


Human Capital, Life Satisfaction, and the Floating Population’s Urban Settlement Intention in Cities—A Case Study of Six Cities in the Pearl River Delta


Abstract
1. Introduction
2. Concepts and Measurement Indicators of Model Structure of Human Capital, Life Satisfaction, and Urban Settlement Intention
2.1. The Concept and Measurement Indicators of Life Satisfaction
2.2. Indicators for Measuring the Human Capital of the Floating Population
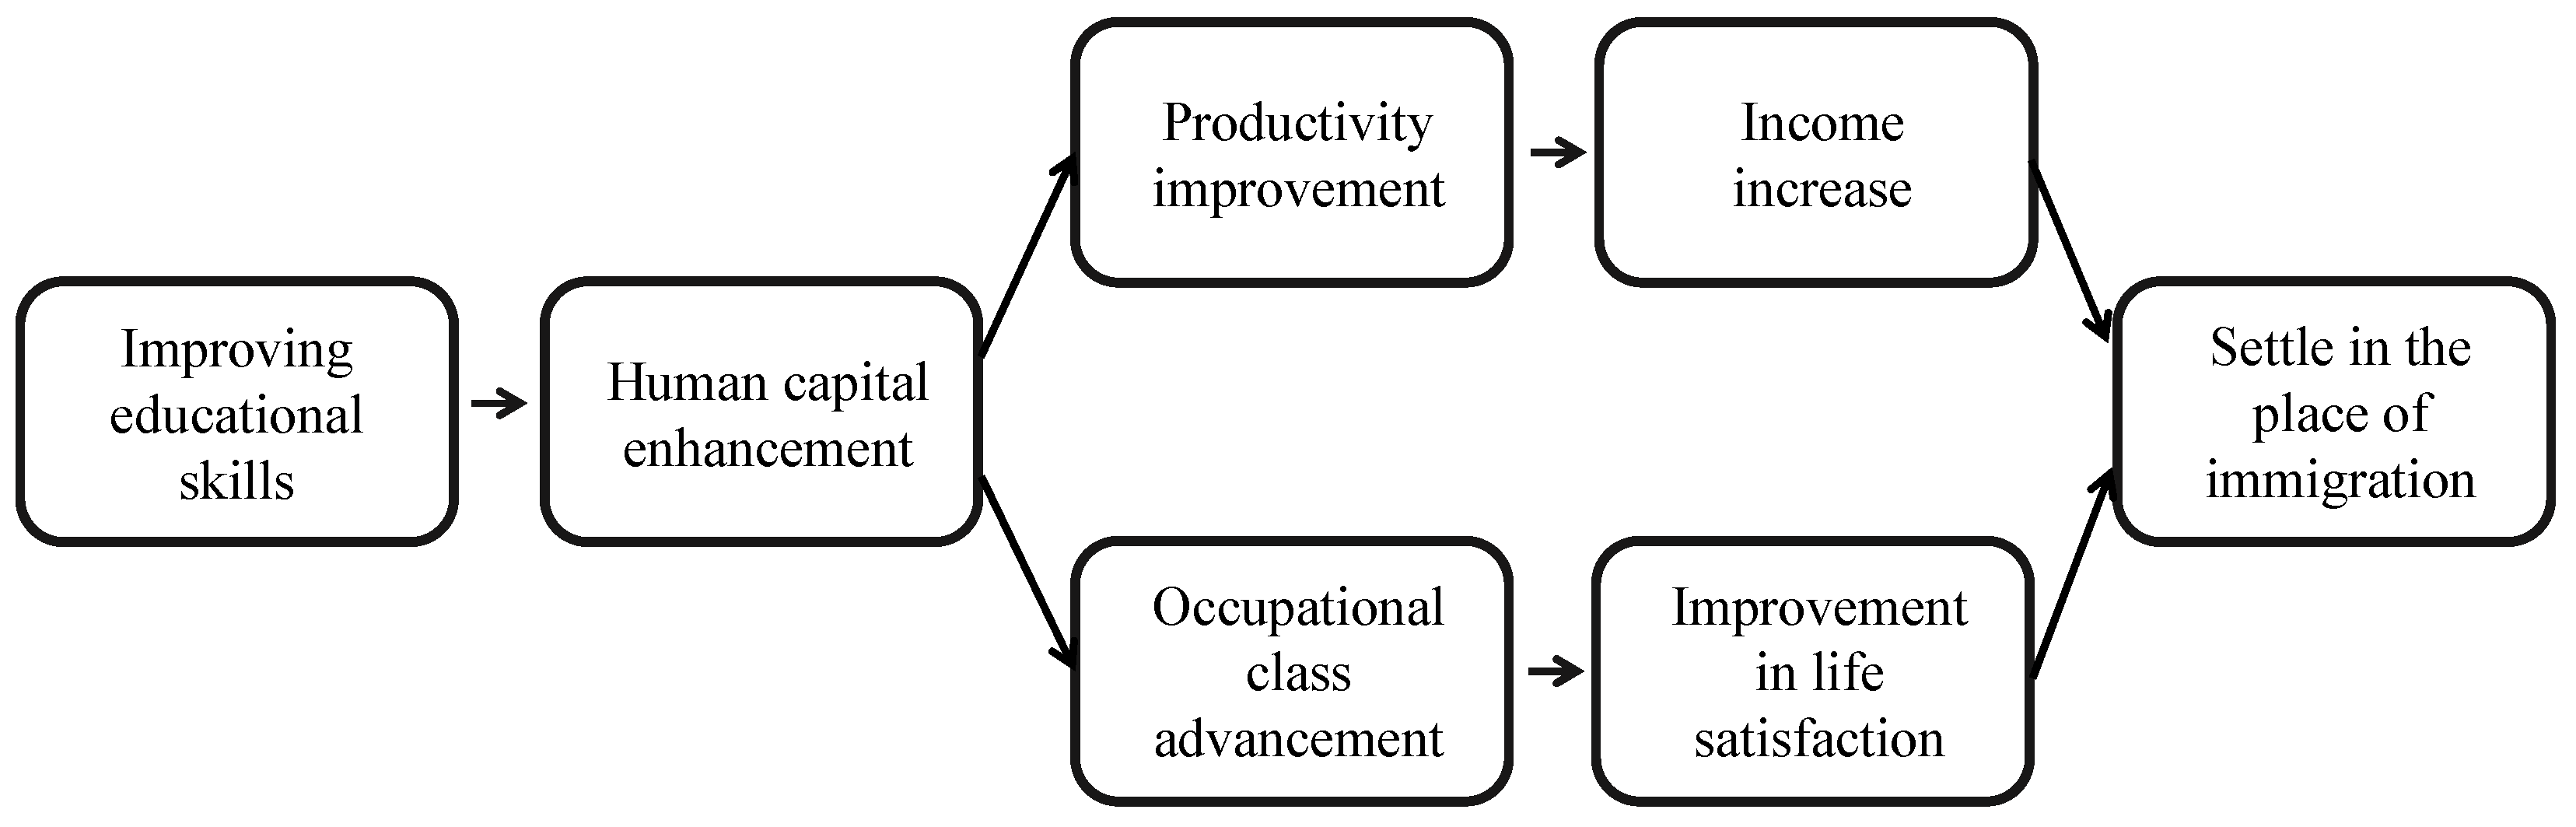
2.3. Model Structure of Human Capital, Life Satisfaction, and Urban Settlement Intention for the Floating Population
3. Study Area, Data, and Model
3.1. Study Area and Survey Target
3.2. Urban Life Satisfaction of Floating Population in Pearl River Delta
3.3. Measurements for Structural Equation Modeling
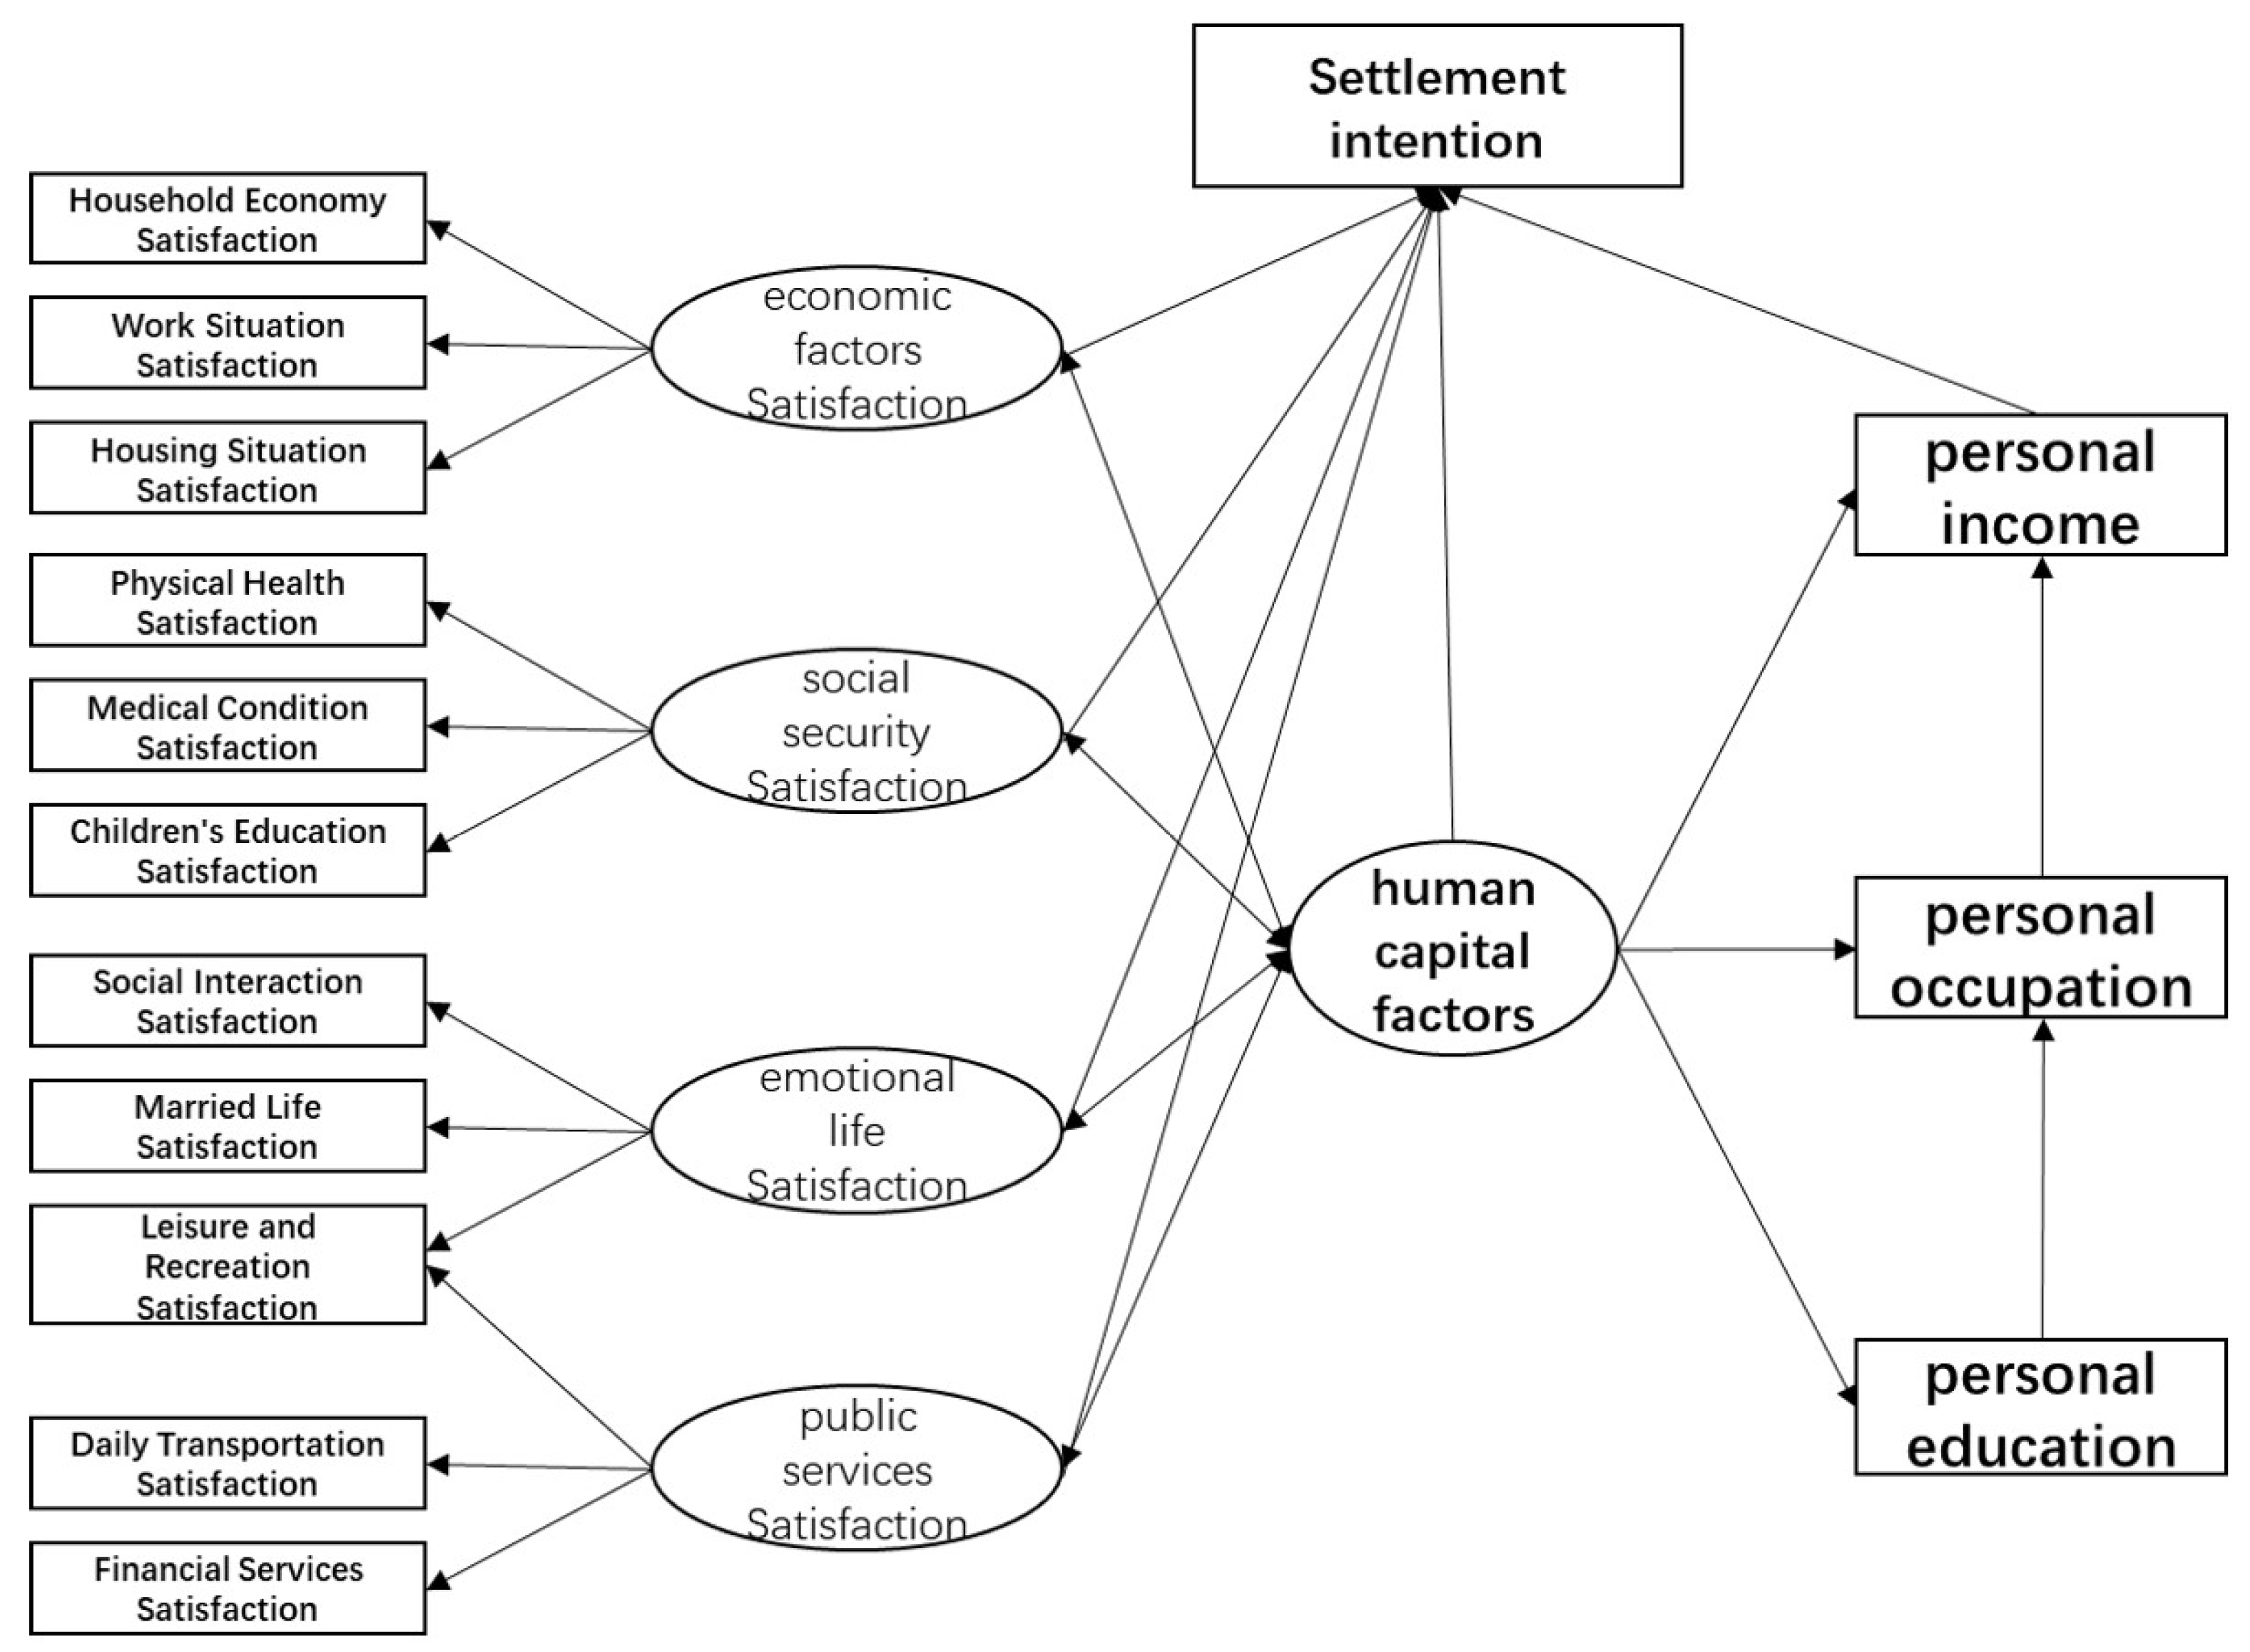
3.3.1. Measurement Models
3.3.2. Structural Models
4. Results
4.1. Correlation Analysis of Observed Variables in Life Satisfaction
- (1)
- The correlation between household economics and the satisfaction scores of work status and housing status are all strong. The correlation coefficients of all three are above 0.5, indicating an indissoluble relationship that underpins the floating population’s perceptions of economic and living standards. The correlation between these three variables and medical status is also relatively strong, with a correlation coefficient R of around 0.4, a relationship that can be attributed to the higher incomes from comparatively superior employment and the presence of supplementary health insurance. In addition, the correlation coefficients R of these three variables with other variables are generally around and below 0.3.
- (2)
- There is a correlation between the satisfaction scores of physical health, medical condition, and children’s education related to the social security system. A moderate correlation is observed between the respondents’ physical health and medical condition (R = 0.42, p < 0.05); meanwhile, the correlation coefficient between medical condition and children’s education is close to 0.4 (R = 0.395, p < 0.05).
- (3)
- There is a correlation between the satisfaction scores of leisure and recreation, marital life, and social interaction related to emotional life. Among them, the correlation coefficient linking leisure and recreation with social interaction exceeds 0.4 (R = 0.413, p < 0.05), and the correlation coefficient between marital life and social interaction also approaches the 0.4 mark (R = 0.394, p < 0.05).
- (4)
- Concurrently, the scores for leisure and recreation, as well as social interaction, bear a relationship with the satisfaction levels regarding public service facilities such as daily transportation and financial services. Among them, the correlation coefficient between leisure and recreation and daily transportation is more than 0.4 (R = 0.427, p < 0.05), and the correlation coefficients of the other factors are also close to 0.4, suggesting that public service facilities exert an influence on the floating population’s daily recreational and social interaction activities.
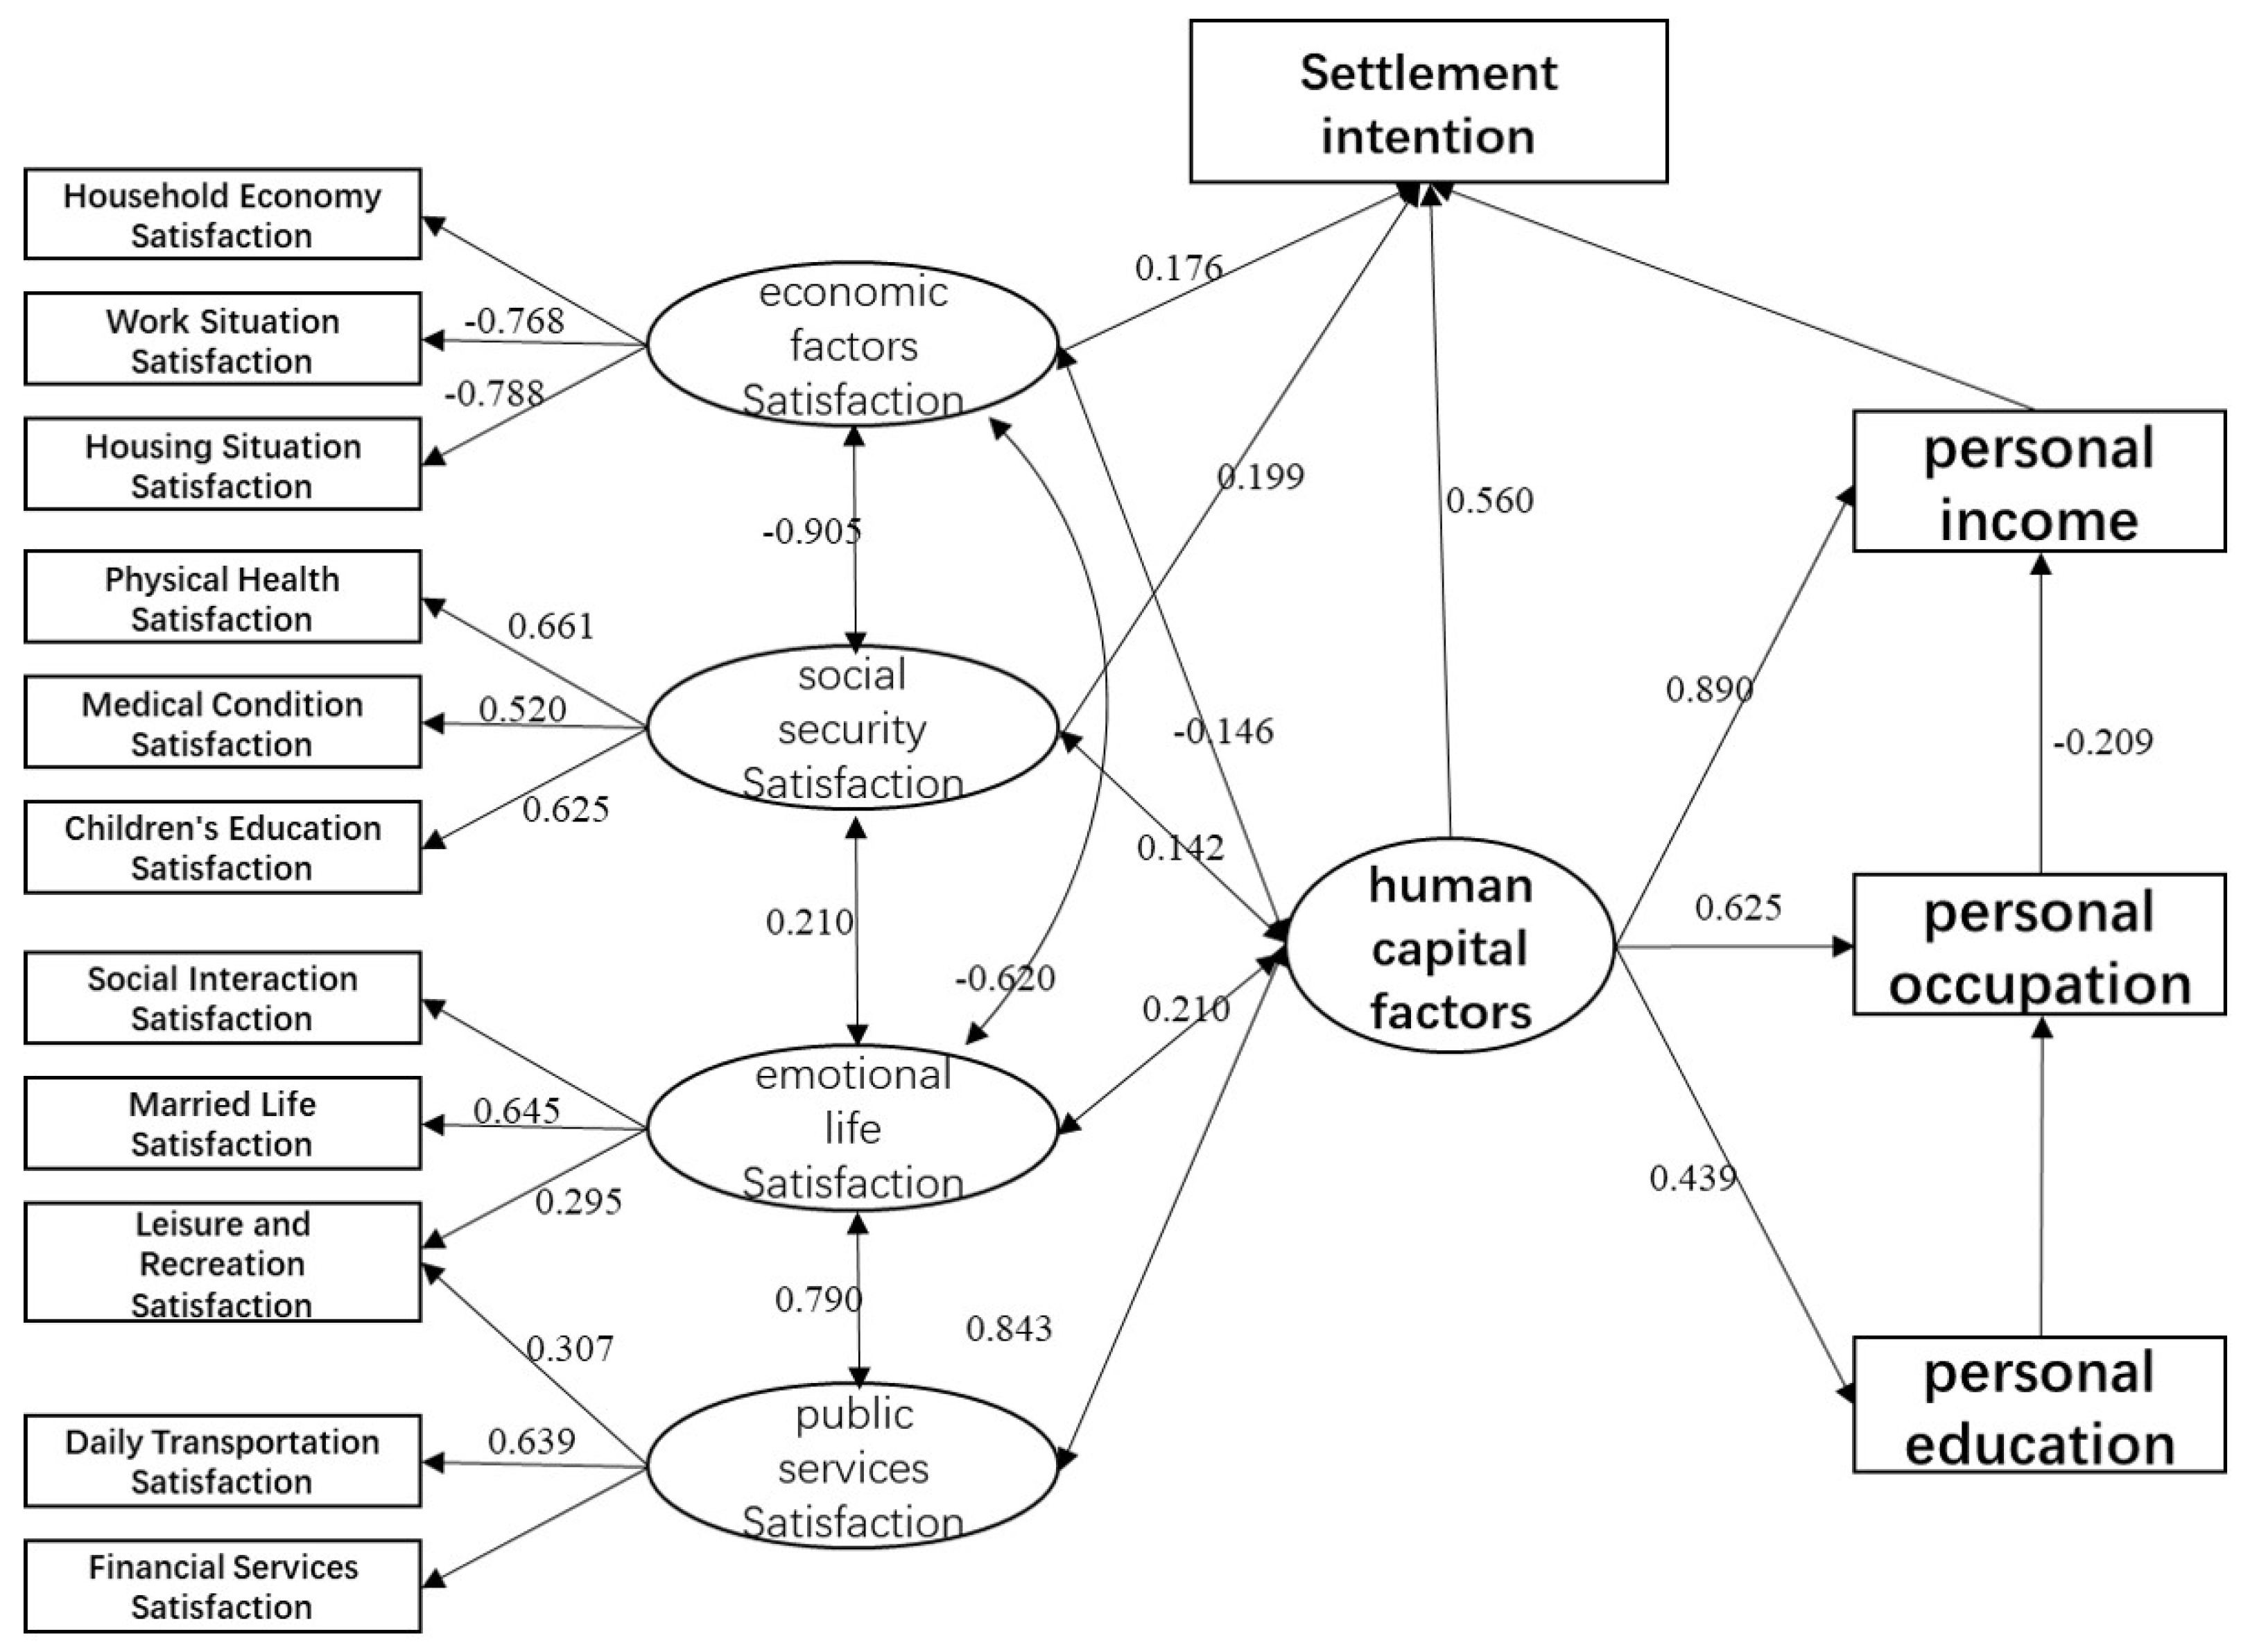
4.2. Model Estimation Results: Human Capital, Life Satisfaction, and Urban Settlement Intention
4.3. Outcome Analysis: Human Capital, Life Satisfaction, and Urban Settlement Intention
4.3.1. Human Capital, Economic Life Satisfaction, and Social Security Satisfaction among the Floating Population Exert a Discernible Influence on Its Urban Settlement Intentions
4.3.2. A Negative Correlation between the Economic Life Satisfaction of the Floating Population and Multiple Latent Variables Exists
4.3.3. A Robust Correlation among Satisfaction with Social Security, Emotional Life, and Public Services Exists
5. Conclusions and Policy Recommendations
Author Contributions
Funding
Informed Consent Statement
Data Availability Statement
Conflicts of Interest
Appendix A

| Household Economy | Work Situation | Housing Situation | Physical Health | Medical Condition | Children’s Education | Daily Transportation | Leisure and Recreation | Married Life | Social Interaction | Financial Services | Overall Situation | |
|---|---|---|---|---|---|---|---|---|---|---|---|---|
| Dongguan City | 6.2 | 6.72 | 6.03 | 7.87 | 6.58 | 6.44 | 7.11 | 6.8 | 7.9 | 6.96 | 6.81 | 7.13 |
| Northeast Cluster | 5.83 | 6.32 | 5.83 | 7.7 | 6.11 | 6.09 | 6.83 | 6.62 | 7.95 | 6.77 | 6.31 | 6.85 |
| Southeast Cluster | 6.43 | 7.12 | 6.12 | 8.17 | 6.63 | 6.68 | 7.27 | 7.09 | 8.18 | 7.22 | 7.06 | 7.21 |
| Northwest Cluster | 6.22 | 6.42 | 6.03 | 7.42 | 6.68 | 6.33 | 6.89 | 6.31 | 8 | 6.78 | 6.61 | 7.06 |
| Southwest Cluster | 6 | 6.42 | 5.78 | 7.83 | 6.39 | 6.12 | 6.87 | 6.48 | 7.87 | 6.66 | 6.7 | 7.02 |
| Center Cluster | 6.4 | 7.13 | 6.32 | 8.08 | 6.9 | 6.99 | 7.54 | 7.36 | 7.64 | 7.3 | 7.09 | 7.37 |
| Foshan City | 6.24 | 6.68 | 6.04 | 7.78 | 6.69 | 6.84 | 7.1 | 6.58 | 7.91 | 7.11 | 7.03 | 7.29 |
| Chancheng District | 6.61 | 6.57 | 6.07 | 7.84 | 7.27 | 7.03 | 7.54 | 7.16 | 7.51 | 7.45 | 7.11 | 7.45 |
| Gaoming District | 6.5 | 7.43 | 6.38 | 7.88 | 6.4 | 7.54 | 7 | 5.76 | 8.68 | 7.55 | 7.02 | 7.55 |
| Nanhai District | 6.53 | 6.85 | 6.18 | 8.04 | 7.04 | 6.58 | 7.15 | 6.87 | 7.91 | 7.13 | 7.16 | 7.36 |
| Sanshui District | 5.91 | 7.04 | 6.35 | 7.52 | 6.13 | 7 | 6.74 | 6.13 | 8.19 | 6.26 | 6.78 | 7.13 |
| Shunde District | 5.76 | 6.26 | 5.72 | 7.5 | 6.3 | 6.64 | 6.95 | 6.38 | 7.73 | 6.95 | 6.92 | 7.1 |
| Guangzhou City | 5.99 | 6.07 | 5.68 | 7.77 | 6.51 | 6.08 | 7.04 | 6.51 | 7.6 | 6.96 | 6.71 | 7.01 |
| Baiyun District | 6.39 | 6.26 | 5.61 | 7.13 | 6.3 | 6.37 | 6.97 | 6.23 | 7.79 | 7.03 | 6.88 | 7.11 |
| Conghua District | 5.68 | 6.48 | 5.88 | 7.64 | 6.4 | 6.32 | 7.24 | 6.16 | 7.59 | 7.28 | 6.48 | 6.92 |
| Panyu District | 5.67 | 5.95 | 5.67 | 7.89 | 6.31 | 5.52 | 7.62 | 6.69 | 8.24 | 7.23 | 6.43 | 7 |
| Haizhu District | 5.94 | 5.52 | 5.09 | 7.33 | 6.46 | 6.07 | 6.48 | 6.15 | 6.78 | 6.6 | 6.33 | 6.75 |
| Huadu District | 5.67 | 6.07 | 5.62 | 7.68 | 5.95 | 5.79 | 6.42 | 6.14 | 6.29 | 6.28 | 6.55 | 6.95 |
| Huangpu District | 6.23 | 6.35 | 6.16 | 8.25 | 6.98 | 5.45 | 6.98 | 7 | 6.93 | 6.97 | 6.87 | 7.3 |
| Liwan District | 6.25 | 5.48 | 5.61 | 8.39 | 6.39 | 6.24 | 8 | 6.46 | 7.86 | 7.5 | 7.04 | 6.96 |
| Nansha District | 5.52 | 6.11 | 6.04 | 8.26 | 6.69 | 6.05 | 7.06 | 6.76 | 8.55 | 7.02 | 7.22 | 6.91 |
| Tianhe District | 6.32 | 6.07 | 5.42 | 7.68 | 6.74 | 7 | 6.86 | 6.42 | 7.53 | 6.89 | 6.5 | 6.96 |
| Yuexiu District | 6.2 | 6.35 | 5.35 | 8.35 | 7.3 | 7 | 7.75 | 6.95 | 9 | 7.8 | 7.3 | 7.3 |
| Zengcheng District | 6.09 | 6.18 | 6.12 | 7.5 | 6.69 | 5.85 | 6.73 | 6.77 | 7.8 | 6.74 | 6.9 | 6.91 |
| Shenzhen City | 6.25 | 6.88 | 5.94 | 7.93 | 7.08 | 6.87 | 7.25 | 7.23 | 7.85 | 7.3 | 7.37 | 7.3 |
| Baoan District | 6.03 | 6.72 | 5.78 | 7.72 | 6.77 | 6.92 | 7.29 | 7.06 | 7.91 | 7.1 | 7.22 | 7.08 |
| Futian District | 7.24 | 7.33 | 6.43 | 8.14 | 7.19 | 7.62 | 8.19 | 8.05 | 7.88 | 7.33 | 7.67 | 7.55 |
| Guangming New District | 7.83 | 7.17 | 5.83 | 8.83 | 7.83 | 6.25 | 7 | 8.5 | 8.25 | 7.67 | 8.5 | 7.83 |
| Longgang District | 5.93 | 6.77 | 5.59 | 7.82 | 7.03 | 6.59 | 7.1 | 7.02 | 7.79 | 7.39 | 7.48 | 7.22 |
| Longhua District | 6.25 | 6.9 | 6.17 | 7.93 | 7.26 | 6.97 | 7.11 | 7.32 | 7.78 | 7.35 | 7.54 | 7.49 |
| Luohu District | 6.68 | 7.16 | 6.21 | 8.21 | 7.74 | 8.3 | 6.84 | 7.79 | 7.73 | 7.26 | 7.26 | 7.63 |
| Nanshan District | 6.47 | 7.13 | 6.51 | 8.06 | 6.98 | 6.83 | 7.51 | 7.19 | 7.96 | 7.23 | 6.87 | 7.28 |
| Pingshan District | 6.94 | 6.83 | 5.83 | 8.72 | 7.67 | 6.13 | 7.17 | 7.33 | 7.75 | 7.72 | 7.56 | 7.56 |
| Zhongshan City | 6.36 | 6.68 | 6.43 | 7.91 | 6.67 | 6.49 | 7.19 | 6.8 | 7.77 | 7.1 | 6.89 | 7.26 |
| Eastern Cluster | 5.97 | 5.8 | 5.64 | 7.38 | 6.08 | 5.83 | 6.68 | 6.36 | 7.75 | 6.74 | 6.45 | 6.87 |
| Southern Cluster | 6.1 | 6.63 | 6.68 | 8.21 | 6.66 | 7.03 | 7.44 | 6.67 | 8 | 7.3 | 6.9 | 7.26 |
| Northwest Cluster | 6.66 | 7.07 | 6.69 | 8.08 | 6.88 | 6.9 | 7.22 | 6.93 | 7.69 | 7.26 | 7.38 | 7.46 |
| Center Cluster | 6.29 | 6.51 | 6.23 | 7.7 | 6.64 | 5.95 | 7.18 | 6.91 | 7.75 | 6.86 | 6.38 | 7.14 |
| Zhuhai City | 6.28 | 6.49 | 6.11 | 7.8 | 6.59 | 6.83 | 7.32 | 6.81 | 7.97 | 7.18 | 6.77 | 7.24 |
| Doumen District | 5.93 | 6.55 | 6.19 | 7.81 | 6.71 | 6.85 | 6.77 | 6.18 | 7.54 | 7 | 6.36 | 7.12 |
| Jinwan District | 6.55 | 6.64 | 6.49 | 7.78 | 6.49 | 7.17 | 7.3 | 6.81 | 8.38 | 7.35 | 6.93 | 7.25 |
| Xiangzhou District | 6.25 | 6.32 | 5.72 | 7.81 | 6.6 | 6.52 | 7.67 | 7.2 | 7.85 | 7.15 | 6.88 | 7.3 |
| Total | 6.2 | 6.56 | 6 | 7.84 | 6.68 | 6.55 | 7.15 | 6.77 | 7.82 | 7.08 | 6.92 | 7.18 |
Appendix B
| Attribute | Classification | Frequency | Proportion(%) | Attribute | Classification | Frequency | Proportion(%) |
|---|---|---|---|---|---|---|---|
| Personal income | ≤30 | 684 | 29.9 | Daily transportation | 0–2 | 61 | 2.7 |
| 30–60 | 1105 | 48.4 | 3–4 | 126 | 5.5 | ||
| 60–100 | 337 | 14.8 | 5–6 | 597 | 26.1 | ||
| >100 | 158 | 6.9 | 7–8 | 960 | 42.0 | ||
| Personal education | Primary school and below | 327 | 14.3 | 9–10 | 540 | 23.6 | |
| Junior and senior high school | 1424 | 62.3 | Average | 7.13 | |||
| College and above | 533 | 23.3 | Leisure and recreation | 0–2 | 109 | 4.8 | |
| Household economy | 0–2 | 133 | 5.8 | 3–4 | 171 | 7.5 | |
| 3–4 | 242 | 10.6 | 5–6 | 680 | 29.8 | ||
| 5–6 | 915 | 40.1 | 7–8 | 910 | 39.8 | ||
| 7–8 | 744 | 32.6 | 9–10 | 414 | 18.1 | ||
| 9–10 | 250 | 10.9 | Average | 6.73 | |||
| Average | 6.15 | Married life | 0–2 | 109 | 4.8 | ||
| Work situation | 0–2 | 90 | 3.9 | 3–4 | 171 | 7.5 | |
| 3–4 | 158 | 6.9 | 5–6 | 680 | 29.8 | ||
| 5–6 | 828 | 36.3 | 7–8 | 910 | 39.8 | ||
| 7–8 | 908 | 39.8 | 9–10 | 414 | 18.1 | ||
| 9–10 | 300 | 13.1 | Average | 7.83 | |||
| Average | 6.55 | Social interaction | 0–2 | 53 | 2.3 | ||
| Housing situation | 0–2 | 167 | 7.3 | 3–4 | 143 | 6.3 | |
| 3–4 | 351 | 15.4 | 5–6 | 634 | 27.8 | ||
| 5–6 | 818 | 35.8 | 7–8 | 961 | 42.1 | ||
| 7–8 | 672 | 29.4 | 9–10 | 493 | 21.6 | ||
| 9–10 | 276 | 12.1 | Average | 7.06 | |||
| Average | 5.97 | Financial services | 0–2 | 90 | 3.9 | ||
| Physical health | 0–2 | 33 | 1.4 | 3–4 | 130 | 5.7 | |
| 3–4 | 60 | 2.6 | 5–6 | 631 | 27.6 | ||
| 5–6 | 388 | 17.0 | 7–8 | 965 | 42.3 | ||
| 7–8 | 952 | 41.7 | 9–10 | 468 | 20.5 | ||
| 9–10 | 851 | 37.3 | Average | 6.93 | |||
| Average | 7.83 | Overall situation | 0–2 | 11 | 0.5 | ||
| Medical condition | 0–2 | 109 | 4.8 | 3–4 | 67 | 2.9 | |
| 3–4 | 169 | 7.4 | 5–6 | 589 | 25.8 | ||
| 5–6 | 709 | 31.0 | 7–8 | 1300 | 56.9 | ||
| 7–8 | 933 | 40.8 | 9–10 | 317 | 13.9 | ||
| 9–10 | 364 | 15.9 | Average | 7.17 | |||
| Average | 6.65 | ||||||
| Children’s education | 0–2 | 90 | 3.9 | ||||
| 3–4 | 123 | 5.4 | |||||
| 5–6 | 402 | 17.6 | |||||
| 7–8 | 1423 | 62.3 | |||||
| 9–10 | 246 | 10.8 | |||||
| Average | 6.53 | ||||||
References
- Liu, T.; Zhuo, Y.; Wang, J. How multi-proximity affects destination choice in onward migration: A nested logit model. Acta Geogr. Sin. 2020, 75, 2716–2729. (In Chinese) [Google Scholar]
- Fan, C.C. Urban settlement intention and Split Households: Findings from a Survey of Floating Population in Beijing’s Urban Villages. China Rev.-Interdiscip. J. Greater China 2011, 11, 11–41. [Google Scholar]
- Wang, C.; Shen, J. How subjective economic status matters: The reference-group effect on Migrants’ Urban settlement intention in urban China. Asian Popul. Stud. 2023, 19, 105–123. [Google Scholar] [CrossRef]
- Liu, Y.; Pan, Z.; Liu, Y.; Chen, H.; Li, Z. Where your heart belongs to shapes how you feel about yourself: Migration, social comparison and subjective well-being in China. Popul. Space Place 2020, 26, e2336. [Google Scholar] [CrossRef]
- Greenspan, I.; Walk, M.; Handy, F. Immigrant Integration Through Volunteering: The Importance of Contextual Factors. J. Soc. Policy 2018, 47, 803–825. [Google Scholar] [CrossRef]
- Wen, P.; Zhou, S. The effects of family migration on jobs-housing relationship of the floating population: A case study of Guangzhou. Geogr. Res. 2022, 41, 1212–1226. (In Chinese) [Google Scholar]
- Nahapiet, J.; Ghoshal, S. Social capital, intellectual capital, and the organizational advantage. Acad. Manag. Rev. 1998, 23, 242–266. [Google Scholar] [CrossRef]
- Liu, T.; Wang, J. Bringing city size in understanding the permanent Urban settlement intention of rural-urban Floating Population in China. Popul. Space Place 2020, 26, e2295. [Google Scholar] [CrossRef]
- Cao, G.; Li, M.; Ma, Y.; Tao, R. Self-employment and intention of permanent urban settlement: Evidence from a survey of Floating Population in China’s four major urbanising areas. Urban Stud. 2015, 52, 639–664. [Google Scholar] [CrossRef]
- Lin, S.; Liang, Q.; Li, Z.; Pang, R. Family migration and Urban settlement intention in China’s medium-sized city: A case study of Wenzhou. Geogr. Res. 2019, 38, 1640–1650. (In Chinese) [Google Scholar]
- Liu, Y.; Liu, Y.; Li, Z. Settlement Intention of New Floating Population in China’s Large Cities: Patterns and Determinants. Sci. Geogr. Sin. 2014, 34, 780–787. (In Chinese) [Google Scholar] [CrossRef]
- Fang, G.; Feng, X. Research on Subjective Well-being Diferences between Urban and Rural Residents and Their Influence Factors-Take Chengdu City as a Case. Popul. Dev. 2009, 15, 74–81. (In Chinese) [Google Scholar]
- Allen, F.; Qian, J.; Qian, M. Law, finance, and economic growth in China. J. Financ. Econ. 2005, 77, 57–116. [Google Scholar] [CrossRef]
- Lu, J.; Li, B. Social Networks, Informal Finance and Residents’ Happiness: An Empirical Analysis Based on Data of CFPS in 2016. J. Shanghai Univ. Financ. Econ. 2018, 20, 46–62. (In Chinese) [Google Scholar] [CrossRef]
- Morris, T.; Manley, D.; Sabel, C.E. Residential mobility: Towards progress in mobility health research. Prog. Hum. Geogr. 2018, 42, 112–133. [Google Scholar] [CrossRef] [PubMed]
- Matheson, F.I.; Moineddin, R.; Dunn, J.R.; Creatore, M.I.; Gozdyra, P.; Glazier, R.H. Urban neighborhoods, chronic stress, gender and depression. Soc. Sci. Med. 2006, 63, 2604–2616. [Google Scholar] [CrossRef] [PubMed]
- Zull Kepili, E.I.; Nik Azman, N.H.; Ab Razak, A.; Rahman, S. The impact of home financing costs and the built environment on the depression levels of lower-income employees working from home during the COVID-19 pandemic (March 2020—March 2021). Plan. Malays. 2023, 21. [Google Scholar] [CrossRef]
- Kling, J.R.; Liebman, J.B.; Katz, L.F. Experimental analysis of neighborhood effects. Econometrica 2007, 75, 83–119. [Google Scholar] [CrossRef]
- Jones, A.; Dantzler, P. Neighbourhood perceptions and residential mobility. Urban Stud. 2021, 58, 1792–1810. [Google Scholar] [CrossRef]
- Oishi, S.; Talhelm, T. Residential Mobility: What Psychological Research Reveals. Curr. Dir. Psychol. Sci. 2012, 21, 425–430. [Google Scholar] [CrossRef]
- Wang, Y.; Zuo, S.; Wang, F. Residential mobility and psychological transformation in China: From relational to institutional trust. Psych J. 2023, 13, 90–101. [Google Scholar] [CrossRef] [PubMed]
- Wang, Z.; Li, H. Identity, personal skills and migrant workers’ willingness to return to their hometown: An empirical study based on CMDS data. Econ. Surv. 2021, 38, 34–43. [Google Scholar]
- Xu, H.; Wu, W.; Zhang, C.; Xie, Y.; Lv, J.; Ahmad, S.; Cui, Z. The impact of social exclusion and identity on migrant workers’ willingness to return to their hometown: Micro-empirical evidence from rural China. Humanit. Soc. Sci. Commun. 2023, 10, 919. [Google Scholar] [CrossRef]
- Zhang, J.; Huang, J.; Wang, J.; Guo, L. Return migration and Hukou registration constraints in Chinese cities. China Econ. Rev. 2020, 63, 101498. [Google Scholar] [CrossRef]
- Gambaro, L.; Joshi, H.; Lupton, R. Moving to a better place? Residential mobility among families with young children in the Millennium Cohort Study. Popul. Space Place 2017, 23, e2072. [Google Scholar] [CrossRef]
- Diener, E.; Suh, E. Measuring quality of life: Economic, social, and subjective indicators. Soc. Indic. Res. 1997, 40, 189–216. [Google Scholar] [CrossRef]
- Yang, C.; Li, W.; Lu, Y. The effect of migrant workers’ income and working hours on life satisfaction—The role of urban integration and social security. J. Agrotech. Econ. 2014, 36–46. (In Chinese) [Google Scholar] [CrossRef]
- Oishi, S. The Psychology of Residential Mobility: Implications for the Self, Social Relationships, and Well-Being. Perspect. Psychol. Sci. 2010, 5, 5–21. [Google Scholar] [CrossRef]
- Xing, Z.; Huang, L. Two Main Concepts of Happiness in the History of Western Philosophy and Research on Contemporary Subjective Happiness. Theor. Investig. 2004, 32–35. (In Chinese) [Google Scholar] [CrossRef]
- Diener, E.; Suh, E.M.; Lucas, R.E.; Smith, H.L. Subjective well-being: Three decades of progress. Psychol. Bull. 1999, 125, 276–302. [Google Scholar] [CrossRef]
- Lyubomirsky, S.; Ross, L. Changes in attractiveness of elected, rejected, and precluded alternatives: A comparison of happy and unhappy individuals. J. Personal. Soc. Psychol. 1999, 76, 988–1007. [Google Scholar] [CrossRef] [PubMed]
- Mersky, J.P.; Topitzes, J.; Reynolds, A.J. Impacts of adverse childhood experiences on health, mental health, and substance use in early adulthood: A cohort study of an urban, minority sample in the US. Child Abus. Negl. 2013, 37, 917–925. [Google Scholar] [CrossRef] [PubMed]
- Wanberg, C.R.; Csillag, B.; Douglass, R.P.; Zhou, L.; Pollard, M.S. Socioeconomic Status and Well-Being During COVID-19: A Resource-Based Examination. J. Appl. Psychol. 2020, 105, 1382–1396. [Google Scholar] [CrossRef] [PubMed]
- Yu, G.B.; Kim, N. The Effects of Leisure Life Satisfaction on Subjective Wellbeing under the COVID-19 Pandemic: The Mediating Role of Stress Relief. Sustainability 2021, 13, 3225. [Google Scholar] [CrossRef]
- Association, A.P. Stress in America™ 2021: Stress and Decision-Making during the Pandemic; America Psychological Association: Washington, DC, USA, 2021. [Google Scholar]
- Bowling, A.; Browne, P.D. Social networks, health, and emotional well-being among the oldest in London. J. Gerontol. 1991, 46, S20–S32. [Google Scholar] [CrossRef] [PubMed]
- Usui, W.M.; Keil, T.J.; Durig, K.R. Socioeconomic comparisons and life satisfaction of elderly adults. J. Gerontol. 1985, 40, 110–114. [Google Scholar] [CrossRef]
- Diener, E.; Sapyta, J.J.; Suh, E. Subjective well-being is essential to well-being. Psychol. Inq. 1998, 9, 33–37. [Google Scholar] [CrossRef]
- Krause, N.; Herzog, A.R.; Baker, E. Providing support to others and well-being in later life. J. Gerontol. 1992, 47, P300–P311. [Google Scholar] [CrossRef]
- Costa, P.T., Jr.; McCrae, R.R. Influence of extraversion and neuroticism on subjective well-being: Happy and unhappy people. J. Personal. Soc. Psychol. 1980, 38, 668–678. [Google Scholar] [CrossRef]
- Donggen, W.; Fenglong, W. Contributions of the Usage and Affective Experience of the Residential Environment to Residential Satisfaction. Housing Studies. 2016, 31, 42–60. [Google Scholar] [CrossRef]
- Lyubomirsky, S. Why are some people happier than others? The role of cognitive and motivational processes in well-being. Am. Psychol. 2001, 56, 239–249. [Google Scholar] [CrossRef] [PubMed]
- Wang, Y.; Zhu, Z.; Wang, Z.; Xu, Q.; Zhou, C. Household Registration, Land Property Rights, and Differences in Migrants’ Settlement Intentions—A Regression Analysis in the Pearl River Delta. Land 2022, 11, 31. [Google Scholar] [CrossRef]
- Constant, A.; Massey, D.S. Self-selection, earnings, and out-migration: A longitudinal study of immigrants to Germany. J. Popul. Econ. 2003, 16, 631–653. [Google Scholar] [CrossRef]
- Massey, D.S.; Akresh, I.R. Immigrant intentions and mobility in a global economy: The attitudes and behavior of recently arrived US immigrants. Soc. Sci. Q. 2006, 87, 954–971. [Google Scholar] [CrossRef]
- Zhu, Y.; Chen, W. The Urban settlement intention of China’s Floating Population in the Cities: Recent Changes and Multifaceted Individual-Level Determinants. Popul. Space Place 2010, 16, 253–267. [Google Scholar] [CrossRef]
- Liu, Z.; Wang, Y.; Chen, S. Does formal housing encourage Urban settlement intention of rural Floating Population in Chinese cities? A structural equation model analysis. Urban Stud. 2017, 54, 1834–1850. [Google Scholar] [CrossRef]
- Liu, Y.; Deng, W.; Song, X. Influence factor analysis of Migrants’ Urban settlement intention: Considering the characteristic of city. Appl. Geogr. 2018, 96, 130–140. [Google Scholar] [CrossRef]
- Xie, S.; Chen, J. Beyond homeownership: Housing conditions, housing support and rural migrant urban settlement intentions in China. Cities 2018, 78, 76–86. [Google Scholar] [CrossRef]
- Ma, L.; Chen, M.; Che, X.; Fang, F. Farmers’ Rural-To-Urban Migration, Influencing Factors and Development Framework: A Case Study of Sihe Village of Gansu, China. Int. J. Environ. Res. Public Health 2019, 16, 877. [Google Scholar] [CrossRef]
- Gu, H.; Liu, Z.; Shen, T. Spatial pattern and determinants of migrant workers’ interprovincial hukou transfer intention in China: Evidence from a National Migrant Population Dynamic Monitoring Survey in 2016. Popul. Space Place 2020, 26, e2250. [Google Scholar] [CrossRef]
- Wang, C.; Pang, Z.; Choi, C.G. Township, County Town, Metropolitan Area, or Foreign Cities? Evidence from House Purchases by Rural Households in China. Land 2023, 12, 1038. [Google Scholar] [CrossRef]
- Jensen, P.; Pedersen, P.J. To stay or not to stay? Out-migration of immigrate from Denmark. Int. Migr. 2007, 45, 87–113. [Google Scholar] [CrossRef]
- Wang, W.W.; Fan, C.C. Migrant Workers’ Integration in Urban China: Experiences in Employment, Social Adaptation, and Self-Identity. Eurasian Geogr. Econ. 2012, 53, 731–749. [Google Scholar] [CrossRef]
- Tang, S.; Feng, J. Cohort differences in the urban settlement intentions of rural Floating Population: A case study in Jiangsu Province, China. Habitat Int. 2015, 49, 357–365. [Google Scholar] [CrossRef]
- Chen, S.; Liu, Z. What determines the Urban settlement intention of rural Floating Population in China? Economic incentives versus sociocultural conditions. Habitat Int. 2016, 58, 42–50. [Google Scholar] [CrossRef]
- Peng, B.-l.; Ling, L. Association between rural-to-urban Migrants’ social medical insurance, social integration and their medical return in China: A nationally representative cross-sectional data analysis. BMC Public Health 2019, 19, 86. [Google Scholar] [CrossRef] [PubMed]
- Boyden, J. ‘We’re not going to suffer like this in the mud’: Educational aspirations, social mobility and independent child migration among populations living in poverty. Comp.-A J. Comp. Int. Educ. 2013, 43, 580–600. [Google Scholar] [CrossRef]
- Wen, C. Educating rural migrant children in interior China: The promise and pitfall of low-fee private schools. Int. J. Educ. Dev. 2020, 79, 102276. [Google Scholar] [CrossRef]
- Fan, C.C.; Sun, M.; Zheng, S. Migration and split households: A comparison of sole, couple, and family Floating Population in Beijing, China. Environ. Plan. A-Econ. Space 2011, 43, 2164–2185. [Google Scholar] [CrossRef]
- Chen, Y.; Chen, H.; Liu, J. Household Split, Income, and Migrants’ Life Satisfaction: Social Problems Caused by Rapid Urbanization in China. Sustainability 2019, 11, 3415. [Google Scholar] [CrossRef]
- Huang, X.; Liu, Y.; Xue, D.; Li, Z.; Shi, Z. The effects of social ties on rural-urban Migrants’ intention to settle in cities in China. Cities 2018, 83, 203–212. [Google Scholar] [CrossRef]
- Zhang, B.; Druijven, P.; Strijker, D. Does ethnic identity influence Migrants’ Urban settlement intentions? Evidence from three cities in Gansu Province, Northwest China. Habitat Int. 2017, 69, 94–103. [Google Scholar] [CrossRef]
- Chen, H.; Wang, X.; Liu, Y.; Liu, Y. Migrants’ choice of household split or reunion in China’s urbanisation process: The effect of objective and subjective socioeconomic status. Cities 2020, 102, 102669. [Google Scholar] [CrossRef]
- Chan, K.W. The Household Registration System and Migrant Labor in China: Notes on a Debate. Popul. Dev. Rev. 2010, 36, 357–364. [Google Scholar] [CrossRef] [PubMed]
- Liu, Y.Q.; Zhang, F.Z.; Wu, F.L.; Liu, Y.; Li, Z.G. The subjective wellbeing of migrants in Guangzhou, China: The im-pacts of the social and physical environment. Cities 2017, 60, 333–342. [Google Scholar] [CrossRef]
- Liao, L.P.; Wang, C.C. Urban amenity and settlement intentions of rural–urban migrants in China. PLoS ONE 2019, 14, e0215868. [Google Scholar] [CrossRef] [PubMed]
- Lee, K.-Y. Relationship between Public Service Satisfaction and Intention of Continuous Residence of Younger Generations in Rural Areas: The Case of Jeonbuk, Korea. Land 2021, 10, 1203. [Google Scholar] [CrossRef]
- Connelly, R.; Roberts, K.; Zheng, Z. The settlement of rural migrants in urban China—Some of China’s migrants are not ‘floating’ anymore. J. Chin. Econ. Bus. Stud. 2011, 9, 283–300. [Google Scholar] [CrossRef]
- Zhu, Y. China’s floating population and their settlement intention in the cities: Beyond the Hukou reform. Habitat Int. 2007, 31, 65–76. [Google Scholar] [CrossRef]
- Assirelli, G.; Barone, C.; Recchi, E. “You Better Move On”: Determinants and Labor Market Outcomes of Graduate Migration from Italy. Int. Migr. Rev. 2019, 53, 4–25. [Google Scholar] [CrossRef]
- Kahanec, M.; Fabo, B. Migration Strategies of the Crisis-strickenYouth in an Enlarged European Union. Transf. Eur. Rev. Labor Res. 2013, 19, 365–380. [Google Scholar]
- Recchi, E. Mobile Europe: The Theory and Practice of Free Movement in the EU; Palgrave Macmillan: Basingstoke, UK, 2015. [Google Scholar]

| Dongguan | Foshan | Guangzhou | Shenzhen | Zhongshan | Zhuhai | Total | |
|---|---|---|---|---|---|---|---|
| Number of questionnaires | 499 | 384 | 560 | 363 | 317 | 293 | 2416 |
| Proportion of males (%) | 58.52% | 51.82% | 56.43% | 53.99% | 49.21% | 50.17% | 54.06% |
| Avg. age | 36.32 | 34.15 | 34.81 | 32.97 | 33.22 | 35.30 | 34.59 |
| S.D. of age | 11.84 | 9.62 | 11.01 | 10.15 | 10.58 | 10.16 | 10.75 |
| Avg. years of schooling | 9.56 | 9.99 | 11.35 | 12.00 | 10.36 | 10.60 | 10.64 |
| S.D. of years of schooling | 3.61 | 3.73 | 4.00 | 3.44 | 3.56 | 3.54 | 3.78 |
| Proportion of rural household registrations (%) | 87.17% | 83.85% | 76.25% | 76.31% | 79.50% | 78.16% | 80.38% |
| Avg. monthly individual income (unit: Yuan) | 4086.38 | 4288.14 | 4743.45 | 6934 | 4987.12 | 3922.46 | 4802.72 |
| S.D. of monthly individual income (unit: Yuan) | 3144.05 | 2912.86 | 4264.92 | 11,691.35 | 6879.08 | 2682.78 | 6040.65 |
| Household Economy | Work Situation | Housing Situation | Physical Health | Medical Condition | Children’s Education | Daily Transportation | Leisure and Recreation | Married Life | Social Interaction | Financial Services | |
|---|---|---|---|---|---|---|---|---|---|---|---|
| Household Economy | 1 | 0.605 ** | 0.529 ** | 0.330 ** | 0.394 ** | 0.345 ** | 0.284 ** | 0.338 ** | 0.248 ** | 0.304 ** | 0.336 ** |
| Work Situation | 0.605 ** | 1 | 0.544 ** | 0.329 ** | 0.415 ** | 0.347 ** | 0.295 ** | 0.339 ** | 0.245 ** | 0.330 ** | 0.346 ** |
| Housing Situation | 0.529 ** | 0.544 ** | 1 | 0.331 ** | 0.386 ** | 0.365 ** | 0.295 ** | 0.284 ** | 0.191 ** | 0.296 ** | 0.304 ** |
| Physical Health | 0.330 ** | 0.329 ** | 0.331 ** | 1 | 0.420 ** | 0.266 ** | 0.278 ** | 0.254 ** | 0.285 ** | 0.332 ** | 0.258 ** |
| Medical Condition | 0.394 ** | 0.415 ** | 0.386 ** | 0.420 ** | 1 | 0.395 ** | 0.390 ** | 0.357 ** | 0.189 ** | 0.285 ** | 0.380 ** |
| Children’s Education | 0.345 ** | 0.347 ** | 0.365 ** | 0.266 ** | 0.395 ** | 1 | 0.341 ** | 0.324 ** | 0.309 ** | 0.299 ** | 0.336 ** |
| Daily Transportation | 0.284 ** | 0.295 ** | 0.295 ** | 0.278 ** | 0.390 ** | 0.341 ** | 1 | 0.427 ** | 0.228 ** | 0.295 ** | 0.375 ** |
| Leisure and Recreation | 0.338 ** | 0.339 ** | 0.284 ** | 0.254 ** | 0.357 ** | 0.324 ** | 0.427 ** | 1 | 0.254 ** | 0.413 ** | 0.379 ** |
| Married Life | 0.248 ** | 0.245 ** | 0.191 ** | 0.285 ** | 0.189 ** | 0.309 ** | 0.228 ** | 0.254 ** | 1 | 0.394 ** | 0.281 ** |
| Social Interaction | 0.304 ** | 0.330 ** | 0.296 ** | 0.332 ** | 0.285 ** | 0.299 ** | 0.295 ** | 0.413 ** | 0.394 ** | 1 | 0.397 ** |
| Financial Services | 0.336 ** | 0.346 ** | 0.304 ** | 0.258 ** | 0.380 ** | 0.336 ** | 0.375 ** | 0.379 ** | 0.281 ** | 0.397 ** | 1 |
| Overall Situation | 0.533 ** | 0.518 ** | 0.476 ** | 0.404 ** | 0.459 ** | 0.414 ** | 0.424 ** | 0.424 ** | 0.332 ** | 0.486 ** | 0.504 ** |
| Path Coefficient (Estimate) | Standard Error (S.E.) | Critical Ratio (st./S.E.) | Significance Probability (p-Value) | |
|---|---|---|---|---|
| Economic life satisfaction by household economy | 0.069 | 0.023 | 2.935 | 0.003 |
| Economic life satisfaction by work situation | −0.768 | 0.013 | −58.439 | 0.000 |
| Economic life satisfaction by housing situation | −0.788 | 0.013 | −61.090 | 0.000 |
| Social security satisfaction by physical health | 0.661 | 0.015 | 43.322 | 0.000 |
| Social security satisfaction by medical condition | 0.520 | 0.019 | 28.023 | 0.000 |
| Social security satisfaction by children’s education | 0.625 | 0.017 | 37.770 | 0.000 |
| Emotional life satisfaction by leisure and recreation | 0.295 | 0.097 | 3.041 | 0.002 |
| Emotional life satisfaction by married life | 0.645 | 0.049 | 13.100 | 0.000 |
| Emotional life satisfaction by social interaction | −0.023 | 0.026 | −0.876 | 0.381 |
| Public service satisfaction by daily transportation | 0.639 | 0.036 | 17.768 | 0.000 |
| Public service satisfaction by leisure and recreation | 0.307 | 0.096 | 3.182 | 0.001 |
| Public service satisfaction by financial services | 0.035 | 0.026 | 1.366 | 0.172 |
| Human capital factors by personal income | 0.890 | 0.087 | 10.203 | 0.000 |
| Human capital factors by personal occupation | 0.625 | 0.104 | 6.017 | 0.000 |
| Human capital factors by personal education | 0.439 | 0.041 | 10.723 | 0.000 |
| Economic life satisfaction → urban settlement intention | 0.176 | 0.089 | 1.964 | 0.050 |
| Social security satisfaction → urban settlement intention | 0.199 | 0.088 | 2.267 | 0.023 |
| Human capital factors → urban settlement intention | 0.560 | 0.169 | 3.321 | 0.001 |
| Personal income → urban settlement intention | −0.229 | 0.177 | −1.296 | 0.195 |
| Personal occupation → personal income | −0.209 | 0.075 | −2.784 | 0.005 |
| Personal education → personal occupation | −0.067 | 0.067 | −1.009 | 0.313 |
| Economic life satisfaction ↔ human capital factors | −0.146 | 0.033 | −4.431 | 0.000 |
| Social security satisfaction ↔ human capital factors | 0.142 | 0.032 | 4.497 | 0.000 |
| Social security satisfaction ↔ economic life satisfaction | −0.905 | 0.017 | −53.303 | 0.000 |
| Emotional life satisfaction ↔ human capital factors | 0.210 | 0.037 | 5.616 | 0.000 |
| Emotional life satisfaction ↔ economic life satisfaction | −0.620 | 0.052 | −11.975 | 0.000 |
| Emotional life satisfaction ↔ social security satisfaction | 0.722 | 0.058 | 12.513 | 0.000 |
| Public service satisfaction ↔ human capital factors | 0.028 | 0.038 | 0.729 | 0.466 |
| Public service satisfaction ↔ economic life satisfaction | −0.619 | 0.043 | −14.533 | 0.000 |
| Public service satisfaction ↔ social security satisfaction | 0.843 | 0.046 | 18.142 | 0.000 |
| Public service satisfaction ↔ emotional life satisfaction | 0.790 | 0.094 | 8.447 | 0.000 |
Disclaimer/Publisher’s Note: The statements, opinions and data contained in all publications are solely those of the individual author(s) and contributor(s) and not of MDPI and/or the editor(s). MDPI and/or the editor(s) disclaim responsibility for any injury to people or property resulting from any ideas, methods, instructions or products referred to in the content. |
© 2024 by the authors. Licensee MDPI, Basel, Switzerland. This article is an open access article distributed under the terms and conditions of the Creative Commons Attribution (CC BY) license (https://creativecommons.org/licenses/by/4.0/).
Share and Cite
Jiang, Q.; Wang, Y.; Ye, X.; Li, X.; Pan, W.; Wang, Y. Human Capital, Life Satisfaction, and the Floating Population’s Urban Settlement Intention in Cities—A Case Study of Six Cities in the Pearl River Delta. Land 2024, 13, 817. https://doi.org/10.3390/land13060817
Jiang Q, Wang Y, Ye X, Li X, Pan W, Wang Y. Human Capital, Life Satisfaction, and the Floating Population’s Urban Settlement Intention in Cities—A Case Study of Six Cities in the Pearl River Delta. Land. 2024; 13(6):817. https://doi.org/10.3390/land13060817
Chicago/Turabian StyleJiang, Qinyi, Yuanyuan Wang, Xiaomei Ye, Xinger Li, Weimin Pan, and Yuqu Wang. 2024. "Human Capital, Life Satisfaction, and the Floating Population’s Urban Settlement Intention in Cities—A Case Study of Six Cities in the Pearl River Delta" Land 13, no. 6: 817. https://doi.org/10.3390/land13060817
APA StyleJiang, Q., Wang, Y., Ye, X., Li, X., Pan, W., & Wang, Y. (2024). Human Capital, Life Satisfaction, and the Floating Population’s Urban Settlement Intention in Cities—A Case Study of Six Cities in the Pearl River Delta. Land, 13(6), 817. https://doi.org/10.3390/land13060817