Assessing the Nonlinear Relationship between Land Cover Change and PM10 Concentration Change in China
Abstract
1. Introduction
2. Materials and Methods
2.1. Study Area
2.2. Data Source
2.2.1. PM10 Monitoring Stations
2.2.2. Satellite Remote-Sensing AOD Dataset
2.2.3. ERA5 Reanalysis of Meteorological Datasets
2.2.4. Dust Emission Dataset
2.2.5. Population Dataset
2.2.6. Vegetation Index Dataset
2.2.7. Land-Cover Dataset
2.3. Methods
2.3.1. Extreme Randomized Trees
2.3.2. Generalized Additive Model
2.3.3. Evaluation Indicators
3. Results
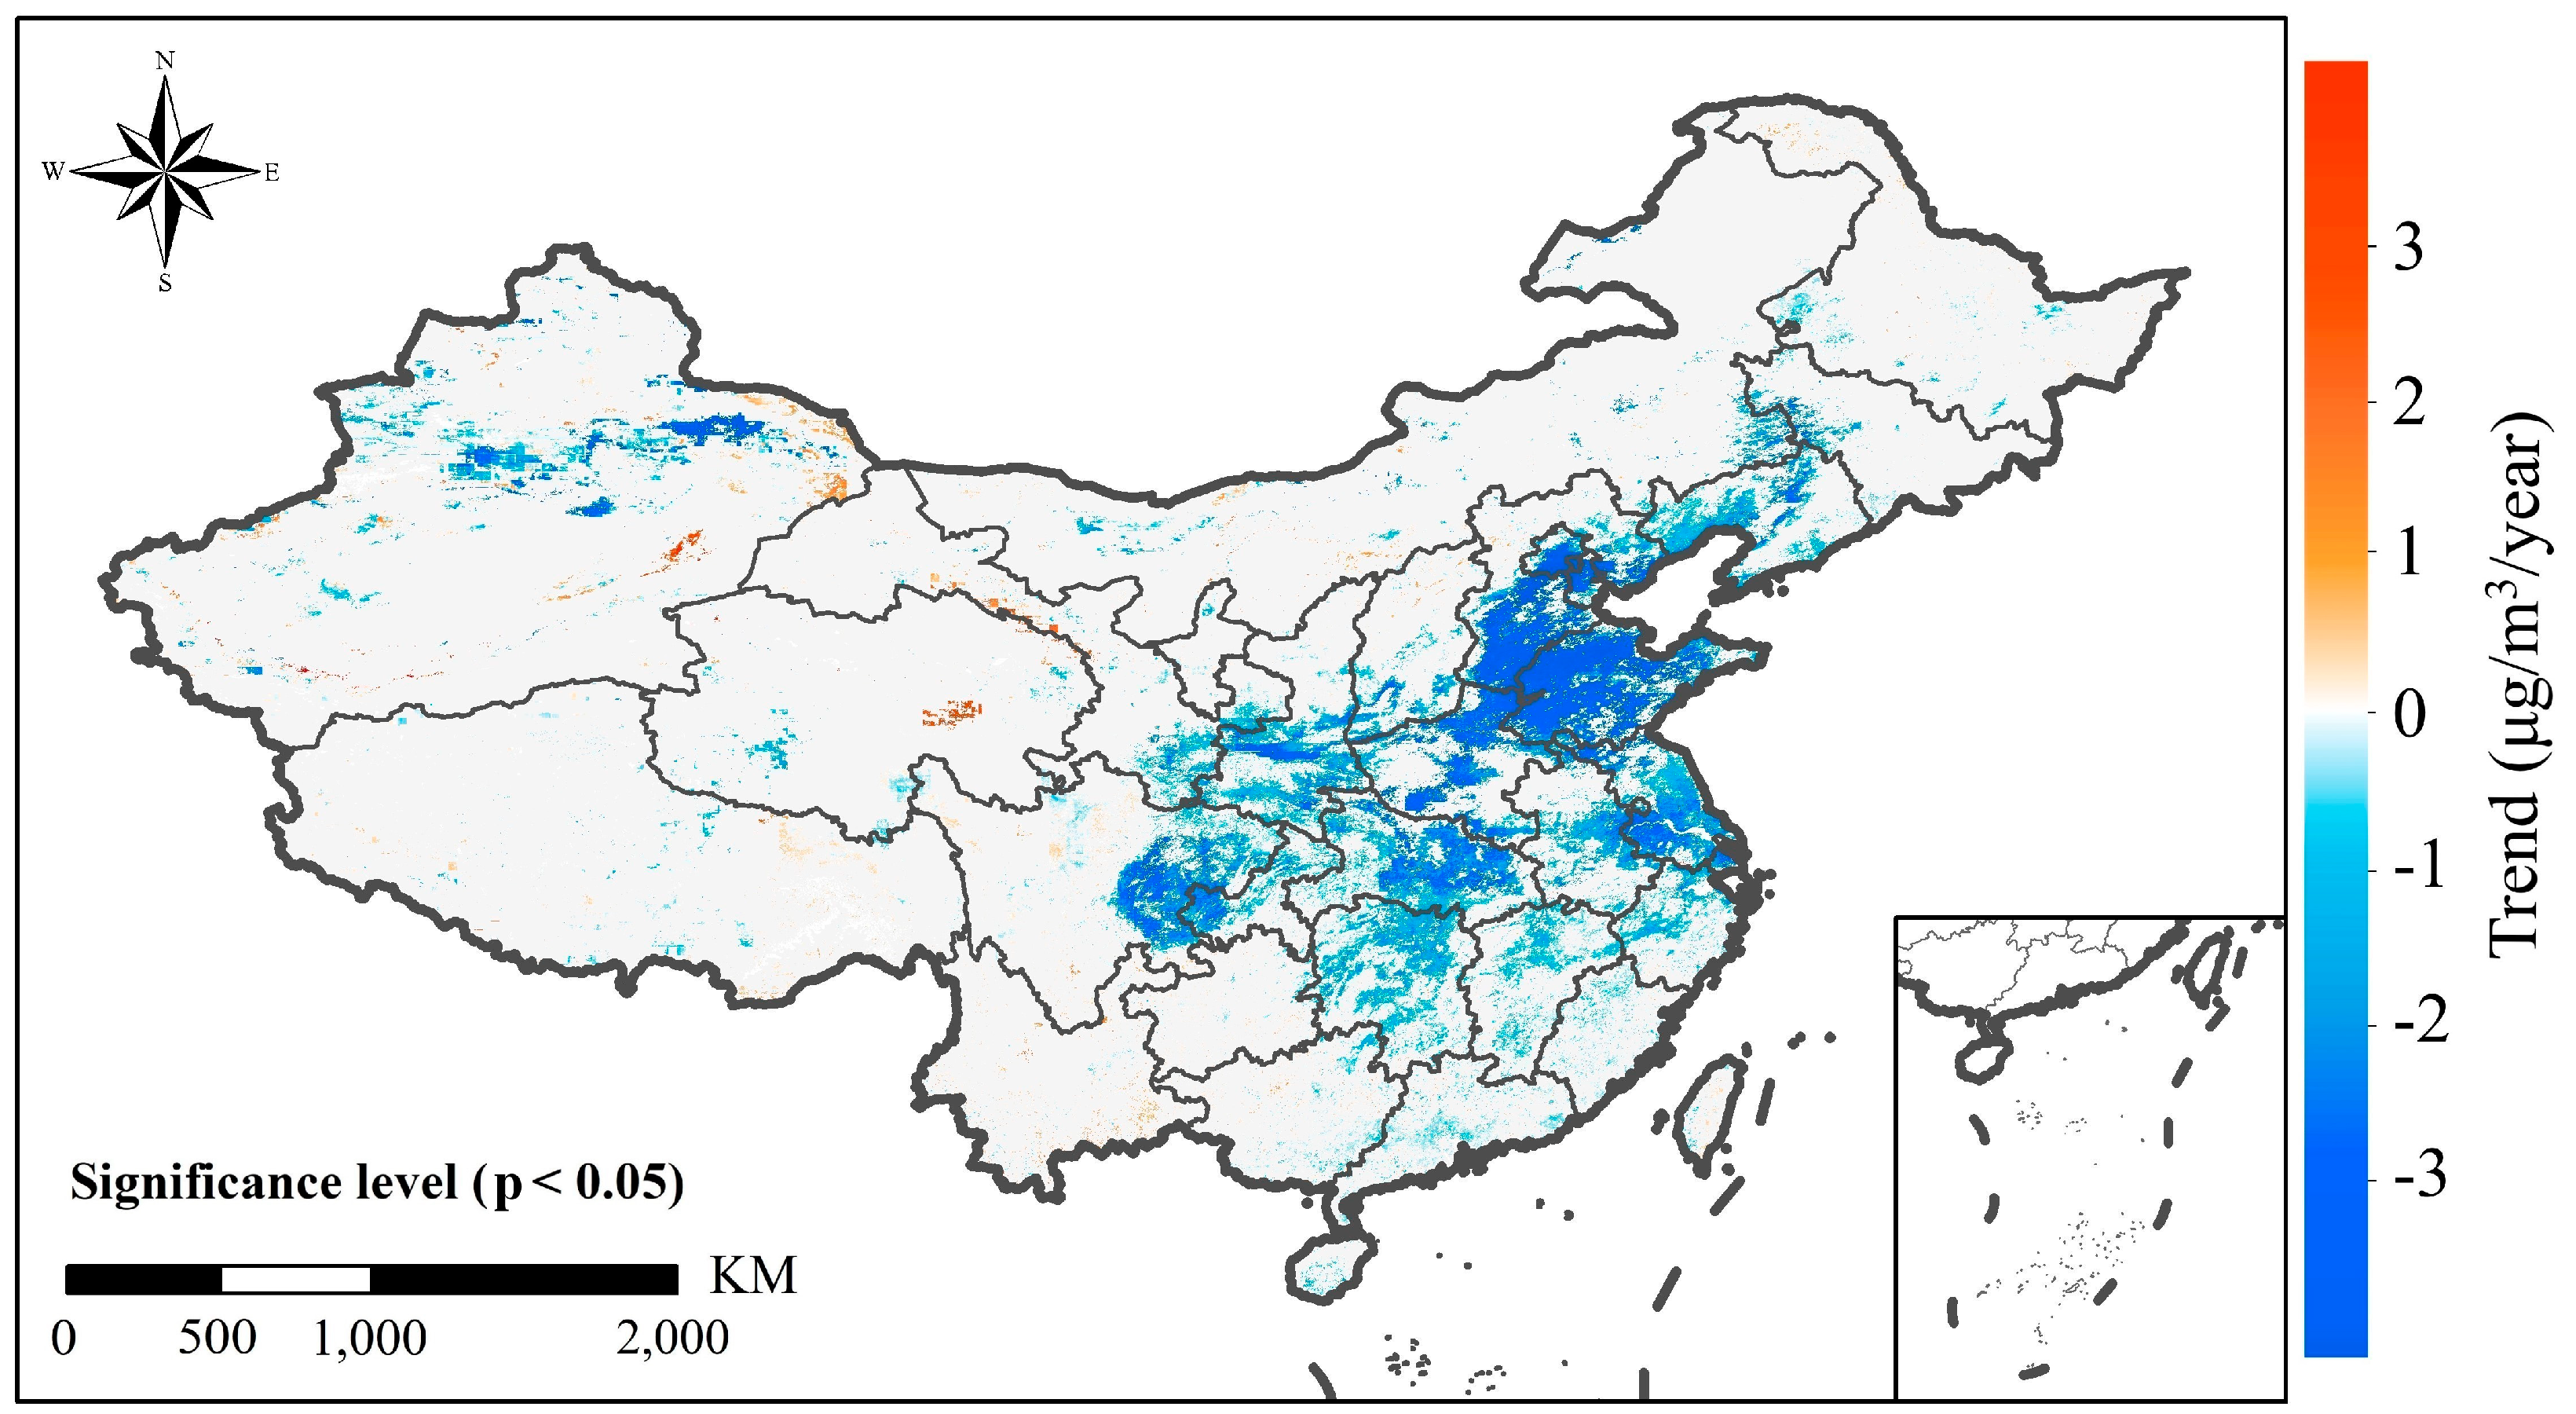
3.1. Spatial and Temporal Variations in Ground-Level PM10 Concentrations
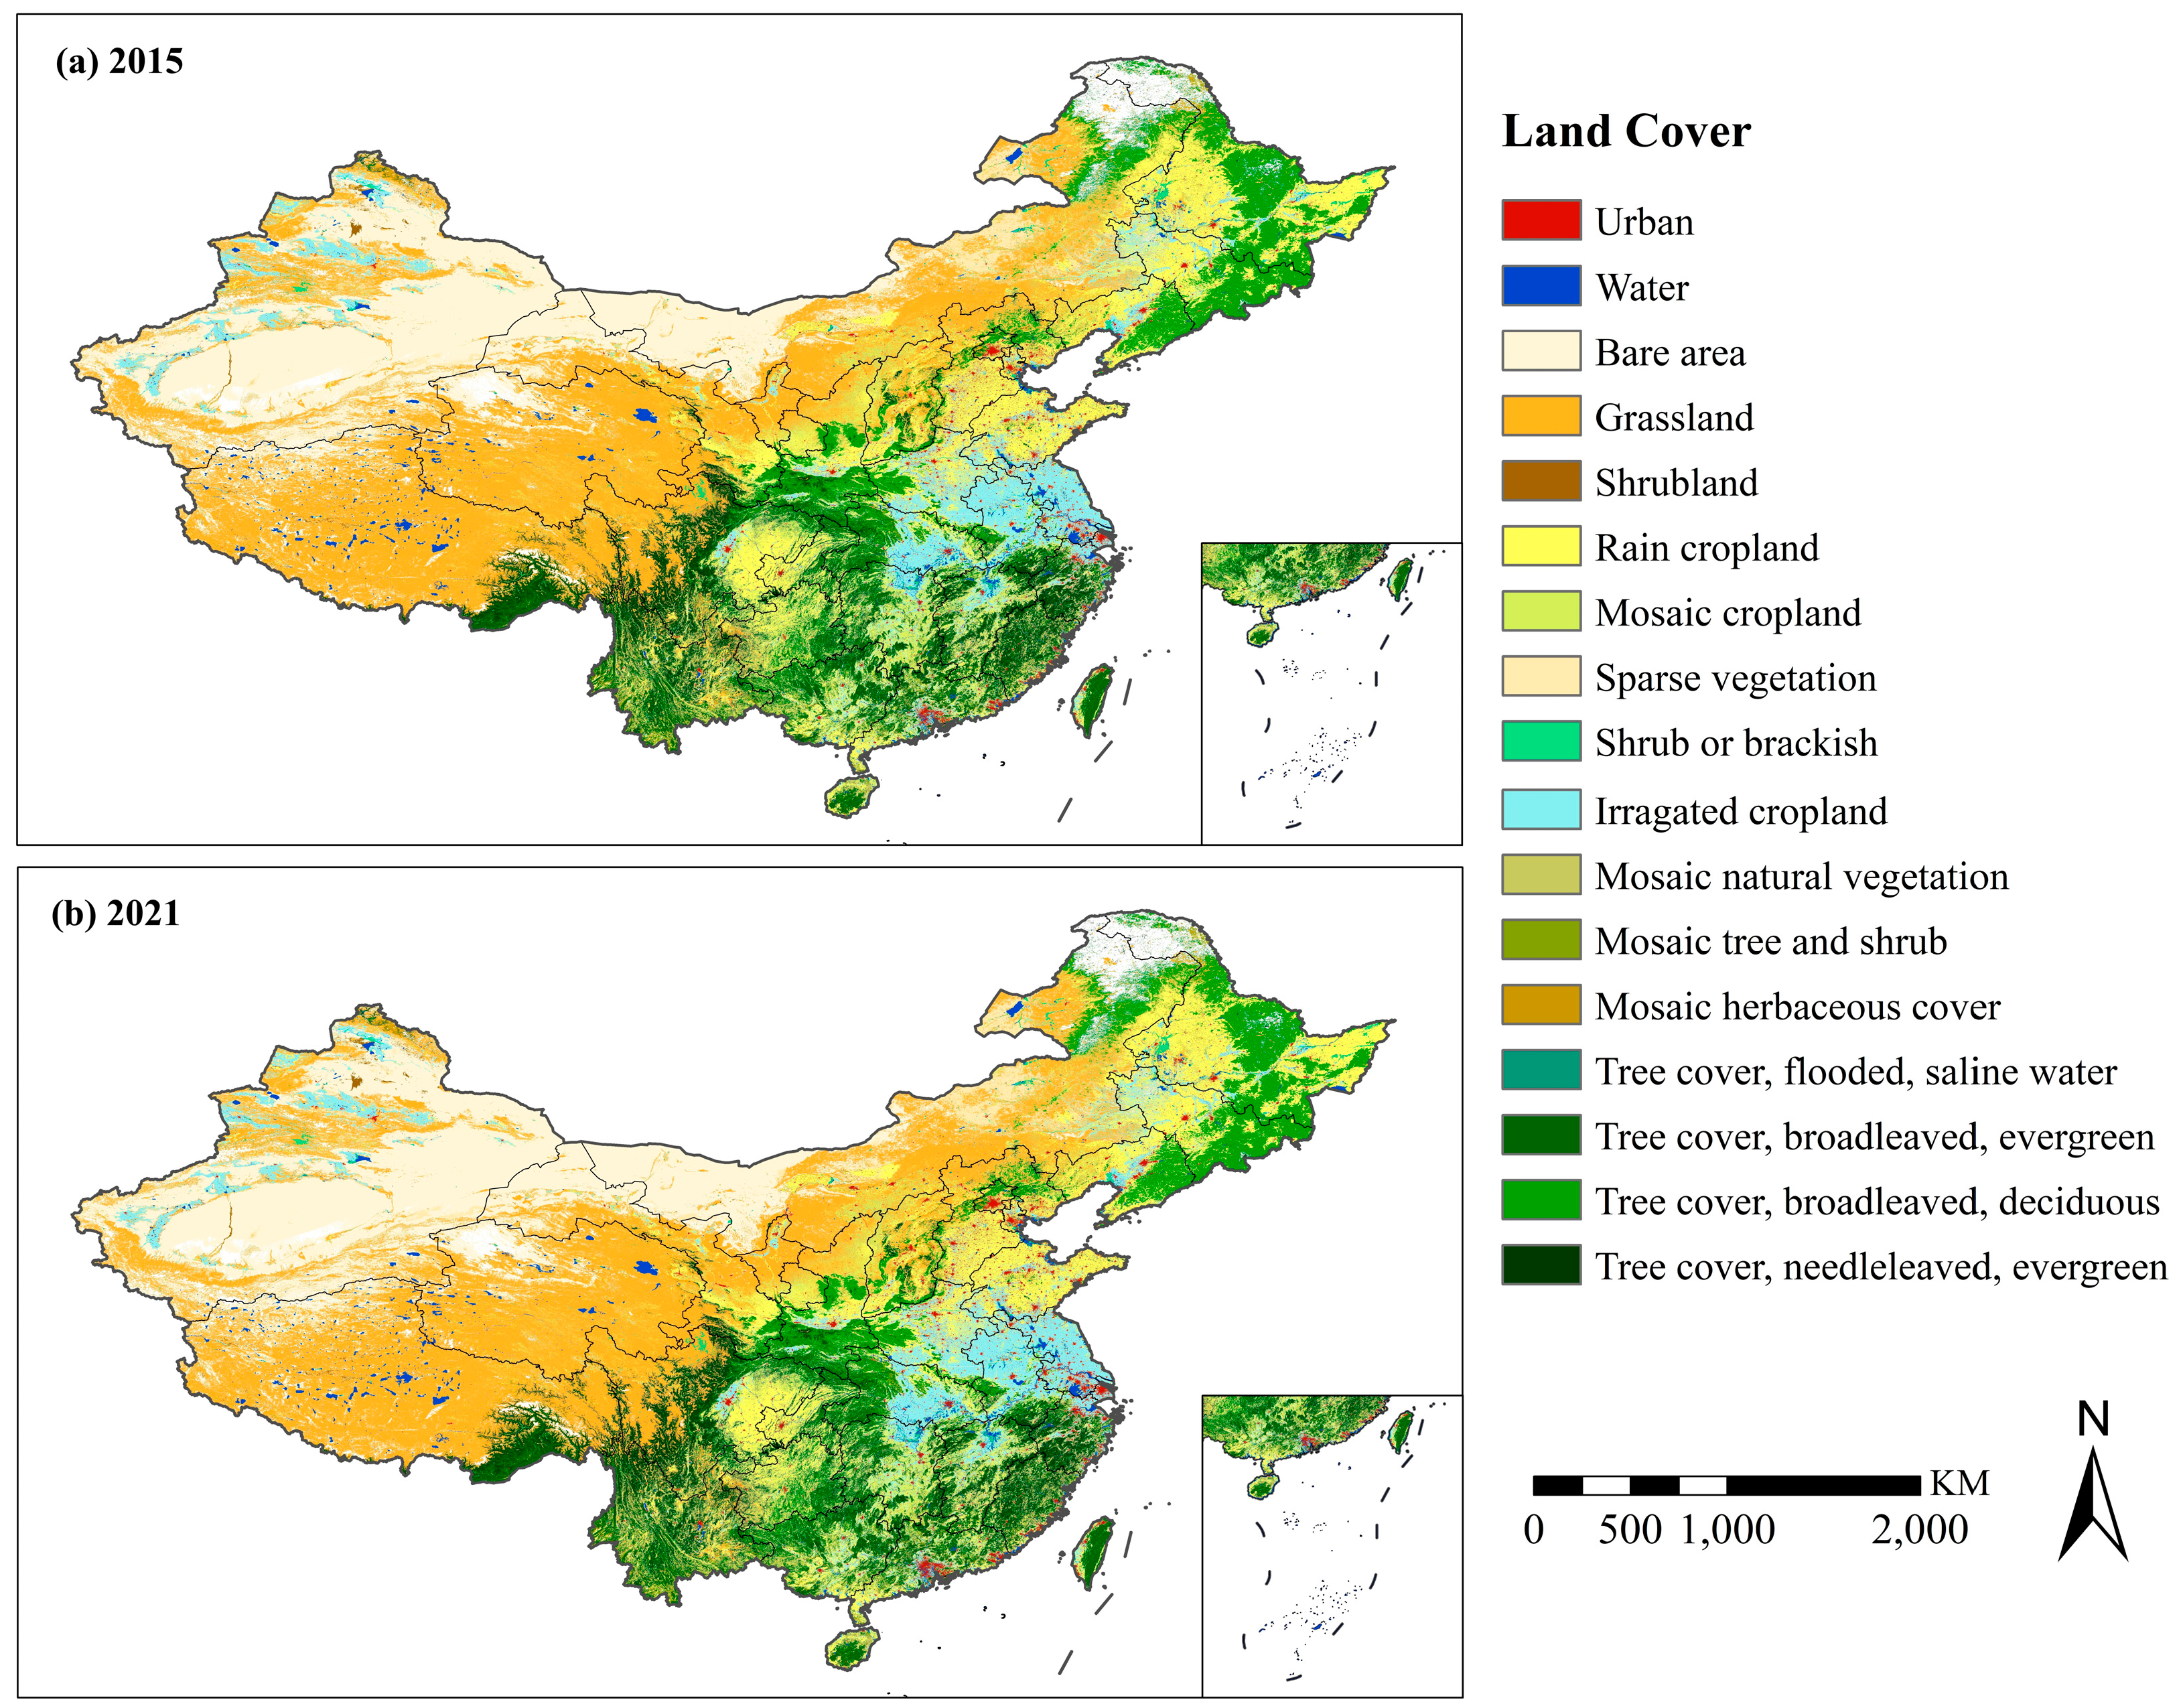
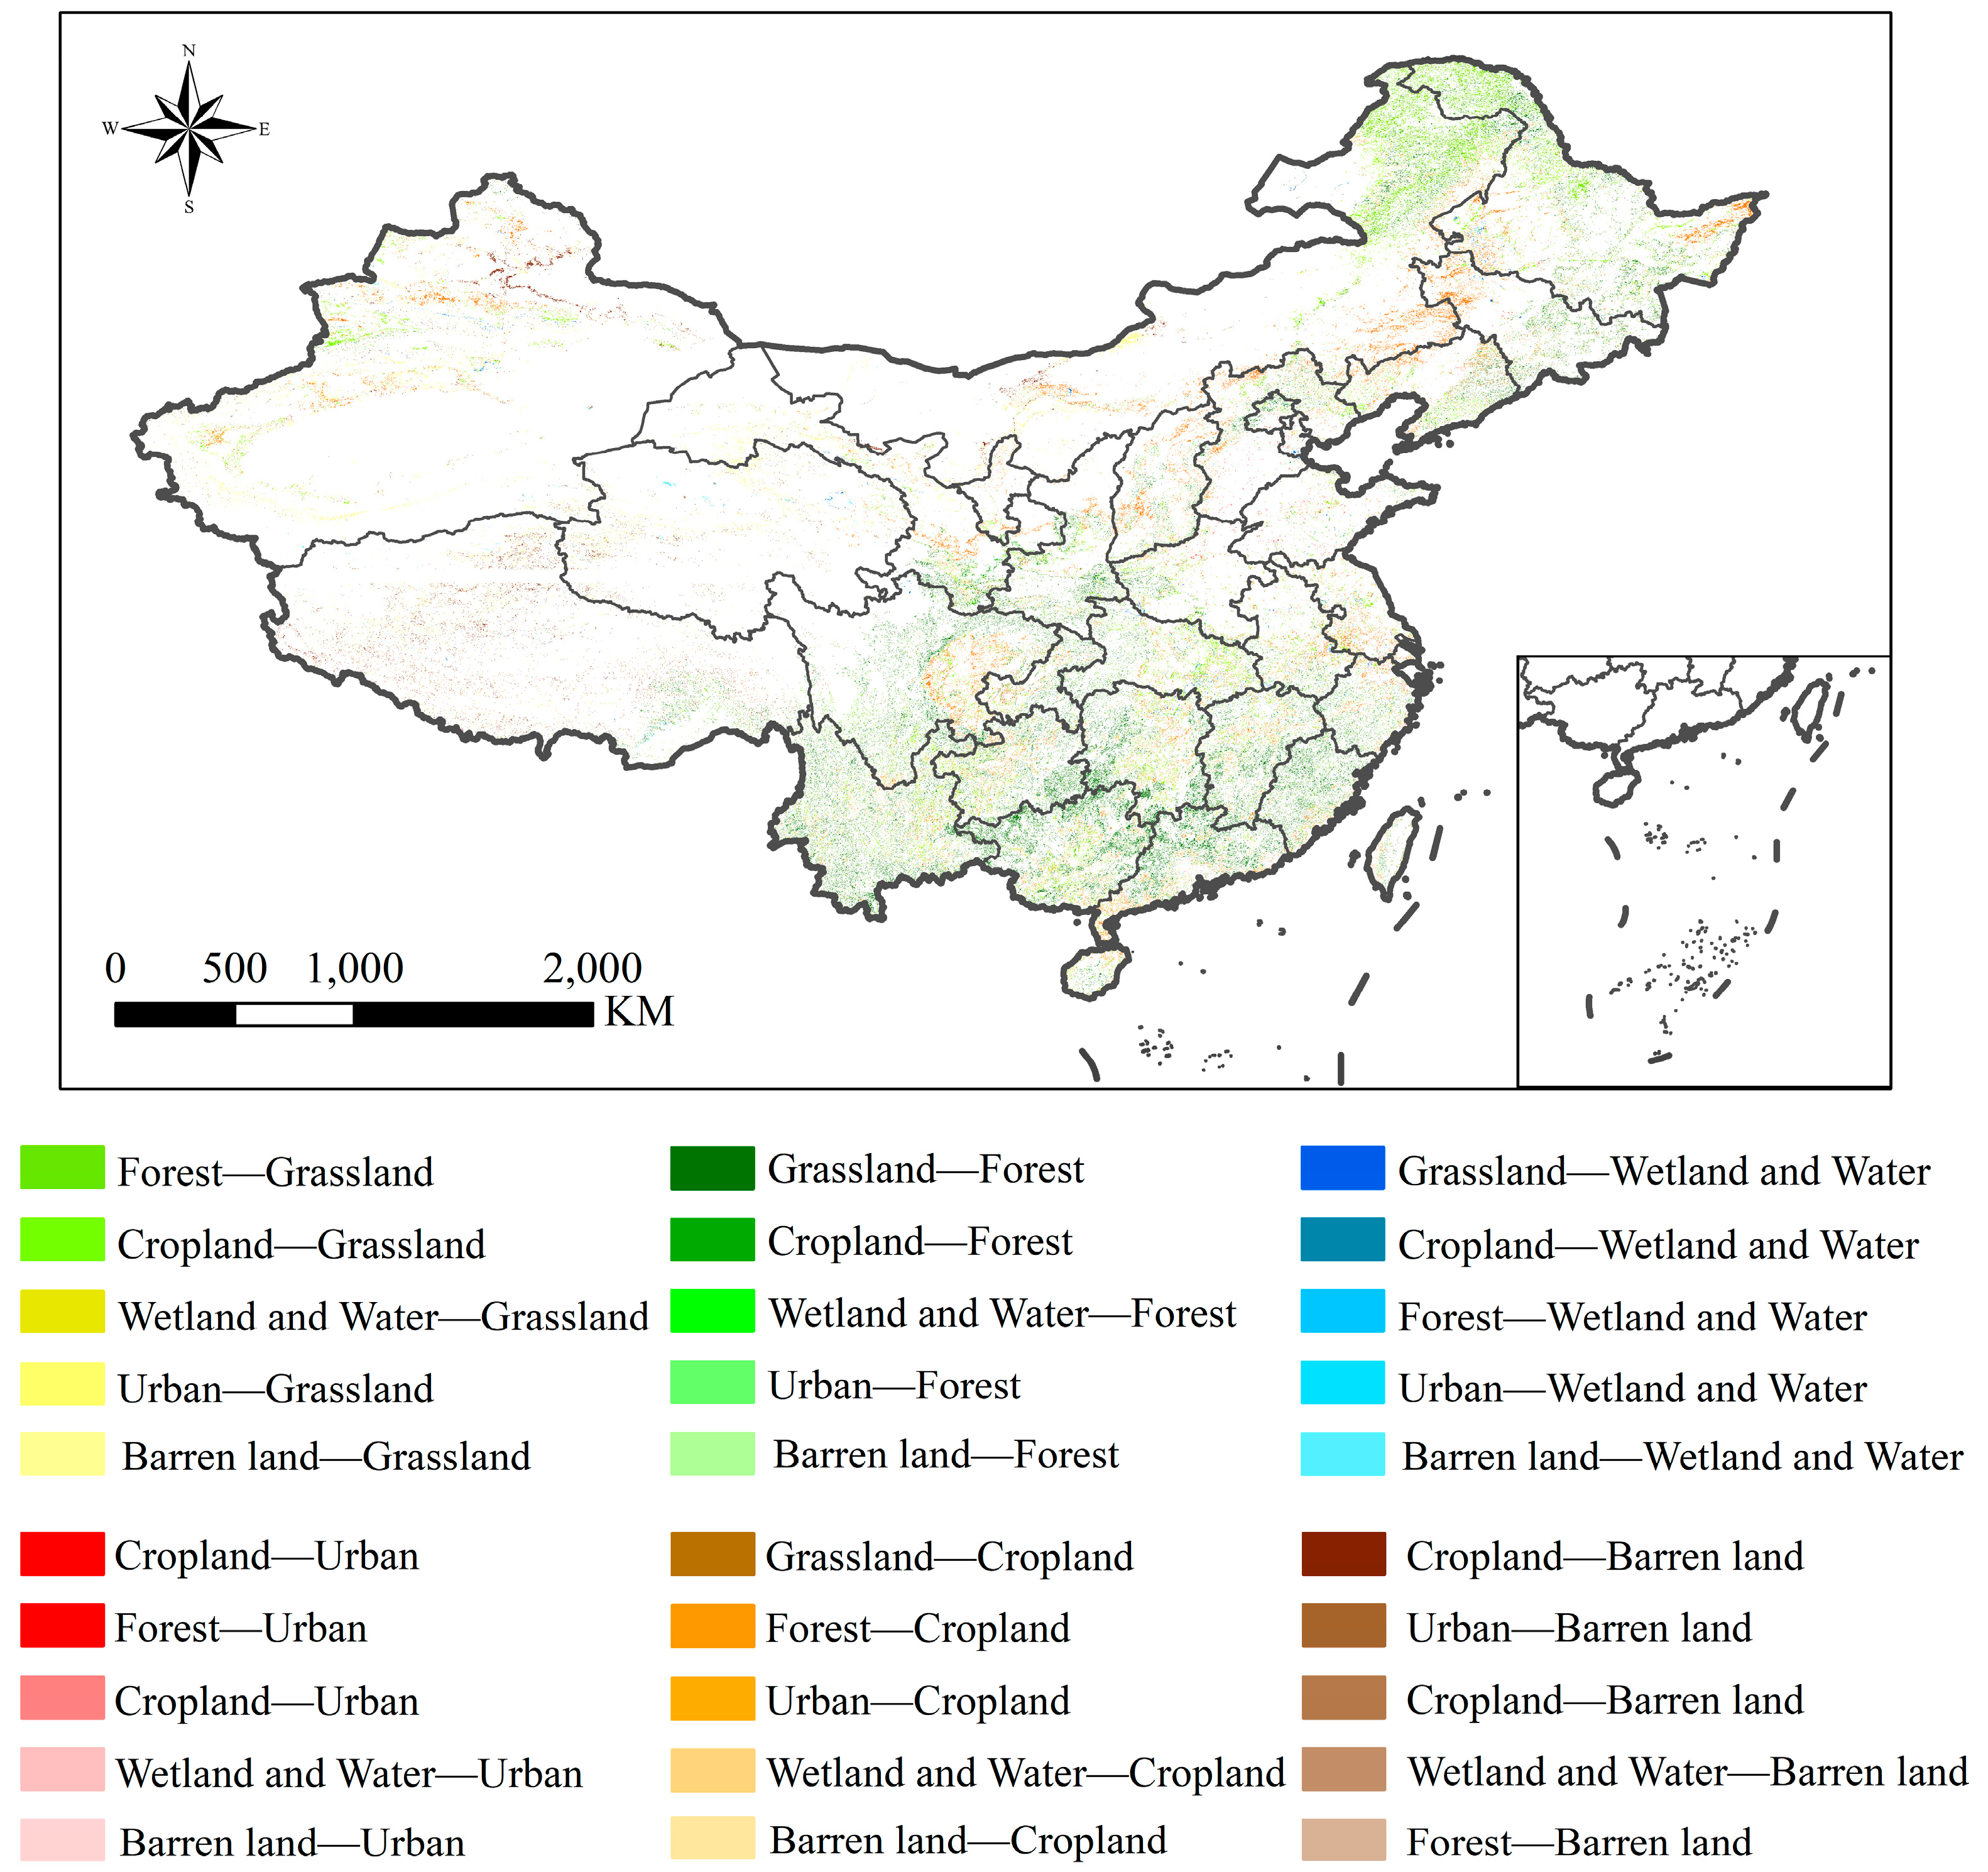
3.2. Land-Cover Change from 2015 to 2021
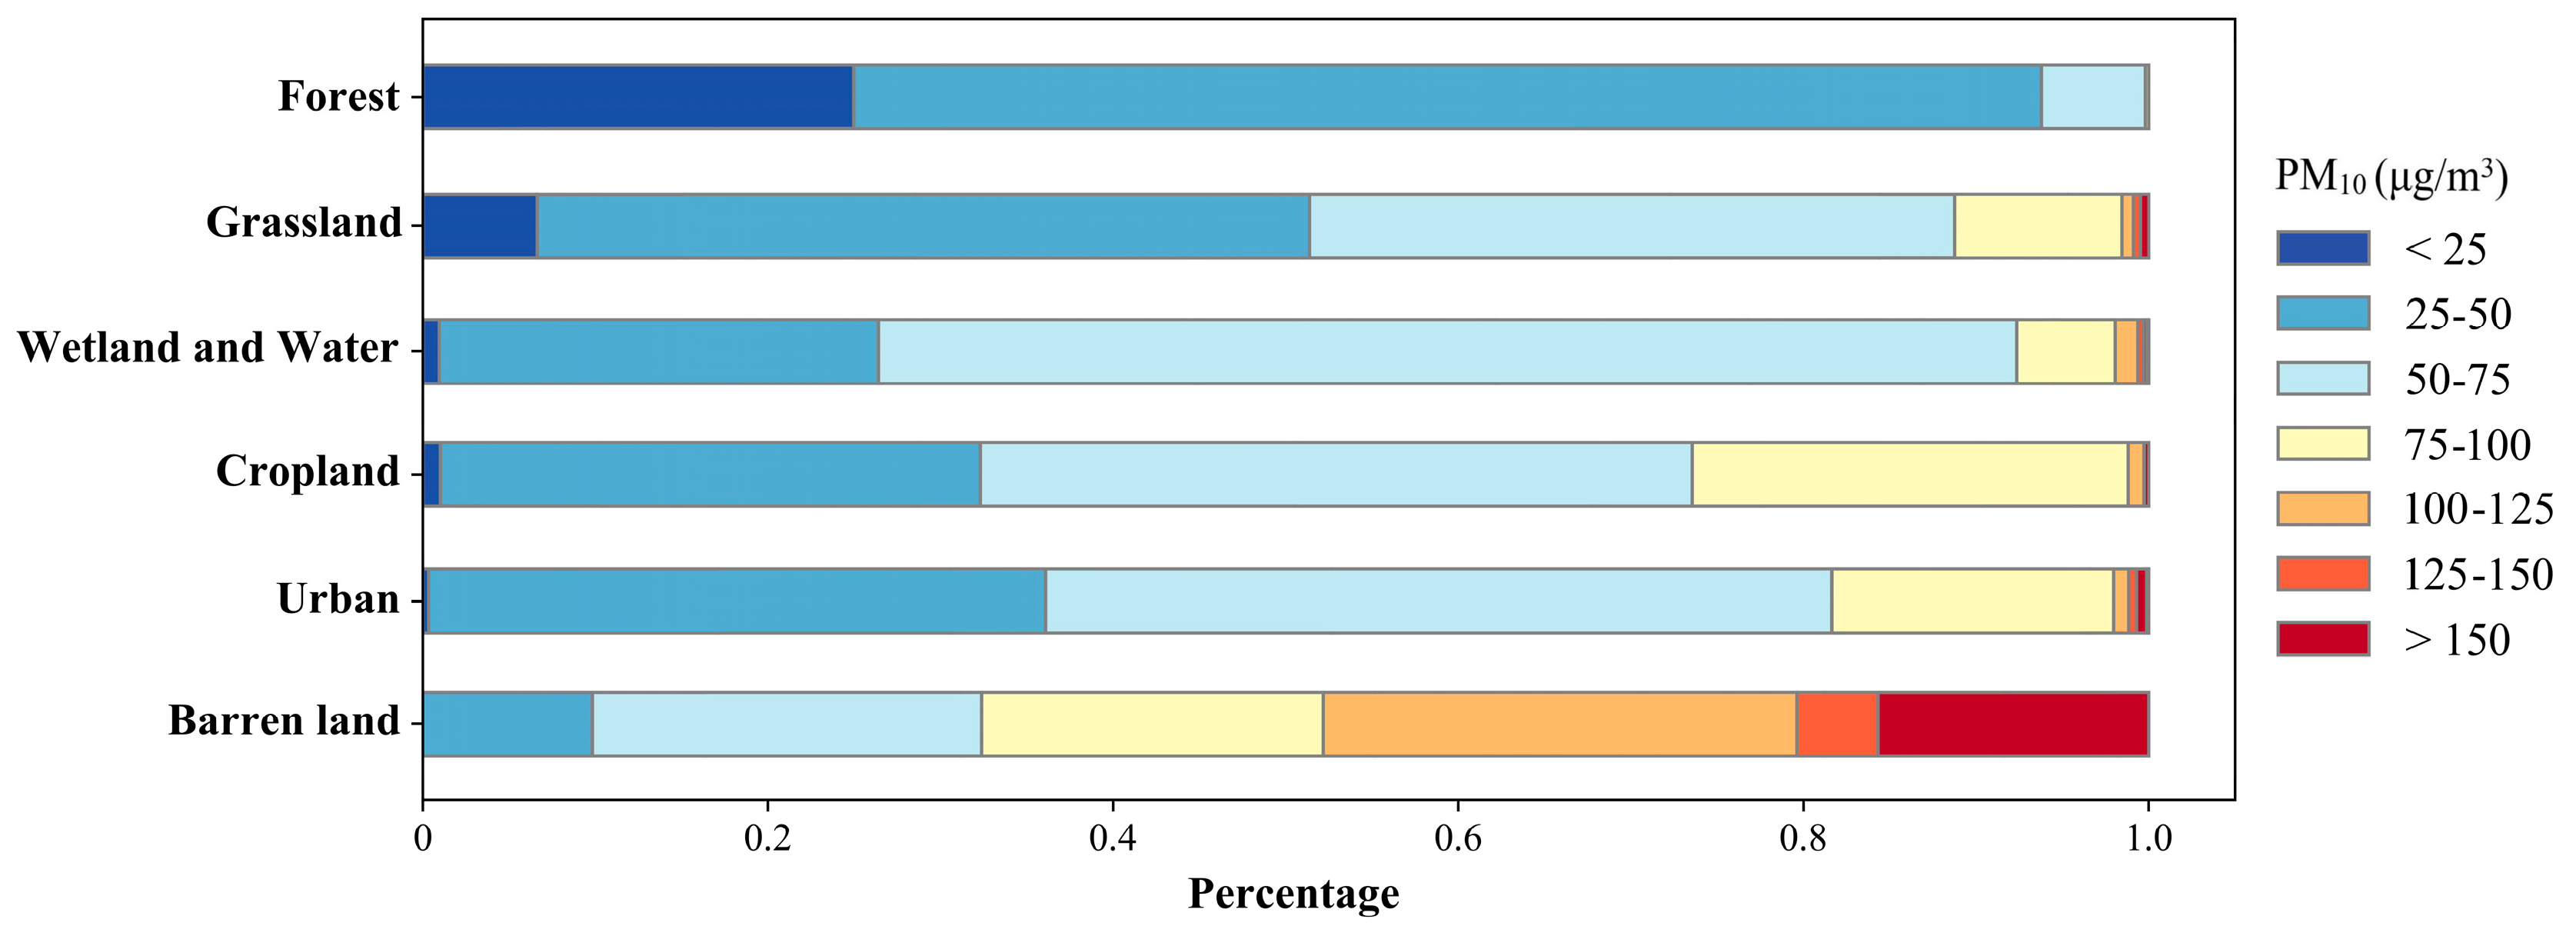
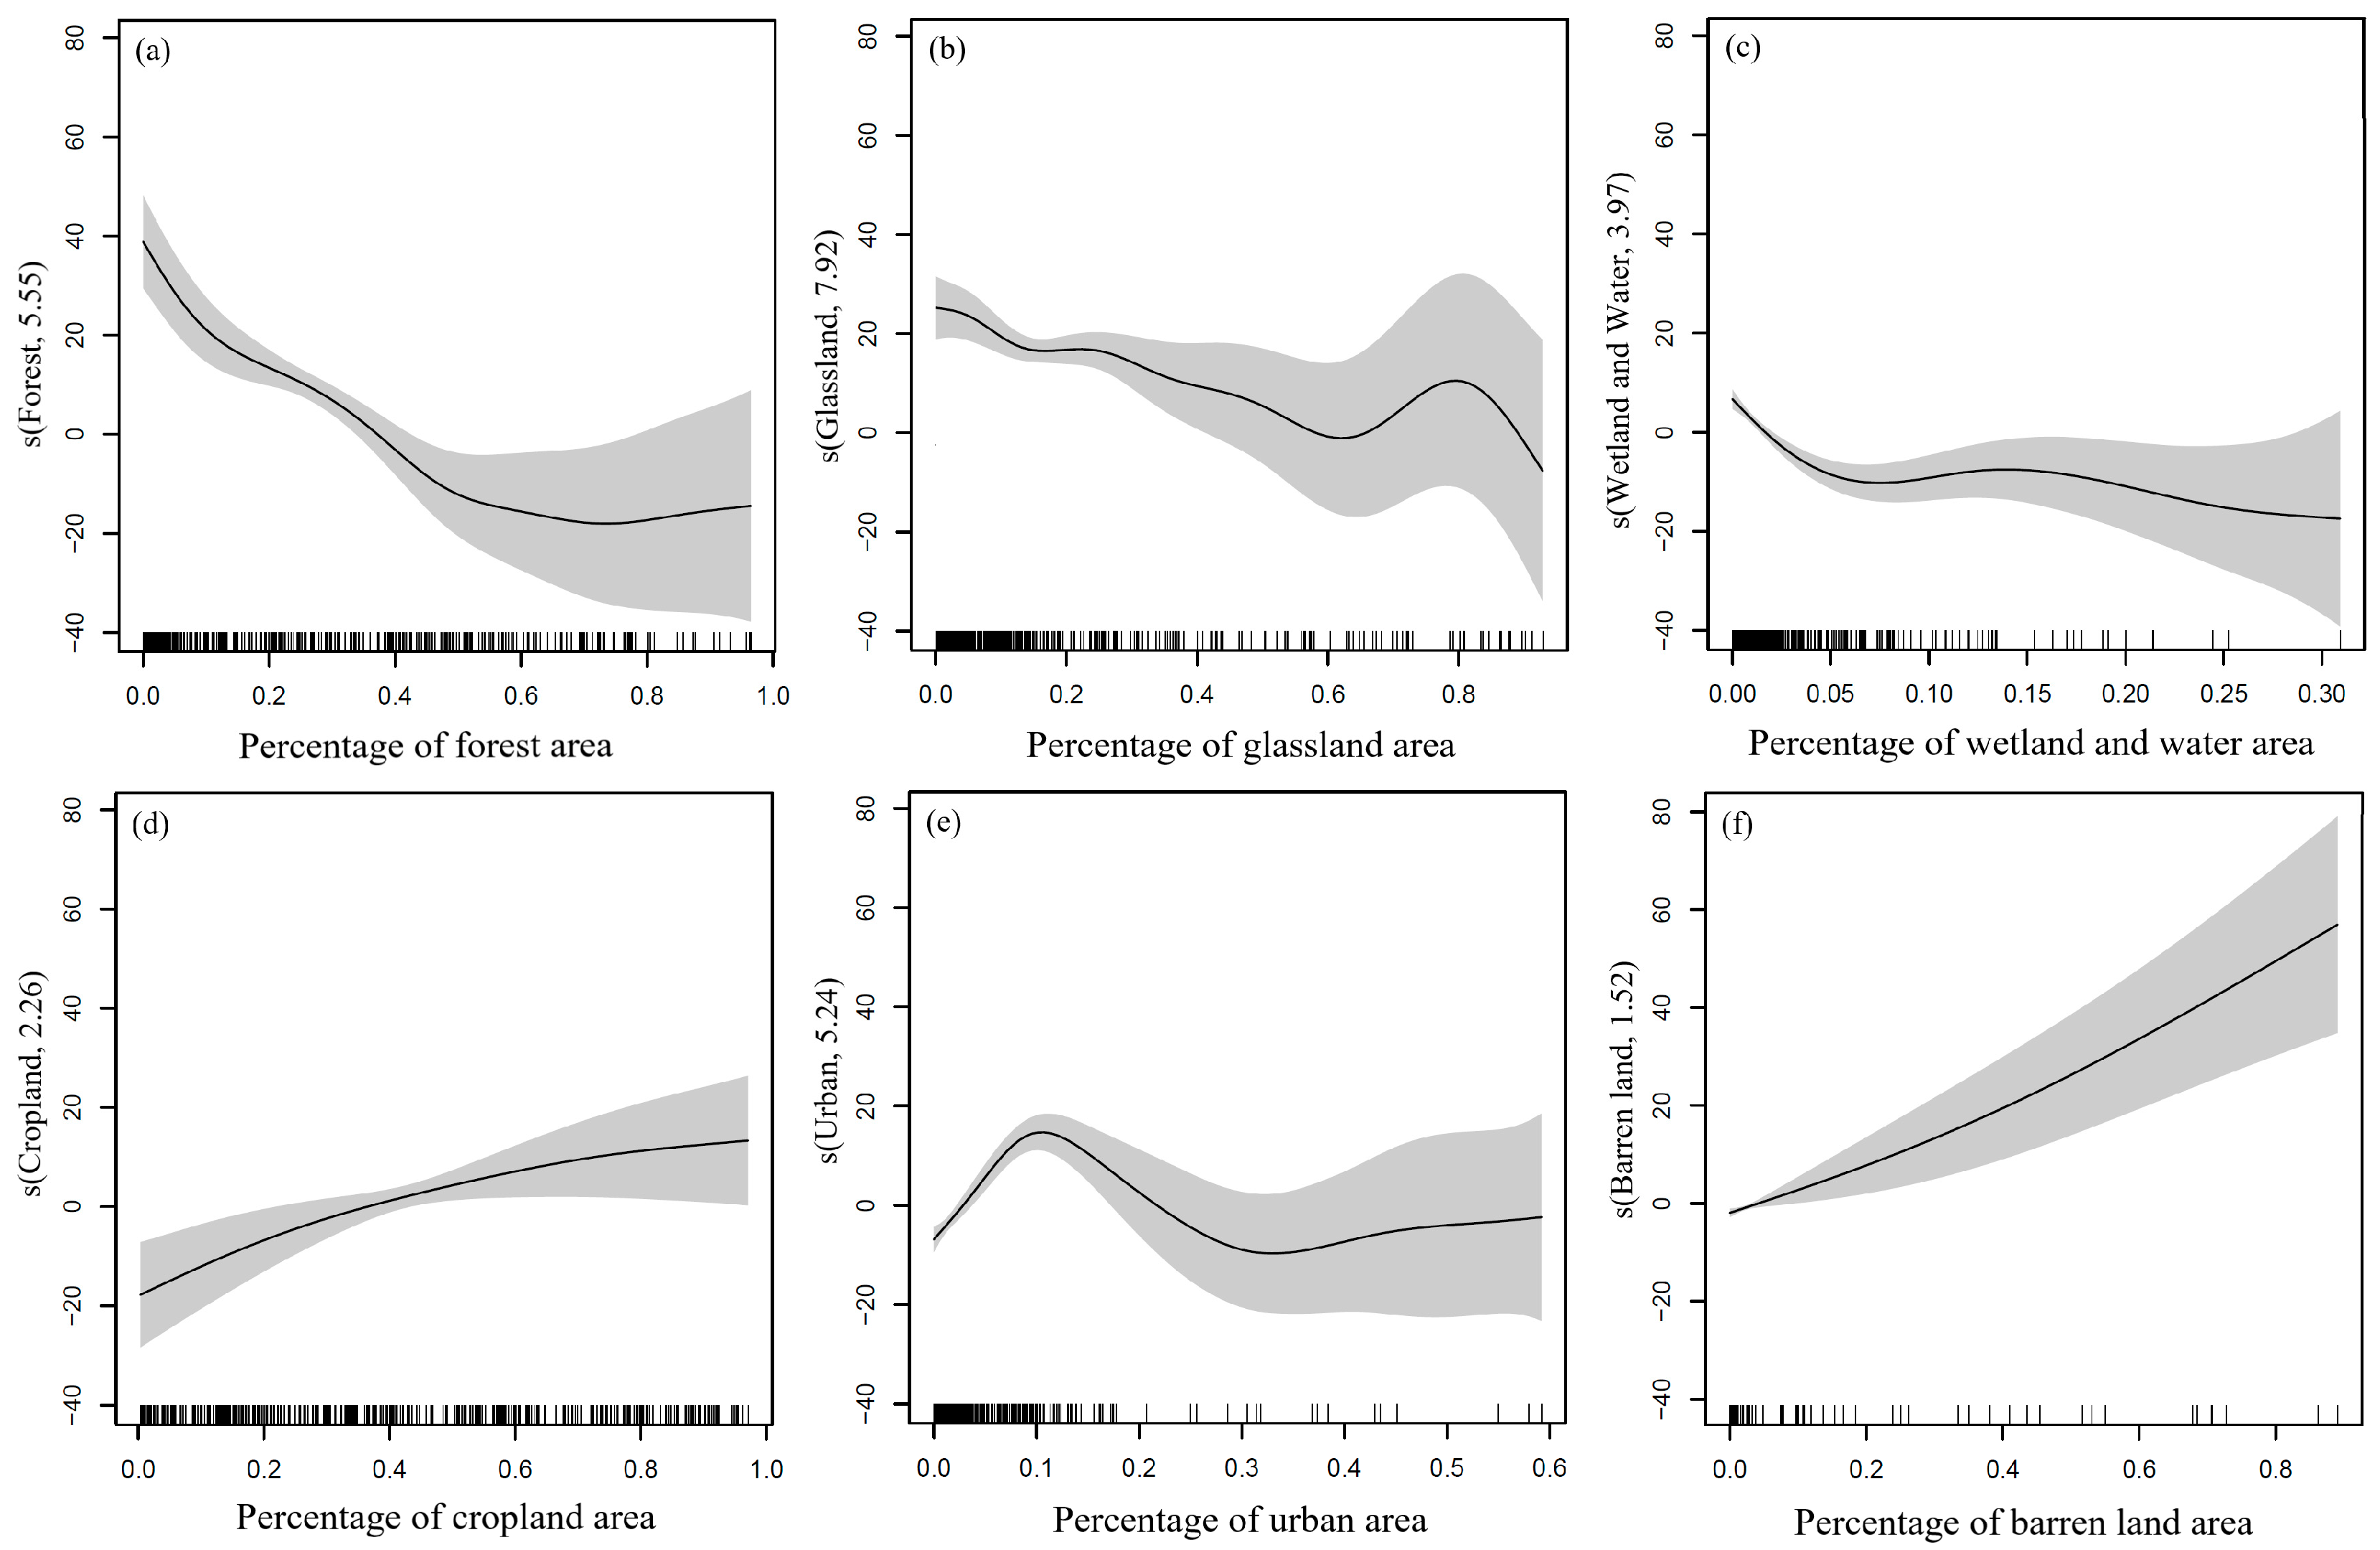
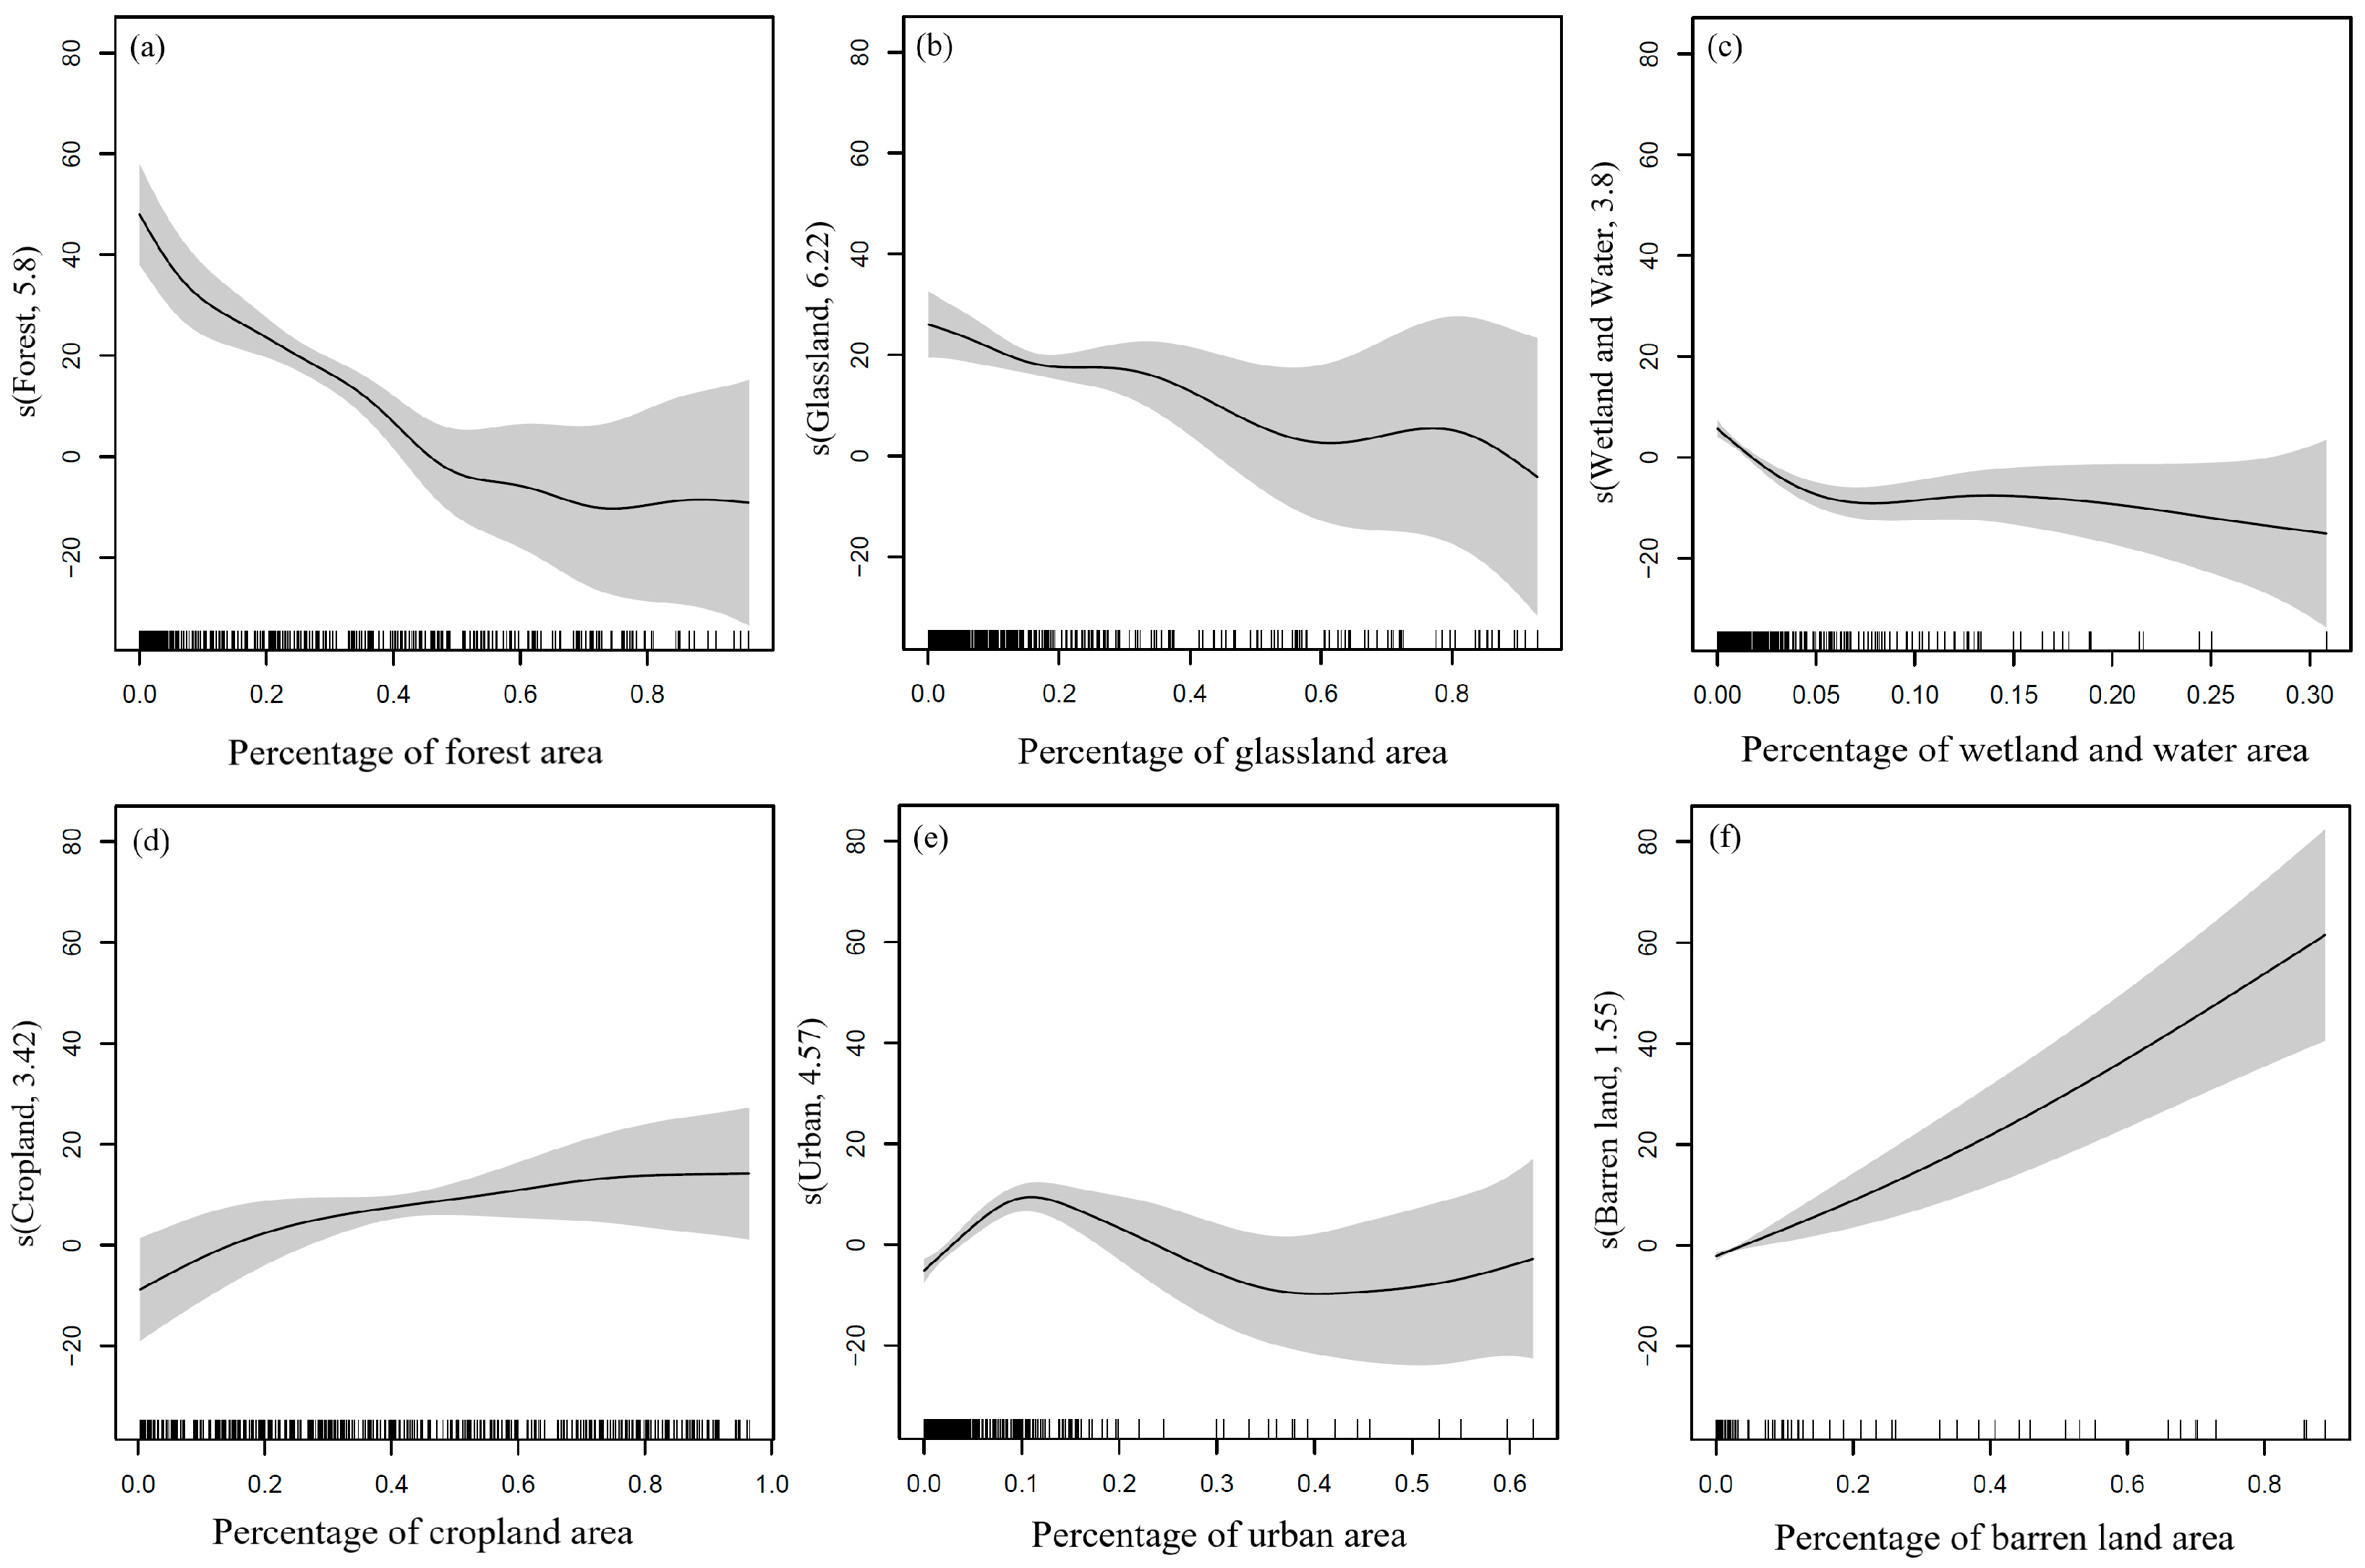
3.3. Nonlinear Relationship between Land-Cover Change and PM10 Concentrations Change
4. Discussion
5. Conclusions
Author Contributions
Funding
Data Availability Statement
Conflicts of Interest
References
- Lin, L.; Gao, T.; Luo, M.; Ge, E.; Yang, Y.; Liu, Z.; Zhao, Y.; Ning, G. Contribution of urbanization to the changes in extreme climate events in urban agglomerations across China. Sci. Total Environ. 2020, 744, 140264. [Google Scholar] [CrossRef] [PubMed]
- Liang, L.; Wang, Z.; Li, J. The effect of urbanization on environmental pollution in rapidly developing urban agglomerations. J. Clean. Prod. 2019, 237, 117649. [Google Scholar] [CrossRef]
- Feng, R.; Zheng, H.; Gao, H.; Zhang, A.; Huang, C.; Zhang, J.; Luo, K.; Fan, J. Recurrent Neural Network and random forest for analysis and accurate forecast of atmospheric pollutants: A case study in Hangzhou, China. J. Clean. Prod. 2019, 231, 1005–1015. [Google Scholar] [CrossRef]
- Li, Y.; Guan, D.; Tao, S.; Wang, X.; He, K. A review of air pollution impact on subjective well-being: Survey versus visual psychophysics. J. Clean. Prod. 2018, 184, 959–968. [Google Scholar] [CrossRef]
- Lambin, E.F.; Turner, B.L.; Geist, H.J.; Agbola, S.B.; Angelsen, A.; Bruce, J.W.; Coomes, O.T.; Dirzo, R.; Fischer, G.; Folke, C. The causes of land-use and land-cover change: Moving beyond the myths. Glob. Environ. Change 2001, 11, 261–269. [Google Scholar] [CrossRef]
- Dewan, A.M.; Yamaguchi, Y.; Ziaur Rahman, M. Dynamics of land use/cover changes and the analysis of landscape fragmentation in Dhaka Metropolitan, Bangladesh. GeoJournal 2012, 77, 315–330. [Google Scholar] [CrossRef]
- Heald, C.; Spracklen, D. Land use change impacts on air quality and climate. Chem. Rev. 2015, 115, 4476–4496. [Google Scholar] [CrossRef] [PubMed]
- Rovira, J.; Domingo, J.; Schuhmacher, M. Air quality, health impacts and burden of disease due to air pollution (PM10, PM2. 5, NO2 and O3): Application of AirQ+ model to the Camp de Tarragona County (Catalonia, Spain). Sci. Total Environ. 2020, 703, 135538. [Google Scholar] [CrossRef] [PubMed]
- Stirnberg, R.; Cermak, J.; Andersen, H. An analysis of factors influencing the relationship between satellite-derived AOD and ground-level PM10. Remote Sens. 2018, 10, 1353. [Google Scholar] [CrossRef]
- Chae, S.; Shin, J.; Kwon, S.; Lee, S.; Kang, S.; Lee, D. PM10 and PM2.5 real-time prediction models using an interpolated convolutional neural network. Sci. Rep. 2021, 11, 11952. [Google Scholar] [CrossRef]
- Song, W.; Jia, H.; Huang, J.; Zhang, Y. A satellite-based geographically weighted regression model for regional PM2.5 estimation over the Pearl River Delta region in China. Remote Sens. Environ. 2014, 154, 1–7. [Google Scholar] [CrossRef]
- You, W.; Zang, Z.; Zhang, L.; Li, Z.; Chen, D.; Zhang, G. Estimating ground-level PM10 concentration in northwestern China using geographically weighted regression based on satellite AOD combined with CALIPSO and MODIS fire count. Remote Sens. Environ. 2015, 168, 276–285. [Google Scholar] [CrossRef]
- Stirnberg, R.; Cermak, J.; Fuchs, J.; Andersen, H. Mapping and understanding patterns of air quality using satellite data and machine learning. J. Geophys. Res. -Atmos. 2020, 125, e2019JD031380. [Google Scholar] [CrossRef]
- Huang, K.; Xiao, Q.; Meng, X.; Geng, G.; Wang, Y.; Lyapustin, A.; Gu, D.; Liu, Y. Predicting monthly high-resolution PM2.5 concentrations with random forest model in the North China Plain. Environ. Pollut. 2018, 242, 675–683. [Google Scholar] [CrossRef] [PubMed]
- Yang, Y.; Wang, Z.; Cao, C.; Xu, M.; Yang, X.; Wang, K.; Guo, H.; Gao, X.; Li, J.; Shi, Z. Estimation of PM2.5 Concentration across China Based on Multi-Source Remote Sensing Data and Machine Learning Methods. Remote Sens. 2024, 16, 467. [Google Scholar] [CrossRef]
- Wang, Z.; Zhou, Y.; Zhao, R.; Wang, N.; Biswas, A.; Shi, Z. High-resolution prediction of the spatial distribution of PM2.5 concentrations in China using a long short-term memory model. J. Clean. Prod. 2021, 297, 126493. [Google Scholar] [CrossRef]
- Huang, D.; He, B.; Wei, L.; Sun, L.; Li, Y.; Yan, Z.; Wang, X.; Chen, Y.; Li, Q.; Feng, S. Impact of land cover on air pollution at different spatial scales in the vicinity of metropolitan areas. Ecol. Indic. 2021, 132, 108313. [Google Scholar] [CrossRef]
- Xian, C.; Zhang, X.; Zhang, J.; Fan, Y.; Zheng, H.; Salzman, J.; Ouyang, Z. Recent patterns of anthropogenic reactive nitrogen emissions with urbanization in China: Dynamics, major problems, and potential solutions. Sci. Total Environ. 2019, 656, 1071–1081. [Google Scholar] [CrossRef] [PubMed]
- Vadrevu, K.; Ohara, T.; Justice, C. Land cover, land use changes and air pollution in Asia: A synthesis. Environ. Res. Lett. 2017, 12, 120201. [Google Scholar] [CrossRef] [PubMed]
- Lai, A.; Liu, Y.; Chen, X.; Chang, M.; Fan, Q.; Chan, P.; Wang, X.; Dai, J. Impact of land-use change on atmospheric environment using refined land surface properties in the Pearl River Delta, China. Adv. Meteorol. 2016, 2016, 3830592. [Google Scholar] [CrossRef]
- Tao, W.; Liu, J.; Ban-Weiss, G.A.; Zhang, L.; Zhang, J.; Yi, K.; Tao, S. Potential impacts of urban land expansion on Asian airborne pollutant outflows. J. Geophys. Res-Atmos. 2017, 122, 7646–7663. [Google Scholar] [CrossRef]
- Sun, L.; Wei, J.; Duan, D.; Guo, Y.; Yang, D.; Jia, C.; Mi, X. Impact of Land-Use and Land-Cover Change on urban air quality in representative cities of China. J. Atmos. Solar -Terr. Phys. 2016, 142, 43–54. [Google Scholar] [CrossRef]
- Yoo, J.-M.; Jeong, M.-J.; Kim, D.; Stockwell, W.R.; Yang, J.-H.; Shin, H.-W.; Lee, M.-I.; Song, C.-K.; Lee, S.-D. Spatiotemporal variations of air pollutants (O3, NO2, SO2, CO, PM10, and VOCs) with land-use types. Atmos. Chem. Phys. 2015, 15, 10857–10885. [Google Scholar] [CrossRef]
- Yang, X.; Zheng, Y.; Geng, G.; Liu, H.; Man, H.; Lv, Z.; He, K.; de Hoogh, K. Development of PM2.5 and NO2 models in a LUR framework incorporating satellite remote sensing and air quality model data in Pearl River Delta region, China. Environ. Pollut. 2017, 226, 143–153. [Google Scholar] [CrossRef] [PubMed]
- Viana, M.; Hammingh, P.; Colette, A.; Querol, X.; Degraeuwe, B.; de Vlieger, I.; Van Aardenne, J. Impact of maritime transport emissions on coastal air quality in Europe. Atmos. Environ. 2014, 90, 96–105. [Google Scholar] [CrossRef]
- Liu, J.; Yan, G.; Wu, Y.; Wang, Y.; Zhang, Z.; Zhang, M. Wetlands with greater degree of urbanization improve PM2.5 removal efficiency. Chemosphere 2018, 207, 601–611. [Google Scholar] [CrossRef] [PubMed]
- Bao, R.; Zhang, A. Does lockdown reduce air pollution? Evidence from 44 cities in northern China. Sci. Total Environ. 2020, 731, 139052. [Google Scholar] [CrossRef] [PubMed]
- Yousefi, R.; Shaheen, A.; Wang, F.; Ge, Q.; Wu, R.; Lelieveld, J.; Wang, J.; Su, X. Fine particulate matter (PM2.5) trends from land surface changes and air pollution policies in China during 1980–2020. J. Environ. Manag. 2023, 326, 116847. [Google Scholar] [CrossRef] [PubMed]
- Bertazzon, S.; Johnson, M.; Eccles, K.; Kaplan, G.G. Accounting for spatial effects in land use regression for urban air pollution modeling. Spat. Spatio-Temporal Epidemiol. 2015, 14, 9–21. [Google Scholar] [CrossRef] [PubMed]
- Li, L.; Wu, J.; Ghosh, J.K.; Ritz, B. Estimating spatiotemporal variability of ambient air pollutant concentrations with a hierarchical model. Atmos. Environ. 2013, 71, 54–63. [Google Scholar] [CrossRef] [PubMed]
- Chen, M.; Dai, F.; Yang, B.; Zhu, S. Effects of neighborhood green space on PM2.5 mitigation: Evidence from five megacities in China. Build. Environ. 2019, 156, 33–45. [Google Scholar] [CrossRef]
- Li, H.; Zhang, H.; Li, Q.; Zhao, J.; Guo, X.; Ying, H.; Wang, S. Vegetation productivity dynamics in response to climate change and human activities under different topography and land cover in Northeast China. Remote Sens. 2021, 13, 975. [Google Scholar] [CrossRef]
- Lyapustin, A.; Wang, Y.; Korkin, S.; Huang, D. MODIS collection 6 MAIAC algorithm. Atmos. Meas. Tech. 2018, 11, 5741–5765. [Google Scholar] [CrossRef]
- Xu, Y.; Xue, W.; Lei, Y.; Huang, Q.; Zhao, Y.; Cheng, S.; Ren, Z.; Wang, J. Spatiotemporal variation in the impact of meteorological conditions on PM2.5 pollution in China from 2000 to 2017. Atmos. Environ. 2020, 223, 117215. [Google Scholar] [CrossRef]
- Hersbach, H.; Bell, B.; Berrisford, P.; Biavati, G.; Horányi, A.; Muñoz Sabater, J.; Nicolas, J.; Peubey, C.; Radu, R.; Rozum, I. ERA5 monthly averaged data on single levels from 1979 to present. Copernic. Clim. Change Serv. (C3S) Clim. Data Store (CDS) 2019, 10, 252–266. [Google Scholar]
- Gelaro, R.; McCarty, W.; Suárez, M.J.; Todling, R.; Molod, A.; Takacs, L.; Randles, C.A.; Darmenov, A.; Bosilovich, M.G.; Reichle, R. The modern-era retrospective analysis for research and applications, version 2 (MERRA-2). J. Clim. 2017, 30, 5419–5454. [Google Scholar] [CrossRef] [PubMed]
- Zhao, S.; Liu, S.; Hou, X.; Beazley, R.; Sun, Y. Identifying the contributions of multiple driving forces to PM10–2.5 pollution in urban areas in China. Sci. Total Environ. 2019, 663, 361–368. [Google Scholar] [CrossRef] [PubMed]
- Tatem, A.J. WorldPop, open data for spatial demography. Sci. Data 2017, 4, 1–4. [Google Scholar] [CrossRef] [PubMed]
- Sulla-Menashe, D.; Gray, J.M.; Abercrombie, S.P.; Friedl, M.A. Hierarchical mapping of annual global land cover 2001 to present: The MODIS Collection 6 Land Cover product. Remote Sens. Environ. 2019, 222, 183–194. [Google Scholar] [CrossRef]
- Geurts, P.; Ernst, D.; Wehenkel, L. Extremely randomized trees. Mach. Learn. 2006, 63, 3–42. [Google Scholar] [CrossRef]
- Segal, M.R. Machine Learning Benchmarks and Random Forest Regression; Kluwer Academic Publishers: Dordrecht, The Netherlands, 2004. [Google Scholar]
- Hastie, T.; Tibshirani, R. Generalized additive models: Some applications. J. Am. Stat. Assoc. 1987, 82, 371–386. [Google Scholar] [CrossRef]
- Rodriguez, J.D.; Perez, A.; Lozano, J.A. Sensitivity analysis of k-fold cross validation in prediction error estimation. IEEE T. Pattern Anal. 2009, 32, 569–575. [Google Scholar] [CrossRef]
- Chen, G.; Wang, Y.; Li, S.; Cao, W.; Ren, H.; Knibbs, L.D.; Abramson, M.J.; Guo, Y. Spatiotemporal patterns of PM10 concentrations over China during 2005–2016: A satellite-based estimation using the random forests approach. Environ. Pollut. 2018, 242, 605–613. [Google Scholar] [CrossRef] [PubMed]
- Zhang, T.; Gong, W.; Zhu, Z.; Sun, K.; Huang, Y.; Ji, Y. Semi-physical estimates of national-scale PM10 concentrations in China using a satellite-based geographically weighted regression model. Atmosphere 2016, 7, 88. [Google Scholar] [CrossRef]
- Zhang, Z.; Wang, J.; Hart, J.E.; Laden, F.; Zhao, C.; Li, T.; Zheng, P.; Li, D.; Ye, Z.; Chen, K. National scale spatiotemporal land-use regression model for PM2.5, PM10 and NO2 concentration in China. Atmos. Environ. 2018, 192, 48–54. [Google Scholar] [CrossRef]
- Wei, J.; Li, Z.; Xue, W.; Sun, L.; Fan, T.; Liu, L.; Su, T.; Cribb, M. The ChinaHighPM10 dataset: Generation, validation, and spatiotemporal variations from 2015 to 2019 across China. Environ. Int. 2021, 146, 106290. [Google Scholar] [CrossRef] [PubMed]
- Liu, H.; Cui, W.; Zhang, M. Exploring the causal relationship between urbanization and air pollution: Evidence from China. Sustain. Cities Soc. 2022, 80, 103783. [Google Scholar] [CrossRef]
- Davidson, N. How much wetland has the world lost? Long-term and recent trends in global wetland area. Mar. Freshwater Res. 2014, 65, 934–941. [Google Scholar] [CrossRef]
- Wang, S.; Bai, X.; Zhang, X.; Reis, S.; Chen, D.; Xu, J.; Gu, B. Urbanization can benefit agricultural production with large-scale farming in China. Nat. Food 2021, 2, 183–191. [Google Scholar] [CrossRef] [PubMed]
- Jiao, L.; Dong, T.; Xu, G.; Zhou, Z.; Liu, J.; Liu, Y. Geographic micro-process model: Understanding global urban expansion from a process-oriented view. Comput. Environ. Urban Syst. 2021, 87, 101603. [Google Scholar] [CrossRef]
- Bhaskar, A.; Chandra, J.; Hashemi, H.; Butler, K.; Bennett, L.; Cellini, J.; Braun, D.; Dominici, F. A literature review of the effects of air pollution on COVID-19 health outcomes worldwide: Statistical challenges and data visualization. Annu. Rev. Public Health 2023, 44, 1–20. [Google Scholar] [CrossRef] [PubMed]
- Barua, S.; Nath, S.D. The impact of COVID-19 on air pollution: Evidence from global data. J. Clean. Prod. 2021, 298, 126755. [Google Scholar] [CrossRef]
- Liang, P.; Chen, B.; Yang, X.; Liu, Q.; Li, A.; Mackenzie, L.; Zhang, D. Revealing the dust transport processes of the 2021 mega dust storm event in northern China. Sci. Bull. 2021, 67, 21–24. [Google Scholar] [CrossRef] [PubMed]
- Dilawar, A.; Chen, B.; Ul-Haq, Z.; Ali, S.; Sajjad, M.; Fang, J.; Gemechu, T.; Guo, M.; Dilawar, H.; Zhang, H.; et al. Evaluating the potential footprints of land use and land cover and climate dynamics on atmospheric pollution in Pakistan. Front. Environ. Sci. 2024, 11, 1272155. [Google Scholar] [CrossRef]
- Liu, Y.; Wang, G.; Hu, Z.; Shi, P.; Lyu, Y.; Zhang, G.; Gu, Y.; Liu, Y.; Hong, C.; Guo, L. Dust storm susceptibility on different land surface types in arid and semiarid regions of northern China. Atmos. Res. 2020, 243, 105031. [Google Scholar] [CrossRef]
- Karagulian, F.; Belis, C.A.; Dora, C.F.C.; Prüss-Ustün, A.M.; Bonjour, S.; Adair-Rohani, H.; Amann, M. Contributions to cities’ ambient particulate matter (PM): A systematic review of local source contributions at global level. Atmos. Environ. 2015, 120, 475–483. [Google Scholar] [CrossRef]
- Wang, P. China’s air pollution policies: Progress and challenges. Curr. Opin. Environ. 2021, 19, 100227. [Google Scholar] [CrossRef]
- Elminir, H. Dependence of urban air pollutants on meteorology. Sci. Total Environ. 2005, 350, 225–237. [Google Scholar] [CrossRef] [PubMed]
- Diener, A.; Mudu, P. How can vegetation protect us from air pollution? A critical review on green spaces’ mitigation abilities for air-borne particles from a public health perspective-with implications for urban planning. Sci. Total Environ. 2021, 796, 148605. [Google Scholar] [CrossRef] [PubMed]
- Zhao, Y.; Xin, Z.; Ding, G. Spatiotemporal variation in the occurrence of sand-dust events and its influencing factors in the Beijing-Tianjin Sand Source Region, China, 1982–2013. Reg. Environ. Change 2018, 18, 2433–2444. [Google Scholar] [CrossRef]
- Darvishi Boloorani, A.; Soleimani, M.; Papi, R.; Neysani Samany, N.; Teymouri, P.; Soleimani, Z. Sources, drivers, and impacts of sand and dust storms: A global view. In Dust and Health: Challenges and Solutions; Springer: Berlin/Heidelberg, Germany, 2023; pp. 31–49. [Google Scholar] [CrossRef]
- Feng, K.; Wang, T.; Liu, S.; Kang, W.; Chen, X.; Guo, Z.; Zhi, Y. Monitoring desertification using machine-learning techniques with multiple indicators derived from MODIS images in Mu Us Sandy Land, China. Remote Sens. 2022, 14, 2663. [Google Scholar] [CrossRef]
- Bauer, S.E.; Tsigaridis, K.; Miller, R. Significant atmospheric aerosol pollution caused by world food cultivation. Geophys. Res. Lett. 2016, 43, 5394–5400. [Google Scholar] [CrossRef]
- Punsompong, P.; Chantara, S. Identification of potential sources of PM10 pollution from biomass burning in northern Thailand using statistical analysis of trajectories. Atmos. Pollut. Res. 2018, 9, 1038–1051. [Google Scholar] [CrossRef]
- Maffia, J.; Dinuccio, E.; Amon, B.; Balsari, P. PM emissions from open field crop management: Emission factors, assessment methods and mitigation measures–A review. Atmos. Environ. 2020, 226, 117381. [Google Scholar] [CrossRef]
- Csavina, J.; Field, J.; Félix, O.; Corral-Avitia, Y.; Sáez, E.; Betterton, A. Effect of wind speed and relative humidity on atmospheric dust concentrations in semi-arid climates. Sci. Total Environ. 2014, 487, 82–90. [Google Scholar] [CrossRef] [PubMed]
- Qu, W.; Wang, J.; Zhang, X.; Wang, D.; Sheng, L. Influence of relative humidity on aerosol composition: Impacts on light extinction and visibility impairment at two sites in coastal area of China. Atmos. Res. 2015, 153, 500–511. [Google Scholar] [CrossRef]
- Li, J.; Song, Y.; Mao, Y.; Mao, Z.; Wu, Y.; Li, M.; Huang, X.; He, Q.; Hu, M. Chemical characteristics and source apportionment of PM2.5 during the harvest season in eastern China’s agricultural regions. Atmos. Environ. 2014, 92, 442–448. [Google Scholar] [CrossRef]
- Wang, S.; Gao, S.; Li, S.; Feng, K. Strategizing the relation between urbanization and air pollution: Empirical evidence from global countries. J. Clean. Prod. 2020, 243, 118615. [Google Scholar] [CrossRef]
- Apergis, N.; Ozturk, I. Testing environmental Kuznets curve hypothesis in Asian countries. Ecol. Indic. 2015, 52, 16–22. [Google Scholar] [CrossRef]
- Zou, B.; Xu, S.; Sternberg, T.; Fang, X. Effect of land use and cover change on air quality in urban sprawl. Sustainability 2016, 8, 677. [Google Scholar] [CrossRef]

| Date | Hour | Type | 1001A | 1002A | 1003A | 1004A | … | 2846A |
|---|---|---|---|---|---|---|---|---|
| 1 January 2016 | 0 | AQI | 245 | 119 | 250 | 243 | … | 153 |
| 1 January 2016 | 0 | PM2.5 | 195 | 90 | 200 | 193 | … | 117 |
| 1 January 2016 | 0 | PM2.5_24h | 67 | 50 | 69 | 65 | … | 52 |
| 1 January 2016 | 0 | PM10 | 200 | - | 209 | 209 | … | - |
| 1 January 2016 | 0 | PM10_24h | 148 | - | 110 | 139 | … | 68 |
| 1 January 2016 | 0 | SO2 | 26 | 22 | 31 | 7 | … | 16 |
| 1 January 2016 | 0 | SO2_24h | 17 | 17 | 15 | 9 | … | 9 |
| 1 January 2016 | 0 | NO2 | 95 | 76 | 98 | 101 | … | 102 |
| 1 January 2016 | 0 | NO2_24h | 71 | 49 | 69 | 76 | … | 63 |
| 1 January 2016 | 0 | O3 | 10 | 2 | 2 | 3 | … | 6 |
| 1 January 2016 | 0 | O3_24h | 29 | 72 | 20 | 22 | … | 87 |
| 1 January 2016 | 0 | O3_8h | 11 | 6 | 3 | 3 | … | 25 |
| 1 January 2016 | 0 | CO | 3.4 | 3.6 | 3.4 | 3.8 | … | 67 |
| 1 January 2016 | 0 | CO_24h | 1.771 | 1.5 | 1.542 | 1.758 | ... | 1.093 |
| ... | ... | ... | ... | ... | ... | ... | ... | … |
| 1 January 2016 | 23 | CO | 4.5 | 4.2 | 4.5 | 5.6 | … | 1.212 |
| 1 January 2016 | 23 | CO_24h | 3.133 | 3.783 | 3.2 | 3.487 | … | 0.943 |
| Variable | Unit | Spatial Resolution | Temporal Resolution | Data Source |
|---|---|---|---|---|
| PM10 | μg/m3 | In situ | Hourly | WAQIPT |
| AOD | - | 1 km × 1 km | Daily | MCD19A2 |
| BLH | m | 0.25° × 0.25° | Monthly | ERA5 |
| RH | % | 0.25° × 0.25° | Monthly | |
| SP | hPa | 0.1° × 0.1° | Monthly | |
| TP | mm | 0.1° × 0.1° | Monthly | |
| WU | m/s | 0.1° × 0.1° | Monthly | |
| WV | m/s | 0.1° × 0.1° | Monthly | |
| T2M | K | 0.1° × 0.1° | Monthly | |
| DE | kg/m2/s | 0.5° × 0.625° | Monthly | MERRA-2 |
| LC | - | 500 m × 500 m | Yearly | MCD12Q1 |
| NDVI | - | 1 km × 1 km | 16-Day | MOD13A2 |
| POP | - | 1 km × 1 km | Yearly | WorldPop |
| 2015 | 2021 | ||||||
|---|---|---|---|---|---|---|---|
| Forest | Grassland | Wetland and Water | Cropland | Urban | Barren Land | Total | |
| Forest | 994,618.79 | 73,068.24 | 252.96 | 786.78 | 4.65 | 0.93 | 1,068,732.35 |
| Grassland | 170,610.36 | 4,075,128.25 | 6224.49 | 107,611.23 | 4886.22 | 28,286.88 | 4,392,747.43 |
| Wetland and Water | 416.64 | 3816.72 | 152,886.82 | 415.71 | 69.75 | 789.57 | 158,395.21 |
| Cropland | 3579.57 | 93,090.21 | 833.28 | 1,432,184.53 | 3450.3 | 33.48 | 1,533,171.37 |
| Urban | 26.97 | 729.12 | 21.39 | 440.82 | 145,883.93 | 1.86 | 147,104.09 |
| Barren land | 196.23 | 57,954.81 | 2463.57 | 232.51 | 46.52 | 2,233,789.52 | 2,294,683.16 |
| Total | 1,169,448.56 | 4,303,787.35 | 162,682.51 | 1,541,671.58 | 154,341.37 | 2,262,902.24 | 9,594,833.61 |
| 2015 | 2016 | 2017 | 2018 | 2019 | 2020 | 2021 | |
|---|---|---|---|---|---|---|---|
| Forest | 37.3 | 37.25 | 36.24 | 38.19 | 38.34 | 36.86 | 35.96 |
| Grassland | 55.81 | 56.02 | 54.17 | 54.66 | 54.47 | 52.91 | 53.58 |
| Wetland and Water | 59.2 | 60.65 | 57.86 | 59.45 | 60.7 | 59.62 | 59.41 |
| Cropland | 61.07 | 63.71 | 60.32 | 62.28 | 62.53 | 61.52 | 60.79 |
| Urban | 61.76 | 61.93 | 61.62 | 61.54 | 61.21 | 60.25 | 61.19 |
| Barren land | 100.33 | 98.97 | 100.01 | 101.18 | 98.42 | 97.04 | 98.34 |
| 2015 | 2021 | ΔPM10 | 2015 | 2021 | ΔPM10 |
|---|---|---|---|---|---|
| Forest | Forest | −7.21 | Cropland | Forest | −9.40 |
| Glassland | −5.33 | Glassland | −7.96 | ||
| Wetland and Water | −2.51 | Wetland and Water | −10.65 | ||
| Cropland | −0.69 | Cropland | −2.42 | ||
| Urban | −5.11 | Urban | −9.67 | ||
| Barren land | 0.95 | Barren land | −1.05 | ||
| Grassland | Forest | −6.82 | Urban | Forest | −5.94 |
| Grassland | −1.04 | Grassland | −9.67 | ||
| Wetland and Water | −7.79 | Wetland and Water | −14.23 | ||
| Cropland | −1.12 | Cropland | −3.49 | ||
| Urban | −11.48 | Urban | −5.76 | ||
| Barren land | −0.42 | Barren land | −8.09 | ||
| Wetland and Water | Forest | −5.86 | Barren land | Forest | −17.34 |
| Grassland | −9.22 | Grassland | 1.12 | ||
| Wetland and Water | −8.04 | Wetland and Water | −5.11 | ||
| Cropland | −2.85 | Cropland | −2.34 | ||
| Urban | −9.82 | Urban | −6.72 | ||
| Barren land | 0.79 | Barren land | 3.39 |
| 2015 | edf | Ref.df | F | p-Value | |
| Forest | 5.551 | 6.41 | 57.11 | <2 × 10⁻¹⁶ ** | |
| Grassland | 7.915 | 8.257 | 3.7 | 0.000486 ** | |
| Wetland and Water | 3.969 | 4.451 | 1.53 | 0.172 | |
| Cropland | 2.263 | 3.493 | 31.08 | <2 × 10⁻¹⁶ ** | |
| Urban | 5.244 | 7.088 | 13.73 | <2 × 10⁻¹⁶ ** | |
| Barren land | 1.518 | 1.752 | 41.72 | <2 × 10⁻¹⁶ ** | |
| 2020 | edf | Ref.df | F | p-value | |
| Forest | 5.797 | 7.114 | 55.13 | <2 × 10⁻¹⁶ ** | |
| Grassland | 6.222 | 7.003 | 3.899 | 0.000408 ** | |
| Wetland and Water | 3.804 | 4.746 | 2.057 | 0.0641 | |
| Cropland | 3.424 | 4.692 | 22.22 | <2 × 10⁻¹⁶ ** | |
| Urban | 4.574 | 6.568 | 7.844 | <2 × 10⁻¹⁶ ** | |
| Barren land | 1.546 | 1.842 | 115.6 | <2 × 10⁻¹⁶ ** |
Disclaimer/Publisher’s Note: The statements, opinions and data contained in all publications are solely those of the individual author(s) and contributor(s) and not of MDPI and/or the editor(s). MDPI and/or the editor(s) disclaim responsibility for any injury to people or property resulting from any ideas, methods, instructions or products referred to in the content. |
© 2024 by the authors. Licensee MDPI, Basel, Switzerland. This article is an open access article distributed under the terms and conditions of the Creative Commons Attribution (CC BY) license (https://creativecommons.org/licenses/by/4.0/).
Share and Cite
Xu, X.; Hao, J.; Liang, Y.; Shen, J. Assessing the Nonlinear Relationship between Land Cover Change and PM10 Concentration Change in China. Land 2024, 13, 766. https://doi.org/10.3390/land13060766
Xu X, Hao J, Liang Y, Shen J. Assessing the Nonlinear Relationship between Land Cover Change and PM10 Concentration Change in China. Land. 2024; 13(6):766. https://doi.org/10.3390/land13060766
Chicago/Turabian StyleXu, Xiankang, Jian Hao, Yuxin Liang, and Jingwei Shen. 2024. "Assessing the Nonlinear Relationship between Land Cover Change and PM10 Concentration Change in China" Land 13, no. 6: 766. https://doi.org/10.3390/land13060766
APA StyleXu, X., Hao, J., Liang, Y., & Shen, J. (2024). Assessing the Nonlinear Relationship between Land Cover Change and PM10 Concentration Change in China. Land, 13(6), 766. https://doi.org/10.3390/land13060766


