Abstract
Inhalable particulate matter (PM10) is a major air pollutant that has significant impacts on environmental climate and human health. Land-cover change is also a key factor influencing changes in atmospheric pollution. Changes in land-cover types can lead to changes in the sources and sinks of air pollutants, thus affecting the spatial distribution of PM10, which poses a threat to human health. Therefore, exploring the relationship between PM10 concentration change and land-cover change is of great significance. In this study, we constructed an extreme randomized trees model (ET) based on ground PM10 monitoring data, satellite-based aerosol optical depth (AOD) data, and auxiliary data including meteorological, vegetation, and population data to retrieve ground-level PM10 concentrations across China. The coefficient of determination (R2), the mean absolute error (MAE), and the root mean square error (RMSE) of the model were 0.878, 5.742 μg/m3, and 8.826 μg/m3, respectively. Based on this, we analyzed the spatio-temporal distribution of PM10 concentrations in China from 2015 to 2021. High PM10 values were mainly observed in the desert areas of northwestern China and the Beijing–Tianjin–Hebei urban agglomeration. The majority of China showed a significant decrease in PM10 concentrations. Additionally, we also analyzed the nonlinear response mechanism of the PM10 concentration change to land-cover change. The PM10 concentration is sensitive to forest and barren land change. Therefore, strengthening the protection of forests and desertification control can significantly reduce air pollution. Attention should also be paid to emission management in agricultural activities and urbanization processes.
1. Introduction
In recent years, with the rapid economic growth in China, urbanization and industrialization have been continuously advancing, leading to increasingly severe regional extreme weather [1] and atmospheric environmental pollution issues [2]. The problem of atmospheric pollution is particularly prominent and has received attention from numerous researchers. According to the 2021 China Ecological Environment Report, out of 339 cities nationwide, 121 cities still exceeded the environmental air quality standards, accounting for 35.7% of all cities. The proportion of polluted days in terms of environmental air quality was 12.6%, with inhalable particulate matter (PM10) as the primary pollutant, accounting for 25.2% of the total number of exceeded days. This indicates that PM10 remains a significant contributor to air pollution [3,4]. Meanwhile, the formation of land-cover types, including grassland, forest land, arable land, construction land, wetland and water bodies, wasteland, etc., can reflect the influence of natural and anthropogenic factors on surface cover conditions, directly or indirectly representing the biological and non-biological characteristics of the land [5]. The atmosphere can affect climate and ecological environment by altering the radiation balance of the land–atmosphere system. The transition of land-cover types also impacts the atmospheric environment [6]. This transformation alters the spatial and temporal distribution of near-surface air pollutants by affecting the emission, absorption, and purification processes of pollutants [7], posing a threat to human health and well-being [8]. Therefore, quantitatively exploring the relationship between PM10 concentration changes and land-cover changes is crucial.
Acquiring atmospheric particulate matter concentration data is a fundamental prerequisite for studying air pollution. Currently, atmospheric particulate matter monitoring is mainly conducted through ground-based monitoring in China. After decades of development, China has established a nationwide atmospheric monitoring network consisting of both national and local monitoring stations. However, due to China’s vast territory, monitoring stations are relatively dispersed, with the majority concentrated in major and medium-sized cities. Relying on the existing station distribution and monitoring technology, it is challenging to achieve large-scale and continuous monitoring of China’s atmospheric environmental quality, requiring significant manpower and resources [9,10]. The rapid development of satellite remote-sensing technology has made it possible to conduct rapid, large-scale, and periodic dynamic monitoring of the atmosphere using satellite sensors. This not only facilitates the acquisition of real-time information but also reduces monitoring costs. Currently, a large number of domestic and foreign researchers are conducting extensive study on the retrieval of PM10 concentrations using multisource remote-sensing data. They attempt to establish models between aerosol optical depth (AOD) and ground-level PM10 concentrations. Initially, PM10 concentrations were estimated through linear models such as the multiple linear regression model and geographic weighted regression model [11,12]. However, linear models exhibit significant uncertainty when faced with big data and complex nonlinear problems. In contrast, machine-learning models often perform with a higher computational efficiency and can express more complex relationships when solving pollution concentration estimation [13,14,15]. To further improve the accuracy of the model, meteorological auxiliary data such as the height of the boundary layer, humidity, temperature, and so on, which are related to the particulate matter, are added in the retrieval process, which can effectively improve the accuracy of the estimation results [16]. These studies provide an important foundation for simulating large-area, long-time series of ground-level PM10 concentration data. However, the existence of issues such as the characteristics of the models, the selection of auxiliary parameters, and the number of monitoring stations has introduced a lot of uncertainty into the retrieval process, leading to discrepancies in different research results. Therefore, there is still a need for further exploration in PM10 concentration inversion work to select more appropriate models and auxiliary parameters to achieve high-quality prediction.
Research on land-cover change has achieved considerable progress, including studies on the spatial distribution of land cover and its impacts on global climate change and atmospheric pollution [17,18,19]. There is a close relationship between land cover and air pollutants. Changes in land-cover types can alter the emission or absorption of various gases in the atmosphere [20] and modify the hydrological and thermal conditions [21], thereby affecting the atmospheric environment and leading to air pollution issues. This has significant implications for ecosystems and human health. In studies examining the response of land-cover change to atmospheric pollution, the focus has primarily been on the relationship between land-cover change and pollutants such as ozone, nitrogen dioxide, and fine particulate matter (PM2.5) [22,23,24]. However, there has been relatively less research on the relationship between PM10 and land cover. Furthermore, when investigating the relationship between atmospheric pollutants and different land-cover types, the emphasis has been on the impact of individual land-cover types on air pollutants [25,26]. In areas with complex spatial distributions, changes in air pollutants are influenced not only by a single land-cover type but also by the combined effects of multiple land-cover types. Research studies commonly employ linear regression methods, including panel regression, multiple linear regression, and geographic weighted regression, to explore the relationship between land-cover change and variations in air pollutant concentrations. These methods are utilized to calculate the correlation between different land-cover types, landscape indices, and air pollutants, facilitating the assessment of their mutual influences [27,28,29]. However, the impact of land cover on air pollutant concentrations is not linear but a complex nonlinear relationship. Thus, solely relying on linear regression methods for quantitative analysis may result in biased calculation results. Thus, when discussing the nonlinear response mechanisms of air pollutants to different land-cover types, nonlinear models can be employed to more accurately capture the correlation between them [30,31]. Although studies of PM10 concentrations and land-cover change are well established in their respective fields, few in-depth studies have been conducted on the relationship between the two. Currently, there is still a lack of quantitative research on the nonlinear relationship between land-cover type changes and PM10 concentration variations at large spatial scales. This could lead to government and other relevant departments being unable to promptly capture the changes in PM10 concentrations caused by land-cover type changes, thus hindering the implementation of macroscopic policy adjustments and environmental governance measures.
This study proposes to construct a machine learning-based model for estimating ground-level PM10 concentrations in China using multisource remote-sensing data, with methods such as machine learning and spatial analysis as theoretical foundations. It aims to estimate long-term time series of ground-level PM10 concentrations and analyze the spatiotemporal variations in PM10 across China from 2015 to 2021. Additionally, we explored land-cover change over a seven-year period and quantitatively explored the nonlinear response of PM10 concentrations to land-cover changes in China using a generalized additive model (GAM). This research is expected to provide scientific basis and guidance for the formulation of sustainable land-use policies and management measures to mitigate environmental pollution problems caused by changes in land-cover types.
2. Materials and Methods
2.1. Study Area
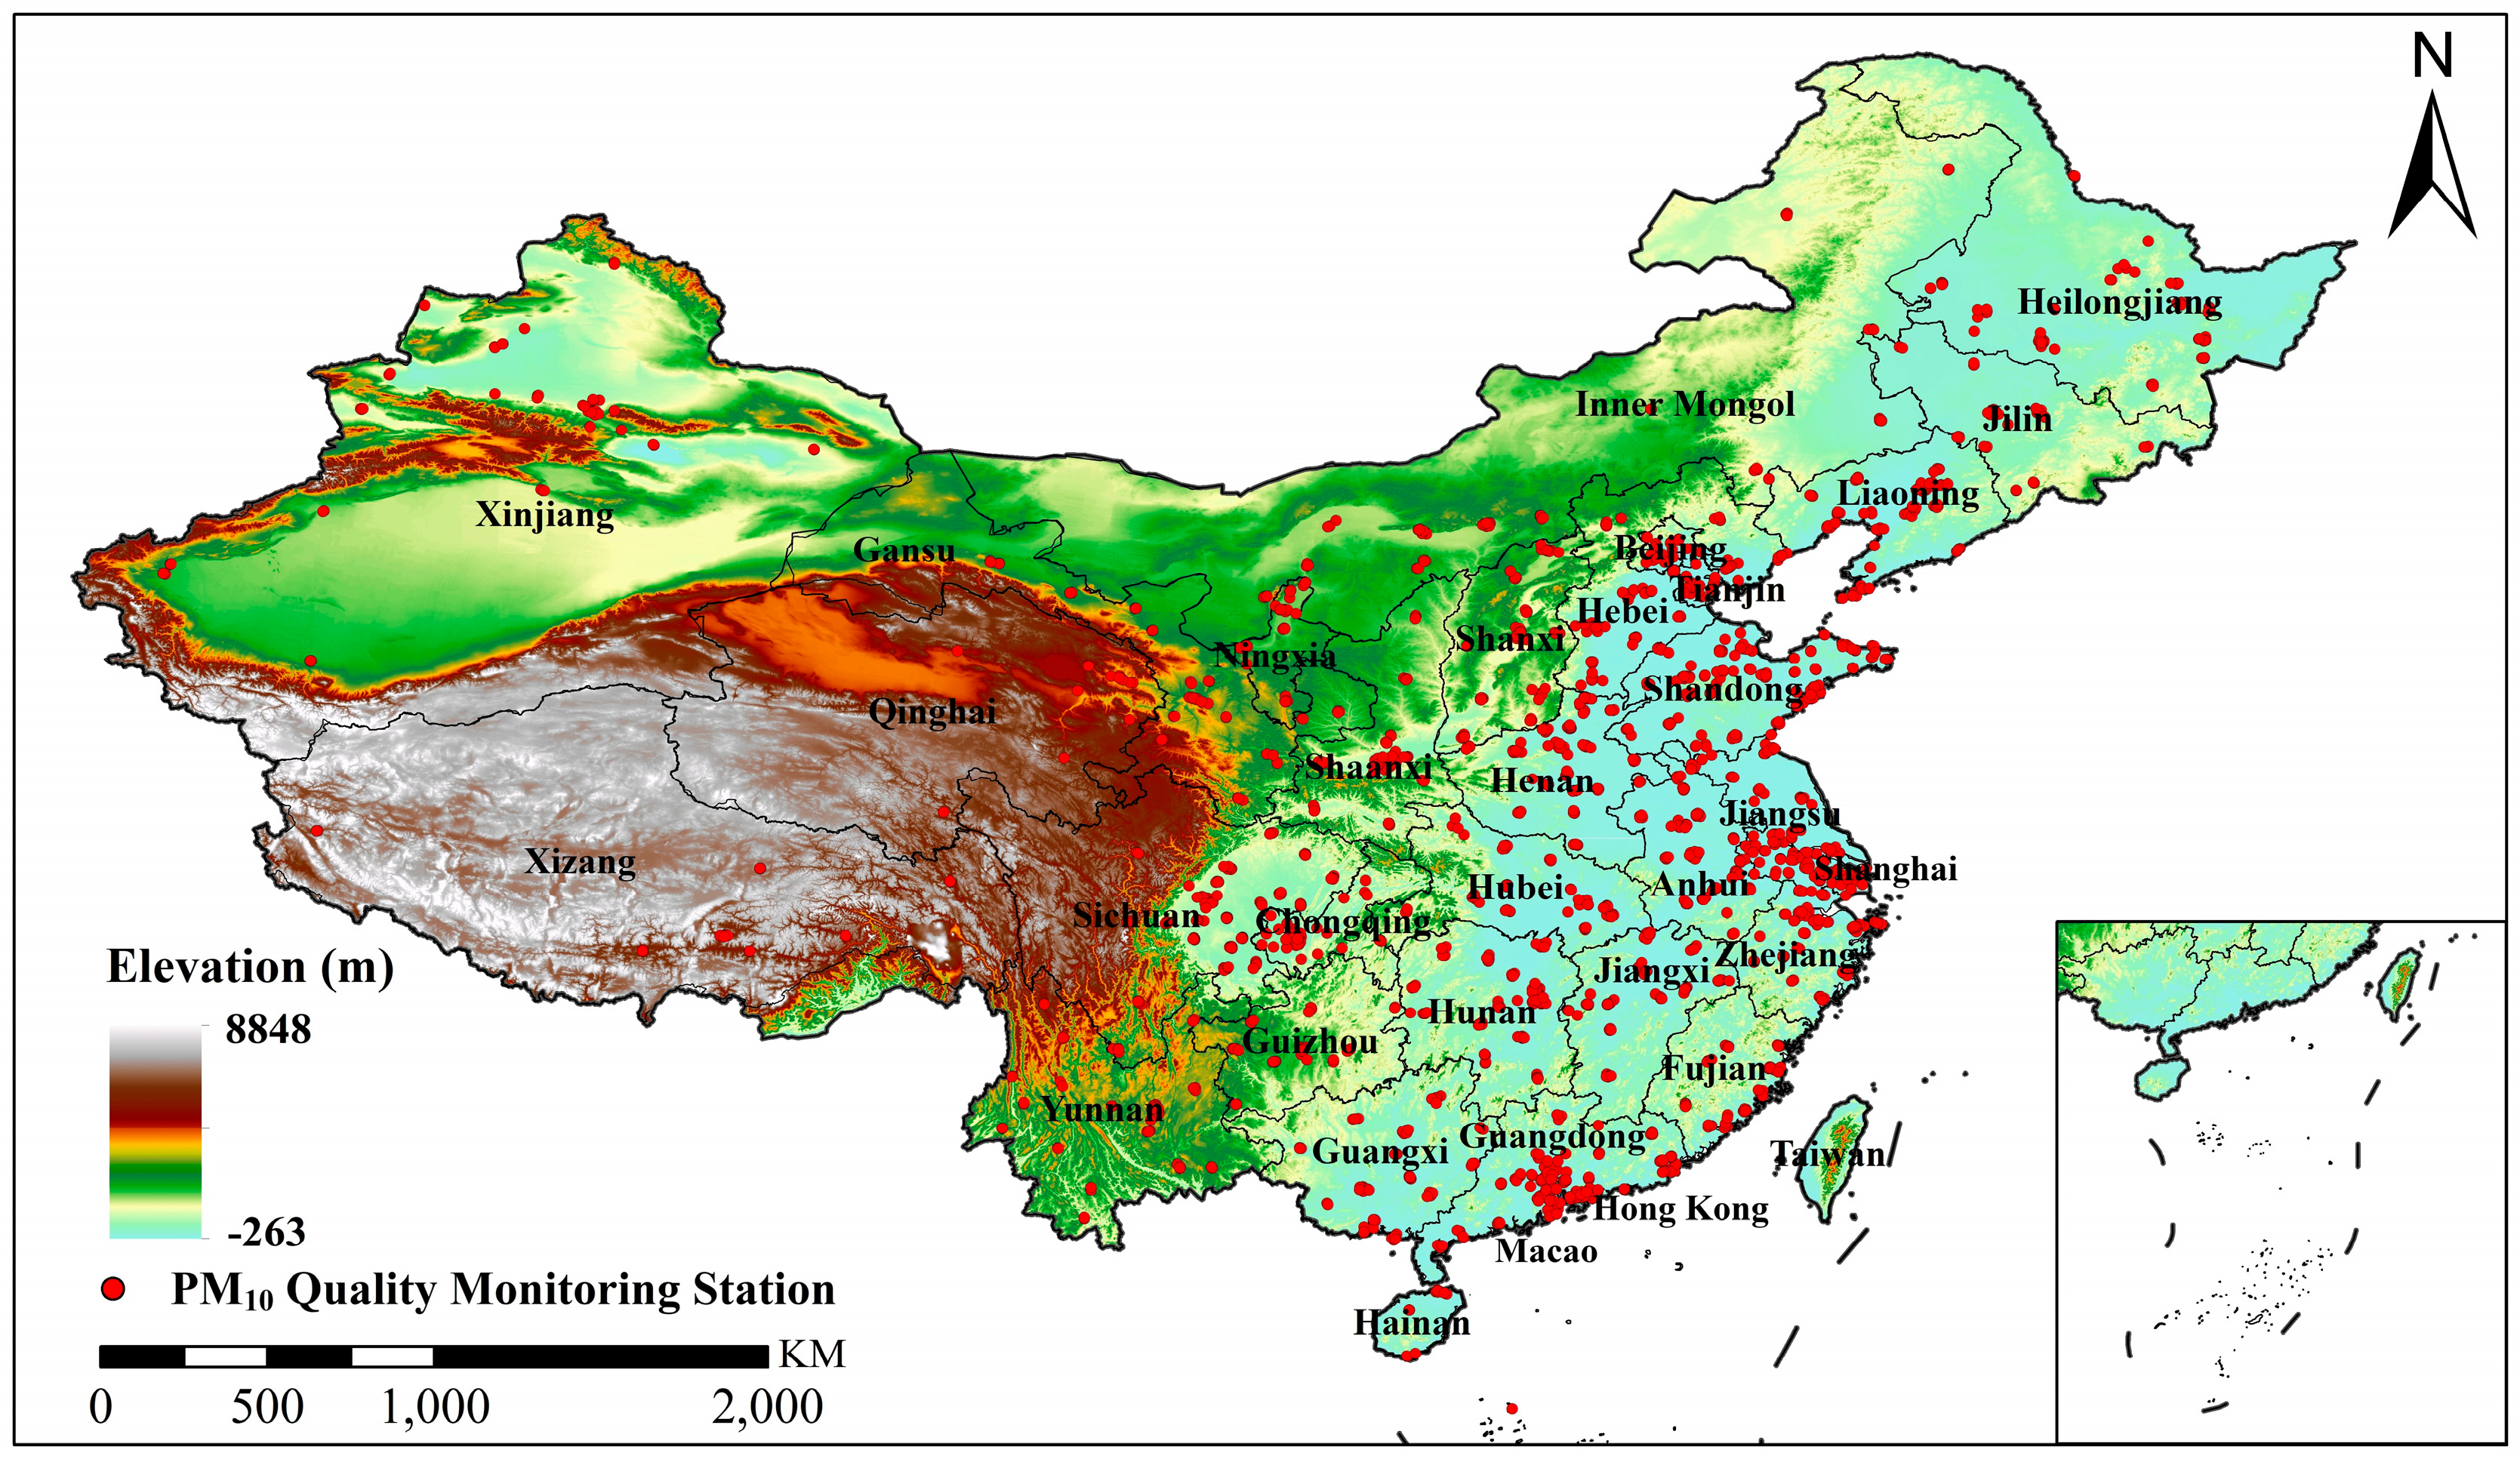
This study focuses on the land region of China, covering a latitude range from 7° N to 53° N and a longitude range from 72° E to 136° E. Figure 1 illustrates the overall spatial distribution of elevation in China. The spatial distribution of elevation in China exhibits diversity and complexity. The western region is dominated by the Qinghai-Tibet Plateau, characterized by significant altitude variations including high mountains, plateaus, and basins. In contrast, the eastern region is mainly composed of plains and hills, such as the North China Plain, the Yangtze River Basin, and the Pearl River Delta. The southwestern region comprises the Yunnan-Guizhou Plateau and mountainous terrain, characterized by complex topography and serving as important forest and water sources. The northeastern region includes the Northeast Plain, as well as mountain ranges like Changbai Mountain, boasting vast plains and abundant forest resources. These diverse terrain features have significant impacts on climate, water resources, and the ecological environment [32].

Figure 1.
Overview of the study area.
2.2. Data Source
2.2.1. PM10 Monitoring Stations
To better monitor changes in air quality, China has established national automatic air quality monitoring sites. The ground-level PM10 concentrations monitoring data used in this study are sourced from the China National Environmental Monitoring Center (https://www.cnemc.cn/, accessed on 28 March 2024). As of 2021, there are over 2000 monitoring stations nationwide in operation. Figure 1 illustrates the distribution of ground-based air quality monitoring stations. These stations can record the concentration values of pollutants measured at the monitoring site within 1 h, 8 h, and 24 h. The concentration values for 1 h are directly measured, while those for 8 h and 24 h are the sliding averages calculated for the preceding 8 h or 24 h up to the current time (Table 1). Currently, air quality data for China since 13 May 2014, are available, including PM2.5, PM10, SO2, O3, CO, and AQI.

Table 1.
Air quality monitoring data.
2.2.2. Satellite Remote-Sensing AOD Dataset
AOD reflects the extent to which suspended fine particles in the atmosphere absorb and scatter light, typically used to describe atmospheric transparency. In this study, the AOD data we obtained are sourced from the high spatial resolution MCD19A2 product provided by the MODIS sensor (https://lpdaac.usgs.gov/products/mcd19a2v061/, accessed on 28 March 2024). This product is derived using the multi-angle implementation of atmospheric correction (MAIAC) algorithm, which considers various influencing factors such as aerosol characteristics, surface reflectance, and observation geometry. It provides an important foundation for the study of air pollution and atmospheric aerosols [33]. Given the large volume of data, we utilized the Google Earth Engine (GEE) platform to mosaic and clip the 1 km resolution AOD data at a wavelength of 550 nanometers within the geographical extent of China from 2015 to 2021. Subsequently, we computed the annual average for each pixel to ensure the spatial integrity of the AOD data.
2.2.3. ERA5 Reanalysis of Meteorological Datasets
Changes in atmospheric conditions directly impact the generation, distribution, and concentration levels of particles in the atmosphere [34]. The meteorological data utilized in this study are sourced from the fifth generation European Centre for Medium-Range Weather Forecasts (ECMWF) reanalysis for global climate and weather (ERA5) [35]. The ERA5 provides reanalyzed meteorological data for over 260 variables from 1979 to present. The temporal resolution of this dataset can reach hourly levels. The atmospheric data have a spatial resolution of 0.25° × 0.25°, while ocean waves data have a spatial resolution of 0.5° × 0.5°. In establishing the PM10–AOD relationship model, we consider the influence of boundary layer height, wind speed, wind direction, humidity, pressure, temperature, and precipitation on PM10 diffusion, transport, and deposition. Ultimately, we selected seven meteorological parameters provided by the ERA5 monthly averaged data on single levels from 2015 to 2021, including the 10 m u-component of wind (WU), 10 m v-component of wind (WV), 2 m temperature (T2M), surface pressure (SP), total precipitation (TP), boundary layer height (BLH), and relative humidity (RH).
2.2.4. Dust Emission Dataset
The dust emission (DE) data used in this study are sourced from the Modern-Era Retrospective Analysis for Research and Applications, version 2 (MERRA-2), produced by NASA’s Global Modeling and Assimilation Office (GMAO). MERRA-2 generates global atmospheric reanalysis data using the GEOS-5 climate model and the Goddard Earth Observing System Data Assimilation System (GEOS-DAS), employing a global grid point statistical interpolation (GSI) analysis method [36]. It provides atmospheric analysis data with a spatial resolution of 0.5° × 0.625° for the years 1980–2021. The dust particle emission data include five categories with different aerodynamic diameters: 0.1–1, 1–1.8, 1.8–3, 3–6, and 6–10 μm. According to the definition of PM10, these dust particles are important components of PM10. Therefore, we obtained monthly dust emission data from 2015 to 2021 for five different diameters from the Aerosol Diagnostics dataset and superimposed them to obtain the total dust emission.
2.2.5. Population Dataset
In addition to natural sources, human activities also contribute significantly to PM10 emissions. Thus, the spatial distribution of population is crucial for PM10 research [37]. In this study, we utilized population distribution (POP) data at a 1 km spatial resolution on a yearly scale produced by WorldPop from 2015 to 2021. These data show the number of people within each grid at the pixel scale. WorldPop has received contributions from numerous collaborators, organizations, and governments worldwide. By integrating and leveraging a wealth of data products, WorldPop produces a variety of satellite-based thematic population-related products. WorldPop has developed peer-reviewed spatial statistical methods, harnessing the capabilities of machine learning, to transform and disaggregate population counts from the administrative unit levels to the pixel level, utilizing relationships with spatial covariate layers from satellites and other sources [38].
2.2.6. Vegetation Index Dataset
The growth status of vegetation has complex effects on air pollutant concentrations. MOD13A2 is one of the remote-sensing data products provided by the MODIS satellite sensor (https://lpdaac.usgs.gov/products/mod13a2v061/, accessed on 28 March 2024), primarily comprising parameters related to vegetation, such as the normalized difference vegetation index (NDVI). This product is highly available and widely applicable. With a spatial resolution of 1 km and a temporal resolution of 16 days, it provides detailed vegetation information for monitoring seasonal changes and long-term trends in vegetation worldwide. The NDVI data from MOD13A2 have extensive applications in various fields, providing important data support for understanding global vegetation status and ecological environmental changes. The NDVI obtained in this study is a core indicator from the MOD13A2 product, which measures the greenness and growth status of surface vegetation by calculating the difference in reflectance values between the near-infrared and red spectral bands. MOD13A2 has the same resolution as the AOD data, so we realized the mosaicking and annual synthesis calculation of the NDVI data on the GEE platform, and finally clipped them according to the administrative divisions of China.
2.2.7. Land-Cover Dataset
This study utilizes the global land-cover data product (LC) from MCD12Q1, developed through collaboration between the National Aeronautics and Space Administration (NASA) and the United States Geological Survey (USGS). This dataset provides global land-cover maps at a spatial resolution of 500 m annually from 2001 to 2021 [39]. Since the MCD12Q1 dataset is stored in multiple tiles based on row and column numbers, we conducted image mosaicking and extraction of images within the Chinese territory using the GEE platform. Then, we resampled them to a 1 km spatial resolution on GEE in order to maintain the spatio-temporal consistency of all data. The dataset offers five different land-cover classification schemes, and for this study, the International Geosphere–Biosphere Program (IGBP) classification was chosen. The IGBP classification system demonstrates relative consistency in its application across different regions and countries, enabling researchers from diverse backgrounds to utilize the same standards for land-cover classification and comparison. Moreover, the IGBP classification system is characterized by clear, simple categories, facilitating the ease of operation. These features make the classification of large-scale remote-sensing data relatively straightforward and practical for global-scale land-cover monitoring. It describes land surface conditions in 17 categories, including 11 natural vegetation types, 3 land development and mosaic categories, and 3 non-vegetation land type-defined categories. Detailed information on the data used in this study is summarized in Table 2.
Table 2.
Summary of data obtained for this study.
2.3. Methods
2.3.1. Extreme Randomized Trees
The extreme randomized trees model (ET) is a tree-based ensemble built according to a top-down procedure that can be well used in classification and regression problems. Its distinction from other tree ensemble models primarily lies in the randomized approach to selecting attributes and cut points during node partitioning. Additionally, it adjusts the degree of randomization to suit the particular problem at hand, thus offering adaptability tailored to specific contexts [40]. Furthermore, the tree ensemble model does not need to consider the covariance between multiple characteristic variables when performing regression [41], the information in multiple feature variables can be better mined to participate in the training of the model. In this study, we constructed an ET model using Python 3.9. To maintain consistency in the spatio-temporal resolution of the input data, we performed annual synthesis on the raw data and resampled them to 1 km using bilinear interpolation. We trained the retrieval model using a fused dataset comprising satellite remote-sensing data on AOD, meteorological parameters, NDVI, and population information. Ultimately, we established the relationship between the ground-level PM10 stations and the AOD data.
2.3.2. Generalized Additive Model
GAM is a flexible statistical model used to explain complex nonlinear relationships between response variables and multiple predictor variables [42]. Unlike linear models, GAM allows for the modeling of each predictor variable’s relationship in a nonlinear manner while maintaining the overall interpretability of the model. In this study, to explore the impact of the land-use type area on PM10 concentration, GAM is introduced to reveal the nonlinear response mechanism of PM10 to land-cover type area. The general form of GAM can be expressed as
where the is the response variable for the probe, is the expected value of , and is a link function that can be used to relate to the linear combination through functions such as the identity function, logarithm; represents the intercept term, and are smooth functions that respectively represent the nonlinear relationships associated with the predictor variable . The core idea of GAM is to use smooth functions to flexibly fit the relationship between each predictor variable and the response variable. Smooth functions can be kernel functions, cubic natural splines, and cubic spline smoothing functions to adapt to different types of data structures. In this study, we implement GAM using the mgcv package in R 3.6.2.
2.3.3. Evaluation Indicators
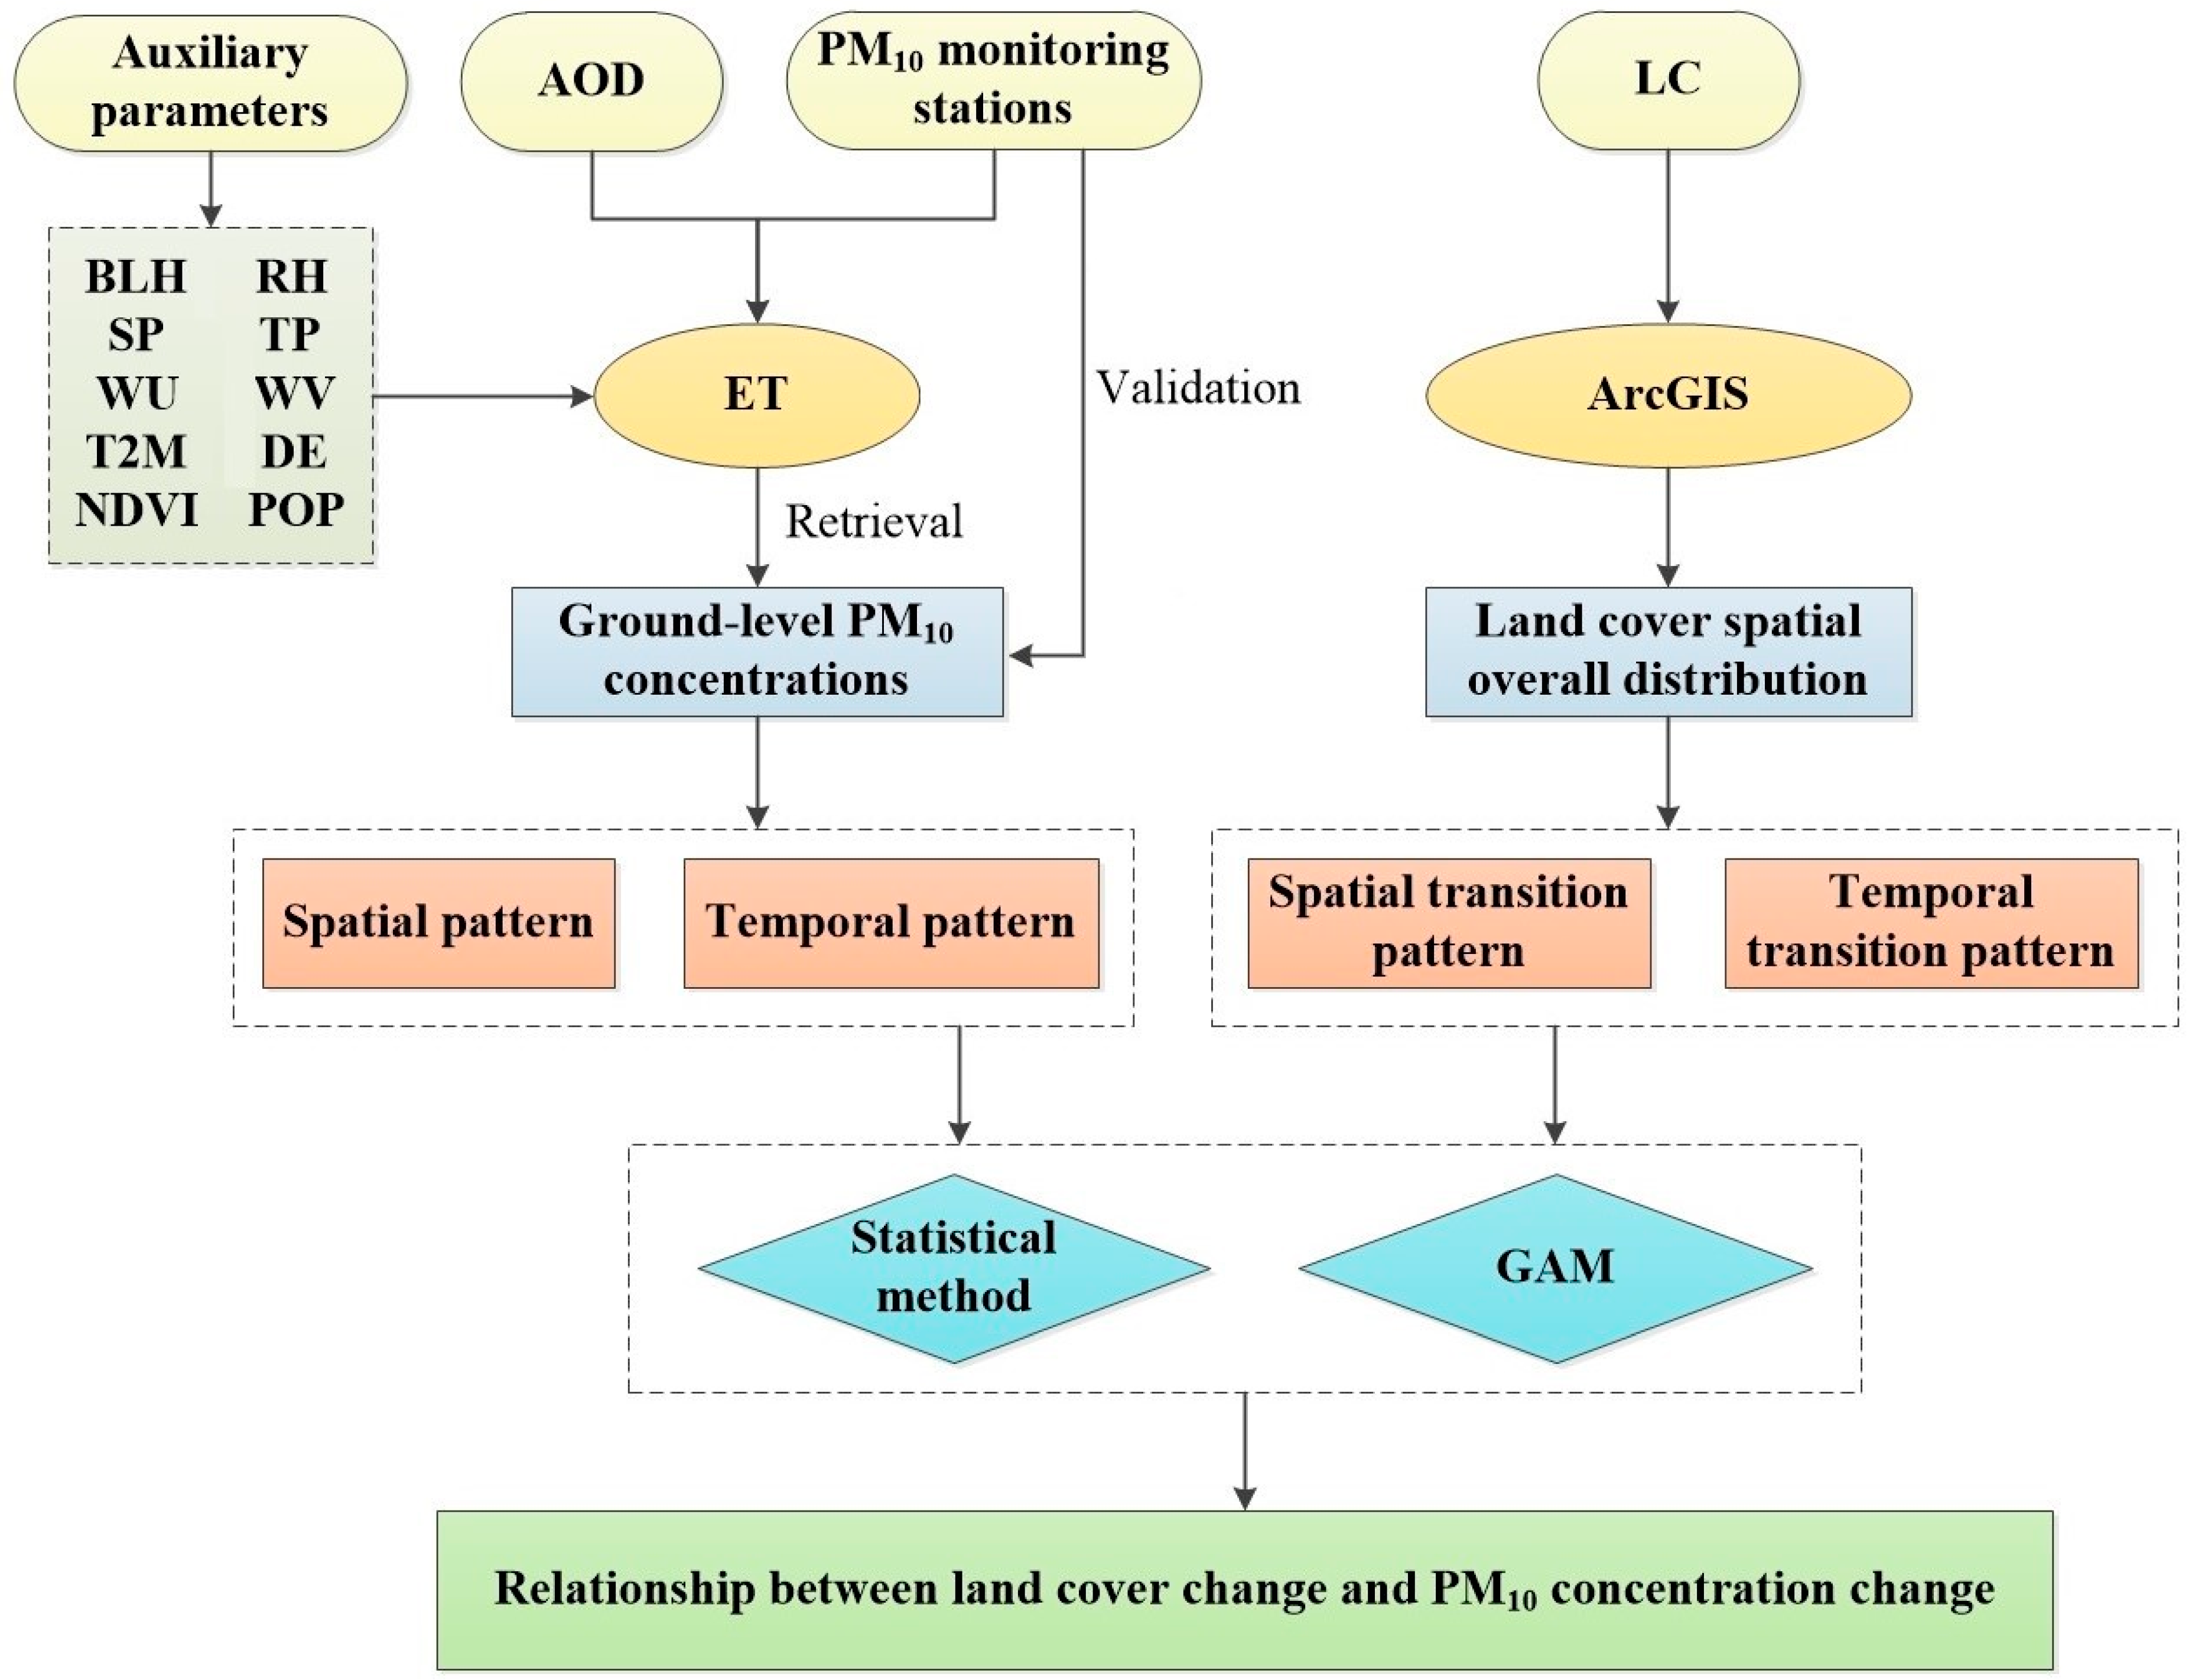
To evaluate the prediction accuracy of the retrieval model, this study uses the 10-fold cross-validation method. The dataset was first randomly divided into 10 equal datasets, 9 of which were used as training datasets to parameterize the model, and the rest were used as test datasets to evaluate the model. This validation process was repeated 10 times, and the results of the 10 validations were averaged to represent the overall model performance [43]. Meanwhile, the PM10 concentrations predicted by the model were validated using the PM10 concentrations observed at the actual ground stations. In this study, we the choose the coefficient of determination (R2), the mean absolute error (MAE), and the root mean square error (RMSE) to evaluate the model. The detailed logical structure of this study is illustrated in the flowchart (Figure 2).

Figure 2.
The framework of the study.
3. Results
3.1. Spatial and Temporal Variations in Ground-Level PM10 Concentrations
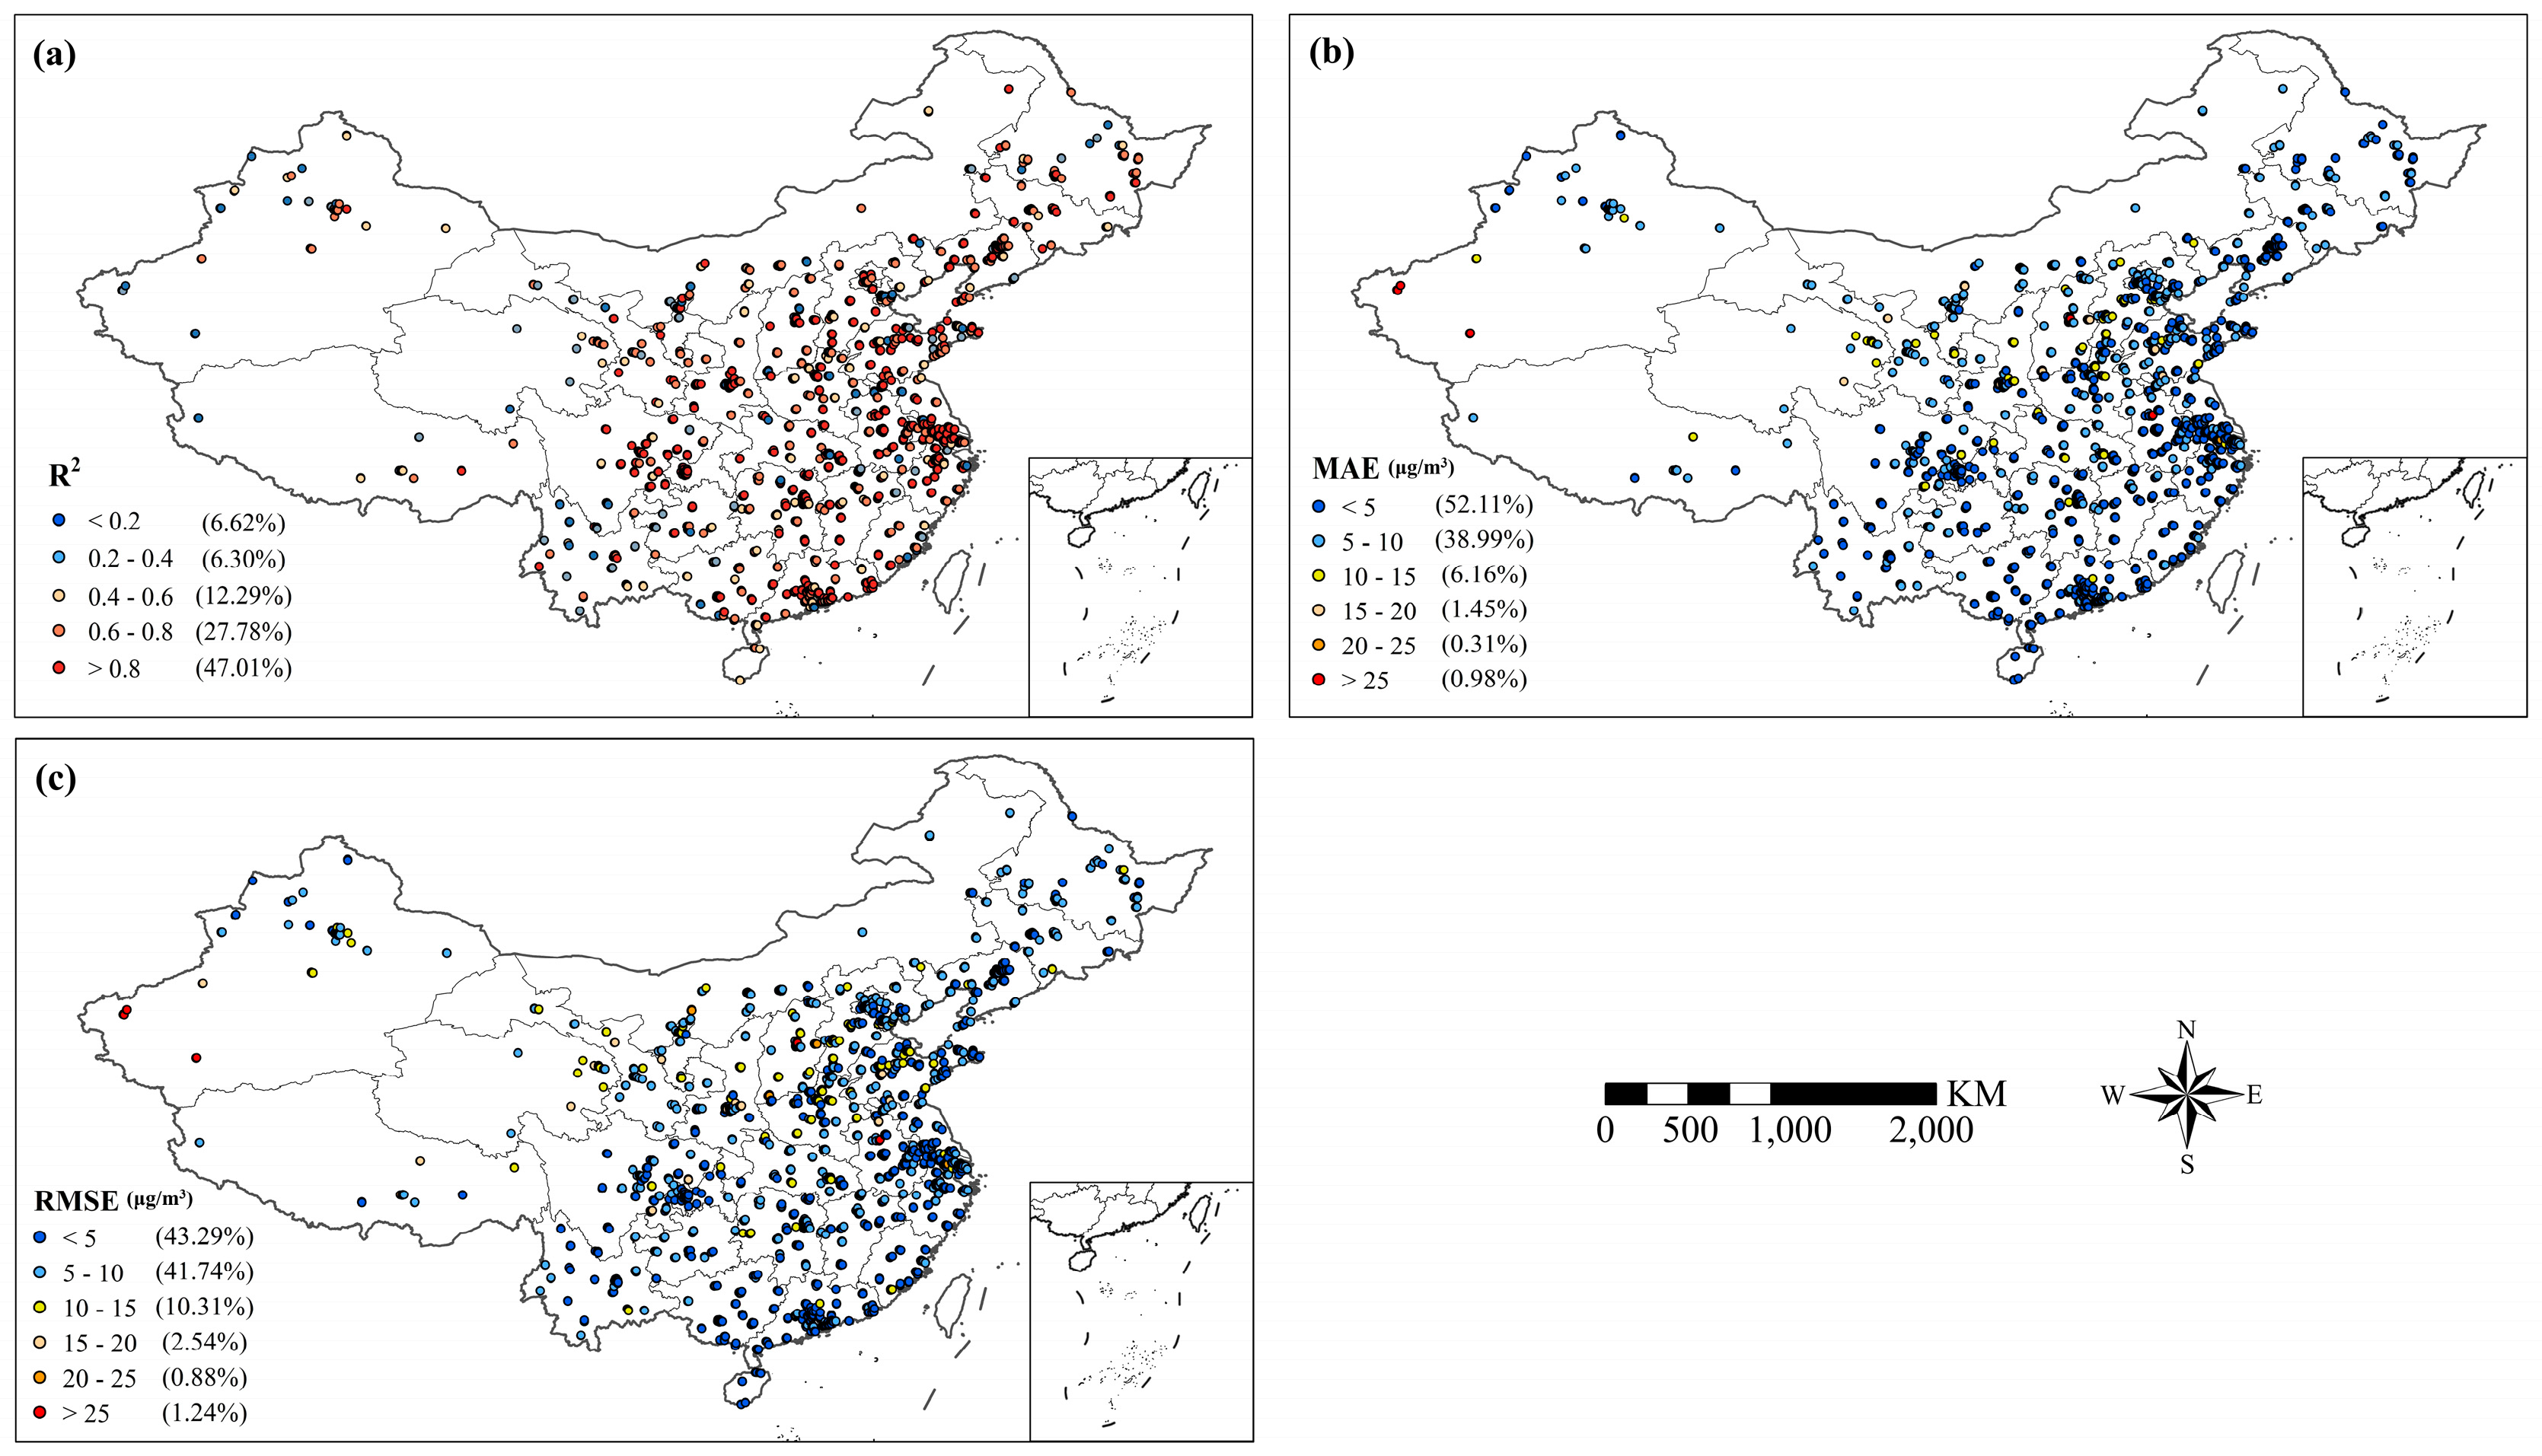
We constructed an ET model for the retrieval of annual ground-level PM10 concentrations in China from 2015 to 2021. Ultimately, the 10-fold cross-validation results showed that R2, MAE, and RMSE were 0.878, 5.742 μg/m3, and 8.826 μg/m3, respectively, indicating that the model has a good fitting accuracy. Additionally, the small difference between R2 values of the training set and the testing set suggests that the model did not experience overfitting during the training process. Figure 3 displays the estimation accuracy at each ground monitoring station from 2015 to 2021. It can be observed that 47.01% of the stations have an R2 exceeding 0.8, with the majority of these stations concentrated in the eastern region where there are more monitoring stations. The proportion of stations with an R2 exceeding 0.6 reaches 74.79%. In regions with a dense station distribution, the model is able to capture features more comprehensively, resulting in a higher prediction accuracy. Conversely, in western regions where stations are sparse, the limited features available in the dataset during model training may lead to relatively larger errors. The proportion of stations with an MAE and RMSE within 5 μg/m3 is 52.11% and 43.29%, respectively, and over 90% of the stations have an MAE within 10 μg/m3. The proportion of stations with an MAE and RMSE exceeding 25 μg/m3 is only 0.98% and 1.24%, respectively. Overall, the spatial distribution of stations accuracy is similar to that of R2, with very few stations exhibiting large errors in regions such as Xinjiang, Tibet, and Qinghai. In previous studies, random forest (RF), geographically weighted regression (GWR), land-use regression (LUR), and space-time extremely randomized trees (STET) models have been applied to retrieve ground-level PM10 concentrations, with R2 values of 0.74, 0.81, 0.64, and 0.86, respectively [44,45,46,47]. The ET model demonstrates a better accuracy compared to previous research. This indicates that the constructed inversion model can effectively perform the retrieval of ground-level PM10 concentrations in China.
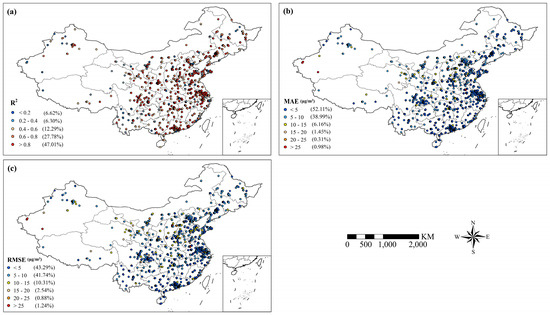
Figure 3.
Model accuracy at each monitoring station from 2015 to 2021: (a) R2, (b) MAE, (c) RMSE.
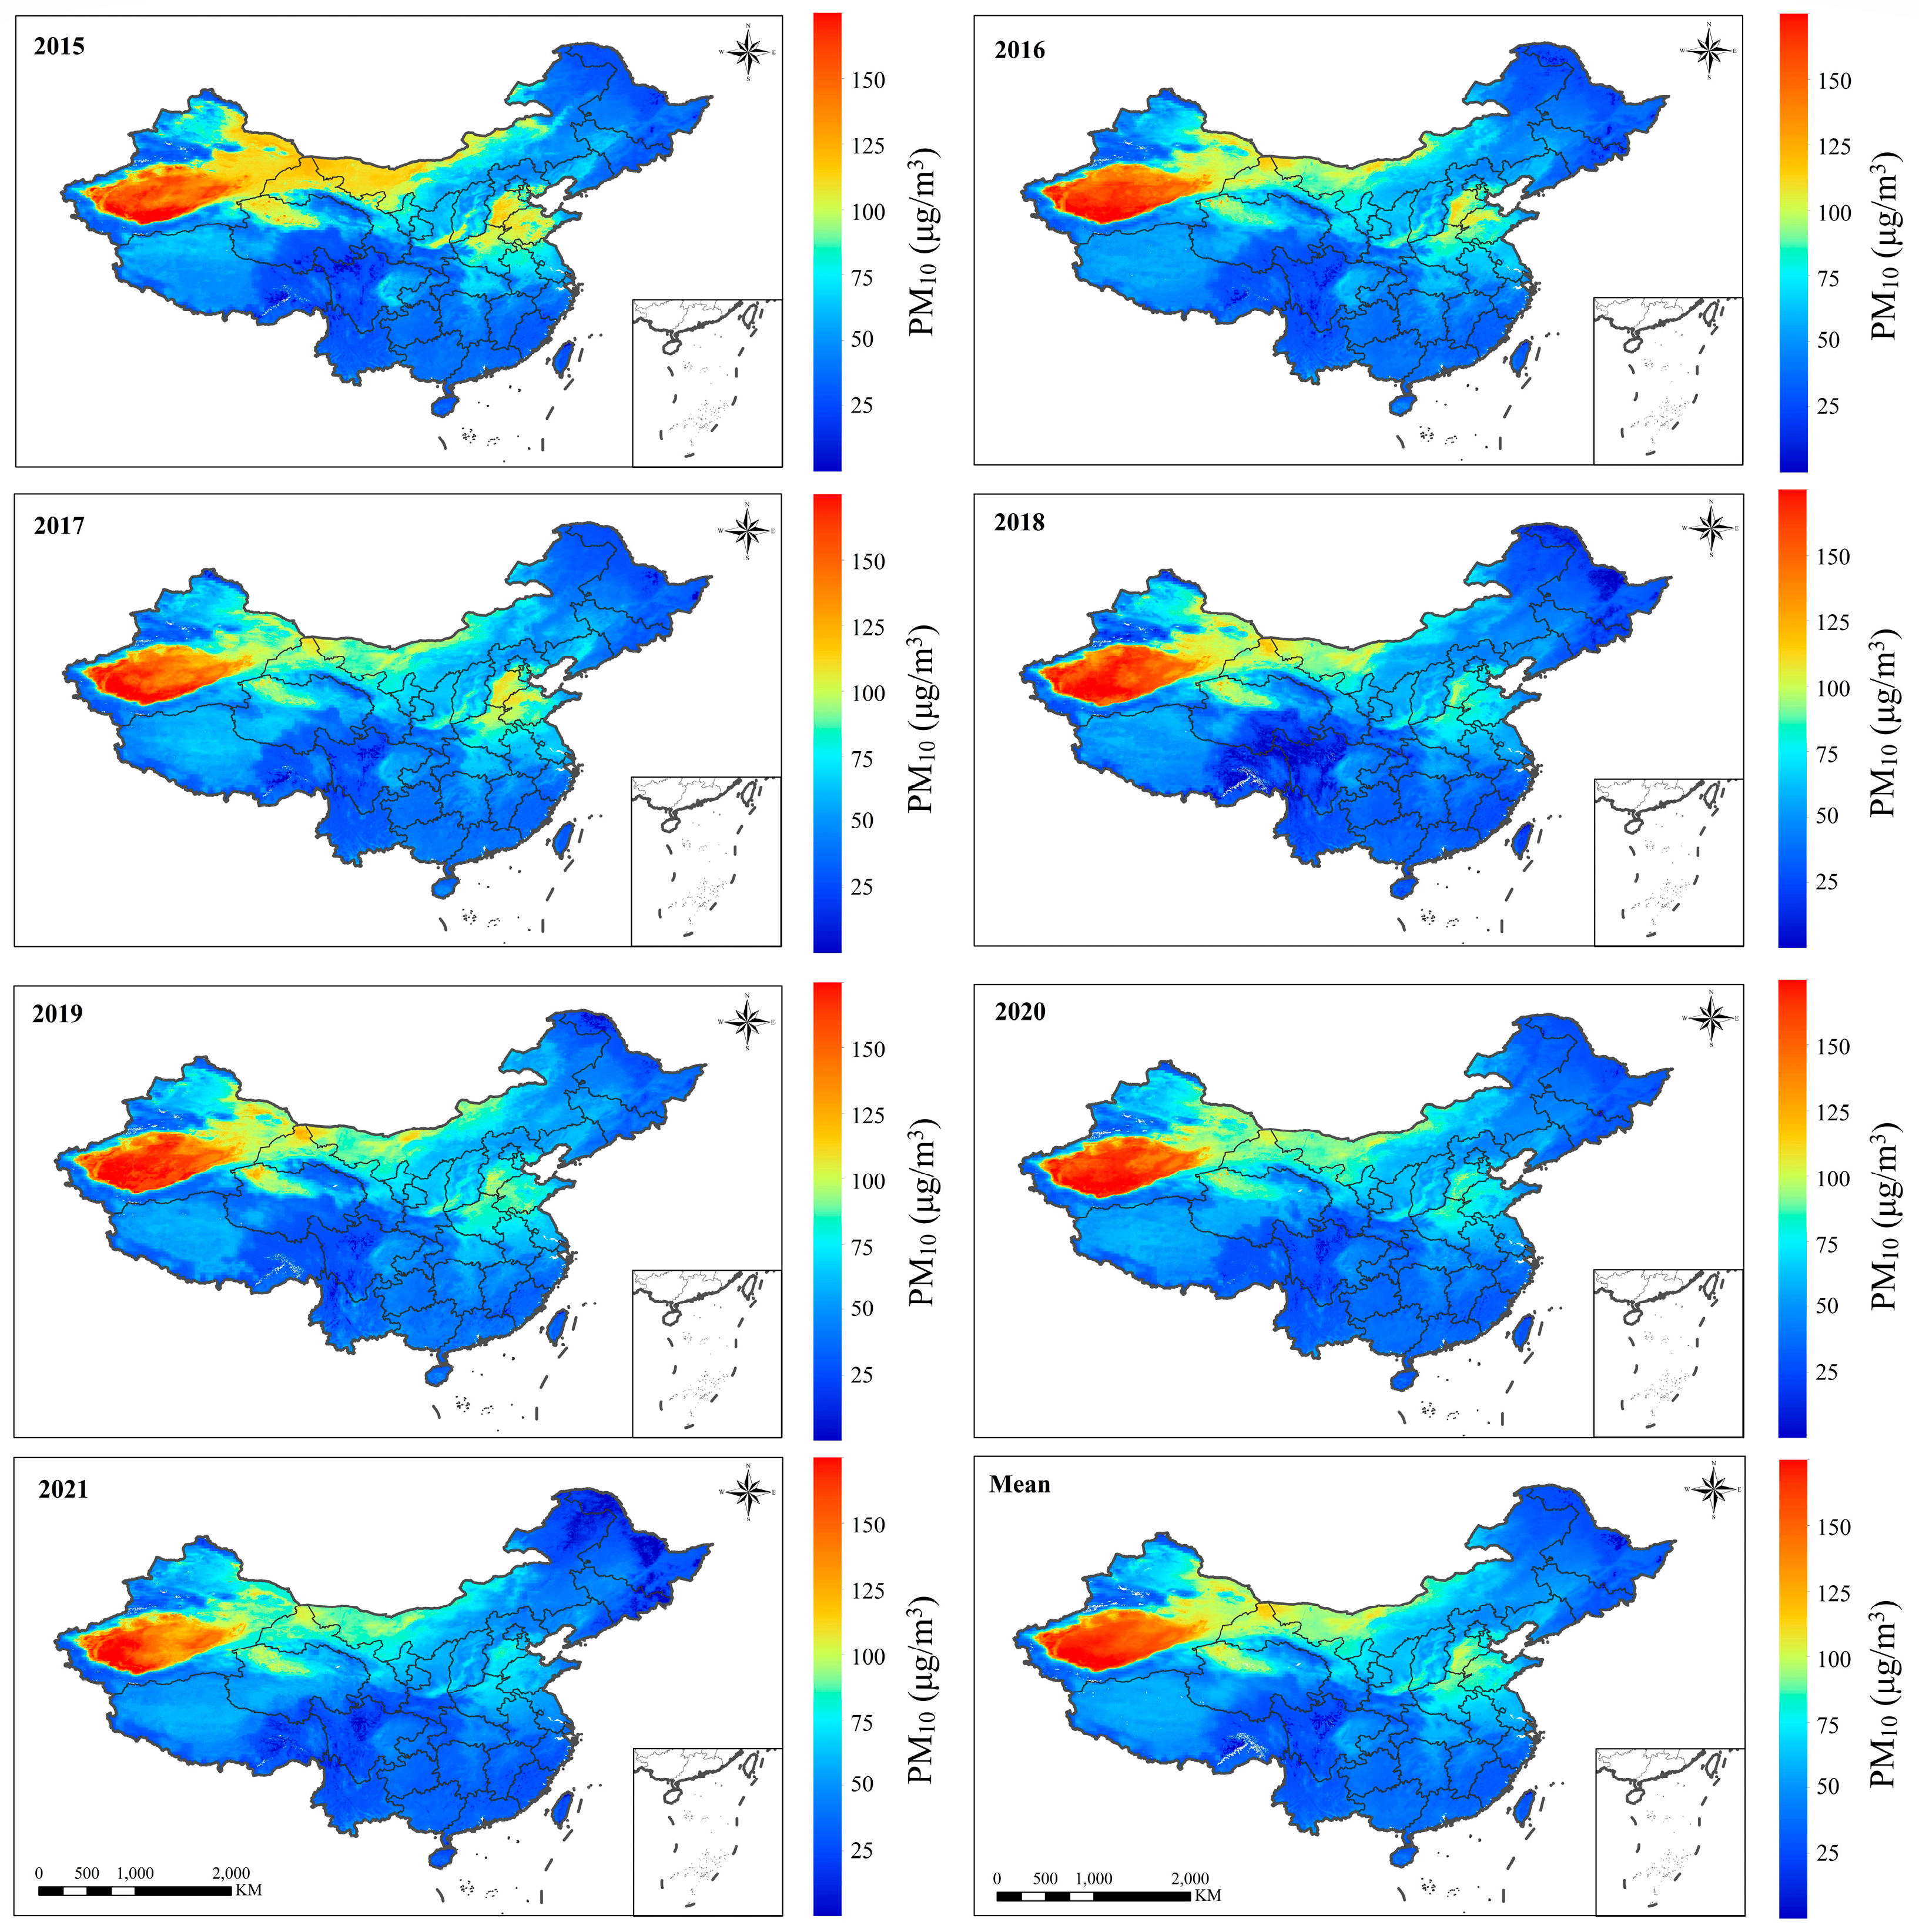
Figure 4 illustrates the spatiotemporal distribution of annual average ground-level PM10 concentrations in China from 2015 to 2021, with a spatial resolution of 1 km × 1 km, estimated based on the ET model. PM10 exhibits significant spatial clustering features in Figure 4, with the highest values occurring in the desert areas of Xinjiang, western Inner Mongolia, and the northwest of Qinghai and Gansu. Not only do these regions have annual average PM10 concentrations exceeding 100 μg/m3, but the spatial extent of high-concentration areas is also substantial. Additionally, relatively high PM10 concentrations are observed in the Beijing–Tianjin–Hebei urban agglomeration and northern Henan Province, where the annual average PM10 concentrations range from 100 μg/m3 to 125 μg/m3. In other regions with high PM10 concentrations, they are mainly concentrated in economically relatively developed cities and their surrounding areas. Overall, the PM10 pollution in the north is more severe than in the south, with annual average PM10 concentrations generally below 75 μg/m3 in the south. Northern Sichuan, Yunnan, Guizhou, and coastal cities in the south have lower annual average PM10 concentrations, all below 50 μg/m3. From the perspective of land-cover types, areas with more forest tend to have lower PM10 concentrations, while areas covered by deserts tend to have higher PM10 concentrations.
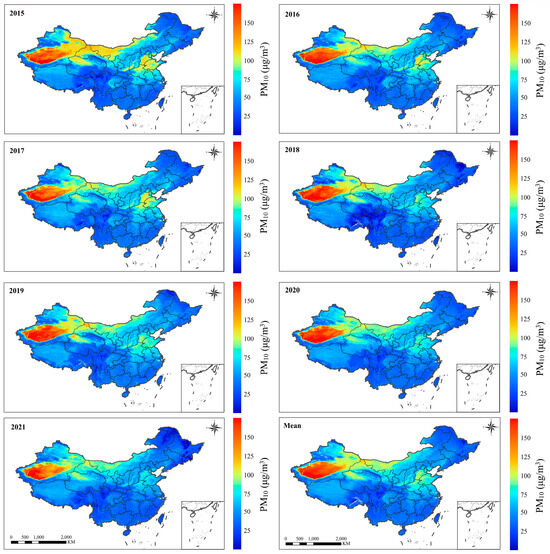
Figure 4.
Annual and multiple-year mean PM10 maps (1 km × 1 km) in China.
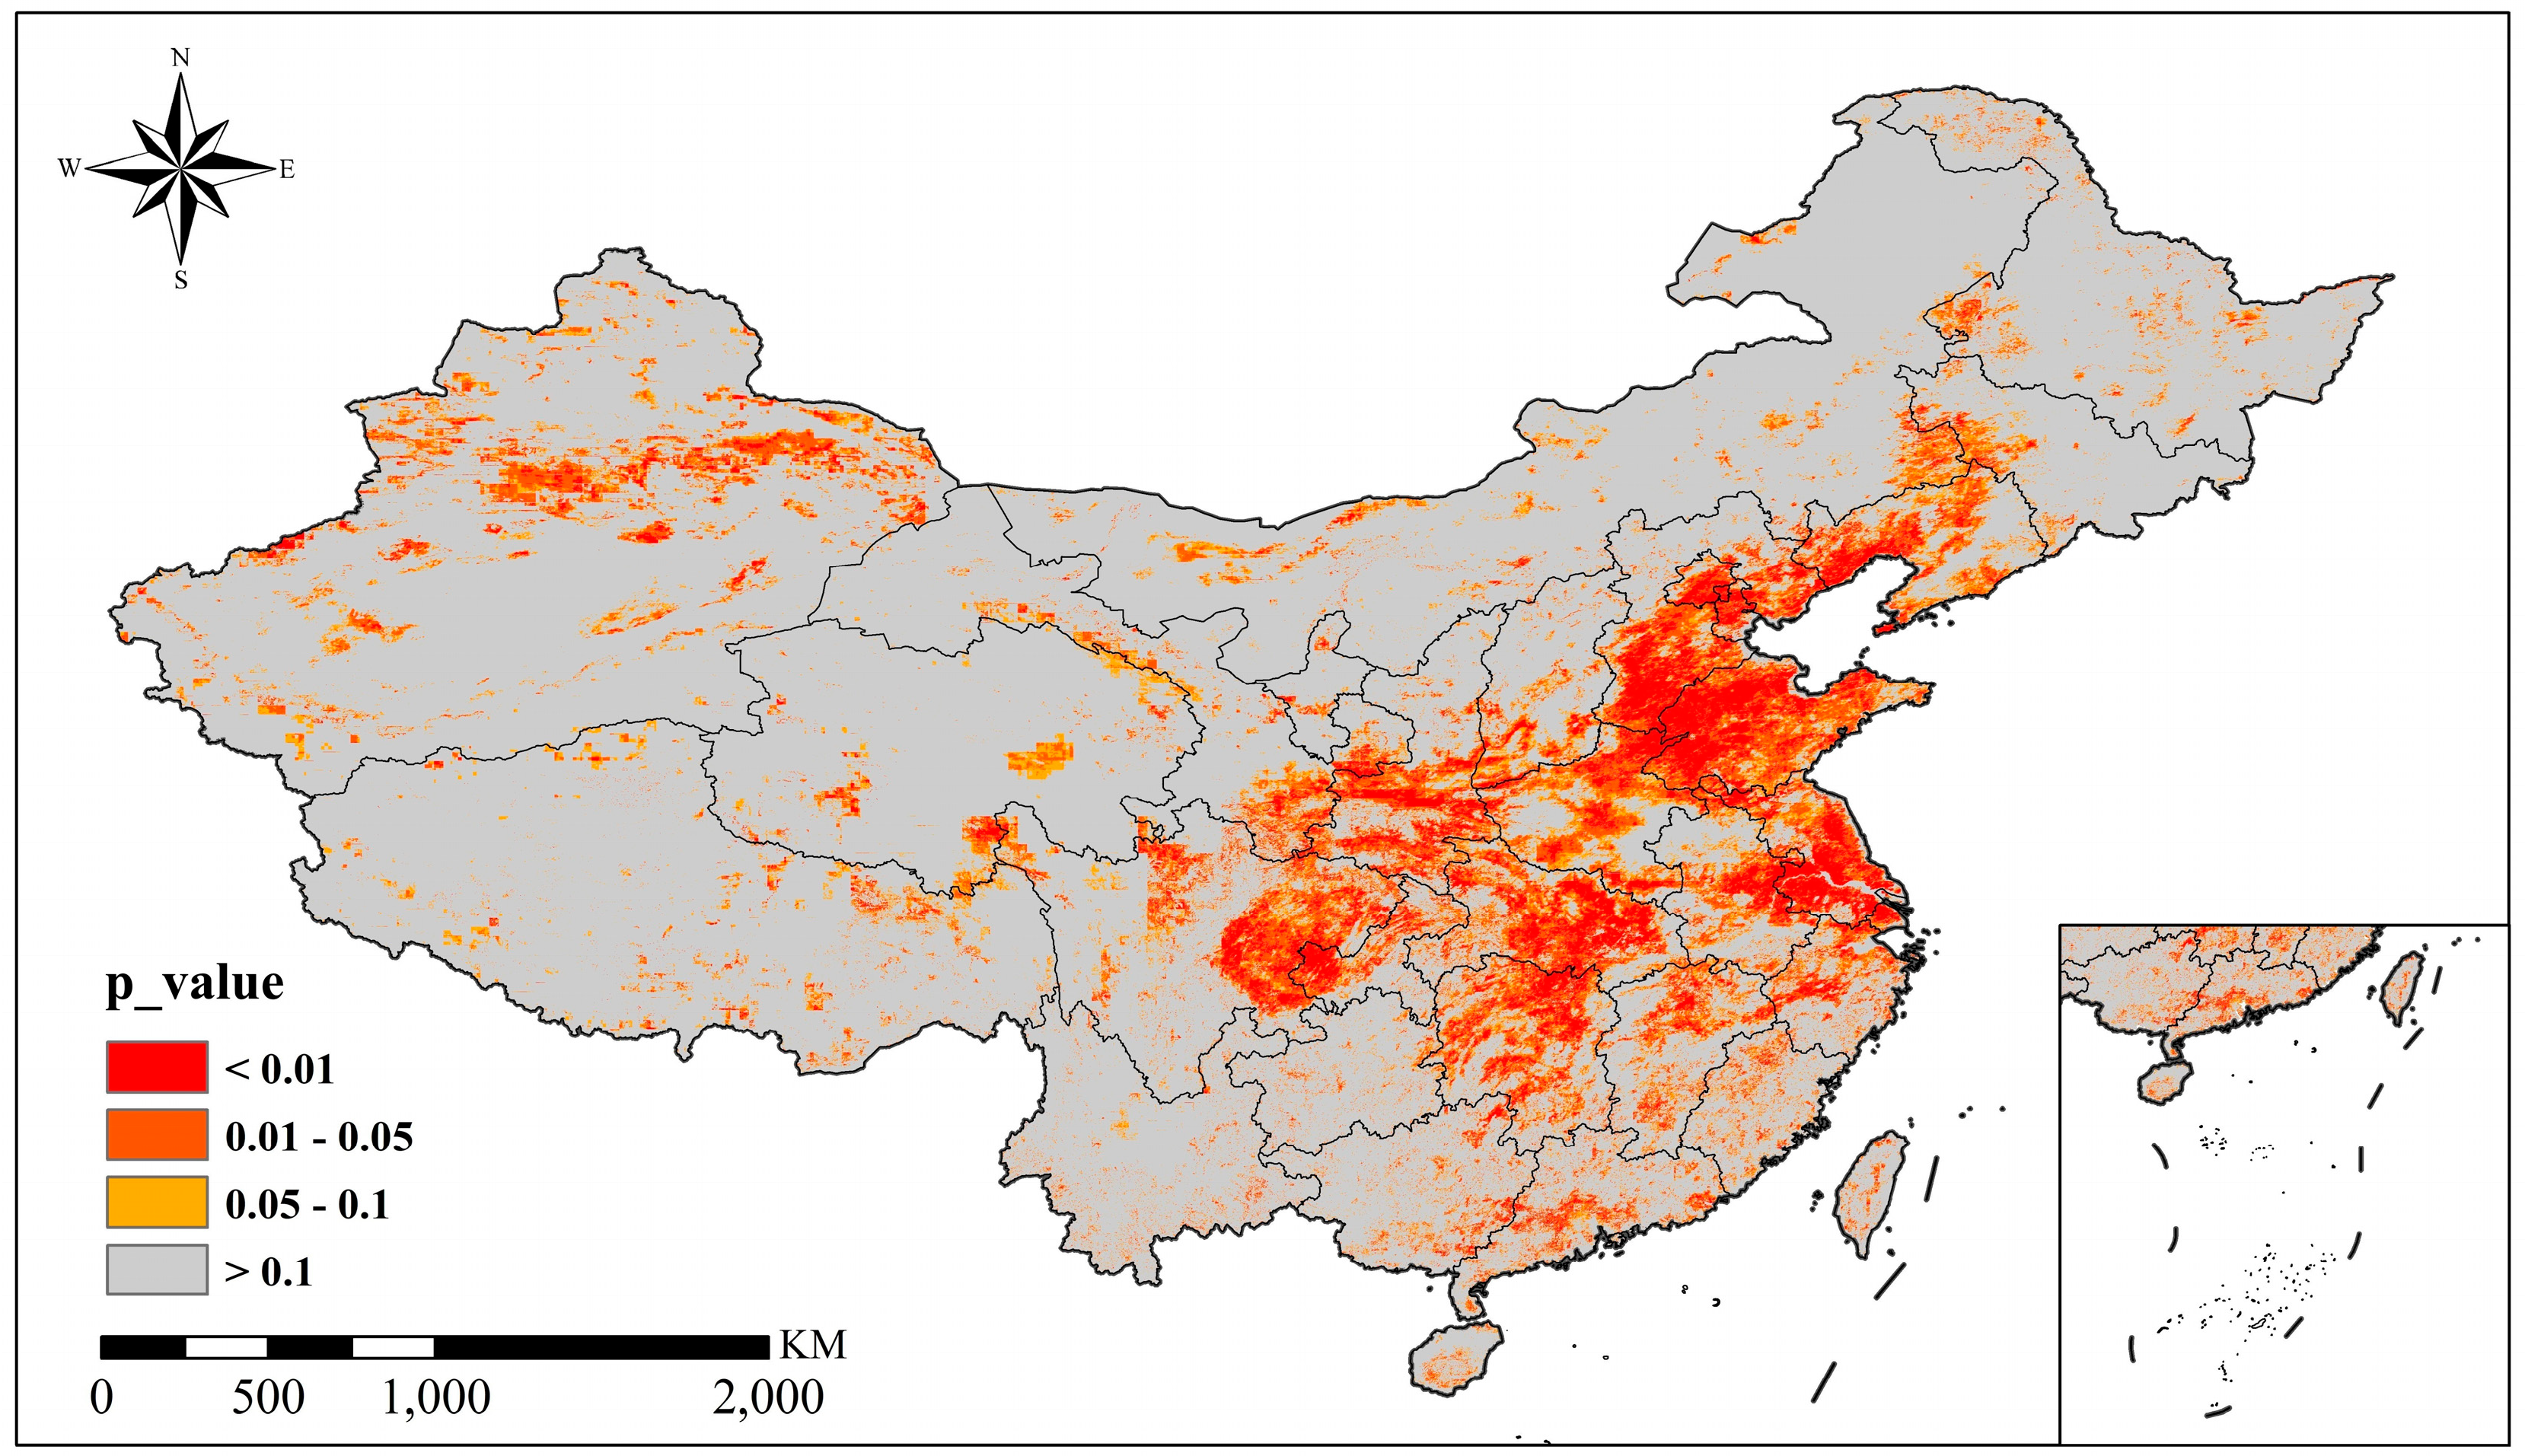
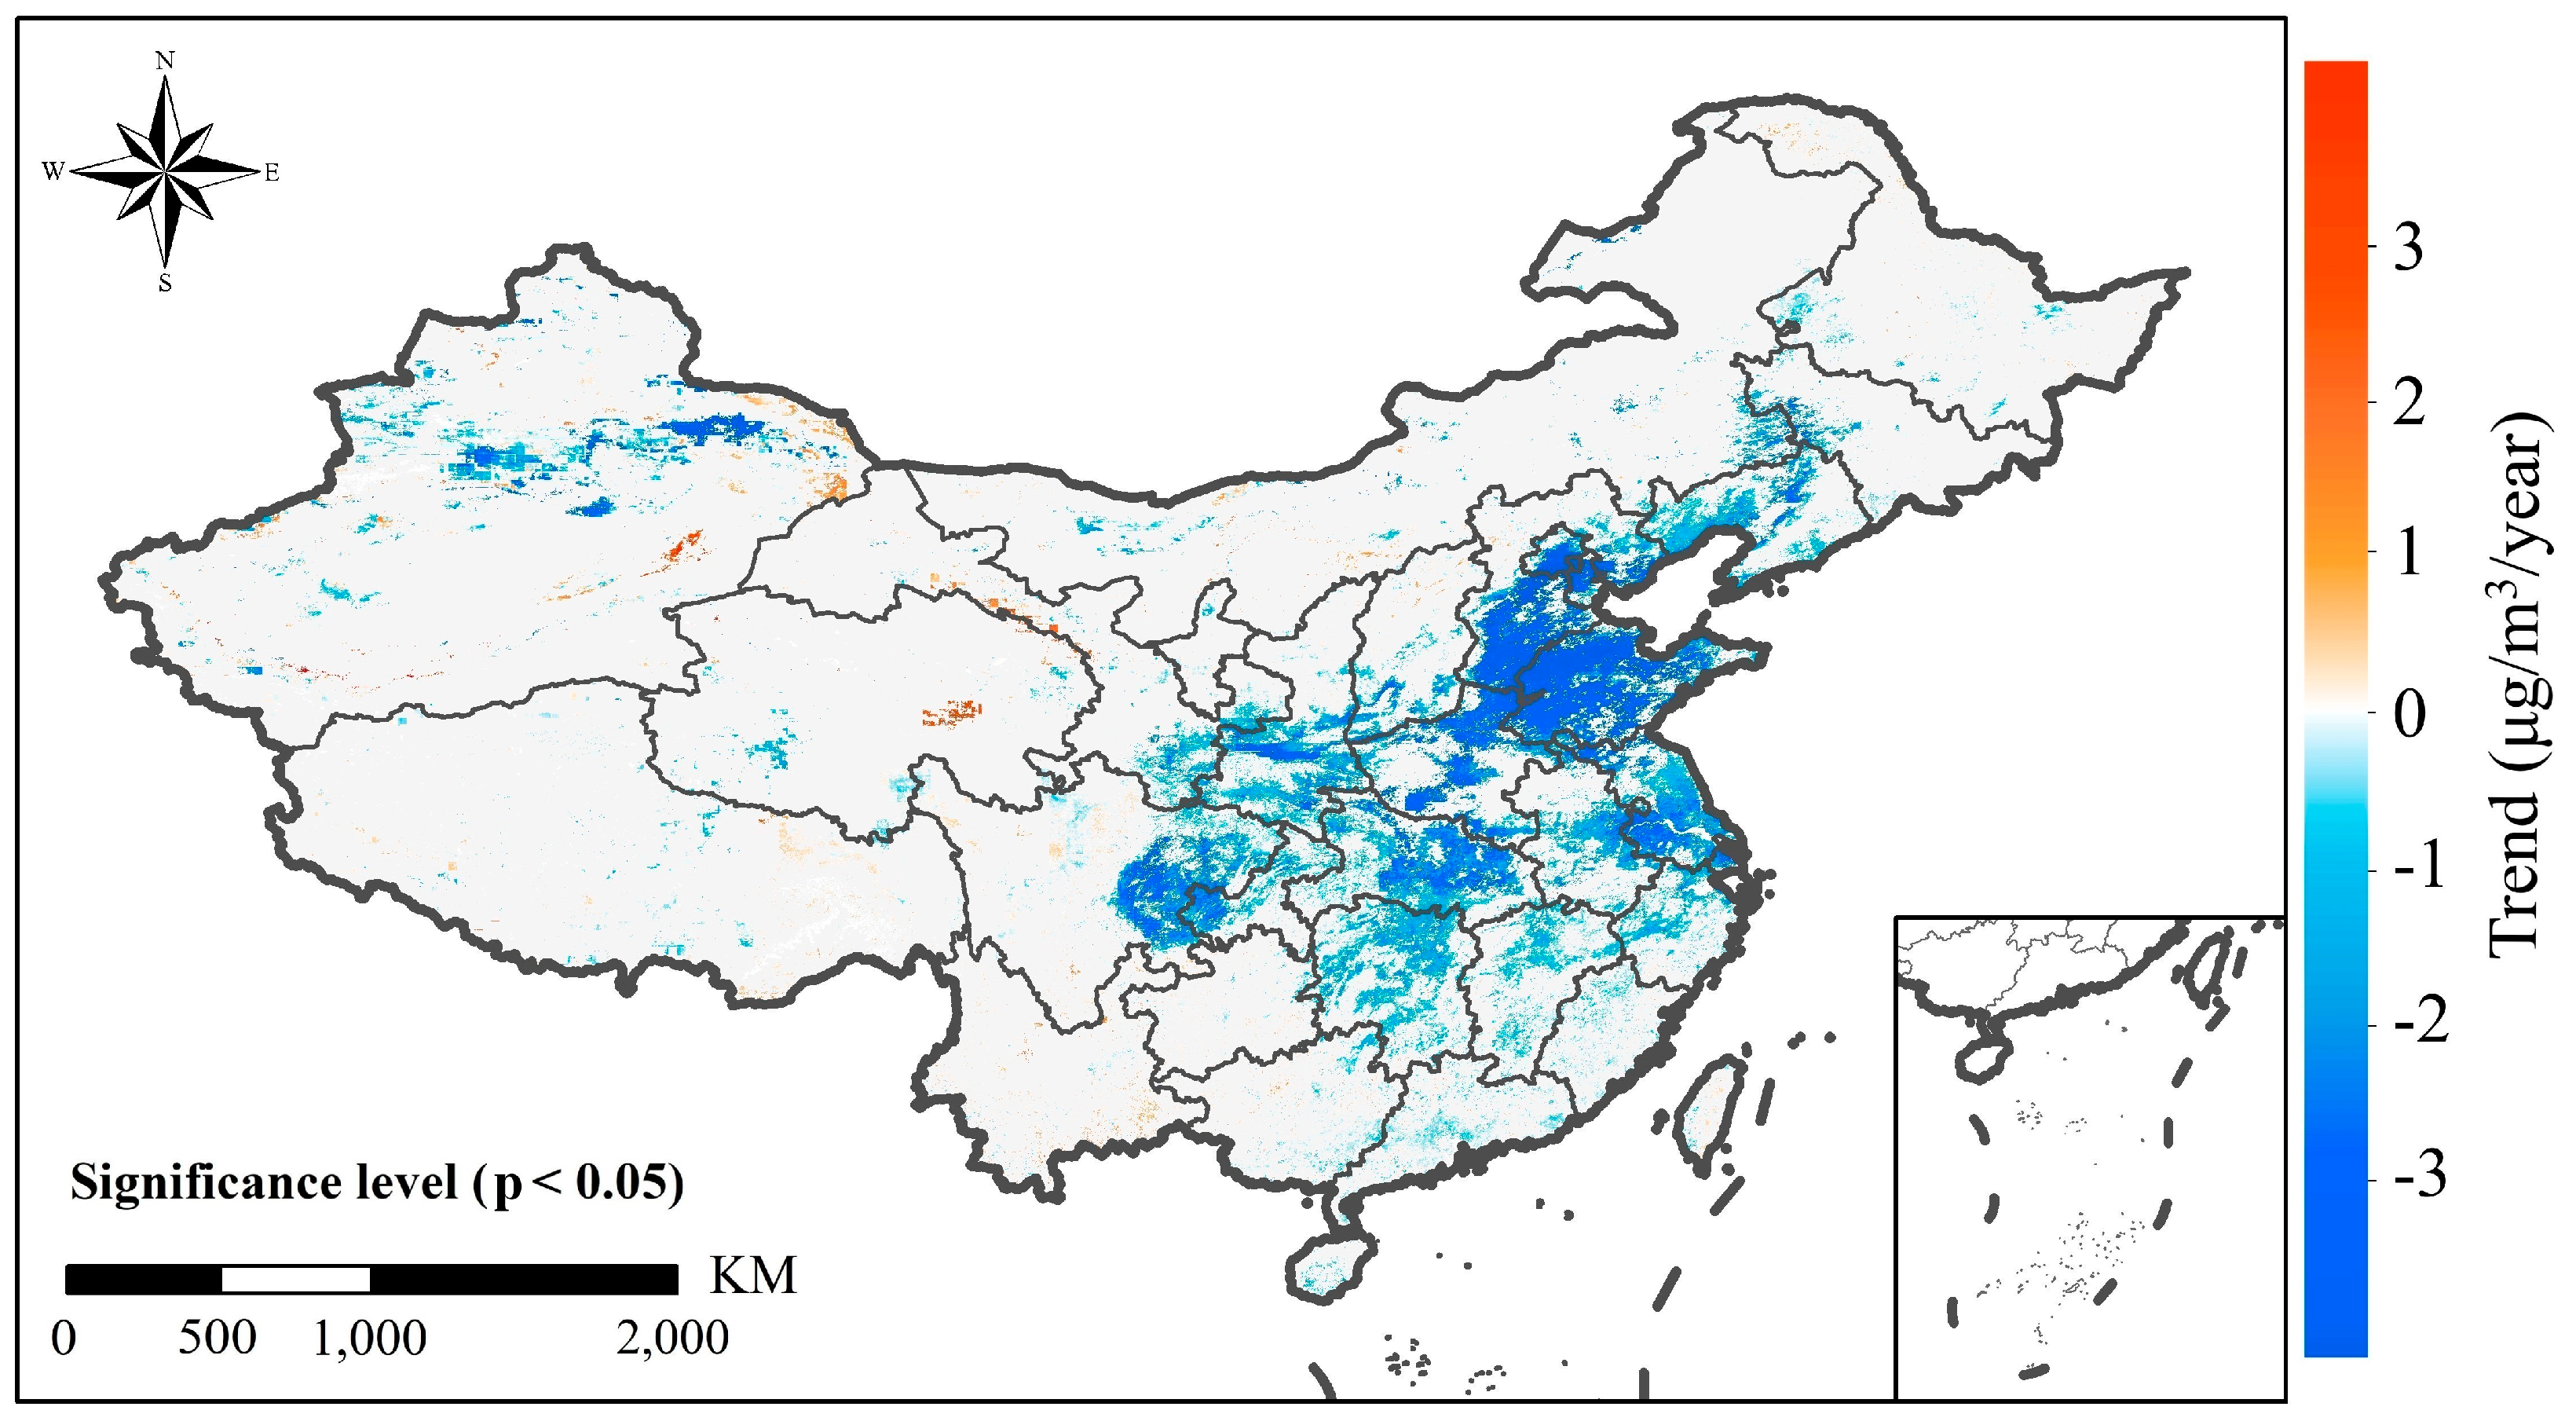
From 2015 to 2021, there was an overall downward trend in PM10 concentration in China. We conducted linear fitting for each pixel of PM10 over these seven years to clarify spatial change trends and performed significance tests on the trends (Figure 5) to assess the statistical significance of the sample data, ensuring that the observed trend changes are significant. It can be seen that in most areas of central and eastern China, the p-values are less than 0.05, indicating significance, while in western and northeastern China, the significance is less pronounced. Figure 6 shows the results of the trend fitting, and to highlight areas with significant changes in China, we selected regions where the trend change was significant at a 95% confidence level (p < 0.05) for plotting. In most areas passing the significance test, PM10 concentration showed a significant downward trend, especially in northern Xinjiang, western and eastern Inner Mongolia, and major urban agglomerations in the Beijing–Tianjin–Hebei region and Shandong Province, where the decrease exceeded 3 μg/m3/year. Areas with significant increases in PM10 concentration were mainly in desert areas surrounding Xinjiang, as well as central Qinghai, the Qilian Mountains in Gansu, western Sichuan, and the Yunnan–Guizhou Plateau. However, the PM10 concentrations in these areas still remain relatively low.
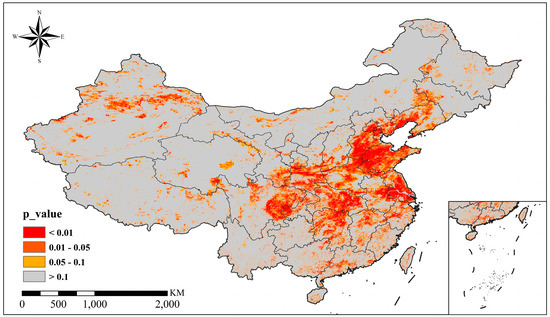
Figure 5.
p-value of PM10 trend over China.
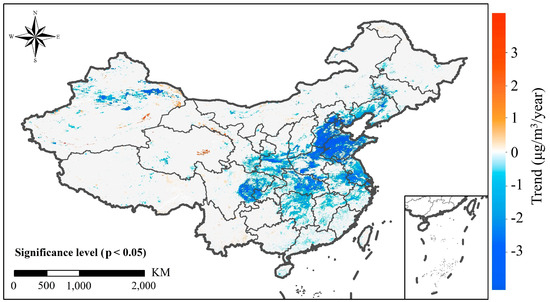
Figure 6.
Spatial distribution of the annual PM10 concentration trend in China (μg/m3/year).
3.2. Land-Cover Change from 2015 to 2021
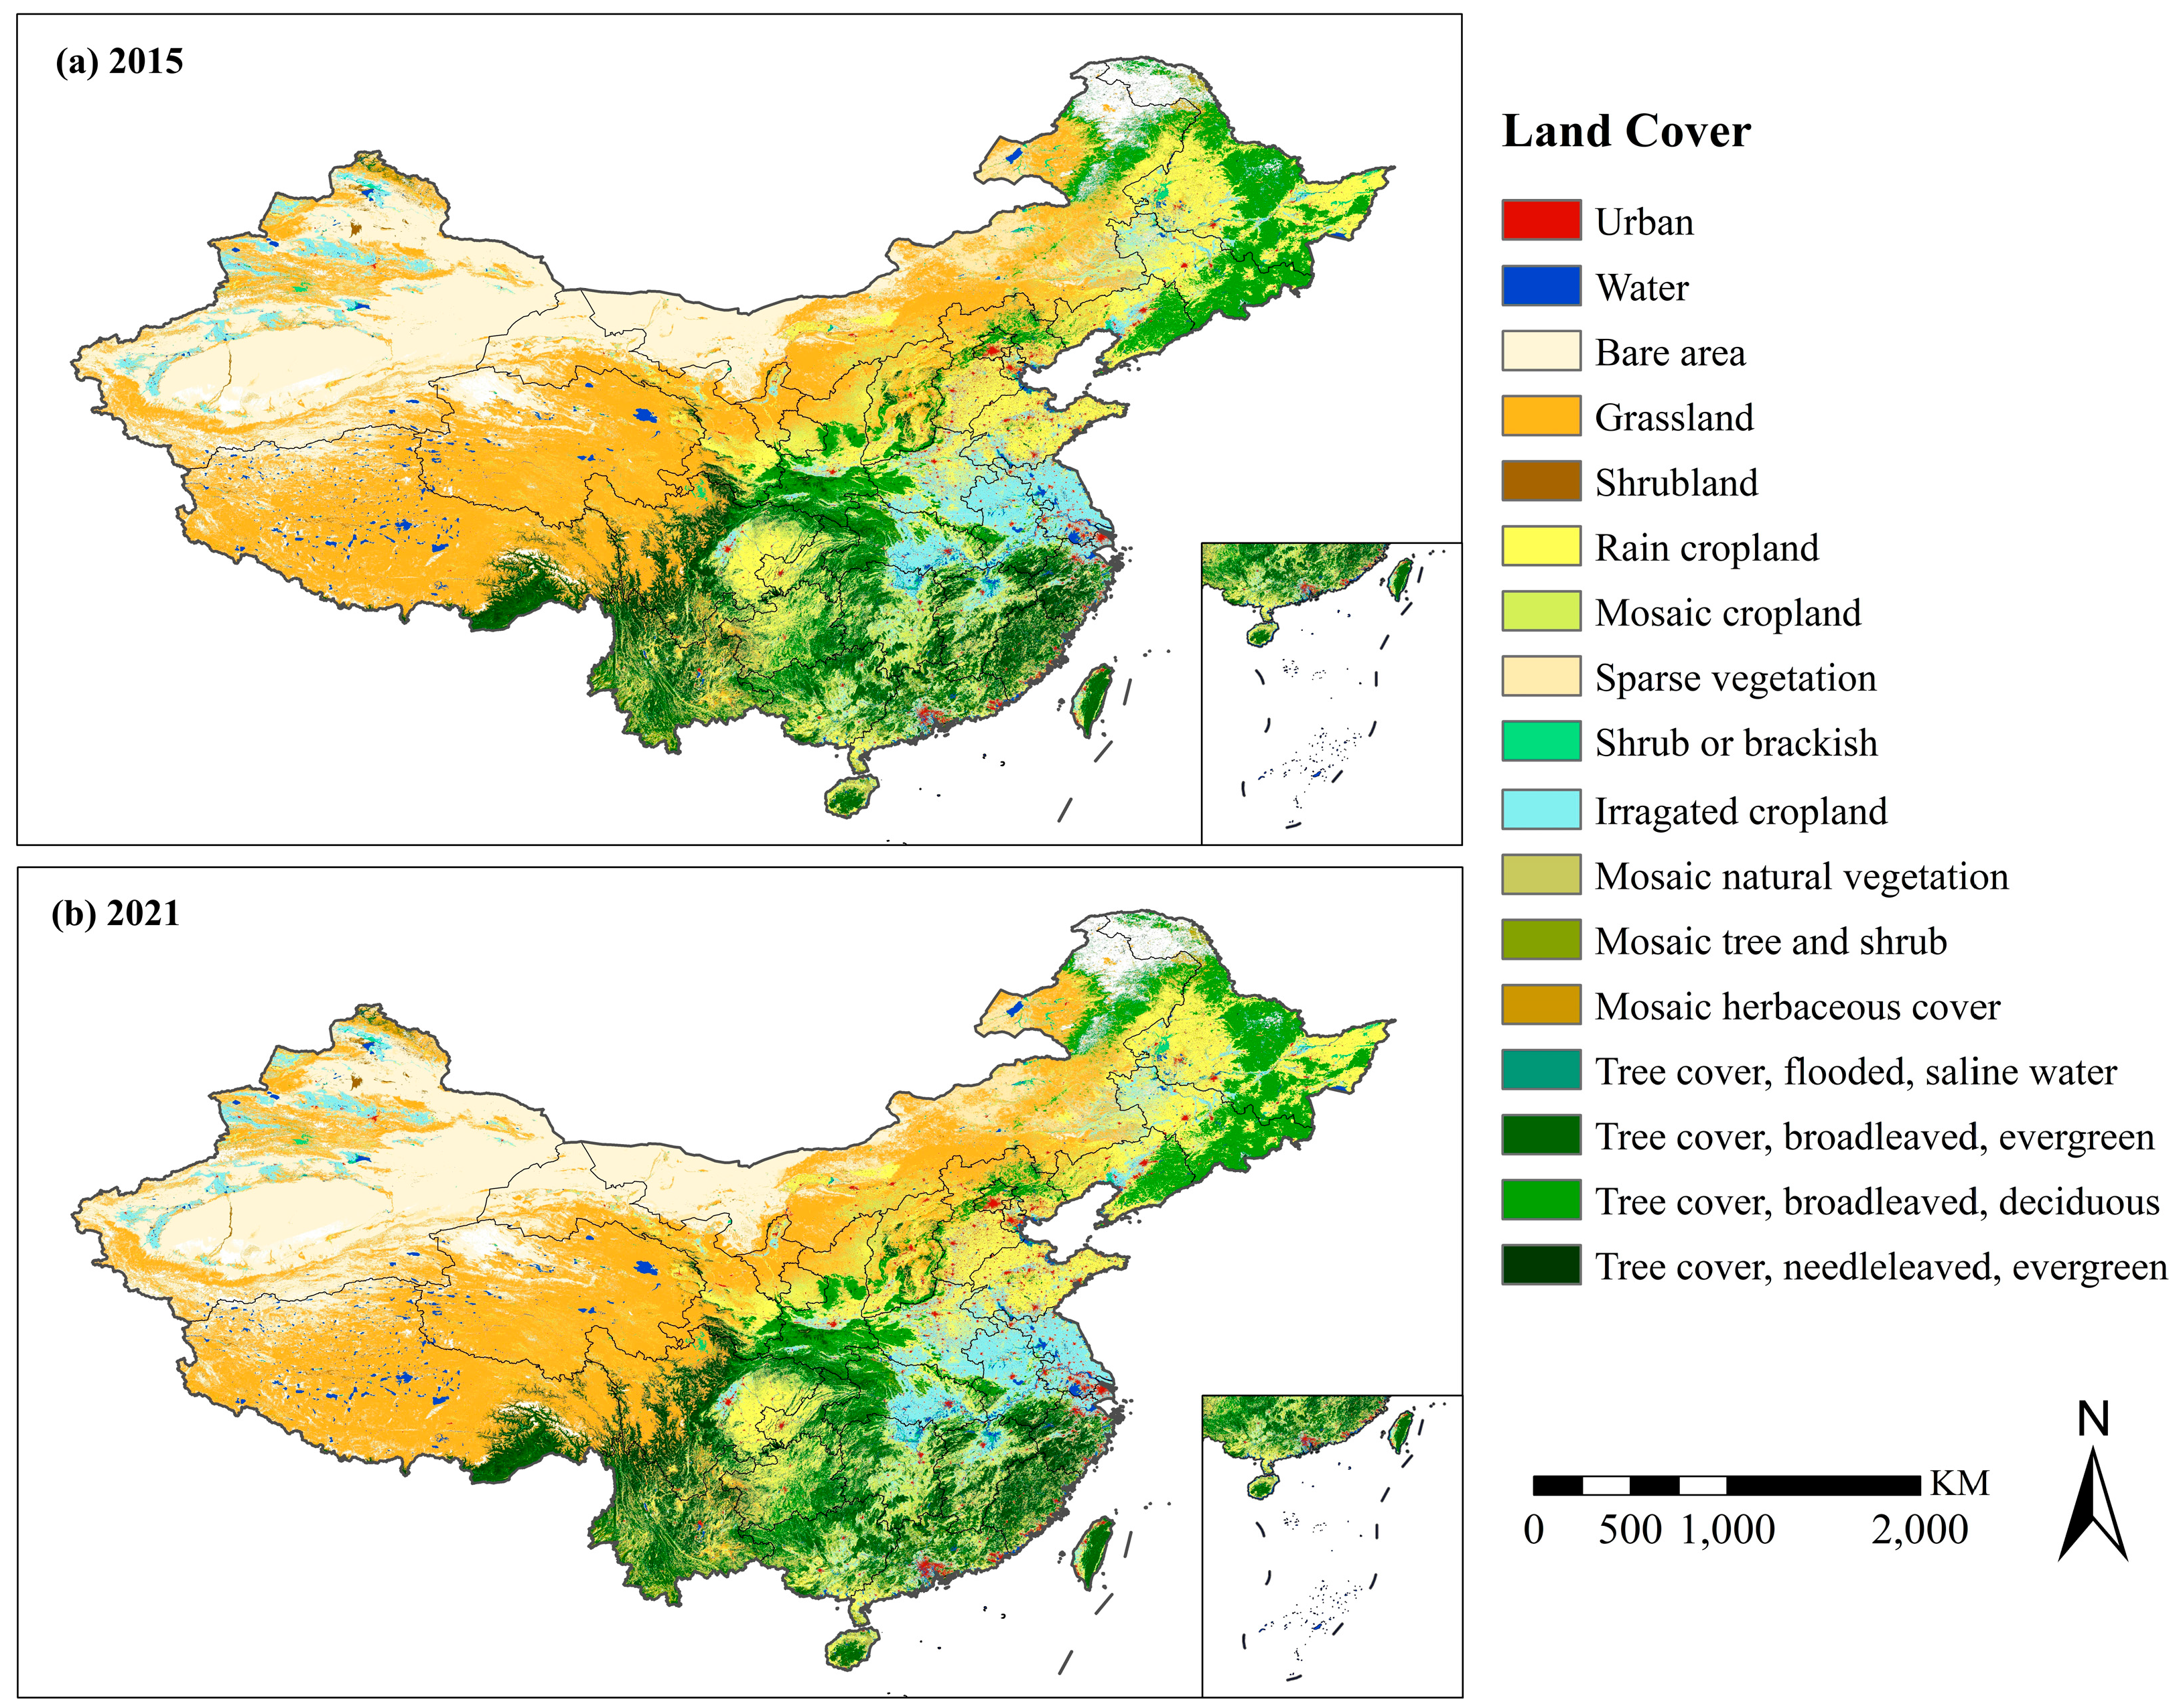
Figure 7 shows the overall spatial distribution of land-cover types in China in 2015 and 2021. Due to various factors such as geographical environment, climate conditions, and human activities, land cover exhibits diversity and complexity, with different types of land cover intermingling. Forests are predominantly concentrated in the eastern and southwestern regions, particularly in the northeast, North China, the Yangtze River Basin, southwestern, and northwestern parts. The forests in the northeast are mainly composed of coniferous trees, while those in the southern regions consist mainly of broad-leaved trees. Grasslands are mainly distributed in the northern and northwestern regions of China, such as Inner Mongolia, Xinjiang. Cropland is widely distributed in the eastern plain areas and along the valleys of rivers and lakes. Urban areas are scattered and mainly concentrated in the eastern coastal areas and around some important economic centers. Barren lands are primarily located in the northwestern region, such as the Taklamakan Desert and the Kumtage Desert. In recent decades, with the rapid economic development in China, significant changes have occurred in the spatial pattern of land cover, leading to a series of environmental issues [48].

Figure 7.
Spatial distribution of land cover in China in 2015 and 2021.
Studying the transition of land-cover types is conducive to better analyzing and understanding the spatial structure and quantity changes in land surfaces, providing critical information for land management, environmental protection, climate change, and sustainable development. The land-cover transition matrix effectively extracts the area conversion between different types of land cover. In this study, we computed the land-cover type transition matrices for 2015 and 2021 (Table 3). From 2015 to 2021, significant conversions occurred among different land-cover types across China. Specifically, forests mainly received conversions from grasslands, with an area conversion reaching more than 170,000 km2, possibly associated with afforestation projects and related activities. Grasslands had the largest areas converted both into and out of, as a substantial amount of grassland was converted into forests, while significant areas were also converted into croplands, closely related to China’s demand for food. Additionally, during the rainy season or snowmelt period, grasslands may be submerged by river or lake flooding, transforming them into wetlands and water. Conversely, through drainage and marshland drying, wetlands may revert back to grasslands [49]. The conversion of urban areas over the seven years under study was the smallest among all land-cover type conversions, as the proportion of urban areas globally is extremely small. It is noteworthy that there were also considerable conversions between grasslands and barren lands, but overall the area converted from barren land to grassland was larger.
Table 3.
Land-cover transition matrix from 2015 to 2021 in China (km2).
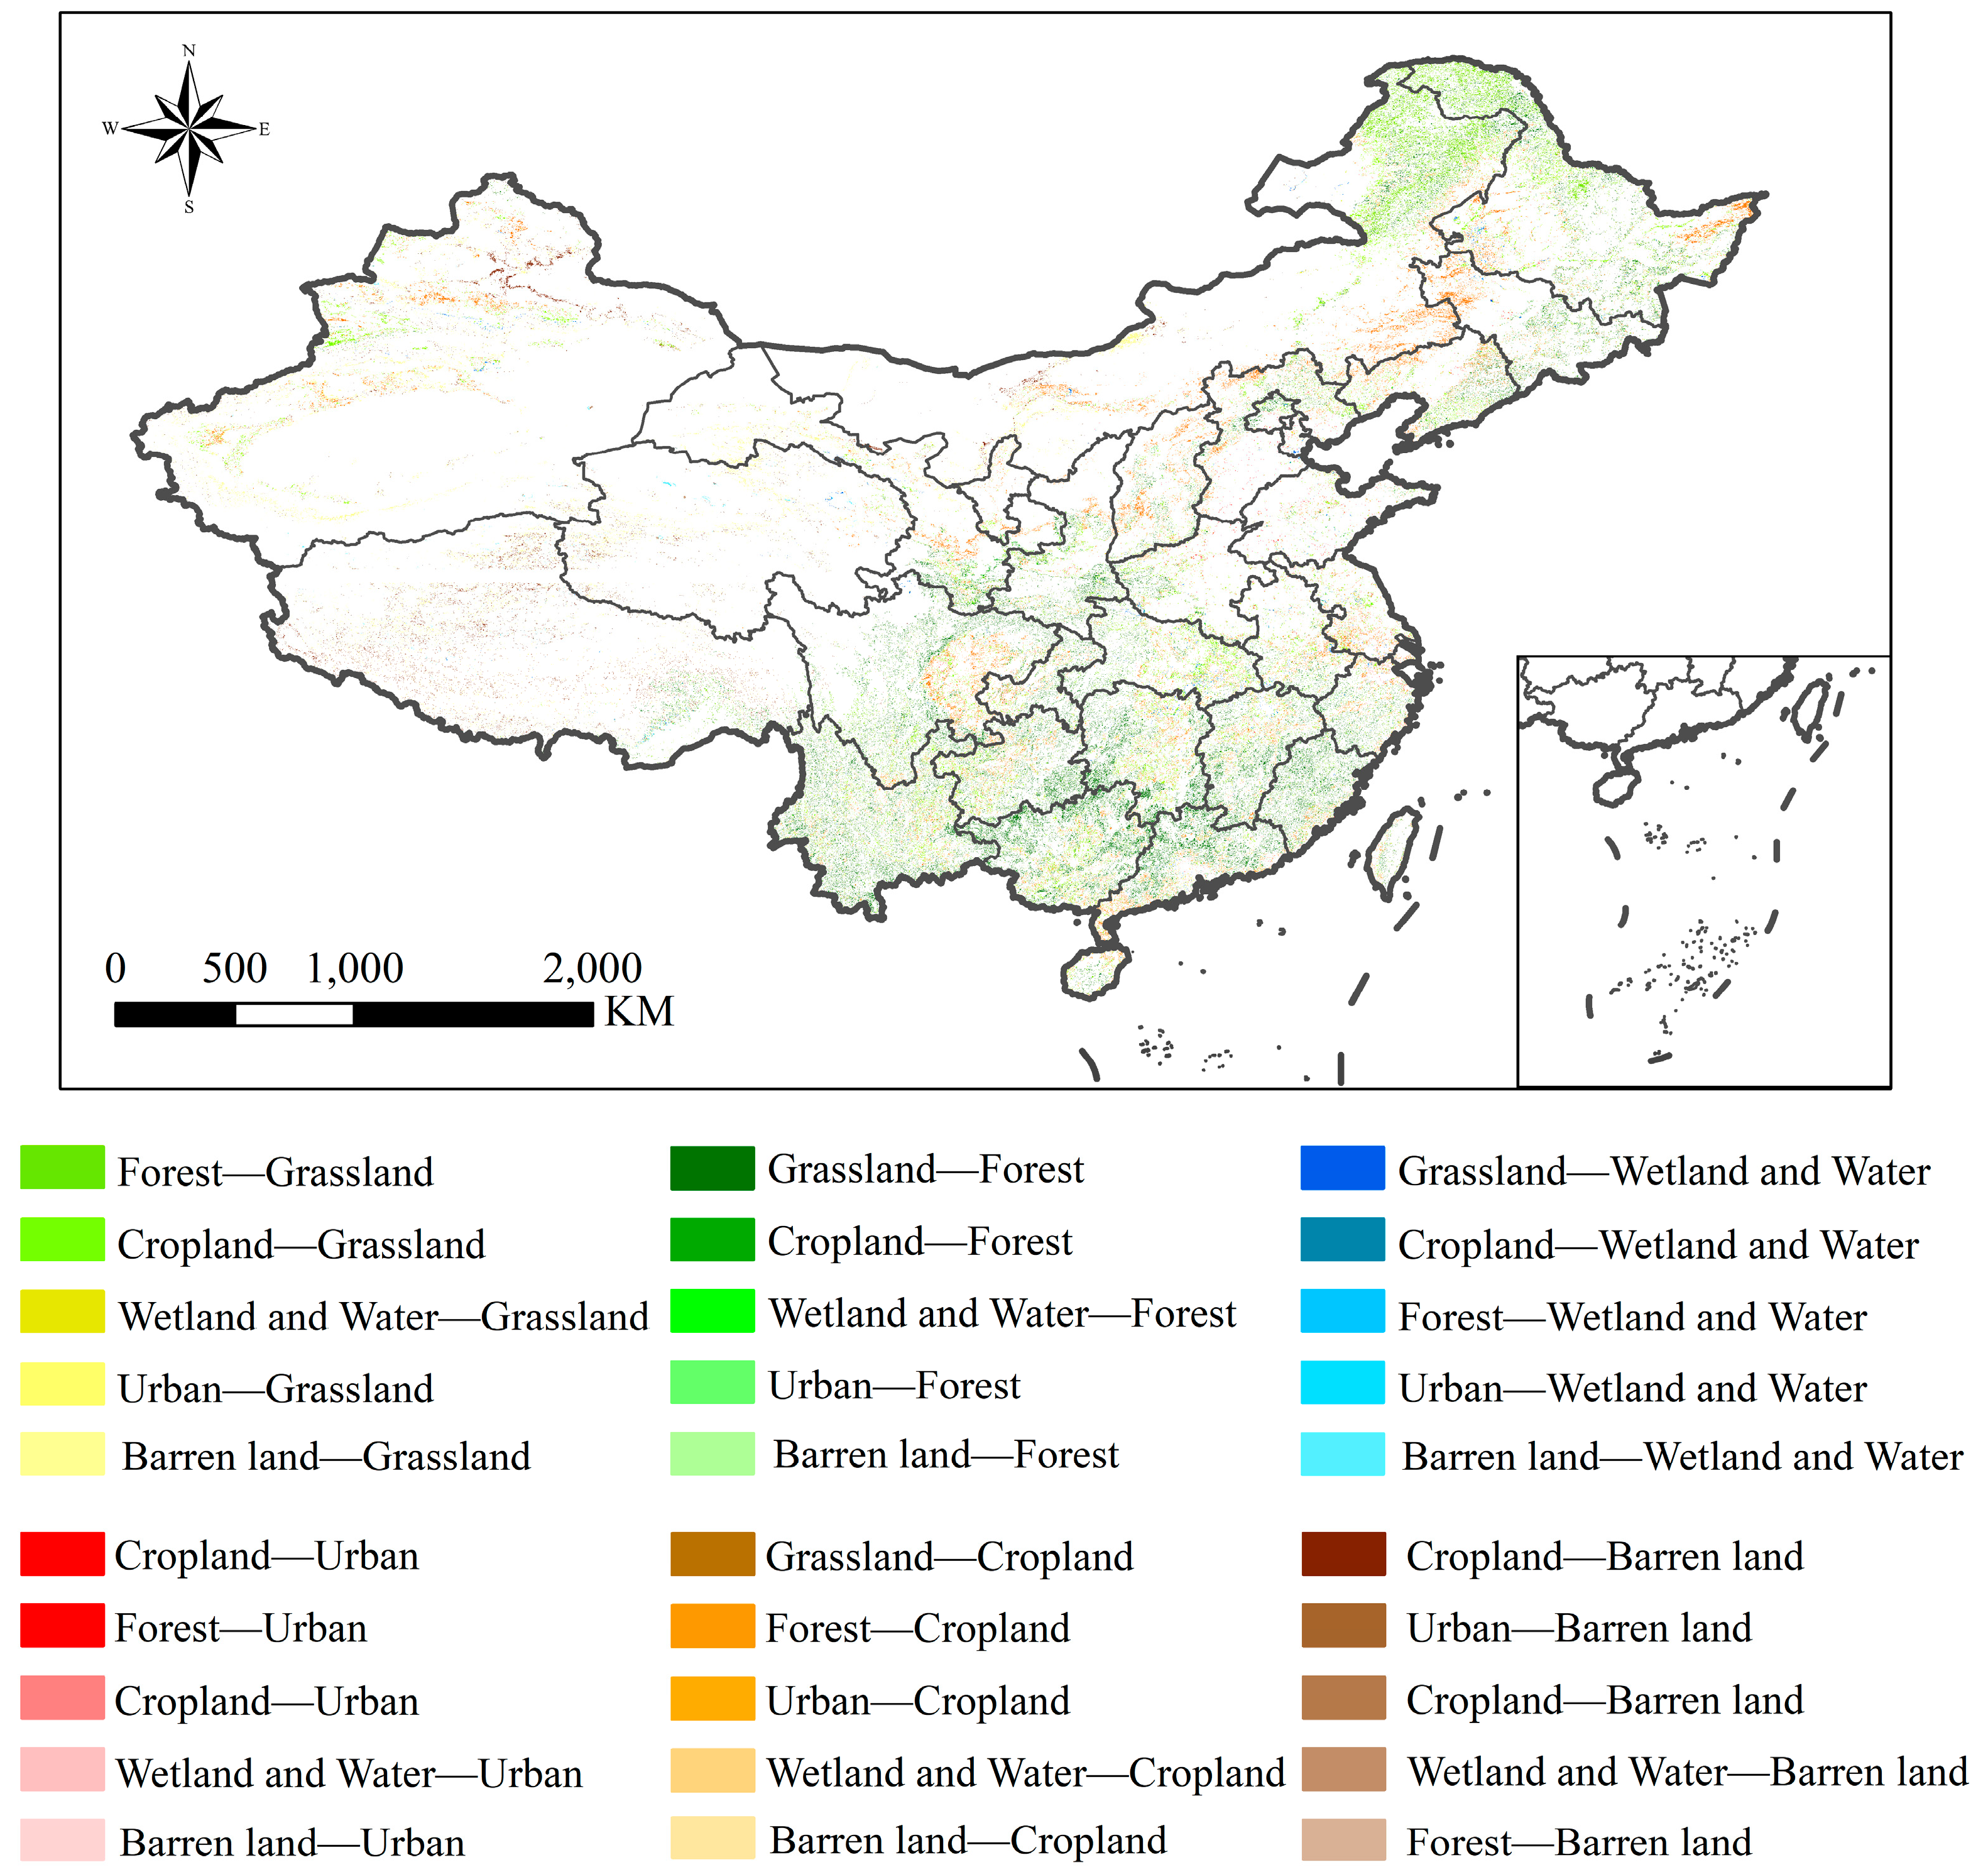
The results of the land-cover type transition matrix provide a quantitative description of land-cover changes from 2015 to 2021. To better understand the spatial dynamics of different land-cover types, spatial change maps of forests, grasslands, croplands, wetland and water, as well as urban areas across China from 2015 to 2021, were also plotted (Figure 8). Both grasslands and forests witnessed large-scale conversions across various provinces in China. China has been focusing on afforestation and forest conservation efforts in regions surrounding the Beijing–Tianjin–Hebei urban agglomeration and the desert areas in the northwest, leading to the conversion of barren land into grasslands and forests. Areas converted into croplands are primarily located in the North China Plain and the Northeast China Plain, which are traditional agricultural areas critical for China’s food security. The Northeast China Plain was historically one of the main agricultural regions, but recent economic restructuring and urbanization have led to spatial shifts in cropland distribution. Land improvement and the rational use of cropland are issues of great concern for the Chinese government, resulting in significant changes in cropland spatial distribution over the seven years under study [50]. Wetlands and water primarily originate from grassland conversions, appearing in river and lake basins. Urban expansion is driven by economic development, with urban areas continuously expanding outward from major cities [51]. In many regions of northwest China and Inner Mongolia, extensive grassland degradation has occurred due to arid climates, fragile ecological environments, and unsustainable land management practices.
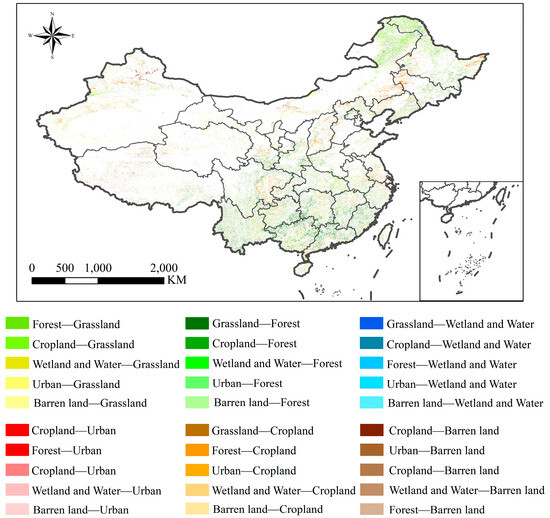
Figure 8.
Land-cover change spatial distribution in China.
3.3. Nonlinear Relationship between Land-Cover Change and PM10 Concentrations Change
In order to investigate the relationship between land-cover types and PM10 concentrations, we conducted statistical analysis on the average PM10 concentrations for different land-cover types, as shown in Table 4. From 2015 to 2021, the interannual variation range of PM10 concentrations at various land-cover types was within 5 μg/m3. It can be observed from the table that the atmospheric quality is the best for forest cover locations, with values within 40 μg/m3 throughout the seven years, significantly lower than other land-cover types. Grassland areas exhibit the second lowest PM10 concentration among the other land-cover types. Wetland and water, croplands, and urban areas have similar PM10 concentrations, with wetland and water being slightly lower than croplands and urban areas. The PM10 concentration in urban areas remains relatively stable, except for 2020, where it stayed between 61 and 60 μg/m3, approximately 1 μg/m3 lower compared to other years. This may be closely related to the sudden outbreak of the coronavirus disease 2019 (COVID-19) pandemic at the end of 2019. The lockdown policy implemented by China resulted in a reduction in traffic and industrial activities. Traffic restrictions reduced vehicle exhaust emissions, while industrial shutdowns reduced industrial emissions, leading to a decrease in PM10 concentration in some urban areas. With the arrival of the post-pandemic era, economic and social activities gradually resumed, and industrial and transportation activities gradually returned to normal levels, leading to a resurgence of air pollutant emissions in some areas [52,53]. Barren land, with its exposed and loose surface, is highly susceptible to wind erosion, which easily generates large amounts of particulate matter into the atmosphere, resulting in air pollution. Moreover, desertification is predominant in barren lands, and sandstorms are one of the main sources of PM10, making barren lands exhibit the highest PM10 concentration among all land-cover types.
Table 4.
Average PM10 concentrations for different land-cover types (unit: μg/m3).
The differences in PM10 concentration among different land-cover types are significant. To further explore the relationship between land-cover types and PM10 concentration, we plotted the proportions of different graded PM10 concentrations under different land-cover types. Figure 9 illustrates significant differences in air quality among different land-cover types. The PM10 concentrations in forested areas are all within 75 μg/m3, with over 90% of forested areas having PM10 concentrations below 50 μg/m3. More than half of grassland areas have PM10 concentrations below 50 μg/m3. However, wetland and water, croplands, and urban areas have PM10 concentrations exceeding 50 μg/m3, with over half of these areas surpassing this threshold. Currently, China’s primary standard for PM10 concentration is 40 μg/m3, indicating that there is still a PM10 exposure risk in many areas with frequent human activities, such as croplands and urban areas. Additionally, barren lands are consistently affected by sandstorms, with 47.8% of the regions experiencing PM10 concentrations exceeding 100 μg/m3.
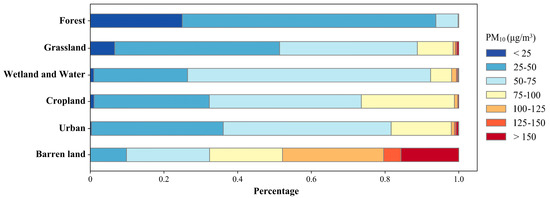
Figure 9.
The proportion of PM10 concentrations at different levels across land-cover types.
Table 5 shows the concentration of variation in PM10 when the land-cover transition occurred. Where there was no change in land-cover type, PM10 concentrations showed a decreasing trend, except for barren land. It can be seen that among all types of transitions, only three transitions show an increase trend in PM10 concentration. Two of these transitions result in an increase in PM10 concentration due to conversion to barren land, while the other land-cover type transitions show a decreasing trend. There is a significant decrease in PM10 concentration when various land-cover types are converted to forest, especially when barren land is converted to forest, with a decrease of −17.34 μg/m3; compared to the PM10 concentration baseline of barren land, the PM10 concentration decreased by 20.73 μg/m3. Additionally, when forest is converted to other land-cover types, the change in PM10 is minimal. But compared to the baseline of forest, the decrease in the PM10 concentration is much smaller, indicating that the land-cover type switch decreased the suppression of PM10. When various land-cover types are converted to urban and wetland and water bodies, there is also a significant decrease trend in PM10 concentration, ranging from −5.11 μg/m3 to −11.48 μg/m3 and −2.51 μg/m3 to −14.23 μg/m3, respectively. Conversely, there is relatively little change in the PM10 concentration when converted to cropland.
Table 5.
The average PM10 concentration change caused by land-cover change (unit: μg/m3).
It is difficult to quantitatively assess the complex nonlinear response mechanism of PM10 concentration to land-cover types by simple statistical analysis. In this study, GAM models were constructed to calculate the nonlinear response characteristics of the PM10 concentration to the proportion of land-cover types in 2015 and 2021. The overall interpretability of the GAM models was 75.6% in 2015 and 76.7% in 2021. Among all land-cover types, only wetland and water did not pass the significance test, while the other five types of land cover passed the significance test at p < 0.01 (Table 6). This might be due to the unique spatial distribution of wetland and water, often found within other land-cover types, resulting in relatively small sample sizes and areas. The results in the table indicate that forests were the dominant factor in the variation in PM10 concentration in 2015, while in 2021, the dominant factor shifted to barren land, which may be closely related to the occurrence of a severe dust storm in China in March 2021 [54]. In nonlinear fitting, the F-statistic is an indicator that assesses the overall significance of the GAM model and can help to determine whether the model is appropriate and whether the explanatory variables have a significant effect on the response variable. This also resulted in a significant difference in the F-statistic for barren land between these two years. Overall, forests and barren land remain the primary factors driving the changes in PM10 concentration.
Table 6.
GAM fitting results of PM10 concentrations and land-cover types.
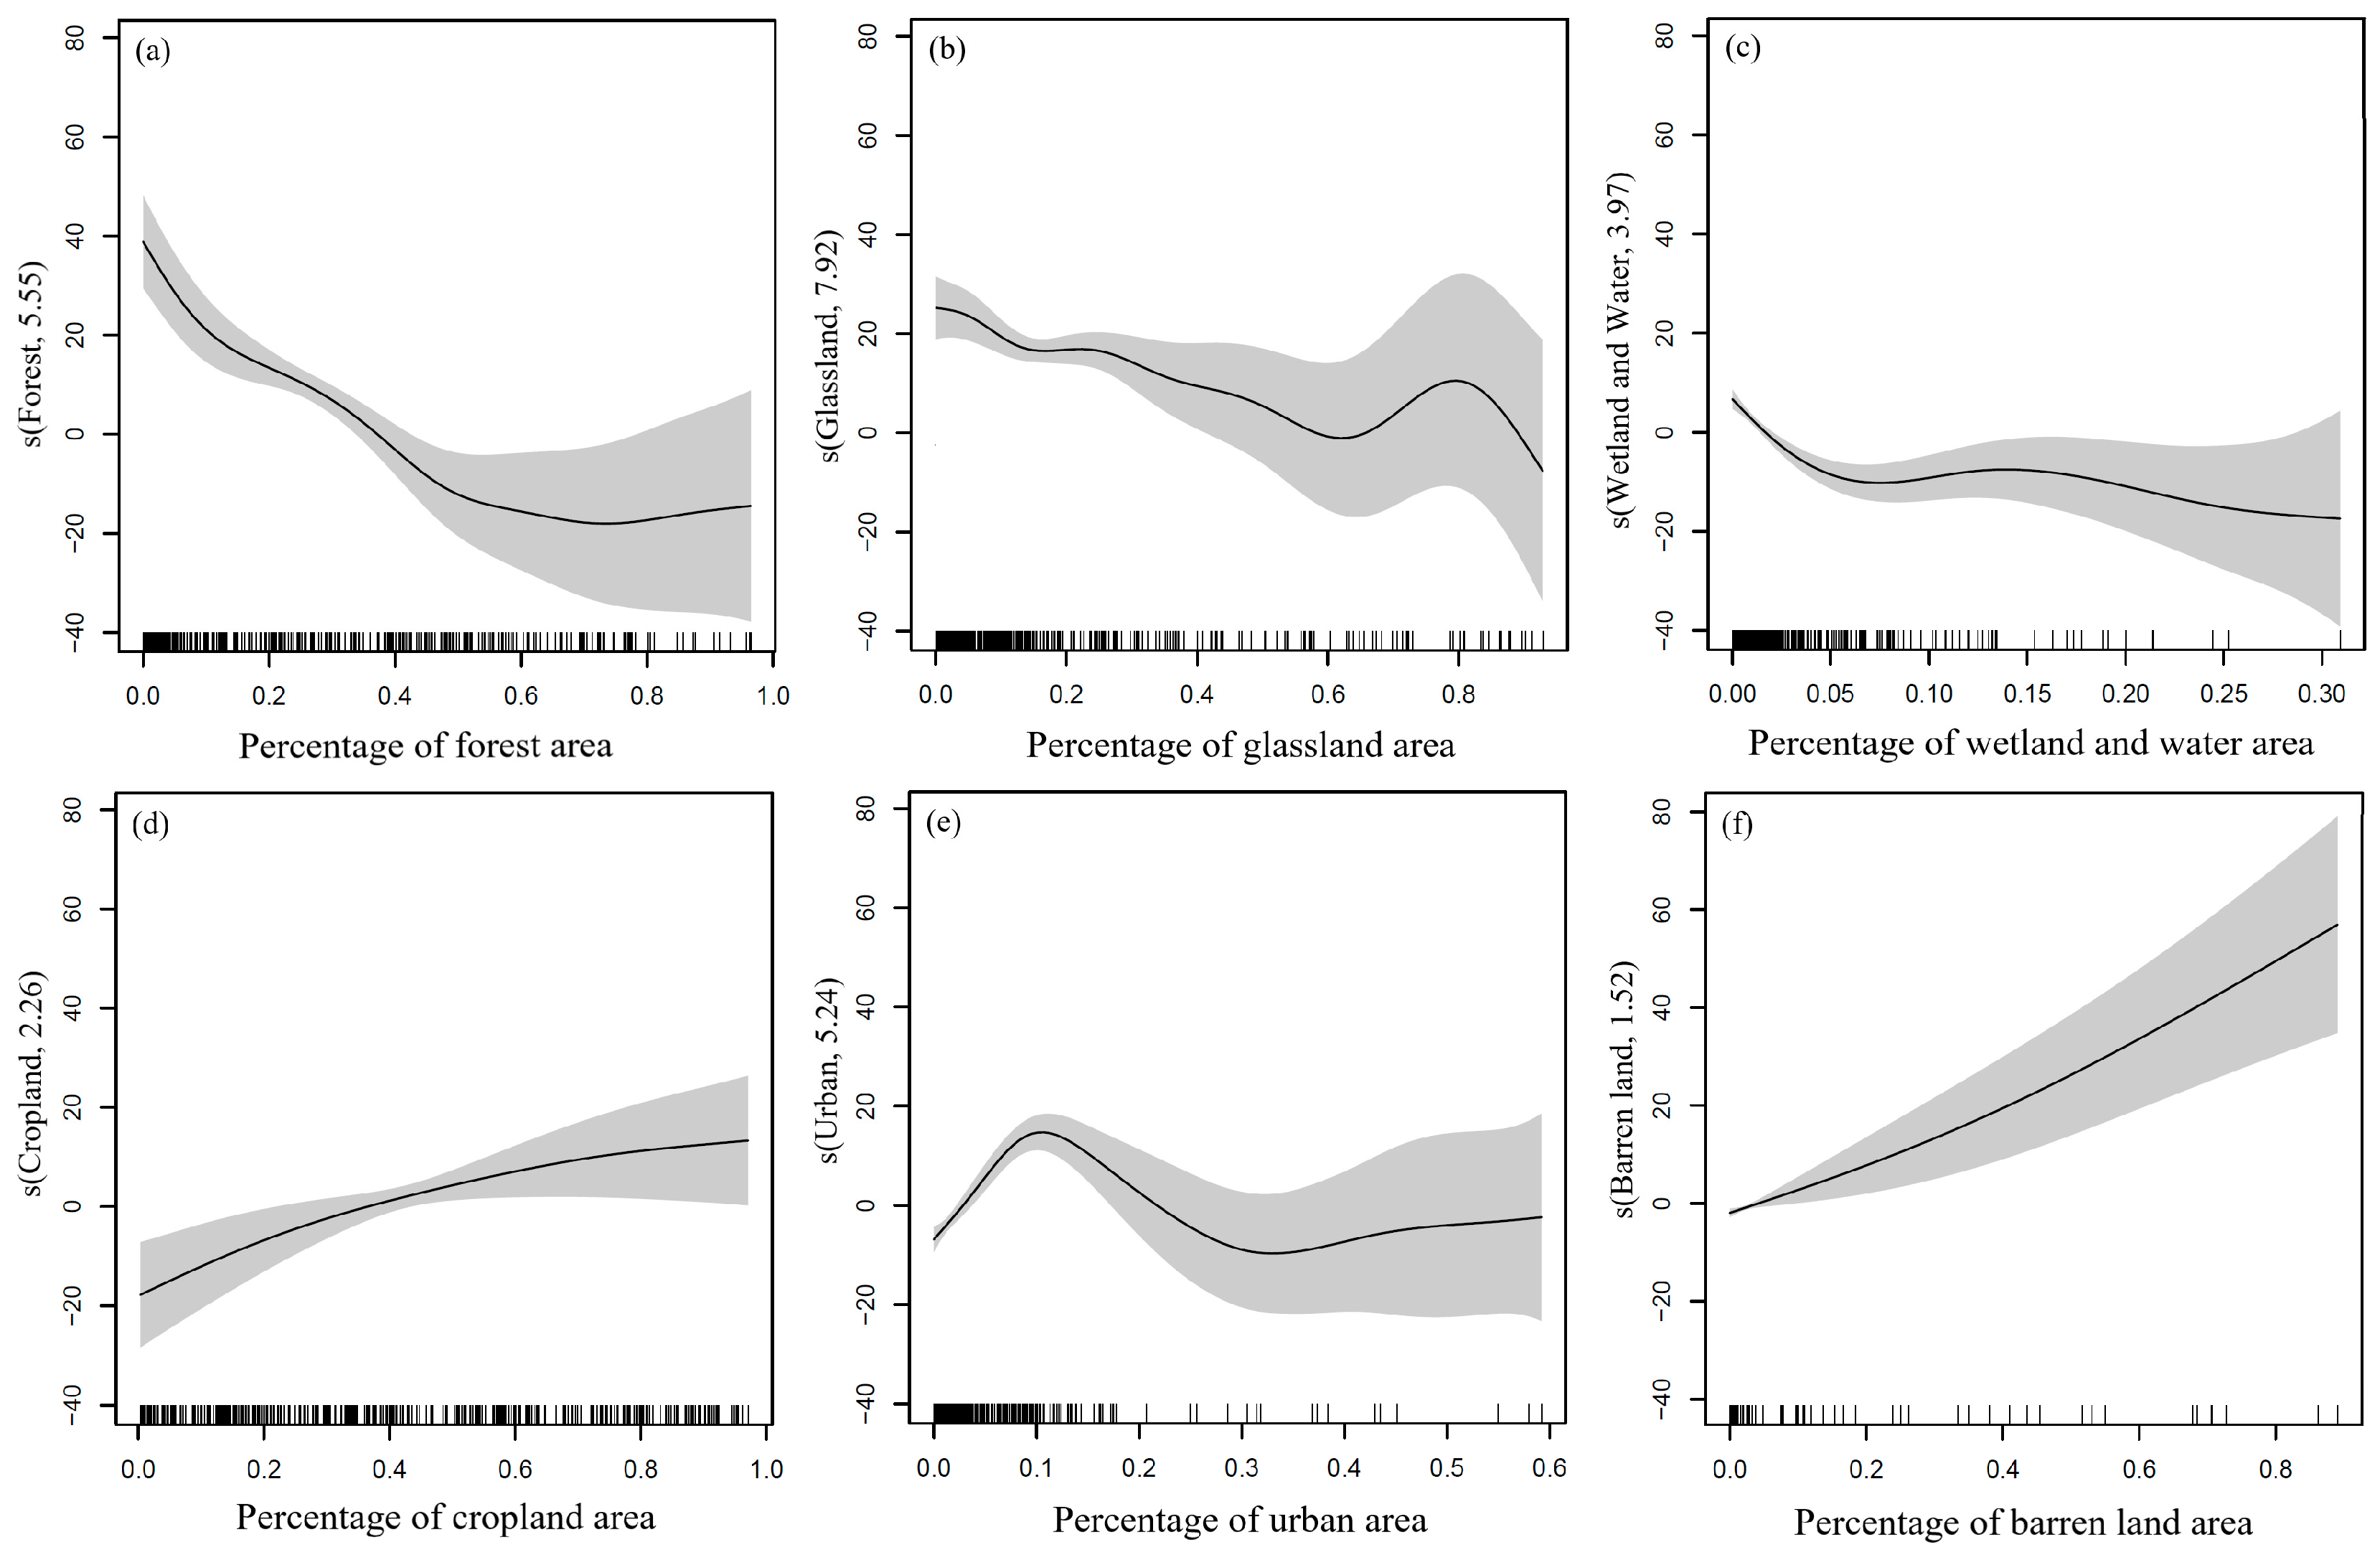
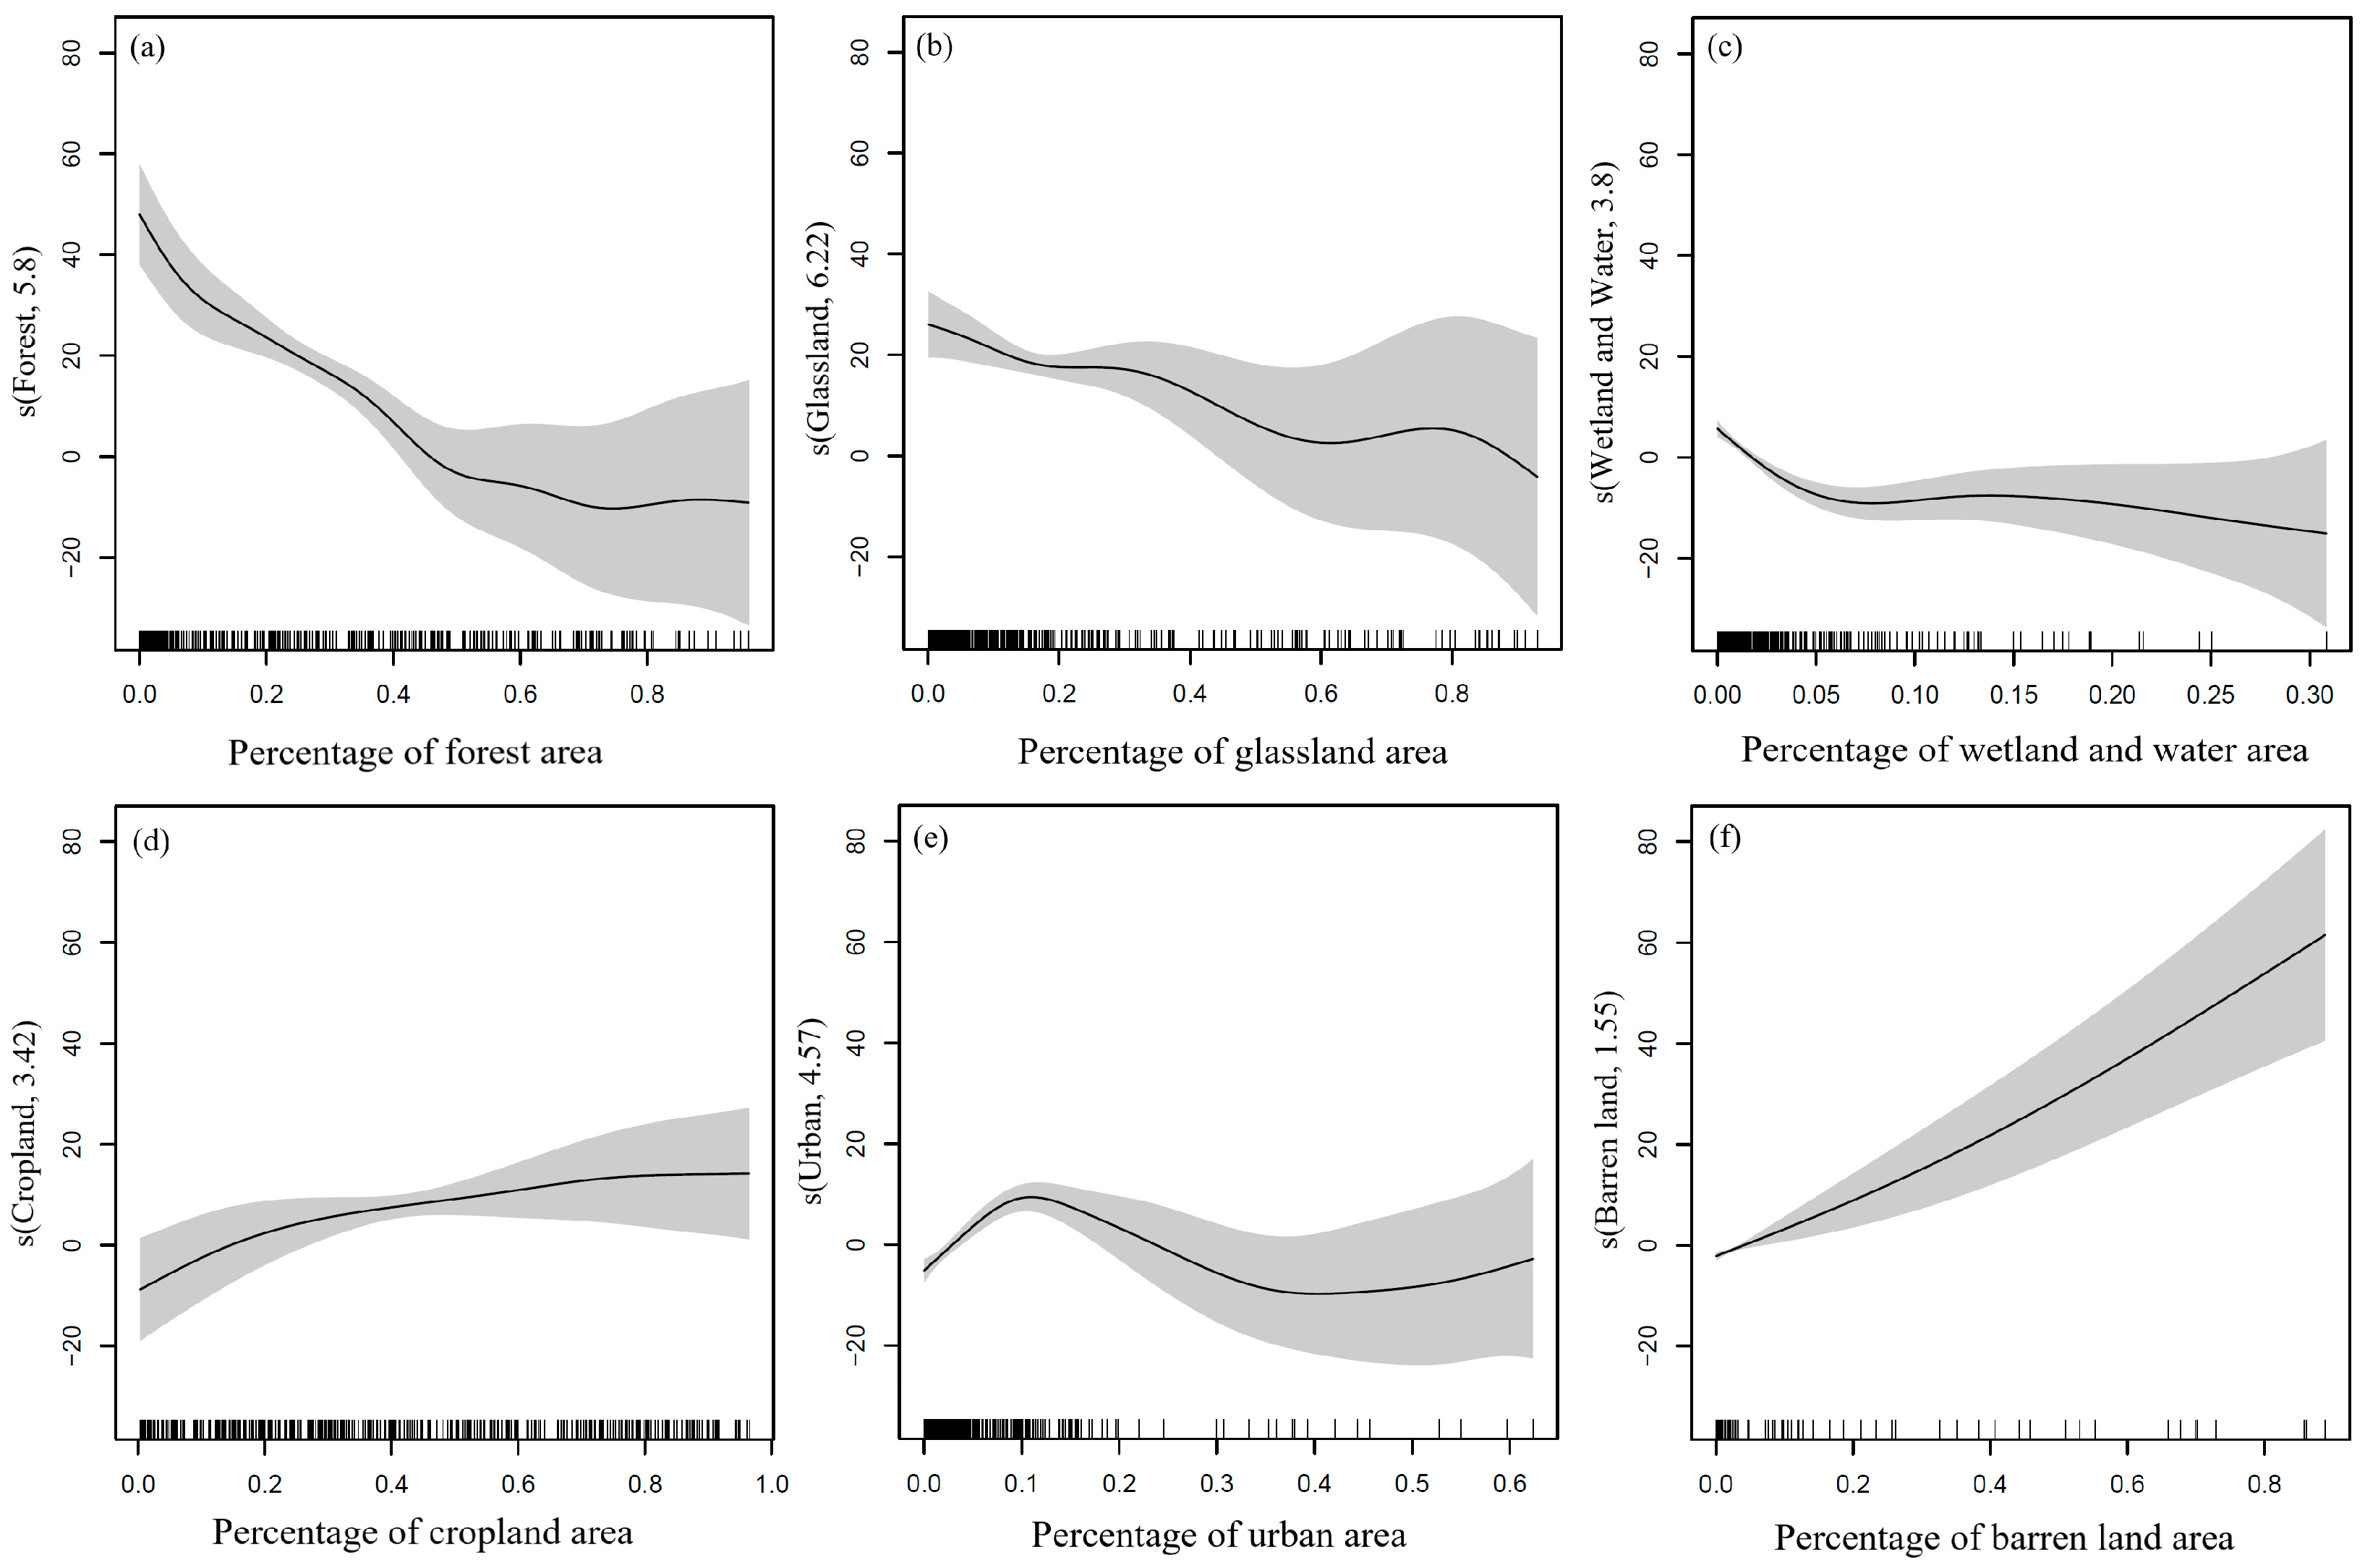
The trend of PM10 concentration changes with variations in the proportion of different land-cover types remains unclear. We plotted the fitted smoothed curves for 2015 and 2021 using the R language with the average PM10 concentration and the proportion of each land-cover type area as the dependent variable and independent variable, respectively (Figure 10 and Figure 11). The proportion of the land-cover type area at all sample points is indicated at the x-axis. It can be observed that in both years, the smooth curve trends between various land-cover types and PM10 were generally similar. This may be due to the limited time span covered by the dataset and the fact that land-cover types in many areas show a relatively stable state during this time, which leads to the similarity of the nonlinear patterns. Forests exhibited a significant inhibitory effect on PM10 concentration changes. Before the proportion of forest area exceeds 60%, the PM10 concentration decreases rapidly as the proportion increases. When it exceeds 60%, it still maintains a certain inhibitory effect, but the effect on the change in the PM10 concentration is not as significant. The inhibitory effect of grasslands is relatively moderate. Changes in wetland and water are also relatively gentle. An increase in cropland land leads to an increase in PM10 concentration. When the proportion of cropland reaches around 40%, the rate of increase in the PM10 concentration is the fastest. As the proportion of cropland continues to increase, the effect on PM10 concentrations levels off. The relationship between urban and PM10 concentration shows an initial increase followed by a decrease as the urban area proportion rises, with the PM10 concentration reaching its peak when the urban area proportion reaches about 10%. The curve also reveals that during urban expansion, the rate of increase in the PM10 concentration exceeds the rate of decrease. The pattern is similar to the environmental Kuznets curve. The environmental Kuznets curve describes the relationship between economic growth and environmental pollution. The curve has an inverted U-shape, representing the rise in environmental pollution with GDP growth in the early stages of economic development and the improvement in environmental quality in the later stages as people become more aware of environmental protection and government environmental policies are implemented. In both years, the degrees of freedom of the fitted curve for barren land were less than two, indicating that the relationship between barren land and PM10 concentration is very close to linear. In desert areas, which are the most important natural sources of PM10 within barren land types, there is a significant trend of increasing PM10 concentration.
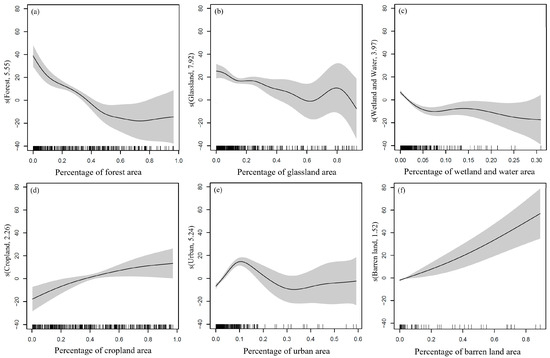
Figure 10.
Nonlinear relationship between PM10 concentrations and land-cover types in 2015. (a) Forest; (b) Glassland; (c) Wetland and Water; (d) Cropland; (e) Urban; (f) Barren land.
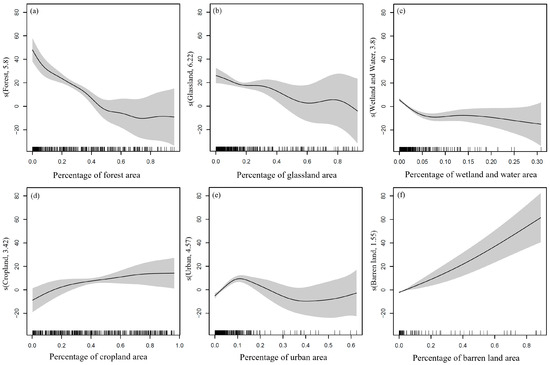
Figure 11.
Nonlinear relationship between PM10 concentrations and land-cover types in 2021. (a) Forest; (b) Glassland; (c) Wetland and Water; (d) Cropland; (e) Urban; (f) Barren land.
4. Discussion
This study focuses on China, analyzing the spatiotemporal variations in PM10, land cover, and the nonlinear relationship between land-cover changes and PM10 concentration changes from 2015 to 2021. There is a strong link between the spatial distribution of PM10 and atmospheric conditions [55]. High temperatures increase convective activity in the atmosphere, which may make PM10 more susceptible to being suspended in the air. High temperatures may also lead to chemical reactions between gases and particulate matter that can generate new PM10 or accelerate the release of PM10. Wind speed and wind direction can determine how much particulate matter is diluted in the atmosphere and the direction in which it is dispersed. Water vapor in the atmosphere can wash particulate matter from the atmosphere and settle it to the ground, thus reducing PM10 concentrations. Overall, in regions such as Xinjiang, western Inner Mongolia, and the northwest of Qinghai and Gansu, the underlying surface is covered by barren land, much of which comprises deserts. Deserts are often characterized by high temperatures and dryness, which leads to increased convective activity in the atmosphere and strong winds, which provide important conditions for the occurrence of dust storms and enrich the sources of PM10 in the atmosphere [56]. Consequently, these regions are subject to severe PM10 pollution throughout the year. In addition, the causes of the high PM10 present in the Beijing–Tianjin–Hebei urban agglomeration and northern Henan Province area are not exactly the same as in the barren land area. It is noteworthy that the main land-cover type in this area is urban. Due to the combination of the barometric pressure system, topography, and seasonal winds, strong northwesterly winds are formed, which bring dust and sand from far away to the Beijing–Tianjin–Hebei region. In addition to this, human activities such as industrial emissions, construction activities, and road dust are also important reasons for the increase in PM10 in the air [57]. However, over a seven-year period, China has seen very significant reductions in PM10 concentrations within many heavily polluted areas. This indicates that the series of environmental protection measures implemented by the Chinese government over the years have played an important role. Examples include the implementation of a series of air pollution prevention and control action plans, adjustment of industrial structure, promotion of clean energy development, and establishment of ecological environment protection policies such as the Three-North Shelter Forest Program [58]. In many of these implemented policies, changes in land-cover types are utilized to alter atmospheric conditions. Measures such as desertification control and the creation of artificial forest belts transform land from barren to grassland or woodland. Additionally, adjustments in industrial structure lead to changes in the spatial pattern and scale of urban areas, thereby effectively controlling pollution source emissions. In the southern region of China, the climate is relatively humid and precipitation is high, which cleanses the atmosphere of particulate matter and allows it to settle to the ground [59]. It is also often influenced by the southeastern monsoon, which carries pollutants from inland areas over the ocean, making the southern region relatively less polluted. In addition to climatic conditions, its lower degree of industrialization, lower population density, and large area of vegetation cover are also important factors in the overall better air quality in the south than in the north.
The results of the nonlinear relationship between land-cover change and PM10 concentration change provide insights for the future development of rational air pollution control policies and land-related policies. Trees, as important dust sinks, have the function of filtering and trapping dust, obstructing the dispersion of particulate matter in the atmosphere through their multi-layered structure, thus producing a certain purification effect [60]. Additionally, vegetated surfaces effectively reduce ground dust and mitigate the risk of resuspension of dust [61,62]. The protection of forested areas and the promotion of sheltered forest projects can have a direct and significant reduction effect on PM10 concentrations. Although grasslands are limited by their canopy structure and cannot achieve the same level of effectiveness as forests, they still possess some air purification capabilities. Furthermore, in many regions of China, grasslands have suffered severe degradation due to climate change, population growth, economic development, overgrazing, and unregulated development. As a result, they have lost their ability to intercept particulate matter and may even become sources of pollution [63]. Therefore, there is also a need to prioritize the restoration of grasslands to prevent further degradation. As one of the world’s major agricultural countries, China has a large rural population base. The occurrence of high concentrations at cropland locations is closely related to the intensity of agricultural activities. During the sowing and harvesting seasons of agricultural production, the soil structure is disturbed, and large amounts of dust and sticky substances are exposed. Driven by the wind, these substances are easily suspended in the air, becoming potential sources of PM10 [64,65]. In addition, agricultural activities involve a series of other factors such as mechanical operations, straw burning, and the use of pesticides and fertilizers, all of which may contribute to PM10 or its precursors as significant dust sources, indicating the potential impact of agricultural activities on air quality [66]. This explains the response of PM10 concentration to changes in cropland area share in the results of the nonlinear relationship well. Usually, moisture in the air tends to absorb and settle particulate matter in the air. The moist environment helps to slow down the suspension time of particulate matter in the air, reducing its concentration. The air humidity is usually higher in the vicinity of wetlands and water bodies, which also creates better conditions for precipitation and increases the likelihood of precipitation. Therefore, areas of high relative humidity and precipitation can have a significant impact on PM10 concentrations [67,68]. However, the nonlinear relationship curve between wetlands and water bodies did not exhibit a significant negative correlation. This may be due to the unique shape and geographical location of inland water bodies; they are susceptible to the influence of nearby particulate matter emissions, especially in areas adjacent to high particulate matter emission sources such as industrial zones and areas with dense traffic pollution. The air quality around water bodies may be significantly affected by the surrounding environment, resulting in high levels of pollution [69], thus making their impact on PM10 concentration largely dependent on the surrounding environment. In developed countries, there is often a negative correlation between urban development and air pollution, due to the fact that in developed countries, there is more capital investment in environmental management and more sophisticated urban planning projects [70]. But China is still in a state of unbalanced and inadequate development, with many regions having relatively low levels of economic development and light environmental pollution. However, as urbanization accelerates, environmental pollution increases from low to high. When the proportion of urban area reaches around 10%, PM10 concentration also reaches its peak. As the level of economic development reaches a certain level, environmental pollution decreases from high to low, and PM10 concentration begins to decrease, ultimately leading to a gradual flattening of the curve as the environmental quality improves [71]. China has invested a great deal of human, material, and financial resources in combating sand and dust storms over the years, and it has indeed achieved remarkable results in terms of the trend of PM10 concentration and land-cover transfer, and it should adhere to the implementation of the relevant policies in the future so as to bring the PM10 concentration up to the qualified standard. In conclusion, the average level of PM10 has a significant positive correlation with the percentage of barren land, cropland, and urban area, but a negative correlation with the proportion of wetland and water, forest, and grassland area. This is consistent with the findings of previous researchers in urban agglomerations in China [17,72].
5. Conclusions
In this study, we established the relationship between ground-based PM10 monitoring stations in China and AOD data obtained from satellite remote sensing. By utilizing the ET model, we achieved the retrieval of PM10 concentration across China, ultimately generating spatio-temporal distribution maps of the annual average PM10 concentration from 2015 to 2021 at a spatial resolution of 1 km. The results indicate that the ET model demonstrates a better estimation accuracy compared to many classical machine-learning models, with final R2, MAE, and RMSE values of 0.878, 5.742 μg/m3, and 8.826 μg/m3, respectively. High values primarily appear in the desert areas of northwest China and the Beijing–Tianjin–Hebei urban agglomeration. Overall, northern regions experience more severe PM10 pollution compared to southern regions. Between 2015 and 2021, significant decreases in PM10 concentration were observed across most regions of China, particularly in northern Xinjiang, western Inner Mongolia, and major urban agglomerations in the eastern region.
There exists a complex nonlinear relationship between land cover and air pollutants. Currently, the response mechanism of PM10 concentration to land-cover types is not well understood. Based on the generated PM10 concentration data and combined with land-cover data, we used the GAM model to investigate the response of PM10 concentration to land-cover types. The PM10 concentration is mainly influenced by forests and barren land, with the PM10 concentration rapidly decreasing with an increasing forest area and increasing at a slower rate with an increasing barren land area. Therefore, efforts directed towards forest conservation and afforestation, as well as desertification control, are crucial for reducing air pollution significantly. Additionally, attention should be given to emission management in agricultural activities and the urbanization process.
In this study, there are also some limitations. For example, in areas with sparse station data in western China, the model estimation results still show some underestimation. In future research, we intend to incorporate more geographical auxiliary factors to improve the accuracy of the model. Additionally, the process influencing the PM10 concentration is highly complex, and its diffusion, migration, and transformation are not solely affected by changes in land-cover types. Factors such as meteorological conditions and indicators of human activity intensity, such as road network density and the proportion of the three major industries in the region, also play a significant role in influencing PM10 concentration changes, which requires further in-depth investigation.
Author Contributions
Conceptualization, X.X. and J.S.; methodology, X.X.; validation, J.H.; formal analysis, J.S.; investigation, X.X.; resources, X.X.; data curation, X.X. and Y.L.; writing—original draft, X.X., J.H. and Y.L.; writing—review and editing, X.X. and J.S.; visualization, J.S.; supervision, J.S.; project administration, J.S.; funding acquisition, J.S. All authors have read and agreed to the published version of the manuscript.
Funding
This research was funded by the Natural Science Foundation of Chongqing (No. CSTB2022NSCQ-MSX0336) and the Special Fund for the Youth Team of Southwest University (No. SWU-XJPY202307).
Data Availability Statement
Data are contained within the article.
Conflicts of Interest
The authors declare no conflicts of interest.
References
- Lin, L.; Gao, T.; Luo, M.; Ge, E.; Yang, Y.; Liu, Z.; Zhao, Y.; Ning, G. Contribution of urbanization to the changes in extreme climate events in urban agglomerations across China. Sci. Total Environ. 2020, 744, 140264. [Google Scholar] [CrossRef] [PubMed]
- Liang, L.; Wang, Z.; Li, J. The effect of urbanization on environmental pollution in rapidly developing urban agglomerations. J. Clean. Prod. 2019, 237, 117649. [Google Scholar] [CrossRef]
- Feng, R.; Zheng, H.; Gao, H.; Zhang, A.; Huang, C.; Zhang, J.; Luo, K.; Fan, J. Recurrent Neural Network and random forest for analysis and accurate forecast of atmospheric pollutants: A case study in Hangzhou, China. J. Clean. Prod. 2019, 231, 1005–1015. [Google Scholar] [CrossRef]
- Li, Y.; Guan, D.; Tao, S.; Wang, X.; He, K. A review of air pollution impact on subjective well-being: Survey versus visual psychophysics. J. Clean. Prod. 2018, 184, 959–968. [Google Scholar] [CrossRef]
- Lambin, E.F.; Turner, B.L.; Geist, H.J.; Agbola, S.B.; Angelsen, A.; Bruce, J.W.; Coomes, O.T.; Dirzo, R.; Fischer, G.; Folke, C. The causes of land-use and land-cover change: Moving beyond the myths. Glob. Environ. Change 2001, 11, 261–269. [Google Scholar] [CrossRef]
- Dewan, A.M.; Yamaguchi, Y.; Ziaur Rahman, M. Dynamics of land use/cover changes and the analysis of landscape fragmentation in Dhaka Metropolitan, Bangladesh. GeoJournal 2012, 77, 315–330. [Google Scholar] [CrossRef]
- Heald, C.; Spracklen, D. Land use change impacts on air quality and climate. Chem. Rev. 2015, 115, 4476–4496. [Google Scholar] [CrossRef] [PubMed]
- Rovira, J.; Domingo, J.; Schuhmacher, M. Air quality, health impacts and burden of disease due to air pollution (PM10, PM2. 5, NO2 and O3): Application of AirQ+ model to the Camp de Tarragona County (Catalonia, Spain). Sci. Total Environ. 2020, 703, 135538. [Google Scholar] [CrossRef] [PubMed]
- Stirnberg, R.; Cermak, J.; Andersen, H. An analysis of factors influencing the relationship between satellite-derived AOD and ground-level PM10. Remote Sens. 2018, 10, 1353. [Google Scholar] [CrossRef]
- Chae, S.; Shin, J.; Kwon, S.; Lee, S.; Kang, S.; Lee, D. PM10 and PM2.5 real-time prediction models using an interpolated convolutional neural network. Sci. Rep. 2021, 11, 11952. [Google Scholar] [CrossRef]
- Song, W.; Jia, H.; Huang, J.; Zhang, Y. A satellite-based geographically weighted regression model for regional PM2.5 estimation over the Pearl River Delta region in China. Remote Sens. Environ. 2014, 154, 1–7. [Google Scholar] [CrossRef]
- You, W.; Zang, Z.; Zhang, L.; Li, Z.; Chen, D.; Zhang, G. Estimating ground-level PM10 concentration in northwestern China using geographically weighted regression based on satellite AOD combined with CALIPSO and MODIS fire count. Remote Sens. Environ. 2015, 168, 276–285. [Google Scholar] [CrossRef]
- Stirnberg, R.; Cermak, J.; Fuchs, J.; Andersen, H. Mapping and understanding patterns of air quality using satellite data and machine learning. J. Geophys. Res. -Atmos. 2020, 125, e2019JD031380. [Google Scholar] [CrossRef]
- Huang, K.; Xiao, Q.; Meng, X.; Geng, G.; Wang, Y.; Lyapustin, A.; Gu, D.; Liu, Y. Predicting monthly high-resolution PM2.5 concentrations with random forest model in the North China Plain. Environ. Pollut. 2018, 242, 675–683. [Google Scholar] [CrossRef] [PubMed]
- Yang, Y.; Wang, Z.; Cao, C.; Xu, M.; Yang, X.; Wang, K.; Guo, H.; Gao, X.; Li, J.; Shi, Z. Estimation of PM2.5 Concentration across China Based on Multi-Source Remote Sensing Data and Machine Learning Methods. Remote Sens. 2024, 16, 467. [Google Scholar] [CrossRef]
- Wang, Z.; Zhou, Y.; Zhao, R.; Wang, N.; Biswas, A.; Shi, Z. High-resolution prediction of the spatial distribution of PM2.5 concentrations in China using a long short-term memory model. J. Clean. Prod. 2021, 297, 126493. [Google Scholar] [CrossRef]
- Huang, D.; He, B.; Wei, L.; Sun, L.; Li, Y.; Yan, Z.; Wang, X.; Chen, Y.; Li, Q.; Feng, S. Impact of land cover on air pollution at different spatial scales in the vicinity of metropolitan areas. Ecol. Indic. 2021, 132, 108313. [Google Scholar] [CrossRef]
- Xian, C.; Zhang, X.; Zhang, J.; Fan, Y.; Zheng, H.; Salzman, J.; Ouyang, Z. Recent patterns of anthropogenic reactive nitrogen emissions with urbanization in China: Dynamics, major problems, and potential solutions. Sci. Total Environ. 2019, 656, 1071–1081. [Google Scholar] [CrossRef] [PubMed]
- Vadrevu, K.; Ohara, T.; Justice, C. Land cover, land use changes and air pollution in Asia: A synthesis. Environ. Res. Lett. 2017, 12, 120201. [Google Scholar] [CrossRef] [PubMed]
- Lai, A.; Liu, Y.; Chen, X.; Chang, M.; Fan, Q.; Chan, P.; Wang, X.; Dai, J. Impact of land-use change on atmospheric environment using refined land surface properties in the Pearl River Delta, China. Adv. Meteorol. 2016, 2016, 3830592. [Google Scholar] [CrossRef]
- Tao, W.; Liu, J.; Ban-Weiss, G.A.; Zhang, L.; Zhang, J.; Yi, K.; Tao, S. Potential impacts of urban land expansion on Asian airborne pollutant outflows. J. Geophys. Res-Atmos. 2017, 122, 7646–7663. [Google Scholar] [CrossRef]
- Sun, L.; Wei, J.; Duan, D.; Guo, Y.; Yang, D.; Jia, C.; Mi, X. Impact of Land-Use and Land-Cover Change on urban air quality in representative cities of China. J. Atmos. Solar -Terr. Phys. 2016, 142, 43–54. [Google Scholar] [CrossRef]
- Yoo, J.-M.; Jeong, M.-J.; Kim, D.; Stockwell, W.R.; Yang, J.-H.; Shin, H.-W.; Lee, M.-I.; Song, C.-K.; Lee, S.-D. Spatiotemporal variations of air pollutants (O3, NO2, SO2, CO, PM10, and VOCs) with land-use types. Atmos. Chem. Phys. 2015, 15, 10857–10885. [Google Scholar] [CrossRef]
- Yang, X.; Zheng, Y.; Geng, G.; Liu, H.; Man, H.; Lv, Z.; He, K.; de Hoogh, K. Development of PM2.5 and NO2 models in a LUR framework incorporating satellite remote sensing and air quality model data in Pearl River Delta region, China. Environ. Pollut. 2017, 226, 143–153. [Google Scholar] [CrossRef] [PubMed]
- Viana, M.; Hammingh, P.; Colette, A.; Querol, X.; Degraeuwe, B.; de Vlieger, I.; Van Aardenne, J. Impact of maritime transport emissions on coastal air quality in Europe. Atmos. Environ. 2014, 90, 96–105. [Google Scholar] [CrossRef]
- Liu, J.; Yan, G.; Wu, Y.; Wang, Y.; Zhang, Z.; Zhang, M. Wetlands with greater degree of urbanization improve PM2.5 removal efficiency. Chemosphere 2018, 207, 601–611. [Google Scholar] [CrossRef] [PubMed]
- Bao, R.; Zhang, A. Does lockdown reduce air pollution? Evidence from 44 cities in northern China. Sci. Total Environ. 2020, 731, 139052. [Google Scholar] [CrossRef] [PubMed]
- Yousefi, R.; Shaheen, A.; Wang, F.; Ge, Q.; Wu, R.; Lelieveld, J.; Wang, J.; Su, X. Fine particulate matter (PM2.5) trends from land surface changes and air pollution policies in China during 1980–2020. J. Environ. Manag. 2023, 326, 116847. [Google Scholar] [CrossRef] [PubMed]
- Bertazzon, S.; Johnson, M.; Eccles, K.; Kaplan, G.G. Accounting for spatial effects in land use regression for urban air pollution modeling. Spat. Spatio-Temporal Epidemiol. 2015, 14, 9–21. [Google Scholar] [CrossRef] [PubMed]
- Li, L.; Wu, J.; Ghosh, J.K.; Ritz, B. Estimating spatiotemporal variability of ambient air pollutant concentrations with a hierarchical model. Atmos. Environ. 2013, 71, 54–63. [Google Scholar] [CrossRef] [PubMed]
- Chen, M.; Dai, F.; Yang, B.; Zhu, S. Effects of neighborhood green space on PM2.5 mitigation: Evidence from five megacities in China. Build. Environ. 2019, 156, 33–45. [Google Scholar] [CrossRef]
- Li, H.; Zhang, H.; Li, Q.; Zhao, J.; Guo, X.; Ying, H.; Wang, S. Vegetation productivity dynamics in response to climate change and human activities under different topography and land cover in Northeast China. Remote Sens. 2021, 13, 975. [Google Scholar] [CrossRef]
- Lyapustin, A.; Wang, Y.; Korkin, S.; Huang, D. MODIS collection 6 MAIAC algorithm. Atmos. Meas. Tech. 2018, 11, 5741–5765. [Google Scholar] [CrossRef]
- Xu, Y.; Xue, W.; Lei, Y.; Huang, Q.; Zhao, Y.; Cheng, S.; Ren, Z.; Wang, J. Spatiotemporal variation in the impact of meteorological conditions on PM2.5 pollution in China from 2000 to 2017. Atmos. Environ. 2020, 223, 117215. [Google Scholar] [CrossRef]
- Hersbach, H.; Bell, B.; Berrisford, P.; Biavati, G.; Horányi, A.; Muñoz Sabater, J.; Nicolas, J.; Peubey, C.; Radu, R.; Rozum, I. ERA5 monthly averaged data on single levels from 1979 to present. Copernic. Clim. Change Serv. (C3S) Clim. Data Store (CDS) 2019, 10, 252–266. [Google Scholar]
- Gelaro, R.; McCarty, W.; Suárez, M.J.; Todling, R.; Molod, A.; Takacs, L.; Randles, C.A.; Darmenov, A.; Bosilovich, M.G.; Reichle, R. The modern-era retrospective analysis for research and applications, version 2 (MERRA-2). J. Clim. 2017, 30, 5419–5454. [Google Scholar] [CrossRef] [PubMed]
- Zhao, S.; Liu, S.; Hou, X.; Beazley, R.; Sun, Y. Identifying the contributions of multiple driving forces to PM10–2.5 pollution in urban areas in China. Sci. Total Environ. 2019, 663, 361–368. [Google Scholar] [CrossRef] [PubMed]
- Tatem, A.J. WorldPop, open data for spatial demography. Sci. Data 2017, 4, 1–4. [Google Scholar] [CrossRef] [PubMed]
- Sulla-Menashe, D.; Gray, J.M.; Abercrombie, S.P.; Friedl, M.A. Hierarchical mapping of annual global land cover 2001 to present: The MODIS Collection 6 Land Cover product. Remote Sens. Environ. 2019, 222, 183–194. [Google Scholar] [CrossRef]
- Geurts, P.; Ernst, D.; Wehenkel, L. Extremely randomized trees. Mach. Learn. 2006, 63, 3–42. [Google Scholar] [CrossRef]
- Segal, M.R. Machine Learning Benchmarks and Random Forest Regression; Kluwer Academic Publishers: Dordrecht, The Netherlands, 2004. [Google Scholar]
- Hastie, T.; Tibshirani, R. Generalized additive models: Some applications. J. Am. Stat. Assoc. 1987, 82, 371–386. [Google Scholar] [CrossRef]
- Rodriguez, J.D.; Perez, A.; Lozano, J.A. Sensitivity analysis of k-fold cross validation in prediction error estimation. IEEE T. Pattern Anal. 2009, 32, 569–575. [Google Scholar] [CrossRef]
- Chen, G.; Wang, Y.; Li, S.; Cao, W.; Ren, H.; Knibbs, L.D.; Abramson, M.J.; Guo, Y. Spatiotemporal patterns of PM10 concentrations over China during 2005–2016: A satellite-based estimation using the random forests approach. Environ. Pollut. 2018, 242, 605–613. [Google Scholar] [CrossRef] [PubMed]
- Zhang, T.; Gong, W.; Zhu, Z.; Sun, K.; Huang, Y.; Ji, Y. Semi-physical estimates of national-scale PM10 concentrations in China using a satellite-based geographically weighted regression model. Atmosphere 2016, 7, 88. [Google Scholar] [CrossRef]
- Zhang, Z.; Wang, J.; Hart, J.E.; Laden, F.; Zhao, C.; Li, T.; Zheng, P.; Li, D.; Ye, Z.; Chen, K. National scale spatiotemporal land-use regression model for PM2.5, PM10 and NO2 concentration in China. Atmos. Environ. 2018, 192, 48–54. [Google Scholar] [CrossRef]
- Wei, J.; Li, Z.; Xue, W.; Sun, L.; Fan, T.; Liu, L.; Su, T.; Cribb, M. The ChinaHighPM10 dataset: Generation, validation, and spatiotemporal variations from 2015 to 2019 across China. Environ. Int. 2021, 146, 106290. [Google Scholar] [CrossRef] [PubMed]
- Liu, H.; Cui, W.; Zhang, M. Exploring the causal relationship between urbanization and air pollution: Evidence from China. Sustain. Cities Soc. 2022, 80, 103783. [Google Scholar] [CrossRef]
- Davidson, N. How much wetland has the world lost? Long-term and recent trends in global wetland area. Mar. Freshwater Res. 2014, 65, 934–941. [Google Scholar] [CrossRef]
- Wang, S.; Bai, X.; Zhang, X.; Reis, S.; Chen, D.; Xu, J.; Gu, B. Urbanization can benefit agricultural production with large-scale farming in China. Nat. Food 2021, 2, 183–191. [Google Scholar] [CrossRef] [PubMed]
- Jiao, L.; Dong, T.; Xu, G.; Zhou, Z.; Liu, J.; Liu, Y. Geographic micro-process model: Understanding global urban expansion from a process-oriented view. Comput. Environ. Urban Syst. 2021, 87, 101603. [Google Scholar] [CrossRef]
- Bhaskar, A.; Chandra, J.; Hashemi, H.; Butler, K.; Bennett, L.; Cellini, J.; Braun, D.; Dominici, F. A literature review of the effects of air pollution on COVID-19 health outcomes worldwide: Statistical challenges and data visualization. Annu. Rev. Public Health 2023, 44, 1–20. [Google Scholar] [CrossRef] [PubMed]
- Barua, S.; Nath, S.D. The impact of COVID-19 on air pollution: Evidence from global data. J. Clean. Prod. 2021, 298, 126755. [Google Scholar] [CrossRef]
- Liang, P.; Chen, B.; Yang, X.; Liu, Q.; Li, A.; Mackenzie, L.; Zhang, D. Revealing the dust transport processes of the 2021 mega dust storm event in northern China. Sci. Bull. 2021, 67, 21–24. [Google Scholar] [CrossRef] [PubMed]
- Dilawar, A.; Chen, B.; Ul-Haq, Z.; Ali, S.; Sajjad, M.; Fang, J.; Gemechu, T.; Guo, M.; Dilawar, H.; Zhang, H.; et al. Evaluating the potential footprints of land use and land cover and climate dynamics on atmospheric pollution in Pakistan. Front. Environ. Sci. 2024, 11, 1272155. [Google Scholar] [CrossRef]
- Liu, Y.; Wang, G.; Hu, Z.; Shi, P.; Lyu, Y.; Zhang, G.; Gu, Y.; Liu, Y.; Hong, C.; Guo, L. Dust storm susceptibility on different land surface types in arid and semiarid regions of northern China. Atmos. Res. 2020, 243, 105031. [Google Scholar] [CrossRef]
- Karagulian, F.; Belis, C.A.; Dora, C.F.C.; Prüss-Ustün, A.M.; Bonjour, S.; Adair-Rohani, H.; Amann, M. Contributions to cities’ ambient particulate matter (PM): A systematic review of local source contributions at global level. Atmos. Environ. 2015, 120, 475–483. [Google Scholar] [CrossRef]
- Wang, P. China’s air pollution policies: Progress and challenges. Curr. Opin. Environ. 2021, 19, 100227. [Google Scholar] [CrossRef]
- Elminir, H. Dependence of urban air pollutants on meteorology. Sci. Total Environ. 2005, 350, 225–237. [Google Scholar] [CrossRef] [PubMed]
- Diener, A.; Mudu, P. How can vegetation protect us from air pollution? A critical review on green spaces’ mitigation abilities for air-borne particles from a public health perspective-with implications for urban planning. Sci. Total Environ. 2021, 796, 148605. [Google Scholar] [CrossRef] [PubMed]
- Zhao, Y.; Xin, Z.; Ding, G. Spatiotemporal variation in the occurrence of sand-dust events and its influencing factors in the Beijing-Tianjin Sand Source Region, China, 1982–2013. Reg. Environ. Change 2018, 18, 2433–2444. [Google Scholar] [CrossRef]
- Darvishi Boloorani, A.; Soleimani, M.; Papi, R.; Neysani Samany, N.; Teymouri, P.; Soleimani, Z. Sources, drivers, and impacts of sand and dust storms: A global view. In Dust and Health: Challenges and Solutions; Springer: Berlin/Heidelberg, Germany, 2023; pp. 31–49. [Google Scholar] [CrossRef]
- Feng, K.; Wang, T.; Liu, S.; Kang, W.; Chen, X.; Guo, Z.; Zhi, Y. Monitoring desertification using machine-learning techniques with multiple indicators derived from MODIS images in Mu Us Sandy Land, China. Remote Sens. 2022, 14, 2663. [Google Scholar] [CrossRef]
- Bauer, S.E.; Tsigaridis, K.; Miller, R. Significant atmospheric aerosol pollution caused by world food cultivation. Geophys. Res. Lett. 2016, 43, 5394–5400. [Google Scholar] [CrossRef]
- Punsompong, P.; Chantara, S. Identification of potential sources of PM10 pollution from biomass burning in northern Thailand using statistical analysis of trajectories. Atmos. Pollut. Res. 2018, 9, 1038–1051. [Google Scholar] [CrossRef]
- Maffia, J.; Dinuccio, E.; Amon, B.; Balsari, P. PM emissions from open field crop management: Emission factors, assessment methods and mitigation measures–A review. Atmos. Environ. 2020, 226, 117381. [Google Scholar] [CrossRef]
- Csavina, J.; Field, J.; Félix, O.; Corral-Avitia, Y.; Sáez, E.; Betterton, A. Effect of wind speed and relative humidity on atmospheric dust concentrations in semi-arid climates. Sci. Total Environ. 2014, 487, 82–90. [Google Scholar] [CrossRef] [PubMed]
- Qu, W.; Wang, J.; Zhang, X.; Wang, D.; Sheng, L. Influence of relative humidity on aerosol composition: Impacts on light extinction and visibility impairment at two sites in coastal area of China. Atmos. Res. 2015, 153, 500–511. [Google Scholar] [CrossRef]
- Li, J.; Song, Y.; Mao, Y.; Mao, Z.; Wu, Y.; Li, M.; Huang, X.; He, Q.; Hu, M. Chemical characteristics and source apportionment of PM2.5 during the harvest season in eastern China’s agricultural regions. Atmos. Environ. 2014, 92, 442–448. [Google Scholar] [CrossRef]
- Wang, S.; Gao, S.; Li, S.; Feng, K. Strategizing the relation between urbanization and air pollution: Empirical evidence from global countries. J. Clean. Prod. 2020, 243, 118615. [Google Scholar] [CrossRef]
- Apergis, N.; Ozturk, I. Testing environmental Kuznets curve hypothesis in Asian countries. Ecol. Indic. 2015, 52, 16–22. [Google Scholar] [CrossRef]
- Zou, B.; Xu, S.; Sternberg, T.; Fang, X. Effect of land use and cover change on air quality in urban sprawl. Sustainability 2016, 8, 677. [Google Scholar] [CrossRef]

Disclaimer/Publisher’s Note: The statements, opinions and data contained in all publications are solely those of the individual author(s) and contributor(s) and not of MDPI and/or the editor(s). MDPI and/or the editor(s) disclaim responsibility for any injury to people or property resulting from any ideas, methods, instructions or products referred to in the content. |
© 2024 by the authors. Licensee MDPI, Basel, Switzerland. This article is an open access article distributed under the terms and conditions of the Creative Commons Attribution (CC BY) license (https://creativecommons.org/licenses/by/4.0/).