Article

Offshore Wind Farms and Tourism Development Relationship to Energy Distribution Justice for the Beibu Gulf, China

School of Public Administration, Guangxi University, Nanning 530004, China
*
Author to whom correspondence should be addressed.
Land 2024, 13(5), 678; https://doi.org/10.3390/land13050678
Submission received: 15 April 2024 / Revised: 30 April 2024 / Accepted: 10 May 2024 / Published: 13 May 2024

Abstract

:
Energy distribution justice is of primary concern within the energy justice framework and it is crucial to increase public acceptance of offshore wind energy and further advance its development. The rapid development of offshore wind energy in China has inevitably impacted the livelihoods of coastal vulnerable groups (CVGs) engaged in fisheries and tourism in the coastal zone. While current policies often compensate for livelihood losses through cash payments, the fiscal strain caused by COVID-19 renders this approach unsustainable. Consequently, this research pioneers the exploration of Chinese tourist groups’ landscape preferences towards offshore wind farms (OWFs). This study proposes a new approach to enhance OWF landscapes for tourism development, thereby balancing the distribution of costs and benefits between CVGs and tourists. The research focuses on Beihai City in the Beibu Gulf Economic Region, utilizing a combination of Q-methodology and choice experiments that incorporates cut-offs. Answers to eighty Q-methodology questionnaires and 1324 choice experiment questionnaires are obtained. The findings indicate that this region can achieve energy distribution justice by compensating for the livelihood losses of CVGs through tourism. Contrary to traditional assumptions about wind farm noise preferences, Chinese tourists prefer proximity to OWFs, as an appropriate coastal acoustics landscape can enhance their tourism experience. In light of these findings, this paper presents policy recommendations towards energy distribution justice.

1. Introduction

By 2021, China’s offshore wind energy had amassed an installation capacity exceeding 26 GW, ranking first in the world [1]. While offshore wind energy contributes to the development of clean energy, it has also resulted in energy injustices, including cost–benefit imbalances and imbalances in space allocations. As the world’s largest developing country, China’s approach to achieving energy justice in the expansion of offshore wind energy critically influences the acceptance of offshore wind farms (OWFs) by stakeholders [2,3]. The utilized approach is also vital for the welfare of 1.4 billion people, including coastal vulnerable groups (CVGs) and tourists nationwide. Distributive justice, a key goal of recognition and procedural justice, is of paramount concern in energy justice [4,5,6].
Energy injustices, mainly related to landscape degradation and livelihood losses, are the reason why CVGs often resist OWFs [7,8,9]. To still achieve energy distribution justice, current energy policies typically compensate for these losses through measures such as financial compensation, electricity fee reductions, community welfare funds, and joint ownership [10,11,12]. However, these modes of compensation are perceived by CVGs as evidence of the high negative externalities of OWFs, thus further diminishing their willingness to accept them [13]. As a result of the COVID-19 pandemic, economies worldwide are facing fiscal challenges [14,15], limiting their ability to provide large-scale compensations for OWFs and hindering the further advancement of offshore wind energy. For both governments and businesses, compensation implies higher costs [16,17,18]. In today’s post-pandemic era, realizing distributive justice for offshore wind energy urgently requires a new avenue for loss compensation.
The impact of OWFs on tourism remains an unresolved issue to date. Different groups may perceive the externalities of OWFs differently, and a landscape that may appear negative to CVGs are potentially attractive to tourists [19]. Moreover, according to the exposure cumulative effect [20], tourists’ short-term exposure to such externalities may not equate to the long-term exposure of residents, offering a potential route for compensating the losses of CVGs through tourism and achieving distributive justice through this pathway. Existing research primarily focused on developed countries and regions such as Europe and the USA [21]. Most relevant studies suggest that an OWF landscape could harm tourism, recommending that they should be located further out to sea, far from coastlines [22,23,24]. However, it has also been suggested that the impact on tourism is neutral, or may even be positive [25,26]. Nevertheless, how OWFs landscape influence tourism in developing countries such as China and whether these countries can simultaneously achieve both the development of clean energy infrastructure and energy distributive justice is still underexplored.
This study aims to address the two following research questions: (1) Can the tourism landscape development of OWFs effectively contribute to energy distribution justice? (2) What are the factors that affect the realization of distributive justice in offshore wind energy? To address these two questions, this paper presents two Q-methodology studies and two choice experiment studies. The Q-methodology studies are used to derive the attributes for the choice experiments, ensuring that the attributes considered are of the utmost concern to both CVGs and tourist groups. The two-choice experiment studies are employed to measure the marginal willingness to accept (MWTA) and marginal willingness to pay (MWTP) of both CVGs and tourist groups. In assessing the MWTP of tourist groups, cut-offs are incorporated to enhance measurement accuracy. Based on these four studies, this paper answers the two questions posed and offers pertinent policy recommendations to achieve energy distributive justice. This paper is structured as follows: Section 2 presents a literature review on energy distributive justice, CVGs, the impact of OWFs on tourism, and the modified choice experiment. Section 3 introduces the research area, the Q-methodology, the modified choice experiment method and model selection, as well as data sources and methodologies including the design of choice experiments. Section 4 details the results of the choice experiments, followed by Section 5 and Section 6, which present the discussion and conclusion of this paper, respectively.

2. Literature Review

2.1. Energy Distribution Justice

Energy distributive justice is the element most focused on within energy justice research, and it is key to addressing energy poverty [27]. Among the three principles of energy justice—distributive justice, procedural justice, and recognition justice—injustices in recognition and decision-making processes exacerbate unfairness in distribution [6,28,29,30,31].
How can energy distribution justice be achieved? Current research focuses on the four following aspects: cost allocation, benefit allocation, space allocation, and energy acquisition. In OWF projects, acquiring economic benefits can effectively enhance the acceptance of wind energy facilities by citizens [32,33,34]. However, the contrast between negative externalities such as noise and landscape damage imposed on local areas, and the outward flow of most income and economic benefits to non-local participants, is a key reason why citizens often resist OWFs [11,35]. Thus, equitable allocation of costs and benefits is of primary concern towards increasing OWF acceptance and achieving distributive justice [5,36]. Additionally, since the introduction of the concept of spatial justice into the field of energy justice [37], research has shown that the public prefers the consumption of electricity near its place of production, leading to regionalism and further emphasizing geographical disparities in energy poverty [38]. Finally, low-cost access to energy services is often used to offset the negative externalities of energy facilities and enhance community acceptance [33,39]. This is an inherent part of energy distributive justice.

2.2. Coastal Vulnerable Groups

In coastal fishing communities, CVGs are pivotal participants for achieving energy justice. The coastal ecosystem, which is fragile and unstable, is predominantly inhabited by fishermen who are engaged in fishing and marine tourism. Their livelihoods are heavily reliant on the local marine environment, making them highly susceptible to coastal disasters, climate change [40,41,42,43], and human activities that alter this ecosystem [41,44,45,46,47]. Recent advancements in offshore energy projects, especially the development and construction of OWFs, have sparked competition for livelihood resources among CVGs, thus further exacerbating the fragility of this ecosystem [48,49,50,51]. Residents living near wind turbines are particularly prone to the externalities of energy facilities [3,13]. Unlike developed areas such as Europe and the USA, which focus on the destruction of landscape aesthetics, developing countries such as China place greater emphasis on the impacts on farmers’ livelihoods [51,52,53].
Coastal fishing communities in China have optimized their household livelihood structures through tourism models such as “Fisherman’s Family Tourism”, thus enhancing family income and reducing vulnerability [54]. However, this will inevitably be affected by the externalities of OWFs, and the closer the Fisherman’s Family Tourism operator is to the coastal zone, the greater the impact (vision, noise, etc.), as tourists are often willing to rent accommodation closer to the coast in order to reduce their transportation costs [47,54].

2.3. Impact of Offshore Wind Farms on Tourism

Tourism is a substantial source of revenue for coastal nations and regions, with global earnings amounting to billions of dollars. In today’s post-pandemic era, the previously suppressed potential of tourism is gradually being unlocked [55,56], wind energy facilities are predominantly located in areas of scenic beauty [57]. Thus, examining the relationship between OWFs and the tourism industry, as well as tourists’ actual preferences towards OWFs, is of vital importance for the further development of marine wind energy.
The impact of OWFs on tourism, whether positive or negative, remains a subject of debate. Research focusing on the negative aspects often centers on the construction distance and layout of OWFs. Such research argues that OWFs should be built far from the coast to reduce their visual and acoustic impact, although this substantially increases energy costs. Meanwhile, OWFs have two opposing views of the vacation rental market. A stated preference study in coastal North Carolina showed that rental value losses are likely to be as high as 10% when OWFs are within eight miles of the coast [8], but Block Island’s difference-in-differences study found that OWF construction significantly increased nightly bookings, occupancy, and monthly income [58]. Regarding layout, certain scholars suggested that, to minimize ecological damage and maintain local community attachment to the coastline, protected areas and scenic islands that provide recreational services should be avoided. However, such avoidance limits the tourism potential [59]. Other researchers posited that wind energy facilities can enhance recreational fishing and that OWFs, as novel landscapes, provide an appealing aspect [25,60,61,62]. As offshore wind technology advances and tourists’ prior experience with OWFs increases, tourists are likely to pay more for locations where they can see the turbines [63]. The negative impacts of OWFs on the tourism industry will become more manageable and, with the help of certain management measures, will gradually turn into positive impacts [21].
When analyzing the causes underlying the heterogeneous outcomes observed, group characteristics and blurred boundaries between tourists and the general public emerge as decisive factors. Studies have shown that the acceptance of offshore wind projects varies across age groups. For instance, Vanja Westerberg et al. (2013) employed a latent class logit to examine the impact of socio-economic characteristics on OWF preferences; they found that younger tourists exhibited higher acceptance than older tourists [26]. This finding has been echoed by several other studies [64,65]. Additionally, factors such as energy preferences, the urgency of climate issues, and the coherence of environmental policies have been incorporated as explanatory variables in tourists’ choice of destination, thereby imposing excessive moral elements on these choices [66,67]. Tourists primarily focus on the travel experience [68,69]; therefore, placing energy-related topics at the forefront of interviews or surveys can distort the identity of respondents, commonly leading to an underestimation of their welfare level. Current studies may also overestimate the overall welfare level. For example, treating the general public as tourists overlooks the gap between contingent and actual behaviors [24]. Not all tourists who express a preference for OWFs will also visit beaches, as this behavior is influenced by subjective, economic, and physiological factors [68]. Such imprecision in measuring tourist welfare levels impacts the assessment of the effect of OWFs on tourism in the existing literature.
Broadly speaking, current studies demonstrate ambiguity between tourists and the broader populace and tend to explore tourism compartmentalized. Neither positive nor negative stances have formulated a balanced pathway for distributing externalities concerning the effects of OWFs.

2.4. Modified Choice Experiment

The assessment of justice in energy distribution relies on comparing the overall MWTA and MWTP of CVGs and tourist groups. As a form of stated preference method, choice experiments offer the advantage of simulating real decision-making processes, and evaluating both preferences and trade-offs. This approach is extensively applied in fields such as product pricing, healthcare, and natural resource management.
The choice of attributes in choice experimental designs influences the overall measure of MWTA and MWTP. Scholars from developed countries have systematically reviewed the externalities of OWFs [70]. However, the prioritization of these externalities and the focus on these externalities in developing countries such as China remains unexplored. Selecting the attributes most valued by respondents becomes a critical factor for determining the scientific rigor of choice experiments. Current choice experimental studies primarily derive attributes from literature reviews, interviews, and surveys. Yet, these methods may be influenced by the subjectivity of researchers, thus introducing uncertainty [71].
The Q-methodology can circumvent this uncertainty in the attribute selection of traditional choice experiments. Compared with traditional attribute selection methods, the Q-methodology employs rigorous quantitative examination, providing objective analysis and understanding of subjective communication, and resulting in more impartial and objective research outcomes obtained through data analysis [72,73]. Additionally, the Q-methodology scientifically categorizes and ranks the viewpoints of stakeholders, comprehends their behaviors, and delves into subjective preferences. Ultimately, the Q-methodology generates representative research results that are aligned with the genuine psychology of stakeholders, thus overcoming the uncertainty of attribute selection [74,75].
Choice experiments present respondents with a series of decision scenarios and derive preference information based on their selections. However, when confronted with extensive choice data, limited by cognitive capacities, respondents frequently resort to non-compensatory strategies to reduce decision-making costs [76]. Traditional choice models that are grounded in linear compensatory principles do not account for the likelihood of respondents using non-compensatory strategies, possibly compromising the accuracy of estimation outcomes. Given this logic, Swait proposed to incorporate respondents’ attribute cut-offs into the analysis [77]. While cut-offs in choice experiments concerning the externalities of renewable energy facility landscapes have been integrated [78], such considerations are absent in OWF research, which could affect the precision of choice experiment measurements.
In general, the current choice experiment research on OWFs has two problems: the selection of scheme attributes is highly arbitrary, and the accuracy of experimental measurements needs to be improved. To address these issues, this paper employs the Q-methodology to define the scheme attributes and incorporate cut-offs in the choice experiments.

3. Data Sources and Research Methods

3.1. Overview of the Research Area

This study focuses on Beihai City in the Beibu Gulf Economic Region (BGER), which is located in the South China Sea and neighbors the countries of the Association of South East Asian Nations (see Figure 1). This region is one of China’s least developed coastal regions. Moreover, this region is also the starting port of China’s Maritime Silk Road. By using this region as the research area, the conclusions drawn have implications for realizing energy distribution justice in other coastal areas of China and nations of Southeast Asia. Guangxi’s 14th Five-Year Plan includes a proposal for offshore wind energy projects in this area. Unlike the Guangdong and Hainan regions of BGER, Guangxi has no precedents for OWF construction. The CVGs lack prior experience with OWFs, making the selection of this area particularly forward-looking [79]. Beihai City boasts a relatively mature tourism and fishing industry, identifying it as a fitting representation of the coastal regions in BGER that combine both fisheries and tourism. Additionally, as indicated by the obtained data (see Section 4.1), tourists in Beihai City come from all over China, ensuring that the obtained tourist samples are nationally representative.

3.2. Q-Methodology

To mitigate the uncertainty associated with selecting scheme attributes and to discern the OWF external factors prioritized by China’s CVGs and tourist groups, this paper initially adopts the Q-methodology to collect preferences on these factors from both groups [80]. The Q-methodology is a subjective research method with strong operability. Later, researchers inherited and developed the Q-methodology, proposed a series of specific operational steps, and formed a set of systematic subjective research procedures [81].

3.2.1. Research Process

Adopting the foundational procedures of the Q-methodology [82,83], the forced rankings of the Q-statements of participants were employed to discern the preferences of CVGs and tourist groups regarding the establishment of OWFs. Based on the results, attributes for subsequent choice experiments are defined. Q-statements were initially designed. The Q-statements used in this paper encapsulate the external aspects of OWFs, gleaned from existing literature and interviews, conforming to principles of representativeness and pertinence. The gathered Q-statements for the CVGs were divided into four dimensions, centered on energy distribution justice. In contrast, the Q-statements for tourist groups were segmented into biodiversity, sensory perception, the aesthetic of wind energy installations, and landscape consonance. The accumulated Q-statements can be found in Table A1 and Table A2. P-samples were chosen next. For the formal experiment, 40 samples of CVGs and 40 samples of tourist groups were selected to form P-samples. Finally, Q-sorting was completed [84].

3.2.2. Data Analysis and Results

This study used the Ken-Q Analysis online tool to input results and calculate correlation matrices; subsequently, data were processed using principal component analysis and the maximum variance rotation method [85,86]. Following the Kaiser criterion, factors with eigenvalues greater than one were retained [87]. The results indicate that two factors among tourists had eigenvalues exceeding one, accounting for a cumulative explained variance of 87%, which is considerably high. The standard values reflect the degree of preference towards factors among the different categories of respondents. Based on the Q-sort results, the standard values of 20 secondary factors across the selected factors were computed. These values serve as the foundational data for preference attributes in the choice experiment.
Drawing from data analysis outcomes and concrete interviews conducted via the Q-methodology, the research pinpointed the foremost indicators among the 20 listed indicators. The aggregate Q-sort outcomes emerge from summing standard values across varied factors for all P-sample types, sequentially ordered based on their respective scores. Figure 2 shows the results. Prioritizing the thoroughness and inclusivity in attribute selection, and amalgamating score ranks with statement characteristics, ultimately, scale, offshore distance, fish count, and coastal acoustics were designated as attributes for the tourist groups’ choice experiment. Conversely, the risk of fish count reduction, tourist volume, offshore distance, and power obtainability were designated as attributes for CVGs.

3.3. Modified Choice Experiment and Research Design

The choice experiment (CE) is grounded in attribute value theory and random utility theory [88,89]. By translating the consumer’s choices in the choice set into a comparison of utilities, the researcher can obtain the consumer’s utility maximization and thus estimate the model parameters [90]. Therefore, both CVGs and tourist groups can select a combination of OWFs attributes based on the principle of maximizing their utility.
Traditional choice models assume that respondents are rational agents, who achieve maximum utility by choosing within a finite choice set C:
M a x i C δ i U X i
s . t . i C δ i = 1 , δ i 0 1 , i C δ i p i Y , i C
In Equations (1) and (2), U represents the utility function; X i is a k-dimensional vector describing the attributes of OWFs; δ i is an indicator variable for choosing or not choosing, which is represented by 1 and 0, respectively; C is the set of alternative choice options; p i represents the price variable, denoting the price of i , and Y represents the respondent’s income.
Traditional choice models overlook the violation of cut-offs. Swait accounted for these cut-offs in the model and amended the conventional choice model accordingly [75], arriving at the following modified choice model:
M a x U = i C δ i U X i + i C k δ i w k λ i k + v k κ i k
s . t . i C δ i = 1 , δ i 0 1 , i C δ i p i Y , i C
δ i θ L Z i λ i 0
δ i Z i θ U κ i 0
λ 0 , κ 0 ; i C
In Equations (3)–(7), θ L and θ U represent the minimum and maximum cut-offs, respectively, for OWF attributes that respondents can accept. Z i is a k + 1 dimensional vector that characterizes the attributes and price of OWFs. The penalty coefficients for violating the minimum and maximum cut-offs are represented by w k and v k , respectively, signifying the marginal disutility after breaching the cut-offs. λ i k and κ i k are used to measure the extent to which respondents violate the minimum and maximum cut-offs, respectively, for the kth attribute of the OWF, quantitatively satisfying λ i k = m a x ( 0 , θ k L Z i k ) , κ i k = m a x ( 0 , Z i k θ k U ) . λ i k = κ i k = 0 indicates that the respondent’s choice does not violate any cut-offs, and subsequent processing is the same as in the traditional CE model.
The modified model assumes that respondents have specific minimum and maximum acceptable cut-offs, represented by θ L and θ U , respectively, for the attributes of OWFs. This model permits respondents to exceed their personally set cut-offs, which, in turn, generates a corresponding marginal disutility. For example, the maximum amount that a tourist is willing to pay for OWFs is CNY 100; however, the long interview and a series of choice sets caused cognitive fatigue for the respondent, leading him to choose the option of paying CNY 150 in the choice set, which clearly exceeds his maximum willingness to pay and will result in a biased final estimate. Essentially, the new model amends observable effects through the cut-offs and recalibrates them into a composite of two components: one is the utility respondent n derives from the combination of OWF attributes, and the other is the negative utility stemming from the breach of attribute cut-offs. That is:
V n i = k ( β k X i k + w k λ n i k + ν k k n i k )
In Equation (8), V n i represents the utility respondent n derives from the ith option; β k is the estimated parameter; X i k denotes the level of the kth attribute combination of the OWF for the ith option; λ n i k and k n i k quantify the extent to which respondent n violates the minimum and maximum cut-offs for attribute k, respectively.
The modified CE model aligns more closely with reality. The total marginal utility of the respondents not only encompasses the marginal utility derived from the original attributes but also includes the negative marginal utility resulting from breaches of attribute cut-offs. Under this framework, assuming that the utility function U i ( Z ) is a linear function of attribute Z i k , the total marginal utility in the revised model can be represented by the following equation:
U i Z i k = δ i β k w k β k β k + ν k Z i k < θ k L θ k L Z i k θ k U Z i k > θ k U
In Equation (9), θ k L and θ k U represent the lowest and highest cut-offs for attribute k respondents can accept, respectively.
Based on the modified random utility function, the actual marginal value of OWF attributes can be expressed as:
M W T P k   ( M W T A k   ) = β k β p
The payment surplus can be expressed as:
C S   = 1 β p ( V 0 V 1 )
In Equations (10) and (11), M W T P k represents the actual marginal value of attribute k; C S is the compensation/payment surplus after cut-offs correction; β k and β p denote the actual marginal utilities of attribute k and the compensation amounts/payment, respectively; using Equation (9) for numerical adjustments, V 0 and V 1 indicate the welfare utility levels of respondents without and with OWFs, respectively.
This study did not incorporate cut-offs into the CVG model but instead employed the traditional CE model to gauge the willingness to be compensated among CVGs. Three reasons underpin this approach. Firstly, the MWTA results tend to be several times higher than the MWTP results [91]. If tourists’ MWTP can offset their MWTA, it can also offset MWTP. Furthermore, the accuracy enhancement for welfare outcomes because of cut-offs lies within 30–50% [92], implying that including cut-offs will not substantially improve the precision of WTA measures. Secondly, during field examinations, the research team discovered that CVGs opt for extreme cut-offs to maximize benefits, such as the highest compensations, lowest fishery losses, and maximum tourist influx. Thirdly, there was an attempt to transition from gauging MWTA to MWTP for the sake of using cheap talk in research (which represents a way of talking that can elicit more accurate information about respondents’ preferences), but respondents were reluctant to pay for projects that impact their livelihoods. The tourist groups cohort utilized the CE model with integrated cut-offs to enhance the accuracy of MWTP measurements.

3.4. Choice Experimental Design and Data Collection

The crux of the CE lies in identifying the attributes of schemes and their combinations. Based on the Q-methodology and the results of the pre-survey, we derive the OWFs attributes and compensation amounts/payments that are of most concern to CVGs and tourists are shown in Table 1. Notably, the fish count levels indicated by CVGs differ from those indicated by tourist groups. The impact of OWFs on fish count remains inconclusive and varies with the different phases of OWF construction and operation under governmental marine spatial management. However, in general, OWFs have a positive effect on recreational angling activities for tourists but potentially have negative implications for the fishing activities of CVGs [59,93,94,95]. The decisions of CVGs that affect their livelihoods are influenced by both objective and subjective risk preferences, prompting to consider risk preferences in the setup of fish count levels for this group [96]. Unlike previous studies where wind turbine sounds were defined as noise [97,98,99], this study adopted a more neutral expression, allowing respondents to make their judgements using various audio formats.
Utilizing SPSS 26.0 for orthogonal experimental design and considering the lack of prior experience among CVGs, the research team divided the generated eight choice sets into four versions. Each choice set consists of three alternative schemes and one status quo scheme, and each CVG member received one such version. However, for the tourist groups, which have higher prior experience and education levels, the research team presented all choice sets at once.
To ascertain the tourists’ cut-offs for the attributes of OWFs, in this section of the questionnaire, a series of supplementary questions related to cut-offs were incorporated [100]. Examples are as follows: “What is the maximum distance from OWFs you are willing to accept in km?” and “What is the loudest sound from the OWF you are willing to tolerate?”. Respondents were provided with pre-determined cut-off levels in the questionnaire and were asked to select the category closest to their limit. Depending on the attribute, tourists were queried about the maximum cut-offs for the offshore distance, scale, and coastal acoustics landscape of OWFs, as well as the minimum cut-off for fish count. Furthermore, we added cheap talk during the CE process, which improved the precision of the measure by giving full disclosure, providing a free discussion environment, and conducting multiple response confirmations to make the respondents’ MWTA/MWTP closer to the true value [71,101,102].
The experimental questionnaire consists of four sections: basic attitudes towards OWFs, fundamental preferences and cut-offs for OWFs, selection sets for OWFs, and the socioeconomic characteristics of respondents. Given the availability of data, the CVG samples were obtained in Beihai City using stratified random sampling, and the tourist samples were obtained through cooperation with Beihai City Scenic Spots using convenience sampling. Each tourist receives a souvenir of Beihai’s specialties as a questionnaire reward, while each CVG receives necessities such as laundry detergent and paper towels. To ensure the representativeness of samples from CVGs and tourist groups, the research team visited the study area four times during the peak tourist seasons between May 2022 and June 2023. All researchers who conducted interviews in all four phases were from relevant fields. They underwent extensive training before the survey to ensure familiarity with the questionnaire and acquisition of necessary research skills. During the four phases of the experimental selection, 314 valid questionnaires were retrieved from CVGs and 1010 from the tourist groups, totaling 1324 responses.

4. Results and Analysis

4.1. Descriptive Statistical Results of Respondents

The socio-economic characteristics, gender ratio, age structure, educational level, and household income of CVGs and the tourist groups are provided in Table 2. Overall, the income level of the tourist groups is higher than that of CVGs, and tourists are younger and more educated. A total of 95.1% of tourists support the development of offshore wind energy, 81.9% are attracted to OWF landscapes, and 81.3% claim they would be willing to pay to view OWFs. The geographical spread of tourists largely mirrors the population distribution percentages across China, guaranteeing that the sampled tourist groups are fairly representative.

4.2. Marginal Willingness to Accept of Coastal Vulnerable Groups

For CVGs, Stata 17.0 software was used to estimate and analyze the model without considering attribute cut-offs. Utilizing the results from the model estimation and Equation (10), the marginal values for the OWF attributes were determined, as detailed in Table 3. Through the application of Equation (10), the monthly compensatory willingness of CVGs is derived as CNY 61.21 for offshore distance, CNY 225.22 for tourist volume, CNY 396.72 for risk of fish count reduction, and CNY 111.44 for power obtainability, amounting to a total of 794.59 CNY/month.

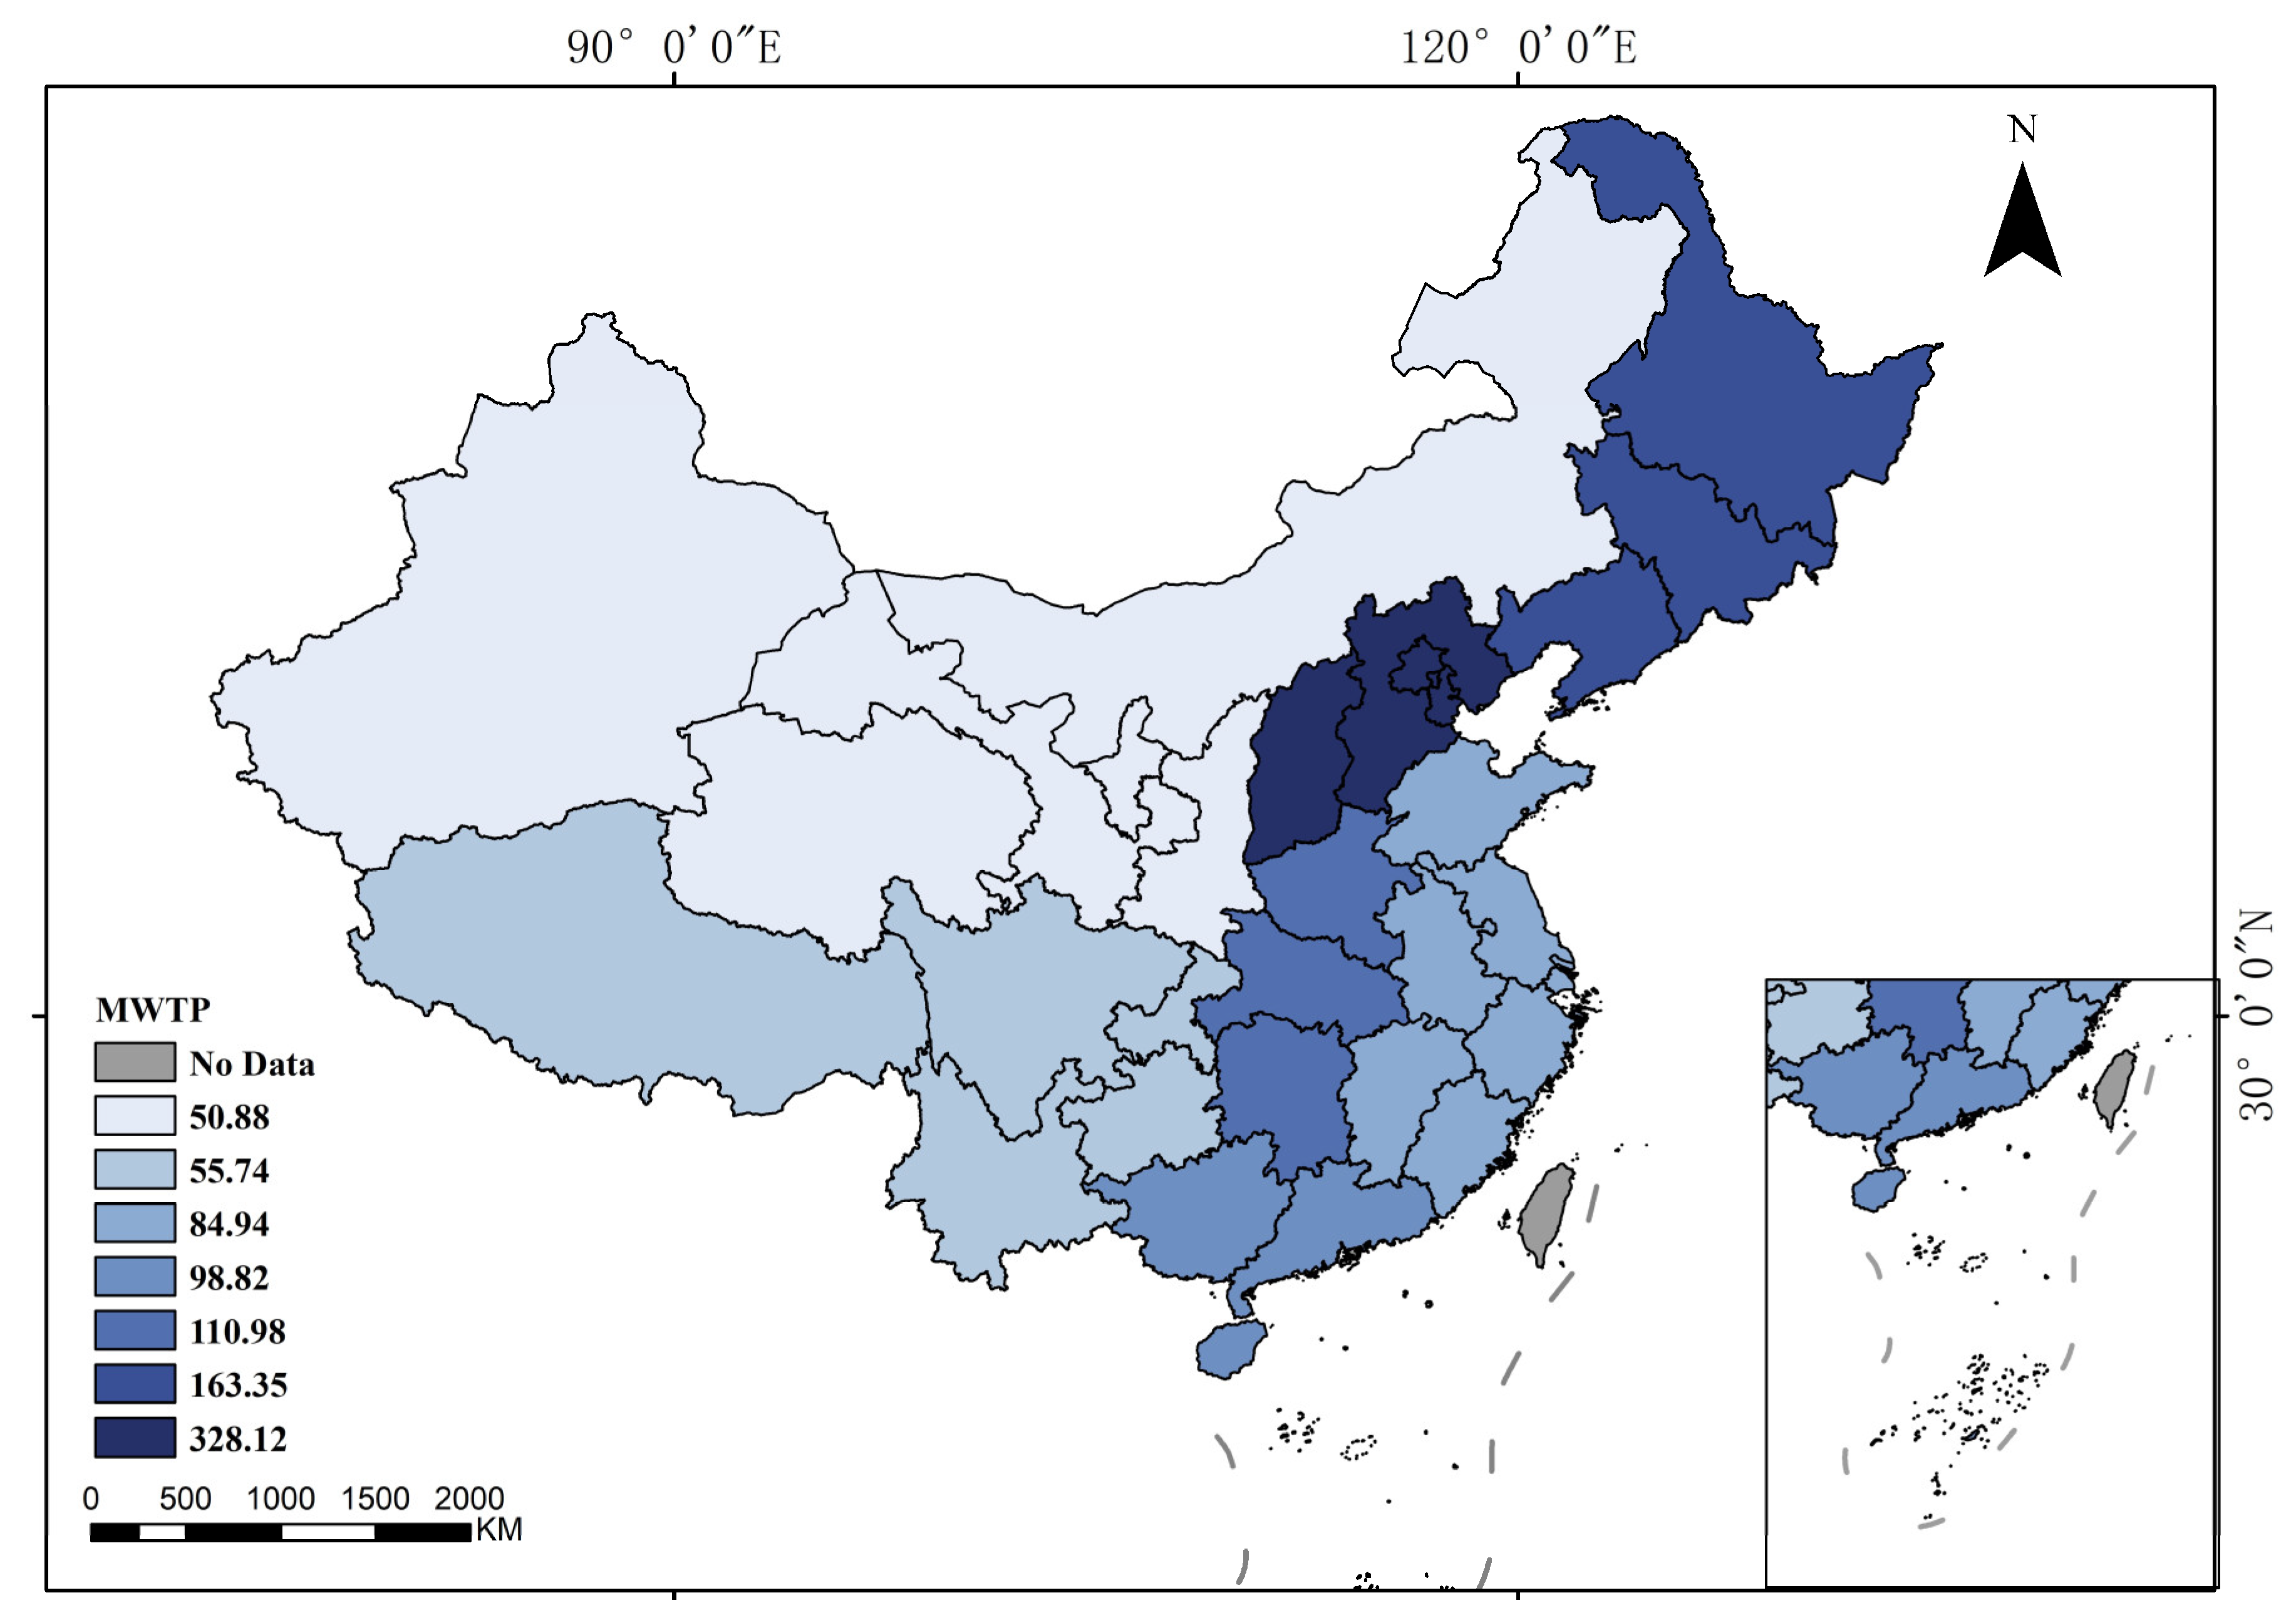
4.3. Marginal Willingness to Pay of Tourist Groups

The analysis of tourist groups integrated statistical results from both choice models, one with and one without cut-offs. Judging by the fit of the model, the Log-likelihood indicates that the model considering attribute cut-offs achieves a better fit and more accurately reflects the real choices of tourist groups. This result is consistent with the findings of Nie et al. [100]. From the perspective of model robustness, the direction and significance of various attributes, except for the scale attribute, do not change before and after the incorporation of cut-offs, indicating that the model is overall robust. The change in the significance of the scale attribute before and after suggests that the utility tourists derive from the scale attribute of OWFs is more composed of the negative utility generated by the violation of cut-offs.
Based on the coefficients of OWF attributes, the effects of offshore distance and coastal acoustics landscape on utility are negative, whereas the fish count has a positive impact on utility. The preference for OWFs in close proximity reflects the uniqueness of Chinese tourists. Existing studies generally perceive nearshore OWFs as negative landscape attributes [24]. This distinctive space allocation preference for wind farms allows China to achieve energy distribution justice through tourism. Table 4 and Table A3 show that the overall utility of the coastal acoustics landscape for tourists is negative, and surprisingly, tourists do not desire the absence of the OWF sound, and the effect is positive when the OWF sound is at a low level. This implies that the OWFs sound can be a positive experience for tourists when it is appropriate, contrary to the common view of noise [99]. As one tourist remarked, “The sound of the turbines, combined with the waves and seabirds, gives me a romantic feeling—it’s like white noise”.
Using the estimations from the model and employing Equation (10), the marginal values of OWF attributes can be ascertained under the two model scenarios. The findings demonstrate that in the traditional model, tourists are willing to pay CNY 7.14, CNY 32.43, 14.70, and CNY 31.26 for the attributes of scale, offshore distance, fish count, and coastal acoustics landscape, respectively; when considering the attribute cut-offs in the choice model, these values change to CNY 16.99, CNY 30.78, CNY 12.41, and CNY 35.82, respectively. By considering the attribute cut-offs, the amended model more accurately reflects the actual situation and presents an enhanced model fit. From the estimations derived from the model and using Equation (11), a per capita payment surplus for the tourist groups of CNY 96.00 can be deduced.
Similarly, applying the model that incorporates cut-offs to tourist groups from different geographical regions allows one to derive the space allocation of MWTP across China, as shown in Figure 3. The results indicate that tourists from north China, northeast China, and central China exhibit a higher MWTP. In contrast, tourists from northwest China and southwest China exhibit a relatively lower MWTP. The MWTP for tourists across the country varies widely, ranging from CNY 50.88 to CNY 328.12.
This research has pinpointed the factors that affect energy distribution justice for CVGs and tourist groups by applying Q-methodology and CEs. The most critical of these factors have been identified, thus answering the second research question.

4.4. Cost and Benefit Allocation Balance

According to the Beihai City Economic and Social Development Statistical Bulletin, the total number of tourists in Beihai City in 2020 reached 41.2 million. These tourists generated a tourism revenue of CNY 514.27 billion. By multiplying the per capita MWTP with the number of tourists and subtracting the 18.7% of tourists with zero MWTP, the total payment intention amounts to CNY 32.16 billion per year. This suggests that the construction of OWFs could lead to a 6.25% increase in tourism revenue for Beihai City.
According to the Guangxi Statistical Yearbook, in 2020, Beihai City boasted a standing population of 1.8 million. Among the residents, about 200,000 were CVGs, primarily subsisting on manual fisheries and tourism. By excluding the tourist volume compensation from the per capita MWTA and then multiplying it by the count of these CVGs, the total compensation intent reaches CNY 1.366 billion annually. This indicates that basing tourism on OWFs could compensate for the likely livelihood deficits these CVGs face. In addition, OWFs present a potential yearly income augmentation of CNY 9250 for CVGs. This figure represents 55.08% of the annual disposable income for Beihai’s rural dwellers and 24.37% for its urban populace. A comparison of MWTA and MWTP data can be found in Table 5.
In the tourism industry, tourists can enhance their travel experience by paying for the opportunity to closely observe OWFs, engage in reef fishing, and enjoy romantic soundscapes. This increases the attractiveness of coastal areas for tourism. Additionally, tourists compensate for the negative externalities imposed on CVGs due to the development of OWFs by paying for their visits. This approach effectively addresses the concerns of local OWF protesters, who question why the benefits of clean energy are shared by the public while the costs are borne solely by them.
At this point, the study answers the first question posed in the introduction, that MWTP by tourists has the potential to compensate for the loss of livelihoods of CVGs. By paying for it, tourists can have a better tourist experience while promoting energy distribution justice centered on a balanced distribution of costs and benefits.

5. Discussion

The use of the Q-methodology ensures that the attributes of the plans are the most valued by both groups, and that the derived MWTA/MWTP better represent the core desires of both communities. The MWTA for CVGs in Beihai City is 9535.08 CNY/year, while the MWTP for Chinese tourists regarding OWF landscapes is 96.00 CNY/visit. This implies that the development of the OWF tourism landscape has the potential to contribute to a balanced distribution of costs and benefits in offshore wind development.
The proper space allocation of wind energy facilities can help balance costs and benefits between these two groups. Contrary to the research in Europe, the USA, and other parts of Asia [61,103], this study shows that tourists prefer OWFs that are closer in proximity. Departing from traditional assumptions about wind farm noise, the results of this research indicate that appropriate sounds from OWFs can enhance the tourist experience, which is related to the harmony of the soundscape [104,105].
Improving the energy acquisition for CVGs can increase their willingness to accept OWFs. The stability of energy supply in coastal areas is significantly affected by extreme weather events such as typhoons [40]. CVGs expect a higher priority for energy supply. Given the hot climate of the BGER and the associated use of air conditioning units, the electricity demand of these CVGs is also higher. Reducing electricity fees can enhance their acceptance of OWFs.
Although most studies have negative conclusions, this research shows that tourists have a positive preference for OWFs. This positivity is due to the fact that previous studies have overly moralized the options available to tourists, overlooking that the primary demand of tourists is the travel experience itself. The study reveals that changes in fish populations have varying impacts on tourists and CVGs. OWFs lead to an increase in fish populations due to the enrichment effect, while the establishment of no-fishing zones results in a decline in fishing yields. It is important to note that these impacts are not uniform and affect different groups differently. The study recorded and simulated coastal soundscapes, finding that the sounds of waves, wind turbines, and seabirds can create a harmonious soundscape, increasing tourists’ MWTP.
This article’s contributions are three-fold: (1) It is the first to apply the Q-methodology to the selection of experimental scheme attributes, overcoming the issue of randomness in attribute selection. (2) The choice experiment model incorporates cut-offs, which enhances the precision of measuring tourists’ MWTP. (3) The study revisits the differences between tourists, the public, and CVGs. It finds that the core reason for the low acceptance of OWFs by CVGs is the underexplored potential of the OWF tourism landscape.
Because of ethical and privacy considerations, this paper could not obtain the precise geographical locations and related characteristics of tourists, and hence, analysis was restricted to large-scale geographical divisions within China. Moreover, the appeal of OWFs to tourists might be due to their “novelty”. It remains uncertain whether the attractiveness of OWF landscapes will persist in the long run [25,62]. This study also did not measure the potential increase in tourist numbers induced by OWFs; hence, the total amount tourists are willing to pay may even be higher than identified in this study. Further research is needed on the sustainability of this appeal and dynamic changes in tourists’ MWTP. From the perspective of external validity, future research could also continuously focus on the impact of the offshore wind farm tourism industry on energy distribution justice in regions with similar economic, social, and geographical conditions, such as Goa in India, Da Nang in Vietnam, and Boracay in the Philippines. Overall, this study concludes that OWFs tourism landscape development has the potential to contribute to energy distribution justice, but how CVGs can fully exploit the potential of offshore wind tourism still deserves further research.

6. Conclusion and Policy Implications

6.1. Conclusions

This paper employs a modified CE to measure both the MWTP of tourist groups, which is CNY 96.00 per visit, and the MWTA of CVGs, which amounts to CNY 9535.08 per year. The following findings can be summarized as follows: (1) The tourism industry can achieve a balance among the allocation of costs and benefits. Furthermore, the equitable distribution of energy resources can be realized through the space allocation of nearby OWFs, the optimization of coastal acoustics landscape, and enhancing the power obtainability for CVGs. (2) The impact of OWFs on fish count and tourist volume is the most concerning factor for CVGs. For tourists, the distance of OWFs and the coastal acoustics landscape are the primary factors affecting their landscape experience. Realizing energy distribution justice necessitates a considering of the cost allocation, benefit allocation, space allocation, and energy acquisition. Based on the obtained research findings, this paper proposes policy recommendations revolving around these four perspectives.

6.2. Policy Recommendations

In light of these findings, this paper presents policy recommendations towards energy distribution justice from four perspectives.
(1)
For CVGs, OWFs should be constructed away from traditional fishing grounds to mitigate adverse effects on fishing navigation and potential risks to fish count. For tourist groups, attention should be directed to aesthetics and overall visual harmony when planning OWFs, thus transforming the potential negative costs into benefits. In general, CVGs bear livelihood cost losses, while tourists incur no direct costs when enjoying the positive externalities of clean energy.
(2)
For CVGs, the government should guide them to optimize their livelihood structures by introducing policies that encourage integration with the tourism industry. This integration ensures that tourism revenue from OWFs directly benefits CVG communities. Furthermore, the government can identify groups or segments of the livelihood conversion process that are unable to realize offsets and compensate them monetarily accordingly, and the MWTA derived from this study can be used as a reference. For tourist groups, attractions should incorporate recreational activities linked with OWFs, such as leisure fishing and promoting clean energy awareness. The direct benefits from OWFs mainly manifest in tourism growth, with tourists paying for the enjoyed positive externalities.
(3)
For CVGs, no-fishing zones associated with OWFs should not overlap with traditional fishing grounds. For tourist groups, proximity to and a smaller scale of OWFs can enhance their experience and willingness to pay. Balancing the preferences of both groups, OWFs are best constructed 3–15 km off the coast in non-fishing areas. Furthermore, regional adaptations can be made based on historical visitor geographic distribution and varying MWTP to adjust the placement of OWFs.
(4)
For CVGs, that are substantially impacted by climate and experience energy instability, the electricity produced by OWFs should be prioritized for their consumption. Appropriate tariff reductions should be granted to alleviate energy poverty. For tourist groups, the government should promote transnational tourism reliant on OWFs, thus advancing regional energy distribution justice.

Author Contributions

Conceptualization, X.N. and H.M.; Methodology, X.N., H.M. and S.C.; Formal analysis, H.M. and S.C.; Investigation, H.M., S.C. and K.L.; Data curation, K.L. and Z.Y.; Writing—original draft, X.N., H.M., S.C. and H.W.; Writing—review & editing, H.M., S.C., K.L., Z.Y., H.W. and Z.W.; Visualization, Z.W.; Supervision, Z.W.; Funding acquisition, X.N. All authors have read and agreed to the published version of the manuscript.

Funding

This work is supported by the National Natural Science Foundation of China (Nos. 71973038 and 71763001), which supported the research costs for Beihai City.

Data Availability Statement

Data available on request due to ethical and private restrictions: The data presented in this study are available on request from the corresponding author.

Acknowledgments

The authors would like to sincerely thank the Beihai City Government of Guangxi, China, for their strong support. We would like to thank Xiaofang Chen, Yunyi Guan, Jiayi Li, Meizhu Qian, and Junda Huang for their help in the research. We also thank the anonymous reviewer for their insightful comments and suggestions, which have greatly contributed to improving the manuscript.

Conflicts of Interest

The authors declare no conflict of interest.

Appendix A

Table A1. Q statement for coastal vulnerable groups.
LabelStatementDimensionalityExplanation
FishFishCost AllocationI care about the impact of offshore wind on fish populations
House priceHousing priceCost AllocationI care about the impact of offshore wind on surrounding house prices
SoundSoundCost AllocationI care about offshore wind sounds
Shadow and flickerShadow and flickerCost AllocationI care about the shadows and flicker from offshore wind.
NavigationFishing boat navigationCost AllocationI care about the impact on fishing vessel navigation
TouristsTouristsProfit AllocationI care about the impact of offshore wind on tourist numbers
EmploymentEmployment opportunitiesProfit AllocationI care about the increase in jobs from offshore wind farms
ClimateImpact on climateProfit AllocationI care about the climate impact of offshore wind
RentImpact on rentProfit AllocationI think offshore wind has an impact on rents
Social identitySocial identityProfit AllocationI think offshore wind improves the social identity of the area for others
DistanceDistanceSpace AllocationI care about offshore wind distance
No-fishing zoneEstablishment of prohibited fishing areasSpace AllocationI care about the setting of closed areas (generally 1–4 km around)
ScaleScale Space AllocationI care about the scale of offshore wind power
HeightHeightSpace AllocationI care about the height of offshore wind.
ArrangementArrangement Space AllocationI care about offshore wind alignment
Electricity billsElectricity billsEnergy AcquisitionI want my electric bill to go down.
PriorityPower priority supply rightEnergy AcquisitionI want to have first right of refusal to supply electricity from offshore wind.
OwnershipOwnershipEnergy AcquisitionI care about offshore wind ownership (state, business, community joint venture)
DestinationElectric energy destinationEnergy AcquisitionI care about where offshore wind power goes (domestic, foreign/transnational trade in power)
StabilityStability of energy supplyEnergy AcquisitionI think offshore wind enhances the stability of local energy supply
Table A2. Tourist’s Q statement.
LabelStatementDimensionalityExplanation
FishEffect on fishBiodiversityI care more about offshore wind power impacts on fish
BirdsEffect on birdsBiodiversityI am more concerned about the impacts of offshore wind on birds than I am about offshore wind
BatsEffect on batsBiodiversityI care more about the impact of offshore wind on bats
SoundSoundFive SensesI care more about offshore wind sound
ColorColorFive SensesI care more about offshore wind colors
ShadowShadowFive SensesI care more about offshore wind generated shadows
FlashingFlashingFive SensesI care more about offshore wind generated flicker
HeightHeightOwn AppearanceI care more about offshore wind heights
NameplateNameplateOwn AppearanceI care more about offshore wind nameplates
Rotation speedRotation speedOwn AppearanceI care more about the offshore wind speed
Blade lengthBlade lengthOwn AppearanceI care more about offshore wind power blade length
Heads_numberNumber of headsOwn AppearanceI care more about the number of offshore wind turbine heads
Wind wheels_numberNumber Of wind wheelsOwn AppearanceI care more about the number of wind turbines for offshore wind power
TypeTypeOwn AppearanceI care more about the type of offshore wind power construction
Blades_numberNumber of fan bladesOwn AppearanceI care more about the number of fan blades in offshore wind power construction.
ScalesScalesOwn AppearanceI care more about offshore wind power offshore distance
Offshore distanceOffshore DistanceLandscape HarmonyI care more about offshore wind power scale (number)
ArrangementArrangementLandscape HarmonyI care more about offshore wind power arrangement.
Day and nightDay and nightLandscape HarmonyI care about the different landscape of offshore wind by day and by night.
SpacingSpacing distanceLandscape HarmonyI care more about the distance between the offshore wind power construction.
Table A3. Random parameter Logit model of coastal acoustics landscape.
VariableTourist
CoefficientStandard Error
Scale−0.1258 *** 0.0254
Offshore distance−0.2128 ***0.0202
Fish count0.0903 ***0.0285
Coastal acoustics landscape_medium0.1940 ***0.0652
Coastal acoustics landscape_loud−0.5344 ***0.0433
Payments−0.0074 ***0.0005
Log likelihood−6344.8687
Note: *** indicate that the estimated value is significant at the level of 1%.

References

  1. Alex GWECs Global Offshore Wind Report 2022; Global Wind Energy Council: Brussels, Belgium, 2022.
  2. le Maitre, J.; Ryan, G.; Power, B.; O’Connor, E. Empowering Onshore Wind Energy: A National Choice Experiment on Financial Benefits and Citizen Participation. Energy Policy 2023, 173, 113362. [Google Scholar] [CrossRef]
  3. Rand, J.; Hoen, B. Thirty Years of North American Wind Energy Acceptance Research: What Have We Learned? Energy Res. Soc. Sci. 2017, 29, 135–148. [Google Scholar] [CrossRef]
  4. Monyei, C.G.; Jenkins, K.; Serestina, V.; Adewumi, A.O. Examining Energy Sufficiency and Energy Mobility in the Global South through the Energy Justice Framework. Energy Policy 2018, 119, 68–76. [Google Scholar] [CrossRef]
  5. Sovacool, B.K. What Are We Doing Here? Analyzing Fifteen Years of Energy Scholarship and Proposing a Social Science Research Agenda. Energy Res. Soc. Sci. 2014, 1, 1–29. [Google Scholar] [CrossRef]
  6. Walker, G.; Day, R. Fuel Poverty as Injustice: Integrating Distribution, Recognition and Procedure in the Struggle for Affordable Warmth. Energy Policy 2012, 49, 69–75. [Google Scholar] [CrossRef]
  7. Broekel, T.; Alfken, C. Gone with the Wind? The Impact of Wind Turbines on Tourism Demand. Energy Policy 2015, 86, 506–519. [Google Scholar] [CrossRef]
  8. Lutzeyer, S.; Phaneuf, D.J.; Taylor, L.O. The Amenity Costs of Offshore Wind Farms: Evidence from a Choice Experiment. Energy Econ. 2018, 72, 621–639. [Google Scholar] [CrossRef]
  9. Steins, N.A.; Veraart, J.A.; Klostermann, J.E.M.; Poelman, M. Combining Offshore Wind Farms, Nature Conservation and Seafood: Lessons from a Dutch Community of Practice. Mar. Policy 2021, 126, 104371. [Google Scholar] [CrossRef]
  10. Bristow, G.; Cowell, R.; Munday, M. Windfalls for Whom? The Evolving Notion of ‘Community’ in Community Benefit Provisions from Wind Farms. Geoforum 2012, 43, 1108–1120. [Google Scholar] [CrossRef]
  11. Kermagoret, C.; Levrel, H.; Carlier, A.; Ponsero, A. Stakeholder Perceptions of Offshore Wind Power: A Fuzzy Cognitive Mapping Approach. Soc. Nat. Resour. 2016, 29, 916–931. [Google Scholar] [CrossRef]
  12. van Wijk, J.; Fischhendler, I.; Rosen, G.; Herman, L. Penny Wise or Pound Foolish? Compensation Schemes and the Attainment of Community Acceptance in Renewable Energy. Energy Res. Soc. Sci. 2021, 81, 102260. [Google Scholar] [CrossRef]
  13. Walker, B.J.A.; Wiersma, B.; Bailey, E. Community Benefits, Framing and the Social Acceptance of Offshore Wind Farms: An Experimental Study in England. Energy Res. Soc. Sci. 2014, 3, 46–54. [Google Scholar] [CrossRef]
  14. Alon, T.; Kim, M.; Lagakos, D.; Van Vuren, M. Macroeconomic Effects of COVID-19 Across the World Income Distribution. IMF Econ. Rev. 2023, 71, 99–147. [Google Scholar] [CrossRef]
  15. Goodell, J.W. COVID-19 and Finance: Agendas for Future Research. Financ. Res. Lett. 2020, 35, 101512. [Google Scholar] [CrossRef] [PubMed]
  16. Blazquez, J.; Galeotti, M.; Martin-Moreno, J.M. Green Recovery Packages for a Post-Covid-19 World: A Lesson from the Collapse of Spanish Wind Farms in the Past Financial Crisis. Renew. Sustain. Energy Rev. 2021, 151, 111570. [Google Scholar] [CrossRef]
  17. Lerche, J.; Lorentzen, S.; Enevoldsen, P.; Neve, H.H. The Impact of COVID-19 on Offshore Wind Project Productivity—A Case Study. Renew. Sust. Energy Rev. 2022, 158, 112188. [Google Scholar] [CrossRef]
  18. Tu, Q.; Mo, J.; Liu, Z.; Gong, C.; Fan, Y. Using Green Finance to Counteract the Adverse Effects of COVID-19 Pandemic on Renewable Energy Investment-The Case of Offshore Wind Power in China. Energy Policy 2021, 158, 112542. [Google Scholar] [CrossRef] [PubMed]
  19. Cave, J.; Brown, K.G. Island Tourism: Destinations: An Editorial Introduction to the Special Issue. Int. J. Cult. Tour. Hosp. Res. 2012, 6, 95–113. [Google Scholar] [CrossRef]
  20. Meyerhoff, J. Do Turbines in the Vicinity of Respondents’ Residences Influence Choices among Programmes for Future Wind Power Generation? J. Choice Model. 2013, 7, 58–71. [Google Scholar] [CrossRef]
  21. Machado, J.T.M.; de Andrés, M. Implications of Offshore Wind Energy Developments in Coastal and Maritime Tourism and Recreation Areas: An Analytical Overview. Environ. Impact Assess. Rev. 2023, 99, 106999. [Google Scholar] [CrossRef]
  22. Ladenburg, J.; Skotte, M. Heterogeneity in Willingness to Pay for the Location of Offshore Wind Power Development: An Application of the Willingness to Pay Space Model. Energy 2022, 241, 122900. [Google Scholar] [CrossRef]
  23. Ladenburg, J.; Hevia-Koch, P.; Petrovic, S.; Knapp, L. The Offshore-Onshore Conundrum: Preferences for Wind Energy Considering Spatial Data in Denmark. Renew. Sust. Energy Rev. 2020, 121, 109711. [Google Scholar] [CrossRef]
  24. Parsons, G.; Firestone, J.; Yan, L.; Toussaint, J. The Effect of Offshore Wind Power Projects on Recreational Beach Use on the East Coast of the United States: Evidence from Contingent-Behavior Data. Energy Policy 2020, 144, 111659. [Google Scholar] [CrossRef]
  25. Smythe, T.; Bidwell, D.; Moore, A.; Smith, H.; McCann, J. Beyond the Beach: Tradeoffs in Tourism and Recreation at the First Offshore Wind Farm in the United States. Energy Res. Soc. Sci. 2020, 70, 101726. [Google Scholar] [CrossRef]
  26. Westerberg, V.; Westerberg, V.; Jacobsen, J.B.; Lifran, R. The Case for Offshore Wind Farms, Artificial Reefs and Sustainable Tourism in the French Mediterranean. Tour. Manag. 2013, 34, 172–183. [Google Scholar] [CrossRef]
  27. Sovacool, B.; Heffron, R.; McCauley, D.A.; Goldthau, A. Reframing Energy Decisions as Justice and Social Concerns. Nat. Energy 2016, 1, 56–61. [Google Scholar] [CrossRef]
  28. Heffron, R.J. Applying Energy Justice into the Energy Transition. Renew. Sustain. Energy Rev. 2022, 156, 111936. [Google Scholar] [CrossRef]
  29. Heffron, R.J.; McCauley, D. The Concept of Energy Justice across the Disciplines. Energy Policy 2017, 105, 658–667. [Google Scholar] [CrossRef]
  30. Jenkins, K.; McCauley, D.; Heffron, R.; Stephan, H.; Rehner, R. Energy Justice: A Conceptual Review. Energy Res. Soc. Sci. 2016, 11, 174–182. [Google Scholar] [CrossRef]
  31. McCauley, D.A.; Heffron, R.J.; Stephan, H.; Jenkins, K. Advancing Energy Justice: The Triumvirate of Tenets. Int. Energy Law. Rev. 2013, 32, 107–110. [Google Scholar]
  32. Hyland, M.; Bertsch, V. The Role of Community Involvement Mechanisms in Reducing Resistance to Energy Infrastructure Development. Ecol. Econ. 2018, 146, 447–474. [Google Scholar] [CrossRef]
  33. Knauf, J. Can’t Buy Me Acceptance? Financial Benefits for Wind Energy Projects in Germany. Energy Policy 2022, 165, 112924. [Google Scholar] [CrossRef]
  34. Toke, D.; Breukers, S.; Wolsink, M. Wind Power Deployment Outcomes: How Can We Account for the Differences? Renew. Sustain. Energy Rev. 2008, 12, 1129–1147. [Google Scholar] [CrossRef]
  35. Bourdin, S.; Colas, M.; Raulin, F. Understanding the Problems of Biogas Production Deployment in Different Regions: Territorial Governance Matters Too. J. Env. Plann Man. 2020, 63, 1655–1673. [Google Scholar] [CrossRef]
  36. Leer Jørgensen, M.; Anker, H.T.; Lassen, J. Distributive Fairness and Local Acceptance of Wind Turbines: The Role of Compensation Schemes. Energy Policy 2020, 138, 111294. [Google Scholar] [CrossRef]
  37. Bouzarovski, S.; Simcock, N. Spatializing Energy Justice. Energy Policy 2017, 107, 640–648. [Google Scholar] [CrossRef]
  38. Bidwell, D.; Firestone, J.; Ferguson, M.D. Love Thy Neighbor (or Not): Regionalism and Support for the Use of Offshore Wind Energy by Others. Energy Res. Soc. Sci. 2022, 90, 102599. [Google Scholar] [CrossRef]
  39. Yenneti, K.; Day, R. Distributional Justice in Solar Energy Implementation in India: The Case of Charanka Solar Park. J. Rural. Stud. 2016, 46, 35–46. [Google Scholar] [CrossRef]
  40. Cinner, J.E.; Adger, W.N.; Allison, E.H.; Barnes, M.L.; Brown, K.; Cohen, P.J.; Gelcich, S.; Hicks, C.C.; Hughes, T.P.; Lau, J.; et al. Building Adaptive Capacity to Climate Change in Tropical Coastal Communities. Nat. Clim. Change 2018, 8, 117–123. [Google Scholar] [CrossRef]
  41. Koomson, D.; Davies-Vollum, K.S.; Raha, D. Characterising the Vulnerability of Fishing Households to Climate and Environmental Change: Insights from Ghana. Mar. Policy 2020, 120, 104142. [Google Scholar] [CrossRef]
  42. Spijkers, J.; Merrie, A.; Wabnitz, C.C.C.; Osborne, M.; Mobjörk, M.; Bodin, Ö.; Selig, E.R.; Le Billon, P.; Hendrix, C.S.; Singh, G.G.; et al. Exploring the Future of Fishery Conflict through Narrative Scenarios. One Earth 2021, 4, 386–396. [Google Scholar] [CrossRef]
  43. Utete, B.; Phiri, C.; Mlambo, S.S.; Muboko, N.; Fregene, B.T. Vulnerability of Fisherfolks and Their Perceptions towards Climate Change and Its Impacts on Their Livelihoods in a Peri-Urban Lake System in Zimbabwe. Env. Dev. Sustain. 2019, 21, 917–934. [Google Scholar] [CrossRef]
  44. Bennett, N.J.; Dearden, P. Why Local People Do Not Support Conservation: Community Perceptions of Marine Protected Area Livelihood Impacts, Governance and Management in Thailand. Mar. Policy 2014, 44, 107–116. [Google Scholar] [CrossRef]
  45. Cinner, J.E.; McClanahan, T.R.; Wamukota, A. Differences in Livelihoods, Socioeconomic Characteristics, and Knowledge about the Sea between Fishers and Non-Fishers Living near and Far from Marine Parks on the Kenyan Coast. Mar. Policy 2010, 34, 22–28. [Google Scholar] [CrossRef]
  46. Shameem, M.I.M.d.; Momtaz, S.; Rauscher, R. Vulnerability of Rural Livelihoods to Multiple Stressors: A Case Study from the Southwest Coastal Region of Bangladesh. Ocean Coast. Manag. 2014, 102, 79–87. [Google Scholar] [CrossRef]
  47. Wu, H.; Li, Q.; Wang, C.; Wu, Q.; Peng, C.; Jefferson, T.A.; Long, Z.; Luo, F.; Xu, Y.; Huang, S.-L. Bycatch Mitigation Requires Livelihood Solutions, Not Just Fishing Bans: A Case Study of the Trammel-Net Fishery in the Northern Beibu Gulf, China. Mar. Policy 2022, 139, 105018. [Google Scholar] [CrossRef]
  48. Ito, T.; Rachman, N.F.; Savitri, L.A. Power to Make Land Dispossession Acceptable: A Policy Discourse Analysis of the Merauke Integrated Food and Energy Estate (MIFEE), Papua, Indonesia. J. Peasant. Stud. 2014, 41, 29–50. [Google Scholar] [CrossRef]
  49. Mohammed, A.S.; Graham, E.; Dary, S.K. Rising Expectations and Dying Hopes: Local Perceptions of Oil and Gas Extraction in Ghana. Energy Res. Soc. Sci. 2022, 88, 102529. [Google Scholar] [CrossRef]
  50. Shiraishi, K.; Shirley, R.G.; Kammen, D.M. Geospatial Multi-Criteria Analysis for Identifying High Priority Clean Energy Investment Opportunities: A Case Study on Land-Use Conflict in Bangladesh. Appl. Energy 2019, 235, 1457–1467. [Google Scholar] [CrossRef]
  51. Zhang, Y.; Zhang, C.; Chang, Y.-C.; Liu, W.-H.; Zhang, Y. Offshore Wind Farm in Marine Spatial Planning and the Stakeholders Engagement: Opportunities and Challenges for Taiwan. Ocean Coast. Manag. 2017, 149, 69–80. [Google Scholar] [CrossRef]
  52. Ramirez, J.; Böhm, S. Transactional Colonialism in Wind Energy Investments: Energy Injustices against Vulnerable People in the Isthmus of Tehuantepec. Energy Res. Soc. Sci. 2021, 78, 102135. [Google Scholar] [CrossRef]
  53. Tsai, H.-H.; Tseng, H.-S.; Huang, C.-K.; Yu, S.-C. Review on the Conflicts between Offshore Wind Power and Fishery Rights: Marine Spatial Planning in Taiwan. Energies 2022, 15, 8768. [Google Scholar] [CrossRef]
  54. Su, M.M.; Wall, G.; Jin, M. Island Livelihoods: Tourism and Fishing at Long Islands, Shandong Province, China. Ocean Coast. Manag. 2016, 122, 20–29. [Google Scholar] [CrossRef]
  55. Zhang, H.; Song, H.; Wen, L.; Liu, C. Forecasting Tourism Recovery amid COVID-19. Ann. Tour. Res. 2021, 87, 103149. [Google Scholar] [CrossRef] [PubMed]
  56. Zhang, R.; Tong, Y. Quantifying the COVID-19-Affected Tourism Education in China: A Potential Crisis in Tourism Recovery. Curr. Issues Tour. 2023, 26, 1–6. [Google Scholar] [CrossRef]
  57. McKenna, R.; Weinand, J.M.; Mulalic, I.; Petrović, S.; Mainzer, K.; Preis, T.; Moat, H.S. Scenicness Assessment of Onshore Wind Sites with Geotagged Photographs and Impacts on Approval and Cost-Efficiency. Nat. Energy 2021, 6, 663–672. [Google Scholar] [CrossRef]
  58. Carr-Harris, A.; Lang, C. Sustainability and Tourism: The Effect of the United States’ First Offshore Wind Farm on the Vacation Rental Market. Resour. Energy Econ. 2019, 57, 51–67. [Google Scholar] [CrossRef]
  59. Kim, C.-K.; Jang, S.; Kim, T.Y. Site Selection for Offshore Wind Farms in the Southwest Coast of South Korea. Renew. Energy 2018, 120, 151–162. [Google Scholar] [CrossRef]
  60. Bidwell, D.; Smythe, T.; Tyler, G. Anglers’ Support for an Offshore Wind Farm: Fishing Effects or Clean Energy Symbolism. Mar. Policy 2023, 151, 105568. [Google Scholar] [CrossRef]
  61. Cranmer, A.; Broughel, A.E.; Ericson, J.; Goldberg, M.; Dharni, K. Getting to 30 GW by 2030: Visual Preferences of Coastal Residents for Offshore Wind Farms on the US East Coast. Energ Policy 2023, 173, 113366. [Google Scholar] [CrossRef]
  62. Smythe, T.; Bidwell, D.; Tyler, G. Optimistic with Reservations: The Impacts of the United States’ First Offshore Wind Farm on the Recreational Fishing Experience. Mar. Policy 2021, 127, 104440. [Google Scholar] [CrossRef]
  63. Trandafir, S.; Gaur, V.; Behanan, P.; Uchida, E.; Lang, C.; Miao, H. How Are Tourists Affected By Offshore Wind Turbines? A Case Study Of The First U.S. Offshore Wind Farm. J. Ocean. Coast. Econ. 2020, 7, 1. [Google Scholar] [CrossRef]
  64. Boudet, H.S. Public Perceptions of and Responses to New Energy Technologies. Nat. Energy 2019, 4, 446–455. [Google Scholar] [CrossRef]
  65. Faulques, M.; Bonnet, J.; Bourdin, S.; Juge, M.; Pigeon, J.; Richard, C. Generational Effect and Territorial Distributive Justice, the Two Main Drivers for Willingness to Pay for Renewable Energies. Energy Policy 2022, 168, 113094. [Google Scholar] [CrossRef]
  66. Voltaire, L.; Koutchade, O.P. Public Acceptance of and Heterogeneity in Behavioral Beach Trip Responses to Offshore Wind Farm Development in Catalonia (Spain). Resour. Energy Econ. 2020, 60, 101152. [Google Scholar] [CrossRef]
  67. Westerberg, V.; Jacobsen, J.B.; Lifran, R. Offshore Wind Farms in Southern Europe—Determining Tourist Preference and Social Acceptance. Energy Res. Soc. Sci. 2015, 10, 165–179. [Google Scholar] [CrossRef]
  68. Hsu, T.-K.; Tsai, Y.-F.; Wu, H.-H. The Preference Analysis for Tourist Choice of Destination: A Case Study of Taiwan. Tour. Manag. 2009, 30, 288–297. [Google Scholar] [CrossRef]
  69. Nicolau, J.L.; Más, F.J. The Influence of Distance and Prices on the Choice of Tourist Destinations: The Moderating Role of Motivations. Tour. Manag. 2006, 27, 982–996. [Google Scholar] [CrossRef]
  70. Mattmann, M.; Logar, I.; Brouwer, R. Wind Power Externalities: A Meta-Analysis. Ecol. Econ. 2016, 127, 23–36. [Google Scholar] [CrossRef]
  71. Johnston, R.J.; Boyle, K.J.; Adamowicz, W.; Bennett, J.; Brouwer, R.; Cameron, T.A.; Hanemann, W.M.; Hanley, N.; Ryan, M.; Scarpa, R.; et al. Contemporary Guidance for Stated Preference Studies. J. Assoc. Environ. Resour. Econ. 2017, 4, 319–405. [Google Scholar] [CrossRef]
  72. Brown, S.R. A Primer on Q Methodology. osub 1993, 16, 91–138. [Google Scholar] [CrossRef]
  73. Fei, L.; Jiaming, L.I.U.; Hu, Y.U.; He, Z.H.U.; Shuying, Z. The Evaluation System and Application of the Homestay Agglomeration Location Selection. J. Resour. Ecol. 2019, 10, 324. [Google Scholar] [CrossRef]
  74. Jensen, A.K. A Structured Approach to Attribute Selection in Economic Valuation Studies: Using Q-Methodology. Ecol. Econ. 2019, 166, 106400. [Google Scholar] [CrossRef]
  75. Mazur, K.E.; Asah, S.T. Clarifying Standpoints in the Gray Wolf Recovery Conflict: Procuring Management and Policy Forethought. Biol. Conserv. 2013, 167, 79–89. [Google Scholar] [CrossRef]
  76. Leong, W.; Hensher, D.A. Embedding Decision Heuristics in Discrete Choice Models: A Review. Transp. Rev. 2012, 32, 313–331. [Google Scholar] [CrossRef]
  77. Swait, J. A Non-Compensatory Choice Model Incorporating Attribute Cutoffs. Transp. Res. Part. B Methodol. 2001, 35, 903–928. [Google Scholar] [CrossRef]
  78. Oehlmann, M.; Glenk, K.; Lloyd-Smith, P.; Meyerhoff, J. Quantifying Landscape Externalities of Renewable Energy Development: Implications of Attribute Cut-Offs in Choice Experiments. Resour. Energy Econ. 2021, 65, 101240. [Google Scholar] [CrossRef]
  79. Chen, X.; Foley, A.; Zhang, Z.; Wang, K.; O’Driscoll, K. An Assessment of Wind Energy Potential in the Beibu Gulf Considering the Energy Demands of the Beibu Gulf Economic Rim. Renew. Sustain. Energy Rev. 2020, 119, 109605. [Google Scholar] [CrossRef]
  80. Zabala, A.; Sandbrook, C.; Mukherjee, N. When and How to Use Q Methodology to Understand Perspectives in Conservation Research. Conserv. Biol. 2018, 32, 1185–1194. [Google Scholar] [CrossRef]
  81. Yin, C.; Xiao, J.; Qian, X. Understanding Urban Planning Failure in China: Identifying Practitioners’ Perspectives Using Q Methodology. Cities 2023, 134, 104193. [Google Scholar] [CrossRef]
  82. Kim, H.K. Estimating Agreement between the Q Block and the Q Tool. Operant. Subj. 2010, 34. [Google Scholar] [CrossRef]
  83. Kim, J.; Ko, H.; Shin, M.; Shin, M.-S.; Hwang, Y.; Kim, M.; Cho, K.; Park, S.; Yi, H. Abstract 14507: Perceptions and Attitudes About Advance Care Planning Among Healthcare Professionals of Cardiac Care: A Q Methodology Study. Circulation 2022, 146, A14507. [Google Scholar] [CrossRef]
  84. Northrop, A. Political Subjectivity: Applications of Q Methodology in Political Science. Steven R. Brown. J. Politics 1981, 43, 912–914. [Google Scholar] [CrossRef]
  85. Shayan, F. Doing Q-Methodological Research: Theory, Method and Interpretation. Int. J. Soc. Res. Methodol. 2014, 17, 87–88. [Google Scholar] [CrossRef]
  86. Vecchio, Y.; Di Pasquale, J.; Del Giudice, T.; Pauselli, G.; Masi, M.; Adinolfi, F. Precision Farming: What Do Italian Farmers Really Think? An Application of the Q Methodology. Agric. Syst. 2022, 201, 103466. [Google Scholar] [CrossRef]
  87. Kahane, F.; Osborne, J.; Crowley, S.; Shaw, R. Motivations Underpinning Honeybee Management Practices: A Q Methodology Study with UK Beekeepers. Ambio 2022, 51, 2155–2168. [Google Scholar] [CrossRef]
  88. Lancaster, K.J. A New Approach to Consumer Theory. J. Political Econ. 1966, 74, 132–157. [Google Scholar] [CrossRef]
  89. McFadden, D. Conditional Logit Analysis of Qualitative Choice Behavior; University of California: Los Angeles, CA, USA, 1973. [Google Scholar]
  90. Rosen, S. Hedonic Prices and Implicit Markets: Product Differentiation in Pure Competition. J. Political Econ. 1974, 82, 34–55. [Google Scholar] [CrossRef]
  91. Horowitz, J.K.; McConnell, K.E. A Review of WTA/WTP Studies. J. Environ. Econ. Manag. 2002, 44, 426–447. [Google Scholar] [CrossRef]
  92. Li, L.; Adamowicz, W.; Swait, J. The Effect of Choice Set Misspecification on Welfare Measures in Random Utility Models. Resour. Energy Econ. 2015, 42, 71–92. [Google Scholar] [CrossRef]
  93. Inger, R.; Attrill, M.J.; Bearhop, S.; Broderick, A.C.; James Grecian, W.; Hodgson, D.J.; Mills, C.; Sheehan, E.; Votier, S.C.; Witt, M.J.; et al. Marine Renewable Energy: Potential Benefits to Biodiversity? An Urgent Call for Research. J. Appl. Ecol. 2009, 46, 1145–1153. [Google Scholar] [CrossRef]
  94. Klain, S.; Satterfield, T.; Chan, K.M.A.; Lindberg, K. Octopus’s Garden under the Blade: Boosting Biodiversity Increases Willingness to Pay for Offshore Wind in the United States. Energy Res. Soc. Sci. 2020, 69, 101744. [Google Scholar] [CrossRef]
  95. Stelzenmüller, V.; Letschert, J.; Gimpel, A.; Kraan, C.; Probst, W.N.; Degraer, S.; Döring, R. From Plate to Plug: The Impact of Offshore Renewables on European Fisheries and the Role of Marine Spatial Planning. Renew. Sustain. Energy Rev. 2022, 158, 112108. [Google Scholar] [CrossRef]
  96. Nie, X.; Zhou, J.; Cheng, P.; Wang, H. Exploring the Differences between Coastal Farmers’ Subjective and Objective Risk Preferences in China Using an Agent-Based Model. J. Rural. Stud. 2021, 82, 417–429. [Google Scholar] [CrossRef]
  97. Müller, F.J.Y.; Leschinger, V.; Hübner, G.; Pohl, J. Understanding Subjective and Situational Factors of Wind Turbine Noise Annoyance. Energy Policy 2023, 173, 113361. [Google Scholar] [CrossRef]
  98. Radun, J.; Maula, H.; Saarinen, P.; Keränen, J.; Alakoivu, R.; Hongisto, V. Health Effects of Wind Turbine Noise and Road Traffic Noise on People Living near Wind Turbines. Renew. Sustain. Energy Rev. 2022, 157, 112040. [Google Scholar] [CrossRef]
  99. Solman, H.; Kirkegaard, J.K.; Kloppenburg, S. Wind Energy and Noise: Forecasting the Future Sounds of Wind Energy Projects and Facilitating Dutch Community Participation. Energy Res. Soc. Sci. 2023, 98, 103037. [Google Scholar] [CrossRef]
  100. Nie, X.; Jin, X.; Wu, J.; Li, W.; Wang, H.; Yao, Y. Evaluation of Coastal Wetland Ecosystem Services Based on Modified Choice Experimental Model: A Case Study of Mangrove Wetland in Beibu Gulf, Guangxi. Habitat. Int. 2023, 131, 102735. [Google Scholar] [CrossRef]
  101. Cummings, R.G.; Taylor, L.O. Unbiased Value Estimates for Environmental Goods: A Cheap Talk Design for the Contingent Valuation Method. Am. Econ. Rev. 1999, 89, 649–665. [Google Scholar] [CrossRef]
  102. Whitehead, J.C.; Cherry, T.L. Willingness to Pay for a Green Energy Program: A Comparison of Ex-Ante and Ex-Post Hypothetical Bias Mitigation Approaches. Resour. Energy Econ. 2007, 29, 247–261. [Google Scholar] [CrossRef]
  103. Kim, H.-J.; Kim, J.-H.; Yoo, S.-H. Social Acceptance of Offshore Wind Energy Development in South Korea: Results from a Choice Experiment Survey. Renew. Sust. Energy Rev. 2019, 113, 109253. [Google Scholar] [CrossRef]
  104. Buxton, R.T.; Pearson, A.L.; Allou, C.; Fristrup, K.; Wittemyer, G. A Synthesis of Health Benefits of Natural Sounds and Their Distribution in National Parks. Proc. Natl. Acad. Sci. USA 2021, 118, e2013097118. [Google Scholar] [CrossRef] [PubMed]
  105. Fisher, J.C.; Irvine, K.N.; Bicknell, J.E.; Hayes, W.M.; Fernandes, D.; Mistry, J.; Davies, Z.G. Perceived Biodiversity, Sound, Naturalness and Safety Enhance the Restorative Quality and Wellbeing Benefits of Green and Blue Space in a Neotropical City. Sci. Total Environ. 2021, 755, 143095. [Google Scholar] [CrossRef] [PubMed]
Figure 1. Research area.
Land 13 00678 g001
Figure 2. Results of the Q-methodology: (a) Q-methodology results for coastal vulnerable groups; and (b) Q-methodology results for tourist groups. The scores represent the relative importance of corresponding Q-statements.
Land 13 00678 g002
Figure 3. Marginal willingness to pay (MWTP) for tourist groups from various regions in China.
Land 13 00678 g003
Table 1. Description of each attribute level and index.
AttributeLevelsIndicators/Description
Coastal vulnerable groups (CVGs)Offshore distance3 kmLand 13 00678 i001
15 kmLand 13 00678 i002
50 kmLand 13 00678 i003
Tourist volumeReducedLand 13 00678 i004
UnchangedLand 13 00678 i005
IncreasedLand 13 00678 i006
Risk of fish count reductionLow riskThe influence of radiation and sound waves from offshore wind farms (OWFs)
Impacts of closed fishing areas
Risk
High risk
Power obtainabilityUnchangedPower tariff reduction; power supply priority; power supply stability;
Small increases
Large increases
Compensation amounts (CNY/person/month)50, 100, 150The amount of compensation each person receives per month
Tourist groupsOffshore distance3 kmLand 13 00678 i007
15 kmLand 13 00678 i008
50 kmLand 13 00678 i009
ScaleSmallLand 13 00678 i010
MediumLand 13 00678 i011
LargeLand 13 00678 i012
Fish countUnchangedCoral reef-like enrichment effect, can be used for leisure fishing
Small increase
Substantial increase
Coastal acoustics landscapeLow turbine soundTurbine sound;
waves sound;
seabirds sound;
Medium turbine sound
Loud turbine sound
Payments (yuan/person)50, 100, 150The amount each person receives every time
Table 2. Sociodemographic profile of survey respondents.
CharactersCVGsTourist Groups
Sample size3141010
Sex distribution
Female49.68%50.50%
Male50.32%49.50%
Age distribution
18–3026.11%64.75%
31–4019.43%22.18%
41–5021.34%8.71%
51–6018.79%2.67%
Over 6114.44%1.68%
Highest level of education
Primary school and below20.70%1.09%
Middle school35.67%1.68%
High school/secondary school20.06%8.81%
Junior college11.15%10.30%
Bachelor’s degree or above12.42%78.12%
Household income (CNY/year)
Less than 50,0008.60%11.98%
50,000–100,00045.54%23.56%
100,000–150,00029.62%26.63%
150,000–200,00010.51%18.42%
Over 200,0005.73%19.41%
Regions
East China 29.70%
South China 14.55%
Central China 16.14%
Southwest 15.25%
North China 10.50%
Northeast 6.63%
Northwest 7.23%
Attitude
Attitude to offshore wind power 4.61
Willingness to visit OWFs or beaches 4.23
Willingness to pay for OWF views 3.43
Note: The attitude part is scored from 1 to 5, where the higher the score, the greater the support and the stronger the willingness.
Table 3. Random parameter Logit model estimation results for coastal vulnerable groups.
VariableCVG
CoefficientStandard Error
Offshore distance0.2060 *0.1215
Tourist volume0.7580 ***0.2135
Risk of fish count reduction−1.3352 ***0.3689
Power obtainability0.3751 *0.2059
Compensation amounts0.0337 **0.0016
Log likelihood−556.2949
Note: ***, **, and * indicate that the estimated value is significant at the level of 1%, 5%, and 10%, respectively.
Table 4. Random parameter Logit model estimation results for tourist groups.
VariableModel without Cut-OffsModel with Cut-Offs
CoefficientStandard ErrorCoefficientStandard Error
Scale−0.0467 **0.0219−0.00230.0302
Offshore distance−0.2120 ***0.0203−0.1001 ***0.0313
Fish count0.0961 ***0.02850.0703 **0.0346
Coastal acoustics landscape−0.2044 ***0.0191−0.0780 **0.0358
Payments−0.0065 ***0.0005−0.0029 ***0.0006
Scale_cutoff −0.1835 ***0.0479
Offshore distance_cutoff −0.2323 ***0.0493
Fish count_cutoff −0.2043 ***0.0545
Coastal acoustics Landscape_cutoff −0.3089 ***0.0651
Payments_cutoff −0.0079 ***0.0010
Log likelihood−6365.3996 −6299.2261
Note: *** and ** indicate that the estimated value is significant at the level of 1% and 5% respectively.
Table 5. Comparison of MWTA and MWTP data.
CVGTourist
MWTA(CNY/person/year)6832.44
MWTP(CNY/person) 96.00
Number of people200,00033,495,600
Total amount1,366,488,0003,215,577,600
Income growth1,849,089,600
Disclaimer/Publisher’s Note: The statements, opinions and data contained in all publications are solely those of the individual author(s) and contributor(s) and not of MDPI and/or the editor(s). MDPI and/or the editor(s) disclaim responsibility for any injury to people or property resulting from any ideas, methods, instructions or products referred to in the content.

