Article

Spatial and Temporal Dynamics of Ecological Parameters in Various Land Use Types in China during the First 20 Years of the 21st Century

1
College of Geography and Environment Sciences, Northwest Normal University, Lanzhou 730070, China
2
Key Laboratory of Resource Environment and Sustainable Development of Oasis, Lanzhou 730070, China
3
College of Forestry Engineering, Gansu Forestry Polytechnic, Tianshui 741020, China
4
Surveying and Mapping Engineering Institute of Gansu Province, Lanzhou 730070, China
*
Author to whom correspondence should be addressed.
Land 2024, 13(5), 572; https://doi.org/10.3390/land13050572
Submission received: 27 March 2024 / Revised: 13 April 2024 / Accepted: 20 April 2024 / Published: 25 April 2024
(This article belongs to the Special Issue Advances in Land Use and Land Cover Mapping)

Abstract

:
Ecological quality in China has experienced significant improvements due to the interplay of climate change and human activities. Nevertheless, previous studies exploring the trend of ecological parameters have always overlooked the effects of land use types. Therefore, in this study, we explored the spatiotemporal variation in ecological parameters in various land use types and discussed the relationship between ecological parameters and climatic factors in China during the first 20 years of the 21st century. The results show that: (1) The area of grassland and unutilized land decreased, and the area of other land use types increased. (2) Distinct variations in the average, slope, and interval distribution of ecological parameters across various land use types were evident. Particularly significant increases in ecological parameters were observed in cultivated land and forest. (3) The influence of land use and land cover change on ecological parameters was evident. The conversion of cultivated land, forest, and grassland into water bodies, constructive land, and unutilized land resulted in a significant decrease in ecological parameters. (4) The distinct climatic conditions resulted in heightened monthly variations in the ecological parameters. Significant monthly fluctuations in ecological parameters were observed for cultivated land, forest, grassland, and constructed land, while water bodies and unutilized land did not exhibit such variations. (5) The correlation between ecological parameters and climatic factors varied considerably in various land use types in different regions.

1. Introduction

Land use and land cover (LULC) changes represent a direct manifestation of the impact of human activities on the Earth’s surface ecosystem, serving as a crucial link between the natural ecosystem and social and economic endeavors [1,2,3,4]. This phenomenon significantly contributes to global change processes by impacting various biophysical parameters, including surface albedo and roughness, photosynthetically active radiation, and evapotranspiration [5,6]. These effects have far-reaching implications on surface radiant energy balance, biogeochemical cycles, and ecosystem services [7,8,9]. LULC is commonly utilized in modeling global climate and biogeochemical effects, with the United Nations Sustainable Development Goals (SDGs) underscoring its pivotal role in goal formulation and attainment [10,11,12,13,14]. In response to escalating challenges related to population–resource–environment dynamics, the research on LULC has evolved to include a more nuanced examination of its impacts at diverse spatiotemporal scales, the driving forces behind its changes, and the resultant effects [15,16].
In the context of climate change, vegetation exhibits distinct seasonal and interannual variations [17,18], playing a crucial role in climate regulation through its impact on factors such as evapotranspiration, surface albedo, and surface roughness. Additionally, vegetation significantly contributes to soil and water conservation and ecological enhancement [18]. The evaluation of vegetation ecosystem quality is commonly employed to assess the growth status of vegetation in specific areas [19]. The most recent ecological environment standard, HJ1172–2021 [20], released by the Ministry of Ecology and Environment of the People’s Republic of China in May 2021, outlines the technical guidelines for the National Ecological Condition Survey and Assessment, particularly focusing on Ecosystem Quality Assessment. This assessment primarily considers parameters such as vegetation coverage (VC), leaf area index (LAI), and gross primary productivity (GPP). VC is utilized to describe the horizontal structural state of vegetation [21,22], while LAI indicates the vertical structural complexity of vegetation [23,24], and GPP reflects the photosynthetic capacity of vegetation [25,26]. It is worthwhile that VC calculations often rely on the dimidiate pixel model, which assumes a pixel comprises vegetation and non-vegetation components, with its spectral characteristics being influenced by soil and vegetation types [27]. Consequently, the normalized difference vegetation index (NDVI) is proposed as an alternative to VC for assessment purposes.
Numerous studies have investigated alterations in ecological parameters and their reactions to climate change in the broader context of global change [28,29,30]. However, it is important to highlight that a majority of these studies has typically examined the entire study area as a whole [24,31,32,33,34], with a limited focus on variations in ecological parameters across different land use or vegetation types in the region in response to climate change [35,36]. For instance, studies have demonstrated significant fluctuations in the correlations between the normalized difference vegetation index (NDVI) and temperature among diverse vegetation types in Inner Mongolia [37], as well as varying associations between leaf area index (LAI) and a range of climatic factors across different vegetation types in China [24]. Furthermore, existing studies predominantly concentrate on individual ecological parameters [38,39,40,41], with fewer investigations into the changes in multiple ecological parameters and their responses to climate variations. Therefore, this study introduces the enhanced vegetation index (EVI) and net primary productivity (NPP) in addition to the commonly used ecological parameters to enhance ecosystem quality assessment, enabling a more comprehensive understanding of vegetation dynamics related to growth status and photosynthetic capacity influenced by LULC. It is crucial to acknowledge that the NDVI is influenced by atmospheric conditions, soil characteristics, and the vegetation canopy [42], leading to issues such as saturation. Hence, the inclusion of the EVI addresses the limitations of the NDVI by incorporating soil adjustment parameters and feedback mechanisms to effectively resolve the related challenges [43,44]. Net primary productivity (NPP), on the other hand, represents the organic carbon fixed by vegetation minus that consumed through respiration, thereby emphasizing the distinction between vegetated and non-vegetated areas [45,46,47,48].
The surge of industrialization and urbanization accompanying global economic expansion has played a significant role in the rise of warming trends worldwide [49,50,51,52,53,54]. A global phenomenon is the widespread degradation of vegetation, as many vegetated areas have been converted into urban and industrial zones [55,56]. However, it is important to highlight that China has initiated a series of ecological initiatives that have helped mitigate degradation and promote greening efforts. As a result of the combined impacts of global warming, industrialization, urbanization, and ecological projects, China has successfully curbed and begun to restore land degradation, with the ecological environment showing positive progress. Nevertheless, there are significant spatial variations in the extent of restoration efforts across different regions.
Hence, it is imperative to investigate alterations in ecological parameters across various land use types and their reactions to climate change. The objectives of this research were to (1) analyze the evolution of land use types and ecological parameters in China over the past two decades; (2) investigate the relationship between ecological parameters of various land use types and meteorological variables; and (3) elucidate the influence of LULC on ecological parameters. The outcomes of this study are anticipated to provide valuable data and findings to inform the development of ecological rehabilitation strategies.

2. Materials and Methods
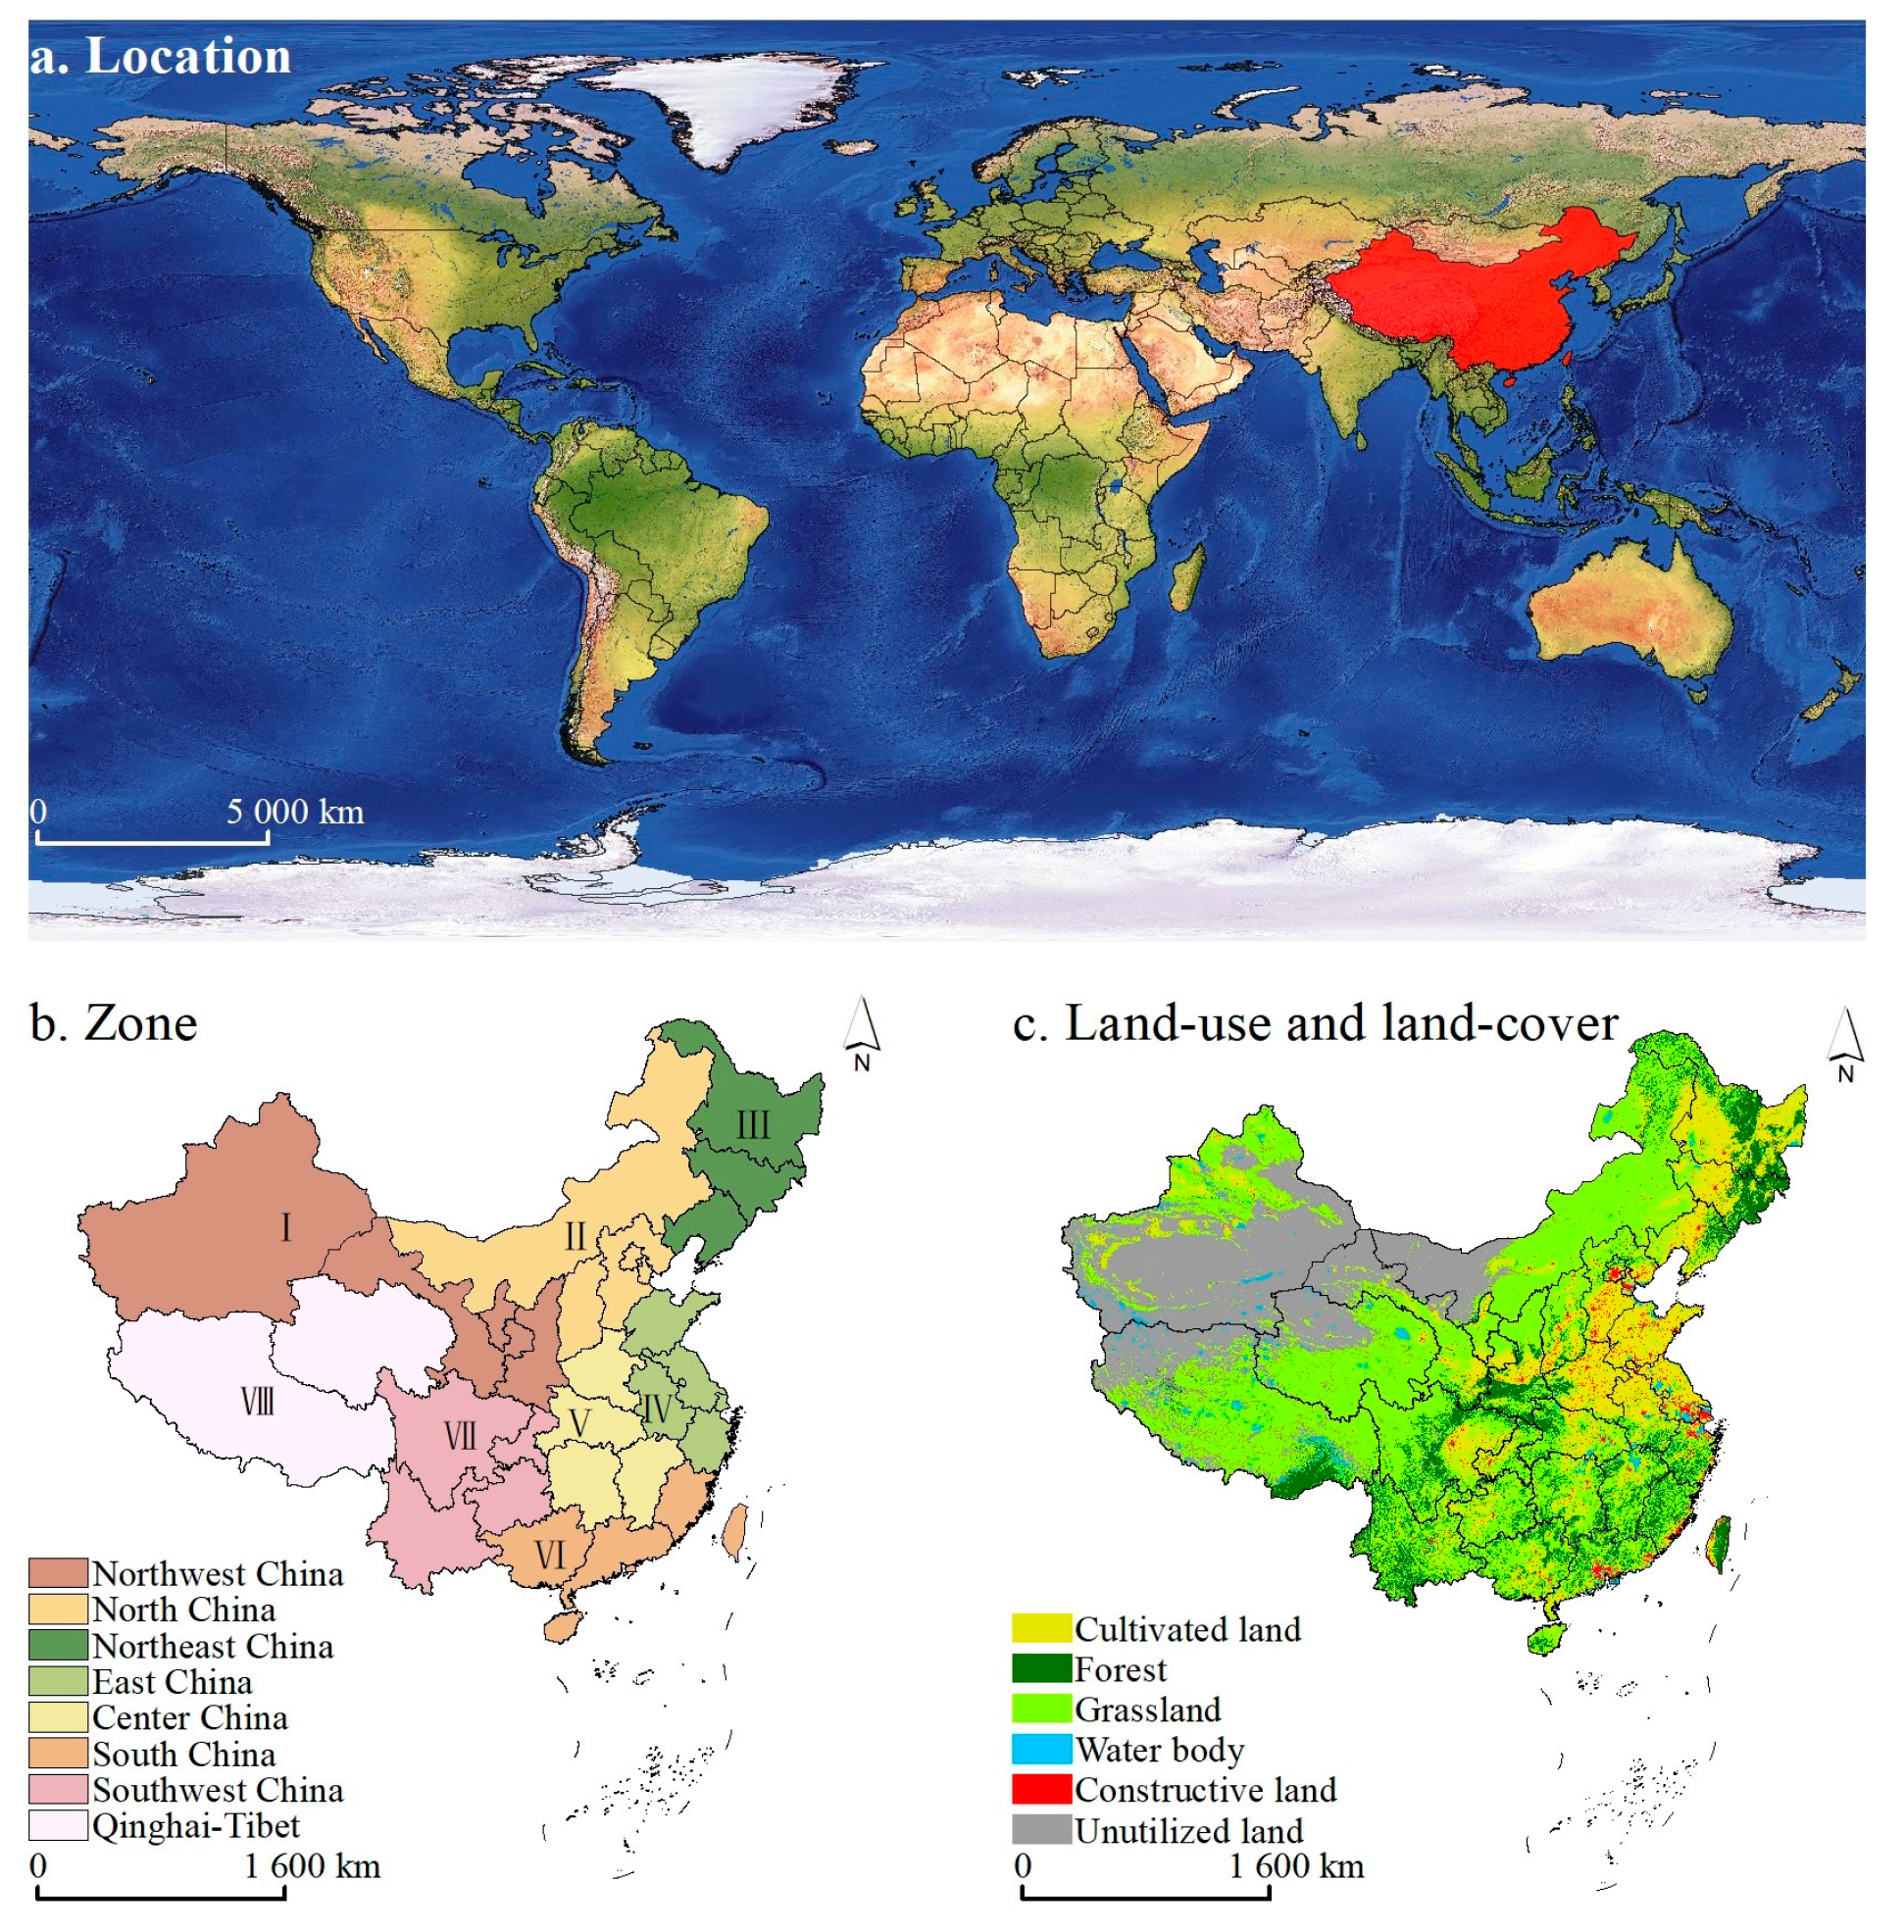
2.1. Research Area

The range of the study area is 73°40′ E~135°2′ E and 3°51′ N~53°31′ N. Located in Eastern Asia and near the Pacific Ocean (Figure 1a), it covers a land area of about 960 × 104 km2 and an ocean area of about 473 × 104 km2. The topography presents a terraced distribution, decreasing from West to East. It is mainly dominated by plateaus and mountains, accounting for 59.3% of the land. The Tibetan Plateau is located in Western China, whose average altitude is higher than 4000 m. The direction of the mountains is mainly East–West and Northeast—Southwest. It is divided into three steps by high mountains. The divided lines are the Kunlun–Qilian–Hengduan Mountains and the Daxinganling–Taihang–Wu–Xuefeng Mountains. The plains are situated on the third terrace, encompassing regions such as Northeast China, North China, and the Middle and Lower Yangtze Plain. The distinct geographical positioning and elevation gradients result in regional climatic variations, categorized as continental, monsoon, and plateau mountain climates, with the monsoon climate being the most prominent. Temperature exhibits a decreasing trend from lower to higher latitudes, with the Tibetan Plateau acting as a low-value center due to its uplift. Precipitation patterns are influenced by the region’s land–sea location and topography, showing a decline from Southeast to Northwest. Land use and land cover predominantly comprise grassland and unutilized land, accounting for 46.31% and 23.72% in 2020, respectively (Figure 1c). Considering factors like topography and climate, the research area was divided into eight regions based on provincial administrative districts (Figure 1b), including Northwest China (NWC), North China (NC), Northeast China (NEC), East China (EC), Central China (CC), South China (SC), Southwest China (SWC), and Qinghai–Tibet (QT).

2.2. Data Sources

In this study, the NDVI, EVI, LAI, GPP, and NPP were selected as parameters to characterize vegetation growth dynamics. These variables were obtained from MODIS datasets as outlined in Table 1. The NDVI was computed based on the reflectance values between red (620~670 nm) and near-infrared (841~876 nm) bands, while the EVI was derived from the reflectance values across red, blue (459~479 nm), and near-infrared bands. Annual datasets for NDVI, EVI, and LAI were constructed by calculating the mean values for each year. The MOD17A3HGF dataset was utilized to represent vegetation productivity, encompassing both GPP and NPP, with a temporal resolution of 1 year, facilitating direct utilization in the study.
N D V I = ρ N I R ρ R E D ρ N I R + ρ R E D
E V I = 2.5 × ρ N I R ρ R E D ρ N I R + 6 × ρ R E D 7.5 × ρ B L U E + 1
where ρNIR, ρRED, and ρBLUE are the reflectance values of the near-infrared, red, and blue bands after atmospheric correction, respectively.
The data utilized in this study include MCD12Q1/MOD15A2H/MOD17A3HGF covering the period from 2001 to 2020, with the MOD/MYD13A1 data being incomplete due to the commencement of MYD13A1 data in July 2002. Consequently, only the annual mean values of MOD13A1 were considered for the NDVI and EVI in 2001 and 2002, while the annual mean values of both MOD13A1 and MYD13A1 were used for the years 2003 to 2020, respectively.
The MCD12Q1 dataset, updated in 2001, was employed for land use type (LUT) differentiation, with the IGBP system comprising seventeen types, including natural vegetation and human-altered and non-vegetation types, being selected for classification. This study integrated the IGBP classification system into six types, as illustrated in Figure 2, based on the data characteristics and previous research by Liu’s team [57,58,59].
In this study, we utilized the 1 km national spatial resolution dataset on air temperature and precipitation developed by Wang et al. [60]. The dataset covers the period from 2000 to 2012 and was derived from the “Daily value dataset of China’s surface climatic data” compiled by the National Meteorological Information Center of China. The data preprocessing procedure involved various steps, such as data reading, merging, verification, statistical analysis, and the creation of a spatial interpolation batch code. Subsequently, the annual temperature and precipitation dataset with a spatial resolution of 1 km was produced using ANUSPLINE interpolation software (version 4.3) [61,62]. The dataset is accessible for download at http://www.sciencedb.cn/dataSet/handle/319 (accessed on 20 December 2023), and for the purposes of this study, it was updated to include data up to 2018. To align with the spatial resolution of the land use and ecological parameters considered in this research, the dataset was resampled by the bilinear method to a resolution of 500 m.

2.3. Methods

The article includes a flowchart illustrating the data processing step in Figure 3, which is divided into three modules based on various datasets. Furthermore, some important methods are discussed in the additional details in this section.

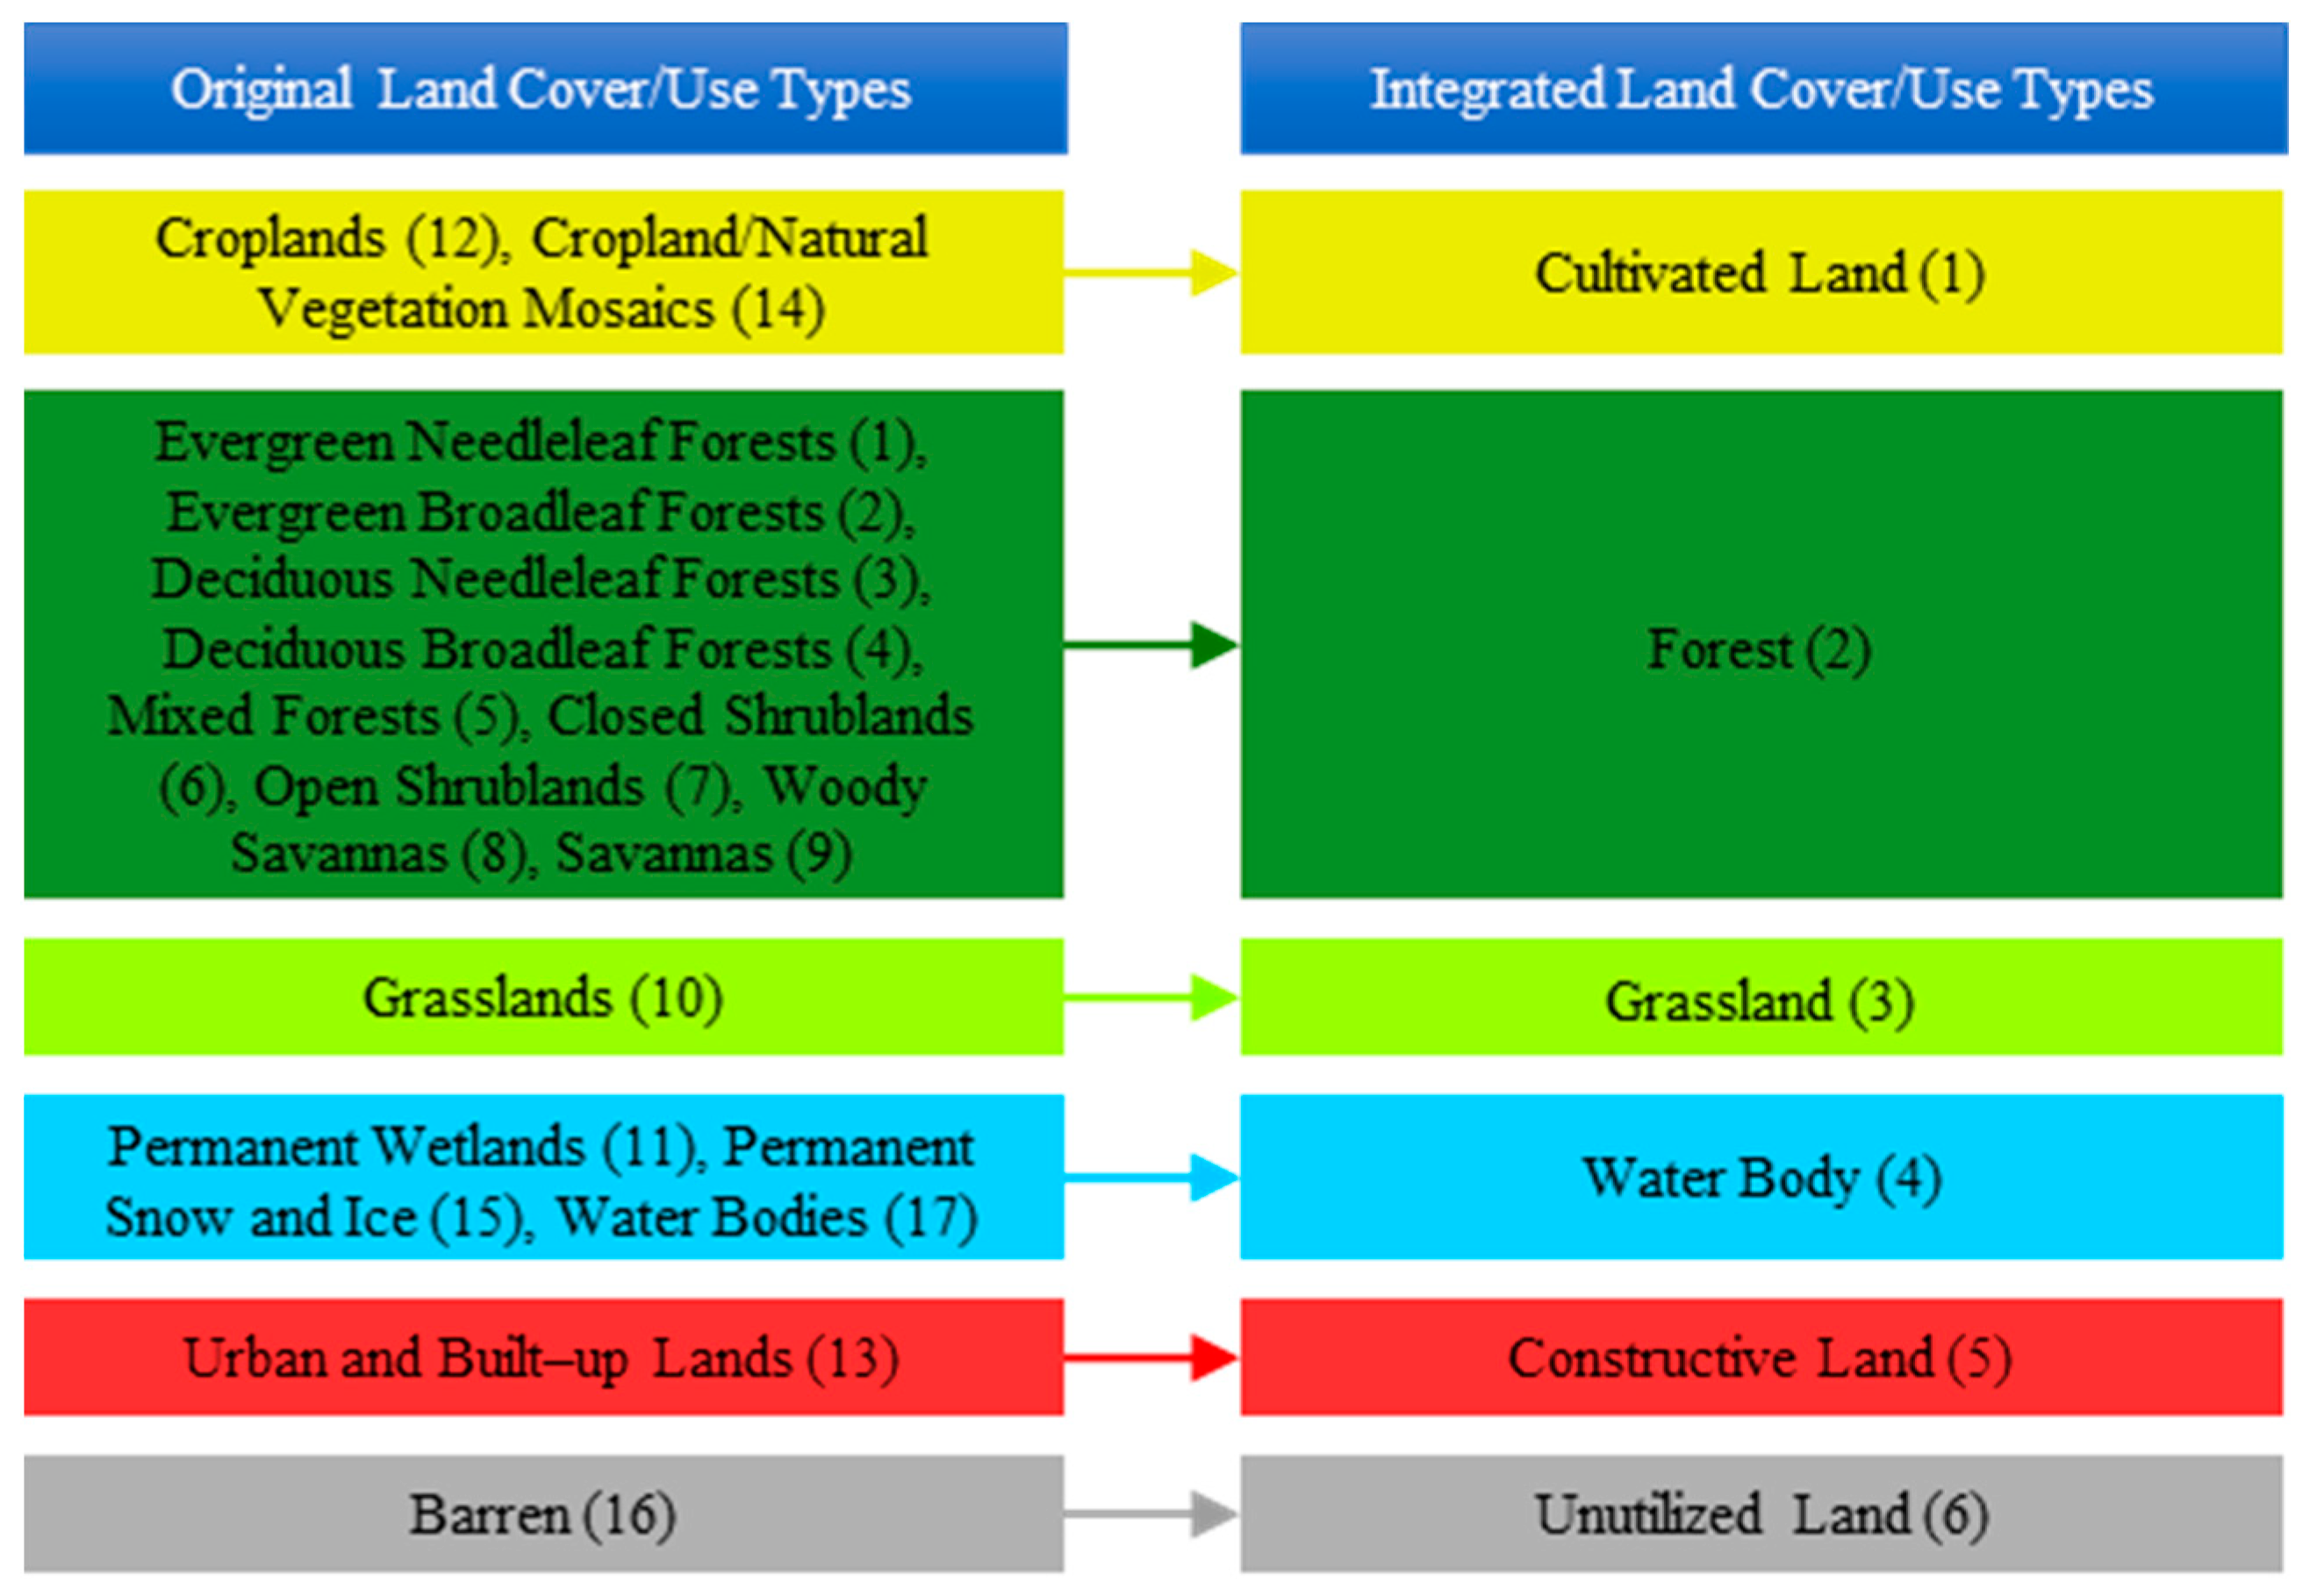
2.3.1. Land Use Change

This study utilized the map fusion [63] method to extract LULC at the pixel level. This was achieved through map algebraic operations in ArcGIS 10.4 software. The equation is as follows:
L C = i = 1 n A i × 10 i 1
where LC is the result of LULC at the pixel scale, i represents different periods, and Ai is the pixel value of land cover types in the i periods. When Ai is equal to Ai–1, we believe that the LUTs of this pixel has been unchanged. Otherwise, it has been changed.

2.3.2. Linear Regression

This research utilized linear regression to calculate the trend of ecological parameters. The fundamental concept of linear regression is the least squares method [64]. R and p-values are key parameters in assessing the impact of linear regression. R represents the proportion of the predicted value explained to assess the effect of linear regression, and p indicates the significance test value of the regression effect.
θ S l o p e = n × i = 1 n i × E I i i = 1 n i i = 1 n E I i n × i = 1 n i 2 i = 1 n i 2
where θSlope is the variation slope of the annual ecological parameters for each pixel. θSlope > 0 suggests an increasing trend of ecological parameters, while θSlope < 0 represents a decreasing trend. n is the count of years and EIi is the mean value of the ecological parameters of the ith year.

2.3.3. Coupled Analysis

In order to measure the influence of LULC on ecological parameters, we introduced the idea of the coupled degree in relation to social science. This concept suggests that, when changes in LULC consistently affect various ecological parameters in a similar way, we consider the coupling between them to be significant.
D E I = E I i + 1 E I i
R D E I = 0 D E I < 0 1 D E I 0
S D E I = i = 1 5 R D E I i
C D E I = S D E I = 0 N e g a t i v e S t r o n g l y S D E I = 1 N e g a t i v e M o d e r a t e l y S D E I = 2 N e g a t i v e W e a k l y S D E I = 3 P ositive W e a k l y S D E I = 4 P ositive M o d e r a t e l y S D E I = 5 P ositive S t r o n g l y
where DEI refers to the difference value of ecological parameters of LULC in alternate years. Then we normalized DEI. If DEI is greater than 0 or equal to 0, we set it as 1; otherwise, it is 0. This allowed us to achieve RDEI. Next, we summed up the RDEI of different ecological parameters to obtain SDEI. Finally, we reclassified SDEI and obtained the coupled degree of LULC on ecological parameters, that is, CDEI.

2.3.4. Correlation Test

The parameters commonly used to test the correlation between multiple variables are mainly divided into three categories, namely Pearson, Spearman, and Kendall. Taking into account the characteristics of the research data, this study used the Pearson correlation coefficient as the standard to quantify the correlation between ecological parameters of different LUTs and meteorological data.
R = n × i = 1 n C l i i × E I i i = 1 n C l i i × i = 1 n E I i n × i = 1 n C l i i 2 i = 1 n C l i i 2 × n × i = 1 n E I i 2 i = 1 n E I i 2
where R refers to the Pearson correlation coefficient between climatic data and ecological indicators, n is the number of years. Clii and EIi are the annual climate data and the mean value of EI of the i-th year, respectively.

3. Results

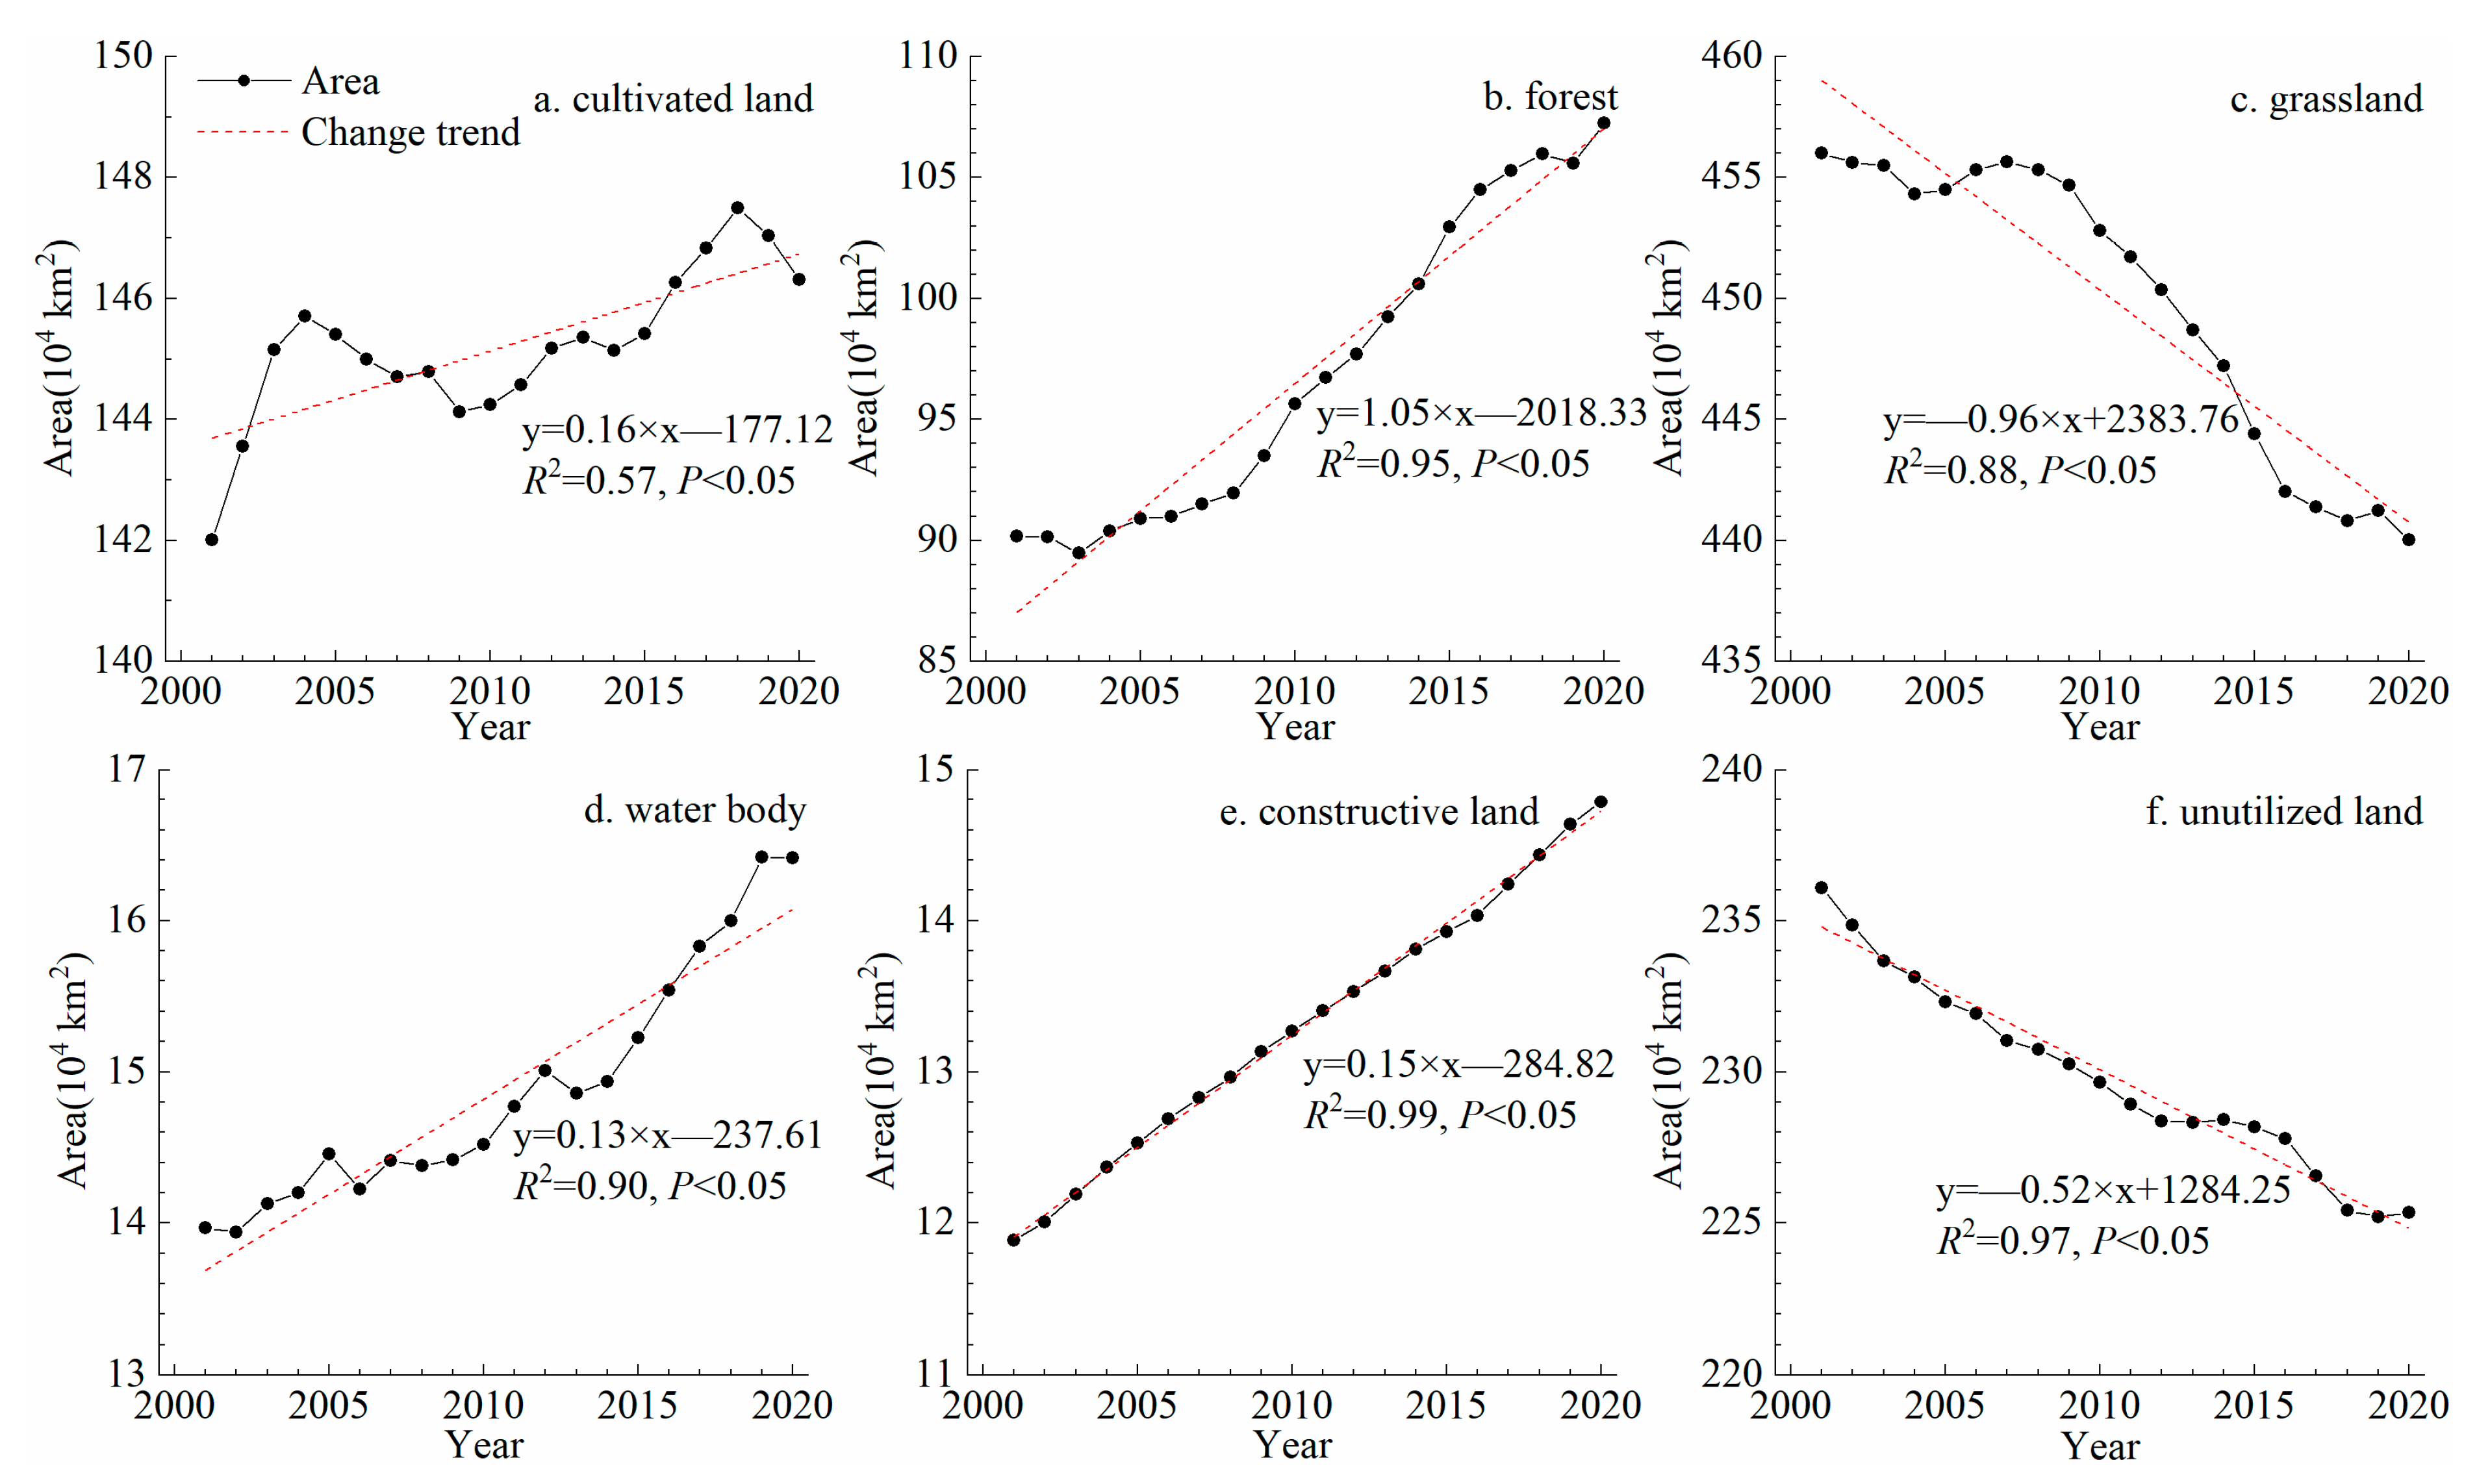
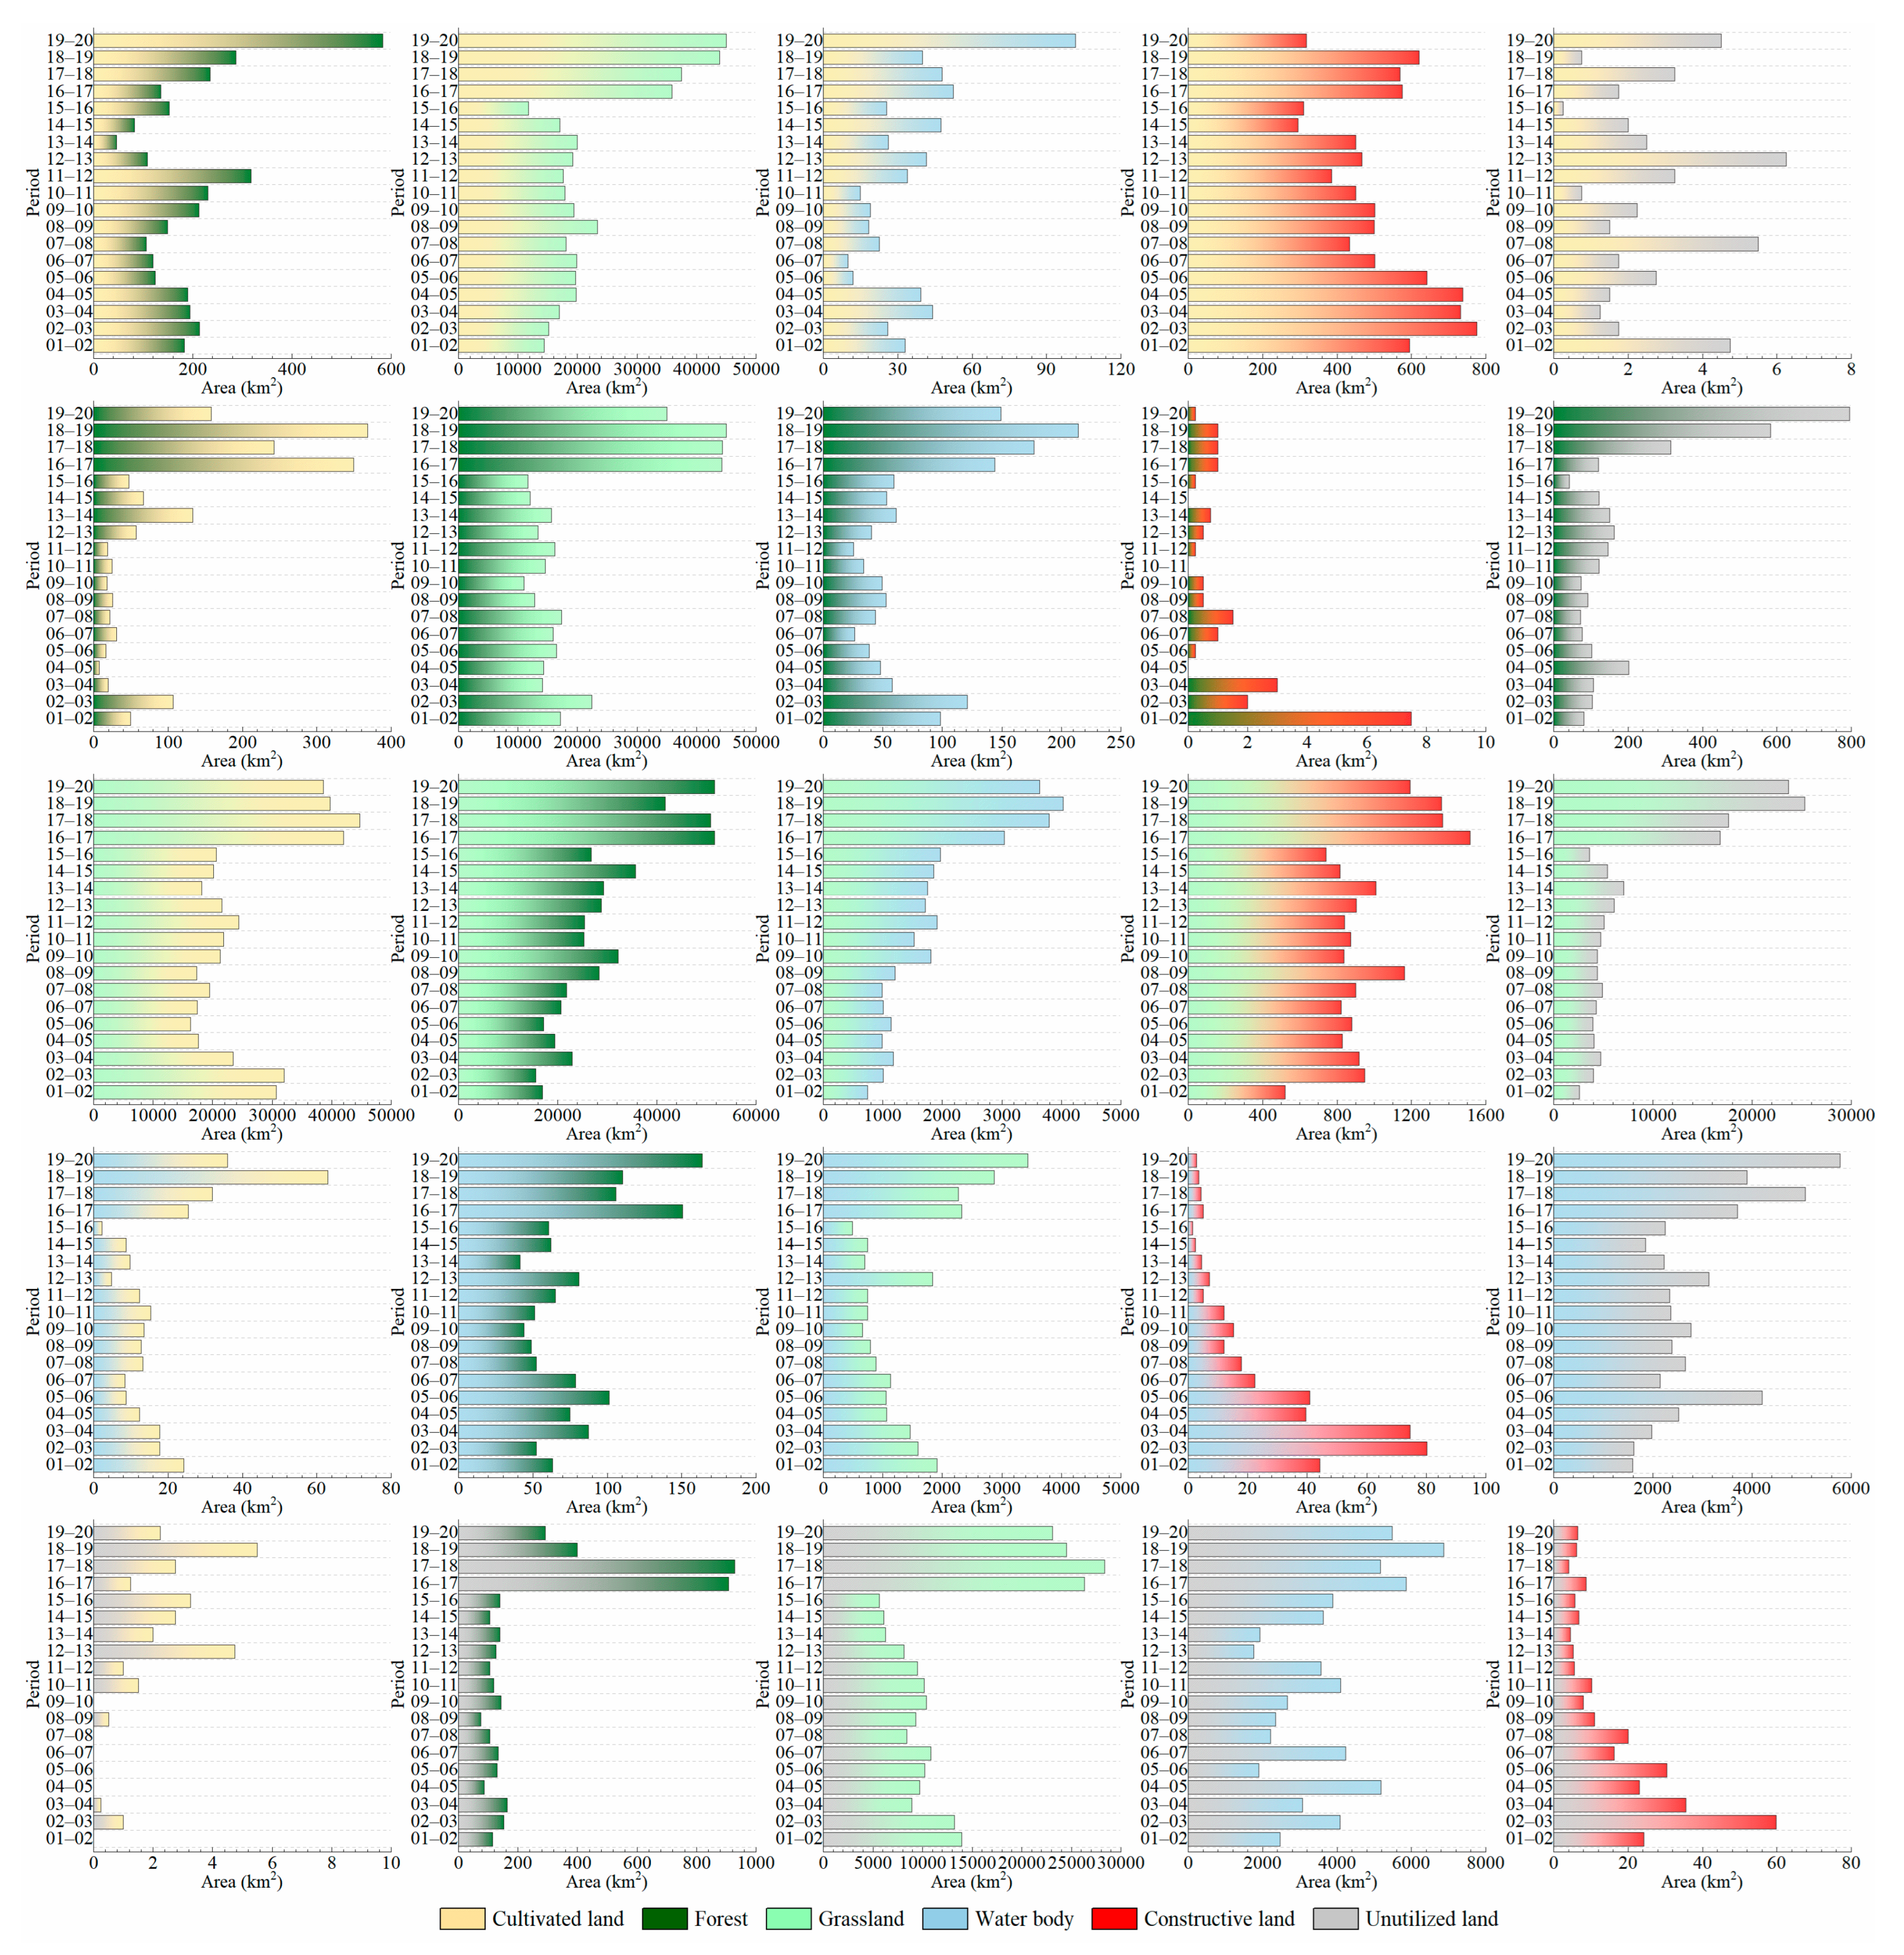
3.1. LULC Changes in the Research Area from 2001 to 2020

In 2020, the distribution of land use types varied, with grassland (46.31%) and unutilized land (23.72%) comprising the largest areas, followed by cultivated land (15.40%) and forest (11.29%). Water bodies (1.37%) and constructed land (1.56%) accounted for the smallest proportions (Figure 4). Grassland dominated land use types across regions, except for the NWC, NEC, and EC regions. The NWC region had the highest percentage of unutilized land (57.20%), while the EC and NEC regions had the highest percentages of cultivated land, at 54.86% and 44.21%, respectively. Regions with forest cover exceeding 20% included NEC (28.07%), SEC (24.25%), and SC (28.20%), which are recognized as significant forested areas in China. The NEC region had the highest proportions of water bodies (5.53%) and constructed land (8.41%). With the exception of NWC (57.20%), NC (17.94%), and QT (34.06%), unutilized land ratios in other regions were below 1%.
Our analysis of LULC on a yearly basis in China indicated that the majority of pixels, accounting for 84.77%, experienced no change over time. Conversely, the rates of single, double, and triple changes were 8.28%, 4.31%, and 1.64%, respectively. With the exception of grassland and unutilized land, the land area of other categories expanded in 2001~2020 in China (Figure 5). Cultivated land, forest, water bodies, and constructed land exhibited growth rates of 0.16 × 10⁴ km2·a−1, 1.05 × 10⁴ km2·a−1, 0.13 × 10⁴ km2·a−1, and 0.15 × 10⁴ km2·a−1, respectively. Conversely, the areas of grassland and unutilized land decreased at rates of –0.96 × 10⁴ km2·a−1 and –0.52 × 10⁴ km2·a−1, respectively.
During the period from 2001 to 2020, there were significant changes in land use patterns across various categories, as illustrated in Figure 6. There was a consistent growth in construction land without any corresponding decrease, indicating the ongoing urbanization in China. The shifts in land area primarily occurred in transitions between grassland and cultivated land, as well as forest areas. Conversely, there were minimal changes observed in water bodies and constructed land. The LULC is closely linked to national policies, particularly those focused on reforestation and converting cultivated land to promote the expansion of grassland and forest. An obvious transition was observed between grassland and unutilized land, where grassland was either degraded to unutilized land due to climate change and human activities, or unutilized land was transformed into grassland as part of ecological restoration efforts to harness the resource potential of unutilized land in the context of climate change. It is important to note that, except for the conversion of other land types to constructed land (coded 15, 25, 35, 45, and 65), which decreased after 2016, the area of other LUTs has shown a relatively significant increase.

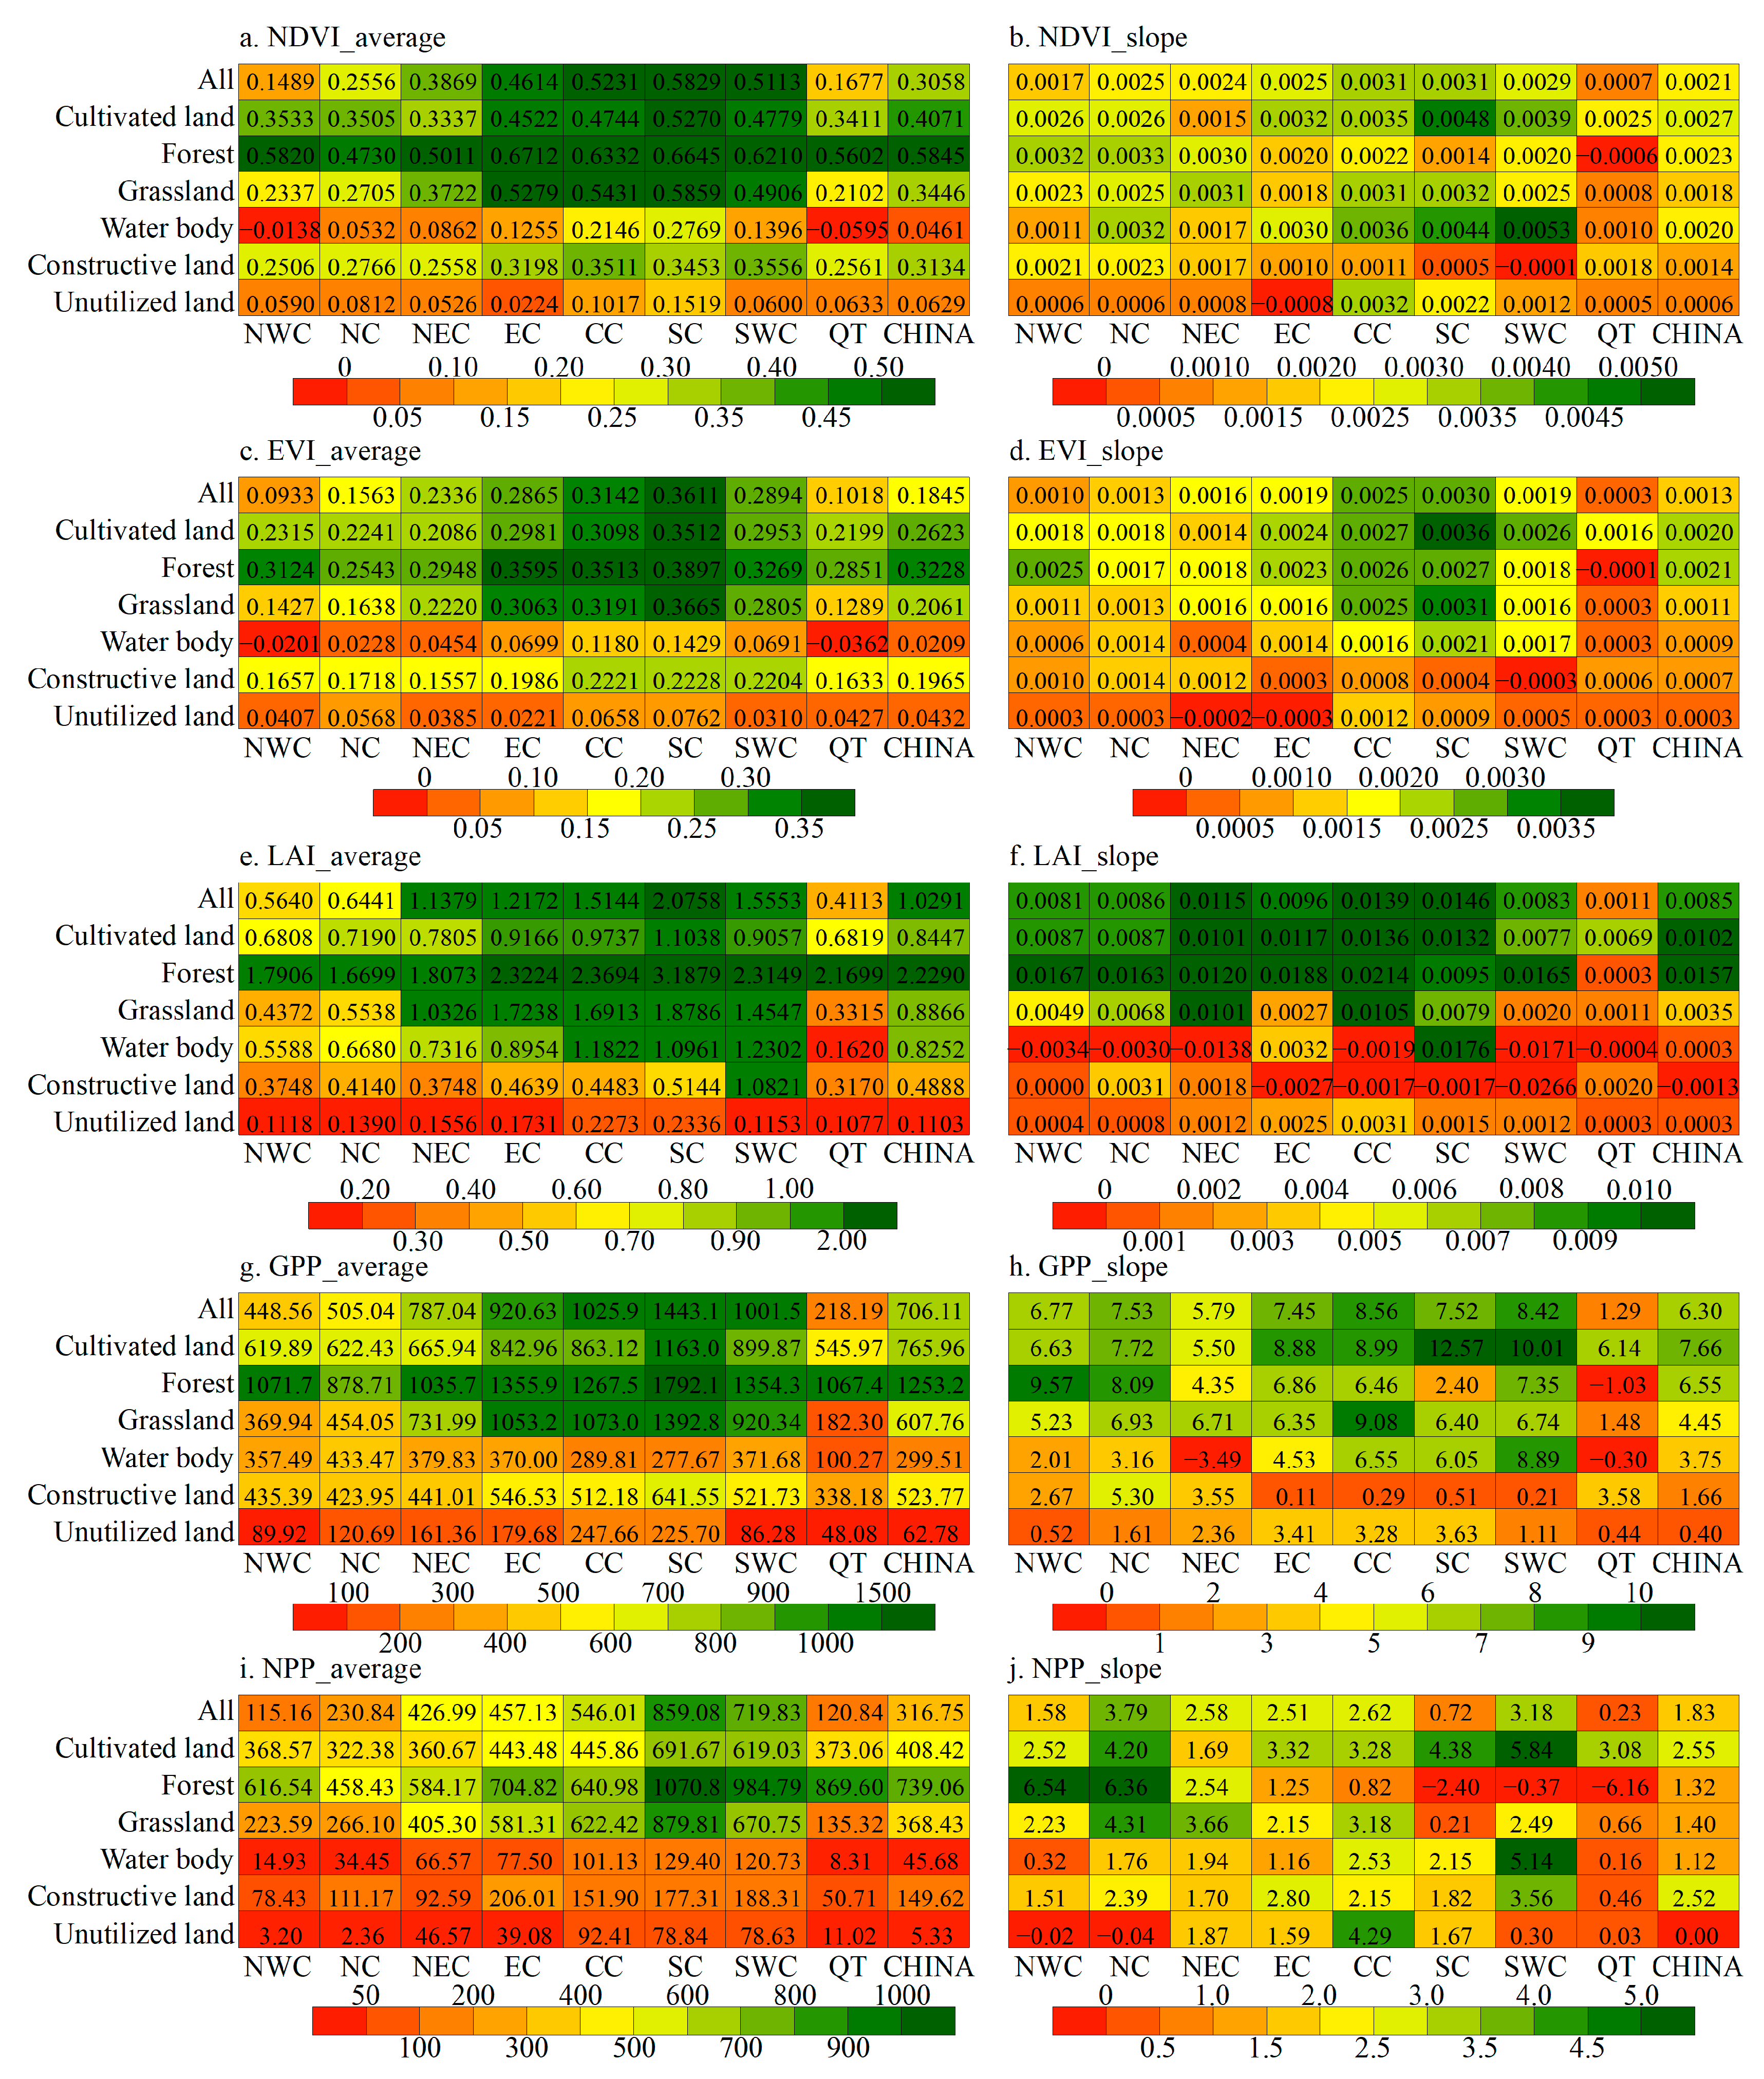
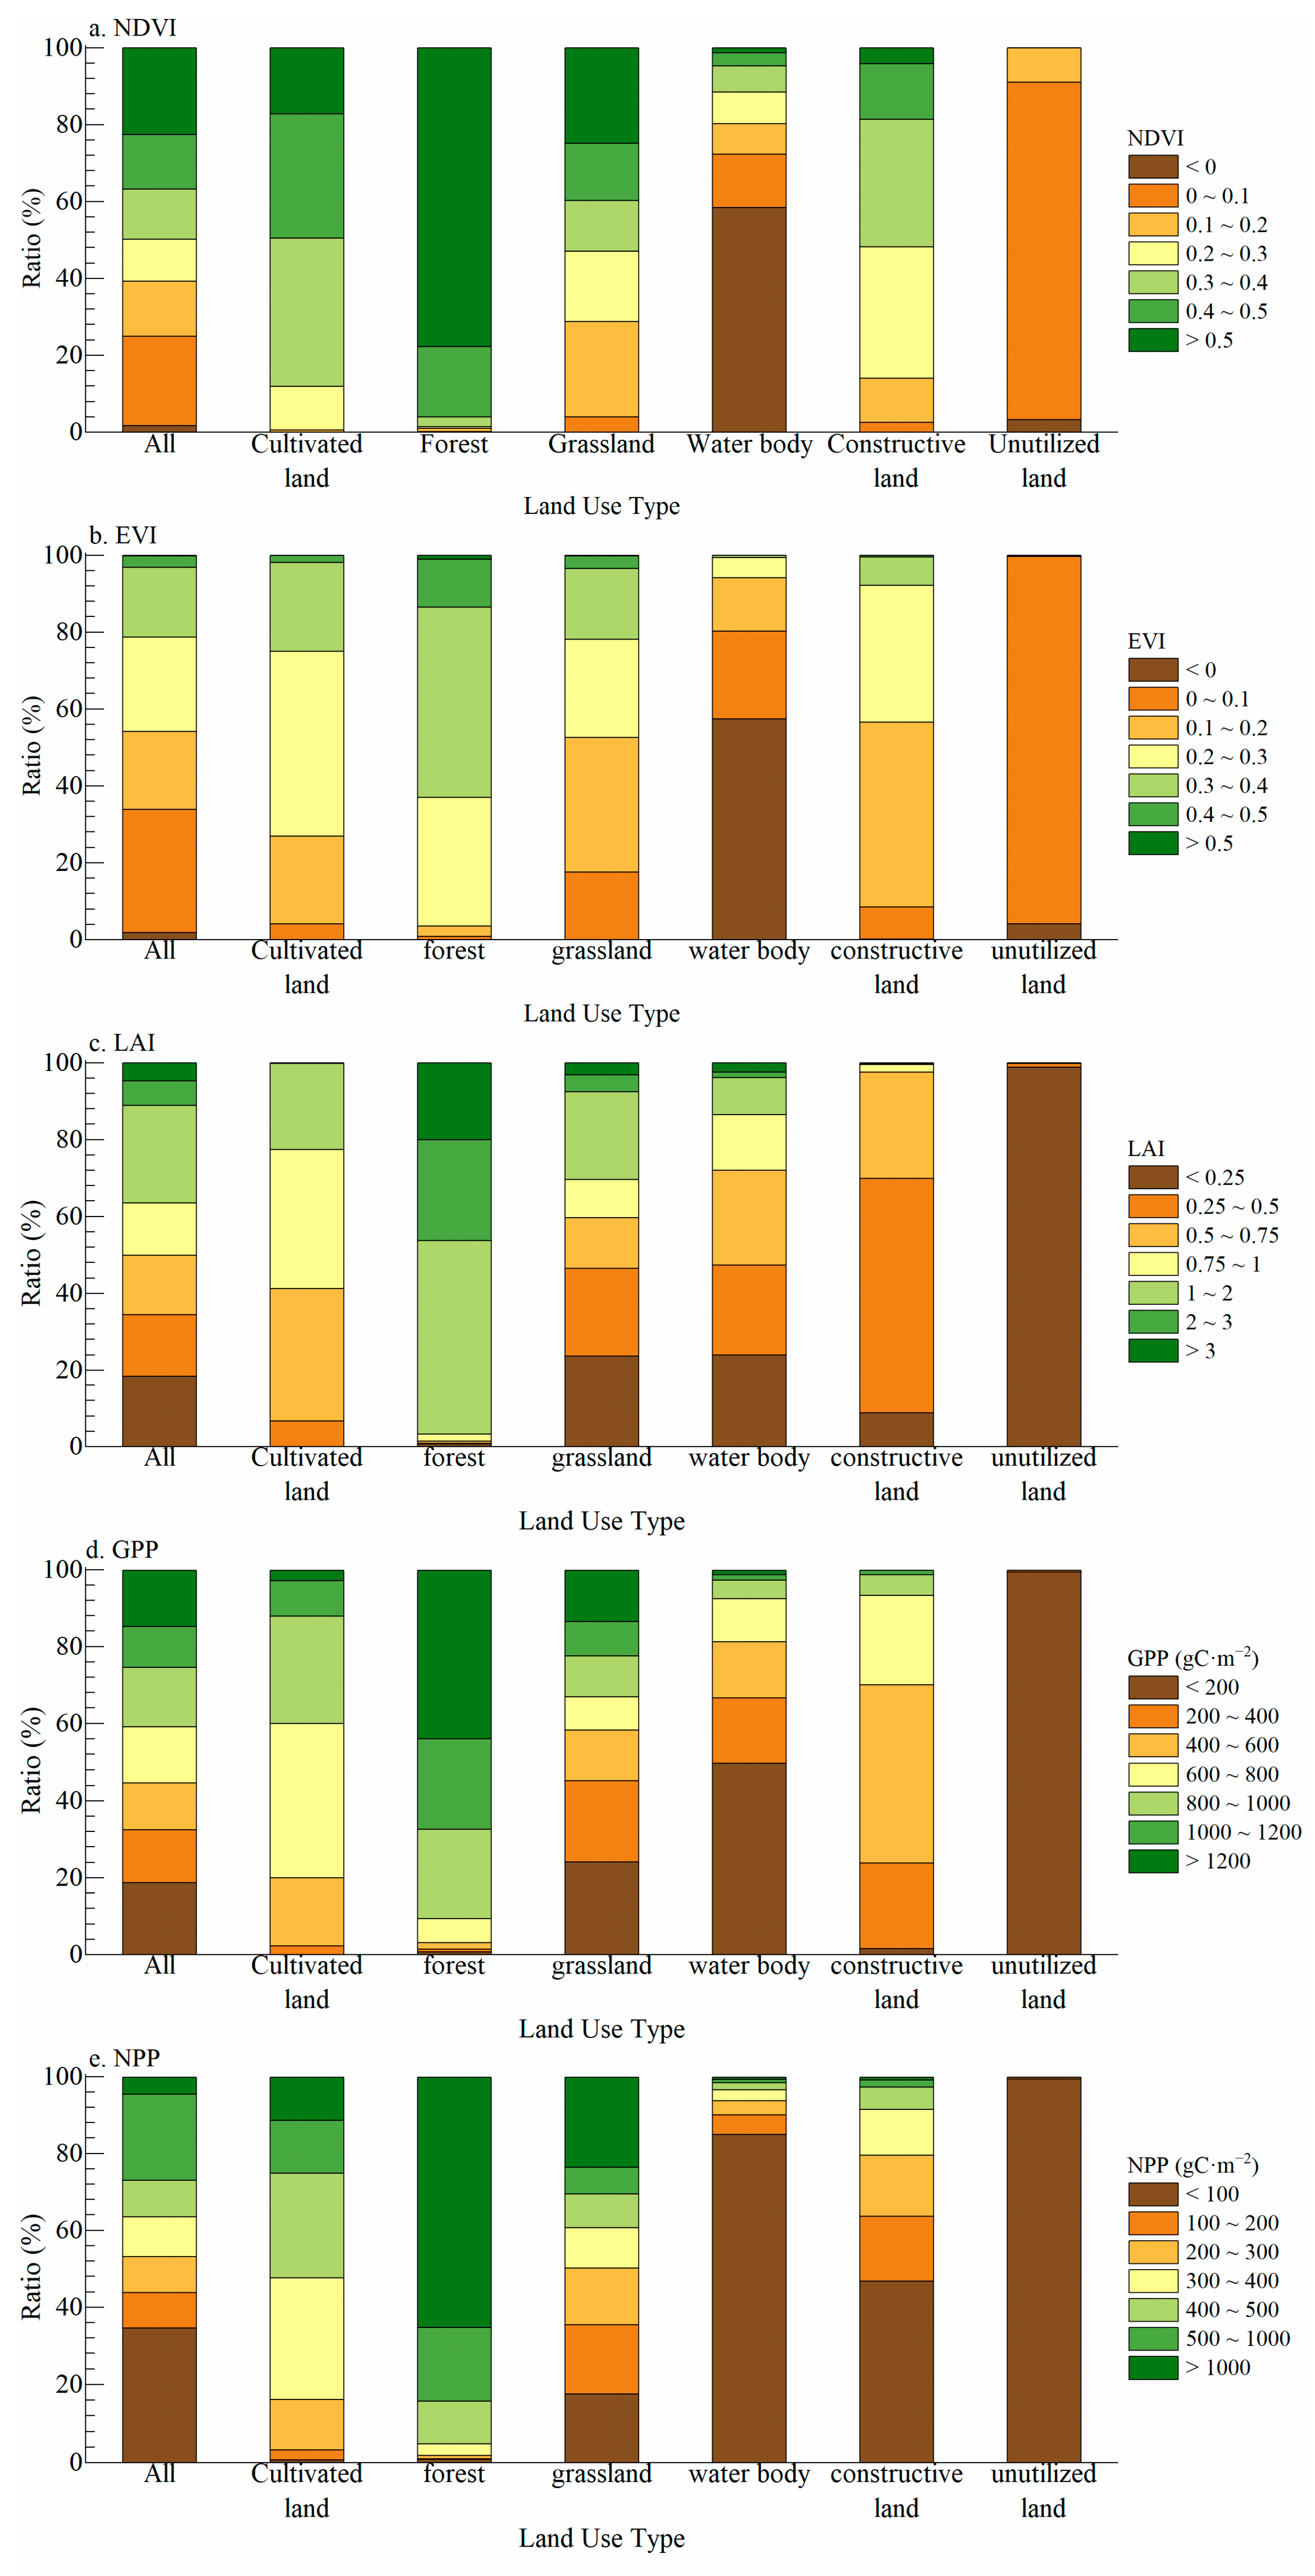
3.2. Ecological Parameter Changes Considering LUTs

Previous studies [24,31,32,33,34] have typically examined the study area as a whole, overlooking the impact of various LUTs on ecological parameters. In our research, we segmented the study area into eight sub-regions based on natural characteristics and administrative boundaries, and subsequently conducted a detailed analysis of ecological parameter variations with respect to LUTs. For instance, the findings from previous studies were primarily applicable to changes in ecological parameters across China and its eight sub-regions. The mean values of the NDVI, EVI, LAI, GPP, and NPP were 0.3058, 0.1845, 1.0291, 706.11 gC·m−2, and 316.75 gC·m−2 in 2001–2020, with corresponding slopes of 0.0021, 0.0013, 0.0085, 6.30 gC·m−2·a−1 and 1.83 gC·m−2·a−1 in China, respectively. Research efforts in sub-regions have primarily concentrated on ecologically vulnerable areas like the NWC, NC, and QT, often with a regional focus that does not account for LUTs. For instance, the mean values of the NDVI, EVI, LAI, GPP, and NPP were 0.1677, 0.1018, 0.4113, 218.19 gC·m−2, and 120.84 gC·m−2, in the 2001–2020 period in QT, with corresponding slopes of 0.0007, 0.0003, 0.0011, 1.29 gC·m−2·a−1, and 0.23 gC·m−2·a−1 in QT, respectively. Compared to China as a whole, QT exhibited lower average values and slopes for ecological parameters.
In contrast to numerous previous investigations, this study centers on the comparison of ecological parameters’ value and slope among various LUTs in different sub-regions (Figure 7). Initially, irrespective of whether considering China as a whole or its sub-regions, forests exhibit the highest ecological parameters, followed by cultivated land and grassland, while water bodies and unutilized land show the lowest ecological parameters. In regions where the forest area exceeds 20%, such as the NEC, SWC, and SC regions, all ecological parameters are only lower than forests and higher than other LUTs. Furthermore, in traditional pastoral areas, like the NWC, NC, and QT regions, the ecological parameters of cultivated land surpass those of grassland, whereas in other regions, this relationship is reversed. As anticipated, in traditional pastoral areas, the ecological parameters of the vegetation areas exceed those of the non-vegetation areas. Constructive land’s ecological parameters are higher than those of water bodies and unutilized land. In summary, the ecological parameters of various LUTs can be categorized into two modes: (1) Forest > Whole area > Cultivated land, Grassland > non-vegetation types (including NEC, EC, CC, SC, and SWC), and (2) Forest > Cultivated land, Grassland > Whole area > non-vegetation types (including NWC, NC, and QT). Among all ecological parameters, net primary productivity (NPP) appears to be the ecological indicator that most closely adheres to the regulation, with the order of NPP being Forest > Cultivated land, Grassland > Construction land > Water body, unutilized land. This can be attributed to the NPP’s characteristic efficiency in which vegetation captures and converts light energy into compounds. The NPP value is directly linked to vegetation growth conditions and remains unaffected by other factors.
The comparison of changes in ecological parameters resulting from various LUTs is a complex process. When considering the entire region and its sub-regions, it can be observed that all ecological parameters exhibit an overall increasing trend, indicating a positive stage of ecological restoration. Specifically, in terms of vegetation types, the ecological parameters of forest decreased in the QT region but increased in other regions. The NDVI, EVI, and NPP of water bodies, as well as the GPP and NPP of construction land, showed an increase. Conversely, the LAIs of both LUTs experienced a significant decrease. The ecological parameters of unutilized land increased in many sub-regions, although the NPP in the NWC and NC regions decreased. The substantial area of unutilized land in the NWC and NC regions contributed to a minor decrease in the NPP of unutilized land in China. In summary, all ecological parameters of cultivated land and grassland increased in China and its sub-regions. However, the ecological parameters of forests in the QT region and the NPP of forests in the SC and SWC regions decreased. Additionally, the LAIs of water bodies and construction land in each sub-region experienced a considerable decrease.
This study not only compared the average values and change rates of ecological parameters across various LUTs, but also conducted an additional analysis of the distribution of their numerical intervals (Figure 8). The findings reveal that ecological parameters related to water bodies, construction land, and unutilized land tend to be concentrated in lower value ranges compared to cultivated land, forest, and grassland. When LUTs were not taken into account, the proportion of ecological parameters in the highest value range varied between 0.15% and 22.65%, while the proportion in the lowest value range ranged from 1.64% to 34.70%. Forest exhibited a higher proportion of high ecological parameters compared to other LUTs, with proportions in the highest value range ranging from 1.03% to 77.69%. In contrast, cultivated land showed a more evenly distributed proportion of ecological parameters across different value ranges. Unutilized land had the lowest proportion of ecological parameters in the highest value range among non-vegetation regions. Additionally, except for the LAI, water bodies generally had a higher proportion of ecological parameters in the low-value range compared to construction land.
In summary, this section initially involves an examination of the average values and trends of ecological parameters on a regional level, followed by overlaying LULC data to assess the variations in average values, trends, and numerical ranges of ecological parameters across various LUTs. Ultimately, it was determined that LULC change exerts a substantial influence on ecological parameters, resulting in significant distinctions in regional attributes.

3.3. Influence of LULC on Ecological Parameters
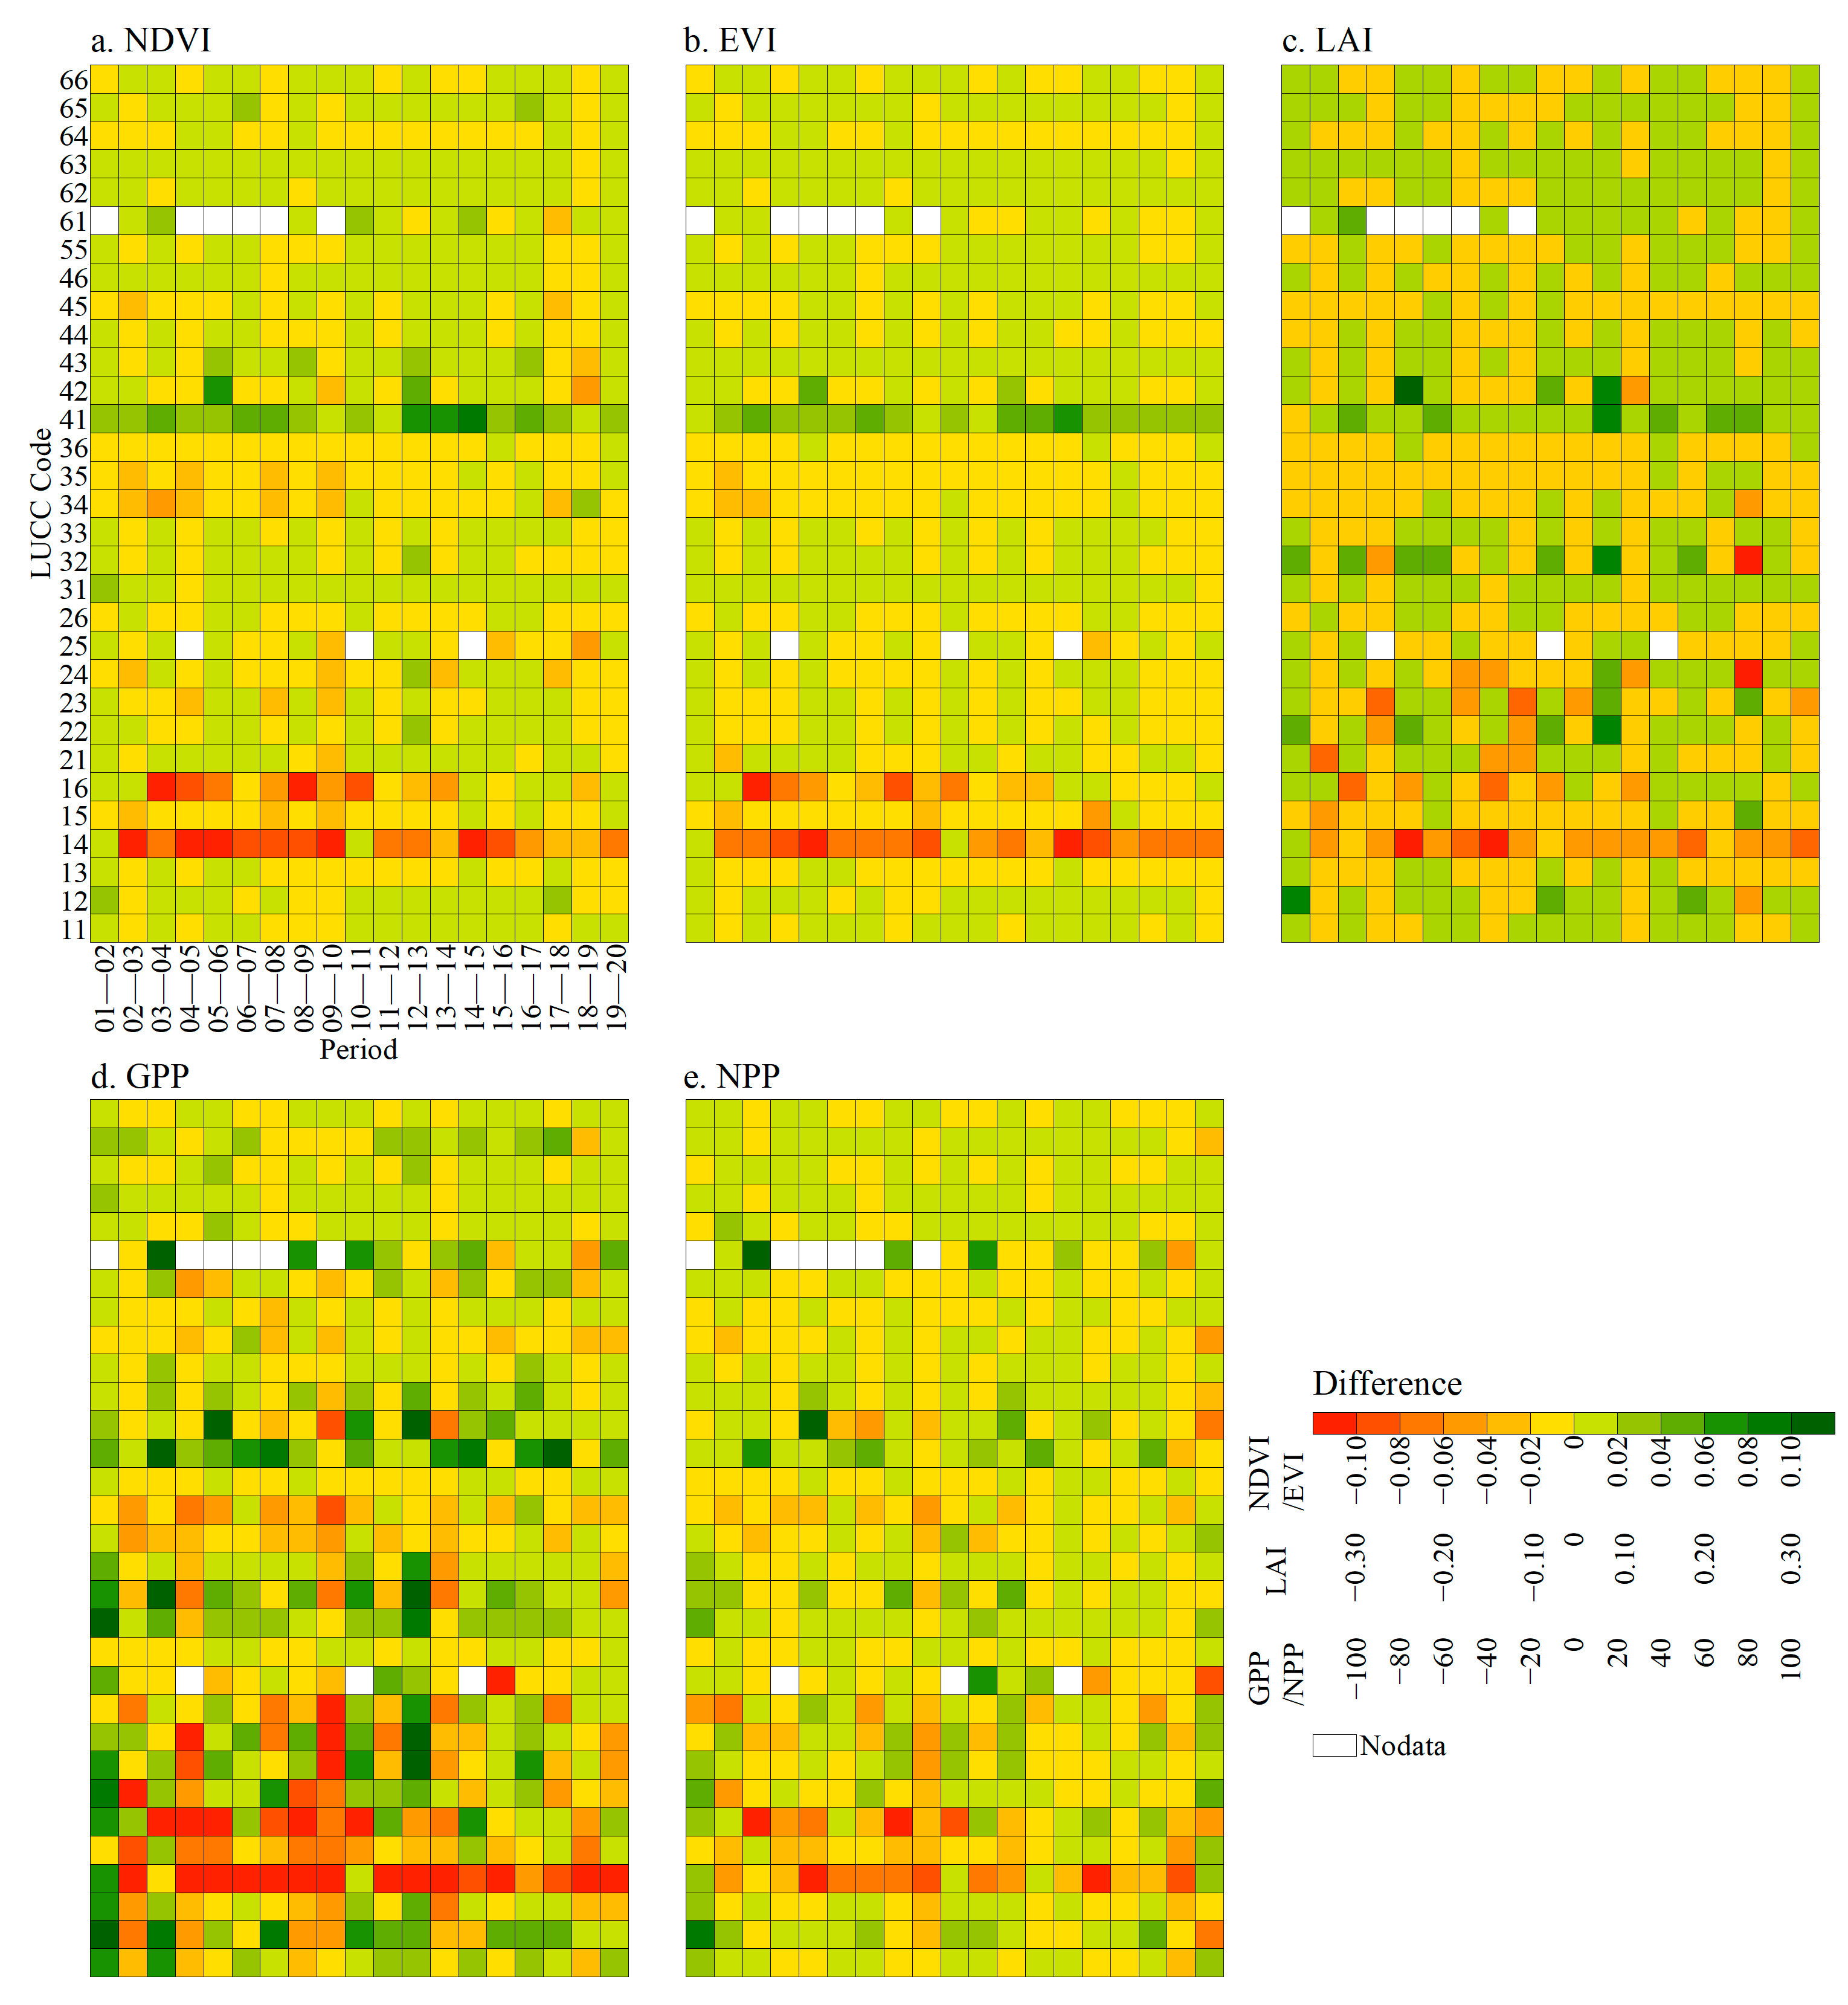
At first, we created the dataset of LULC year to year. Then, based on the dataset of LULC and ecological parameters, the ecological parameters before and after the transfer of land use were extracted and carried the average values. Finally, the ecological parameter difference of overlapping LULC changes year to year was processed. The results were used to analyze the influence of LULC on ecological parameters. This part mainly analyzes the values change and coupled degree from two perspectives.

3.3.1. Value Change

Previous studies often ignore the impact of LULC changes on ecological parameters. It is worth noting that the yearly variations in ecological parameters are less pronounced in regions where LULC remains unchanged compared to those where the LULC has changed, as depicted in Figure 9. Specifically, the disparity in ecological parameters in other years when the LULC code was 11/22/33/44/55/66 was compared. The most significant interannual differences were predominantly observed in areas characterized by LULC changes coded as 14/15/16/23/24/32/34/41/42, with a focus on transitions between vegetation and non-vegetation areas. In general, when the land use type changes from a vegetation region to non-vegetation region, its ecological indicator exhibits a decreasing trend, that is, the ten-digit value of the land use change code is 1/2/3 and the one-digit value is 4/5/6, while the opposite is true regarding the change from a non-vegetation area to a vegetation area. Noteworthy variations in ecological parameters were also observed during transitions in vegetation and non-vegetation regions. Initially, the changes in ecological parameters in vegetation regions were examined, revealing an increase in ecological indicators when the LULC codes were 12, 31, and 32, while most indicators decreased when the transformation trend was reversed. Subsequently, changes in ecological parameters in non-vegetation regions were investigated, showing that the NDVI and EVI primarily increased during transitions from water bodies to unutilized land, whereas the LAI, GPP, and NPP mostly decreased. Conversely, transitions from unutilized land to water bodies resulted in a reversal of this trend. Ecological parameters decreased predominantly during transitions from water bodies to constructed land, while they increased during transitions from unutilized land to constructed land. Overall, the comparison of various ecological parameters suggests that LULC change impacts the LAI and GPP, particularly during interconversions in vegetation regions.
Beyond simply comparing the direct influence of LULC on ecological parameters, it is essential to highlight the rate of change in these indicators. Figure 10 illustrates that regions with the most significant annual variations in ecological parameters consistently show a significant difference in pixel proportions between increases and decreases. This discrepancy is particularly evident in regions identified as 14/41/35/63. Conversely, in non-vegetation areas, the variance in the pixel count between increases and decreases is relatively equal, approximately at 50%. The assertion that LULC has a more pronounced impact on changes in ecological parameters, as previously mentioned, was further supported by the observation that the difference in ecological parameters was greater in the transition between vegetation and non-vegetation regions. It is worthwhile that the NPP appears to exhibit a unique pattern in terms of differences in pixel proportions. For instance, when transitioning between water bodies and unutilized land, the pixel proportion of increasing NPP exceeds 85%, while the pixel proportion of increasing other ecological parameters remains at 50%. This distinct characteristic can aid in the rapid detection and identification of LULC changes.

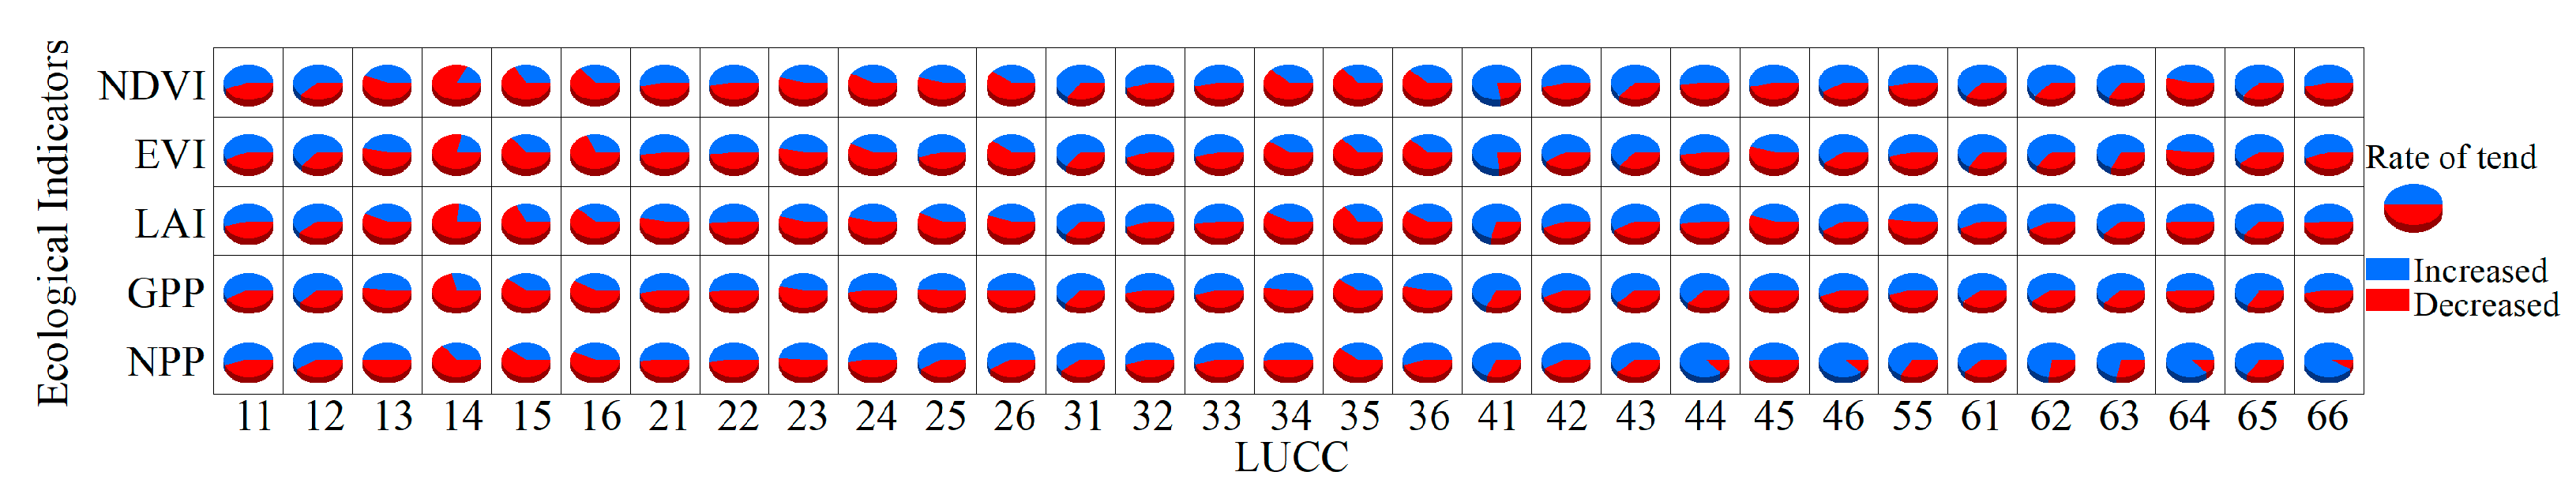
3.3.2. Coupled Degree

Based on comparing ecological parameters’ differences between alternate years of LULC, significant differences were observed. To further analyze these variances, a coupled degree was introduced as a metric to more accurately depict the differences in changes across different ecological parameters. By examining the trends of these ecological parameters, the coupled degree was categorized into five distinct levels (Figure 11). Comparing the couple degree of various ecological parameters, it was noted that an inverse relationship between the coupled degree and the magnitude of parameter change exists. Specifically, regions with less changes in ecological parameters exhibited higher coupled degrees. These regions primarily include transitions between vegetation and non-vegetation areas, denoted by LULC codes 11/12/13/21/22/23/31/32/33/44/45/46/55/64/65/66, where the changes are minimal and uncertainties are greater. Conversely, areas with higher coupled degrees were concentrated in the conversions between vegetation and non-vegetation regions, indicating greater changes and lower uncertainties in ecological parameters in these regions. The coupled degree serves as an effective indicator to reflect the relationship between the extent of LULC variations and the alterations in ecological parameters. Generally, a wider range of LULC changes corresponds to higher coupled degrees.

4. Discussion

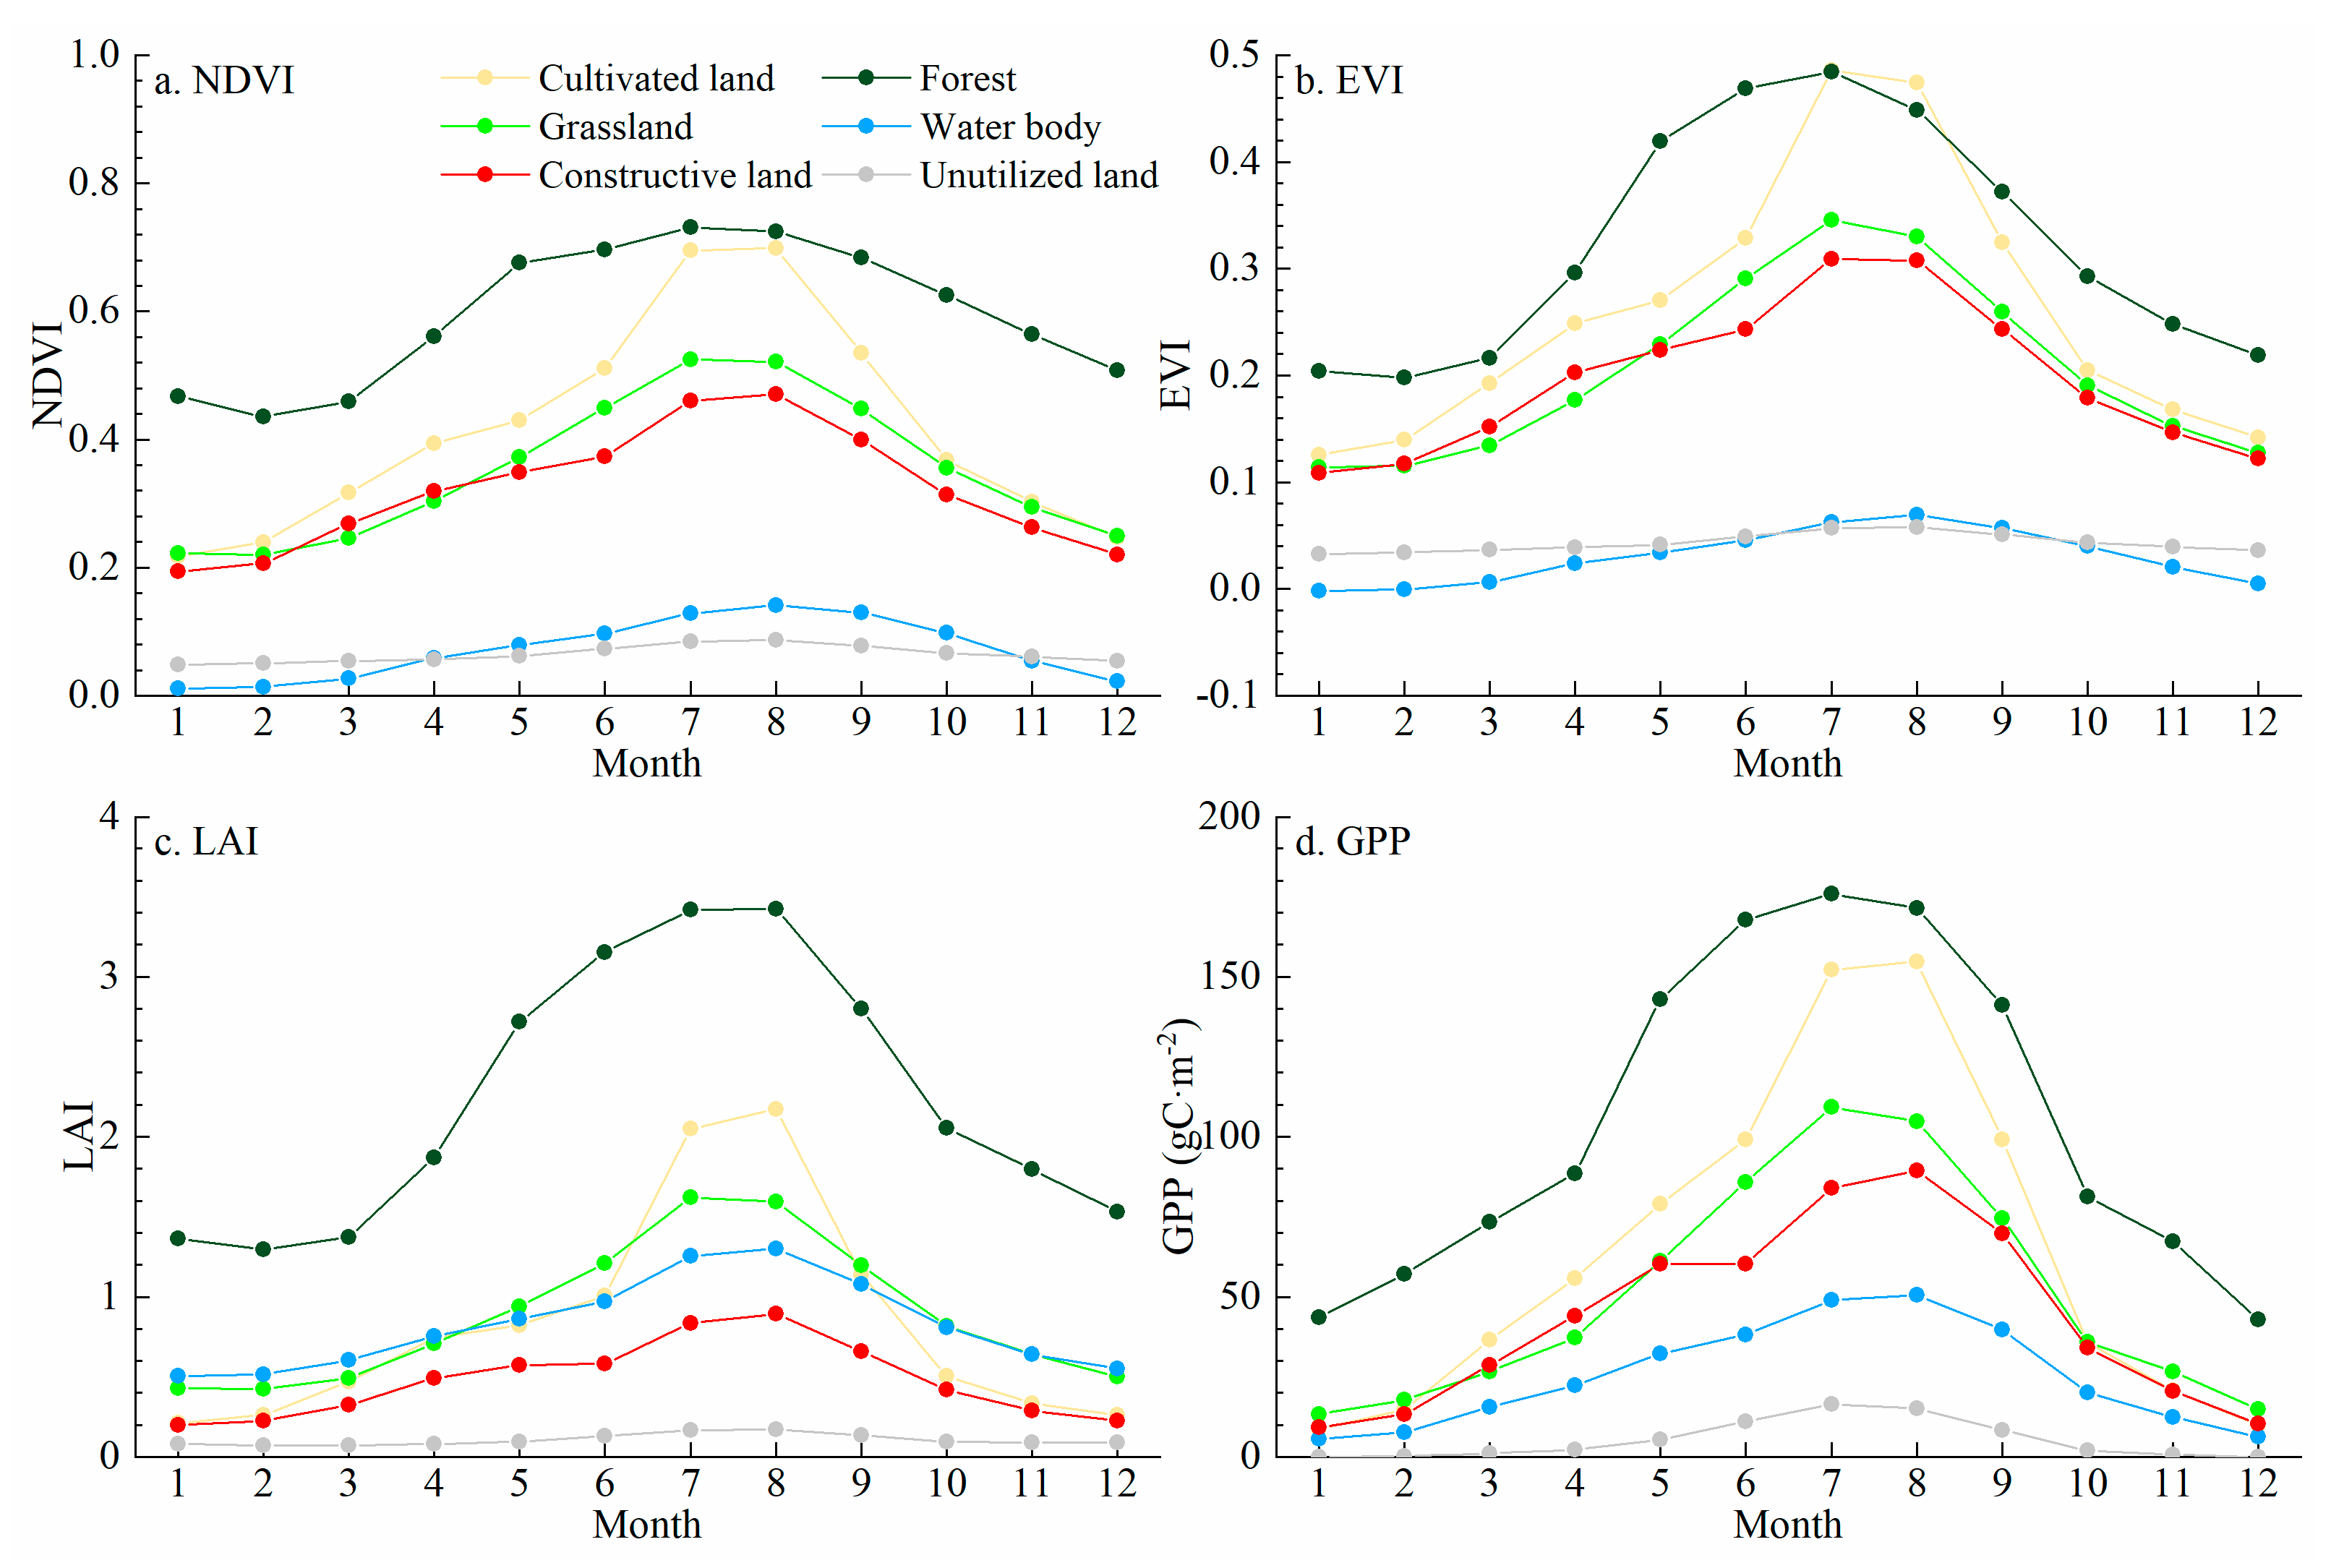
4.1. Monthly Dynamics of Ecological Parameters in China

The growth of vegetation is a gradual process, necessitating the monitoring of ecological parameters with consideration of monthly dynamics. Figure 12 illustrates the inter-monthly fluctuations of ecological parameters across different LUTs, while Figure 13 presents a comprehensive analysis of the data from Figure 12, focusing solely on the range and coefficient of variation. Initially, the study discussed the changing characteristics of ecological parameters in various LUTs in vegetation regions. Forest exhibited the highest lower and upper limits of ecological parameters. The peak ecological parameters for cultivated land were observed in August, whereas for forest and grassland, they were in July. The coefficient of variation for ecological parameters was lowest in forests, followed by grasslands, and highest in cultivated lands. Subsequently, when comparing the changing characteristics of various LUTs in non-vegetation regions, it was noted that, except for LAI, the ecological parameters of water bodies were lower than those of built-up areas. The coefficient of variation for NDVI and EVI in water bodies was the highest, indicating significant inter-monthly variation. Specific changes in the NDVI and EVI were observed in water bodies and unutilized land. The monthly dynamics of ecological parameters between grasslands and constructive land were found to be similar. However, a distinct observation was made regarding the trend of both LUTs from May to July. As depicted in Figure 12, the trend of ecological parameters in grasslands from May to July appears smoother compared to constructive land. This smoother trend was primarily due to a more gradual increase in various ecological parameters from May to June, followed by a more rapid increase from June to July.

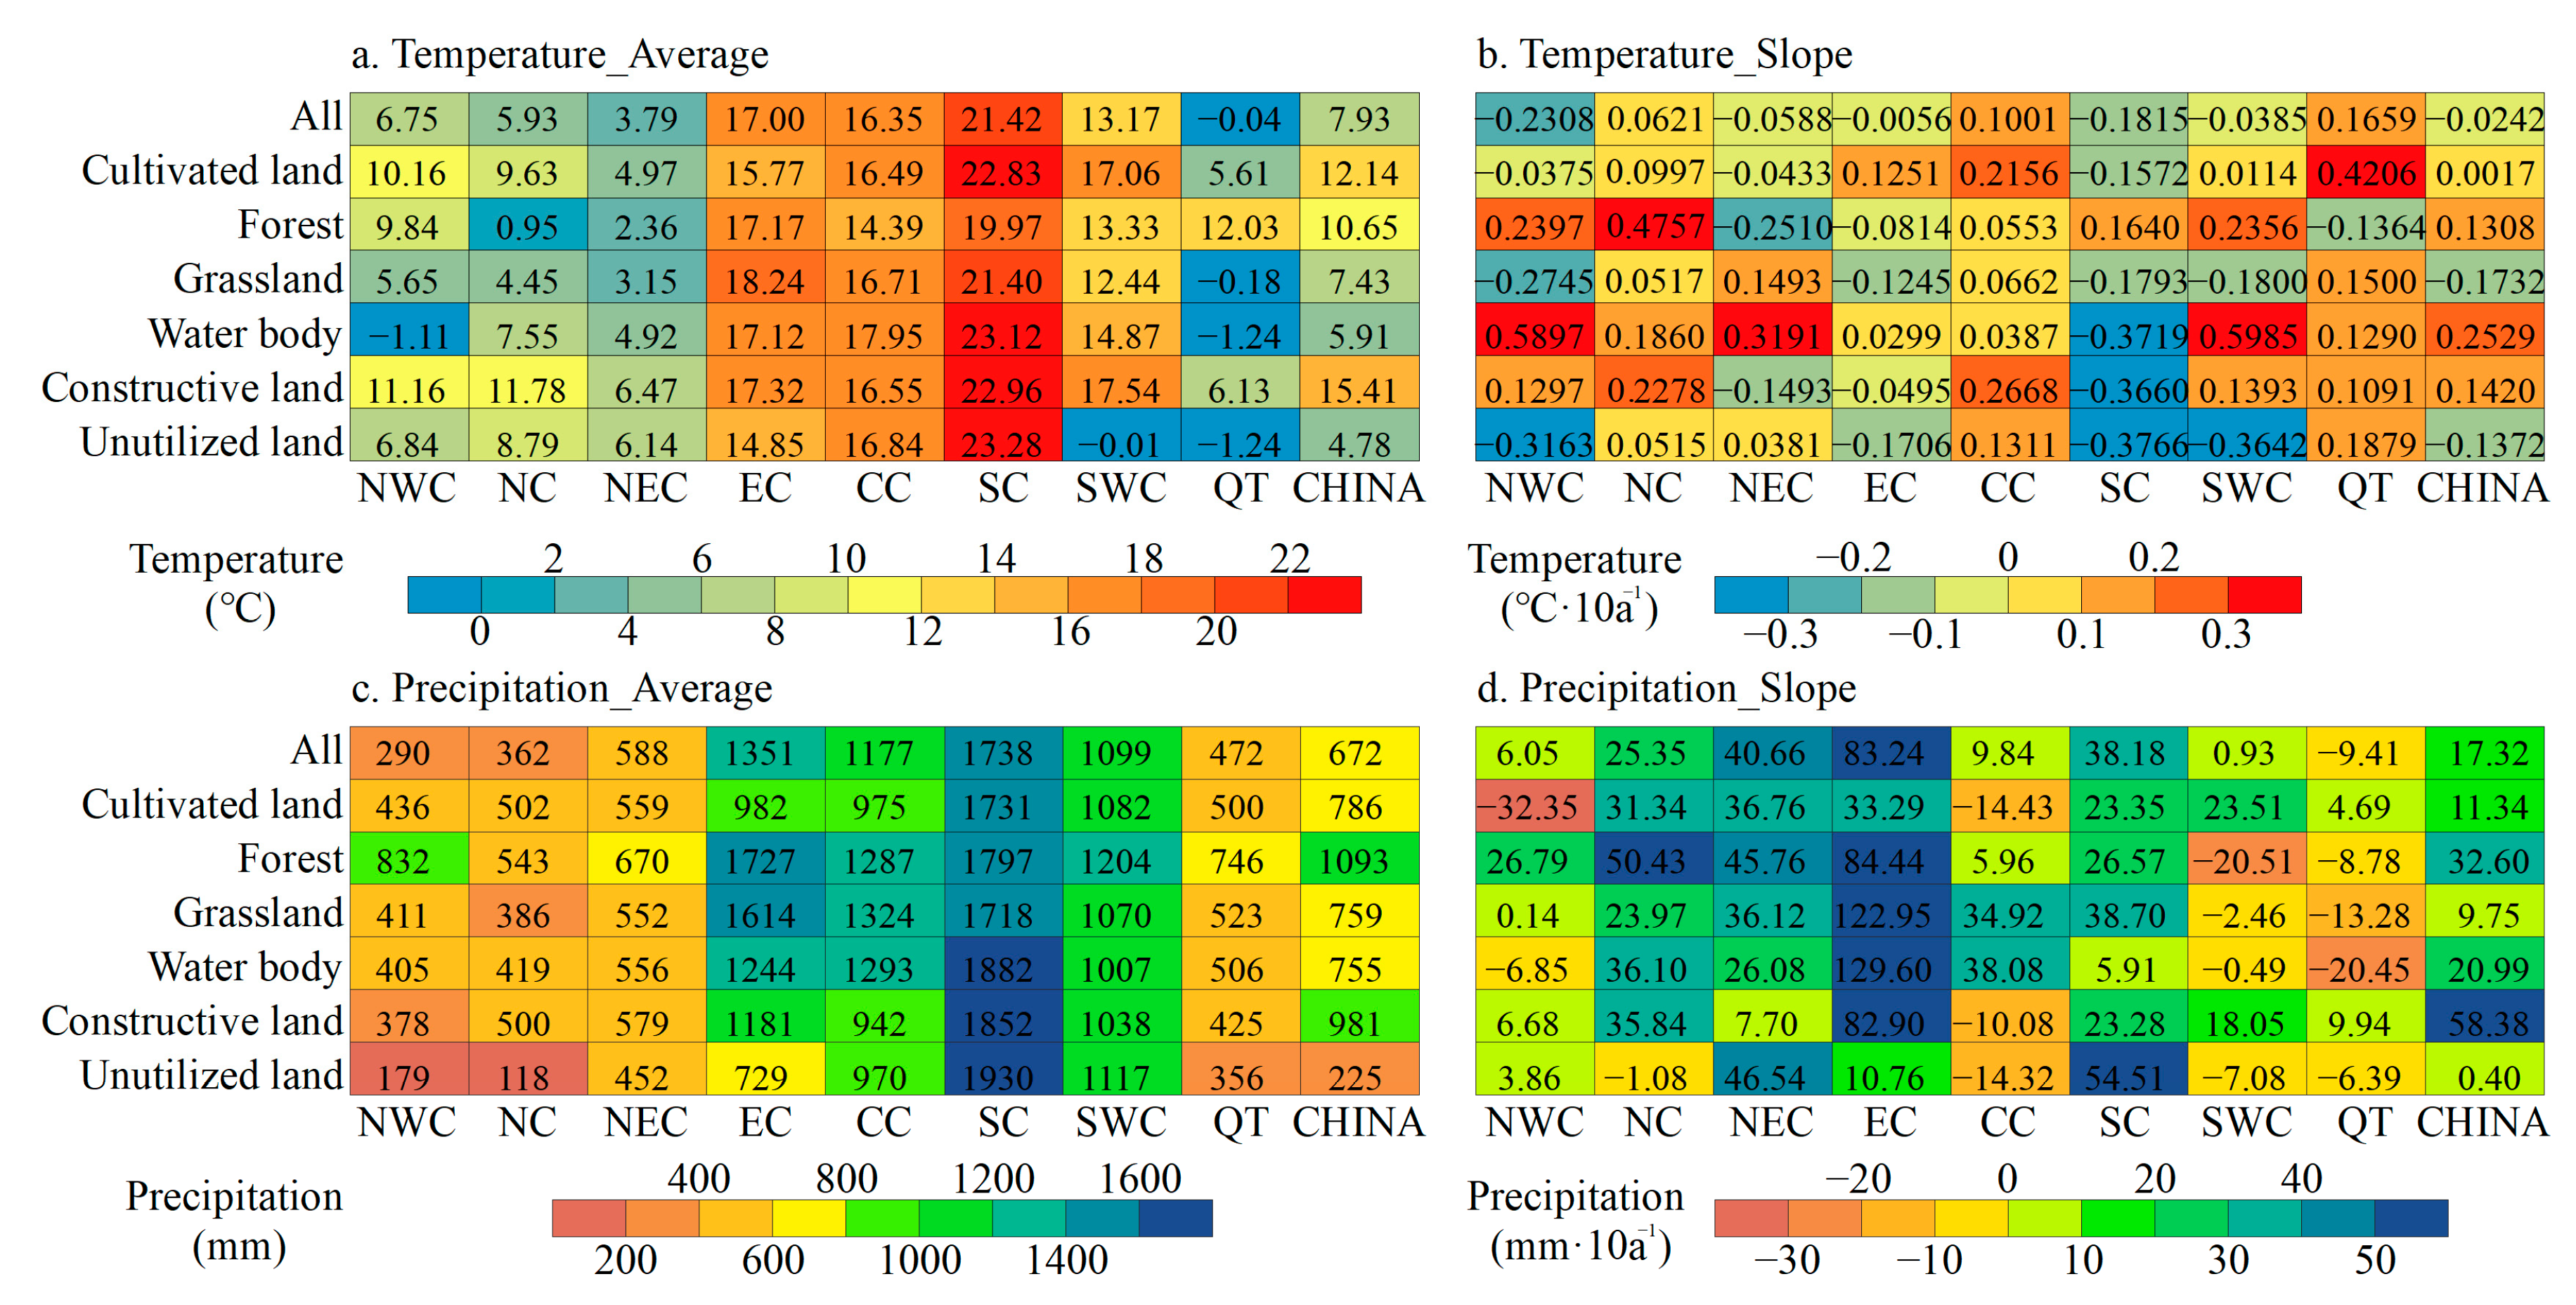
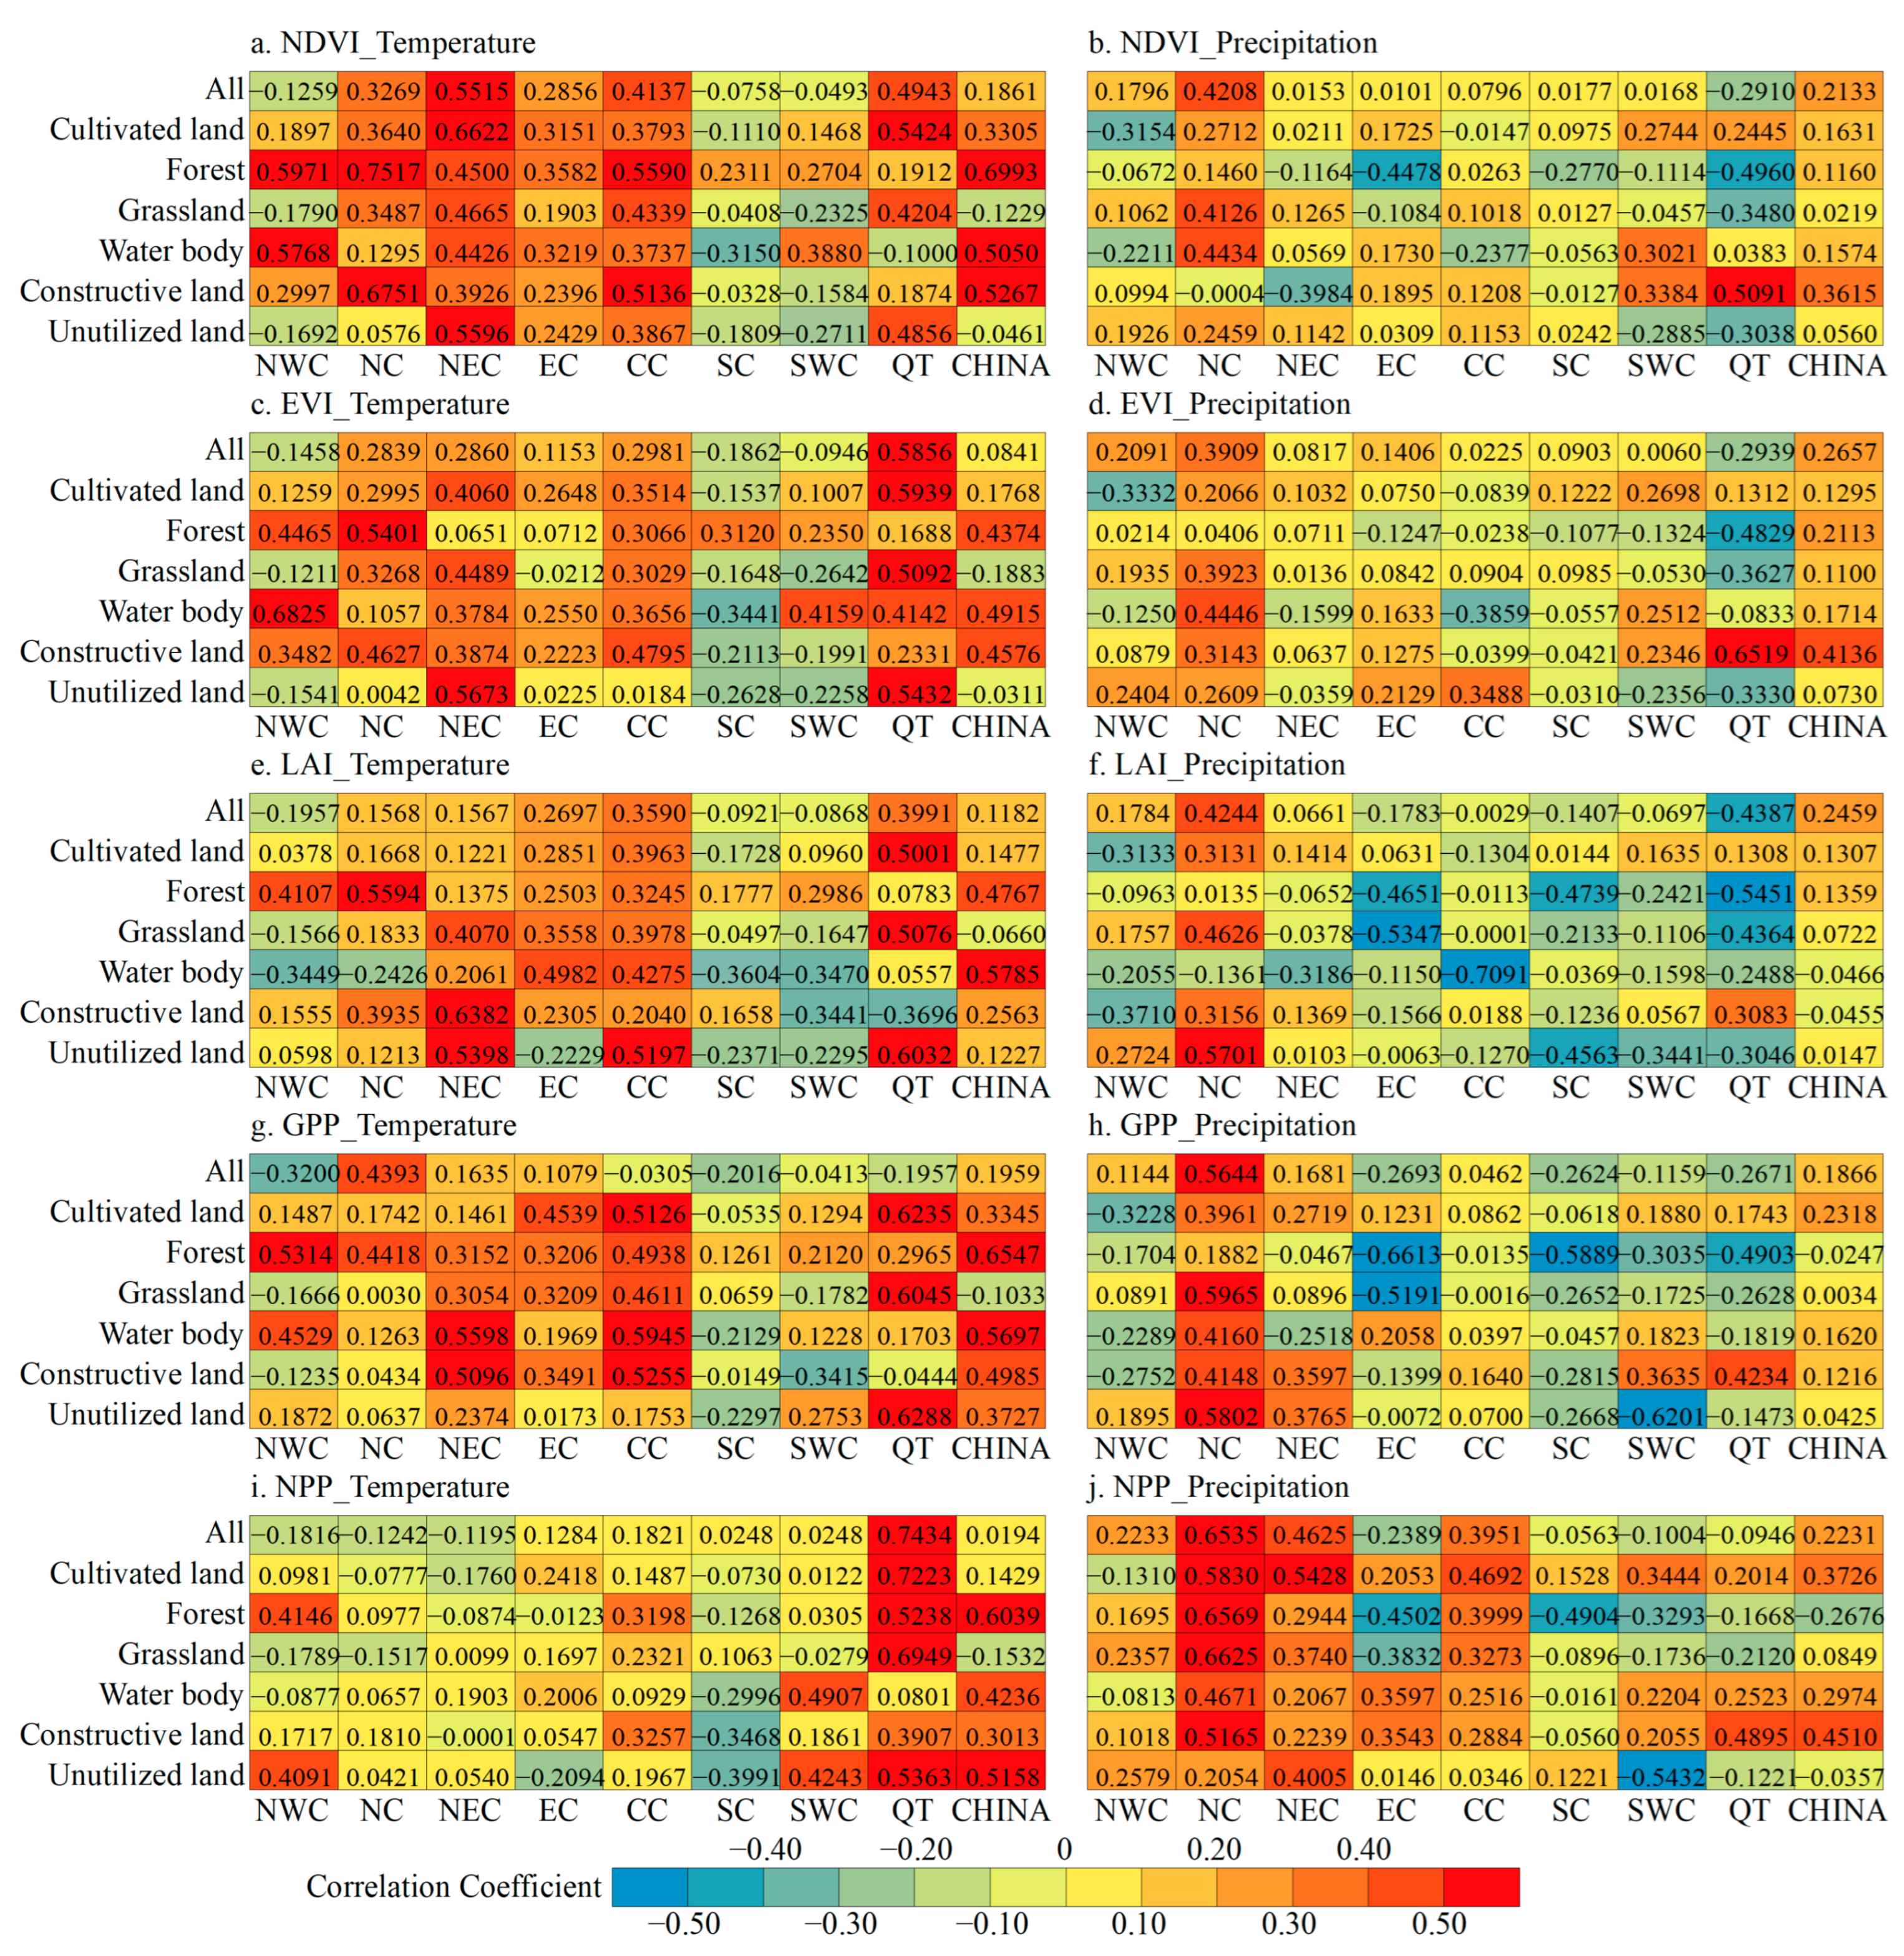
4.2. Relationship between Climatic Factors and Ecological Parameters of Various LUTs in China and Its Sub-Regions

In the context of climate change, there are obvious regional and vegetation-type variances in how distinct meteorological factors impact vegetation growth [36,65,66,67,68,69]. Previous research has tended to treat all vegetation types collectively, examining the relationship between ecological parameters and climate variables by averaging values across the study area, thereby overlooking the impact of land use variations on this correlation. Based on our previous studies, the mean values of temperature and precipitation in China from 2001 to 2018 were 7.93 °C and 672 mm, with rates of change of –0.0242 °C·(10a)−1 and 17.32 mm·(10a)−1, respectively, when the meteorological factors were ignored for the study of various land types (Figure 14). The average annual temperature of cultivated land (12.14 °C), forest (10.65 °C), and constructed land (15.41 °C) exceeded 10 °C, while unutilized land recorded the lowest temperature (4.78 °C). Solely the average annual precipitation of forests surpassed 1000 mm (1093 mm), followed by constructed land (981 mm), with unutilized land exhibiting the least annual precipitation (225 mm). Regarding the trend in meteorological parameter changes, except for grassland and unutilized land, the temperature of other LUTs exhibited an upward trajectory. Precipitation levels increased across all LUTs, albeit with obvious differences. The disparities in average values and trends of meteorological parameters are conspicuous at the regional level, with further details available in Figure 14.
In the absence of LUTs, all ecological parameters exhibit a positive relationship with temperature and precipitation in China, as illustrated in Figure 15. However, the correlation of various ecological parameters with temperature and precipitation varies significantly across regions. For instance, in the NWC region, all ecological parameters display a negative correlation with temperature and a positive correlation with precipitation. Conversely, in the NC and NEC regions, with the exception of NPP, other ecological parameters exhibit a positive correlation with both temperature and precipitation. In contrast, the NEC, SC, and SWC regions show a negative correlation with LAI, GPP, NPP, and precipitation. Furthermore, all ecological parameters demonstrate a negative correlation with precipitation in the QT region. It is evident that the relationship between ecological parameters and precipitation is more intricate compared to temperature when LUTs are not considered.
In the analysis involving LUTs, it was observed that the relationship between ecological parameters and climate variables exhibited a higher level of complexity (refer to Figure 15). In the context of China, the distribution of ecological parameters across various LUTs indicated a ratio of 23:7 for positive and negative correlations with temperature, and a ratio of 5:1 for correlations with precipitation. Specifically, all ecological parameters of grassland, as well as the NDVI and EVI of unutilized land, displayed a negative correlation with temperature. Furthermore, a negative correlation was identified between the GPP and NPP of forests and precipitation. The diversity in correlation patterns was more pronounced at the regional level. At this scale, the ratios of ecological parameters of cultivated land, forest, and grassland exhibiting positive and negative correlations with temperature were 23:7, 37:3, and 5:3, respectively. Correspondingly, the ratios for precipitation were 31:9, 11:29, and 1:1 for the same land types. Upon focusing solely on vegetation cover area, it was observed that all ecological parameters of cultivated land, forest, and grassland were positively correlated with temperature in the CC and QT regions. Conversely, for cultivated land, all ecological parameters exhibited negative correlations with temperature in the SC region, and with precipitation in the NC region. With the exception of the NPP, all ecological parameters of forests displayed positive correlations with temperature across all regions, while negative correlations with precipitation were evident in the EC, SC, SWC, and QT regions. Similarly, all ecological parameters of grassland in the NC and SWC regions were negatively correlated with temperature, and negatively correlated with precipitation in the QT region. The negative correlation between ecological parameters and precipitation was found to be more pronounced than that with temperature.
In conclusion, on the basis of the existing data sources and methods, we must explore the correlations between various ecological indicators of all LUTs and climatic factors in different regions and explore their patterns. It is essential to recognize the response of diverse ecological parameters of all LUTs in the context of global warming.

4.3. The Limitations and Future Directions of the Study

Drawing on previous research, this study firstly considered LUTs, and then systematically analyzed ecological parameters and their trends. Subsequently, the study explored the correlation between ecological parameters of different LUTs and climate variables. However, upon scrutinizing the data, the researchers identified several pertinent issues and algorithms that necessitated resolutions and optimizations. These include: (1) A focus on the influence of LULC on ecological parameters in the context of climate change. Compared with previous studies, the impact of LULC was considered, but zoning planning was still based on administrative boundaries, and human intervention was not circumvented, and the zoning planning was carried out in a purely natural environment. (2) The climatic indicators used in this research to explore correlations were too homogeneous. We did not consider the influence of factors such as the terrain, elevation, and carbon emissions on ecological parameters. (3) Future research endeavors should aim to quantify the impact of human activities to facilitate a more in-depth analysis of correlation relationships.

5. Conclusions

This study utilized various ecological parameter datasets, including NDVI, EVI, LAI, GPP, and NPP, in conjunction with LULC and climate data, employing methods such as linear regression, coupling analysis, and correlation testing. The research focused on China and its sub-regions as the geographical scope. The analysis revealed the changes in LUTs and ecological parameters over the past two decades in response to climate variations, and examined the impact of LULC on ecological parameters. The study delved into the characteristics of LULC; the average values, trends, and distribution intervals of ecological parameters across various LUTs; and the influence of LULC on ecological parameters. Furthermore, the Discussion Section explored the monthly-scale variations in ecological parameters and the interrelation between climate fluctuations and ecological parameters within distinct LUTs. The study concluded by outlining its limitations and proposing future research directions to enhance our comprehension of the interplay between land use change, climate dynamics, and ecological parameters. The study aims to offer valuable data and recommendations to inform the development of ecological restoration policies.

Author Contributions

Conceptualization, C.Z. and X.Y.; data curation, C.Z. and L.X.; formal analysis, C.Z.; methodology, C.Z., L.X., H.J. and J.C.; resources, C.Z. and L.X.; software, C.Z. and J.C.; supervision, C.Z. and X.Y.; validation, C.Z., L.X. and H.J.; visualization, C.Z. and X.Y.; writing—original draft, C.Z.; writing—review and editing, C.Z. and J.C. All authors have read and agreed to the published version of the manuscript.

Funding

This research was jointly funded by the National Natural Science Foundation of China (No. 42071089), Higher Education Innovation Fund Project of Gansu Province (No. 2022A–256), and Key Talent Project of Natural Resources in Gansu Province (No. 202304).

Data Availability Statement

Data are contained within the article.

Acknowledgments

We thank Te Sha for his help in writing this article. Finally, I would like to thank the previous scholars for their research results in this field, which are very enlightening for our work.

Conflicts of Interest

The authors declare no conflicts of interest.

References

  1. Mottet, A.; Ladet, S.; Coqué, N.; Gibon, A. Agricultural land-use change and its drivers in mountain landscapes: A case study in the Pyrenees. Agric. Ecosyst. Environ. 2006, 114, 296–310. [Google Scholar] [CrossRef]
  2. Sterling, S.M.; Ducharne, A.; Polcher, J. The impact of global land-cover change on the terrestrial water cycle. Nat. Clim. Change 2012, 3, 385–390. [Google Scholar] [CrossRef]
  3. Tian, H.Q.; Chen, G.S.; Zhang, C.; Liu, M.L.; Sun, G.; Chappelka, A.; Ren, W.; Xu, X.F.; Lu, C.Q.; Pan, S.F.; et al. Century-scale response of ecosystem carbon storage to multifactorial global change in the Southern United States. Ecosystems 2012, 15, 674–694. [Google Scholar] [CrossRef]
  4. Mooney, H.A.; Duraiappah, A.; Larigauderie, A. Evolution of natural and social science interactions in global change research programs. Proc. Natl. Acad. Sci. USA 2013, 110, 3665–3672. [Google Scholar] [CrossRef]
  5. Lawler, J.J.; Lewis, J.D.; Nelson, E.; Plantinga, A.J.; Polasky, S.; Withey, J.C.; Helmers, D.P.; Martinuzzi, S.; Pennington, D.; Radeloff, V.C. Projected land-use change impacts on ecosystem services in the United States. Proc. Natl. Acad. Sci. USA 2014, 111, 7492–7497. [Google Scholar] [CrossRef] [PubMed]
  6. Wulder, M.A.; White, J.C.; Goward, S.N.; Masek, J.G.; Irons, J.R.; Herold, M.; Cohen, W.B.; Loveland, T.R.; Woodcock, C.E. Landsat continuity: Issues and opportunities for land cover monitoring. Remote Sens. Environ. 2008, 112, 955–969. [Google Scholar] [CrossRef]
  7. Zhu, Z.; Woodcock, C.E. Continuous change detection and classification of land cover using all available Landsat data. Remote Sens. Environ. 2014, 144, 152–171. [Google Scholar] [CrossRef]
  8. Deng, L.; Liu, G.B.; Shangguan, Z.P. Land-use conversion and changing soil carbon stocks in China’s ‘Grain-for-Green’ Program: A synthesis. Glob. Change Biol. 2014, 20, 3544–3556. [Google Scholar] [CrossRef] [PubMed]
  9. Xu, C.L.; Zhang, Q.B.; Yu, Q.; Wang, J.P.; Wang, F.; Qiu, S.; Ai, M.S.; Zhao, J.K. Effects of land use/cover change on carbon storage between 2000 and 2040 in the Yellow River Basin, China. Ecol. Indic. 2023, 151, 110345. [Google Scholar] [CrossRef]
  10. Seto, K.C.; Güneralp, B.; Hutyra, L.R. Global forecasts of urban expansion to 2030 and direct impacts on biodiversity and carbon pools. Proc. Natl. Acad. Sci. USA 2012, 109, 16083–16088. [Google Scholar] [CrossRef]
  11. Seto, K.C.; Golden, J.S.; Alberti, M.; Turner, B.L. Sustainability in an urbanizing planet. Proc. Natl. Acad. Sci. USA 2017, 114, 8935–8938. [Google Scholar] [CrossRef] [PubMed]
  12. Gao, L.; Bryan, B.A. Finding pathways to national-scale land-sector sustainability. Nature 2017, 544, 217–222. [Google Scholar] [CrossRef] [PubMed]
  13. Pretty, J.; Benton, T.G.; Bharucha, Z.P.; Dicks, L.V.; Flora, C.B.; Godfray, H.C.J.; Goulson, D.; Hartley, S.; Lampkin, N.; Morris, C.; et al. Global assessment of agricultural system redesign for sustainable intensification. Nat. Sustain. 2018, 1, 441–446. [Google Scholar] [CrossRef]
  14. Nagendra, H.; Bai, X.; Brondizio, E.S.; Lwasa, S. The urban south and the predicament of global sustainability. Nat. Sustain. 2018, 1, 341–349. [Google Scholar] [CrossRef]
  15. Jansen, L.J.M.; Gregorio, A.D. Parametric land cover and land use classifications as tools for environmental change detection. Agr. Ecosyst. Environ. 2002, 91, 89–100. [Google Scholar] [CrossRef]
  16. Semwal, R.L.; Nautiyal, S.; Sen, K.K.; Rana, U.; Maikhuri, R.K.; Rao, K.S.; Saxena, K.G. Patterns and ecological implications of agricultural land use changes: A case study from central Himalaya, India. Agric. Ecosyst. Environ. 2004, 102, 81–92. [Google Scholar] [CrossRef]
  17. Piao, S.L.; Fang, J.Y.; Zhou, L.M.; Guo, Q.H.; Henderson, M.; Ji, W.; Li, Y.; Tao, S. Interannual variations of monthly and seasonal normalized difference vegetation index (NDVI) in China from 1982 to 1999. J. Geophys. Res. 2003, 108, 4401. [Google Scholar] [CrossRef]
  18. Speed, J.D.M.; Evankow, A.M.; Petersen, T.K.; Ranke, P.S.; Nilsen, N.H.; Turner, G.; Aagaard, K.; Bakken, T.; Davidsen, J.G.; Dunshea, G.; et al. A regionally coherent ecological fingerprint of climate change, evidenced from natural history collections. Ecol. Evol. 2022, 12, e9471. [Google Scholar] [CrossRef]
  19. Strassburg, B.B.N.; Iribarrem, A.; Beyer, H.L.; Cordeiro, C.L.; Crouzeilles, R.; Jakovac, C.C.; Junqueira, A.B.; Lacerda, E.; Latawiec, A.E.; Balmford, A.; et al. Global priority areas for ecosystem restoration. Nature 2020, 586, 724–729. [Google Scholar] [CrossRef]
  20. HJ1172–2021; Technical Specification for Investigation and Assessment of National Ecological Status—Ecosystem Quality Assessment. Ministry of Ecology and Environment of the People’s Republic of China: Beijing, China, 2021.
  21. Linderholm, H.W. Growing season changes in the last century. Agric. For. Meteorol. 2006, 137, 1–14. [Google Scholar] [CrossRef]
  22. Defries, R.S.; Field, C.B.; Fung, I.; Justice, C.O.; Los, S.; Matson, P.A.; Matthews, E.; Mooney, H.A.; Potter, C.S.; Prentice, K.; et al. Mapping the land surface for global atmosphere-biosphere models: Toward continuous distributions of vegetation’s functional properties. J. Geophys. Res. Atmos. 1995, 100, 20867–20882. [Google Scholar] [CrossRef]
  23. Myneni, R.B.; Hoffman, S.; Knyazikhin, Y.; Privette, J.L.; Glassy, J.; Tian, Y.; Wang, Y.; Song, X.; Zhang, Y.; Smith, G.R.; et al. Global products of vegetation leaf area and absorbed PAR from year one of MODIS data. Remote Sens. Environ. 2002, 83, 214–231. [Google Scholar] [CrossRef]
  24. Ma, Y.Y.; Wang, W.Y.; Jin, S.K.; Li, H.X.; Liu, B.M.; Gong, W.; Fan, R.N.; Li, H. Spatiotemporal variation of LAI in different vegetation types and its response to climate change in China from 2001 to 2020. Ecol. Indic. 2023, 156, 111101. [Google Scholar] [CrossRef]
  25. Campbell, J.E.; Berry, J.A.; Seibt, U.; Smith, S.J.; Montzka, S.A.; Launois, T.; Belviso, S.; Bopp, L.; Laine, M. Large historical growth in global terrestrial gross primary production. Nature 2017, 544, 84–87. [Google Scholar] [CrossRef] [PubMed]
  26. Li, X.L.; Liang, S.L.; Yu, G.R.; Yuan, W.P.; Cheng, X.; Xia, J.Z.; Zhao, T.B.; Feng, J.M.; Ma, Z.G.; Maf, M.G.; et al. Estimation of gross primary production over the terrestrial ecosystems in China. Ecol. Model. 2013, 261–262, 80–92. [Google Scholar] [CrossRef]
  27. Mu, S.J.; Yang, H.F.; Li, J.L.; Chen, Y.Z.; Gang, C.C.; Zhou, W.; Ju, W.M. Spatio-temporal dynamics of vegetation coverage and its relationship with climate factors in Inner Mongolia, China. J. Geogr. Sci. 2013, 23, 231–246. [Google Scholar] [CrossRef]
  28. Hoegh-Guldberg, O.; Bruno, J.F. The impact of climate change on the world’s marine ecosystems. Science 2010, 328, 1523–1528. [Google Scholar] [CrossRef] [PubMed]
  29. Henson, S.A.; Beaulieu, C.; Ilyina, T.; John, J.G.; Long, M.; Séférian, R.; Tjiputra, J.; Sarmiento, J.L. Rapid emergence of climate change in environmental drivers of marine ecosystems. Nat. Commun. 2017, 8, 14682. [Google Scholar] [CrossRef]
  30. Bruno, J.F.; Bates, A.E.; Cacciapaglia, C.; Pike, E.P.; Amstrup, S.C.; Hooidonk, R.V.; Henson, S.A.; Aronson, R.B. Climate change threatens the world’s marine protected areas. Nat. Clim. Change 2018, 8, 499–503. [Google Scholar] [CrossRef]
  31. Guo, D.; Song, X.N.; Hu, R.H.; Ma, R.; Zhang, Y.N.; Gao, L.; Zhu, X.M.; Kardol, P. Spatio-temporal variation in leaf area index in the Yan Mountains over the past 40 years and its relationship to hydrothermal conditions. Ecol. Indic. 2023, 157, 111291. [Google Scholar] [CrossRef]
  32. Liu, Y.; Lei, H. Responses of Natural Vegetation Dynamics to Climate Drivers in China from 1982 to 2011. Remote Sens. 2015, 7, 10243–10268. [Google Scholar] [CrossRef]
  33. Cao, R.; Jiang, W.; Yuan, L.; Wang, W.J.; Lv, Z.L.; Chen, Z. Inter-annual variations in vegetation and their response to climatic factors in the upper catchments of the Yellow River from 2000 to 2010. J. Geogr. Sci. 2014, 24, 963–979. [Google Scholar] [CrossRef]
  34. Zhang, Y.L.; Song, C.H.; Band, L.E.; Sun, G.; Li, J.X. Reanalysis of global terrestrial vegetation trends from MODIS products: Browning or greening? Remote Sens. Environ. 2017, 191, 145–155. [Google Scholar] [CrossRef]
  35. Beigaite, R.; Tang, H.; Bryn, A.; Skarpaas, O.; Stordal, F.; Bjerke, J.W.; Zliobaite, I. Identifying climate thresholds for dominant natural vegetation types at the global scale using machine learning: Average climate versus extremes. Glob. Change Biol. 2022, 28, 3557–3579. [Google Scholar] [CrossRef] [PubMed]
  36. Xu, H.J.; Wang, X.P.; Zhang, X.X. Decreased vegetation growth in response to summer drought in Central Asia from 2000 to 2012. Int. J. Appl. Earth Obs. 2016, 52, 390–402. [Google Scholar] [CrossRef]
  37. Chuai, X.W.; Huang, X.J.; Wang, W.J.; Bao, G. NDVI, temperature and precipitation changes and their relationships with different vegetation types during 1998–2007 in Inner Mongolia, China. Int. J. Climatol. 2013, 33, 1696–1706. [Google Scholar] [CrossRef]
  38. He, P.X.; Ma, X.L.; Meng, X.Y.; Han, Z.M.; Liu, H.X.; Sun, Z.J. Spatiotemporal evolutionary and mechanism analysis of grassland GPP in China. Ecol. Indic. 2022, 143, 109323. [Google Scholar] [CrossRef]
  39. Lin, M.; Hou, L.Z.; Qi, Z.M.; Wan, L. Impacts of climate change and human activities on vegetation NDVI in China’s Mu Us Sandy Land during 2000–2019. Ecol. Indic. 2022, 142, 109164. [Google Scholar] [CrossRef]
  40. Bianchi, E.; Villalba, R.; Solarte, A. NDVI Spatio-temporal Patterns and Climatic Controls Over Northern Patagonia. Ecosystems 2020, 23, 84–97. [Google Scholar] [CrossRef]
  41. Zhou, S.; Zhang, Y.; Clais, P.; Xiao, X.M.; Luo, Y.Q.; Caylor, K.K.; Huang, Y.F.; Wang, G.Q. Dominant role of plant physiology in trend and variability of gross primary productivity in North America. Sci. Rep. 2017, 7, 41366. [Google Scholar] [CrossRef]
  42. Liu, H.Q.; Huete, A. A feedback based modification of the NDVI to minimize canopy background and atmospheric noise. IEEE Trans. Geosci. Remote 1995, 33, 457–465. [Google Scholar] [CrossRef]
  43. Huete, A.; Didan, K.; Miura, T.; Rodriguez, E.P.; Gao, X.; Ferreira, L.G. Overview of the radiometric and biophysical performance of the MODIS vegetation indices. Remote Sens. Environ. 2002, 83, 195–213. [Google Scholar] [CrossRef]
  44. Liu, J.Y.; Liu, M.L.; Tian, H.Q.; Zhuang, D.F.; Zhang, Z.X.; Zhang, W.; Tang, X.M.; Deng, X.Z. Spatial and temporal patterns of China’s cropland during 1990–2000: An analysis based on Landsat TM data. Remote Sens. Environ. 2005, 98, 442–456. [Google Scholar] [CrossRef]
  45. Garbulsky, M.F.; Paruelo, J.M. Remote sensing of protected areas to derive baseline vegetation functioning characteristics. J. Veg. Sci. 2004, 15, 711–720. [Google Scholar] [CrossRef]
  46. Running, S.W.; Nemani, R.R.; Heinsch, F.A.; Zhao, M.; Hashimoto, H. A continuous satellite-derived measure of global terrestrial primary production. Bioscience 2004, 54, 547–560. [Google Scholar] [CrossRef]
  47. Zhang, F.G.; Zeng, B.; Cao, Y.; Li, F.; Tang, Z.Y.; Qi, J.G. Human activities have markedly altered the pattern and trend of net primary production in the Ili River basin of northwest China under current climate change. Land Degrad. Dev. 2022, 33, 2585–2595. [Google Scholar] [CrossRef]
  48. Chen, S.F.; Zhang, Q.F.; Chen, Y.N.; Zhou, H.H.; Xiang, Y.Y.; Liu, Z.H.; Hou, Y.F. Vegetation change and eco-environmental quality evaluation in the Loess Plateau of China from 2000 to 2020. Remote Sens. 2023, 15, 424. [Google Scholar] [CrossRef]
  49. Sun, Y.; Zhang, X.B.; Ren, G.Y.; Zwiers, F.W.; Hu, T. Contribution of urbanization to warming in China. Nat. Clim. Change 2016, 6, 706–709. [Google Scholar] [CrossRef]
  50. Kalnay, E.; Cai, M. Impact of urbanization and land-use change on climate. Nature 2003, 423, 528–531. [Google Scholar] [CrossRef]
  51. Wu, S.B.; Chen, B.; Webster, C.; Xu, B.; Gong, P. Improved human greenspace exposure equality during 21st century urbanization. Nat. Commun. 2023, 14, 6460. [Google Scholar] [CrossRef]
  52. Gao, J.; Bukovsky, M.S. Urban land patterns can moderate population exposures to climate extremes over the 21st century. Nat. Commun. 2023, 14, 6536. [Google Scholar] [CrossRef]
  53. Yang, J.X. China’s Rapid Urbanization. Science 2013, 342, 310. [Google Scholar] [CrossRef] [PubMed]
  54. Chao, R. Effects of Increased Urbanization. Science 2009, 324, 37. [Google Scholar] [CrossRef] [PubMed]
  55. Zhang, L.; Yang, L.; Zonher, C.M.; Crowther, T.W.; Li, M.C.; Shen, F.X.; Guo, M.; Qin, J.; Yao, L.; Zhou, C.H. Direct and indirect impacts of urbanization on vegetation growth across the world’s cities. Sci. Adv. 2022, 8, eabo0095. [Google Scholar] [CrossRef]
  56. Li, J.G.; Zou, C.X.; Li, Q.; Xu, X.Y.; Zhao, Y.Q.; Yang, W.H.; Zhang, Z.Q.; Liu, L.L. Effects of urbanization on productivity of terrestrial ecological systems based on linear fitting: A case study in Jiangsu, eastern China. Sci. Rep. 2019, 9, 17140. [Google Scholar] [CrossRef] [PubMed]
  57. Liu, J.Y.; Kuang, W.H.; Zhang, Z.X.; Xu, X.L.; Qin, Y.W.; Ning, J.; Zhou, W.C.; Zhang, S.W.; Li, R.D.; Yan, C.Z.; et al. Spatiotemporal characteristics, patterns, and causes of land-use changes in China since the late 1980s. J. Geogr. Sci. 2014, 24, 195–210. [Google Scholar] [CrossRef]
  58. Ning, J.; Liu, J.Y.; Kuang, W.H.; Xu, X.L.; Zhang, S.W.; Yan, C.Z.; Li, R.D.; Wu, S.X.; Hu, Y.F.; Du, G.M.; et al. Spatiotemporal patterns and characteristics of land-use change in China during 2010–2015. J. Geogr. Sci. 2018, 28, 547–562. [Google Scholar] [CrossRef]
  59. Kuang, W.H.; Zhang, S.W.; Du, G.M.; Yan, C.Z.; Wu, S.X.; Li, R.D.; Lu, D.S.; Pan, T.; Ning, J.; Guo, C.Q.; et al. Monitoring periodically national land use changes and analyzing their spatiotemporal patterns in China during 2015–2020. J. Geogr. Sci. 2022, 32, 1705–1723. [Google Scholar] [CrossRef]
  60. Wang, J.B.; Wang, J.W.; Ye, H.; Liu, Y.; He, H.L. An interpolated temperature and precipitation dataset at 1–km grid resolution in China (2000–2012). China Sci. Data 2017, 2, 73–80. [Google Scholar] [CrossRef]
  61. Hutchinson, M.F. Interpolating mean rainfall using thin plate smoothing splines. Int. J. Geogr. Inf. Sci. 1995, 9, 385–403. [Google Scholar] [CrossRef]
  62. Hutchinson, M. ANUSPLIN Version 4.2 User Guide; Center for Resource and Environmental Studies, the Australian National University: Canberra, Australia, 2001. [Google Scholar]
  63. Wang, S.; Zhang, L.L.; Lin, W.B.; Huang, Q.S.; Song, Y.X.; Ye, M. Study on vegetation coverage and land-use change of Guangdong province based on MODIS-NDVI. Acta Ecol. Sin. 2022, 42, 2149–2163. [Google Scholar] [CrossRef]
  64. Stow, D.; Daeschner, S.; Hope, A.; Douglas, D.; Petersen, A.; Myneni, R.; Zhou, L.; Oechel, W. Variability of the seasonally integrated normalized difference vegetation index across the north slope of Alaska in the 1990s. Int. J. Remote Sens. 2003, 24, 1111–1117. [Google Scholar] [CrossRef]
  65. Piao, S.L.; Mohammat, A.; Fang, J.Y.; Cai, Q.; Feng, J.M. NDVI-based increase in growth of temperate grasslands and its responses to climate changes in China. Glob. Environ. Change 2006, 16, 340–348. [Google Scholar] [CrossRef]
  66. Krause, A.; Papastefanou, P.; Gregor, K.; Layritz, L.S.; Zang, C.S.; Buras, A.; Li, X.; Xiao, J.F.; Rammig, A. Quantifying the impacts of land cover change on gross primary productivity globally. Sci. Rep. 2022, 12, 18398. [Google Scholar] [CrossRef] [PubMed]
  67. Rezaei, E.E.; Webber, H.; Asseng, S.; Boote, K.; Durand, L.J.; Ewert, F.; Martre, P.; MacCarthy, D.S. Climate change impacts on crop yields. Nat. Rev. Earth Environ. 2023, 4, 831–846. [Google Scholar] [CrossRef]
  68. Chen, N.; Zhang, Y.F.; Yuan, F.H.; Song, C.C.; Xu, M.J.; Wang, Q.W.; Hao, G.Y.; Bao, T.; Zuo, Y.J.; Liu, J.Z.; et al. Warming-induced vapor pressure deficit suppression of vegetation growth diminished in northern peatlands. Nat. Commun. 2023, 14, 7885. [Google Scholar] [CrossRef]
  69. Singh, B.K.; Delgado-Baquerizo, M.; Egidi, E.; Guirado, E.; Leach, J.E.; Liu, H.W.; Trivedi, P. Climate change impacts on plant pathogens, food security and paths forward. Nat. Rev. Microbiol. 2023, 21, 640–656. [Google Scholar] [CrossRef]
Figure 1. Spatial distribution of (a) location, (b) zone, (c) land use and land cover in China.
Land 13 00572 g001
Figure 2. The original and integrated land cover/use types.
Land 13 00572 g002
Figure 3. The flowchart of data processing in this study.
Land 13 00572 g003
Figure 4. Rate of LULC change in China and its various regions in 2020.
Land 13 00572 g004
Figure 5. Area changes in various LUTs in China in 2001~2020.
Land 13 00572 g005
Figure 6. Distribution of land use conversion. (Colors of the columns represent changes in different land use types, and the value represents the area of conversion).
Land 13 00572 g006
Figure 7. The average and slope values of ecological parameters of various LUTs in China and its sub-regions in 2001~2020.
Land 13 00572 g007
Figure 8. The proportion of numerical intervals of ecological parameters of various LUTs in China in 2001~2020.
Land 13 00572 g008
Figure 9. Ecological indicators’ differences between alternate years of LULC in China in 2001~2020.
Land 13 00572 g009
Figure 10. The rate of ecological parameters’ trends between alternate years of LULC in China in 2001~2020.
Land 13 00572 g010
Figure 11. The coupled degree of ecological parameters between alternate years of LULC changes in China in 2001~2020.
Land 13 00572 g011
Figure 12. The inter-monthly fluctuations of ecological parameters of various LUTs in China in 2001~2020.
Land 13 00572 g012
Figure 13. The range and coefficient of variation of inter-monthly ecological parameters of various LUTs in China in 2001~2020.
Land 13 00572 g013
Figure 14. The average and slope values of both temperature and precipitation for various LUTs in China and its sub-regions in 2001~2018.
Land 13 00572 g014
Figure 15. The correlation coefficient of both climatic factors and ecological parameters of various LUTs in China’s sub-regions in 2001~2018.
Land 13 00572 g015
Table 1. Data source in this study.
DataEISpatial ResolutionTime Resolution
MCD12Q1LULC500 m1 Year
MOD/MYD13A1EVI/NDVI500 m16 Days
MOD15A2HLAI500 m8 Days
MOD17A3HGFGPP/NPP500 m1 Year
Disclaimer/Publisher’s Note: The statements, opinions and data contained in all publications are solely those of the individual author(s) and contributor(s) and not of MDPI and/or the editor(s). MDPI and/or the editor(s) disclaim responsibility for any injury to people or property resulting from any ideas, methods, instructions or products referred to in the content.

