Abstract
The serious problem of soil erosion not only has a profound impact on people’s lives but also results in a series of ecological and environmental challenges. To determine the impact of changes in land use type on soil erosion in the urban agglomeration on the northern slopes of the Tianshan Mountains, this study commences by employing the InVEST-SDR (integrated valuation of ecosystem services and tradeoffs–sediment delivery ratio) model to calculate soil erosion levels spanning from 2000 to 2020. Subsequently, it forecasts land use and land cover (LULC) conditions for the year 2030 under three scenarios: Q1 (natural development), Q2 (ecological protection), and Q3 (economic priority). This projection is accomplished through the integration of a coupled Markov chain and multi-objective planning model (MOP) alongside patch-generating land use simulation (PLUS) models. Ultimately, based on these outcomes, the study predicts soil erosion levels for the year 2030. There has been a consistent decline in soil erosion from 2000 to 2020 with high-intensity erosion concentrated in the Tianshan Mountain region. Grasslands, glaciers, and permafrost are identified as the most erosion-prone land types in the study area, with forests exhibiting the highest capacity for soil retention. Converting from grassland and barren land to forest within the same area results in a substantial reduction in soil erosion, specifically by 27.3% and 46.3%, respectively. Furthermore, the transformation from barren land to grassland also leads to a noteworthy 19% decrease in soil erosion. Over the past two decades, the study area has witnessed a significant decline in the area of grasslands, with a notable shift towards barren and impervious surfaces due to economic development and mining activities. The three predicted scenarios depict significant expansion towards barren land, grassland, and impervious area, respectively. Soil erosion decreases under different shared socio-economic pathway (SSP) scenarios relative to 2020. There is an increase in soil erosion in the Q1 scenario and in the Q3 scenario, whereas the amount of soil erosion in the Q2 scenario exhibits a continued decrease when only the effect of land change on soil erosion is considered. Persistently rapid economic development can exacerbate soil erosion problems, underscoring the need to find a balance between economic growth and ecological conservation. As economic expansion slows down, greater emphasis should be placed on environmental protection to maintain ecological stability.
1. Introduction
Soil is a vital resource on our planet as it plays a critical role in providing regulatory ecosystem services that have a significant impact on human life and the environment [1]. Nevertheless, the presence and sustainability of these services are at risk due to soil erosion [2], thereby making it a serious environmental and economic problem [3]. The process of soil erosion involves denudation, transport, and eventually deposition of soil particles in another location. Soil erosion modeling has a long history [4], and several empirical models have been proposed in recent years, the most widely used of which are the universal soil erosion model (USLE) [5] and the revised universal soil erosion model (RUSLE) [6]. The (R)USLE is preferred over physical models such as the water erosion and processing model (WEPP) [7] and Limburg soil erosion model (LISEM) [8] due to its concise parameters, easily accessible data, extensive documentation in the literature [9], and its ability to be applied to various geographical regions. Despite the (R)USLE model having notable shortcomings in simulating sediment output and deposition processes, the (R)USLE series of models are the most commonly used soil erosion models globally in various forms [10]. Numerous scholars have effectively employed these models to assess soil erosion in various regions and across different geographical scales [11,12,13].
The inclusion of the sediment delivery ratio (SDR) in the (R)USLE model allows for the estimation of both sediment export and sediment retention within a watershed. The SDR is defined as the proportion of sediment delivery from a specific section of the watershed to the total erosion within the watershed [14,15]. Scholars have proposed different methods for SDR estimation [16]. Consequently, several models, such as (R)USLE-SDR [17], WaTEM/SEDEM [18], and SEDD [19], have been developed in response to these efforts. In particular, the InVEST-SDR (integrated valuation of ecosystem services and tradeoffs-sediment delivery ratio) model integrates the USLE equation and the work of Borselli et al. [20] and Vigiak et al. [21] to determine the spatial distribution of sediment production within a catchment. This is achieved by calculating soil erosion and sediment transport ratios (SDR) [22]. The SDR values enable the simulation of soil output and deposition, and the extensive utilization of this model has shown success in various places [23,24].
In recent years, scholars have shifted their focus to evaluating the driving factors of soil erosion [25], improving soil erosion factors [26], and simulating sediment [27]. Land use/land cover (LULC) change has been a focus in socio-environmental research [28] in recent years. Changes in land use are recognized as a significant factor and a crucial driver of global environmental change, with alterations in land use and land cover being strongly linked to soil erosion [29]. Land use influences the runoff and sediment transport processes, and thus the soil erosion process, by altering surface morphology [30]. Several scholars have conducted studies to investigate the effects of LULC changes on soil erosion [31,32,33], as well as to analyze the ways in which various land uses and covers interact with soil erosion. The urban agglomeration on the northern slopes of the Tianshan Mountains has undergone large–scale soil and water development due to economic growth. Human activities have drastically changed the land use distribution in the region, leading to a notable increase in construction land and industrial and mining land. Additionally, desert areas have been converted into artificial oases through the implementation of oasis expansion projects. In order to achieve a comprehensive understanding and assessment of soil erosion in the urban agglomeration on the northern slopes of Tianshan Mountains, it is essential to investigate and forecast the effects of LULC changes on soil erosion.
Currently, there are two primary ways used for predicting soil erosion. One is based on existing soil erosion results [34], while the other involves predicting future soil erosion factors before applying soil erosion models for calculation [35]. The first method generally uses the Markov model to predict soil erosion, ignoring the complex influencing factors and evolution process of soil erosion. In contrast, the second method is the mainstream of current research, how to predict the change in LULC is especially the focus of research. In order to simulate LULC change, scholars have developed numerous models, including the CA–Markov model [36], CLUE/CLUE-S [37], and the FLUS model [38]. The patch-generating land use simulation (PLUS) model, developed by Liang et al. [39] based on the FLUS model, enables the analysis of factors that contribute to land expansion and the prediction of how land use will evolve at the patch level with improved simulation accuracy and adaptability.
Many scholars have combined soil erosion models with these LULC prediction models to predict future scenarios [40,41]. The setting of simulation scenarios is a key factor affecting the accuracy and reliability of future predictions of LULC. Previously, the impact of policies on land use changes was simulated by setting various parameters, such as the land use transfer matrix, neighborhood weights, and regional restrictions. Scholars have used different methods to determine domain weights for simulation scenarios. These methods include focusing on setting the transfer matrix [42], using the probability of land class transfer [43], or using the Markov chain to predict future demand in land use classes. However, these approaches are subjective and ignore benefit objectives [44]. The multi-objective planning (MOP) model is a more scientifically accurate approach compared to setting land use demand based on the Markov chain and relying on experiential limitations for land class conversion. Implementing the MOP model can help mitigate the subjectivity inherent in scenario setting. Additionally, the MOP model can consider ecological and economic policy changes. It is also characterized by its openness and flexibility, enabling the establishment of objective functions and restrictions based on policy formulation and changes in demand.
This study utilized the InVEST-SDR model to evaluate the soil erosion risk in the urban agglomeration on the northern slopes of Tianshan Mountains. The objectives were to identify areas with high erosion risk, analyze the impact of LULC changes on soil erosion over the past two decades, and predict the future land use patterns using the MOP-PLUS coupled model under policy guidance. Three distinct scenarios, namely Q1 (natural development), Q2 (ecological protection), and Q3 (economic priority), were established as prospective scenarios for the future. The aim is to provide guidance and insight for the optimal allocation of regional land resources while minimizing soil erosion risk. The simulation of soil erosion changes under these three scenarios serves as a valuable reference for relevant authorities in planning, striving to achieve a balance between economic and ecological protection.
The innovation and significance of this study are primarily evident in two key aspects. Firstly, there is a scarcity of research on soil erosion prediction regarding the urban agglomeration of the northern slopes of the Tianshan Mountains, especially in relation to the connection between land change and soil erosion. Given the rapid economic development and extensive human activities affecting land use dynamics in this region, it is crucial to understand the relationship between land use and soil erosion. Secondly, this study provides a framework for rapid soil erosion prediction. It combines the InVEST-SDR model for soil erosion calculation with the PLUS model to predict future land use changes. By incorporating the MOP model, various constraints can be adjusted and added to change land demand, thereby reducing prediction subjectivity. This approach enables the quantification of a variety of scenarios, enhancing the applicability and flexibility of this straightforward framework for soil erosion estimation. This study facilitates the quantification of outcomes related to changes in urban land cover under different scenarios, providing planning authorities with valuable insights into achieving a harmonious balance between economic growth and ecological preservation within this soil erosion-prone area.
2. Materials and Methods
2.1. Overview of Study Area
The urban agglomeration situated on the northern slopes of the Tianshan Mountains is positioned in the northwest frontier region of China, in the hinterland of Asia and Europe. It serves as the core city cluster for the Silk Road Economic Belt’s development and construction. It is the most advanced economic region in Xinjiang, and a significant energy base in China. Moreover, it exerts a driving, radiating, and demonstration effect on Xinjiang’s entire economy. The geographical extent of the urban agglomeration on the northern slopes of the Tianshan Mountains, including Turpan, Urumqi, Wujiaqu, Changji Hui Autonomous Prefecture, Shihezi, Shawan, Karamay, Kuitun, Huyanghe, and Wusu (Figure 1), is between 40°41′–46°45′ N and 82°51′–92°54′ E. Situated on the western edge of the second terrain of Chinese topography and in the Junggar Basin, the urban agglomeration is characterized by a typical arid zone in Xinjiang, where the natural vegetation is mainly influenced by the interplay of anthropogenic activities and the natural environment. As a result, the region is a mixture of oasis and desert ecosystems, which often exhibit salinity and desertification on the edges of the oasis [45]. The ecosystem in this region is fragile and susceptible to imbalances.
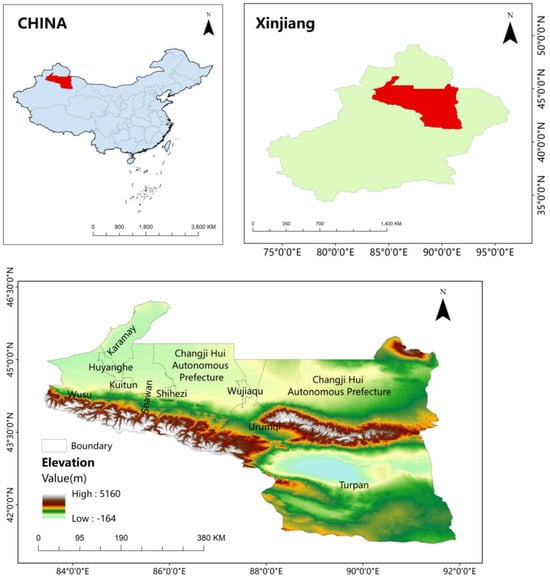
Figure 1.
Panorama of the urban agglomeration on the northern slopes of the Tianshan Mountains, China. The map vector boundary was obtained from the Ministry of Natural Resources: GS(2020)4619 and no modification has been made to the base map boundary.
2.2. Research Data
The data used in this study include land use-type data, a digital elevation model (DEM), soil-type data, road network and water system data, meteorological data, and socio-economic data, etc., as shown in detail in Table 1. The annual mean temperature was obtained from NOAA’s meteorological station data around the urban cluster on the urban agglomeration on the northern slopes of the Tianshan Mountains. The raster map was produced using inverse distance weight interpolation. The DEM and nighttime light data were sourced from and clipped by GEE (Google Earth Engine), and all data are resampled to 30 m and projected to WGS_1984_UTM_Zone_45N.

Table 1.
Data sources.
2.3. Methodology
Figure 2 shows the methodology employed in this study. The InVEST-SDR model was used to calculate soil erosion in the urban agglomeration on the northern slopes of Tianshan Mountains from 2000 to 2020, analyzing the spatial and temporal variations of soil erosion and identifying high risk areas. Furthermore, the Markov chain and MOP-PLUS coupled models were utilized to forecast changes in LULC and soil erosion in the urban agglomeration on the northern slope of the Tianshan Mountains in 2030 under three different scenarios, with macro policies as constraints and ESV and economic benefits as objectives. These scenarios were Q1 (natural development), Q2 (ecological protection), and Q3 (economic priority).
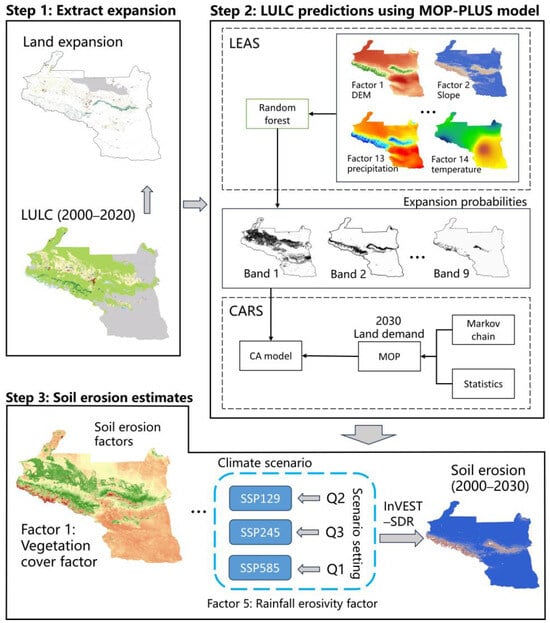
Figure 2.
Flowchart of the Methodology.
2.3.1. InVEST-SDR Model
The InVEST-SDR model is a widely used model that considers various factors, including precipitation, topography, soil erodibility, soil conservation measures, and vegetation cover. It streamlines the previous operation associated with the (R)USLE model by automating the calculation of the LS factor through the utilization of DEM, employing the method established by Desmet and Govers [50]. The soil erosion modulus is computed using Equation (1), where USLEi is the soil erosion modulus [t/(ha-a)], R represents the rainfall erosivity factor [(MJ-mm)/(ha-h-a)], K is the soil erodibility factor [(t-ha-h)/(MJ-ha-mm)], C represents the vegetation cover factor, LS represents the topography factor, and P represents the erosion support practice factor. The calculation of all factors is outlined in the subsequent sections.
The Chinese Ministry of Water Resources has developed the soil erosion classification standard (SL190-2007), which classifies the intensity of soil erosion into six categories: slight erosion [<5 t/(ha-a)], light erosion [5–25 t/(ha-a)], moderate erosion [25–50 t/(ha-a)], strong erosion [50–80 t/(ha-a)], very strong erosion [80–150 t/(ha-a)], and severe erosion [>150 t/(ha-a)].
Rainfall Erosivity Factor (R)
Rainfall is a crucial factor affecting soil erosion, and the R factor is a dynamic indicator that reflects the soil erosion condition. In this paper, the rainfall erosivity factor is estimated using the annual rainfall algorithm proposed by Zhang et al. [51], and the formula is shown below:
where Ra is the precipitation erosion force in year a and Pa is the precipitation in year a. The parameters α and β are assigned the values of 0.0534 and 1.6548, respectively.
Vegetation Cover Factor (C)
The vegetation cover management factor represents the protective effect of vegetation against soil erosion. The vegetation cover factor (C) is a numerical scale that spans from 0 to 1, with a C value of 1 indicating no vegetation cover and a lower value indicating a stronger protective effect of vegetation. The C factor for each land use type is calculated using the maximum annual NDVI value, as indicated in Equation (3). In this equation, the values of α and β are 2 and 1, respectively.
Soil Erodibility Factor (K)
The concept of soil erodibility pertains to the vulnerability of soil to erosion, which is affected by the soil’s physical and chemical properties such as soil texture and organic matter content. In this study, the EPIC equation proposed by Williams et al. [52] was used to estimate soil erodibility. As stated in Equations (4) and (5), to the international system of units, the results were multiplied by 0.1317.
where K is the soil erodibility factor; Sd, Si, Cl, and C are the percentages of sand, powder, clay, and organic carbon content in the soil, respectively.
Erosion Support Practice Factor (P)
The factor for soil and water conservation measures is determined by comparing the amount of soil loss resulting from implementing specific conservation strategies to the amount of soil loss from cultivating downhill without such conservation strategies. The topographical gradients of the terrain significantly influence this correlation. The allocated P values for each land use category in this study were as follows: cropland (0.5), forest (0.9), grassland (0.9), shrubland (0.9), wetland (0.1), water (0), impervious area (0), barren land (1), and glacier and permanent snow (1).
2.3.2. Markov Chain
The Markov chain is widely used for simulating land use changes [53]. It utilizes a historical matrix of probabilities for land use transition to forecast future land demand. The formula for this model is shown in Equation (6), where S(t+1) denotes the land use type at time t+1, pij denotes the land use transfer probability, and St denotes the land use type at time t.
2.3.3. Ecosystem Service Value (ESV)
This study utilized the ecosystem service value assessment approach proposed by Costanza et al. [54] as a foundation, with the findings of Xie et al. [55] on the per unit area of terrestrial ecosystems in China serving as the primary data source. In order to assess the density of ecological services within the designated study area, this study referred to authoritative sources such as the Xinjiang Statistical Yearbook, the National Compilation of Information on Costs and Benefits of Agricultural Products, and statistical data published by municipal governments. The ecosystem service value per unit area of farmland in the urban agglomeration on the northern slopes of the Tianshan Mountains was determined to be 2338.97 yuan/ha, based on the agricultural production data for the year 2020. Subsequently, this value was utilized to compute the ecological service values for each form of land use. Table 2 presents the ecosystem service values per unit area for each category on the northern slopes of the Tianshan Mountains.
Table 2.
Value of ecosystem services per unit area by land type, in yuan.
2.3.4. MOP Model
Future Multi-Scenario Settings
The multi-objective planning model is an important tool in land use optimization research [56], which solves multi-objective problems by employing numerous constraints [57]. This paper presents three potential scenarios for future development in the urban agglomeration located on the northern slopes of the Tianshan Mountains. These scenarios are formulated within the framework of the existing macro-development planning, i.e., natural development (Q1), which assumes that the future trend will follow historical patterns [58], ecological protection priority (Q2), and economic development priority (Q3).
Q1 aligns with the developmental trajectory observed between 2010 and 2020. The Markov chain is used to predict the demand of various types of land in 2030. Q2 and Q3 meet the development trends under the two macro policies of ecological conservation and economic benefit maximization as objectives, respectively. The relevant objective functions of the MOP model are shown below. The LULC alterations in these two scenarios are solved using lingo18.0.
The study focuses on the policy planning document titled “Development Plan for the Urban Agglomeration on the North Slope of Tianshan Mountain” which offers guidance on future development directions, limitations, and protections for specific land use types. However, these documents lack precise quantification of future planning objectives and are subject to uncertainty in the actual development process. To address this issue, three extreme forecasting scenarios have been selected, and the selection of constraints and limitations is informed by the findings of Li et al. [59] and Wang et al. [60].
F1 is the eco-efficiency function, F2 is the economic efficiency function, LUCi is the area of each land use type, ai and bi are the eco-efficiency coefficients and economic efficiency coefficients of each land use type, the eco-efficiency coefficients of each category are obtained from ESV, the economic efficiency coefficients of cropland, forest, shrubland, grassland, wetland, and water are obtained through the statistics of the output values of agriculture, forestry, animal husbandry, and fishery in the study area. The economic efficiency coefficients for impervious areas are calculated based on the output value of the secondary and tertiary industries.
Meanwhile this study uses the CMIP6 (coupled model intercomparison project) climate data as the future climate data for the three scenarios, which combine diverse shared socio-economic pathways (SSPs) to provide a different collection of climate scenario data [61]. This study selected SSP119, SSP245, and SSP585. Detailed information on the SSP data is as follows.
SSP119: In the SSP119 scenario, radiative forcing in the year 2100 is limited to a value below 1.5 W/m2 and the achievement of sustainable socio-economic growth is characterized by minimal greenhouse gas (GHG) emissions.
SSP245: In the SSP245 scenario, radiative forcing is anticipated such that the radiative force will reach 4.5 W/m2 by the year 2100. This value corresponds to a moderate level of socio–economic growth and greenhouse gas (GHG) emissions [62].
SSP585: In the SSP585 scenario, radiative forcing is projected to reach 8.5 W/m2 by 2100, which represents a rapid increase in the consumption of fossil fuels on a wide scale and a substantial increase in greenhouse gas emissions [63].
The study compared and matched the three scenarios, SSP119, SSP245, and SSP585, with the three scenarios Q1, Q2 and Q3, with Q1 being a high-speed development scenario, which is matched in this paper with SSP585 as the scenario with the largest carbon emissions among the three scenarios. The other two scenarios represent two extreme positions within the framework of sustainable macro–development. In Q2, the objective is to minimize terrestrial carbon emissions, while in Q3, the goal is to maximize terrestrial emissions. Carbon emission factors were determined for each category based on relevant studies [64,65,66,67,68]. The carbon emission factor for glaciers and permafrost was assigned a value of 0 due to the lack of knowledge on the carbon emission and absorption mechanisms of permanent snow and ice [69]. The carbon emissions of impervious areas were determined using data from the IPCC Emission Inventory and the Energy Statistics Yearbook. The formula for carbon emissions is shown in Equation (9) and F3 is the carbon emissions in kg·m−2·a−1.
Constraint Settings
(1) Total Area
The sum of the areas of the various LULCs is constant and equal to the total area of the study area.
(2) Cropland
There has been a continuous rise in the cropland area in the urban agglomeration on the northern slopes of the Tianshan Mountains. In order to assure grain production and apply cropland preservation measures, the minimum area must be equal to or greater than the area in 2020, and the maximum will be the anticipated value of the Markov chain.
(3) Forest
It is imperative to comprehensively strengthen ecological protection and restoration, accelerate the restoration and management of degraded forests, improve forest resource protection, cultivate protective forests, and expand forest coverage. The minimum value is 1.05 times the area in 2020, and the maximum value is the Markov chain prediction.
(4) Grassland
The extent of grassland within the study region has shown a consistent decline between the years 2000 and 2020. To protect natural grassland, improve the ecological quality, and maintain the regional ecological balance, the grassland area will not be less than 0.9 times that in 2020, and the maximum area will be 1.1 times that in2020.
(5) Shrubland
Shrubland did not change significantly from 2010 to 2020. The minimum area was 0.97 times that predicted by the Markov chain, and the maximum area was 1.03 times that predicted by the Markov chain.
(6) Wetland
The area of wetlands continued to decrease from 2000 to 2020. In order to protect and restore the ecosystem, preserve wetland retention, and execute wetland restoration projects, the wetland area will not be less than that in 2020, and can potentially increase up to 1.1 times the 2020 area.
(7) Water
The water area has experienced a gradual reduction from 2010 to 2020. The regulation of water resource development is implemented by stringent measures in order to safeguard water resources, mitigate the deterioration of ecological processes in rivers and lakes, and ensure ecological stability. It is essential to ensure that the water body area remains at least equal to that predicted by the Markov chain, and potentially increases up to 1.05 times the area in 2020.
(8) Impervious Area
The impervious area in the urban agglomeration on the northern slopes of the Tianshan Mountains is expanding as the economy progresses. Nevertheless, as a result of the prevailing economic development trajectory, it is anticipated that the growth of building land will decelerate. In accordance with the development plan of the Tianshan North Slope, upregulated expansion will be strictly curbed and the internal structure optimized instead. The minimum value of the impervious area should be no less than 1.05 times that in 2020, while the maximum should be no greater than 0.95 times the predicted value of the Markov chain.
(9) Barren Land
Barren land includes industrial and mining land. However, due to the lack of certain urban macro-scale statistics, industrial and mining land cannot be addressed as a separate category in this study. Therefore, two approaches have been established in this study, both under the premise of ecological protection. The first approach limits the expansion of mineral extraction and sets the area of barren land in 2030 to no more than 0.95 times that in 2020. The second approach assumes that the area of barren land will increase due to the development of industrial and mining land and sets it to 1.01 times that in 2020.
Ecological Protection
Economic Priority
(10) Glaciers and Permafrost
Glaciers and permafrost are experiencing a decline in their coverage. To prevent further degradation, this study sets a minimum projection using the Markov chain and a maximum limit based on the area in 2020.
(11) Population
This study sets a population density of 2 persons/ha for cropland, forest, shrubland, and grassland, and 18.75 persons/ha for impervious area. In order to achieve sustainable development, it is estimated that the population in 2030 would grow by at least 5% compared to 2020.
(12) Ecological Benefits
The ecological benefits in 2030 must be maintained at the same level or higher than those in 2020.
(13) Economic Benefits
The economic benefits in 2030 will not be lower than those in 2020.
2.3.5. PLUS Model
The PLUS model, which integrates the land expansion analysis strategy (LEAS) and the cellular automata (CA) model based on multiple random patch seeds (CARS) [39], offers a powerful tool for analyzing the driving factors influencing land expansion and predicting the evolution of land use at the patch level. The study assessed the growth of land utilization over a span of 10 years by inputting land use data for both 2010 and 2020. The LEAS module utilizes randomized sampling sites to derive the expansion component of each land type from the supplied land use expansion data [70]. The module utilizes the random forest algorithm to extract the expansion pattern of each land use type, thereby obtaining the probability of change and the contribution of various drivers to the land use changes within the provided timeframe. A total of 14 factors were chosen as driving factors in this study (Figure 3). These factors include five environmental factors (elevation, slope, soil type, precipitation, and temperature), three socio-economic factors (GDP, nighttime lighting, and population), and six accessibility factors (distance to railroad, distance to highway, distance to primary road, distance to secondary road, distance to tertiary road, and distance to water system). The training method incorporated a sample rate of 0.1, indicating that 10% of the pixels were included in the training process. The regression tree was configured with a depth of 20. The mTry parameter in the random forest algorithm was assigned a value of 14, representing the total number of driving factors. This value defines the number of variables that are randomly sampled at each splitting node.
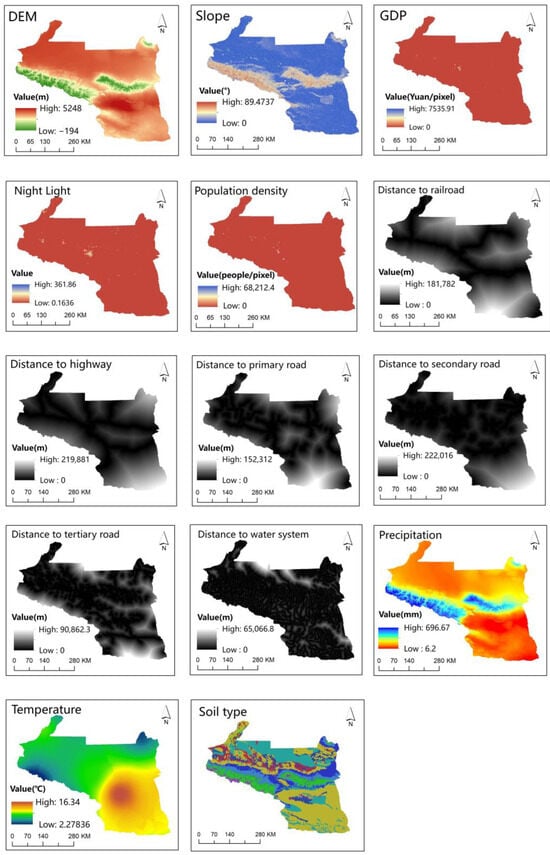
Figure 3.
Factors Driving Land Use Expansion Change.
The integration of the land transfer matrix and neighborhood weights in the CARS module enables the simulation of future land use patterns while adhering to the predicted probability of expansion for each land use type obtained from the LEAS module. The neighborhood weight was calculated based on the proportion of expansion area for each land use type. Additionally, the land use demand was derived from the results generated by the MOP model.
3. Results
3.1. Soil Erosion
There has been a gradual improvement in soil erosion conditions over the past 20 years, characterized by a reduction in both extreme erosion events and overall erosion levels in the areas that had previously experienced severe erosion. The amount of soil erosion in the urban agglomeration on the northern slopes of the Tianshan Mountains has been decreasing from 2000 to 2020 (Figure 4). The total value was 688,885,900 tons in 2000, 600,191,600 tons in 2010, and decreased to 456,803,000 tons in 2020, resulting in a 33.69% reduction over 20 years. This decrease may be attributed to the arid climate with limited rainfall, which makes it more difficult for hydraulic soil erosion to occur and results in less erosion overall. The northern slopes of the Tianshan Mountain are located in the westerly wind belt and experiences cold air from the Arctic Ocean on its windward slope. The topography lifts the airflow, facilitating precipitation formation. On the contrary, the area located in the rear sun belt experiences low water evaporation, resulting in higher humidity. The city of Turpan, being low-lying, faces difficulty in dissipating the high temperatures generated, and is the most arid part of the study area (Figure 5).
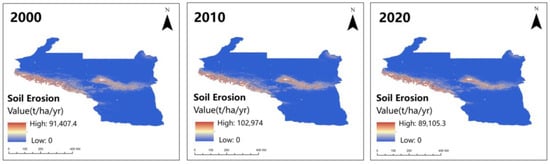
Figure 4.
Soil erosion map of the urban agglomeration on the northern slopes of the Tianshan Mountains.
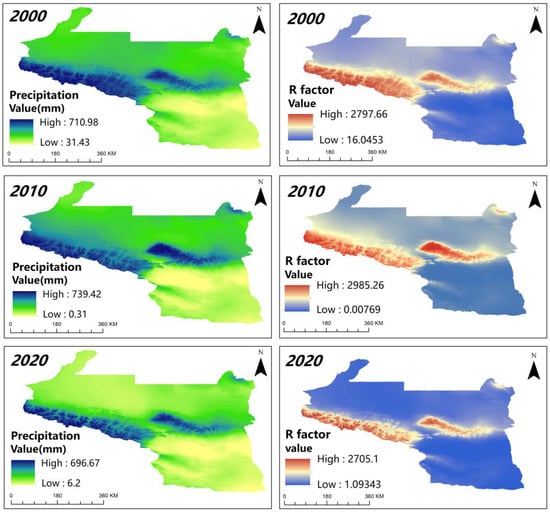
Figure 5.
Rainfall map for 2000–2020.
The Tianshan Mountain region is more susceptible to soil erosion problems because of its steep slopes and high rainfall, and the spatial distribution of soil erosion in the urban agglomeration on the northern slopes of the Tianshan Mountains remained consistent from 2000 to 2020, with high levels of erosion and high-risk areas.
The changes in rainfall patterns have played a significant role in the gradual reduction in soil erosion in this area. An extreme decline in soil erosion was witnessed in 2020, aligning with the variations in rainfall within the urban agglomeration on the northern slopes of the Tianshan Mountains. Specifically, rainfall measured at 141.57 mm/grid in 2000, decreased to 133.81 mm/grid in 2010, and further plummeted to 85.59 mm/grid in 2020. This trend is consistent with the changes observed in soil erosion patterns across the northern slopes of the Tianshan Mountains over the past 20 years.
Table 3 presents the statistics of six categories of soil erosion in the study area. Over the span of two decades, there was a notable reduction in the area affected by light to severe erosion. The most substantial declines were observed in severe erosion and light erosion categories, with proportions decreasing from 18.12% and 16.82% in 2000 to 14.34% and 11.54% in 2020, respectively. The proportion of slight erosion, which had the largest share, increased from 53.54% in 2000 to 65.14% in 2020.
Table 3.
Classified soil erosion in the urban agglomeration on the northern slopes of Tianshan Mountains.
The total soil erosion across all six soil erosion categories has been reduced, yet the proportion of soil erosion within each category has remained relatively stable. This underscores the consistency in the distribution of soil erosion throughout the 20-year period. Although there has been a substantial increase in the area affected by slight erosion, the total soil erosion in this category has significantly decreased. By 2020, slight erosion accounted for only 0.22% of the total erosion, with the majority of erosion coming from areas affected by severe erosion. Severe erosion consistently contributed to more than 96.5% of the total erosion over the 20-year period.
Changji Hui Autonomous Prefecture has the largest amount of soil erosion, accounting for 33.17% of the total erosion in the urban agglomeration on the northern slopes of the Tianshan Mountains in 2020, followed by the city of Wusu with 23.22%. The city of Wusu exhibits the highest soil erosion area ratio, accounting for 6.88% of the study area, yet it contributes to a substantial 23.24% of the total soil erosion. Notably, severe erosion mainly occurs in the southern part of the city. The total amount of soil erosion in each city has gradually decreased over the past 20 years, with the greatest reduction in the city of Wujiaqu (90.74%), followed by the city of Kuitun (87.35%), indicating an overall improvement in the soil erosion situation (Table 4).
Table 4.
Soil erosion by region, 2000–2020.
3.2. Soil Erosion in Different LULC
Table 5 shows the soil erosion of various land use types in the study area, with TSE representing total soil erosion and ASE representing average soil erosion. The average soil erosion value of each land use type has decreased from 2000 to 2020, indicating an improvement in the soil erosion problem. However, the total soil erosion of forests and shrublands has increased, while all other land types have decreased. This increase is closely related to the significant increase in the area of forests and shrublands over the 20-year period. The land types with the highest soil erosion were grassland, barren land, and glacier and permafrost, with grassland and barren land accounting for 64.65% and 26.73% of the total erosion, respectively, and being the primary erosive land types in the study area. Glaciers and permafrost, as well as grasslands, have the highest average soil erosion and are the most susceptible land types to soil erosion in the study area.
Table 5.
Total soil erosion (TSE) in thousand tons and average soil erosion (ASE) in tons/ha.
This study defines the soil retention amount as the difference between the soil erosion amount before and after implementing soil conservation measures for a particular land use type in order to capture the soil retention capacity of different land use types. The soil erosion amount without soil conservation measures is determined by the plant cover management factor (C) and soil and water conservation measures factor (P), both of which are set to 1. The soil retention amount serves as a measure of the soil conservation capacity of the land use type. The corresponding data are shown in Table 6, where TSR indicates the total soil retention amount and ASR indicates the average soil retention amount.
Table 6.
TSR (thousand tons) and ASR (tons/ha).
The forest land type had the highest average soil retention capacity among all land use types, indicating its effectiveness in soil retention. Glaciers and permafrost had the worst soil retention capacity, followed by barren land and shrubland. The change in total and average soil retention varies with the total soil erosion, which is related to the definition of soil retention capacity and complemented by ASE.
3.3. LULC Variation
The land use types in the urban agglomeration on the northern slopes of the Tianshan Mountains are predominately barren land and grassland, followed by cropland (Table 7, Figure 6). There was a significant expansion in the area of barren land, and all other land types except for grassland, wetland, glacier, and permafrost also experienced an increase in their respective areas from 2000 to 2020. Wetland and grassland areas decreased the most, by 47.8% and 38.6%, respectively, during this period. Conversely, shrubland and forest areas increased the most, by 225% and 98.7%, respectively. Due to the rapid economic development, the impervious area has increased rapidly with growth rates of 22.8% and 58.9% from 2000 to 2010 and 2010 to 2020, respectively. Furthermore, owing to the large amount of mining activities, barren land had become the dominant land use type within the urban agglomeration on the northern slopes of Tianshan Mountains, reaching a substantial 56.08% of the total area in 2020.
Table 7.
Land use types and their respective areas in the urban agglomerations on the northern slopes of Tianshan Mountains from 2000 to 2020.
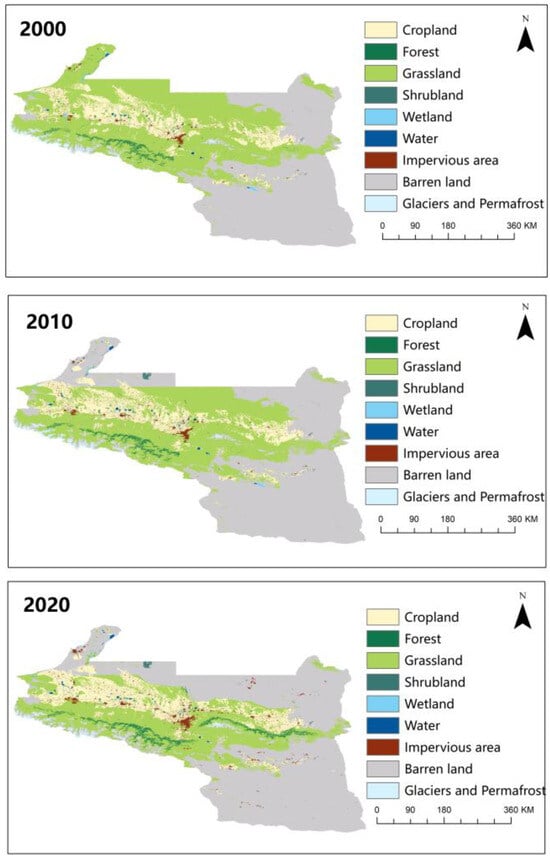
Figure 6.
LULC in Urban Agglomerations on the Northern Slopes of Tianshan Mountains.
Table 8 shows the land transfer in the urban agglomeration on the northern slopes of the Tianshan Mountains from 2000 to 2020. During this period, the most significant land type outflow was grassland, with an area of 3,441,053 ha, mainly converted to barren land (2,607,667 ha) and cropland (52,9021.6 ha), accounting for 75.78% and 15.37% of the total grassland area converted, respectively. The most significant land type inflow was barren land, which mainly came from grassland, accounting for 97.35% of the total inflow area. Shrubland showed the most dramatic change, increasing by 225%, mainly from grassland (18,803.4 ha) and cropland (2351.8 ha), and forests were also mainly converted from grassland, accounting for 98.35% of the total transferred area. The continuous increase in shrubland and forest reflects the positive impact of some ecological protection projects such as returning farmland to forest, sand control, and sand management.
Table 8.
LULC transfer matrix for the urban agglomeration on the northern slopes of the Tianshan Mountains, 2000–2020 (unit ha).
In the same geographical area and timeframe, under identical rainfall erosion conditions, changes in land use have an impact on both soil conservation measures and vegetation cover. Converting cropland to forested land, for instance, results in a modest 3.5% reduction in soil erosion, which is a relatively insignificant improvement in soil erosion control, especially since cropland is usually managed with contour farming practices and has a low inherent risk of soil erosion. The conversion of grassland and barren land to forested land reduced soil erosion significantly by 27.3% and 46.3%, respectively. Additionally, the conversion of barren land to grassland reduces soil erosion by 19%. This is particularly relevant for the southern part of the Tianshan Mountains, i.e., southern Wusu and Changji Hui Autonomous Prefecture, which suffered from severe erosion. This area predominantly consists of barren land and grassland and is influenced by extreme climatic conditions what impede plant growth. Consequently, the primary focus of remediation efforts should be directed towards these high-risk areas. It is worth noting that abrupt and extensive changes in land use are often driven by human interventions.
3.4. Multi-Scenario LULC Changes
The changes in land use types between 2020 and the predicted 2030 under three development scenarios are shown in Figure 7, with the areas of different land uses shown in Table 9. The most transferred-out land type in the Q1 scenario is grassland (1,313,454.24 ha), while the most transferred-in land type is barren land (9,999,988.83 ha). The most transferred-in land type in the Q2 scenario is barren land (846,913.86 ha), and the most transferred-out land type is grassland (866,774.52 ha), with 89.56% of the grassland coming from barren land (776,243.43 ha). Finally, the most transferred-out land type in the Q3 scenario is grassland (528,783.75 ha), and the most transferred-in land type is barren land (270,444.42 ha). In all three scenarios, cropland area is projected to increase. In the Q1 scenario, barren land accounts for 60% of the total area, while in the Q3 scenario, barren land increases slightly relative to 2020. Forests are predicted to expand to the highest value under all three scenarios, highlighting their significance for economic and ecological development in line with the macro policy of safeguarding the economy and environmental protection.
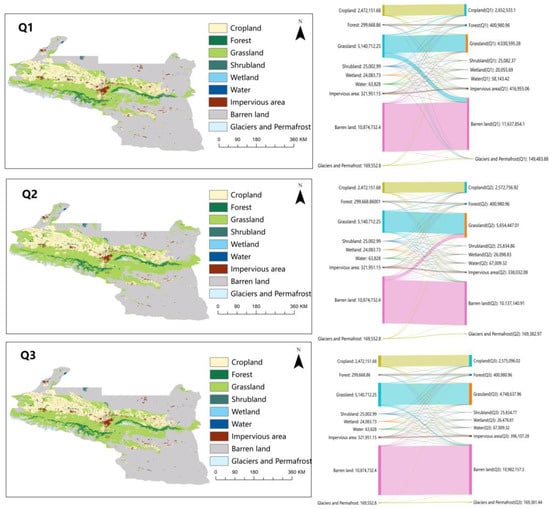
Figure 7.
Multi-scenario LULC changes between 2020 and 2030 (in hectares).
Table 9.
Different land use areas under different scenarios.
3.5. Changes in Soil Erosion under Different Scenarios
Soil erosion for the Q1, Q2, and Q3 scenarios were all significantly lower than that of 2020, with 2,719,436,000 tons, 2,757,876,500 tons and 2,574,784,400 tons, respectively (Figure 8), and this anomaly originated from the predicted 2030 rainfall for the different scenarios. Assuming that the 2030 predictions in different scenarios still use the rainfall values for 2020, while the C values for each land type used in the InVEST-SDR model inputs are calculated based on the C values for 2020. As the R values remain the same and the land classes in the extreme areas do not change, the erosion in the extreme erosion areas under each scenario remains identical to the erosion in 2020. The total soil erosion in 2020 was 456,803,000 tons. It increases by 5,081,661,000 tons in the Q1 (natural development) scenario, slightly increasing to 460,969,000 tons in the Q3 (economic priority) scenario, and decreasing to 438,002,400 tons in the Q2 (ecological protection) scenario. The current prediction method has limitations and requires improvements to incorporate predictions of changes in rainfall and NDVI, which are key factors affecting soil erosion through changes in LULC and related C and P factors. The continuous high-speed development may exacerbate soil erosion, and the Q1 scenario, which is consistent with the development trend of 2000–2020, shows a worsening of soil erosion. The past 20 years have witnessed significant changes in land use patterns due to rapid economic development, but with overall economic growth slowing down, there is a growing emphasis on ecological protection and restoration projects to optimize land use and maintain a balance between the ecological environment and economic development. In the Q3 scenario, which is subject to macro development policy restrictions, the predicted soil erosion amount is similar to the erosion amount in 2020, despite the pursuit of maximum economic benefits. Therefore, it is crucial for resource-based cities to strike a balance between economic development and ecological protection.
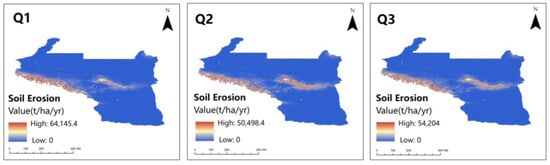
Figure 8.
Predicted soil erosion for each scenario.
This approach only considers the impact of land-use change. The R-value, on the other hand, continues to rely on the 2020 data. Rainfall is a very important factor influencing soil erosion, and the SSP119 scenario exhibits significantly higher rainfall levels relative to the other two scenarios. It is worth noting that the environmentally protected scenario has the highest soil erosion among the three scenarios (Figure 9). The Q1 scenario shows higher peaks of soil erosion, but the erosion area in the central mountainous region is smaller than the other two scenarios, which is also related to the effect of rainfall, with a decreasing trend in the rainfall area from SSP119 to SSP585.
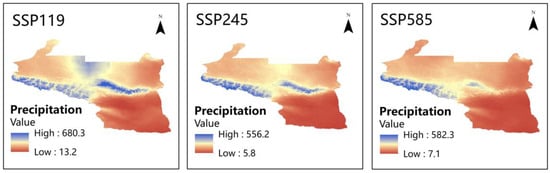
Figure 9.
Predicted precipitation.
4. Discussion
The prevention and management of soil erosion represent complex, long-term endeavors, especially in resource-based cities where resource exploitation is essential for economic development [71]. However, resource exploitation simultaneously elevates the risk of soil erosion. In the urban agglomeration on the northern slopes of the Tianshan Mountains, cropland is predominantly managed using contour farming techniques, resulting in a relatively low risk of soil erosion. Therefore, the impact of converting it into forested land through artificial intervention is limited. Instead, the primary focus should be on addressing soil erosion stemming from resource exploitation activities, particularly in the area surrounding the Tianshan Mountains characterized by steep slopes, heavy precipitation, and heightened susceptibility to severe soil erosion [72]. Artificial intervention in these areas can include planting trees to safeguard the integrity of the existing forests and prevent their degradation. Additionally, public awareness campaigns about ecological environment preservation can play a pivotal role in reducing the damage and pollution associated with human activities.
The forecasting component of this study integrates both the MOP model and the PLUS model to address the inherent limitations of a single model. It used the MOP model to impose constraints on the future scenarios of the two distinct development paths. Nevertheless, the constraints applied by the MOP-PLUS coupled model are not yet comprehensive enough. Additionally, due to the inherent volatility of real-world development and the dynamic nature of policy implementation, the forecasting outcomes may deviate from the actual development trajectory [73].
The selection of the three scenarios in this study was based on the future development plan outlined in the “Development Plan for the Urban Agglomeration on the North Slope of Tianshan Mountain”, which carried a degree of subjectivity [74]. Consequently, the three scenarios chosen for prediction represent extreme ends of the spectrum: business-as-vvusual development, the pursuit of maximization of environmental benefits under the constraints of the development plan, and the maximization of economic growth. These three extreme scenarios serve as reference points for decision-makers, aiding them in managing future land use patterns according to distinct development objectives. The aim is to facilitate improvements in the natural environment and to achieve a balance between environmental preservation and economic development in the context of continuous economic growth. The challenge lies in striking this equilibrium by objectively predicting changes in land use and finding ways to harmonize the inherent conflict between economic development and ecological protection, ultimately paving the way for sustainable development.
In future research, attention can be directed towards refining the control of variable constraints. This can involve the selection of a broader range of variables [70], incorporating additional variables from both social and economic perspectives, and introducing more environmental factors as constraints. Another avenue to explore is employing multiple objective functions to enhance the precision of predictions.
This study primarily emphasized the variations in soil erosion attributable to different land use scenarios, and the R value did not significantly affect the comparative analysis of soil erosion differences across the three scenarios. Nevertheless, improving the comprehensiveness of this study and more accurately characterizing soil erosion predictions requires a crucial focus on predicting rainfall patterns for the year 2030. There is a high degree of uncertainty in the modeling and prediction of the future climate, which may also lead to bias in the projections, which can be reduced through the use of multi-modal ensembles of climate scenario data [75].
The dynamics of soil erosion and land use change constitute a complex process, making it challenging to provide a detailed explanation of the precise influence of land use changes on soil erosion across a large region [76]. Summarizing the relationships between major land categories and soil erosion, as well as the effects stemming from land transfers may not fully capture the intricacies of this process. In future research endeavors, it would be beneficial to shift the focus toward smaller areas, conduct comprehensive long-term and month-to-month modeling analyses, and particularly emphasize soil erosion resulting from land use transitions within specific regions. This approach will allow us to pinpoint which specific land use transitions exert the most significant impact on soil erosion.
5. Conclusions
This study seeks to evaluate the soil erosion changes in the urban agglomeration on the northern slope of the Tianshan Mountains between 2000 and 2020. It specifically examines the influence of changes in land use on soil erosion. Furthermore, the MOP-PLUS coupled model was employed to forecast land use transformations in 2030 across three scenarios: Q1 (natural development), Q2 (ecological protection), and Q3 (economic priority). Additionally, soil erosion was predicted by utilizing the climate data from CMIP6. It offers a comprehensive land management guide for resource cities to achieve a harmonious equilibrium between economic expansion and ecological preservation.
Soil erosion has decreased over the past two decades, with the most affected areas concentrated around the Tianshan mountain region. Rapid conversion highlights the urgency for land management strategies, especially considering the detrimental effects on soil retention capacity and potential exacerbation of erosion in susceptible areas like grasslands, glaciers, and permafrost regions. The projections for 2030 indicate distinct variations in land-use patterns across the three scenarios. Forest areas continue to expand in all circumstances, highlighting their significance in ecological preservation and economic advantages. Soil erosion is expected to decrease in all three scenarios compared to 2020, primarily because of the anticipated decrease in rainfall.
Nevertheless, this study is not without its constraints. The subjective nature of establishing constraint equations and the potential disparities between real-world progress and planned scenarios present difficulties in ensuring the precision of the forecasts. Furthermore, the study’s comprehensiveness is constrained by the absence of accurate land use data and the uncertainty surrounding the modeling of future climatic data.
Author Contributions
Conceptualization, Z.Y.; Methodology, Z.G.; Software, Z.G.; Resources, Z.Y.; Writing—original draft, Z.G. and R.H.; Writing—review & editing, Z.Y., R.H., H.Y., H.C. and R.W.; Visualization, Z.G.; Funding acquisition, Z.Y. All authors have read and agreed to the published version of the manuscript.
Funding
This work was supported by the Third Xinjiang Scientific Expedition Program (2022xjkk1006), the Xinjiang Uygur Autonomous Region Key Research and Development Program (2022B01012-1), the Jiangsu Province Double Innovation Doctoral Program (JSSCBS20221523), the National Natural Science Foundation of China (42201451), the China Postdoctoral Science Foundation (2022M723379), the Open Research Fund of Jiangsu Key Laboratory of Coal-based Greenhouse Gas Control and Utilization (2022KF05), and the Fundamental Research Funds for the Central Universities (2022QN1058).
Data Availability Statement
The authors can provide the data upon reasonable request. The data are not publicly available due to privacy restrictions.
Conflicts of Interest
The authors declare that they have no known competing financial interests or personal relationships that could affect the work reported in this paper.
Abbreviations
| InVEST-SDR | Integrated valuation of ecosystem services and tradeoffs–sediment delivery ratio |
| MOP | Multi-objective planning |
| Q1 | Natural development |
| Q2 | Ecological protection |
| Q3 | Economic priority |
| SSP | Shared socio-economic pathway |
| SSP119 | A sustainable socio-economic development |
| SSP245 | A medium level of socio-economic development |
| SSP585 | A high level of socio-economic development |
| CMIP6 | Coupled model intercomparison project |
| R | Rainfall erosivity factor |
References
- Pereira, P.; Bogunovic, I.; Muñoz-Rojas, M.; Brevik, E.C. Soil ecosystem services, sustainability, valuation and management. Curr. Opin. Environ. Sci. Health 2018, 5, 7–13. [Google Scholar] [CrossRef]
- Marques, S.M.; Campos, F.S.; David, J.; Cabral, P. Modelling Sediment Retention Services and Soil Erosion Changes in Portugal: A Spatio-Temporal Approach. ISPRS Int. J. Geo-Inf. 2021, 10, 262. [Google Scholar] [CrossRef]
- Wang, B.; Zheng, F.; Guan, Y. Improved USLE-K factor prediction: A case study on water erosion areas in China. Int. Soil Water Conserv. Res. 2016, 4, 168–176. [Google Scholar] [CrossRef]
- Alewell, C.; Borrelli, P.; Meusburger, K.; Panagos, P. Using the USLE: Chances, challenges and limitations of soil erosion modelling. Int. Soil Water Conserv. Res. 2019, 7, 203–225. [Google Scholar] [CrossRef]
- Wischmeier, W.H.; Smith, D.D. Predicting Rainfall Erosion Losses: A Guide to Conservation Planning (No. 537); United States Department of Agriculture, Science and Education Administration: Washington, DC, USA, 1978.
- Renard, K.G.; Foster, G.R.; Weesies, G.A.; McCool, D.K.; Yoder, D.C. Predicting Soil Erosion by Water: A Guide to Conservation Planning with the Revised Universal Soil Loss Equation (RUSLE); United States Department of Agriculture, Agricultural Research Service: Washington, DC, USA, 1997.
- Laflen, J.M.; Lane, L.J.; Foster, G.R. WEPP: A new generation of erosion prediction technology. J. Soil Water Conserv. 1991, 46, 34–38. [Google Scholar]
- Takken, I.; Beuselinck, L.; Nachtergaele, J.; Govers, G.; Poesen, J.; Degraer, G. Spatial evaluation of a physically-based distributed erosion model (LISEM). CATENA 1999, 37, 431–447. [Google Scholar] [CrossRef]
- Merritt, W.; Letcher, R.; Jakeman, A. A review of erosion and sediment transport models. Environ. Model. Softw. 2003, 18, 761–799. [Google Scholar] [CrossRef]
- Borrelli, P.; Alewell, C.; Alvarez, P.; Anache, J.A.A.; Baartman, J.; Ballabio, C.; Bezak, N.; Biddoccu, M.; Cerdà, A.; Chalise, D.; et al. Soil erosion modelling: A global review and statistical analysis. Sci. Total Environ. 2021, 780, 146494. [Google Scholar] [CrossRef] [PubMed]
- Kebede, Y.S.; Endalamaw, N.T.; Sinshaw, B.G.; Atinkut, H.B. Modeling soil erosion using RUSLE and GIS at watershed level in the upper beles, Ethiopia. Environ. Chall. 2021, 2, 100009. [Google Scholar] [CrossRef]
- Koirala, P.; Thakuri, S.; Joshi, S.; Chauhan, R. Estimation of soil erosion in Nepal using a RUSLE modeling and geospatial tool. Geosciences 2019, 9, 147. [Google Scholar] [CrossRef]
- Thapa, P. Spatial estimation of soil erosion using RUSLE modeling: A case study of Dolakha district, Nepal. Environ. Syst. Res. 2020, 9, 15. [Google Scholar] [CrossRef]
- Jain, M.K.; Das, D. Estimation of Sediment Yield and Areas of Soil Erosion and Deposition for Watershed Prioritization using GIS and Remote Sensing. Water Resour. Manag. 2010, 24, 2091–2112. [Google Scholar] [CrossRef]
- Thomas, J.; Joseph, S.; Thrivikramji, K. Estimation of soil erosion in a rain shadow river basin in the southern Western Ghats, India using RUSLE and transport limited sediment delivery function. Int. Soil Water Conserv. Res. 2018, 6, 111–122. [Google Scholar] [CrossRef]
- Marques, V.S.; Ceddia, M.B.; Antunes, M.A.H.; Carvalho, D.F.; Anache, J.A.A.; Rodrigues, D.B.B.; Oliveira, P.T.S. USLE K-Factor Method Selection for a Tropical Catchment. Sustainability 2019, 11, 1840. [Google Scholar] [CrossRef]
- Kaffas, K.; Pisinaras, V.; Al Sayah, M.J.; Santopietro, S.; Righetti, M. A USLE-based model with modified LS-factor combined with sediment delivery module for Alpine basins. CATENA 2021, 207, 105655. [Google Scholar] [CrossRef]
- Winterová, J.; Krása, J.; Bauer, M.; Noreika, N.; Dostál, T. Using WaTEM/SEDEM to Model the Effects of Crop Rotation and Changes in Land Use on Sediment Transport in the Vrchlice Watershed. Sustainability 2022, 14, 5748. [Google Scholar] [CrossRef]
- Mirakhorlo, M.S.; Rahimzadegan, M. Evaluating estimated sediment delivery by Revised Universal Soil Loss Equation (RUSLE) and Sediment Delivery Distributed (SEDD) in the Talar Watershed, Iran. Front. Earth Sci. 2020, 14, 50–62. [Google Scholar] [CrossRef]
- Borselli, L.; Cassi, P.; Torri, D. Prolegomena to sediment and flow connectivity in the landscape: A GIS and field numerical assessment. CATENA 2008, 75, 268–277. [Google Scholar] [CrossRef]
- Vigiak, O.; Borselli, L.; Newham, L.T.H.; McInnes, J.; Roberts, A.M. Comparison of conceptual landscape metrics to define hillslope-scale sediment delivery ratio. Geomorphology 2012, 138, 74–88. [Google Scholar] [CrossRef]
- Hamel, P.; Chaplin-Kramer, R.; Sim, S.; Mueller, C. A new approach to modeling the sediment retention service (InVEST 3.0): Case study of the Cape Fear catchment, North Carolina, USA. Sci. Total Environ. 2015, 524–525, 166–177. [Google Scholar] [CrossRef]
- Aneseyee, A.B.; Elias, E.; Soromessa, T.; Feyisa, G.L. Land use/land cover change effect on soil erosion and sediment delivery in the Winike watershed, Omo Gibe Basin, Ethiopia. Sci. Total Environ. 2020, 728, 138776. [Google Scholar] [CrossRef] [PubMed]
- Gashaw, T.; Bantider, A.; Zeleke, G.; Alamirew, T.; Jemberu, W.; Worqlul, A.W.; Dile, Y.T.; Bewket, W.; Meshesha, D.T.; Adem, A.A.; et al. Evaluating InVEST model for estimating soil loss and sediment export in data scarce regions of the Abbay (Upper Blue Nile) Basin: Implications for land managers. Environ. Chall. 2021, 5, 100381. [Google Scholar] [CrossRef]
- Zhao, Y.; Liu, L.; Kang, S.; Ao, Y.; Han, L.; Ma, C. Quantitative analysis of factors influencing spatial distribution of soil erosion based on geo-detector model under diverse geomorphological types. Land 2021, 10, 604. [Google Scholar] [CrossRef]
- Yang, M.; Yang, Q.; Zhang, K.; Wang, C.; Pang, G.; Li, Y. Effects of soil rock fragment content on the USLE-K factor estimating and its influencing factors. Int. Soil Water Conserv. Res. 2023, 11, 263–275. [Google Scholar] [CrossRef]
- Xu, Z.; Zhang, S.; Zhou, Y.; Hou, X.; Yang, X. Characteristics of watershed dynamic sediment delivery based on improved RUSLE model. CATENA 2022, 219, 106602. [Google Scholar] [CrossRef]
- Cao, Y.; Kong, L.; Zhang, L.; Ouyang, Z. The balance between economic development and ecosystem service value in the process of land urbanization: A case study of China’s land urbanization from 2000 to 2015. Land Use Policy 2021, 108, 105536. [Google Scholar] [CrossRef]
- Chen, J.; Li, Z.; Xiao, H.; Ning, K.; Tang, C. Effects of land use and land cover on soil erosion control in southern China: Implications from a systematic quantitative review. J. Environ. Manag. 2021, 282, 111924. [Google Scholar] [CrossRef] [PubMed]
- Tian, P.; Mu, X.; Liu, J.; Hu, J.; Gu, C. Impacts of climate variability and human activities on the changes of runoff and sediment load in a catchment of the Loess Plateau, China. Adv. Meteorol. 2016, 2016, 4724067. [Google Scholar] [CrossRef]
- Huang, C.; Yang, Q.; Cao, X.; Li, Y. Assessment of the soil erosion response to land use and slope in the Loess Plateau—A case study of Jiuyuangou. Water 2020, 12, 529. [Google Scholar] [CrossRef]
- Siswanto, S.Y.; Francés, F. How land use/land cover changes can affect water, flooding and sedimentation in a tropical watershed: A case study using distributed modeling in the Upper Citarum watershed, Indonesia. Environ. Earth Sci. 2019, 78, 550. [Google Scholar] [CrossRef]
- Tadesse, L.; Suryabhagavan, K.; Sridhar, G.; Legesse, G. Land use and land cover changes and Soil erosion in Yezat Watershed, North Western Ethiopia. Int. Soil Water Conserv. Res. 2017, 5, 85–94. [Google Scholar] [CrossRef]
- Ge, Y.G.; Cui, P.; Lin, Y.M.; Zhuang, J.Q.; Jia, S.W. Soil erosion evaluation and prediction approach using 137Cs, RS, and GIS in Xiaojiang River basin of China. Natl. Remote Sens. Bull. 2014, 18, 887–901. [Google Scholar]
- Chuenchum, P.; Xu, M.; Tang, W. Predicted trends of soil erosion and sediment yield from future land use and climate change scenarios in the Lancang–Mekong River by using the modified RUSLE model. Int. Soil Water Conserv. Res. 2020, 8, 213–227. [Google Scholar] [CrossRef]
- Paegelow, M.; Olmedo, M.T.C. Possibilities and limits of prospective GIS land cover modelling—A compared case study: Garrotxes (France) and Alta Alpujarra Granadina (Spain). Int. J. Geogr. Inf. Sci. 2005, 19, 697–722. [Google Scholar] [CrossRef]
- Verburg, P.H.; Overmars, K.P. Combining top-down and bottom-up dynamics in land use modeling: Exploring the future of abandoned farmlands in Europe with the Dyna-CLUE model. Landsc. Ecol. 2009, 24, 1167–1181. [Google Scholar] [CrossRef]
- Liu, X.; Liang, X.; Li, X.; Xu, X.; Ou, J.; Chen, Y.; Li, S.; Wang, S.; Pei, F. A future land use simulation model (FLUS) for simulating multiple land use scenarios by coupling human and natural effects. Landsc. Urban Plan. 2017, 168, 94–116. [Google Scholar] [CrossRef]
- Liang, X.; Guan, Q.; Clarke, K.C.; Liu, S.; Wang, B.; Yao, Y. Understanding the drivers of sustainable land expansion using a patch-generating land use simulation (PLUS) model: A case study in Wuhan, China. Comput. Environ. Urban Syst. 2021, 85, 101569. [Google Scholar] [CrossRef]
- da Cunha, E.R.; Santos, C.A.G.; da Silva, R.M.; Panachuki, E.; de Oliveira PT, S.; de Souza Oliveira, N.; dos Santos Falcão, K. Assessment of current and future land use/cover changes in soil erosion in the Rio da Prata basin (Brazil). Sci. Total Environ. 2022, 818, 151811. [Google Scholar] [CrossRef]
- Zare, M.; Panagopoulos, T.; Loures, L. Simulating the impacts of future land use change on soil erosion in the Kasilian watershed, Iran. Land Use Policy 2017, 67, 558–572. [Google Scholar] [CrossRef]
- Cao, L.; Kong, F.; Xu, C. Exploring ecosystem carbon storage change and scenario simulation in the Qiantang River source region of China. Sci. Prog. 2022, 105. [Google Scholar] [CrossRef]
- Liu, Q.; Yang, D.; Cao, L.; Anderson, B. Assessment and prediction of carbon storage based on land use/land cover dynamics in the tropics: A case study of Hainan Island, China. Land 2022, 11, 244. [Google Scholar] [CrossRef]
- Li, Y.; Yao, S.; Jiang, H.; Wang, H.; Ran, Q.; Gao, X.; Ding, X.; Ge, D. Spatial-Temporal Evolution and Prediction of Carbon Storage: An Integrated Framework Based on the MOP–PLUS–InVEST Model and an Applied Case Study in Hangzhou, East China. Land 2022, 11, 2213. [Google Scholar] [CrossRef]
- Yan, Y.; Chai, Z.; Yang, X.; Simayi, Z.; Yang, S. The temporal and spatial changes of the ecological environment quality of the urban agglomeration on the northern slope of Tianshan Mountain and the influencing factors. Ecol. Indic. 2021, 133, 108380. [Google Scholar]
- Qu, L.; Zhu, Q.; Zhu, C.; Zhang, J. Monthly Precipitation Data Set with 1 km Resolution in China from 1960 to 2020[DB/OL]. V1. Science Data Bank. 2022. Available online: https://cstr.cn/31253.11.sciencedb.01607 (accessed on 17 April 2023).
- Zhao, N.; Liu, Y.; Cao, G.; Samson, E.L.; Zhang, J. Forecasting China’s GDP at the pixel level using nighttime lights time series and population images. GIScience Remote Sens. 2017, 54, 407–425. [Google Scholar] [CrossRef]
- Li, L. 2015–2100 Global Climate Dataset Considering Different SSPs Scenarios of China’s Carbon Neutral Targets [DB/OL]. A Big Earth Data Platform for Three Poles. 2022. Available online: https://poles.tpdc.ac.cn/zh-hans/data (accessed on 20 February 2024).
- Li, L.; Zhang, Y.; Zhou, T.; Wang, K.; Wang, C.; Wang, T.; Yuan, L.; An, K.; Zhou, C.; Lü, G. Mitigation of China’s carbon neutrality to global warming. Nat. Commun. 2022, 13, 5315. [Google Scholar] [CrossRef] [PubMed]
- Desmet, P.J.J.; Govers, G. A GIS procedure for automatically calculating the USLE LS factor on topographically complex landscape units. J. Soil Water Conserv. 1996, 51, 427–433. [Google Scholar]
- Zhang, W.B.; Fu, J.S. Rainfall Erosivity Estimation under Different Rainfall Amount. Resour. Sci. 2003, 25, 35–41. [Google Scholar]
- Williams, J.R.; Renard, K.G.; Dyke, P.T. EPIC: A new method for assessing erosion’s effect on soil productivity. J. Soil Water Conserv. 1983, 38, 381–383. [Google Scholar]
- Singh, S.K.; Mustak, S.; Srivastava, P.K.; Szabó, S.; Islam, T. Predicting spatial and decadal LULC changes through cellular automata Markov chain models using earth observation datasets and geo-information. Environ. Process. 2015, 2, 61–78. [Google Scholar] [CrossRef]
- Costanza, R.; d’Arge, R.; de Groot, R.; Farber, S.; Grasso, M.; Hannon, B.; Limburg, K.; Naeem, S.; O’Neill, R.V.; Paruelo, J.; et al. The value of the world’s ecosystem services and natural capital. Nature 1997, 387, 253–260. [Google Scholar] [CrossRef]
- Xie, G.D.; Zhang, C.X.; Zhang, L.M.; Chen, W.H.; Li, S.M. Improvement of the evaluation method for ecosystem service value based on per unit area. J. Nat. Resour. 2015, 30, 1243–1254. [Google Scholar]
- Wang, Y.; Li, X.; Zhang, Q.; Li, J.; Zhou, X. Projections of future land use changes: Multiple scenarios-based impacts analysis on ecosystem services for Wuhan city, China. Ecol. Indic. 2018, 94, 430–445. [Google Scholar] [CrossRef]
- Li, C.; Wu, Y.; Gao, B.; Zheng, K.; Wu, Y.; Li, C. Multi-scenario simulation of ecosystem service value for optimization of land use in the Sichuan-Yunnan ecological barrier, China. Ecol. Indic. 2021, 132, 108328. [Google Scholar] [CrossRef]
- Yao, Y.; Liu, X.; Li, X.; Liu, P.; Hong, Y.; Zhang, Y.; Mai, K. Simulating urban land-use changes at a large scale by integrating dynamic land parcel subdivision and vector-based cellular automata. Int. J. Geogr. Inf. Sci. 2017, 31, 2452–2479. [Google Scholar] [CrossRef]
- Li, J.; Guldmann, J.-M.; Gong, J.; Su, H. Urban growth boundaries optimization under low-carbon development: Combining multi-objective programming and patch cellular automata models. J. Environ. Manag. 2023, 340, 117934. [Google Scholar] [CrossRef] [PubMed]
- Wang, P.; Li, R.; Liu, D.; Wu, Y. Dynamic characteristics and responses of ecosystem services under land use/land cover change scenarios in the Huangshui River Basin, China. Ecol. Indic. 2022, 144, 109539. [Google Scholar] [CrossRef]
- Riahi, K.; Van Vuuren, D.P.; Kriegler, E.; Edmonds, J.; O’Neill, B.C.; Fujimori, S.; Bauer, N.; Calvin, K.; Dellink, R.; Fricko, O.; et al. The Shared Socioeconomic Pathways and their energy, land use, and greenhouse gas emissions implications: An overview. Glob. Environ. Chang. 2017, 42, 153–168. [Google Scholar] [CrossRef]
- Yun, X.; Tang, Q.; Li, J.; Lu, H.; Zhang, L.; Chen, D. Can reservoir regulation mitigate future climate change induced hydrological extremes in the Lancang-Mekong River Basin? Sci. Total Environ. 2021, 785, 147322. [Google Scholar] [CrossRef]
- Wang, Z.; Li, X.; Mao, Y.; Li, L.; Wang, X.; Lin, Q. Dynamic simulation of land use change and assessment of carbon storage based on climate change scenarios at the city level: A case study of Bortala, China. Ecol. Indic. 2022, 134, 108499. [Google Scholar] [CrossRef]
- Yang, B.; Chen, X.; Wang, Z.; Li, W.; Zhang, C.; Yao, X. Analyzing land use structure efficiency with carbon emissions: A case study in the Middle Reaches of the Yangtze River, China. J. Clean. Prod. 2020, 274, 123076. [Google Scholar] [CrossRef]
- Shi, H.; Mu, X.; Zhang, Y.; Lu, M.Q. Effects of different land use patterns on carbon emission in Guangyuan city of Sichuan province. Bull. Soil Water Conserv. 2012, 32, 101–106. [Google Scholar]
- Chen, H.; Zhou, S.; Wu, N.; Wang, Y.F.; Luo, P.; Shi, F.S. Advance in studies on production, oxidation and emission flux of methane from wetlands. Chin. J. Appl. Environ. Biol. 2006, 12, 726–733. [Google Scholar]
- Sun, H.; Liang, H.; Chang, X.; Cui, Q.; Tao, Y. Land use patterns on carbon emission and spatial association in China. Econ. Geogr. 2015, 35, 154–162. [Google Scholar]
- Zhang, C.-Y.; Zhao, L.; Zhang, H.; Chen, M.-N.; Fang, R.-Y.; Yao, Y.; Zhang, Q.-P.; Wang, Q. Spatial-temporal characteristics of carbon emissions from land use change in Yellow River Delta region, China. Ecol. Indic. 2022, 136, 108623. [Google Scholar] [CrossRef]
- Liu, M.; Dong, X.; Zhang, Y.; Wang, X.-C.; Wei, H.; Zhang, P.; Zhang, Y. Spatiotemporal changes in future water yield and the driving factors under the carbon neutrality target in Qinghai. Ecol. Indic. 2024, 158, 111310. [Google Scholar] [CrossRef]
- Guo, W.; Teng, Y.; Yan, Y.; Zhao, C.; Zhang, W.; Ji, X. Simulation of Land Use and Carbon Storage Evolution in Multi-Scenario: A Case Study in Beijing-Tianjin-Hebei Urban Agglomeration, China. Sustainability 2022, 14, 13436. [Google Scholar] [CrossRef]
- Han, J.; Hu, Z.; Wang, P.; Yan, Z.; Li, G.; Zhang, Y.; Zhou, T. Spatio-temporal evolution and optimization analysis of ecosystem service value—A case study of coal resource-based city group in Shandong, China. J. Clean. Prod. 2022, 363, 132602. [Google Scholar] [CrossRef]
- Zhang, W.; Zhou, J.; Feng, G.; Weindorf, D.C.; Hu, G.; Sheng, J. Characteristics of water erosion and conservation practice in arid regions of Central Asia: Xinjiang, China as an example. Int. Soil Water Conserv. Res. 2015, 3, 97–111. [Google Scholar] [CrossRef]
- Dong, J.; Guo, Z.; Zhao, Y.; Hu, M.; Li, J. Coupling coordination analysis of industrial mining land, landscape pattern and carbon storage in a mining city: A case study of Ordos, China. Geomat. Nat. Hazards Risk 2023, 14, 2275539. [Google Scholar] [CrossRef]
- Liu, Y.; Jing, Y.; Han, S. Multi-scenario simulation of land use/land cover change and water yield evaluation coupled with the GMOP-PLUS-InVEST model: A case study of the Nansi Lake Basin in China. Ecol. Indic. 2023, 155, 110926. [Google Scholar] [CrossRef]
- Xu, S.; Wang, X.; Ma, X.; Gao, S. Risk assessment and prediction of soil water erosion on the middle northern slope of Tianshan Mountain. Sustainability 2023, 15, 4826. [Google Scholar] [CrossRef]
- Qiao, X.; Li, Z.; Lin, J.; Wang, H.; Zheng, S.; Yang, S. Assessing current and future soil erosion under changing land use based on InVEST and FLUS models in the Yihe River Basin, North China. Int. Soil Water Conserv. Res. 2024, 12, 298–312. [Google Scholar] [CrossRef]
Disclaimer/Publisher’s Note: The statements, opinions and data contained in all publications are solely those of the individual author(s) and contributor(s) and not of MDPI and/or the editor(s). MDPI and/or the editor(s) disclaim responsibility for any injury to people or property resulting from any ideas, methods, instructions or products referred to in the content. |
© 2024 by the authors. Licensee MDPI, Basel, Switzerland. This article is an open access article distributed under the terms and conditions of the Creative Commons Attribution (CC BY) license (https://creativecommons.org/licenses/by/4.0/).