Article

Seasonal Response of the NDVI to the SPEI at Different Time Scales in Yinshanbeilu, Inner Mongolia, China

1
Yinshanbeilu Grassland Eco-Hydrology National Observation and Research Station, China Institute of Water Resources and Hydropower Research, Beijing 100038, China
2
General Institute of Water Resources and Hydropower Planning and Design, Ministry of Water Resources, Beijing 100120, China
3
Water Resources Research Institute of Shandong Province, Shandong Provincial Key Laboratory of Water Resources and Environment, Jinan 250014, China
4
School of Water Conservancy, North China University of Water Resources and Electric Power, Zhengzhou 450046, China
*
Author to whom correspondence should be addressed.
Land 2024, 13(4), 523; https://doi.org/10.3390/land13040523
Submission received: 25 February 2024 / Revised: 4 April 2024 / Accepted: 7 April 2024 / Published: 15 April 2024

Abstract

:
Recently, the frequent occurrence of droughts has caused a serious impact on vegetation growth and progression. This research is based upon the normalized difference vegetation index (NDVI) from 2001 to 2020. The correlation between the NDVI and standardized precipitation evapotranspiration index (SPEI) at disparate time scales was used to assess the response of vegetation growth to drought in the Yinshanbeilu region. The drought levels of SPEI1, SPEI3, SPEI6, and SPEI12 increased prominently in the eastern region of the country, while the NDVI decreased significantly from east to west in spring, summer, and autumn but was reversed in the winter. The area with an upward trend (33.86%) was slightly lower than that with a downward trend (66.14%). The correlation coefficients between the NDVI and SPEI over the entire year increased with the SPEI timescale. The elevated values were concentrated in the southeastern and western regions of the survey region. Additionally, the best correlation timescales were SPEI6 and SPEI12. Grassland was the most sensitive vegetation type to the SPEI response in the NDVI. The correlation coefficients of NDVI and SPEI1–12 were 0.313, 0.459, 0.422, and 0.406. Both spring and summer were more responsive to SPEI12, whereas autumn and winter were more responsive to SPEI3. The correlation of disparate time scales exhibited complex soil texture features with respect to different seasonal scales, and the soil texture showed a strong response to vegetation in both summer and autumn. Loam, sandy loam, and silty loam all exhibited the highest response to SPEI12, with coefficients of 0.509, 0.474, and 0.403, respectively.

1. Introduction

Vegetation, as a key part of continental ecosystems, becomes a natural connection between water, the atmosphere and soil and plays an important role in ecosystems. Additionally, vegetation is an “indicator” of global change [1,2,3,4]. Climate change, particularly climate extremes, is capable of exerting significant effects on community structure and ecosystem productivity, in addition to affecting vegetation [5,6,7,8,9]. Drought causes a disequilibrium of the water supply and demand because of abnormally low or no precipitation during a lengthy time period and has become a general natural disaster with an extensive impact and a lengthy duration [10,11,12,13]. As an illustration, a drought that occurred in the southwest of China from 2009 to 2010 led to an evident decrease in vegetation productivity, and a period of vegetation recovery in several fields lasted for more than half a year [14]. Therefore, based on the background of global warming and the significant increase in the frequency and severity of droughts, research on the association between vegetation and drought is highly practically significant and can provide an efficient theoretical foundation for vegetation to handle climate change in the future.
Drought occurrence is generally quantified by the drought index. Several scholars have proposed a variety of drought indices [15,16,17]. These indices include the Palmer drought severity index (PDSI) [18], the standardized precipitation index (SPI) [19], and the SPEI [20]. Among the multitude of drought indices, the SPEI not only considers the influence of precipitation upon drought but also integrates the sensitivity of the PDSI to feasible evapotranspiration variations and the advantage of the SPI at multiple time scales; thus, it is extensively adopted with a view to dissecting the response of vegetation to drought [21,22,23,24,25,26].
Presently, researchers worldwide have implemented many relevant projects concerning the effect of vegetation growth upon drought. Kong et al. [27] used the Pearson correlation coefficient to research the response features of vegetation in disparate areas of China to multiple timescales of drought (1–24 months) and found that in most regions, vegetation was greatly impacted by drought. In addition, the grassland was the most affected by drought. Liu et al. [28] analysed the association between vegetation growth and drought during 1998–2013; additionally, the results showed that in most areas at the 6 month and 12 month scales, the NDVI and SPEI were significantly positively correlated. The droughts had a greater effect on vegetation change in Inner Mongolia; however, droughts had a lesser effect on the eastern forest and western desert. Gouveia et al. [29] evaluated the correlation between the NDVI and SPEI in vegetation categories and different seasons in the southwestern United States from 2000 to 2015 and noted that the NDVI of grassland and scrub vegetation was strongly correlated with the SPEI in summer and that the forest NDVI was strongly connected to the SPEI in winter. Zhao et al. [30] analyzed the effect of vegetation on droughts during 1982–2015 by calculating the maximal Pearson correlation coefficient between the NDVI and SPEI. In addition, the results showed that grassland vegetation in this region was susceptible to droughts on a short-term scale, while forest and desert vegetation were susceptible to droughts on a longer-term scale. Moreover, the stability and resistance of different vegetation types to drought pressure vary, indicating that disparate vegetation categories cause disparate responses to drought during the growing season. In addition, droughts can alter the storage and location of usable soil water through differences in soil particle size and permeability, thereby affecting the water absorption of roots [31,32,33]. The effects of droughts on ecosystems depend not only upon drought features (such as prevailing timescales, seasonality, and drought severity) but also on other factors, such as topography and land use history [34,35,36,37]. Previous studies [38,39] have shown that the degradation and regeneration of forest vegetation are strongly related to variations in soil conditions.
With global warming, Yinshanbeilu has become the most sensitive and important area affected by climate change in all of Inner Mongolia [40]. Due to its distinctive ecosystem vulnerability and its interannual volatility of climate elements, Yinshanbeilu might be a perfect observation region for evaluating how the integration of water and heat affects natural vegetation growth. Recently, in addition to precipitation, Yinshanbeilu has experienced increased temperatures; however, the frequency and intensity of droughts have significantly increased. The increase in drought largely occurred because of the decrease in precipitation. The increase in soil and vegetation evapotranspiration was largely caused by the increase in atmospheric temperature [41]. Currently, there are numerous studies on the temporal and spatial characteristics of droughts and the effects of climate change on vegetation in Inner Mongolia. Nevertheless, few studies have evaluated the influence of vegetation dynamics on drought cases at multiple time scales, particularly at seasonal scales with disparate land cover categories and different soil textures. In addition, the correlation between NDVI and SPEI at different time scales is also quite different, and the response regularity between seasons is also different. Therefore, when studying the response of vegetation to drought, the effects of drought on vegetation growth at different time scales should be considered more carefully.
Therefore, the purpose of this study was as follows: (1) To explore the spatio-temporal characteristics of vegetation change and multi-time scale drought. (2) The correlation between the SPEI and vegetation throughout the entire year was analyzed. (3) To evaluate the effects of drought on vegetation dynamics of different land cover types and soil texture from 2001 to 2020. The results are helpful in terms of exploring the response of different desert vegetation to multi-time scale drought, and they provide scientific basis for vegetation protection and effective water resources treatment.

2. Materials and Methods
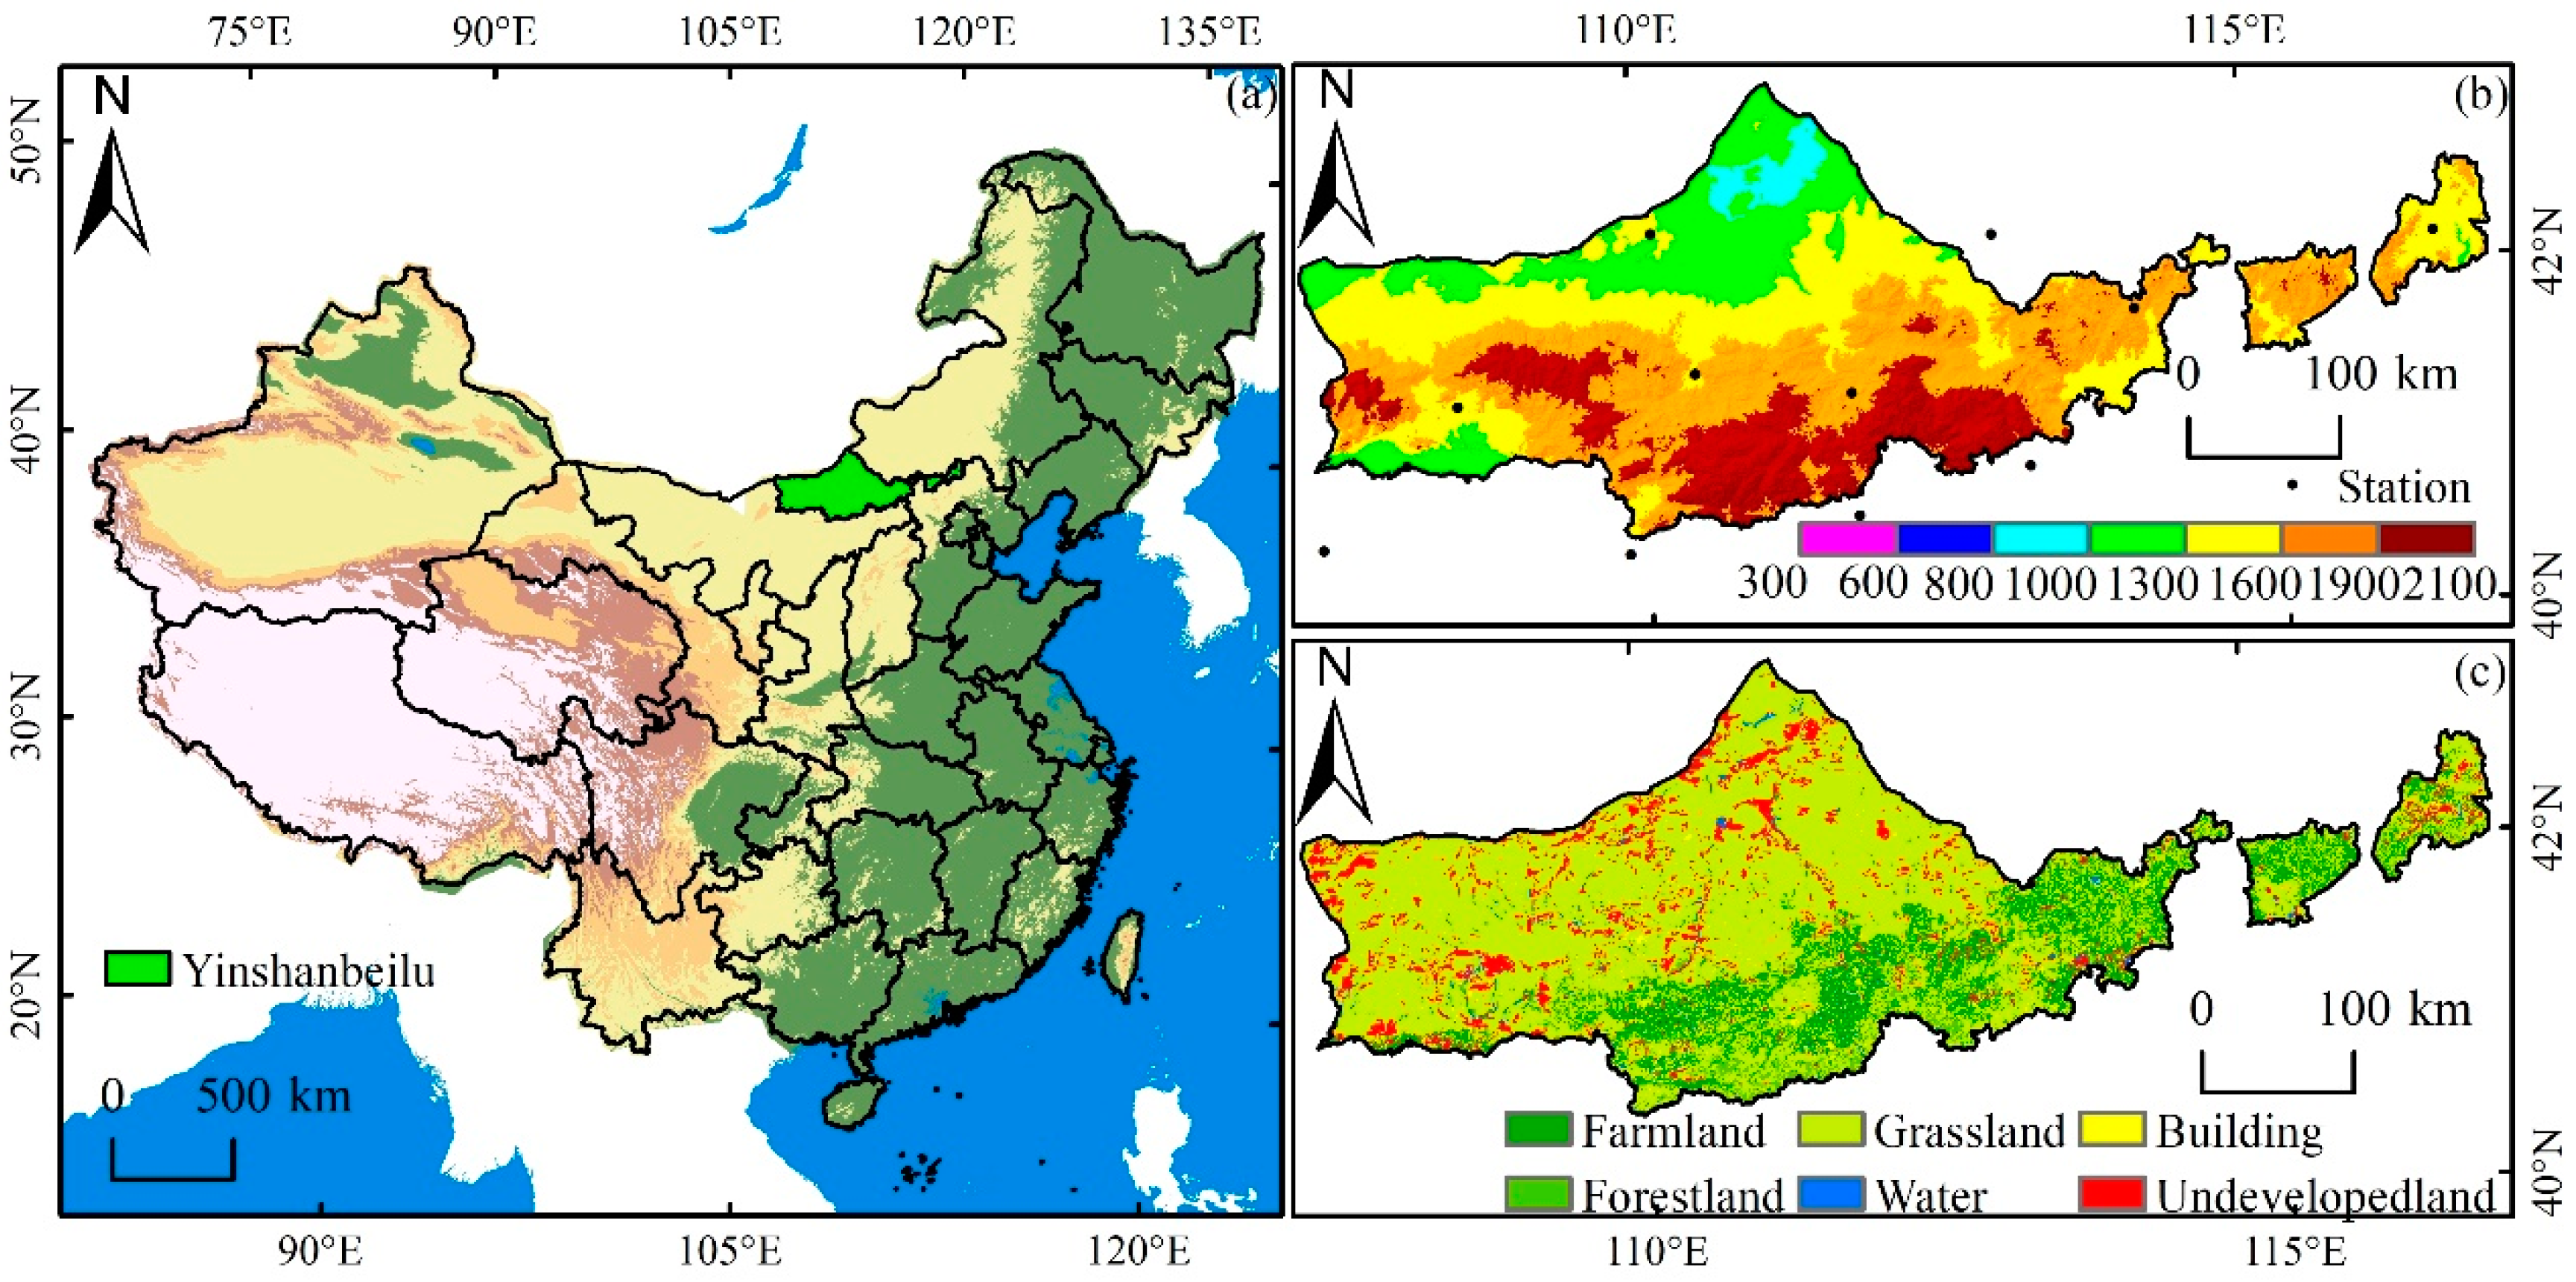
2.1. Study Area

Yinshanbeilu is located in the transitional zone between the Yinshan Mountain Range and the Mongolian Plateau and is a semi-agricultural and semi-pastoral area (Figure 1). The geographical coordinates are 107°17′~116°53′ east longitude and 40°43′~43°23′ north latitude. The administrative scope includes 12 banner counties, with a total area of 97,250.5 km2. The terrain of the study area is gradually lowered from south to north, reaching 941~2295 m in elevation. The area experiences a subarid continental monsoon climate in the mid-temperate zone, with an average yearly precipitation of 200~400 mm, an average annual temperature of 1.3~3.9%, an average annual evaporation of 1748~2300 mm, and an average annual frost-free period of 102~121 days. Coupled with the influence of land use change and human activities, ecological and environmental problems such as soil wind erosion, land desertification, soil erosion, and land degradation are becoming increasingly serious in the Yinshanbeilu area, which greatly restricts the development of the local economy and society.

2.2. Data Sources

2.2.1. Remote Sensing Data

The NDVI data were obtained from the MOD13A2-level NDVI normalized vegetation index data provided by EOS/MODIS (TERRA satellite) of NASA from 2001 to 2020 (https://ladsweb.modaps.eosdis.nasa.gov/, accessed on 1 February 2024), with a temporal resolution of 16 days and a spatial resolution of 1 km. Mean radiant temperature MODIS Reprojection Tool (MRT) was used for batch splicing and projection conversion of the obtained NDVI data, and the sinusoidal projection was subsequently converted into WGS-84 geographical coordinates. Then, the vector boundary of the study area was used to cut the NDVI data after projection conversion, and the monthly NDVI data of the Yinshanbeilu region from 2001 to 2020 were obtained. The NDVIs for spring (March to May), summer (June to August), and autumn (September to November), as well as winter (December to February), were calculated via the arithmetic average method.
The land use type data were obtained from the Data Center for Resources and Environmental Sciences, Chinese Academy of Sciences (http://www.resdc.cn/, accessed on 1 February 2024), with a spatial resolution of 1 km. The figures were produced by manual visual explanation based upon Landsat TM/ETM remotely sensed imagery of each phase, and the phases were divided into 6 primary types and 25 secondary types, from the National Earth System Science Data Center (https://www.geodata.cn, accessed on 1 February 2024). According to the research needs, based on the primary type, the vegetation was reclassified into six categories: grassland, forestland, cultivated land, unused land, building land, and water body.
This dataset is based on national land survey data from 2010 to 2020 and was generated by geographical weighted regression, random forest (RF), and other digital soil mapping methods through the secondary processing of 3 datasets with 1 km resolution of 0–20 cm soil sand content, soil clay content, and soil silt content in China, from the National Earth System Science Data Center (https://www.geodata.cn, accessed on 1 February 2024). In this research, the texture of the study region was split into three types: silty loam, sandy loam, and loam.

2.2.2. Meteorological Data
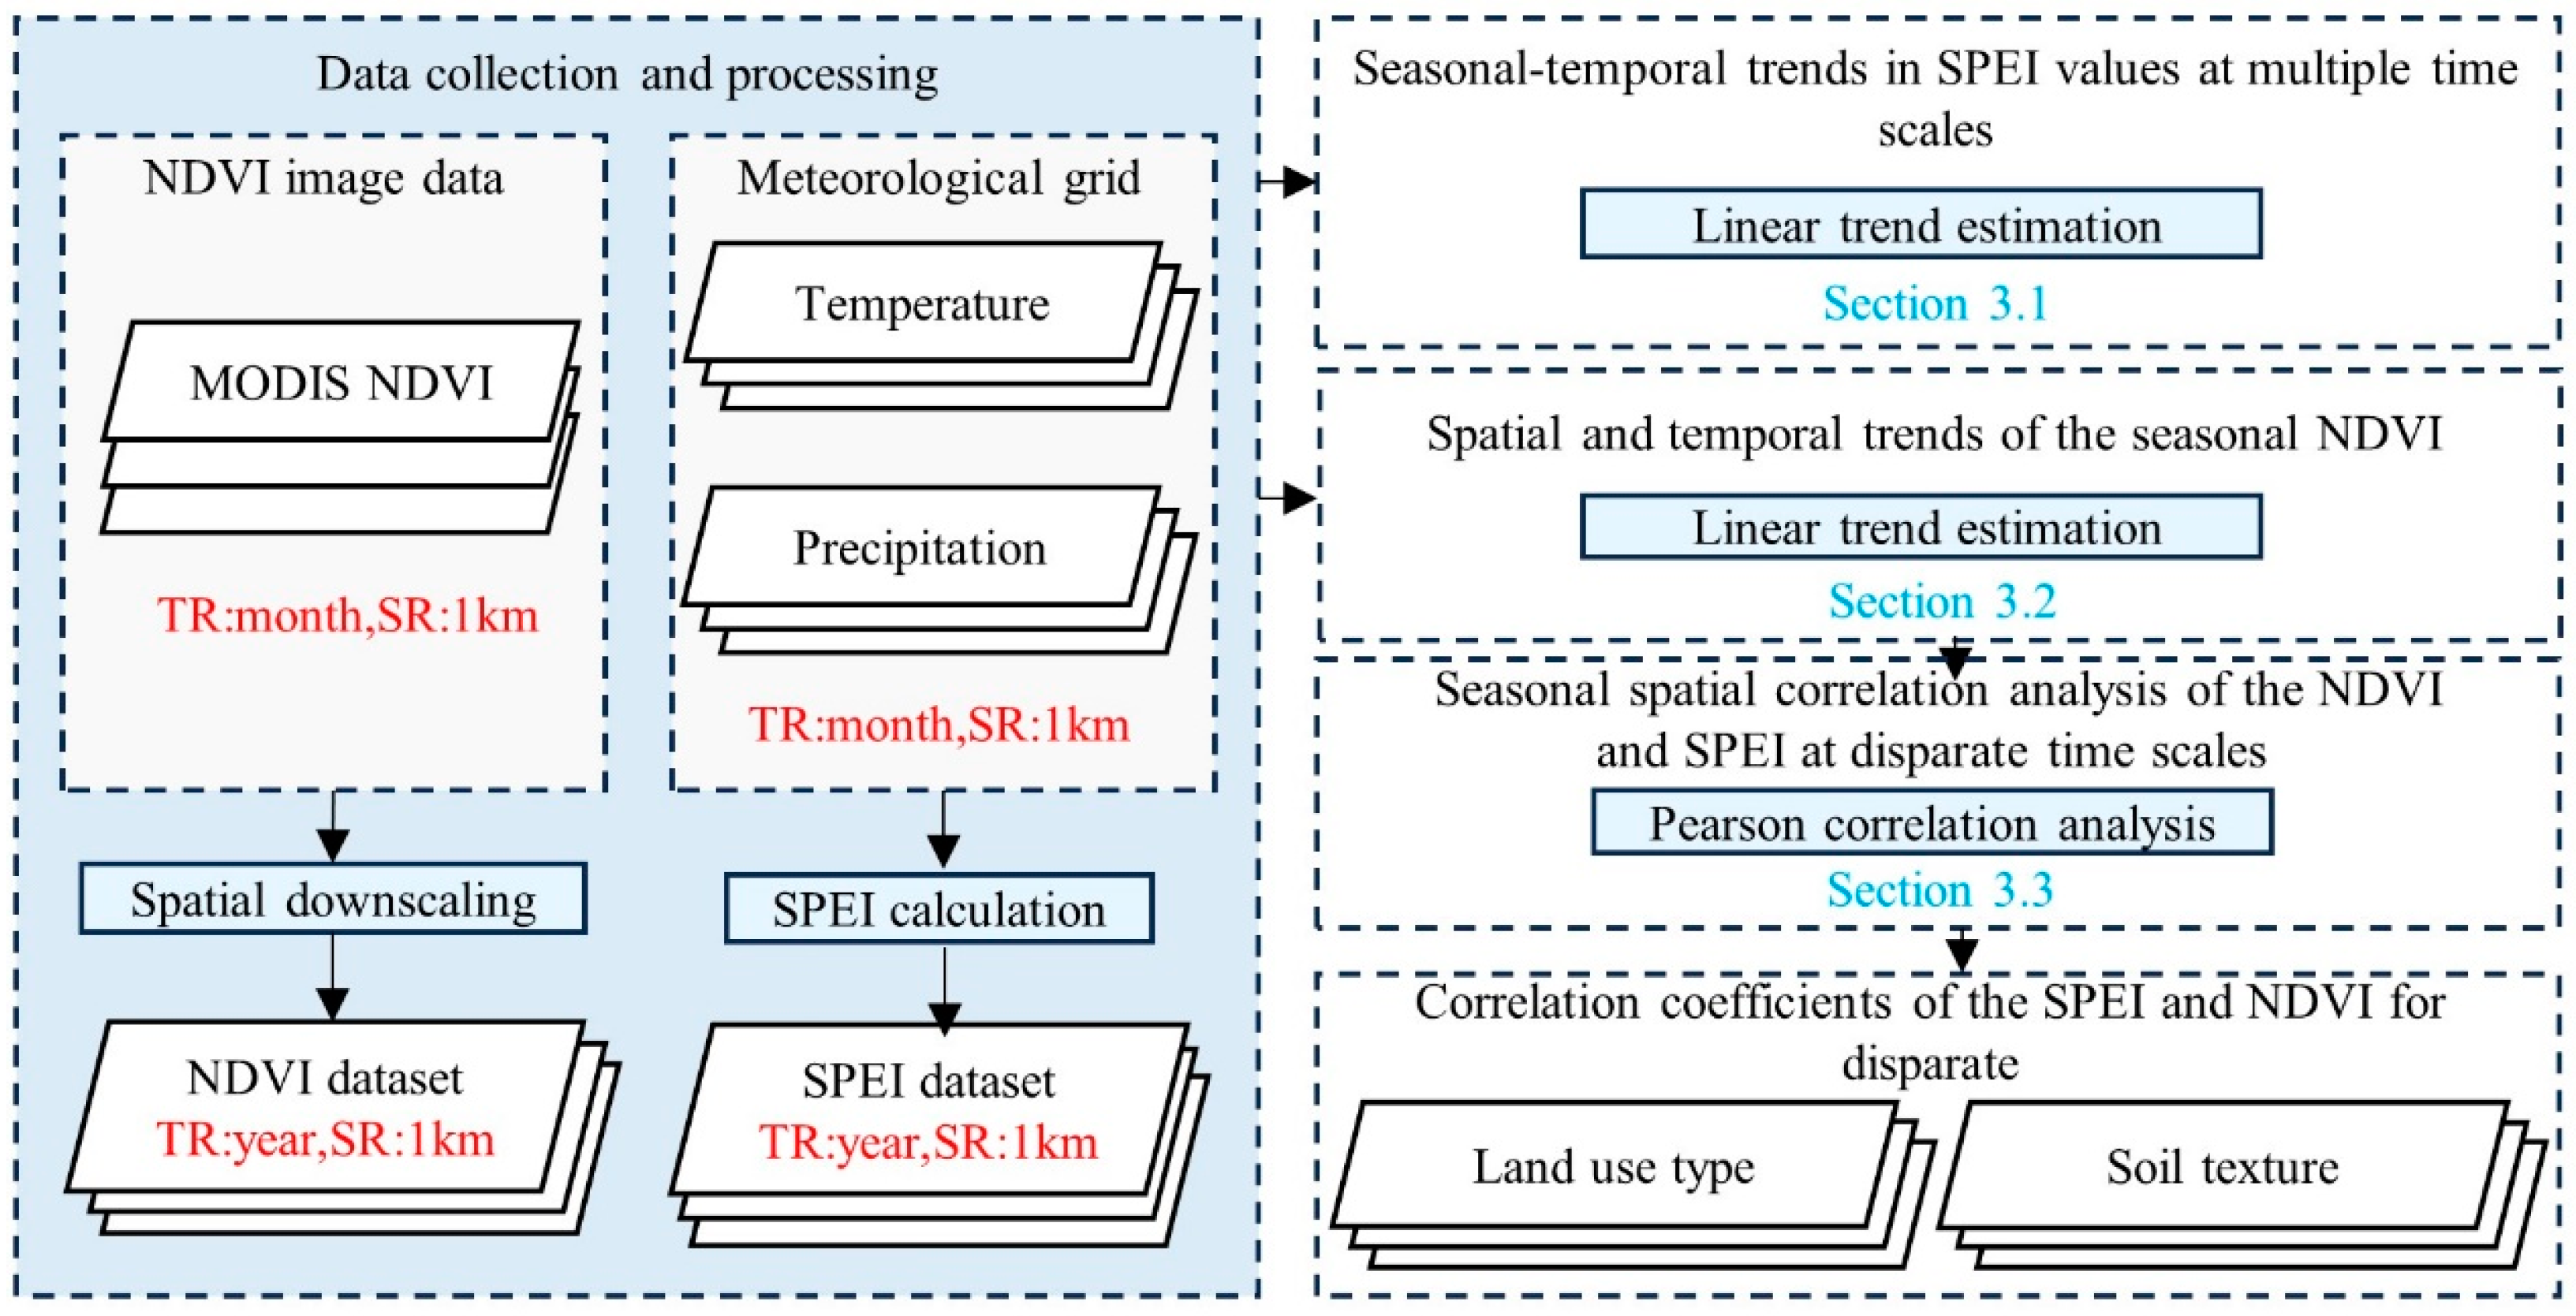
Meteorological data were derived from the periodic-based precipitation and periodic-based average temperature data of Yinshanbeilu and the surrounding standard meteorological stations between 2001 and 2020, provided by the China Meteorological Data Sharing Network (http://cdc.cma.gov.cn, accessed on 1 February 2024). In addition, the meteorological data were interpolated to obtain the spatialized raster meteorological data, and during the processing, the projection, resolution, and temporal scale of the raster meteorological data were ensured to be consistent with those of the NDVI data.

2.3. Methods

The technical route of this research is shown in Figure 2.

2.3.1. SPEI

The SPEI is the drought index normalized with the cumulative probability of the difference between the precipitation and the feasible evapotranspiration series. The SPI based only on precipitation data was improved by introducing the effect of temperature on potential evapotranspiration. Based upon the average periodic-based temperature and precipitation grid figures between 2001 and 2020, the SPEI was calculated pixel by pixel in this study, and the SPEI data for spring, summer, autumn, and winter were obtained. The specific calculation formulas can be found in reference [42]. The calculation formula is as follows:
The first step is to calculate the potential evapotranspiration (E):
E = 16.0 × 10 T i H A
where Ti is the monthly average temperature.
H = i = 1 12 H i = i = 1 12 T i 5 1.514
where H is the annual caloric index.
The second step is to calculate the difference between monthly precipitation and evapotranspiration:
D i = P i E i
where Pi is the precipitation and Ei is evapotranspiration.
In the third step, since there may be negative values in the original data series, the Di data series is normalized with the Log-logistic probability distribution of 3 parameters (α, β, γ), and the SPEI index corresponding to each value is calculated:
F x = 1 + α x γ β 1
where F(x) is the function; α, β, and γ are scale parameters, shape parameters and position parameters, respectively; and x is Di.
Finally, the cumulative probability density is standardized:
P = 1 F x
where P is the probability distribution function. When the cumulative probability P ≤ 0.5:
ω = 2 ln P
S P E I = ω 2.515517 + 0.802853 ω + 0.010328 ω 2 1 + 1.432788 ω + 0.189269 ω 2 + 0.001308 ω 3
The calculation includes SPEI data of different time scales from 1 to 12 months, representing dry and wet changes at different time scales. For example, SPEI1 reflects the dry and wet conditions of the current month, while SPEI12 is calculated based on the input factors of the current month and the previous 11 months, representing the comprehensive situation of the 12 months. The drought classification is shown in Table 1.

2.3.2. Linear Trend Estimation

Trends in both the NDVI and SPEI at multiple time scales between 2001 and 2020 were analyzed via trend analysis with the aim of determining the features of the variation trends [43] according to the formula below:
θ Slope = n × i = 1 n i × X i i = 1 n i × i = 1 n X i n i = 1 n i 2 i = 1 n i 2
where Slope refers to the slope of the trend line, n refers to the cumulative quantity of years of the research time series, and Xi refers to the value of the ith year.

2.3.3. Correlation Analysis

To study the influence of climate factors upon drought, the correlation coefficient between the NDVI and SPEI at multiple time scales was calculated image by image [44] with the following equation:
R = i = 0 n x i x ¯ y y ¯ i = 0 n x i x ¯ 2 i = 0 n y y ¯ 2
where xi refers to the NDVI within season, i refers to the average value of the NDVI in the calendar year, yi denotes the yearly mean value of the multiscale SPEI within season i, and y ¯ refers to the mean value of the multiscale SPEI during the calendar year.

3. Results

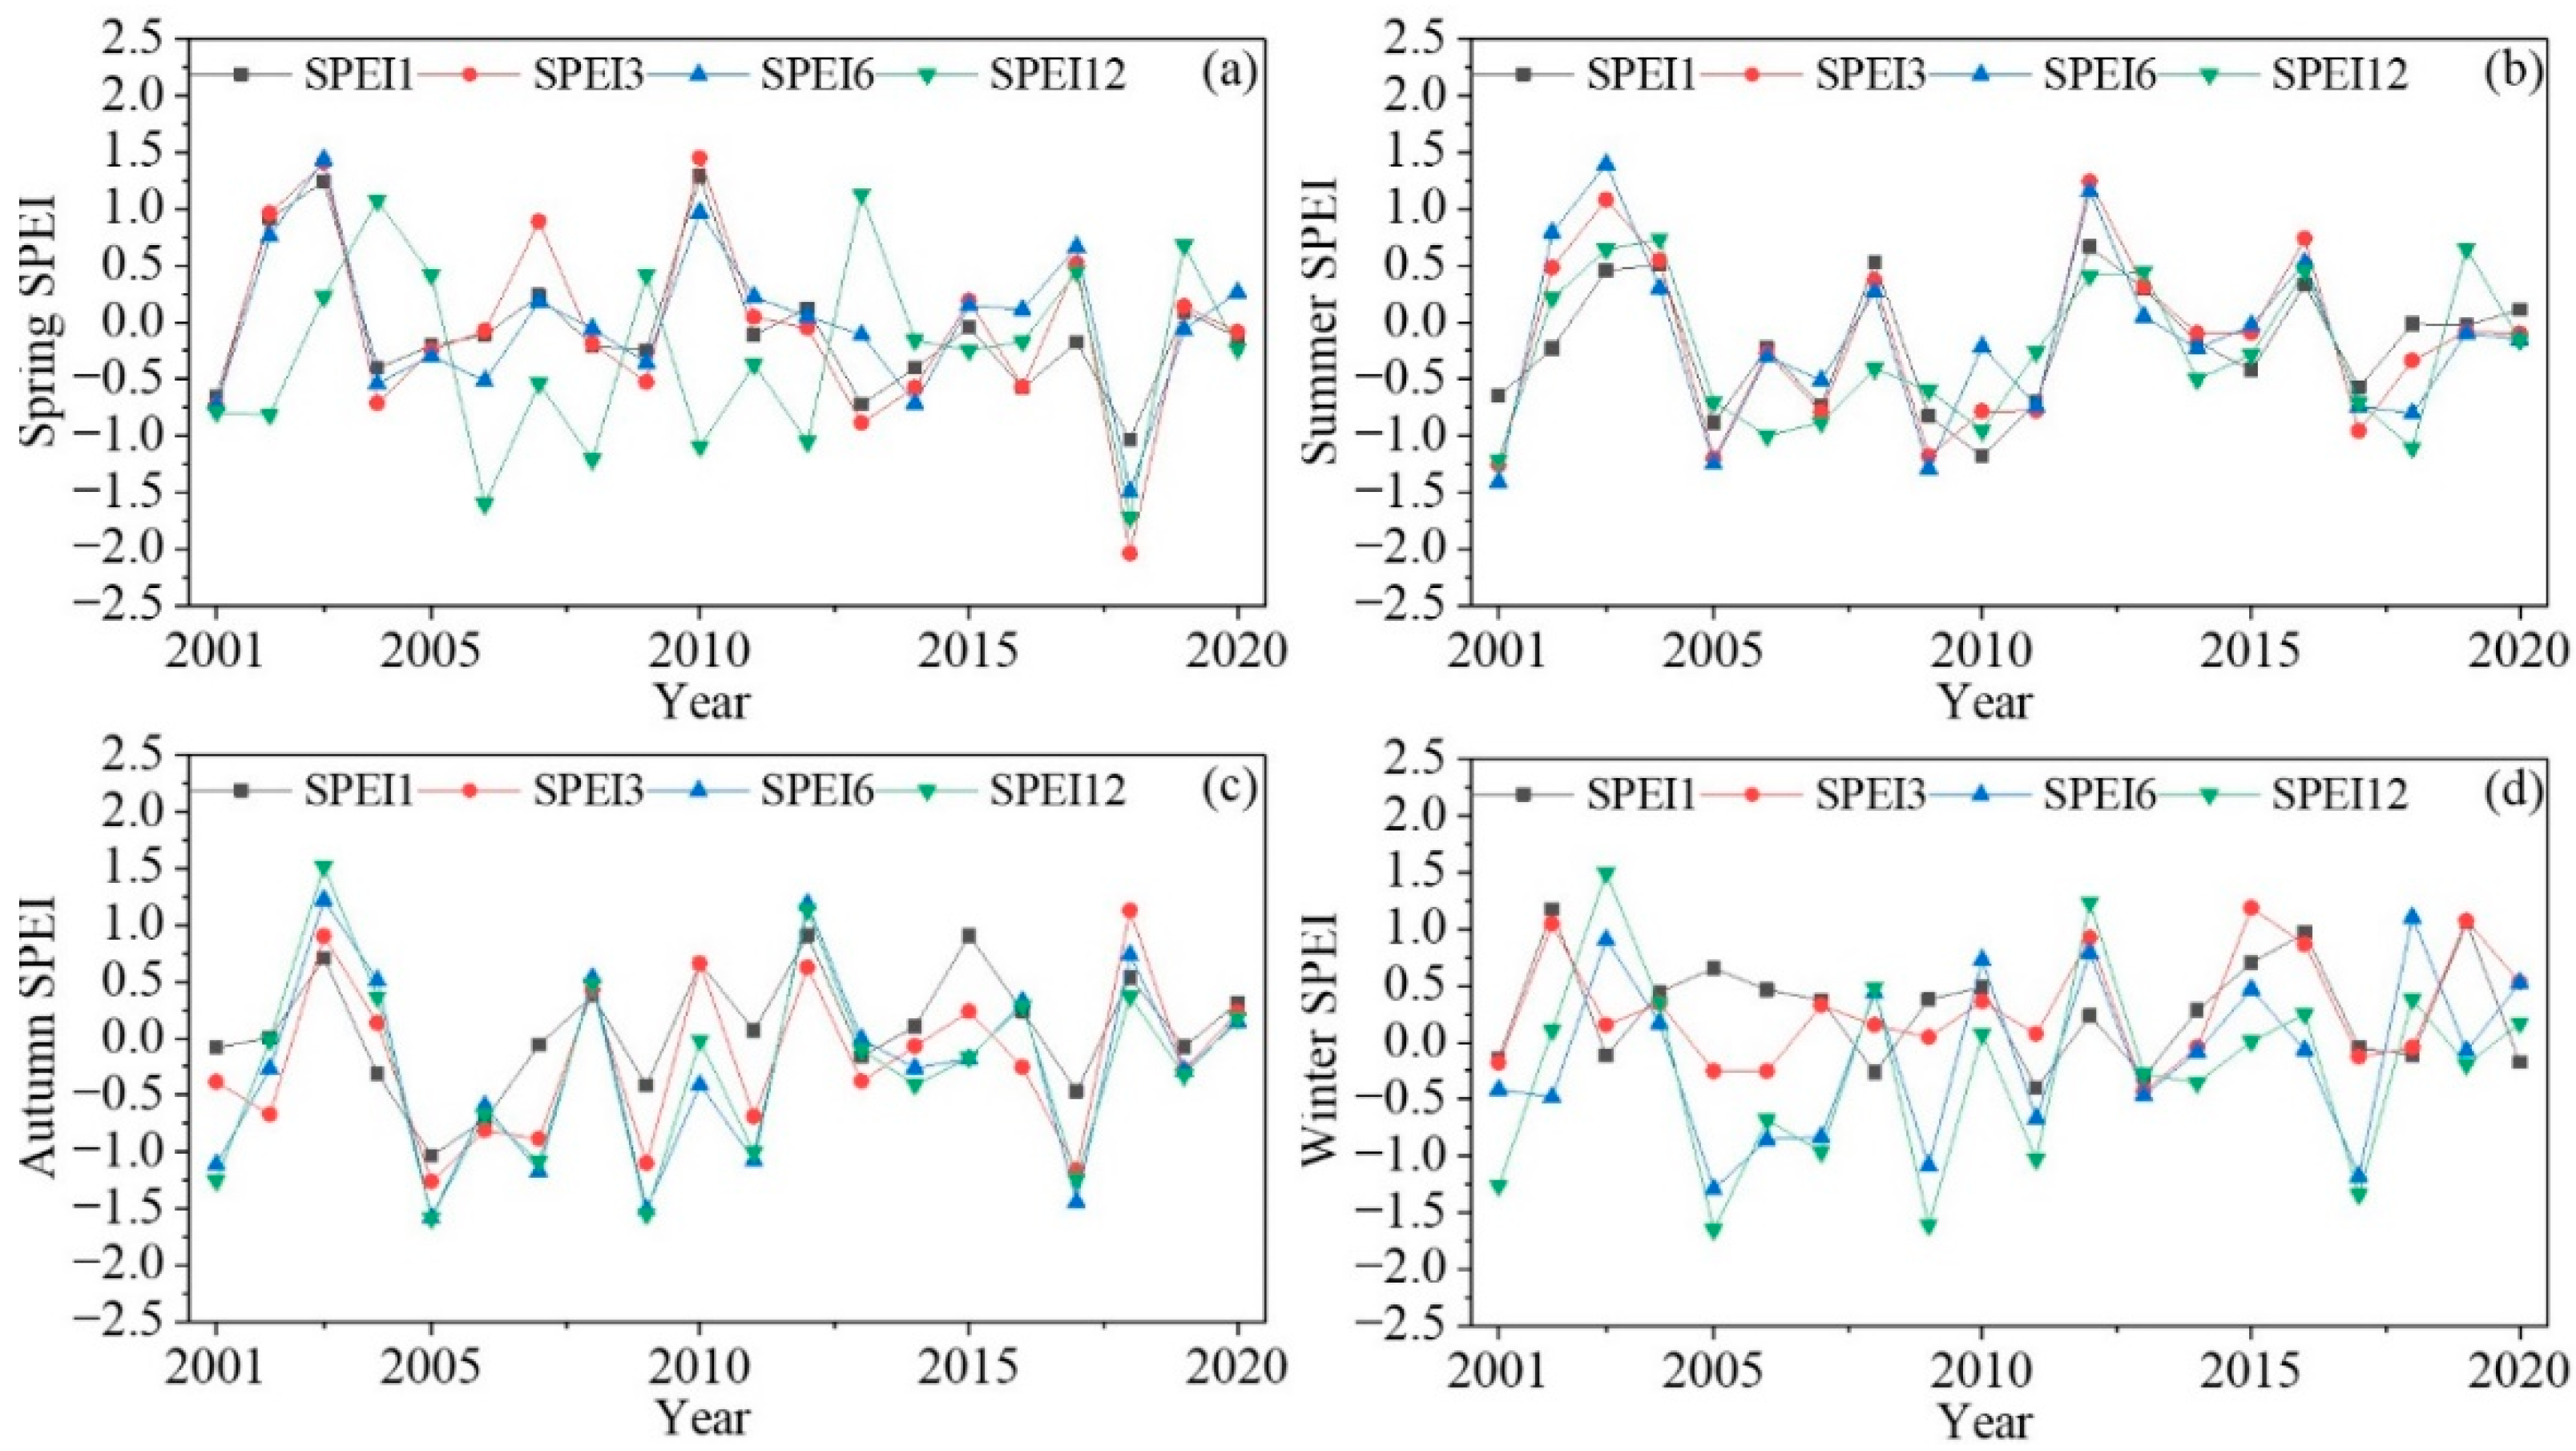
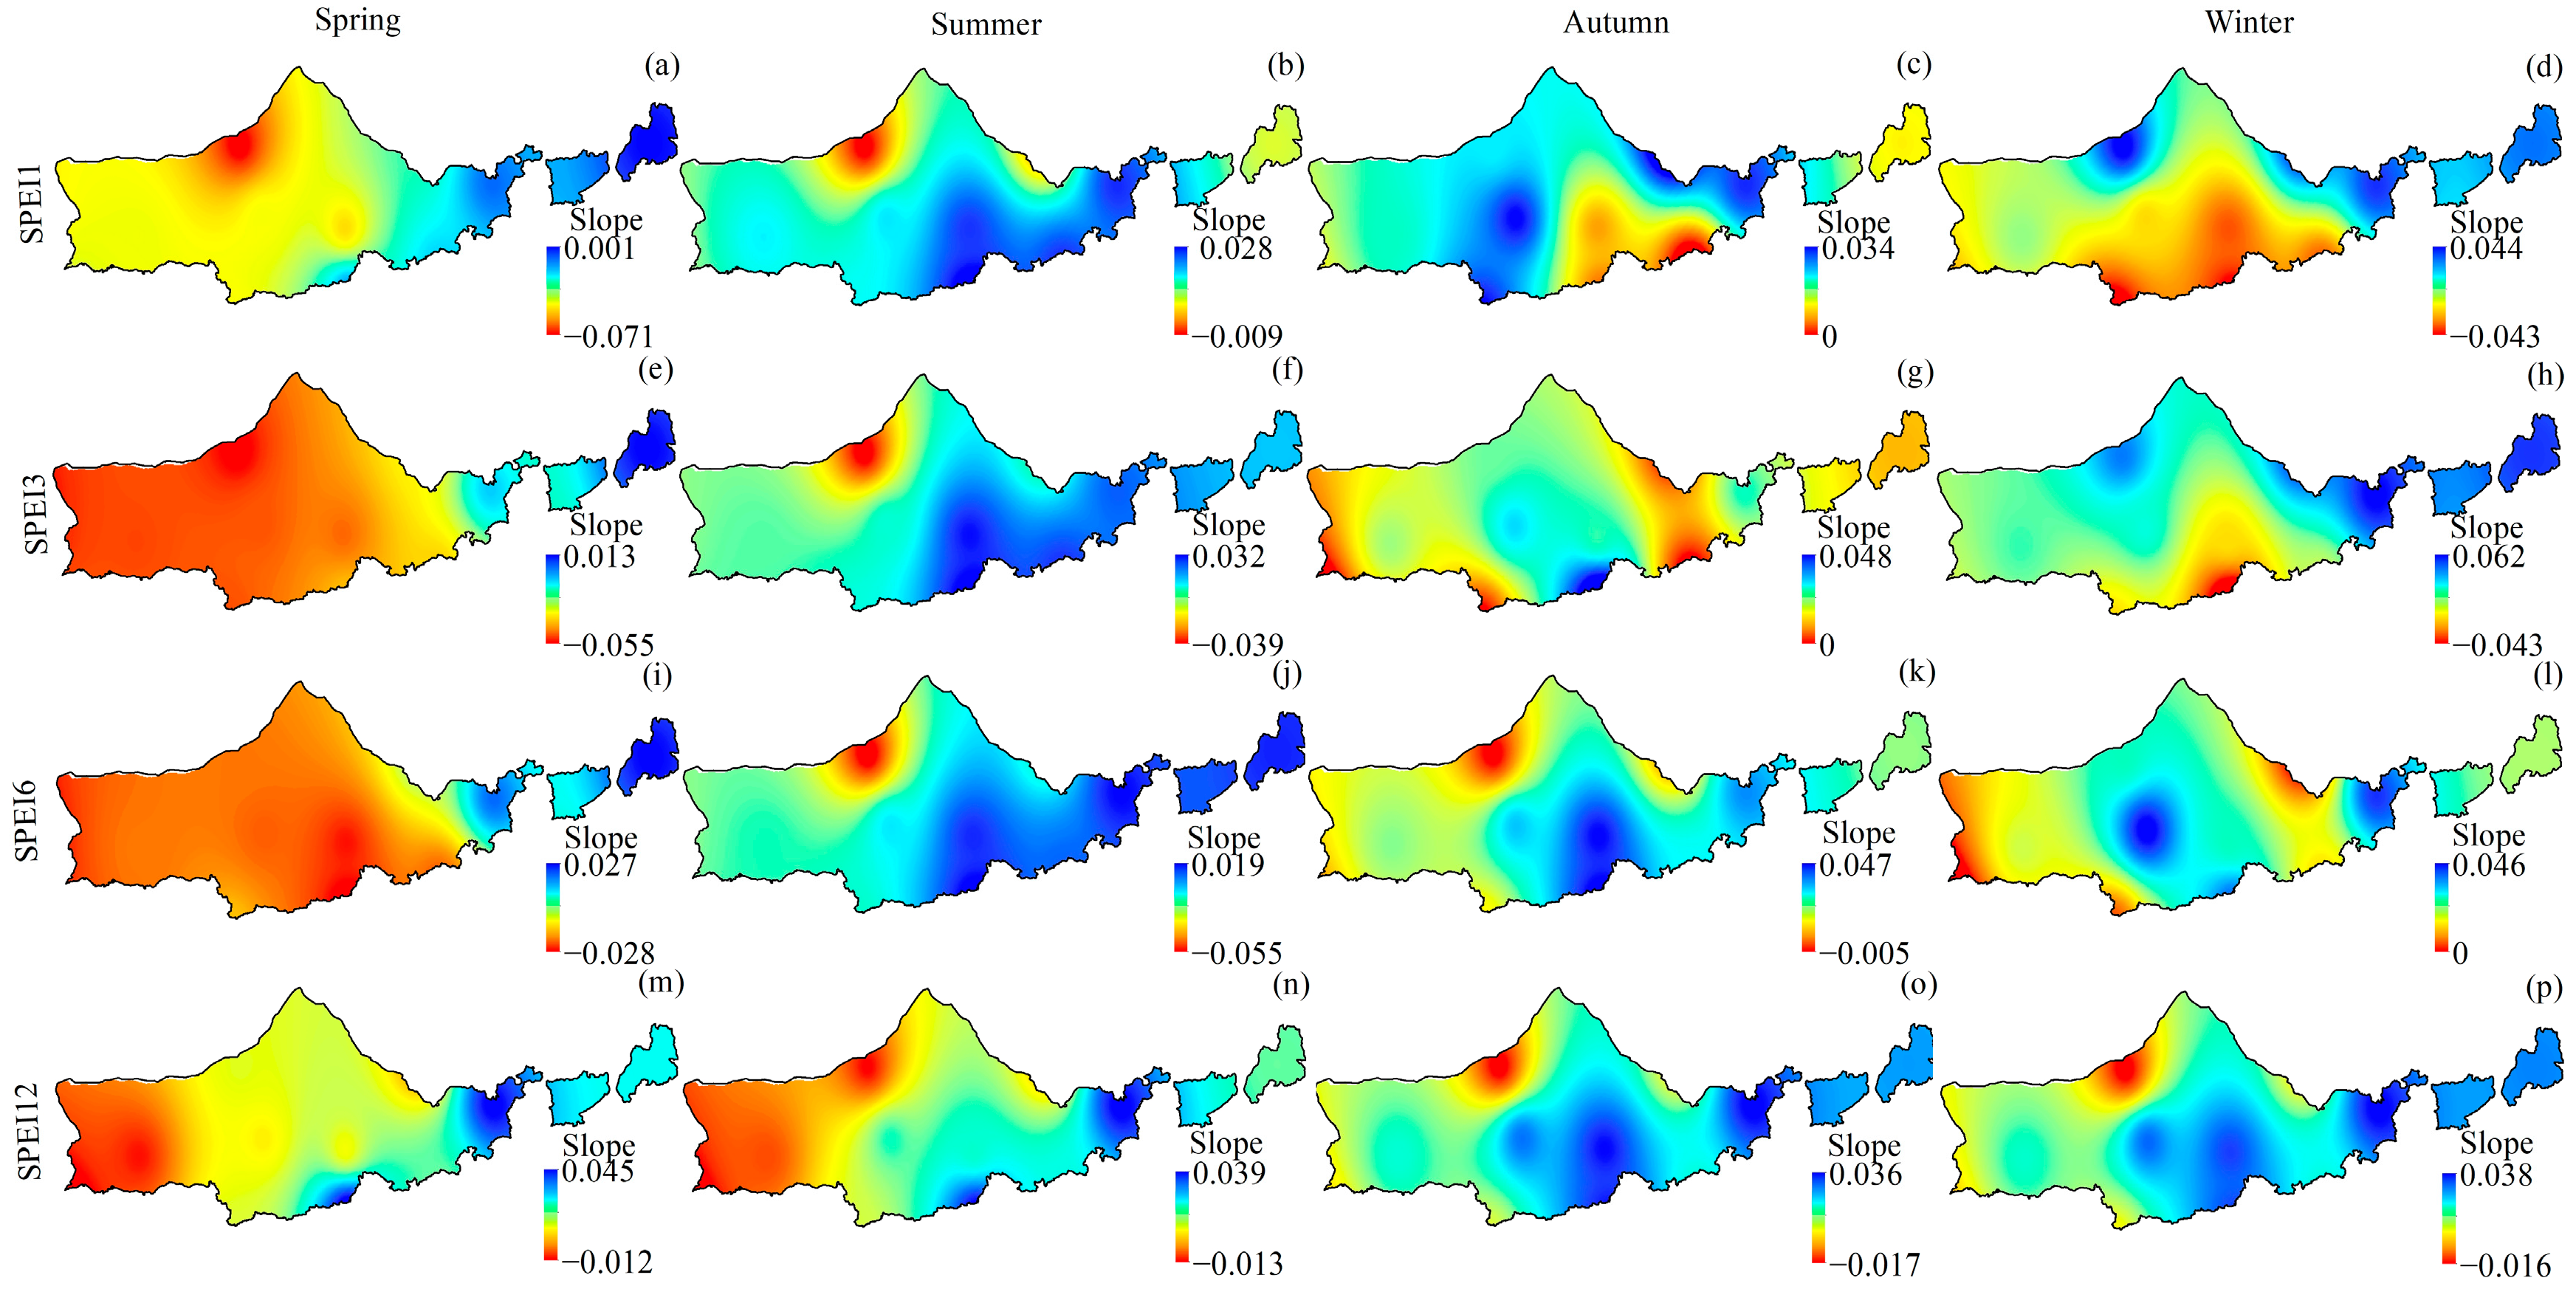
3.1. Seasonal-Temporal Trends in SPEI Values at Multiple Time Scales

The variation characteristics of the SPEI in the different seasons differed; in spring, the linear trend rates of SPEI1, SPEI3, SPEI6, and SPEI12 showed a decreasing trend (Figure 3), and the drought trend of SPEI3 was relatively evident, at −0.393/10a. The linear trends of SPEI1, SPEI3, and SPEI12 showed increasing trends in summer, in which SPEI1 showed a relatively evident wetting trend (0.122/10a), while SPEI6 showed a drying trend (−0.061/10a). However, from the perspective of the annual mean change, the volatility trend was greater than the annual mean. In autumn, the linear trends of SPEI1, SPEI3, SPEI6, and SPEI12 exhibited increasing tendencies; here, the wetting tendency of SPEI1 was relatively evident (0.241/10a), the increasing trend was slightly greater than that in summer, and the volatility was slightly lower all summer. In winter, the linear trend rates of SPEI1, SPEI3, SPEI6, and SPEI12 showed a decreasing trend, and the drought trend of SPEI3 was relatively evident (−0.421/10a) and was greater than that in spring.
According to Figure 4, the spatial differences in the seasonal SPEI trends in Yinshanbeilu were significant. In spring, SPEI1, SPEI3, SPEI6, and SPEI12 exhibited decreasing trends in most areas (64.25%, 92.35%, 93.21%, and 56.35%, respectively); here, the areas with significant decreasing trends (p < 0.05) accounted for only 1.37%, 24.35%, 25.63%, and 3.48%, respectively, and these areas were concentrated in the western and central parts of Yinshanbeilu, showing significant aridification trends in the spring. Yinshanbeilu’s western and central regions exhibited significant trends of spring aridification (Figure 4a). In summer, SPEI1, SPEI3, SPEI6, and SPEI12 had greater percentages of regions with upward trends than those with downward trends, with the upward trends dominating in most of the eastern part of the region and downward trends dominating in parts of the western region; however, most regions had insignificant tendencies (Figure 4b). In autumn, the change trend in the SPEI1 was relatively evident, and the areas with an increasing trend in the SPEI1 continued to spread to the west and east compared to those in summer, accounting for 72.47% of the total area. Among these areas, those with a highly prominent upward tendency (p < 0.01) and a prominent upward tendency (p < 0.05) accounted for 25.37% and 18.01%, respectively, of the area and were centrally located in the eastern and central regions, respectively, with most of the regions being usable land distribution areas. The mass of the region was usable arable land, and the decreasing trend in the SPEI1 shifted from the northwest to the southeast in comparison to that of summer and accounted for only 27.53% of the area (Figure 4c). In winter, the drought trend increased compared with that in autumn, and the change in drought trend in SPEI3 was relatively evident. The area with an upward trend (33.86%) was slightly lower than that with a downward trend (66.14%), and the change trend in most areas was not significant. Among them, the SPEI showed a significant downward trend in only 11.28% of the regions and was concentrated in parts of the southern region (Figure 4d). In general, the SPEI in spring and winter showed drying trends, but the SPEI in summer and autumn showed wetting tendencies, indicating that dry and wet conditions in summer and autumn strongly impacted the yearly climate in northern Inner Mongolia.

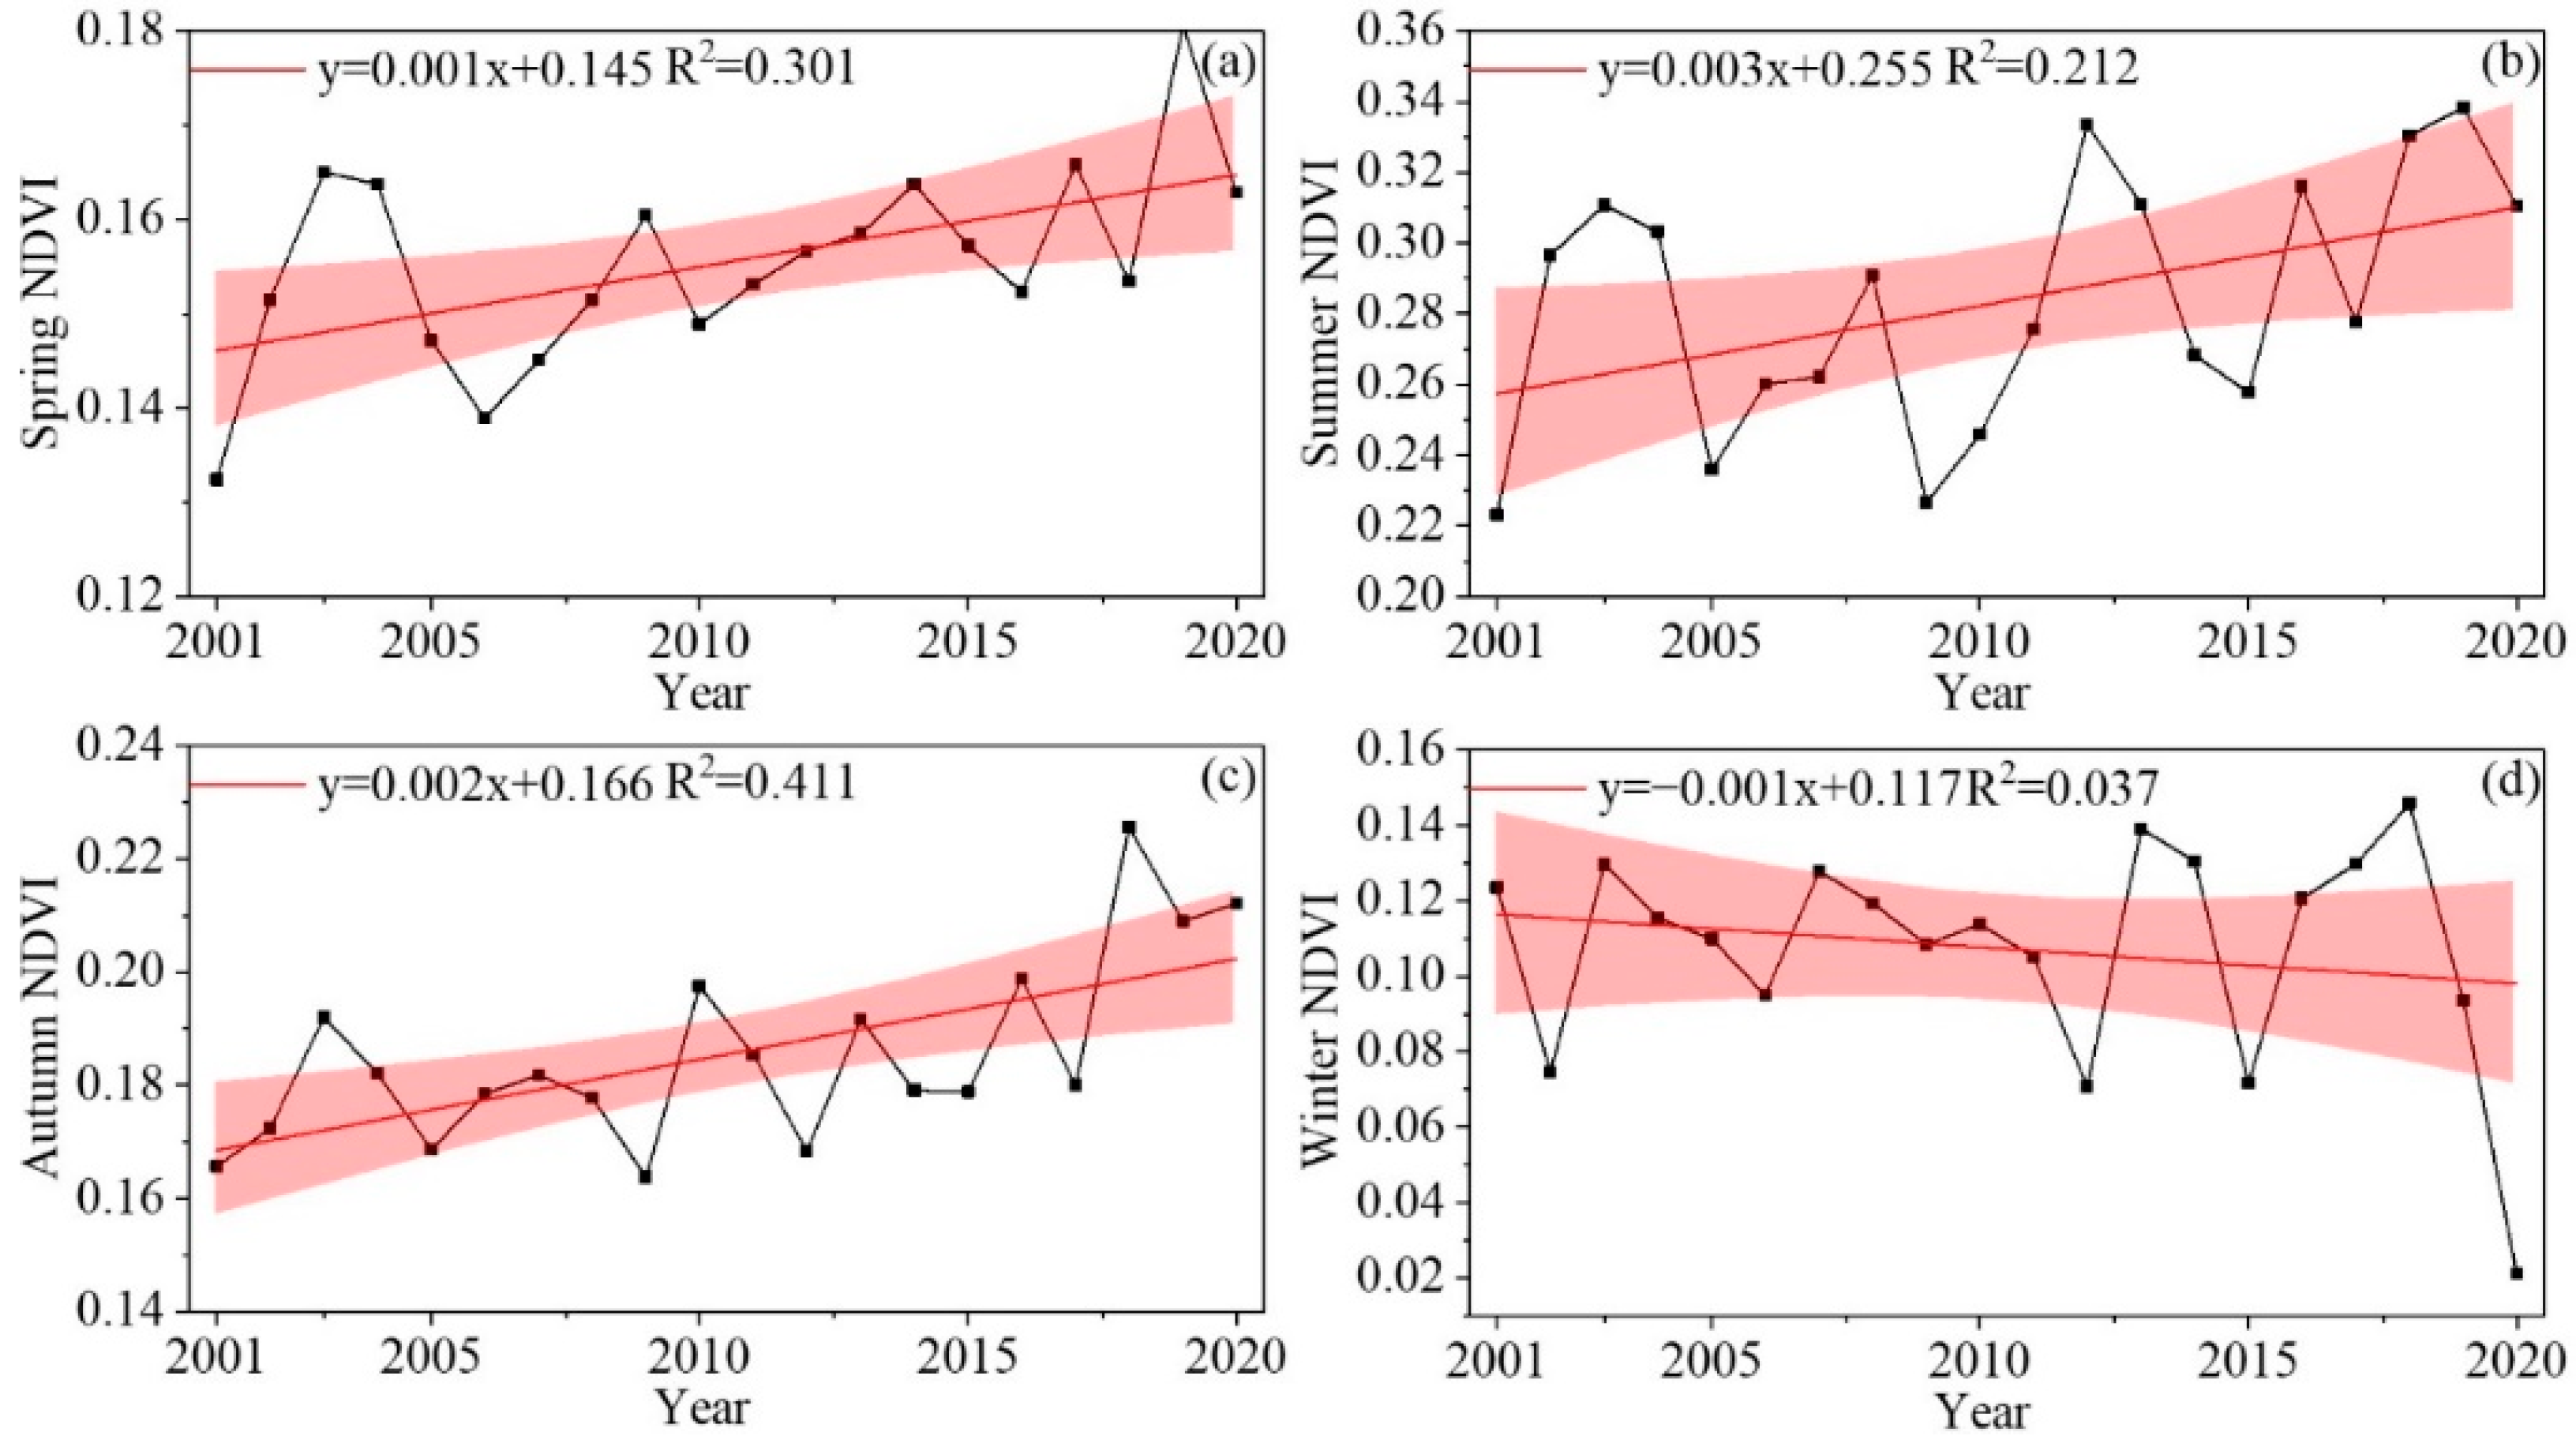
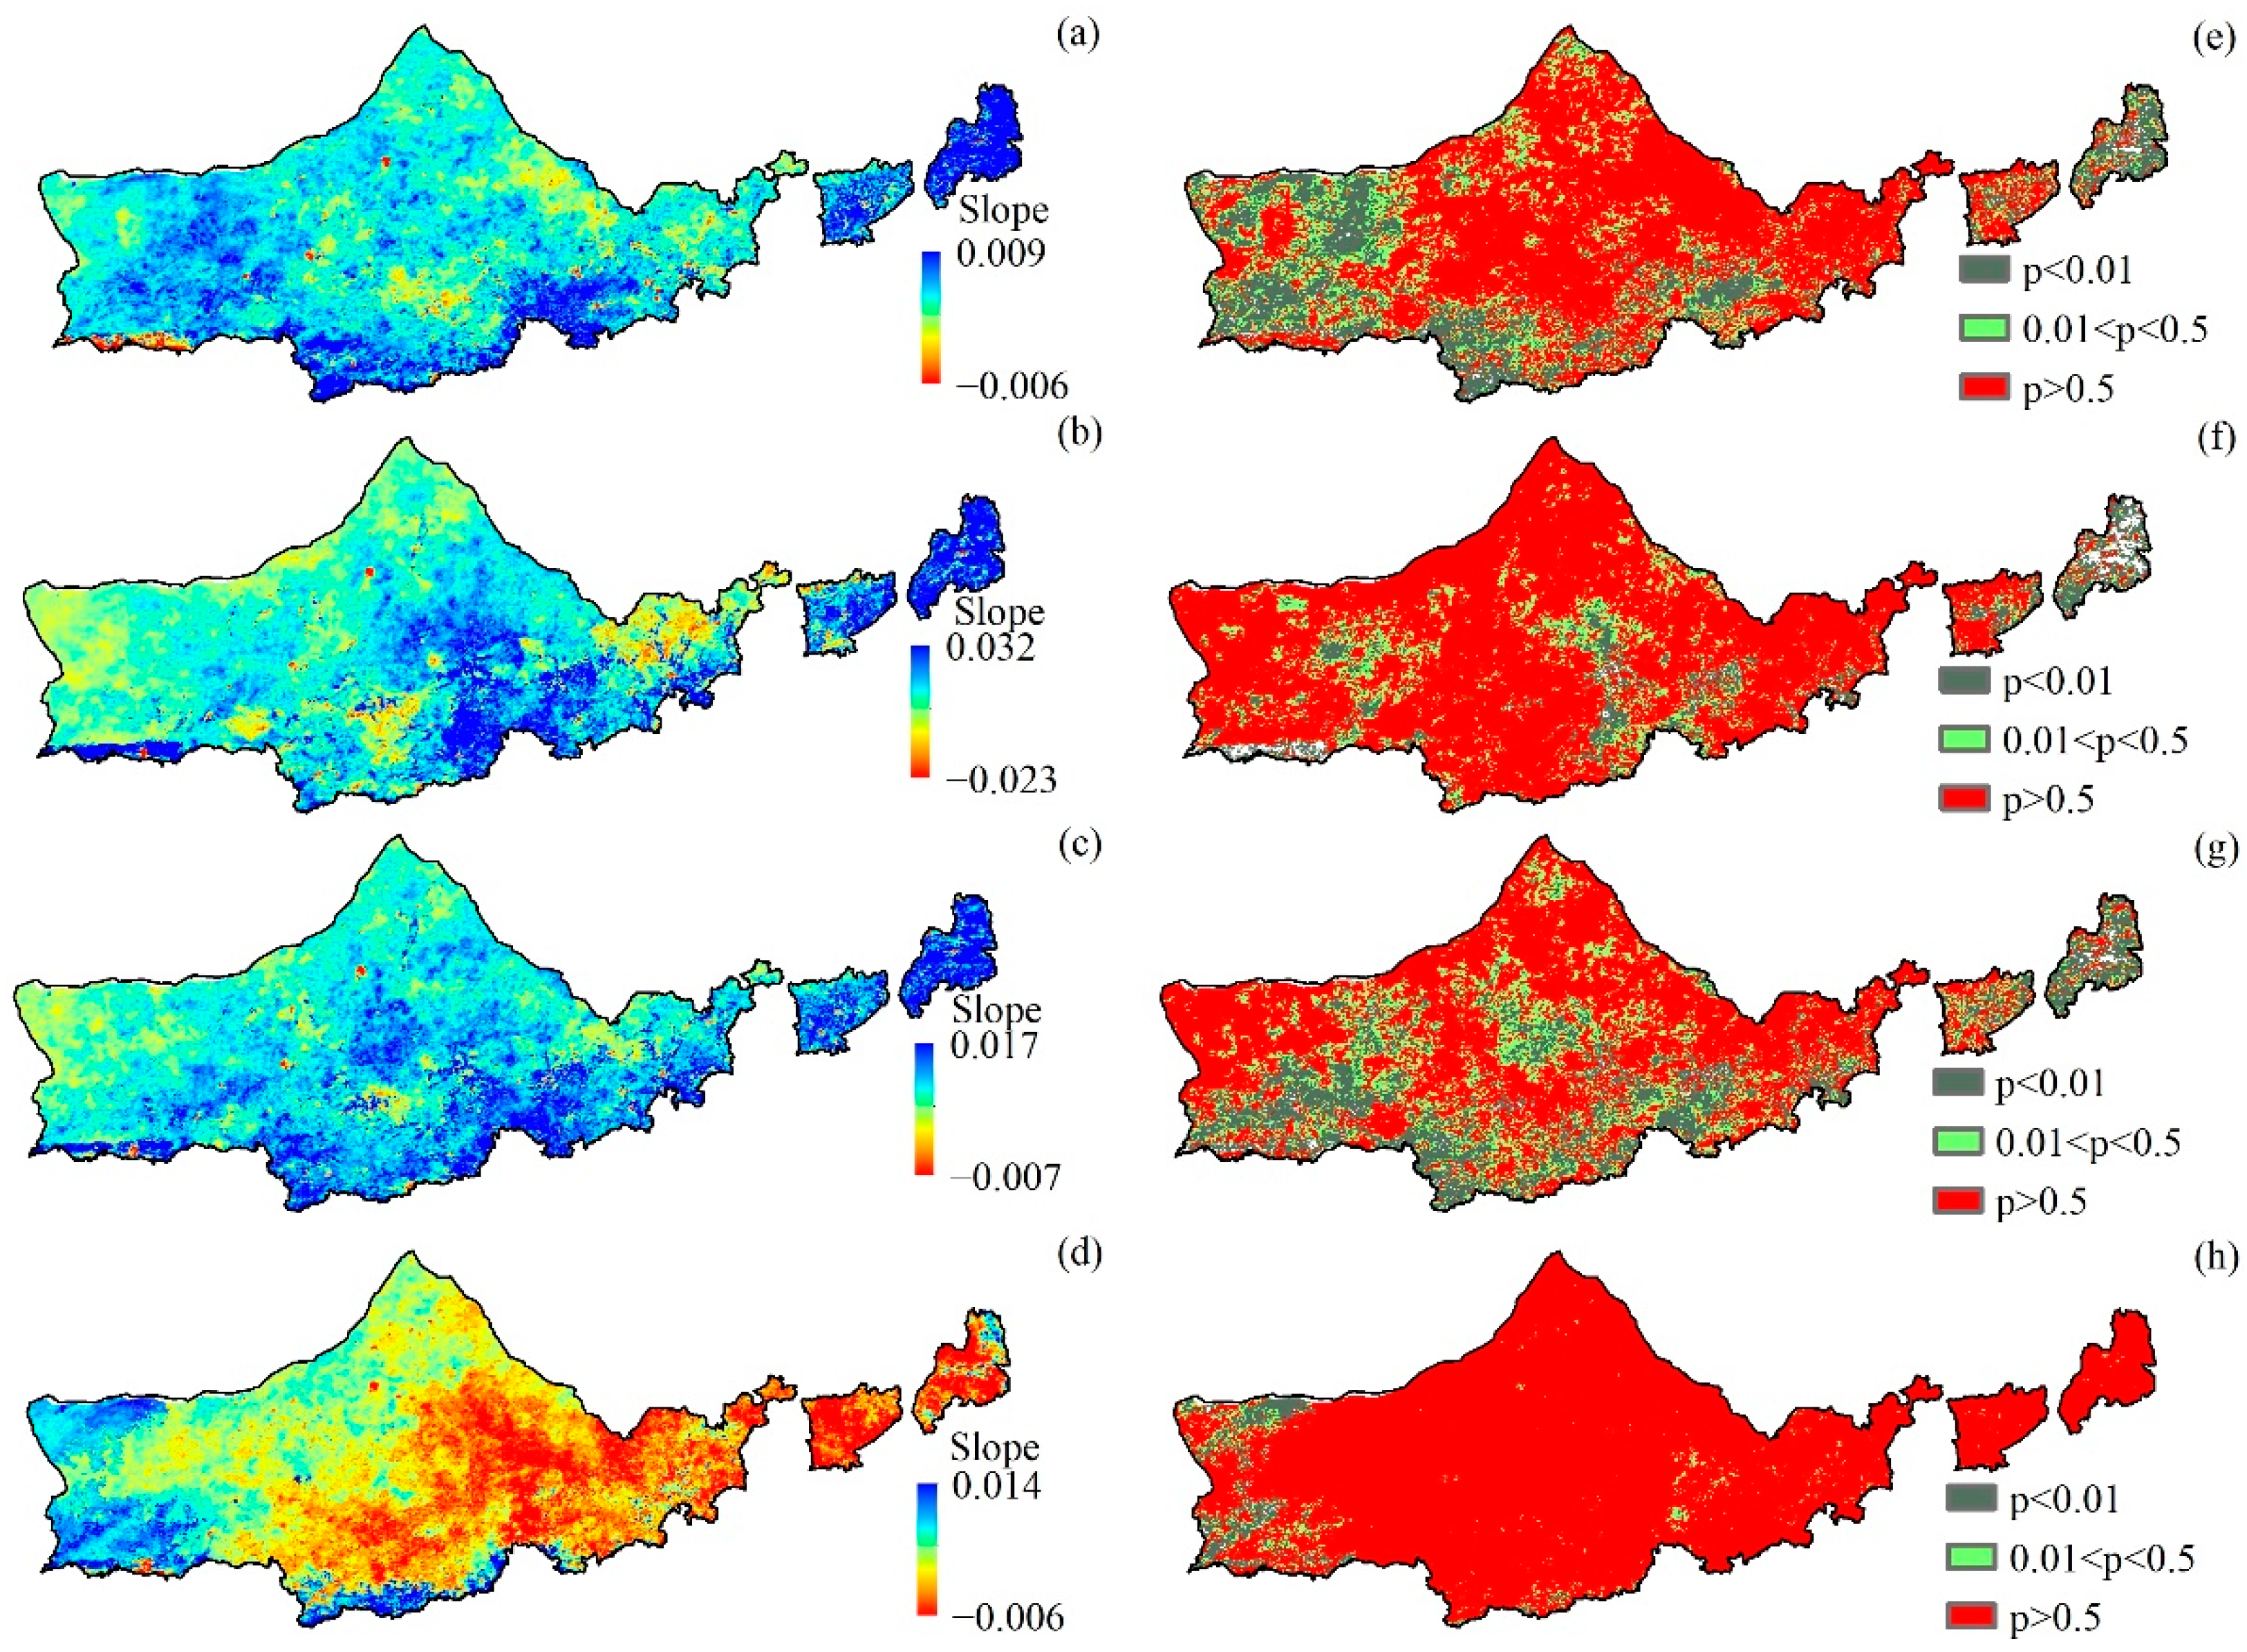
3.2. Spatial and Temporal Trends of the Seasonal NDVI

The interannual variation characteristics of the NDVI throughout the year at Yinshanbeilu are depicted in Figure 5. Linear regression analysis revealed that the NDVI over the entire year except in winter exhibited a significant increasing trend (p < 0.05), with growth rates of 0.001, 0.003, and 0.002 a−1, whereas the NDVI in winter exhibited decreasing trend, with a decreasing rate of −0.001 a−1. Overall, the increase rates in the later parts of the spring, summer, and autumn were much greater than those in the earlier part of the year, and the change in the increase rate in the summer was especially evident. Rates of increase in late spring, summer, and autumn were much greater than those in the early part of the season, especially in summer, during which the variation in the rate of increase was the most evident.
The NDVI showed an overall trend of increasing in the north and south with a decrease in the middle of the spring (Figure 6). The increasing and decreasing NDVI areas accounted for 76.34% and 23.66%, respectively, of the overall regions of the study region, and 17.38% and 6.35%, respectively, passed the significance test. According to the spatial distribution, the regions where the NDVI exhibited a prominent and extremely significant increasing trend were chiefly distributed in the southwest and central north regions of the plateau. The areas where the NDVI exhibited prominent and exceedingly prominent decreasing trends were mainly distributed in the northeast and northwest regions of Yinshanbeilu. In summer and fall, the NDVI tended to increase in the southern region and decrease in the central region of the study area. The areas with increasing and decreasing NDVIs in summer accounted for 83.17% and 16.83%, respectively, of the total study area, and 11.46% and 7.81%, respectively, passed the significance test. The regions in which the NDVI increased and decreased in autumn accounted for 78.69% and 21.31%, respectively, of the overall regions in the study, and 9.88% and 5.66%, respectively, passed the significance test. According to the spatial distribution, the areas where the NDVI exhibited prominent and extremely prominent increasing trends were largely distributed in the southeastern and central regions of Yinshanbeilu. The areas where the NDVI showed a significant or extremely significant decreasing trend were largely distributed in the central and northern parts of Yinshanbeilu. In winter, the NDVI exhibited an overall decreasing trend; here, the area with an increasing trend and a decreasing trend accounted for 5.61% and 94.39%, respectively, of the overall region in the study, and only 4.73% passed the significance test; these areas were distributed in the western area of Yinshanbeilu. In autumn and winter, vegetation began to fade and yellow, and the influence of water on it weakened, resulting in a gradual decrease in the significant area of SPEI and NDVI in autumn and winter.

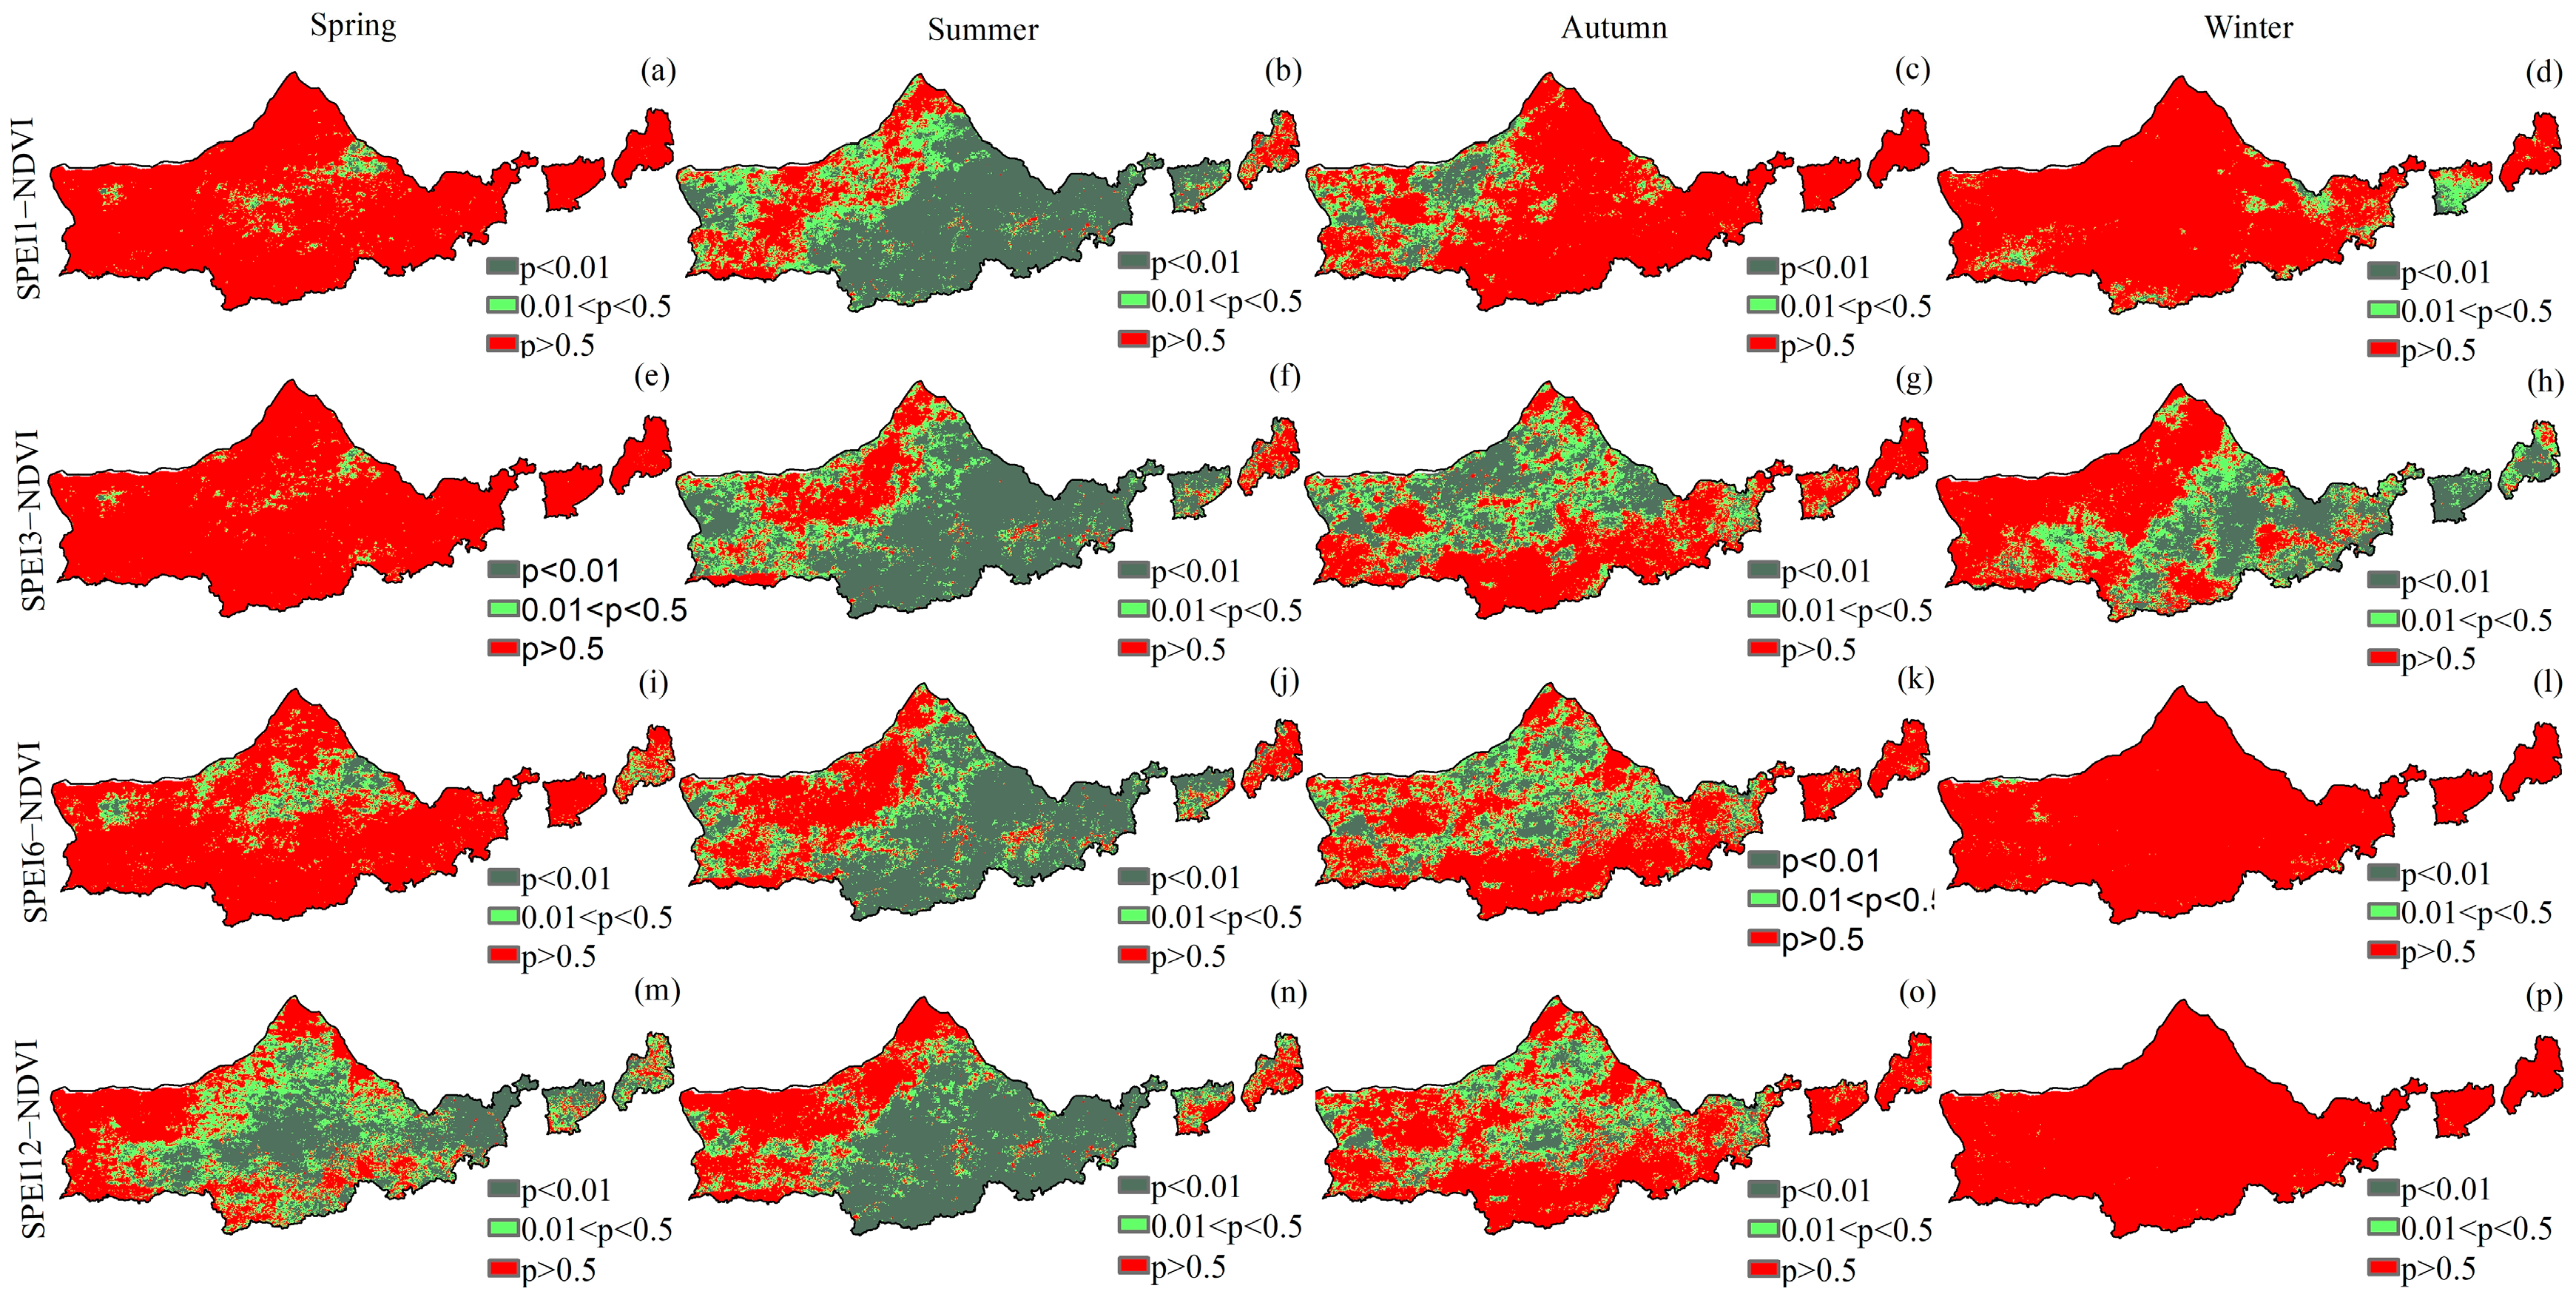
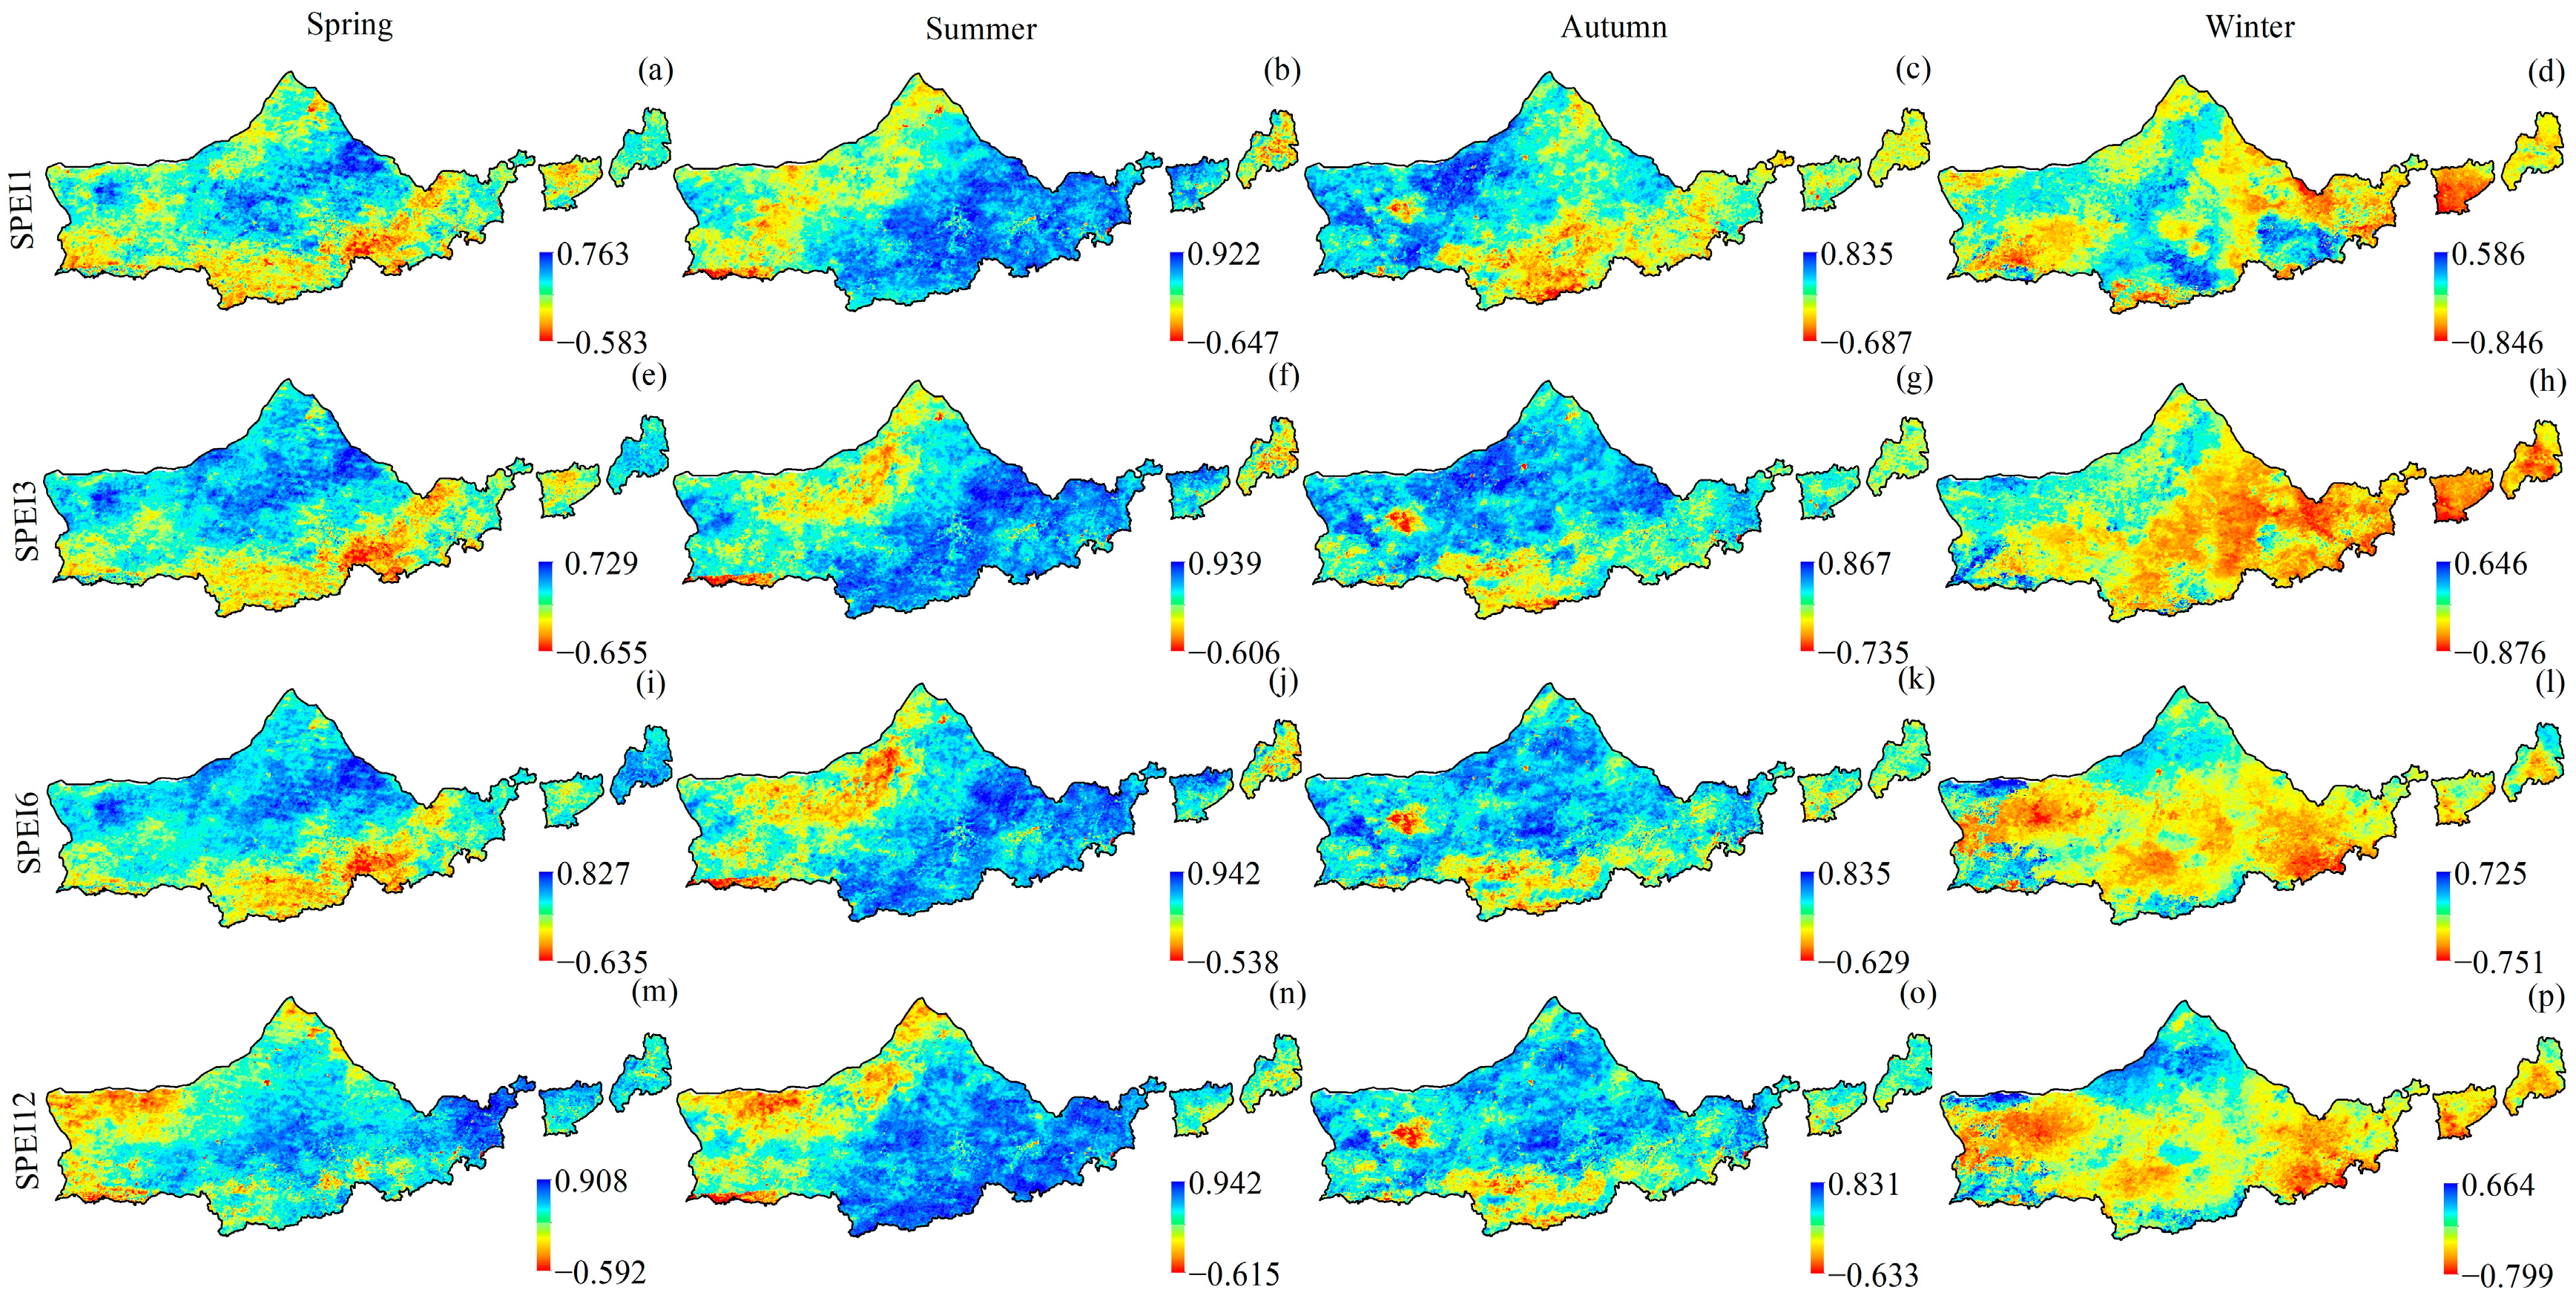
3.3. Seasonal Spatial Correlation Analysis of the NDVI and SPEI at Disparate Time Scales

The relationships between the NDVI and SPEI at the seasonal scale were determined per grid for the different time scales. Figure 7 and Figure 8 show the prominent spatial differences in the correlations for 1, 3, 6, and 12 months for the entire year. During each season, the spatial distribution characteristics of the coefficients between vegetation NDVI and SPEI at disparate time scales were significantly different (Figure 7). In addition to autumn, the correlation coefficients between NDVI and SPEI in summer, spring, and winter increased with increasing SPEI time scale, and the elevated values were concentrated in the southeastern and western regions of the study region. The best correlation time scales were SPEI6 and SPEI12, indicating that long-term drought in the study area could play a key role in vegetation growth. Specifically, the coefficient between the spring vegetation NDVI and SPEI maintained one low value on a short time scale and occupied most of the study area. The coefficients between the spring vegetation NDVI and SPEI12 varied between −0.592 and 0.908, and 83.45% of the regions were positively correlated; here, 28.45% and 42.16% of the regions were significantly positively correlated and mainly distributed in the central and eastern regions, respectively. Additionally, 16.55% were negatively correlated. This region was mainly distributed in parts of western China, and the areas with extremely significant and significant negative correlations were less than 9.36%. The coefficient in summer exceeded that in spring at the same time scale. The coefficients between the summer vegetation NDVI and SPEI12 varied between −0.615 and 0.942, and 87.32% of the regions were positively correlated; here, 43.21% and 24.58% of the regions were significantly positively correlated, mainly distributed in the central and eastern regions, respectively. Additionally, 12.68% were negatively correlated. This region was mainly distributed in parts of western China, and less than 10.35% of the regions exhibited very significant and significant negative correlations. The correlation coefficients of the autumn vegetation NDVI and SPEI were lower than those of summer compared with those of the other seasons at the same time scale. The correlation coefficients of the autumn vegetation NDVI and SPEI3 ranged from −0.735 to 0.867, and 88.59% of the areas were positively correlated; here, 12.58% and 19.87% were highly significantly and significantly positively correlated, mainly in the central and eastern regions of the study region; however, 11.41% of the correlations were negatively correlated, mainly in the western region of the study region, with less than 8.34% of the areas showing highly significant and significant negative correlations. The winter vegetation NDVI and SPEI correlations at all time scales were weak and changed minimally, indicating a negative correlation, and the mean value basically remained at approximately −0.4 (Figure 9). The coefficients between the vegetation NDVI and SPEI6 in winter varied between −0.751 and 0.725, with 24.37% of the area positively correlated and 75.62% negatively correlated, and only 2.16% of the region passed the significance experiment. During this season, high values of image elements were largely concentrated in the northern part of the study region, while low values of image elements were largely distributed in the eastern part.
The correlation of the disparate time scales showed complicated features on the seasonal scale of disparate land cover categories. In spring, the grassland sensitivities were greater at all time scales (Figure 10), indicating a positive correlation, and the correlation coefficient increased with increasing SPEI time scale. The responses of forestland, cultivated land, and grassland to SPEI12 were the highest, and the coefficients reached 0.517, 0.529, and 0.482, respectively. Forests are able to withstand droughts over long time scales because of their higher water content in deep soil. In summer, SPEI1, SPEI3, SPEI6, and SPEI12 were positively correlated with the NDVI in woodlands, cultivated lands, and grasslands. Summer was the most drought-stressed growing season. In addition, the effect of drought on various land cover types increased, especially for the SPEI12 of forestland, SPEI1 of cultivated land, and SPEI3 of grassland. The coefficients reached 0.681, 0.654, and 0.567, respectively. The drought resistance of forests and grasslands was relatively strong and mainly affected by the SPEI3-12 long scale drought. In fall, the correlation values of forestland reached 0.091, 0.275, 0.274, and 0.276; the correlation values of cultivated land were 0.133, 0.306, 0.287, and 0.294; and the correlation values of grassland were 0.313, 0.459, 0.422, and 0.406. Among them, the correlation coefficients of SPEI1, SPEI3, SPEI6, and SPEI12 for grassland were greater than those for forestland and cultivated land, and the maximum correlation occurred at the 3 month time scale (SPEI3). During winter, the relationships of forestland, cultivated land, and grassland were negative at all time scales, and the maximum correlation occurred at the 3 month time scale (SPEI3), with coefficients of −0.452, −0.516, and −0.402, respectively.
To sum up, in spring, vegetation was in the growth stage. Among the multi-scale SPEI, only SPEI3 showed a negative correlation between forest land and farmland, while only the SPEI3 of grassland showed a positive correlation. In summer, most vegetation is in a critical period of growth and development, such as grassland and crops. Due to the influence of strong rainfall, forest land, cultivated land, and grassland are less affected by drought, showing a strong correlation, and the correlation coefficient was greater than 0.5. In autumn and winter, vegetation began to wither and fall, and the influence of water on it was weakened. At this time, NDVI and SPEI showed a weak positive or negative correlation, and both showed a negative correlation in winter.
The correlation of the disparate time scales shows complicated features on the seasonal scales of disparate soil textures (Figure 11). In spring, sandy loam exhibited a high correlation at all time scales, revealing a positive correlation, and the correlation coefficient increased with increasing SPEI time scale. Loam, sandy loam, and silty loam all exhibited the highest response to SPEI12, with coefficients of 0.509, 0.474, and 0.403, respectively. During summer, the SPEI1, SPEI3, SPEI6, and SPEI12 exhibited positive correlations with the NDVI in loam, sandy loam, and silty loam, respectively. Summer was the most drought-stressed season for vegetation in the growing season, and the effects of drought on various soil texture types increased, especially for the SPEI3 of loam, SPEI1 of sandy loam, and SPEI3 of silty loam, with correlation coefficients of 0.612, 0.558, and 0.626, respectively. The drought resistance became relatively weak and was mainly affected by the SPEI1-3 short-term drought. In autumn, the correlation values of loam reached 0.212, 0.357, 0.335, and 0.332, and the correlation values of sandy loam were 0.324, 0.475, 0.437, and 0.421, respectively. The correlation coefficients of silty loam at the various time scales were 0.085, 0.188, 0.197, and 0.208. Among them, the SPEI1, SPEI3, SPEI6, and SPEI12 of sandy loam were greater than those of loam and silty loam, and the maximum correlation occurred within a 3 month time scale (SPEI3). In winter, loam, sandy loam, and silty loam exhibited negative correlations at all time scales, and the largest correlation occurred at the 3 month time scale (SPEI3), with correlation coefficients of −0.478, −0.375, and −0.433, respectively.

4. Discussion

Over the past 20 years, based on the SPEI at the disparate time scales within Yinshanbeilu, drought trends have been decreasing since the 21st century, which is consistent with the actual situation [45]. Most of Yinshanbeilu has arid and subarid areas; however, due to global warming, relevant studies have shown that the climate warming trend in this region has already been more pronounced during the last two decades. Moreover, annual precipitation is increasing, which has alleviated the degree of drought in Yinshanbeilu to a certain extent [46,47].
In terms of the interannual variation in the NDVI, the overall NDVI in Yinshanbeilu significantly increased in spring, summer, and autumn, which was generally consistent with the findings of Yang et al. [48]. The trends from this study further showed that the rates of increase in the NDVI in different years were different, and the rates of increase in the latter part of each season were much greater than those in the earlier part [49,50,51]. These results indicated that the trend of vegetation increase in Inner Mongolia became more evident since the 21st century [52]. The spatial distribution of the NDVI has a certain degree of variability, which is caused by seasonal solar radiation, climatic characteristics of vegetation types, soils, topography, and other factors; thus, the NDVI values during each season exhibited corresponding variability at the spatial level. As the temperature starts to rise, the plants return to the greening and nodulation stage, and thus, the NDVI gradually increases. In summer, the solar altitude angle reaches its highest angle in the year, and solar radiation and air temperature also reach their highest values; thus, the NDVI reaches its highest value in a year in summer [53,54,55]. In autumn, when the solar radiation decreases, the temperature decreases, as the solar altitude angle decreases; thus, the vegetation cover decreases in autumn. In winter, when the intensity of solar radiation reaches its lowest level, temperatures drop further to the lowest level of the year, the night length reaches the longest time of the year, and the vegetation is covered by a thick layer of snow [56,57].
From the perspective of spatial distribution, the relationship between the NDVI and SPEI in the western region of the study region was high and significant, while the abovementioned relationships in the central and eastern regions were weak and mostly insignificant, likely being related to the distribution features of precipitation and vegetation categories in the study region [58]. First, precipitation exhibited a decreasing distribution from east to west, and the western part of the study region was more prone to water deficit events than the eastern part. Additionally, the west areas of the study region had greater intensities and frequencies of the droughts. Second, according to the vegetation type distribution, the above-described region was grassland. Additionally, vegetation growth in grassland was more easily constrained by water quantity; thus, a strong correlation was observed in grassland. In addition, in the eastern region, where crops are mainly concentrated, human disturbance, including fertilization, irrigation, and other field management practices, provided beneficial conditions for the growth of crops; thus, the correlation between NDVI and SPEI in this area was low [59]. The forestland was mainly distributed in the southern region of the study area, where the NDVI and SPEI exhibited weak positive correlations and partial inverse correlations. The above results occurred because the roots of forest trees stretched to deep soil to absorb water when water availability was inadequate; therefore, water had little restriction on vegetation growth in this region, and temperature was the dominant factor impacting the growth of forests [60,61,62].
In addition to winter, the correlation coefficient between the NDVI and SPEI of forest vegetation was the highest in long-run scale SPEI6-12; however, the correlation coefficient between the NDVI and SPEI of grassland was the largest in short time scale SPEI3 in winter. To some extent, these results indicated that different ecosystems had different drought resistance abilities [63]. Studies have shown that forests were able to respond to extreme drought four years ago, while the response period of grasslands is only one year. This difference is related to the water-drawing ability of plant roots, and another important factor is the disparate distribution rates of soil water in the shallow, middle, and deep layers of soil within different vegetation areas [64,65]. With increasing soil thickness, the soil water in the forest area gradually increased, while the soil water in the shallow and middle layers in the grassland area was much greater than that in the deep layer. When autumn drought occurs on a short time scale, grasslands likely consume the shallow soil water quickly and thus are sensitive to drought change. Forests, on the other hand, are able to withstand drought on a long-term scale because of their higher water content in the deep soil [66,67].
In light of the seasonal distribution features of the coefficient between the NDVI and SPEI, the correlation between the two is the most powerful in summer and subsequently in autumn, spring, and winter. Summer is the most relevant season because most of its vegetation, including grasslands and crops, is in a critical period of growth and progression, and the region is highly susceptible to drought [68]. In fall, the vegetation fades, leaves fall, and less water is needed. At this time, the NDVI and SPEI exhibited a weak positive or negative correlation.

5. Conclusions

In this study, the relationship between the NDVI and SPEI at disparate time scales between 2001 and 2020 in the Yinshanbeilu region was studied to evaluate the response of vegetation to drought. The main conclusions of these studies are listed below:
(1)
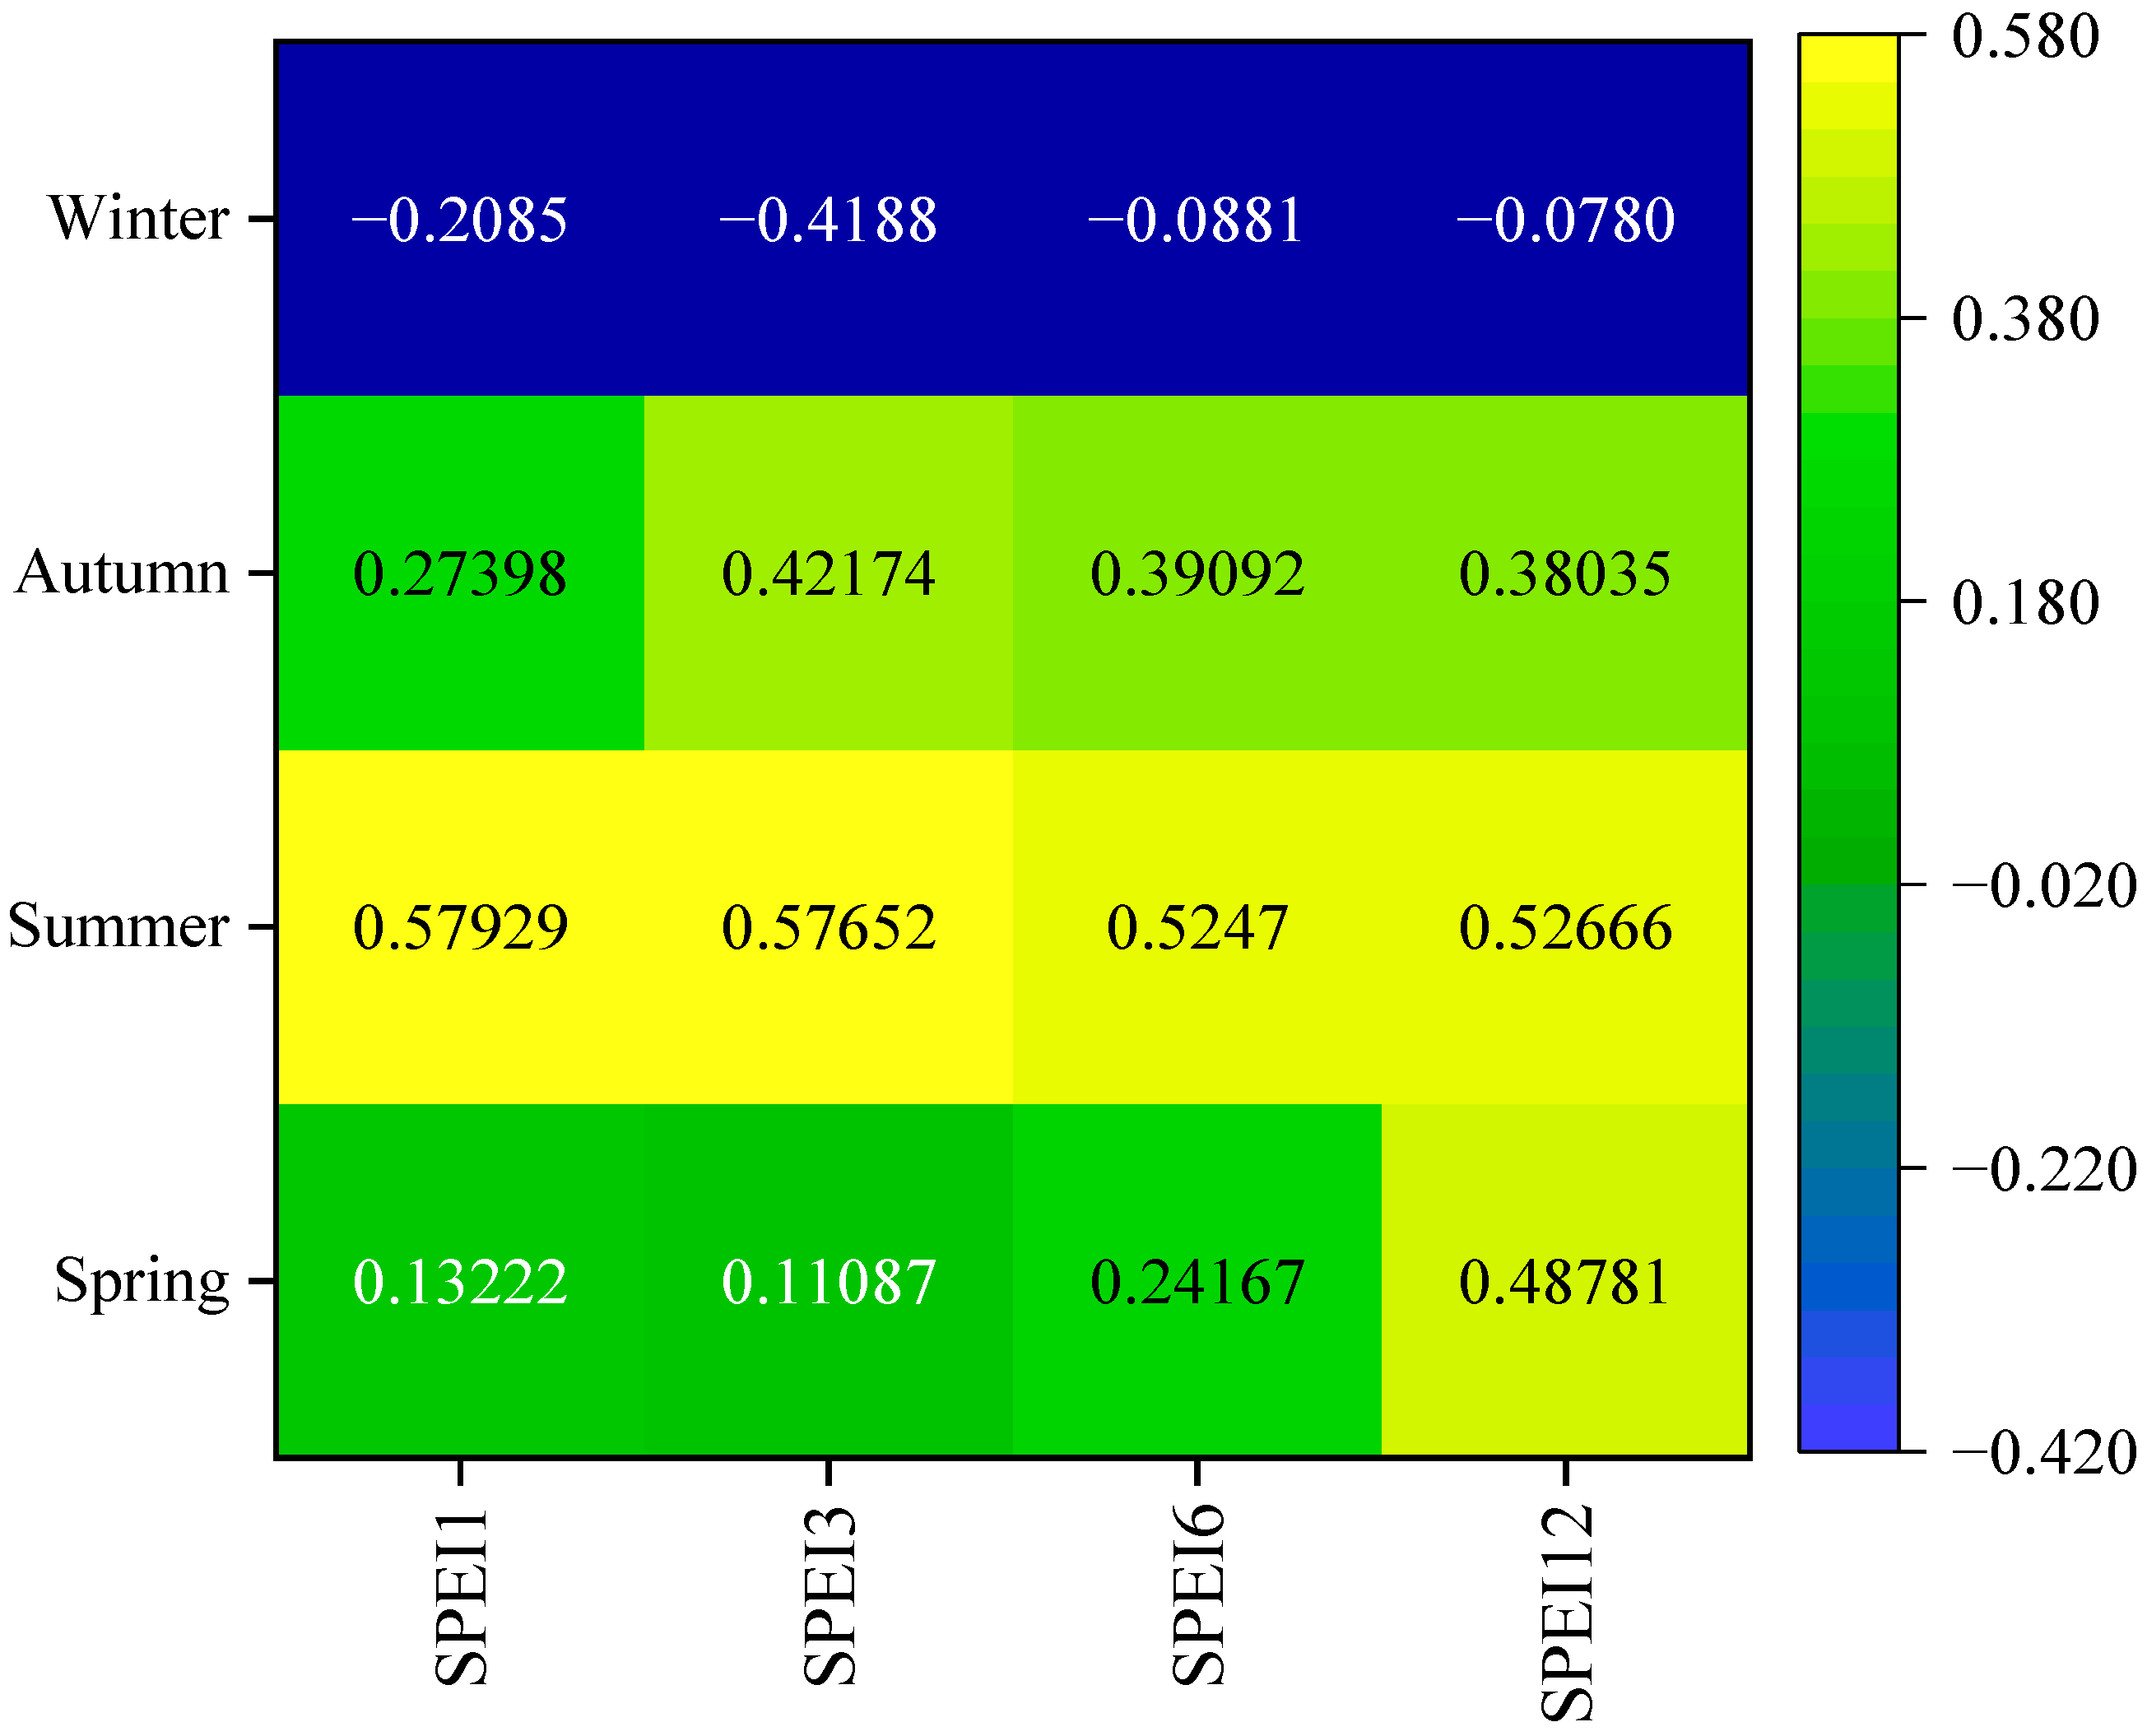
Except for those in winter, the correlation coefficients between the NDVI and SPEI in spring, summer, and autumn increased with increasing SPEI. The increase in correlation was concentrated in the southeastern and western regions of the study region, and the timescales with the best correlation were SPEI6 and SPEI12.
(2)
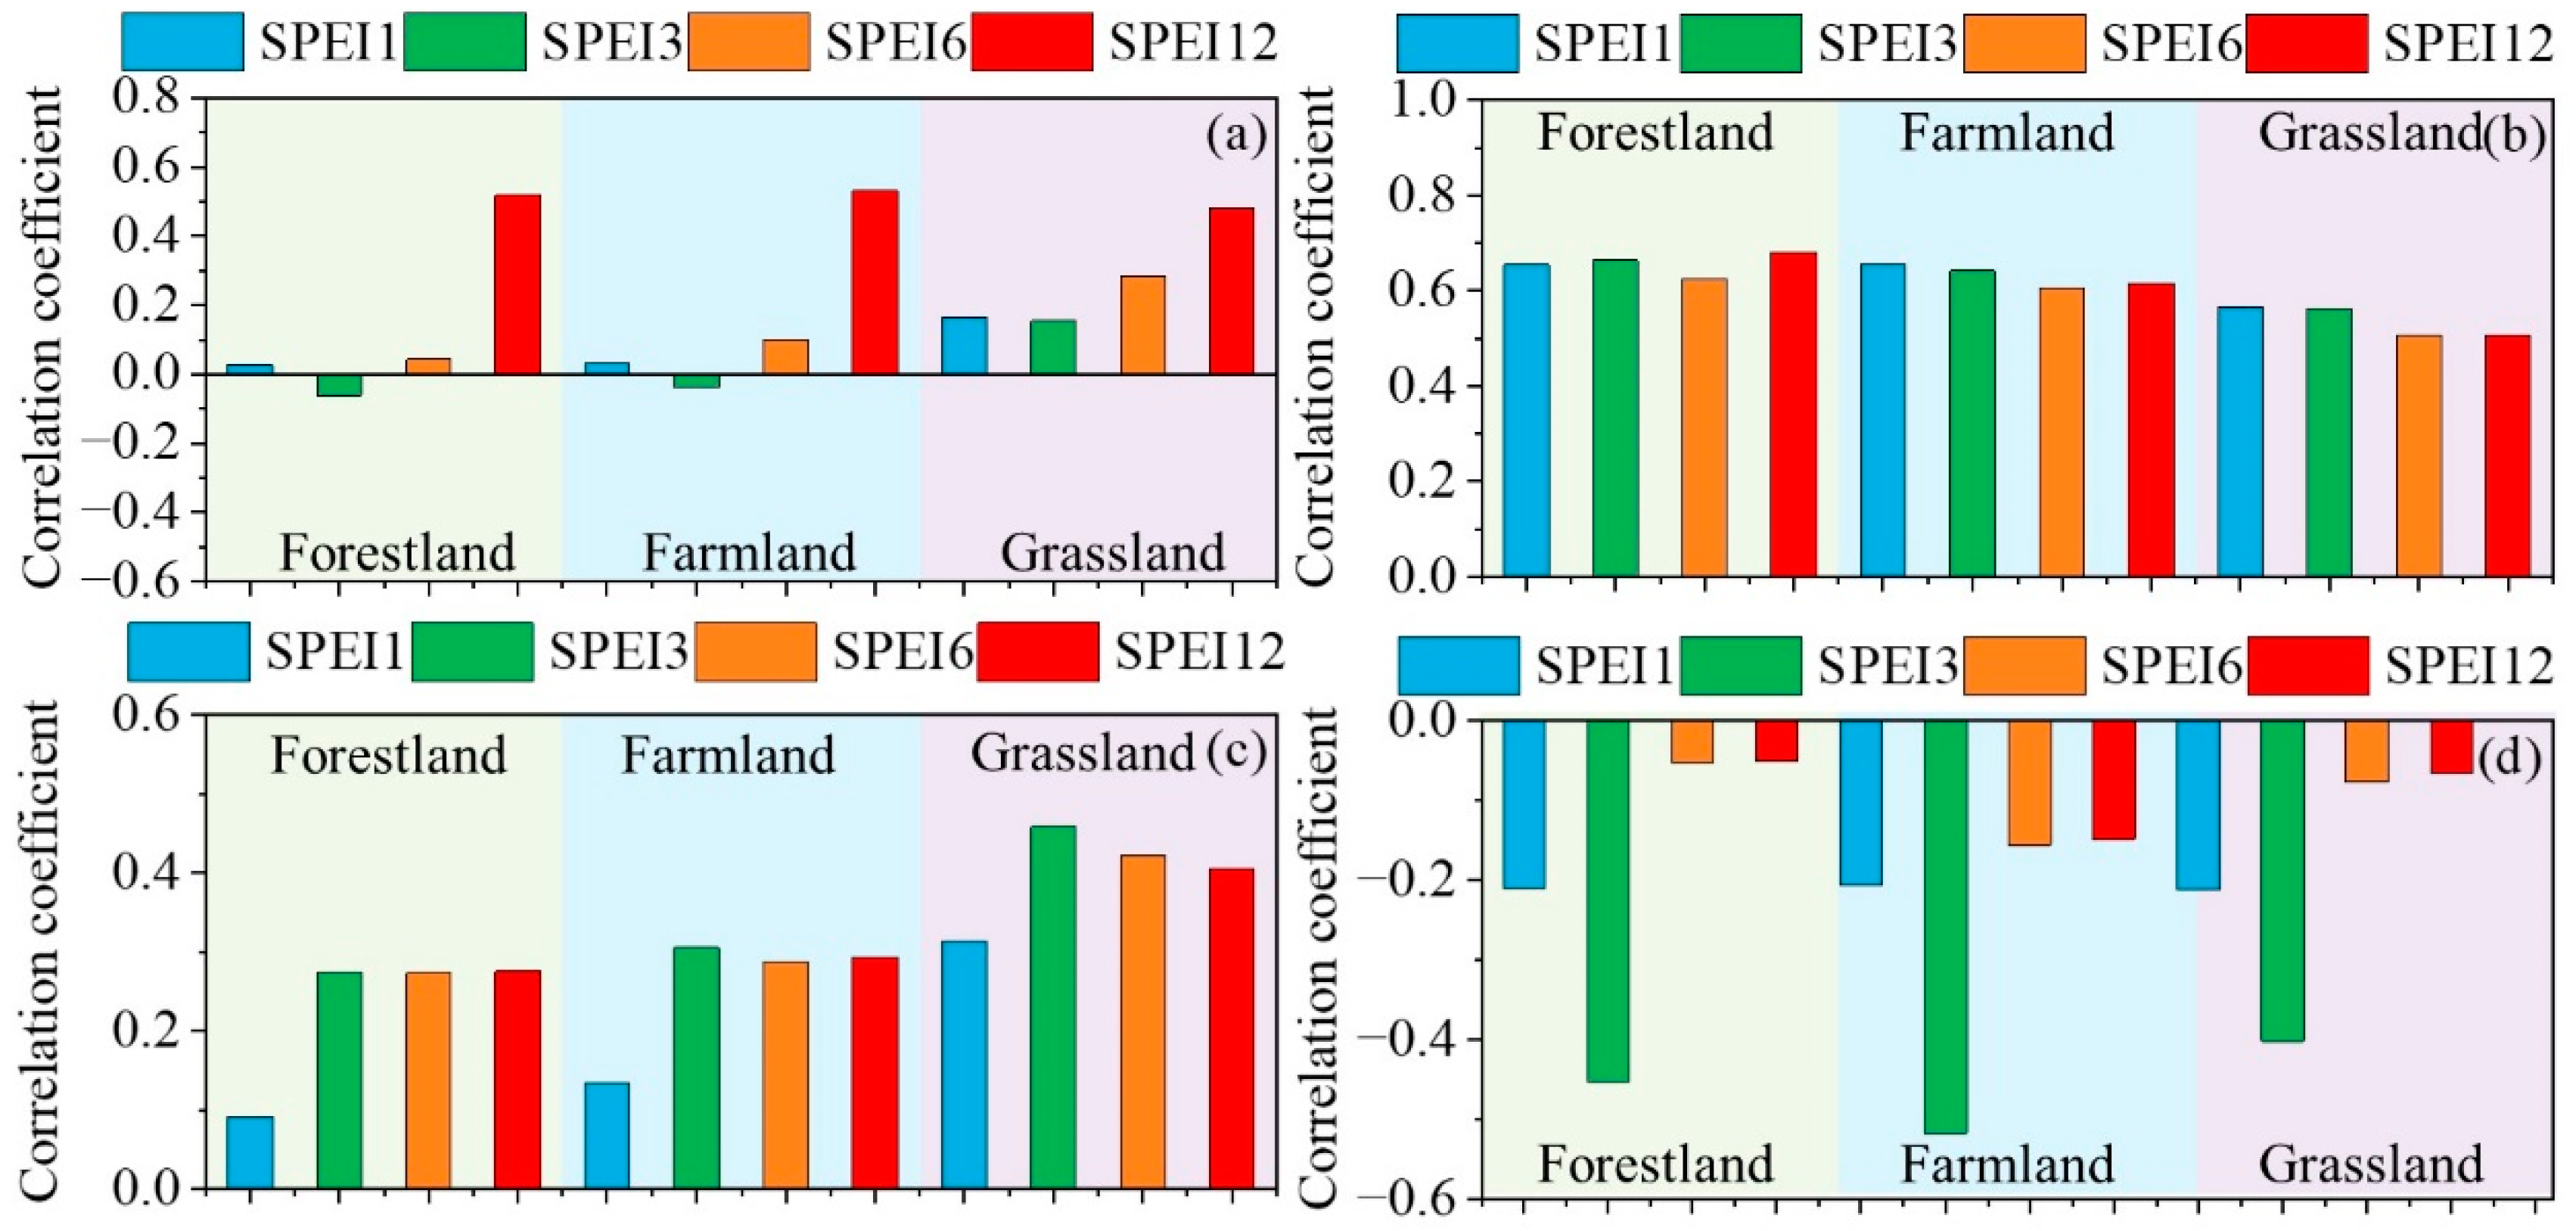
Grassland was the most sensitive vegetation type to the SPEI response of the NDVI; the correlation coefficients of NDVI and SPEI1-12 were 0.313, 0.459, 0.422, and 0.406.
(3)
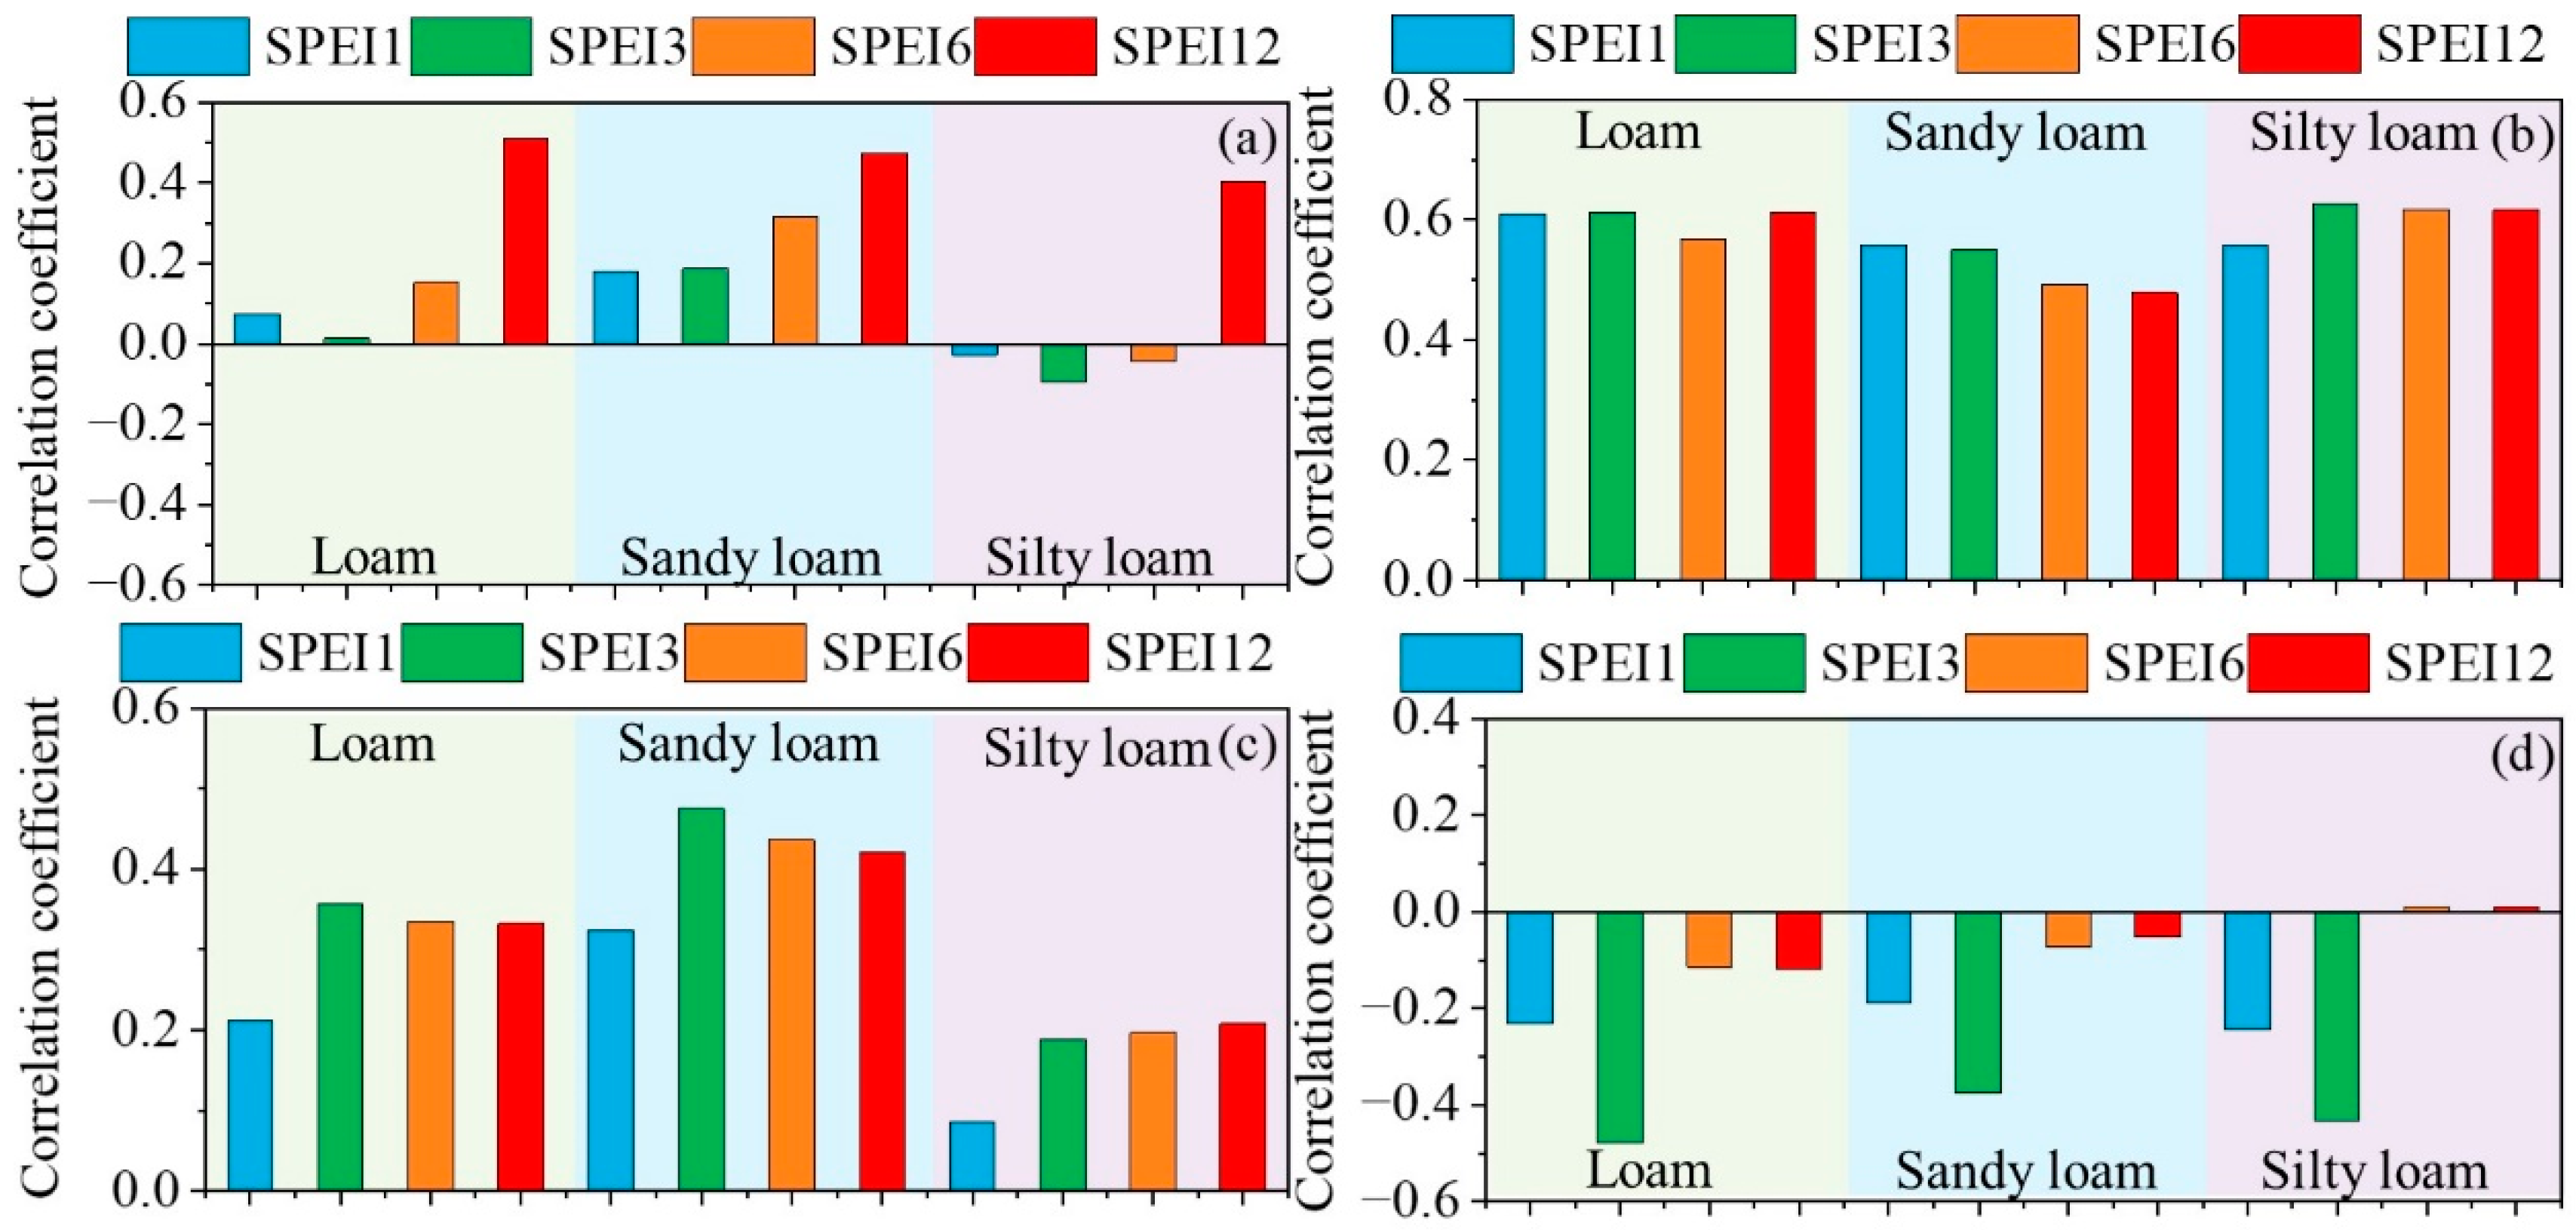
In spring, loam, sandy loam, and silty loam exhibited the highest response to the SPEI12. In summer, the SPEI3 of loam, SPEI1 of sandy loam, and SPEI3 of silty loam were sensitive to the vegetation response. In the fall, the SPEI1, SPEI3, SPEI6, and SPEI12 of sandy loam had greater correlation coefficients than those for loam and silty loam. In winter, loam, sandy loam, and silty loam exhibited negative correlations at all time scales, with the highest correlation occurring at the 3 month time scale. Loam, sandy loam, and silty loam all exhibited the highest response to SPEI12, with coefficients of 0.509, 0.474, and 0.403, respectively

Author Contributions

Writing—original draft, S.W.; methodology, Y.W.; writing—review and editing, S.W., J.G. and M.L.; formal analysis, B.F.; software, X.X. All authors have read and agreed to the published version of the manuscript.

Funding

This study was patronized by Inner Mongolia Autonomous Region Scientific Research Infrastructure and Platform (2023KYPT0002); Basic Research Funds of China Research Institute of Water Resources and Hydropower (MK2023J06; MK2023J07); and Inner Mongolia Natural Science Youth Foundation (2023QN05003).

Informed Consent Statement

Not applicable.

Data Availability Statement

Data are contained within the article.

Conflicts of Interest

The authors declare no conflicts of interest.

References

  1. Tian, F.; Wu, J.; Liu, L.; Leng, S.; Yang, J.; Zhao, W.; Shen, Q. Exceptional Drought across Southeastern Australia Caused by Extreme Lack of Precipitation and Its Impacts on NDVI and SIF in 2018. Remote Sens. 2019, 12, 54. [Google Scholar] [CrossRef]
  2. Ding, Y.; He, X.; Zhou, Z.; Hu, J.; Cai, H.; Wang, X.; Li, L.; Xu, J.; Shi, H. Response of vegetation to drought and yield monitoring based on NDVI and SIF. Catena 2022, 219, 106328. [Google Scholar] [CrossRef]
  3. Qiu, R.; Li, X.; Han, G.; Xiao, J.; Ma, X.; Gong, W. Monitoring drought impacts on crop productivity of the US Midwest with solar-induced fluorescence: GOSIF outperforms GOME-2 SIF and MODIS NDVI, EVI, and NIRv. Agric. For. Meteorol. 2022, 323, 109038. [Google Scholar] [CrossRef]
  4. Rajpoot, P.S.; Kumar, A. Impact assessment of meteorological drought on rainfed agriculture using drought index and NDVI modeling: A case study of Tikamgarh district, MP, India. Appl. Geomat. 2019, 11, 15–23. [Google Scholar] [CrossRef]
  5. Behrang Manesh, M.; Khosravi, H.; Heydari Alamdarloo, E.; Saadi Alekasir, M.; Gholami, A.; Singh, V.P. Linkage of agricultural drought with meteorological drought in different climates of Iran. Theor. Appl. Climatol. 2019, 138, 1025–1033. [Google Scholar] [CrossRef]
  6. Pompa-García, M.; Camarero, J.J.; Colangelo, M.; González-Cásares, M. Inter and intra-annual links between climate, tree growth and NDVI: Improving the resolution of drought proxies in conifer forests. Int. J. Biometeorol. 2021, 65, 2111–2121. [Google Scholar] [CrossRef] [PubMed]
  7. Ali, S.; Haixing, Z.; Qi, M.; Liang, S.; Ning, J.; Jia, Q.; Hou, F. Monitoring drought events and vegetation dynamics in relation to climate change over mainland China from 1983 to 2016. Environ. Sci. Pollut. Res. 2021, 28, 21910–21925. [Google Scholar] [CrossRef]
  8. Moussa Kourouma, J.; Eze, E.; Negash, E.; Phiri, D.; Vinya, R.; Girma, A.; Zenebe, A. Assessing the spatio-temporal variability of NDVI and VCI as indices of crops productivity in Ethiopia: A remote sensing approach. Geomat. Nat. Hazards Risk 2021, 12, 2880–2903. [Google Scholar] [CrossRef]
  9. Javed, T.; Yao, N.; Chen, X.; Suon, S.; Li, Y. Drought evolution indicated by meteorological and remote-sensing drought indices under different land cover types in China. Environ. Sci. Pollut. Res. Int. 2020, 27, 4258–4274. [Google Scholar] [CrossRef]
  10. Miller, D.L.; Alonzo, M.; Meerdink, S.K.; Allen, M.A.; Tague, C.L.; Roberts, D.A.; McFadden, J.P. Seasonal and interannual drought responses of vegetation in a California urbanized area measured using complementary remote sensing indices. ISPRS J. Photogramm. Remote Sens. 2022, 183, 178–195. [Google Scholar] [CrossRef]
  11. Zhao, A.; Zhang, A.; Liu, J.; Feng, L.; Zhao, Y. Assessing the effects of drought and “Grain for Green” Program on vegetation dynamics in China’s Loess Plateau from 2000 to 2014. Catena 2019, 175, 446–455. [Google Scholar] [CrossRef]
  12. Wang, S.; Li, R.; Wu, Y.; Zhao, S. Effects of multi-temporal scale drought on vegetation dynamics in Inner Mongolia from 1982 to 2015, China. Ecol. Indic. 2022, 136, 108666. [Google Scholar] [CrossRef]
  13. Zhang, H.; Ali, S.; Ma, Q.; Sun, L.; Jiang, N.; Jia, Q.; Hou, F. Remote sensing strategies to characterization of drought, vegetation dynamics in relation to climate change from 1983 to 2016 in Tibet and Xinjiang Province, China. Environ. Sci. Pollut. Res. 2021, 28, 21085–21100. [Google Scholar] [CrossRef] [PubMed]
  14. Zhou, Z.; Liu, S.; Ding, Y.; Fu, Q.; Wang, Y.; Cai, H.; Shi, H. Assessing the responses of vegetation to meteorological drought and its influencing factors with partial wavelet coherence analysis. J. Environ. Manag. 2022, 311, 114879. [Google Scholar] [CrossRef] [PubMed]
  15. Bhattacharya, S.; Halder, S.; Nag, S.; Roy, P.K.; Roy, M.B. Assessment of drought using multi-parameter indices. In Advances in Water Resources Management for Sustainable Use; Springer: Berlin/Heidelberg, Germany, 2021; pp. 243–255. [Google Scholar]
  16. Zhang, Y.; Liu, X.; Jiao, W.; Zhao, L.; Zeng, X.; Xing, X.; Zhang, L.; Hong, Y.; Lu, Q. A new multi-variable integrated framework for identifying flash drought in the Loess Plateau and Qinling Mountains regions of China. Agric. Water Manag. 2022, 265, 107544. [Google Scholar] [CrossRef]
  17. Bento, V.A.; Gouveia, C.M.; DaCamara, C.C.; Libonati, R.; Trigo, I.F. The roles of NDVI and Land Surface Temperature when using the Vegetation Health Index over dry regions. Glob. Planet. Chang. 2020, 190, 103198. [Google Scholar] [CrossRef]
  18. Ramirez, S.G.; Hales, R.C.; Williams, G.P.; Jones, N.L. Extending SC-PDSI-PM with neural network regression using GLDAS data and Permutation Feature Importance. Environ. Model. Softw. 2022, 157, 105475. [Google Scholar] [CrossRef]
  19. Pande, C.B.; Costache, R.; Sammen, S.S.; Noor, R.; Elbeltagi, A. Combination of data-driven models and best subset regression for predicting the standardized precipitation index (SPI) at the Upper Godavari Basin in India. Theor. Appl. Climatol. 2023, 152, 535–558. [Google Scholar] [CrossRef]
  20. Zhang, R.; Bento, V.A.; Qi, J.; Xu, F.; Wu, J.; Qiu, J.; Li, J.; Shui, W.; Wang, Q. The first high spatial resolution multi-scale daily SPI and SPEI raster dataset for drought monitoring and evaluating over China from 1979 to 2018. Big Earth Data 2023, 7, 860–885. [Google Scholar] [CrossRef]
  21. Liu, Q.; Zhang, S.; Zhang, H.; Bai, Y.; Zhang, J. Monitoring drought using composite drought indices based on remote sensing. Sci. Total Environ. 2020, 711, 134585. [Google Scholar] [CrossRef]
  22. Xu, L.; Chen, N.; Yang, C.; Zhang, C.; Yu, H. A parametric multivariate drought index for drought monitoring and assessment under climate change. Agric. For. Meteorol. 2021, 310, 108657. [Google Scholar] [CrossRef]
  23. Won, J.; Choi, J.; Lee, O.; Kim, S. Copula-based Joint Drought Index using SPI and EDDI and its application to climate change. Sci. Total Environ. 2020, 744, 140701. [Google Scholar] [CrossRef] [PubMed]
  24. Shah, D.; Mishra, V. Integrated Drought Index (IDI) for Drought Monitoring and Assessment in India. Water Resour. Res. 2020, 56, e2019WR026284. [Google Scholar] [CrossRef]
  25. Xu, L.; Abbaszadeh, P.; Moradkhani, H.; Chen, N.; Zhang, X. Continental drought monitoring using satellite soil moisture, data assimilation and an integrated drought index. Remote Sens. Environ. 2020, 250, 112028. [Google Scholar] [CrossRef]
  26. Malik, A.; Kumar, A.; Singh, R.P. Application of heuristic approaches for prediction of hydrological drought using multi-scalar streamflow drought index. Water Resour. Manag. 2019, 33, 3985–4006. [Google Scholar] [CrossRef]
  27. Kong, D.D.; Zhang, Q.; Gu, X.H.; Wang, Y.; Li, H.Z. Vegetation responses to drought at different time scales in China. Acta Ecol. Sin. 2016, 36, 7908–7918. [Google Scholar]
  28. Liu, S.L.; Tian, Y.Y.; An, N.N.; Zhao, H.D.; Dong, S.K. Effects of climate change on normalized difference vegetation index based on the multiple analysis of standardized precipitation evapotranspiration index methods in the Lancang River Basin. Clim. Environ. Res. 2015, 20, 705–714. [Google Scholar]
  29. Gouveia, C.M.; Trigo, R.M.; Beguería, S.; Vicente-Serrano, S.M. Drought impacts on vegetation activity in the Mediterranean region: An assessment using remote sensing data and multi-scale drought indicators. Glob. Planet. Chang. 2017, 151, 15–27. [Google Scholar] [CrossRef]
  30. Zhao, A.; Zhang, A.; Cao, S.; Liu, X.; Liu, J.; Cheng, D. Responses of vegetation productivity to multi-scale drought in Loess Plateau, China. Catena 2018, 163, 165–171. [Google Scholar] [CrossRef]
  31. Eze, E.; Girma, A.; Zenebe, A.; Okolo, C.C.; Kourouma, J.M.; Negash, E. Predictors of drought-induced crop yield/losses in two agroecologies of southern Tigray, Northern Ethiopia. Sci. Rep. 2022, 12, 6284. [Google Scholar] [CrossRef]
  32. Han, Z.; Huang, S.; Huang, Q.; Bai, Q.; Leng, G.; Wang, H.; Zhao, J.; Wei, X.; Zheng, X. Effects of vegetation restoration on groundwater drought in the Loess Plateau, China. J. Hydrol. 2020, 591, 125566. [Google Scholar] [CrossRef]
  33. Bhaga, T.D.; Dube, T.; Shekede, M.D.; Shoko, C. Impacts of climate variability and drought on surface water resources in Sub-Saharan Africa using remote sensing: A review. Remote Sens. 2020, 12, 4184. [Google Scholar] [CrossRef]
  34. Choudhury, A.; Dutta, D.; Bera, D.; Kundu, A. Regional variation of drought parameters and long-term trends over India using standardized precipitation evapotranspiration index. J. Environ. Manag. 2021, 296, 113056. [Google Scholar] [CrossRef] [PubMed]
  35. Pei, Z.; Fang, S.; Wang, L.; Yang, W. Comparative Analysis of Drought Indicated by the SPI and SPEI at Various Timescales in Inner Mongolia, China. Water 2020, 12, 1925. [Google Scholar] [CrossRef]
  36. Abdourahamane, Z.S.; Garba, I.; Boukary, A.G.; Mirzabaev, A. Spatiotemporal characterization of agricultural drought in the Sahel region using a composite drought index. J. Arid. Environ. 2022, 204, 104789. [Google Scholar] [CrossRef]
  37. Li, Y.; Zhang, W.; Schwalm, C.R.; Gentine, P.; Smith, W.K.; Ciais, P.; Kimball, J.S.; Gazol, A.; Kannenberg, S.A.; Chen, A. Widespread spring phenology effects on drought recovery of Northern Hemisphere ecosystems. Nat. Clim. Chang. 2023, 13, 182–188. [Google Scholar] [CrossRef]
  38. Jiao, W.; Wang, L.; McCabe, M.F. Multi-sensor remote sensing for drought characterization: Current status, opportunities and a roadmap for the future. Remote Sens. Environ. 2021, 256, 112313. [Google Scholar] [CrossRef]
  39. Alahacoon, N.; Edirisinghe, M. A comprehensive assessment of remote sensing and traditional based drought monitoring indices at global and regional scale. Geomat. Nat. Hazards Risk 2022, 13, 762–799. [Google Scholar] [CrossRef]
  40. Cai, S.; Song, X.; Hu, R.; Leng, P.; Li, X.; Guo, D.; Hao, Y.; Wang, Y. Spatiotemporal characteristics of agricultural droughts based on soil moisture data in Inner Mongolia from 1981 to 2019. J. Hydrol. 2021, 603, 127104. [Google Scholar] [CrossRef]
  41. Wang, S.; Wang, W.; Wu, Y.; Li, W.; Zhao, S.; Chen, Z. Effects of a changing climate and anthropogenic impacts on net primary production in Yinshanbeilu, Inner Mongolia, China. Environ. Impact Assess. Rev. 2023, 102, 107185. [Google Scholar] [CrossRef]
  42. Tong, S.; Bao, G.; Bao, Y.; Huang, X. Monitoring of long-term vegetation dynamics and responses to droughts of various timescales in Inner Mongolia. Ecosphere 2023, 14, e4415. [Google Scholar] [CrossRef]
  43. Wei, Y.; Zhu, L.; Chen, Y.; Cao, X.; Yu, H. Spatiotemporal Variations in Drought and Vegetation Response in Inner Mongolia from 1982 to 2019. Remote Sens. 2022, 14, 3803. [Google Scholar] [CrossRef]
  44. Geng, G.; Yang, R.; Liu, L. Downscaled solar-induced chlorophyll fluorescence has great potential for monitoring the response of vegetation to drought in the Yellow River Basin, China: Insights from an extreme event. Ecol. Indic. 2022, 138, 108801. [Google Scholar] [CrossRef]
  45. Lu, Q.; Zhao, D.; Wu, S.; Dai, E.; Gao, J. Using the NDVI to analyze trends and stability of grassland vegetation cover in Inner Mongolia. Theor. Appl. Climatol. 2018, 135, 1629–1640. [Google Scholar] [CrossRef]
  46. Lv, Y.; Zhao, X.Q.; Zhang, S.R.; Zhang, J.G.; Yue, K.T.; Meng, B.P.; Li, M.; Cui, W.X.; Sun, Y.; Chang, L. Herbaceous dominant the changes of normalized difference vegetation index in the transition zone between desert and typical steppe in Inner Mongolia, China. Front. Plant Sci. 2022, 12, 832044. [Google Scholar] [CrossRef] [PubMed]
  47. Cheng, G.; Liu, T.; Wang, S.; Wu, Y.; Zhang, C. Responses to the Impact of Drought on Carbon and Water Use Efficiency in Inner Mongolia. Land 2023, 12, 583. [Google Scholar] [CrossRef]
  48. Yang, J.; Wan, Z.; Borjigin, S.; Zhang, D.; Yan, Y.; Chen, Y.; Gu, R.; Gao, Q. Changing trends of NDVI and their responses to climatic variation in different types of grassland in Inner Mongolia from 1982 to 2011. Sustainability 2019, 11, 3256. [Google Scholar] [CrossRef]
  49. Su, R.; Guo, E.; Wang, Y.; Yin, S.; Bao, Y.; Sun, Z.; Mandula, N.; Bao, Y. Vegetation Dynamics and Its Response to Extreme Climate on the Inner Mongolian Plateau during 1982–2020. Remote Sens. 2023, 15, 3891. [Google Scholar] [CrossRef]
  50. Wang, Y.; Zhang, C.; Meng, F.-R.; Bourque, C.P.A.; Zhang, C. Evaluation of the suitability of six drought indices in naturally growing, transitional vegetation zones in Inner Mongolia (China). PLoS ONE 2020, 15, e0233525. [Google Scholar] [CrossRef]
  51. Gong, Z.; Kawamura, K.; Ishikawa, N.; Goto, M.; Tuya, W.; Alateng, D.; Yin, T.; Ito, Y. Vegetation Dynamics and Phenological Shifts in Long-term NDVI Time Series in Inner Mongolia, China. Jpn. Agric. Res. Q. JARQ 2020, 54, 101–112. [Google Scholar] [CrossRef]
  52. Kang, Y.; Guo, E.; Wang, Y.; Bao, Y.; Bao, Y.; Mandula, N. Monitoring Vegetation Change and Its Potential Drivers in Inner Mongolia from 2000 to 2019. Remote Sens. 2021, 13, 3357. [Google Scholar] [CrossRef]
  53. Wang, B.; Tian, Z.; Zhang, W.; Chen, G.; Guo, Y.; Wang, M. Retrieval of green-up onset date from MODIS Derived NDVI in grasslands of inner Mongolia. IEEE Access 2019, 7, 77885–77893. [Google Scholar] [CrossRef]
  54. Zhang, Y.; Liang, W.; Liao, Z.; Han, Z.; Xu, X.; Jiao, R.; Liu, H. Effects of climate change on lake area and vegetation cover over the past 55 years in Northeast Inner Mongolia grassland, China. Theor. Appl. Climatol. 2019, 138, 13–25. [Google Scholar] [CrossRef]
  55. Wang, Y.; Duan, L.; Liu, T.; Luo, Y.; Li, D.; Tong, X.; Li, W.; Lei, H.; Singh, V.P. Evaluation of non-stationarity in summer precipitation and the response of vegetation over the typical steppe in Inner Mongolia. Clim. Dyn. 2021, 58, 227–2247. [Google Scholar] [CrossRef]
  56. Guo, E.; Wang, Y.; Wang, C.; Sun, Z.; Bao, Y.; Mandula, N.; Jirigala, B.; Bao, Y.; Li, H. NDVI Indicates Long-Term Dynamics of Vegetation and Its Driving Forces from Climatic and Anthropogenic Factors in Mongolian Plateau. Remote Sens. 2021, 13, 688. [Google Scholar] [CrossRef]
  57. Guo, D.; Song, X.; Hu, R.; Cai, S.; Zhu, X.; Hao, Y. Grassland type-dependent spatiotemporal characteristics of productivity in Inner Mongolia and its response to climate factors. Sci. Total Environ. 2021, 775, 145644. [Google Scholar] [CrossRef]
  58. Wang, S.; Li, R.; Wu, Y.; Zhao, S. Vegetation dynamics and their response to hydrothermal conditions in Inner Mongolia, China. Glob. Ecol. Conserv. 2022, 34, e02034. [Google Scholar] [CrossRef]
  59. Cao, J.; An, Q.; Zhang, X.; Xu, S.; Si, T.; Niyogi, D. Is satellite Sun-Induced Chlorophyll Fluorescence more indicative than vegetation indices under drought condition? Sci. Total Environ. 2021, 792, 148396. [Google Scholar] [CrossRef] [PubMed]
  60. Bajocco, S.; Ferrara, C.; Bascietto, M.; Alivernini, A.; Chirichella, R.; Cutini, A.; Chianucci, F. Characterizing the climatic niche of mast seeding in beech: Evidences of trade-offs between vegetation growth and seed production. Ecol. Indic. 2021, 121, 107139. [Google Scholar] [CrossRef]
  61. Mohammed, W.E.; Algarni, S. A remote sensing study of spatiotemporal variations in drought conditions in northern Asir, Saudi Arabia. Environ. Monit. Assess. 2020, 192, 784. [Google Scholar] [CrossRef]
  62. Shen, Z.; Zhang, Q.; Singh, V.P.; Sun, P.; Song, C.; Yu, H. Agricultural drought monitoring across Inner Mongolia, China: Model development, spatiotemporal patterns and impacts. J. Hydrol. 2019, 571, 793–804. [Google Scholar] [CrossRef]
  63. Wang, Y.; Lv, J.; Hannaford, J.; Wang, Y.; Sun, H.; Barker, L.J.; Ma, M.; Su, Z.; Eastman, M. Linking drought indices to impacts to support drought risk assessment in Liaoning province, China. Nat. Hazards Earth Syst. Sci. 2020, 20, 889–906. [Google Scholar] [CrossRef]
  64. Jiang, P.; Ding, W.; Yuan, Y.; Ye, W. Diverse response of vegetation growth to multi-time-scale drought under different soil textures in China’s pastoral areas. J. Environ. Manag. 2020, 274, 110992. [Google Scholar] [CrossRef] [PubMed]
  65. Zhan, C.; Liang, C.; Zhao, L.; Jiang, S.; Niu, K.; Zhang, Y. Drought-related cumulative and time-lag effects on vegetation dynamics across the Yellow River Basin, China. Ecol. Indic. 2022, 143, 109409. [Google Scholar] [CrossRef]
  66. Yuan, Y.; Bao, A.; Jiang, P.; Hamdi, R.; Termonia, P.; De Maeyer, P.; Guo, H.; Zheng, G.; Yu, T.; Prishchepov, A.V. Probabilistic assessment of vegetation vulnerability to drought stress in Central Asia. J. Environ. Manag. 2022, 310, 114504. [Google Scholar] [CrossRef]
  67. Shi, X.; Chen, F.; Ding, H.; Shi, M.; Li, Y. Assessing vegetation ecosystem resistance to drought in the middle reaches of the Yellow River Basin, China. Int. J. Environ. Res. Public Health 2022, 19, 4180. [Google Scholar] [CrossRef]
  68. Ma, T.; Liang, Y.; Li, Z.; Liu, Z.; Liu, B.; Wu, M.M.; Lau, M.K.; Fang, Y. Age-related patterns and climatic driving factors of drought-induced forest mortality in Northeast China. Agric. For. Meteorol. 2023, 332, 109360. [Google Scholar] [CrossRef]
Figure 1. Geographic location of the study region. (a) Yinshanbeilu location; (b) digital elevation model; and (c) land use type.
Land 13 00523 g001
Figure 2. Technology roadmap.
Land 13 00523 g002
Figure 3. Temporal variation in SPEI values at multiple time scales in (a) spring, (b) summer, (c) autumn, and (d) winter.
Land 13 00523 g003
Figure 4. Spatial trends of the SPEI values at multiple time scales in spring, summer, autumn, and winter. (ad) Seasonal spatial distribution trends of SPEI1. (eh) Seasonal spatial distribution tendencies of SPEI3. (il) Seasonal spatial distribution trends of SPEI6. (mp) Trends in the spatial distribution of the SPEI12.
Land 13 00523 g004
Figure 5. Interannual variation trend of the NDVI in different seasons: (a) spring, (b) summer, (c) autumn, and (d) winter.
Land 13 00523 g005
Figure 6. Trend and significance of the NDVI in different seasons. (ad) Trend over the entire year for spring, summer, autumn, and winter; (eh) Significance results over the entire year for spring, summer, autumn, and winter.
Land 13 00523 g006
Figure 7. Spatial distribution of the correlation between the NDVI and SPEI at disparate time scales during the entire year. (ad) Seasonal correlation between the SPEI1 and NDVI. (eh) Seasonal correlation between the SPEI3 and NDVI. (il) Seasonal correlation between the SPEI6 and NDVI. (mp) Seasonal correlation between the SPEI12 and NDVI.
Land 13 00523 g007
Figure 8. Spatial distribution of the significance of the NDVI and SPEI at different time scales throughout the entire year. (ad) Seasonal significance of the SPEI1 and NDVI. (eh) Seasonal significance of the SPEI3 and NDVI. (il) Seasonal significance of the SPEI6 and NDVI. (mp) Seasonal significance of the SPEI12 and NDVI.
Land 13 00523 g008
Figure 9. SPEI1-12 correlation coefficient in different seasons.
Land 13 00523 g009
Figure 10. Correlation coefficients of the SPEI and NDVI for disparate land use categories with different seasonal scales at 1, 3, 6, and 12 month timescales. (ad) Spring, summer, autumn, and winter, respectively.
Land 13 00523 g010
Figure 11. Correlation coefficients of the SPEI and NDVI for disparate soil textures at different seasonal scales for 1, 3, 6, and 12 month timescales. (a) Spring, (b) summer, (c) autumn, and (d) winter.
Land 13 00523 g011
Table 1. Drought grading of SPEI.
Drought GradeSPEI Value
Extreme drought≤−2.00
Severe drought−1.99~−1.50
Moderate drought−1.49~−1.00
Normal−0.99~0.99
Moderate wetting1.00~1.49
Severe wetting1.50~1.99
Extreme wetting≥2.00
Disclaimer/Publisher’s Note: The statements, opinions and data contained in all publications are solely those of the individual author(s) and contributor(s) and not of MDPI and/or the editor(s). MDPI and/or the editor(s) disclaim responsibility for any injury to people or property resulting from any ideas, methods, instructions or products referred to in the content.

