
Agricultural Yield Responses to Climate Variabilities in West Africa: A Food Supply and Demand Analysis


Abstract
1. Introduction
2. Materials and Methods
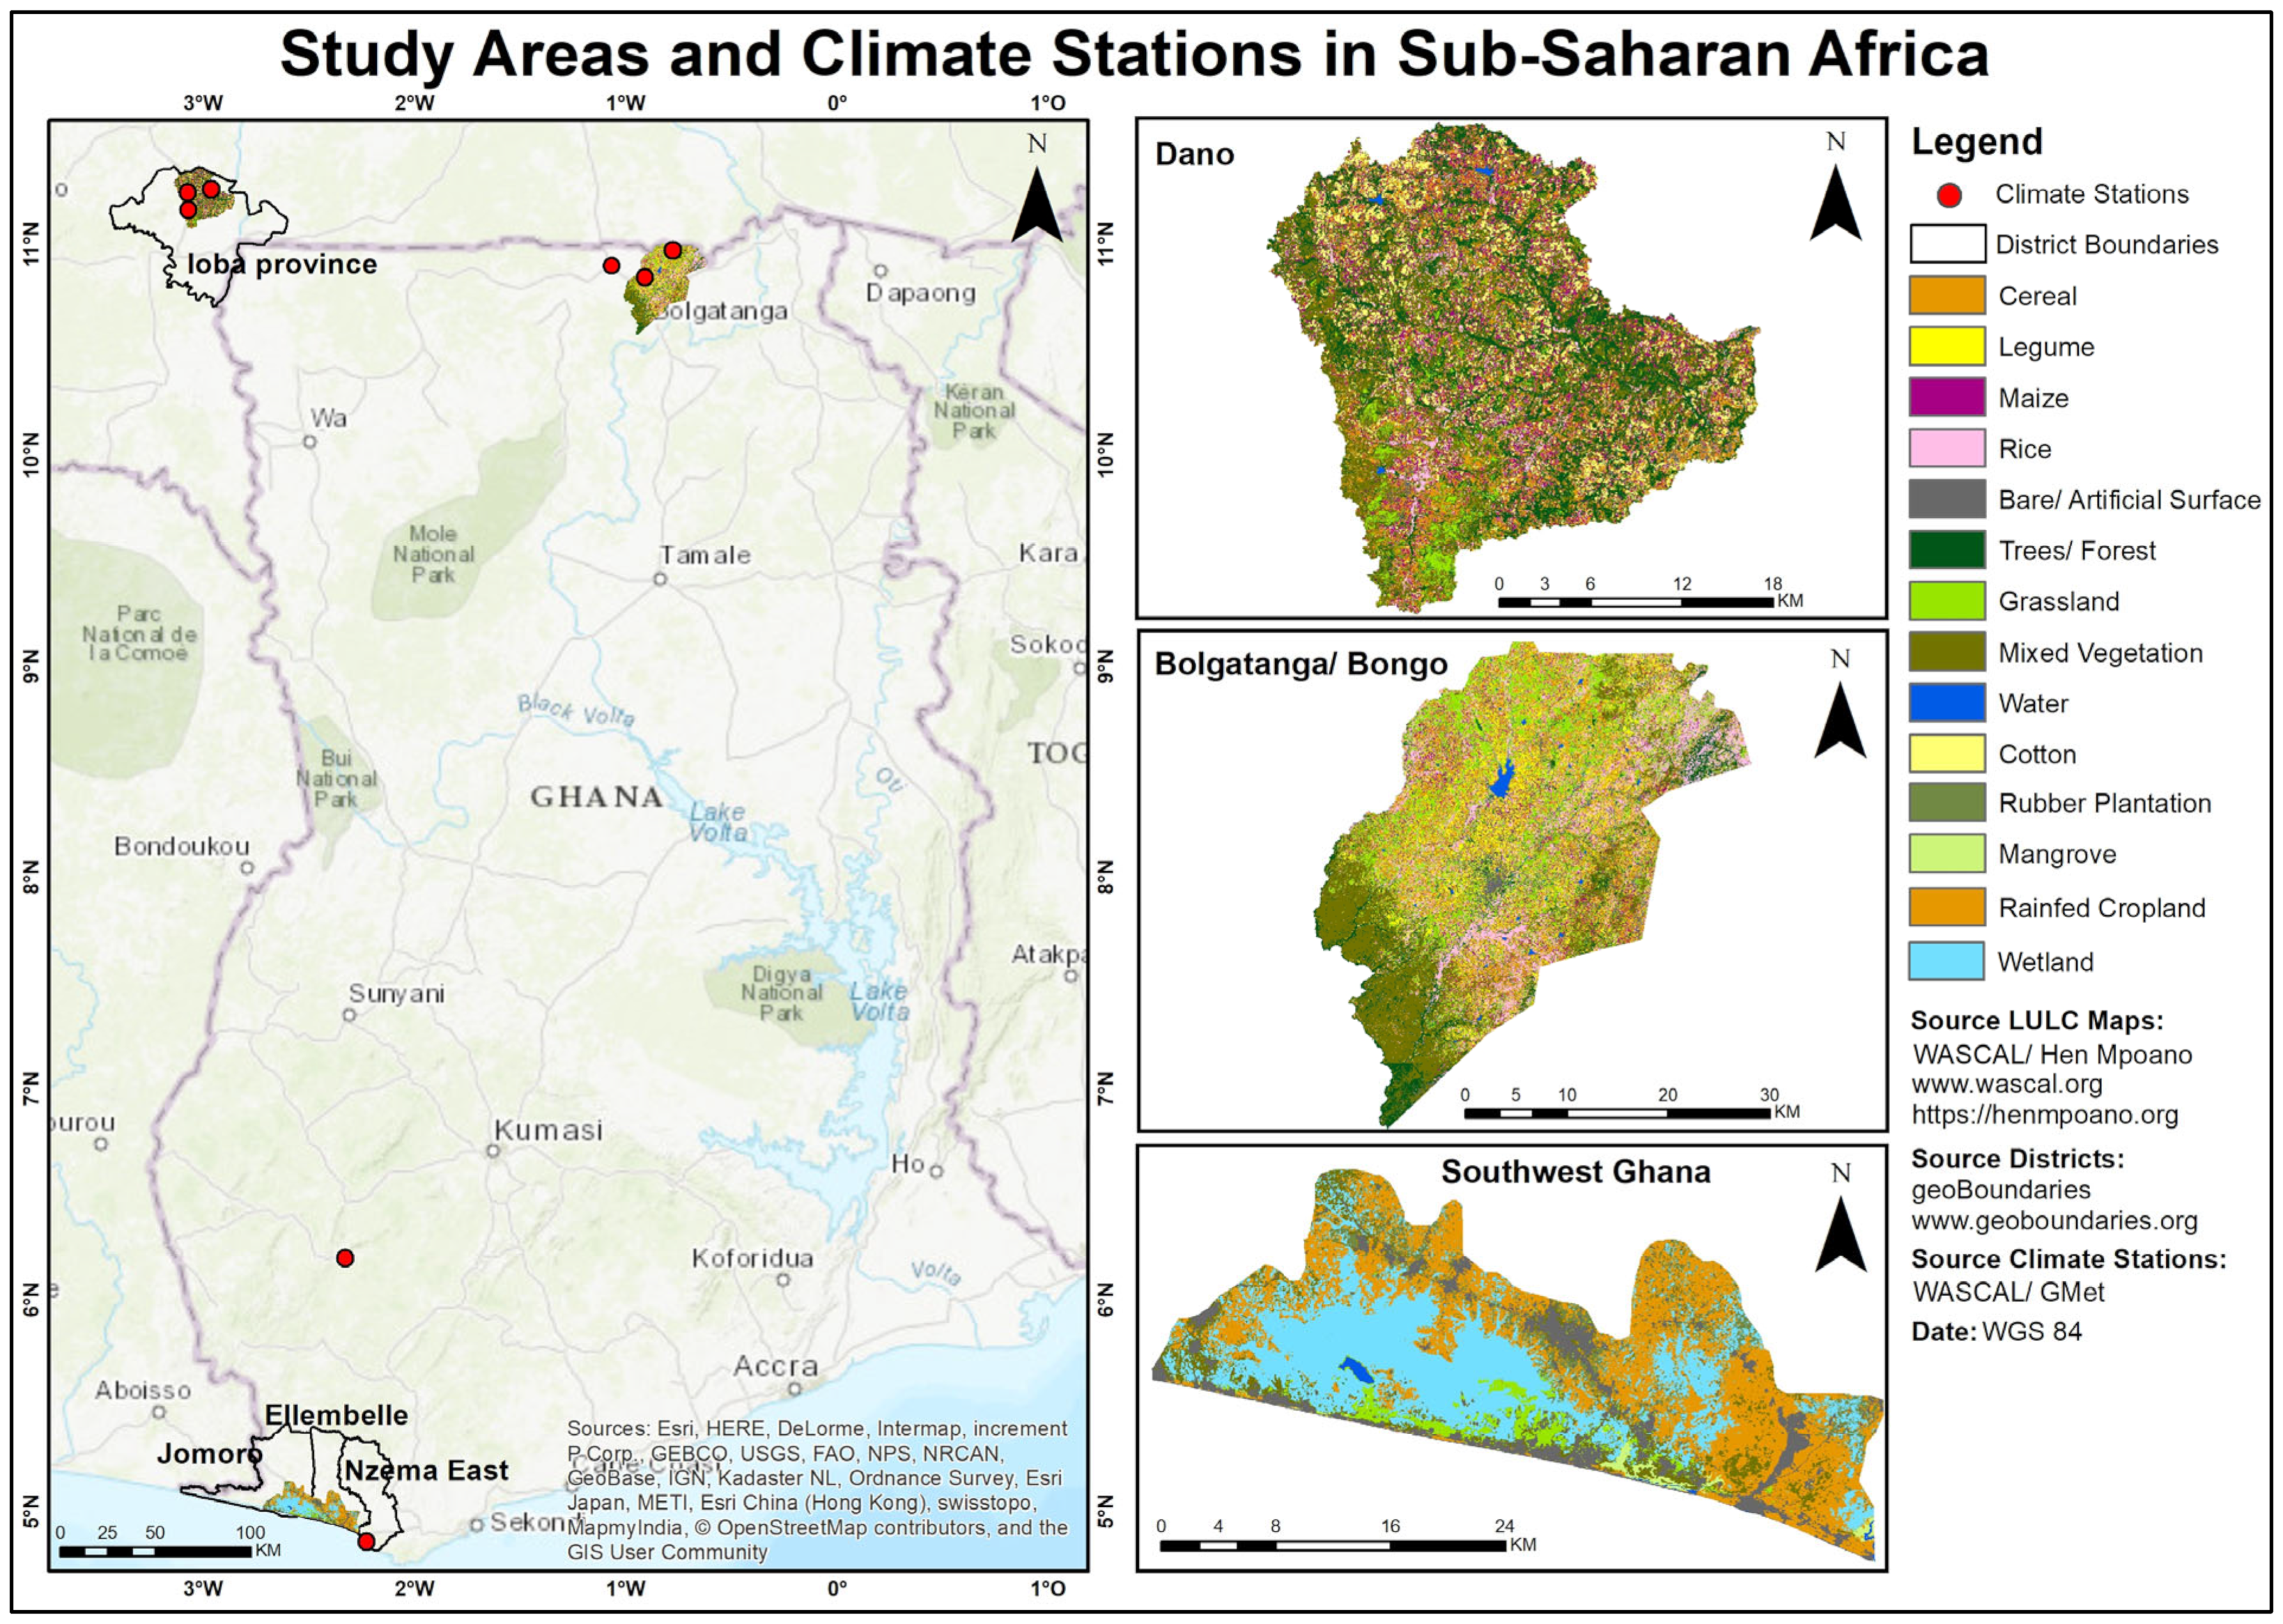
2.1. Study Areas
2.2. Method
2.2.1. Climate Time Series
2.2.2. Agricultural Time Series and Food Consumption Data
2.2.3. Census Information
2.2.4. Statistical Analysis
3. Results
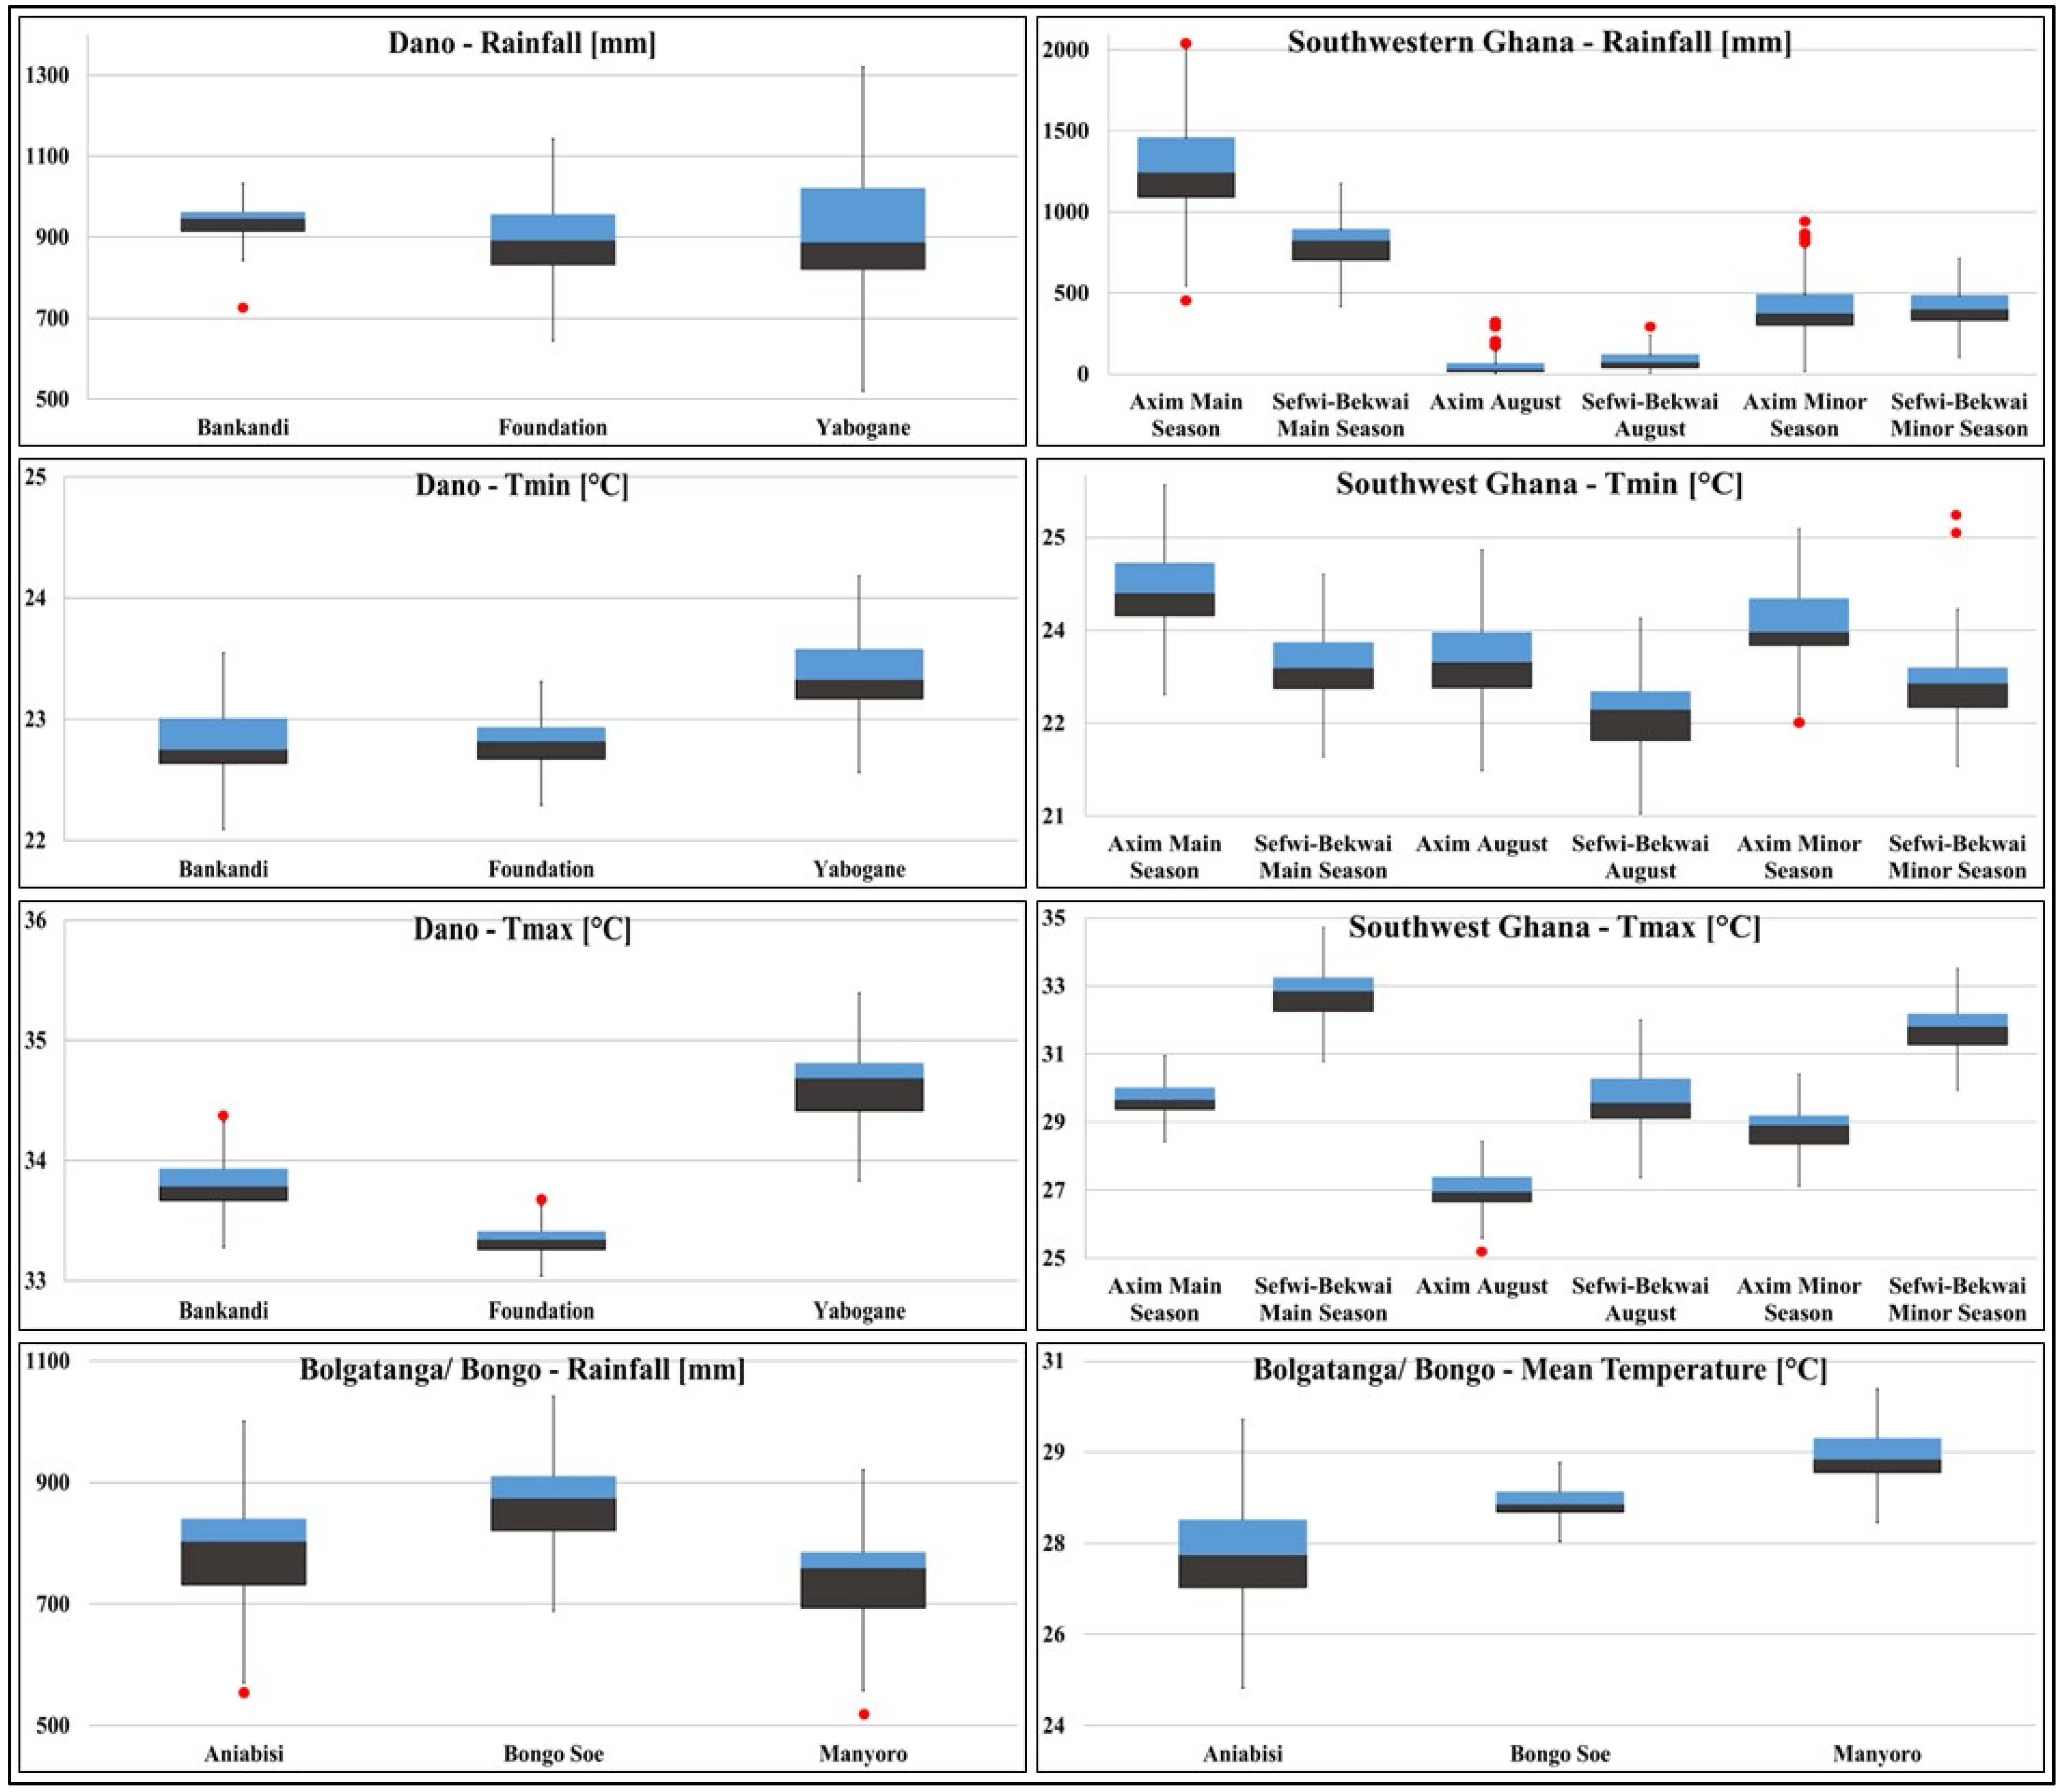
3.1. Climate
3.2. Crop Yield
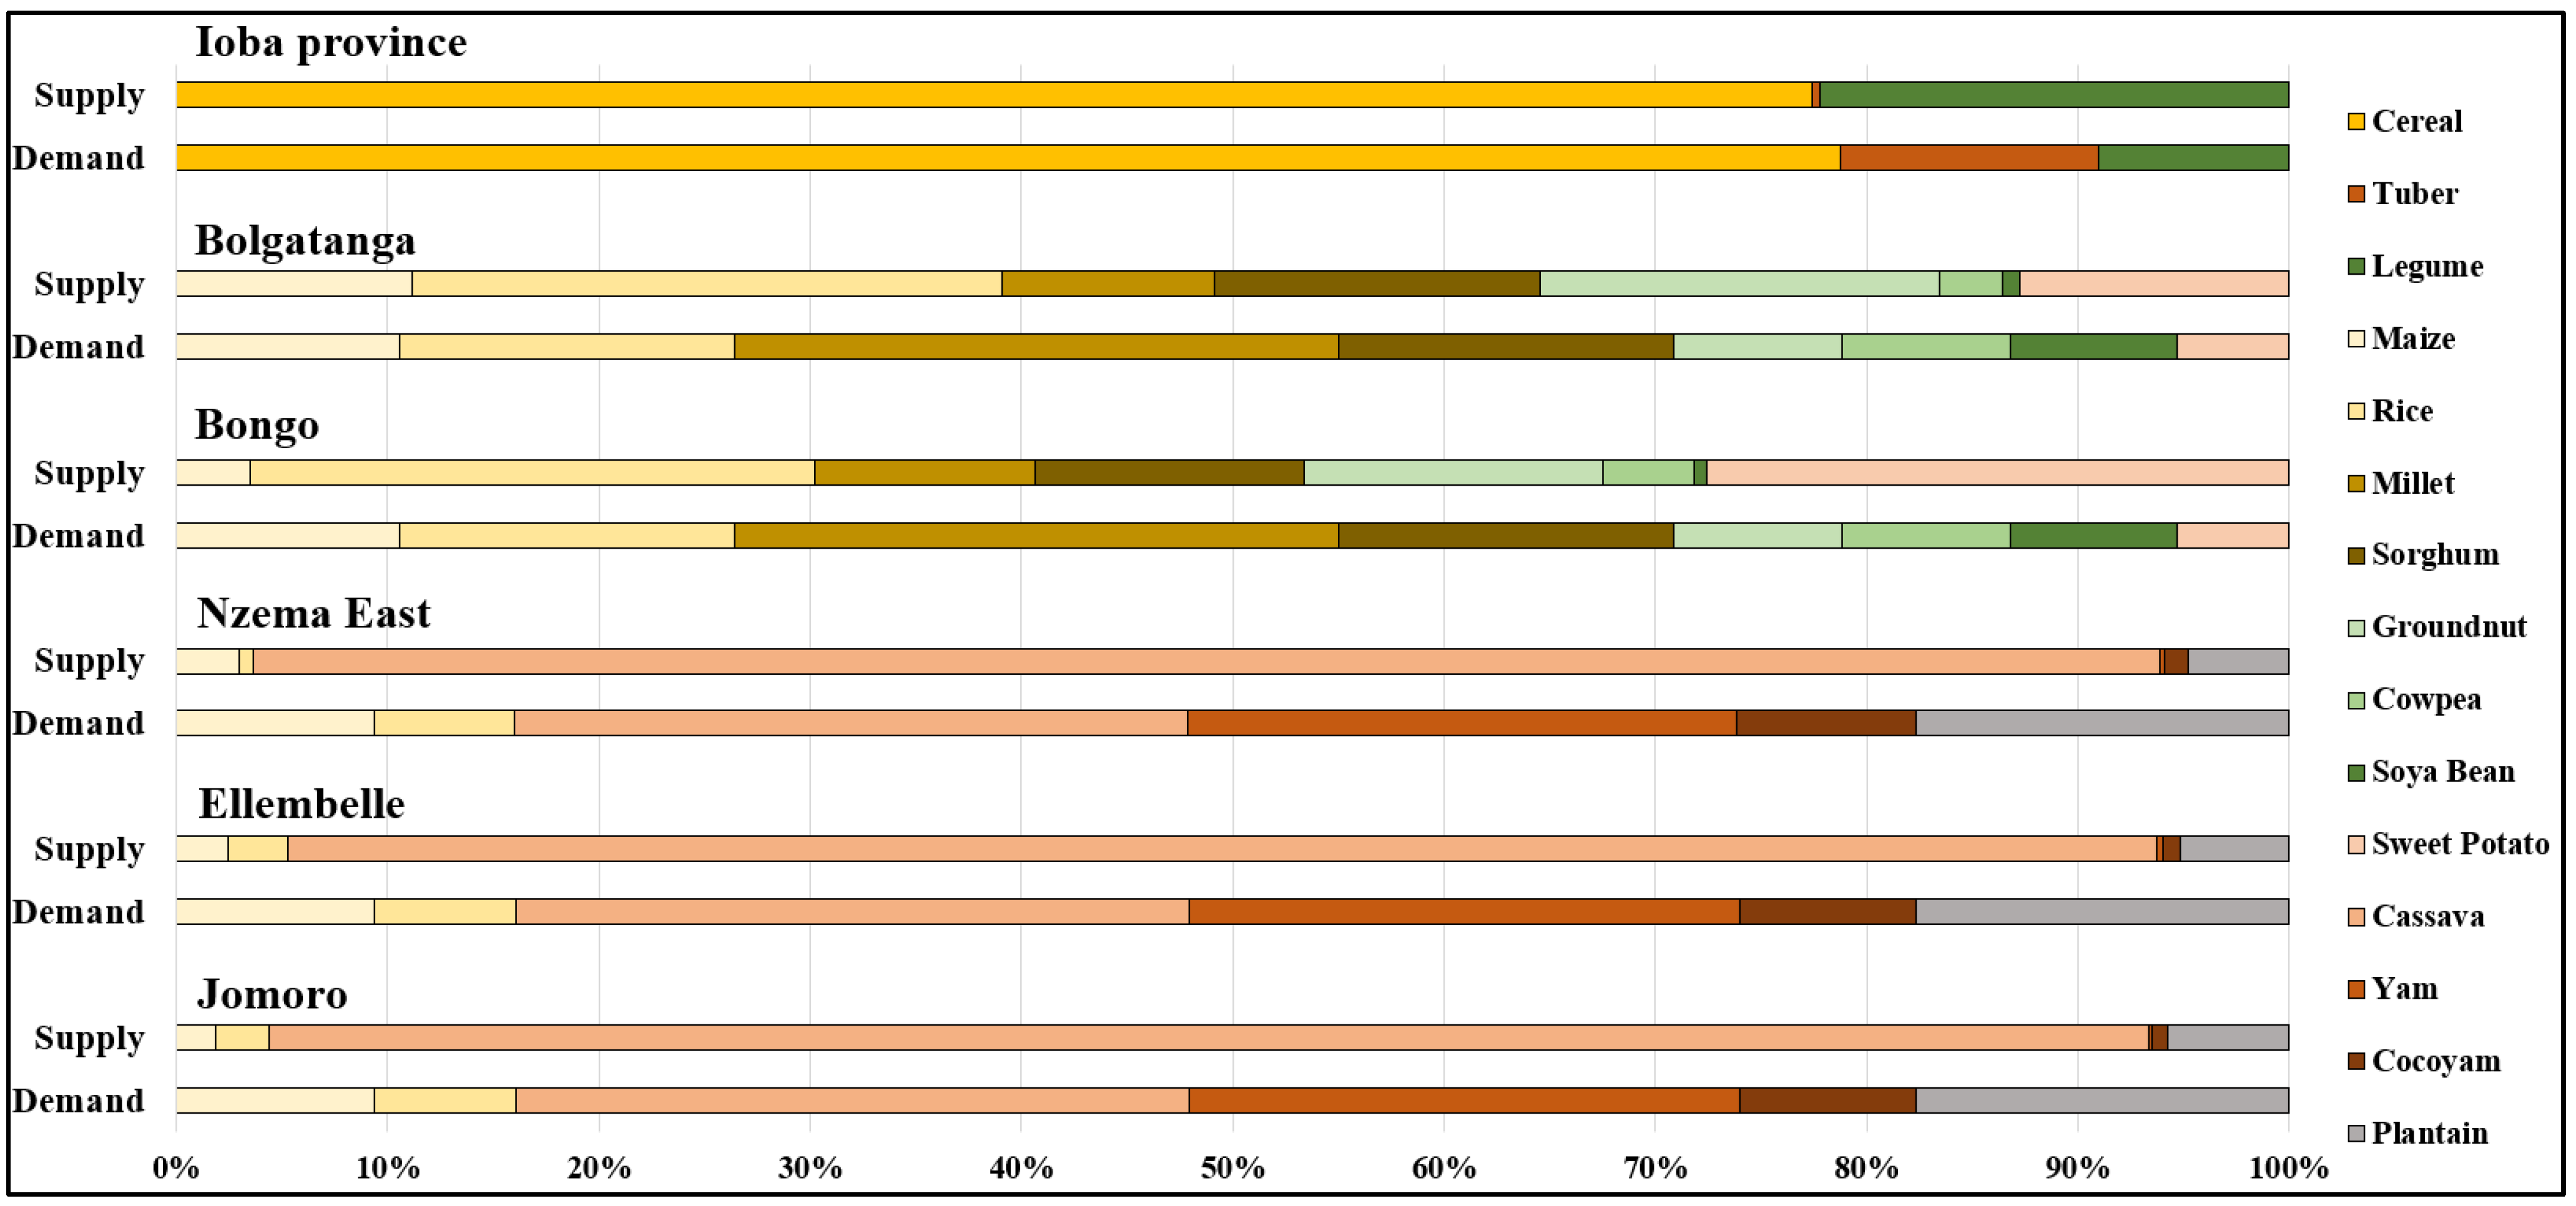
3.3. Food Balance Sheets
4. Discussion
4.1. Climate Variability
4.2. Effects on Agricultural Yield
4.3. Demand and Food Production
5. Conclusions
Author Contributions
Funding
Data Availability Statement
Acknowledgments
Conflicts of Interest
References
- Dibi-Anoh, P.A.; Koné, M.; Gerdener, H.; Kusche, J.; N’Da, C.K. Hydrometeorological Extreme Events in West Africa: Droughts. Surv. Geophys. 2023, 44, 173–195. [Google Scholar] [CrossRef]
- Sultan, B.; Gaetani, M. Agriculture in West Africa in the Twenty-First Century: Climate Change and Impacts Scenarios, and Potential for Adaptation. Front. Plant Sci. 2016, 7, 1262. [Google Scholar] [CrossRef] [PubMed]
- Okafor, G.C.; Larbi, I.; Chukwuma, E.C.; Nyamekye, C.; Limantol, A.M.; Dotse, S.-Q. Local climate change signals and changes in climate extremes in a typical Sahel catchment: The case of Dano catchment, Burkina Faso. Environ. Chall. 2021, 5, 100285. [Google Scholar] [CrossRef]
- Diallo, M.; Wouterse, F. Agricultural development promises more growth and less poverty in Africa: Modelling the potential impact of implementing the Comprehensive Africa Agriculture Development Programme in six countries. Dev. Policy Rev. 2022, 41, e12669. [Google Scholar] [CrossRef]
- Sultan, B.; Defrance, D.; Iizumi, T. Evidence of crop production losses in West Africa due to historical global warming in two crop models. Sci. Rep. 2019, 9, 12834. [Google Scholar] [CrossRef] [PubMed]
- Mechiche-Alami, A.; Abdi, A.M. Agricultural productivity in relation to climate and cropland management in West Africa. Sci. Rep. 2020, 10, 3393. [Google Scholar] [CrossRef]
- Juju, D.; Baffoe, G.; Dam Lam, R.; Karanja, A.; Naidoo, M.; Ahmed, A.; Jarzebski, M.P.; Saito, O.; Fukushi, K.; Takeuchi, K.; et al. Sustainability Challenges in Sub-Saharan Africa in the Context of the Sustainable Development Goals (SDGs). In Sustainability Challenges in Sub-Saharan Africa I. Continental Perspectives and Insights from Western and Central Africa, 1st ed.; Gasparatos, A., Ahmed, A., Naidoo, M., Karanja, A., Fukushi, K., Saito, O., Takeuchi, K., Eds.; Springer: Singapore, 2020; pp. 3–50. [Google Scholar] [CrossRef]
- Van Ittersum, M.K.; van Bussel, L.G.J.; Wolf, J.; Grassini, P.; van Wart, J.; Guilpart, N.; Claessens, L.; de Groot, H.; Wiebe, K.; Mason-D’Croz, D.; et al. Can sub-Saharan Africa feed itself? Proc. Natl. Acad. Sci. USA 2016, 113, 14964–14969. [Google Scholar] [CrossRef]
- FAOSTAT. FAOSTAT Statistical Database. Crops and Livestock Products; FAO: Rome, Italy; Available online: https://www.fao.org/faostat/en/#data/QCL (accessed on 9 January 2024).
- Kaboré, N.P.; Ouédraogo, A.; Some, L.; Millogo-Rasolodimby, J. The driving factors of dry cereals production in the Sudano-Sahelian zone of Burkina Faso. Int. J. Innov. Appl. Stud. 2015, 11, 214–230. [Google Scholar]
- Egg, J.; Wade, I. Bilan et perspectives des cultures vivrières dans les pays du Sahel. Oléagineux Corps Gras Lipides 2006, 16, 285–291. [Google Scholar] [CrossRef][Green Version]
- Herrmann, S.M.; Brandt, M.; Rasmussen, K.; Fensholt, R. Accelerating land cover change in West Africa over four decades as population pressure increased. Commun. Earth Environ. 2020, 1, 53. [Google Scholar] [CrossRef]
- Assede, E.S.P.; Orou, H.; Biaou, S.S.H.; Geldenhuys, C.J.; Ahononga, F.C.; Chirwa, P.W. Understanding Drivers of Land-Use and Land Cover Change in Africa: A Review. Curr. Landsc. Ecol. Rep. 2023, 8, 62–72. [Google Scholar] [CrossRef]
- Defrance, D.; Sultan, B.; Castets, M.; Famien, A.; Baron, C. Impact of Climate Change in West Africa on Cereal Production Per Capita in 2050. Sustainability 2020, 12, 7585. [Google Scholar] [CrossRef]
- FAO; IFAD; UNICEF; WFP; WHO. The State of Food Security and Nutrition in the World 2019; Safeguarding against Economic Slowdowns and Downturns; FAO: Rome, Italy; Available online: www.fao.org/3/ca5162en/ca5162en.pdf (accessed on 23 October 2022).
- Nwozor, A.; Olanrwwaju, J.S. The ECOWAS agricultural policy and the quest for food security: Assessing Nigeria’s implementation strategies. Dev. Stud. Res. 2020, 7, 59–71. [Google Scholar] [CrossRef]
- Chemura, A.; Schauberger, B.; Gornott, C. Impacts of climate change on agro-climatic suitability of major food crops in Ghana. PLoS ONE 2020, 15, e0229881. [Google Scholar] [CrossRef] [PubMed]
- Balana, B.B.; Sanfo, S.; Barbier, B.; Williams, T.; Kolavalli, S. Assessment of flood recession agriculture for food security in Northern Ghana: An optimization modelling approach. Agric. Syst. 2019, 173, 536–543. [Google Scholar] [CrossRef]
- Atanga, R.A.; Tankpa, V. Climate Change, Flood Disaster Risk and Food Security Nexus in Northern Ghana. Front. Sustain. Food Syst. 2021, 5, 706721. [Google Scholar] [CrossRef]
- Turowska, Z.; Buttarelli, E.; Sombié, I.; Nisbett, N.; van den Bold, M.; Becquey, E. Stories of change in nutrition in Burkina Faso 1992–2018: A macro-level perspective. Food Sec. 2022, 15, 535–554. [Google Scholar] [CrossRef]
- Sorgho, R.; Mank, I.; Kagoné, M.; Souares, A.; Danquah, I.; Sauerborn, R. “We Will Always Ask Ourselves the Question of How to Feed the Family”: Subsistence Farmers’ Perceptions on Adaptation to Climate Change in Burkina Faso. Int. J. Environ. Res. Public Health 2020, 17, 7200. [Google Scholar] [CrossRef]
- Zhou, Y.; Staatz, J. Projected demand and supply for various foods in West Africa: Implications for investments and food policy. Food Policy 2016, 61, 198–212. [Google Scholar] [CrossRef]
- Heino, M.; Kinnunen, P.; Anderson, W.; Ray, D.K.; Puma, M.J.; Varis, O.; Siebert, S.; Kummu, M. Increased probability of hot and dry weather extremes during the growing season threatens global crop yields. Sci. Rep. 2023, 13, 3583. [Google Scholar] [CrossRef]
- Wheeler, T.; von Braun, J. Climate Change Impacts on Global Food Security. Science 2013, 341, 508. [Google Scholar] [CrossRef] [PubMed]
- Beck, H.E.; Zimmerann, N.E.; McVicar, T.R.; Vergopolan, N.; Berg, A.; Wood, E.F. Data Descriptor: Present and future Köppen-Geiger climate classification maps at 1-km resolution. Sci. Data 2018, 5, 180214. [Google Scholar] [CrossRef] [PubMed]
- Op de Hipt, F.; Diekkrüger, B.; Steup, G.; Yira, Y.; Hoffmann, T.; Rode, M. Applying SHETRAN in a Tropical West African Catchment (Dano, Burkina Faso)-Calibration, Validation, Uncertainty Assessment. Water 2017, 9, 101. [Google Scholar] [CrossRef]
- Houessionon, P.; Fonta, W.M.; Bossa, A.Y.; Sanfo, S.; Thiombiano, N.; Zahonogo, P.; Yameogo, T.B.; Balana, B. Economic Valuation of Ecosystem Services from Small-Scale Agricultural Management Interventions in Burkina Faso: A Discrete Choice Experiment Approach. Sustainability 2017, 9, 1672. [Google Scholar] [CrossRef]
- Callo-Concha, D.; Gaiser, T.; Webber, H.; Tischbein, B.; Müller, M.; Ewert, F. Farming in the West African Sudan Savanna: Insights in the context of climate change. Afr. J. Agric. Res. 2013, 8, 4693–4705. [Google Scholar] [CrossRef]
- Baidu, N.; Amekudzi, L.K.; Aryee, J.N.A.; Annor, T. Assessment of Long-Term Spatio-Temporal Rainfall Variability over Ghana Using Wavelet Analysis. Climate 2017, 5, 30. [Google Scholar] [CrossRef]
- Yaméogo, T.B.; Bossa, A.Y.; Torou, B.M.; Fusillier, J.L.; Da, D.E.C.; Yira, Y.; Serpantié, G.; Somé, F.; Dama-Balima, M.M. Socio-Economic Factors Influencing Small-Scale Farmers’ Market Participation: Case of Rice Producers in Dano. Sustainability 2018, 10, 4354. [Google Scholar] [CrossRef]
- Callo-Concha, D. Farmer Perceptions and Climate Change Adaptation in the West African Sudan Savannah: Reality Check in Dassari, Benin, and Dano, Burkina Faso. Climate 2018, 6, 44. [Google Scholar] [CrossRef]
- Chiti, T.; Grieco, E.; Perugini, L.; Rey, A.; Valentini, R. Effect of the replacement of tropical forests with tree plantations on soil organic carbon levels in the Jomoro district, Ghana. Plant Soil 2014, 375, 47–59. [Google Scholar] [CrossRef]
- Laudien, R.; Schauberger, B.; Waid, J.; Gornott, C. A forecast of staple crop production in Burkina Faso to enable early warnings of shortages in domestic food availability. Sci. Rep. 2022, 12, 1638. [Google Scholar] [CrossRef]
- Institut National de la Statistique et de la Démographie (INSD). Cinquième Recensement Général de la Population et de l’Habitation du Burkina Faso. Résultats Préliminaires. Available online: http://cns.bf/IMG/pdf/rapport_preliminaire_rgph_2019.pdf (accessed on 11 May 2022).
- Ghana Statistical Service (GSS). Ghana 2021 Population and Housing Census. General Report Volume 3A. Population of Regions and Districts. Available online: https://statsghana.gov.gh/gssmain/fileUpload/pressrelease/2021%20PHC%20General%20Report%20Vol%203A_Population%20of%20Regions%20and%20Districts_181121.pdf (accessed on 15 May 2022).
- Gray, L. Cotton production in Burkina Faso: International rhetoric versus local realities. In Hanging by a Thread: Cotton, Globalization and Poverty in Africa, 1st ed.; Gray, L.C., Moseley, W.G., Eds.; Ohio University Press: Athens, OH, USA, 2008; pp. 65–82. [Google Scholar]
- Koranteng, A.; Zawila-Niedzwiecki, T. Forest Loss and Other Dynamic Land Use Changes in the Western Region of Ghana. J. Environ. Prot. Sustain. Dev. 2016, 2, 7–16. [Google Scholar]
- Akparibo, R.; Aryeetey, R.N.O.; Asamane, E.A.; Osei-Kwasi, H.A.; Ioannou, E.; Infield Solar, G.; Cormie, V.; Pereko, K.K.; Amagloh, F.K.; Caton, S.J.; et al. Food Security in Ghanaian Urban Cities: A Scoping Review of the Literature. Nutrients 2021, 13, 3615. [Google Scholar] [CrossRef]
- Issahaku, A.R.; Campion, B.B.; Edziyie, R. Rainfall and temperature changes and variability in the Upper East Region of Ghana. Earth Space Sci. 2016, 3, 284–294. [Google Scholar] [CrossRef]
- Ministry of Food and Agriculture (MOFA). Agriculture in Ghana. Facts and Figures. 2018. Available online: https://mofa.gov.gh/site/images/pdf/AGRIC%20IN%20GHANA%20F&F_2018.pdf (accessed on 12 May 2022).
- Ministry of Food and Agriculture (MOFA). A Report on Rainfed Crop and Livestock Performance—2018 (Holders, Area, Yields & Production). Unpublished.
- Ministère de l’Agriculture de l’Hydraulique et des Ressources Halieutiques (MAHRH). Results Previsionels de la Campagne Agricole et de la Situation Alimentaire et Nutritionnelle 2011/2012. Available online: http://cns.bf/IMG/pdf/masa_rdca_2011-2012.pdf (accessed on 21 May 2022).
- Institut National de la Statistique et de la Démographie (INSD). Recensement General de la Population et de L’habitation 2006. Resultates Definites. Available online: http://www.cns.bf/IMG/pdf/RGPH_2006.pdf (accessed on 21 May 2022).
- Ghana Statistical Service (GSS). 2010 Population and Housing Census. National Analytical Report. Available online: https://statsghana.gov.gh/gssmain/fileUpload/pressrelease/2010_PHC_National_Analytical_Report.pdf (accessed on 14 May 2022).
- Ghana Statistical Service (GSS). 2010 Population and Housing Census. District Analytical Report. Bolgatanga Municipality. Available online: https://www2.statsghana.gov.gh/docfiles/2010_District_Report/Upper%20East/Bolga.pdf (accessed on 14 May 2022).
- Ghana Statistical Service (GSS). 2010 Population and Housing Census. District Analytical Report. Bongo District. Available online: https://www2.statsghana.gov.gh/docfiles/2010_District_Report/Upper%20East/Bongo.pdf (accessed on 14 May 2022).
- Ghana Statistical Service (GSS). 2010 Population and Housing Census. District Analytical Report. Nzema East Municipality. Available online: https://www2.statsghana.gov.gh/docfiles/2010_District_Report/Western/NZEMA%20EAST.pdf (accessed on 14 May 2022).
- Ghana Statistical Service (GSS). 2010 Population and Housing Census. District Analytical Report. Ellembelle District. Available online: https://www2.statsghana.gov.gh/docfiles/2010_District_Report/Western/Ellembelle.pdf (accessed on 14 May 2022).
- Ghana Statistical Service (GSS). 2010 Population and Housing Census. District Analytical Report. Jomoro District. Available online: https://www2.statsghana.gov.gh/docfiles/2010_District_Report/Western/JOMORO.pdf (accessed on 14 May 2022).
- Nikolić-Đorić, E.; Čobanovič, K.; Lozanov-Crvenković, Z. Statistical Graphics and Experimental Data. ICOTS-7 Proc. 2006, 1–4. [Google Scholar]
- Abbam, T.; Johnson, F.A.; Dash, J.; Padmadas, S.S. Spatiotemporal variations in rainfall and temperature in Ghana over the twentieth century, 1900–2014. Earth Space Sci. 2018, 5, 120–132. [Google Scholar] [CrossRef]
- Ringard, J.; Chiriaco, M.; Bastin, S.; Habets, F. Recent trends in climate variability at the local scale using 40 years of observations: The case of the Paris region of France. Atmos. Chem. Phys. 2019, 19, 13129–13155. [Google Scholar] [CrossRef]
- Zaghloul, M.S.; Ghaderpour, E.; Dastour, H.; Farjad, B.; Gupta, A.; Eum, H.; Achari, G.; Hassan, Q.K. Long Term Trend Analysis of River Flow and Climate in Northern Canada. Hydrology 2022, 9, 197. [Google Scholar] [CrossRef]
- Sen, P.K. Estimates of the regression coefficient based on Kendall’s Tau. J. Am. Stat. Assoc. 1968, 63, 1379–1389. [Google Scholar] [CrossRef]
- Gleisberg-Gerber, K. Livelihoods and Land Management in the Ioba Province in South-Western Burkina Faso; ZEF Working Paper Series 91; Center for Development Research: Bonn, Germany, 2012; ISSN 1864-6638. [Google Scholar]
- Sugri, I.; Abubakari, M.; Owusu, R.K.; Bidzakin, J.K. Postharvest losses and mitigating technologies: Evidence from Upper East Region in Ghana. Sustain. Futures 2021, 3, 100048. [Google Scholar] [CrossRef]
- Kasei, R.; Diekkrüger, B.; Leemhuis, C. Drought frequency in the Volta Basin of West Africa. Sustain. Sci. 2010, 5, 89–97. [Google Scholar] [CrossRef]
- Nouaceur, Z.; Murarescu, O. Rainfall Variability and Trend Analysis of Rainfall in West Africa (Senegal, Mauritania, Burkina Faso). Water 2020, 12, 1754. [Google Scholar] [CrossRef]
- Hoerling, M.; Hurrell, J.; Eischeid, J.; Phillips, A. Detection and attribution of twentieth-century northern and southern African rainfall change. J. Clim. 2006, 19, 3989–4008. [Google Scholar] [CrossRef]
- De Longueville, F.; Hountondji, Y.C.; Kindo, I.; Gemenne, F.; Ozer, P. Long-term analysis of rainfall and temperature data in Burkina Faso (1950–2013). Int. J. Climatol. 2016, 36, 4393–4405. [Google Scholar] [CrossRef]
- Ayumah, R.; Asante, F.; Guodaar, L.; Eshun, G. How Do Climate and Nonclimatic Variables Influence the Production of Agricultural Staple Crops in Vulnerable Rural Communities in the Bawku Municipality of Northern Ghana? Adv. Agric. 2020, 2020, 6484019. [Google Scholar] [CrossRef]
- Asante, F.A.; Amuakwa-Mensah, F. Climate Change and Variability in Ghana: Stocktaking. Climate 2015, 3, 78–99. [Google Scholar] [CrossRef]
- Baffour-Ata, F.; Antwi-Agyei, P.; Nkiaka, E.; Dougill, A.J.; Anning, A.K.; Kwakye, S.O. Effect of climate variability on yields of selected staple food crops in northern Ghana. J. Agric. Food Res. 2021, 6, 100205. [Google Scholar] [CrossRef]
- Asare-Nuamah, P.; Botchway, E. Understanding climate variability and change: Analysis of temperature and rainfall across agroecological zones in Ghana. Heliyon 2019, 5, E02654. [Google Scholar] [CrossRef]
- Klein, C.; Nkrumah, F.; Taylor, C.M.; Adefisan, E.A. Seasonality and Trends of Drivers of Mesoscale Convective Systems in Southern West Africa. J. Clim. 2021, 34, 71–87. [Google Scholar] [CrossRef]
- Braimah, M.; Asante, V.A.; Ahiatku, M.A.; Ansah, S.O.; Otu-Larbi, F.; Yahaya, B.; Ayabilah, J.B.; Nkrumah, F. Variability of the Minor Season Rainfall over Southern Ghana (1981–2018). Adv. Meteorol. 2022, 2022, 1861130. [Google Scholar] [CrossRef]
- MacCarthy, D.S.; Adiku, S.G.K.; Freduah, B.S.; Gbefo, F.; Kamara, A.Y. Using CERES-Maize and ENSO as Decision Support Tools to Evaluate Climate-Sensitive Farm Management Practices for Maize Production in the Northern Regions of Ghana. Front. Plant Sci. 2017, 8, 31. [Google Scholar] [CrossRef]
- Duvallet, M.; Dumas, P.; Makowski, D.; Boé, J.; Mendez del Villar, P.; Ben-Ari, T. Rice yield stability compared to major food crops in West Africa. Environ. Res. Lett. 2021, 6, 124005. [Google Scholar] [CrossRef]
- Derbile, E.K.; Bonye, S.Z.; Yiridomoh, G.Y. Mapping vulnerability of smallholder agriculture in Africa: Vulnerability assessment of food crop farming and climate change adaptation in Ghana. Environ. Chall. 2022, 8, 100537. [Google Scholar] [CrossRef]
- Tiama, D.; Zoundjihekpon, J.; Sawadogo, N.; Nebie, B. Agro-morphological characterization of yams (Dioscorea sp.) of Passoré in Burkina Faso. J. Appl. Environ. Biol. Sci. 2016, 6, 1. [Google Scholar]
- Heller, O.; Kiba, D.I.; Do Zida, K.W.; Schneider, K.; Kouame, H.K.V.; Traoré, O.Y.A.; Siegrist, M.; Frossard, E. Interdisciplinary Assessment of Market Oriented Yam Cultivation in Semi-arid Burkina Faso. Front. Agron. 2022, 4, 828305. [Google Scholar] [CrossRef]
- Ahmad, S.; Smale, M.; Theriault, V.; Maiga, E. Input subsidies and crop diversity on family farms in Burkina Faso. J. Agric. Econ. 2022, 74, 237–254. [Google Scholar] [CrossRef]
- Boafo, Y.A.; Siddighi Balde, B.; Saito, O.; Gasparatos, A.; Dam Lam, R.; Ouedraogo, N.; Chamba, E.; Moussa, Z.P. Stakeholder perceptions of the outcomes of reforms on the performance and sustainability of the cotton sector in Ghana and Burkina Faso: A tale of two countries. Cogent Food Agric. 2018, 4, 1477541. [Google Scholar] [CrossRef]
- Ragasa, C.; Chapoto, A.; Kolavalli, S. Maize Productivity in Ghana. Ghana Strategic Support Program. Policy Note #5. Available online: https://ebrary.ifpri.org/digital/api/collection/p15738coll2/id/128263/download (accessed on 24 October 2022).
- Naab, J.B.; Mahama, G.B.; Koo, J.; Jones, J.W.; Boote, K.J. Nitrogen and phosphorus fertilization with crop residue retention enhances crop productivity, soil organic carbon, and total soil nitrogen concentrations in sandy-loam soils in Ghana. Nutr. Cycl. Agroecosyst. 2015, 102, 33–45. [Google Scholar] [CrossRef]
- Azu, E.; Elegba, W.; Tweneboah Asare, A.; Kwaku Blege, P.; Mensah Amoatey, H.; Yirenkyi Danquah, E. Responses of smallholder farmers on sorghum production preferences and constraints in the Upper East Region of Ghana. J. Agric. Ext. Rural Dev. 2021, 13, 202–216. [Google Scholar] [CrossRef]
- Boukar, O.; Belko, N.; Chamarthi, S.; Togola, A.; Batieno, J.; Owusu, E.; Haruna, M.; Diallo, S.; Lawan Umar, M.; Olufajo, O.; et al. Cowpea (Vigna unguiculata): Genetics, genomics and breeding. Plant Breed. 2018, 138, 415–424. [Google Scholar] [CrossRef]
- Gage, D.; Bangnikon, J.; Abeka-Afari, H.; Hanif, C.; Addaquay, J.; Antwi, V.; Hale, A. The Market for Maize, Rice, Soy, and Warehousing in Northern Ghana. Available online: https://pdf.usaid.gov/pdf_docs/PA00J9V2.pdf (accessed on 14 October 2022).
- Akabo Asodina, F.; Adams, F.; Nimoh, F.; Owusu Asante, B.; Mensah, A. Performance of smallholder soybean farmers in Ghana; Evidence from Upper West Region of Ghana. J. Agric. Food Res. 2021, 4, 100120. [Google Scholar] [CrossRef]
- Abdullah, K.; Tampuli Abukari, A.B.; Abdulai, A.M. Testing the climate resilience of sorghum and millet with time series data. Cogent Food Agric. 2022, 8, 2088459. [Google Scholar] [CrossRef]
- Sugri, I.; Kissinger Maalekuu, B.; Gaveh, E.; Kusi, F. Sweet Potato Value Chain Analysis Reveals Opportunities for Increased Income and Food Security in Northern Ghana. Adv. Agric. 2017, 2017, 8767340. [Google Scholar] [CrossRef]
- Padi, M. Food Crop Farming and the Climate in Southern Ghana. Acta Sci. Agric. 2018, 2, 23–26. [Google Scholar]
- PricewaterhouseCoopers (PwC). Positioning Nigeria as Africa’s Leader in Maize Production for AfCFTA. Available online: https://www.pwc.com/ng/en/assets/pdf/positioning-nigeria-as-africa-leader-in-maize-production-for-afcfta.pdf (accessed on 11 July 2022).
- Angelucci, F. Analysis of Incentives and Disincentives for Cassava in Ghana. Available online: https://www.fao.org/3/a-at547e.pdf (accessed on 12 September 2022).
- Acheampong, P.P.; Addlson, M.; Wongnaa, C.A. Assessment of impact of adaptation of improved cassava varieties on yields in Ghana: An endogenous switching approach. Cogent Econ. Finance 2022, 10, 2008587. [Google Scholar] [CrossRef]
- Acheampong, P.P.; Osei-Adu, J.; Amengo, E.; Sagoe, R. Cocoyam Value Chain and Benchmark Study in Ghana. Available online: https://doi.org/10.13140/RG.2.1.4295.6326 (accessed on 11 July 2022).
- Chemura, A.; Kutywayo, D.; Hikwa, D.; Gornott, C. Climate change and cocoyam (Colocasia esculenta (L.) Schott) production: Assessing impacts and potential adaptation strategies in Zimbabwe. Mitig. Adapt. Strateg. Glob. Chang. 2022, 27, 42. [Google Scholar] [CrossRef]
- Tortoe, C.; Quaye, W.; Akonor, P.T.; Yeboah, C.O.; Buckmann, E.S.; Yamoah Asafu-Adjaye, N. Biomass-based value chain analysis of plantain in two regions in Ghana. Afr. J. Sci. Technol. Innov. Dev. 2020, 13, 213–222. [Google Scholar] [CrossRef]
- Dzomeku, B.M.; Dankyi, A.A.; Darkey, S.K. Socioeconomic importance of plantain cultivation in Ghana. J. Anim. Plant Sci. 2011, 21, 269–273. [Google Scholar]
- Famine Early Warning Systems Network (FEWS NET). BURKINA FASO Staple Food and Livestock Market Fundamentals. Available online: https://fews.net/sites/default/files/documents/reports/FEWS%20NET%20BurkinaFaso%20MFR_final_20170929_0.pdf (accessed on 18 September 2022).
- Elbehri, A. Rebuilding West Africa’s Food Potential: Policies and Market Incentives for Smallholder-Inclusive Food Value Chains. Available online: http://www.fao.org/3/a-i3222e.pdf (accessed on 24 September 2022).
- Knauer, K.; Gessner, U.; Fensholt, R.; Forkour, G.; Kuenzer, C. Monitoring Agricultural Expansion in Burkina Faso over 14 Years with 30 m Resolution Time Series: The Role of Population Growth and Implications for the Environment. Remote Sens. 2017, 9, 132. [Google Scholar] [CrossRef]
- USAID. Resilience and Economic Growth in the Sahel—Accelerated Growth (REGIS-AG). Value Chain and End Market Assessment: Cowpea. Available online: https://2017-2020.usaid.gov/sites/default/files/documents/1860/USAID_REGIS-AG_Cowpea_Value_Chain_and_End_Market_Assessment.pdf (accessed on 22 September 2022).
- Nanéma, R.K.; Sawadogo, N.; Traoré, R.E.; Ba, A.H. Marketing Potentialities and Constraints for Frafra Potato: Case of the Main Markets of Ouagadougou (Burkina Faso). J. Plant Sci. 2017, 5, 191–195. [Google Scholar]
- Karg, H.; Drechsel, P.; Akoto-Danso, E.K.; Glaser, R.; Nyarko, G.; Buerkert, A. Foodsheets and City Region Food Systems in Two West African Cities. Sustainability 2016, 8, 1175. [Google Scholar] [CrossRef]
- Tanko, M.; Ismaila, S.; Abu Sadiq, S. Planting for Food and Jobs (PFJ): A panacea for productivity and welfare of rice farmers in Northern Ghana. Cogent Econ. Finance 2019, 7, 1693121. [Google Scholar] [CrossRef]
- FAO; IFPRI. Ghana’s Maize Market. MOFA-IFPRI Market Brief No. 1. Available online: https://ebrary.ifpri.org/digital/api/collection/p15738coll2/id/133696/download (accessed on 18 October 2022).
- Darko-Koomson, S.; Aidoo, R.; Abdoulaye, T. Analysis of cassava value chain in Ghana: Implications for upgrading smallholder supply systems. J. Agribus. Dev. Emerg. Econ. 2020, 10, 217–235. [Google Scholar] [CrossRef]


| Station | Rainfall [mm] | Temperature [°C] | ||
|---|---|---|---|---|
| Min. | Max. | Mean | ||
| Dano [October 2012–December 2018] | ||||
| Bankandi | September 2012–December 2019 | September 2012–August 2018 | ||
| Foundation | September 2012–December 2018 | |||
| Yabogane | October 2012–December 2018 | |||
| Bolgatanga/Bongo [June 2014–July 2019] | ||||
| Aniabisi | May 2014 to November 2019 | May/2014 to November 2019 | ||
| Bongo Soe | September 2012 to November 2019 | September 2012 to November 2019 | ||
| Manyoro | June 2014 to September 2019 | June 2014 to September 2019 | ||
| Southwestern Ghana [January 1970–July 2015] | ||||
| Axim | January 1960 to October 2016 | January 1960–July 2015 | ||
| Sefwi-Bekwai | January 1964 to July 2016 | January 1964–August 2015 | ||
| Crop | Ioba Province [kg/year]|Time Period | Bolgatanga/Bongo [kg/year]|Time Period | Southwest Ghana [kg/year]|Time Period | |||
|---|---|---|---|---|---|---|
| Maize | 218 | 2001–2019 | 20 | 1991/93–2016 | 45 | 1991–2016 |
| Rice (milled) | 30 | 32 | ||||
| Millet | 54 | |||||
| White Sorghum | 2003–2019 | |||||
| Red Sorghum | ||||||
| Sorghum | 30 | 1991/93–2016 | ||||
| Cassava | 152.9 | 1991–2016 | ||||
| Sweet Potato | 10 | 2003–2016 | ||||
| Potato | 10 | 2001–2019 | ||||
| Yam | 125 | 1998/99–2016 | ||||
| Cocoyam (taro) | 40 | 1991–2016 | ||||
| Plantain | 84.8 | |||||
| Groundnut (seed) | 19 | 2001–2019 | 15 | 1991/93–2016 | ||
| Cowpea | 2003–2016 | |||||
| Soya Bean | ||||||
| Bambara Bean | ||||||
| Cotton | 2001–2019 | |||||
| Sesame | 16 | 2001–2019 | ||||
| Start Year | Census [No. of Residents] | End Year | Census [No. of Residents] | |
|---|---|---|---|---|
| Ioba province | 2006 | 192,321 | 2019 | 265,876 |
| Bolgatanga (including Bolgatanga East) | 2010 | 131,550 | 2021 | 178,688 |
| Bongo | 84,545 | 120,254 | ||
| Nzema East | 60,828 | 94,621 | ||
| Ellembelle | 87,501 | 120,893 | ||
| Jomoro | 150,107 | 126,576 |
| Station Name | Rainfall | Min. Temperature | Max. Temperature |
|---|---|---|---|
| Mean Temperature | |||
| Bankandi | Decreasing −|−6.60 | Increasing/ −|0.02 | Decreasing/ −|−0.06 |
| Foundation | Increasing −|38.79 | No Trend/ 0.02 | Decreasing/ −|−0.06 |
| Yabogane | Decreasing −|−5.80 | Increasing/ −|0.14 | Increasing/ −|0.14 |
| Aniabisi | Increasing −|68.99 | Decreasing/ −|−0.94 | |
| Bongo Soe | No Trend −4.47 | Decreasing/ +|−0.26 | |
| Manyoro | Increasing −|21.08 | Decreasing/ −|−0.45 | |
| Axim (main season) | Decreasing −|−2.55 | Increasing +++|0.03 | Increasing +++|0.02 |
| Axim (August) | Decreasing −|−0.11 | Increasing +++|0.02 | Increasing +++|0.02 |
| Axim (minor season) | Increasing −|3.34 | Increasing +++|0.03 | Increasing +++|0.02 |
| Sefwi-Bekwai (main season) | Increasing −|0.02 | Increasing +++|0.02 | Increasing +++|0.04 |
| Sefwi-Bekwai (August) | Decreasing −|−0.45 | Increasing +++|0.02 | Increasing +++|0.03 |
| Sefwi-Bekwai (minor season) | Increasing −|0.21 | Increasing +++|0.02 | Increasing +++|0.04 |
| Crop | Nzema East | Ellembelle | Jomoro | Bolgatanga | Bongo | Dano |
|---|---|---|---|---|---|---|
| Maize | Increasing ++|0.01 | Increasing −|0.01 | Increasing +|0.01 | Increasing +++|0.05 | Increasing +++|0.06 | Increasing +|0.03 |
| Rice | Increasing −|0.00 | Increasing −|0.00 | Decreasing −|0.00 | Increasing −|0.02 | Increasing +|0.04 | Increasing −|0.02 |
| Millet | Increasing −|0.00 | Decreasing −|−0.01 | Increasing −|0.01 | |||
| White Sorghum | Increasing −|0.02 | |||||
| Red Sorghum | Increasing +++|0.09 | |||||
| Sorghum | Increasing +|0.01 | Increasing −|0.01 | ||||
| Cassava | Increasing +++|0.09 | Increasing +++|0.06 | Increasing +++|0.12 | |||
| Sweet Potato | Decreasing +|−0.39 | Decreasing −|−0.22 | ||||
| Potato | Increasing −|0.38 | |||||
| Yam | Increasing −|0.05 | Increasing −|0.02 | Increasing +++|0.12 | Decreasing ++|−0.61 | ||
| Cocoyam | Increasing +++|0.07 | Increasing +++|0.04 | Increasing −|0.01 | |||
| Plantain | Increasing +++|0.30 | Increasing +++|0.06 | Increasing +++|0.29 | |||
| Groundnut | Increasing −|0.00 | Decreasing −|0.00 | Increasing −|0.01 | |||
| Cowpea | Decreasing −|−0.02 | Increasing +++|0.06 | Increasing −|0.02 | |||
| Soya Bean | Decreasing −|−0.02 | Increasing ++|0.04 | Increasing −|0.02 | |||
| Cotton | Increasing +|0.02 | |||||
| Sesame | Increasing −|0.07 | |||||
| Bambara Bean | Increasing −|0.03 | |||||
| Crops | Total Production [ton] | Net Production [ton] | Per Capita Consumption [kg/year] | Estimated Consumption [ton] | Surplus/Deficit [ton] |
|---|---|---|---|---|---|
| Ioba province [2009–2020]|∑ 4113.3 ton | |||||
| Cereals | 19,576.8 | 13,703.76 | 218 | 10,704.64 | 2999.12 |
| Legumes | 5619.41 | 3933.59 | 19 | 1228.79 | 2704.80 |
| Tubers | 95.19 | 66.63 | 10 | 1657.25 | −1590.62 |
| Bolgatanga [2011–2017]|∑ 221.2 ton | |||||
| Cereals | 5321.25 | 3937.79 | 134 | 4968.70 | −1030.91 |
| Legumes | 2637.14 | 1846 | 45 | 2224.79 | −378.79 |
| Sweet Potato | 4448.71 | 3114.10 | 10 | 1483.20 | 1630.90 |
| Bongo [2011–2017]|∑ 4846.77 ton | |||||
| Cereals | 3966.16 | 2961.56 | 134 | 3231.84 | −270.28 |
| Legumes | 2015.67 | 1410.97 | 45 | 1447.09 | −36.12 |
| Sweet Potato | 8739.86 | 6117.90 | 10 | 964.73 | 5153.17 |
| Nzema East [2011–2017]|∑ −193.33 ton | |||||
| Cereals | 1086.44 | 779.42 | 77 | 2770.16 | −1990.73 |
| Tubers | 19,610.77 | 13,727.54 | 317.90 | 7878.99 | 5848.55 |
| Plantain | 2929.12 | 2050.39 | 84.80 | 6101.54 | −4051.15 |
| Ellembelle [2011–2017]|∑ −13,617.47 ton | |||||
| Cereals | 839.58 | 630.39 | 77 | 3798.23 | −3167.84 |
| Tubers | 10,209.12 | 7146.38 | 317.90 | 10,454.18 | −3307.79 |
| Plantain | 1748.76 | 1224.13 | 84.80 | 8365.97 | −7141.84 |
| Jomoro [2011–2017]|∑ −16,188.82 ton | |||||
| Cereals | 1224.57 | 924.69 | 77 | 5420.86 | −4496.17 |
| Tubers | 18,171.64 | 12,720.15 | 317.90 | 14,920.27 | −2200.12 |
| Plantain | 3496.34 | 2447.44 | 84.80 | 11,939.97 | −9492.53 |
Disclaimer/Publisher’s Note: The statements, opinions and data contained in all publications are solely those of the individual author(s) and contributor(s) and not of MDPI and/or the editor(s). MDPI and/or the editor(s) disclaim responsibility for any injury to people or property resulting from any ideas, methods, instructions or products referred to in the content. |
© 2024 by the authors. Licensee MDPI, Basel, Switzerland. This article is an open access article distributed under the terms and conditions of the Creative Commons Attribution (CC BY) license (https://creativecommons.org/licenses/by/4.0/).
Share and Cite
Schultze, M.; Kankam, S.; Sanfo, S.; Fürst, C. Agricultural Yield Responses to Climate Variabilities in West Africa: A Food Supply and Demand Analysis. Land 2024, 13, 364. https://doi.org/10.3390/land13030364
Schultze M, Kankam S, Sanfo S, Fürst C. Agricultural Yield Responses to Climate Variabilities in West Africa: A Food Supply and Demand Analysis. Land. 2024; 13(3):364. https://doi.org/10.3390/land13030364
Chicago/Turabian StyleSchultze, Martin, Stephen Kankam, Safiétou Sanfo, and Christine Fürst. 2024. "Agricultural Yield Responses to Climate Variabilities in West Africa: A Food Supply and Demand Analysis" Land 13, no. 3: 364. https://doi.org/10.3390/land13030364
APA StyleSchultze, M., Kankam, S., Sanfo, S., & Fürst, C. (2024). Agricultural Yield Responses to Climate Variabilities in West Africa: A Food Supply and Demand Analysis. Land, 13(3), 364. https://doi.org/10.3390/land13030364