Article

Spatiotemporal Evolution and Mechanisms of Habitat Quality in Nature Reserve Land: A Case Study of 18 Nature Reserves in Hubei Province

1
School of Architecture and Urban Planning, Huazhong University of Science and Technology, Wuhan 430074, China
2
Hubei Engineering and Technology Research Center of Urbanization, Wuhan 430074, China
3
The Key Laboratory of Urban Simulation for Ministry of Natural Resources, Wuhan 430014, China
4
School of Architecture and Urban Planning, Beijing University of Civil Engineering & Architecture, Beijing 100044, China
5
Beijing Tsinghua Tongheng Planning and Design Institute Co., Ltd., Henan Branch, Zhengzhou 450000, China
*
Author to whom correspondence should be addressed.
Land 2024, 13(3), 363; https://doi.org/10.3390/land13030363
Submission received: 30 January 2024 / Revised: 8 March 2024 / Accepted: 9 March 2024 / Published: 13 March 2024
(This article belongs to the Section Land Environmental and Policy Impact Assessment)

Abstract

:
The contribution of biodiversity to the global economy, human survival, and welfare has been significantly increasing. However, nature reserves have long been subject to a sequence of ecological environmental issues caused by human activities. Therefore, quantitatively assessing the spatiotemporal evolution characteristics of habitat quality due to land use changes and exploring the mechanisms of potential influencing factors can provide a scientific basis for the stable and sustainable development of natural ecosystems. This study aims to analyze 18 nature reserves in Hubei Province to identify the spatiotemporal evolution of habitat quality within these reserves and to explore the influence of multifactorial dynamics from nature, humanity, and policy on this evolution. Initially, the study utilizes land use transition matrices and land use dynamic degree methods to understand the spatiotemporal characteristics of land conversion within the study area. Subsequently, it analyzes the spatiotemporal changes in habitat quality from 2000–2020 based on the InVEST model and tools like spatial autocorrelation (Moran’s I) in ArcGIS. Finally, 14 potential influencing factors are selected from natural environment, socio-human, and policy regulation aspects and analyzed in the Geodetector software to understand the factors affecting the spatiotemporal evolution of habitat quality. The results show that, during the study period, the land area of 18 nature reserves in Hubei Province increased from 2000 to 2020, while the water area decreased. There were slight increases in farmland, construction land, and forest land, with significant decreases in grassland and water areas. This reveals the erosion of water bodies due to artificial lake filling during rapid urbanization, leading to a decline in overall habitat quality within the reserves and a gradual increase in spatial heterogeneity. Among the influencing factors, single-factor influences such as land use intensity and distance to county roads and slopes have a strong negative linear relationship with habitat quality, with land use intensity being the most significant human activity factor. The interaction strength among different types of influencing factors in the bivariate interaction detection results is ranked as follows: the interaction between natural geographical and socio-human factors > the interaction within socio-human factors > the interaction within natural geographical factors. This study has diverged from the past focus on the selection of a single continuous natural reserve as the empirical subject. Consequently, it allows for an integrated analysis of physical geographical dimensions such as locational topography with socio-cultural and policy elements including land use and transportation facilities, thereby facilitating a multifactorial assessment of the interactive impacts on habitat quality.

1. Introduction

Biodiversity is the foundation of human survival and development, with all other ecosystem services relying on robust biodiversity [1,2]. Statistics indicate that biodiversity’s contribution to the global economy, human survival, and welfare has increased in recent years [3,4]. However, rapid urbanization and associated land use changes have led to significant losses in biodiversity, massive declines in ecosystem services, and severe impacts and alterations to the quality of biological habitats (i.e., ecological environmental quality), presenting great challenges to biodiversity conservation [5,6]. Habitat quality (HQ) refers to the ability of an ecosystem to provide resources and suitable conditions for the survival and reproduction of individuals or populations, representing a crucial ecosystem service function. It can characterize the region’s biodiversity and the degree of human disturbance to ecosystems to some extent [7,8]. Land use dynamics, a primary activity through which humans modify the natural environment and disturb habitat quality, reflect the intensity of human activities [9,10]. Changes in land use have become one of the significant risk factors affecting the natural environment and the quality of biological habitats. In particular, the expansion of urban construction and agricultural lands exacerbates the destruction of natural environments and biological habitats, hinders habitat connectivity, and intensifies habitat fragmentation and degradation, leading to habitat loss [11,12,13,14]. Therefore, studying the spatiotemporal evolution of land use changes and habitat quality, as well as exploring the impact mechanisms of multifactorial dynamics from nature, humanity, and policy, can provide a basis for analyzing the sustainable use of regional ecological environments.
Two conceptual methods exist for assessing habitat quality: The first is an indirect measurement method, involving field surveys of population variables in different habitats to reveal changes in habitat quality, which often requires substantial human and material resources [15,16,17]. The second method is a direct measurement method, which consists of building models to assess habitat quality. Some commonly used assessment models include the InVEST model (Integrated Valuation of Ecosystem Services and Tradeoffs), SoLVES model (Social Values for Ecosystem Services), and SDM (Species Distribution Model) [18,19]. The second method is more efficient and convenient than the first, hence its widespread application by scholars both domestically and internationally. The InVEST model is extensively used due to its low data requirements, strong spatial visualization, and high precision in computational results. The model can reflect habitat distribution under various landscape patterns, of which the habitat quality module evaluates habitat quality by analyzing land use/cover (LUCC) maps. Specifically, it can determine the degree of threat from different land use types to biodiversity [20,21,22]. For instance, Sallustio et al. assessed the habitat quality and degradation of current protected areas in Italy by InVEST [23]. Terrado et al. assessed terrestrial habitat quality and extended it to freshwater habitats in different scenarios of river basins with the upgrading of InVEST [24]. Li et al. simulated urban expansion in Changzhou City under scenarios preserving areas of high habitat quality with integrated application of the InVEST and the SLEUTH models [25]. Chen et al. assessed the evolution of habitat quality in China’s first batch of five national parks and proposed management zones using InVEST [26]. Liu Chunfang et al. assessed the evolution of habitat quality in Yuzhong County from 1995–2015 by InVEST and analyzed some urbanization factor impact mechanisms on habitat quality with the Geodetector model [27].
Overall, scholars both domestically and internationally have conducted multifaceted and multi-scale research on the assessment of habitat quality at different scales. The methodology and indicator system of the INVEST model for habitat quality assessment has been continuously improved through multiple validations. However, the previous studies still suffer from the following limitations: (1) The selection of empirical objects often focuses on continuous areas with typical geographical features, such as biological habitats [14,23], watershed areas [12,24], urban agglomerations [5,6], national park areas, etc. [26]. These areas have strong homogeneity and multiple human factors within them. Therefore, it is difficult to draw scientific conclusions from continuous areas as a research object for exploring the sustainability of humans and nature. On the contrary, nature reserves have the following characteristics: diversity of protected objects, advantages of natural geographical location, the integrity of the ecosystem, diversity of protective properties, and combination of multiple functions, etc. These characteristics provide complete and direct support for studying the sustainability and stability of natural ecosystems. (2) In the analysis of factors affecting habitat quality, the models often incorporate single-factor dimensions such as topographic gradients [28,29], soil and water conservation [19], urbanization [30], biological communities [31], etc. Single-factor dimensions cannot comprehensively clarify the spatiotemporal mechanisms of habitats because the evolution of habitats is the result of multiple factors such as human participation, changes in natural conditions, policies, etc. In addition, the single-factor dimension cannot comprehensively reflect the comprehensive ability and specific perspective of the evaluated object. Furthermore, single-factor assessment cannot detect the interaction between different factors. Therefore, the reliability of conclusions drawn from examining a single factor is somewhat affected, and the inferential nature is also greatly limited. (3) Application research on nature reserves mainly focuses on the habitat quality assessment and influencing factors of individual reserves [32,33,34]. The major concern brought by a single case is whether the research findings can be applied to a broader range. The evaluation of a single area cannot explain the large-scale spatiotemporal patterns because the spatiotemporal evolution mechanisms caused by a single protected area are highly likely to be sporadic and have not been validated. Overall, these limitations make it difficult for research findings to effectively identify the diverse impacts of human activities on habitat quality. Moreover, whether historical research results can be fully generalized to the habitat quality conservation practices of nature reserves with different geographical characteristics is also debatable.
For this reason, this study intends to select multiple nature reserves within the same administrative jurisdiction as empirical objects and apply the INVEST and geographical detector models to explore the impact mechanisms on different types of nature reserves from dimensions of physical geography, socio-culture, and policy regulation, aiming to address the limitations of multi-factor impact analysis and multi-object comparative research present in existing studies.
To better achieve the research objectives, this study selects all 18 terrestrial-dominated national nature reserves in Hubei Province, China, as empirical objects. First, Hubei Province features a diversity of natural elements such as rivers, forests, mountains, grasslands, wastelands, tidal flats, and wetlands, with a significant range of altitudes, and nature reserves with various geographical characteristics, facilitating the identification of different natural geographic influencing factors. Second, the national nature reserves in Hubei Province adopt a hierarchical management policy of core areas, buffer zones, experimental zones, and operational zones [35,36]. The experimental and operational zones allow for business activities such as eco-tourism and visits under the management of regulatory authorities, making the study of human activity factors on habitat quality in these areas more identifiable. Third, Hubei Province spans approximately 740 km from east to west, with the economic development of the eastern plain areas significantly higher than that of the western mountainous regions. This results in greater pressure on the western counties and cities in provincial GDP assessments, forcing most nature reserves located in western Hubei to face more severe risks of economic development and policy regulation, such as eco-tourism and ecological value products [37,38], further increasing the identifiability of these two aspects of influencing factor analysis. Therefore, selecting the nature reserves in Hubei Province as the empirical area, where the ecosystem is more typically affected by socio-economic elements, is advantageous for better reflecting the impact effects of multidimensional factors on habitat quality.
Currently, research on habitat quality in Hubei Province focuses on the impacts caused by topography, land use, urban expansion, and other single elements in the continuous complete region of the same class. For instance, Pengnan Xiao and others have evaluated the spatiotemporal characteristics of habitat quality across Hubei Province and the impact of topographic gradients on habitat quality [39]. Shuaipeng Chen has assessed the influence of the expansion of prefecture-level cities and counties on the quantity, area, and quality of natural habitats, as well as the critical threshold distances affecting habitats [40]. Moreover, Meng-yao Li and others have evaluated the effects of topographic gradient on habitat quality in northwestern Hubei, using the city of Shiyan as a case study, by employing the topographic position index [41]. However, there is a lack of research on the spatiotemporal characteristics of habitat quality and the multi-factor influence mechanisms in nature reserves across different geographical features of Hubei Province against the backdrop of ecological civilization.
Therefore, our work proposes to further explore the 18 nature reserves in Hubei Province as empirical subjects, aiming to achieve two research objectives: Firstly, to analyze the spatiotemporal characteristics of land use and habitat quality within these 18 nature reserves from 2000 to 2020 based on remote sensing data, clarifying their consistent characteristics and distinctive differences. Secondly, to establish the hypothesis that the quality of habitat is influenced more by the interaction of multiple factors than by single factors, employing the InVEST model and the Geodetector model to quantitatively assess the impact of various factors from natural geography, socio-cultural, and policy regulation dimensions on habitat quality. This involves further analyzing the degree of impact of the interactions between various influencing factors on habitat quality, delving into the research on the mechanisms affecting habitat quality in nature reserves, and providing references for countries worldwide undertaking ecological transitions.

2. Overview of the Study Area and Research Methods

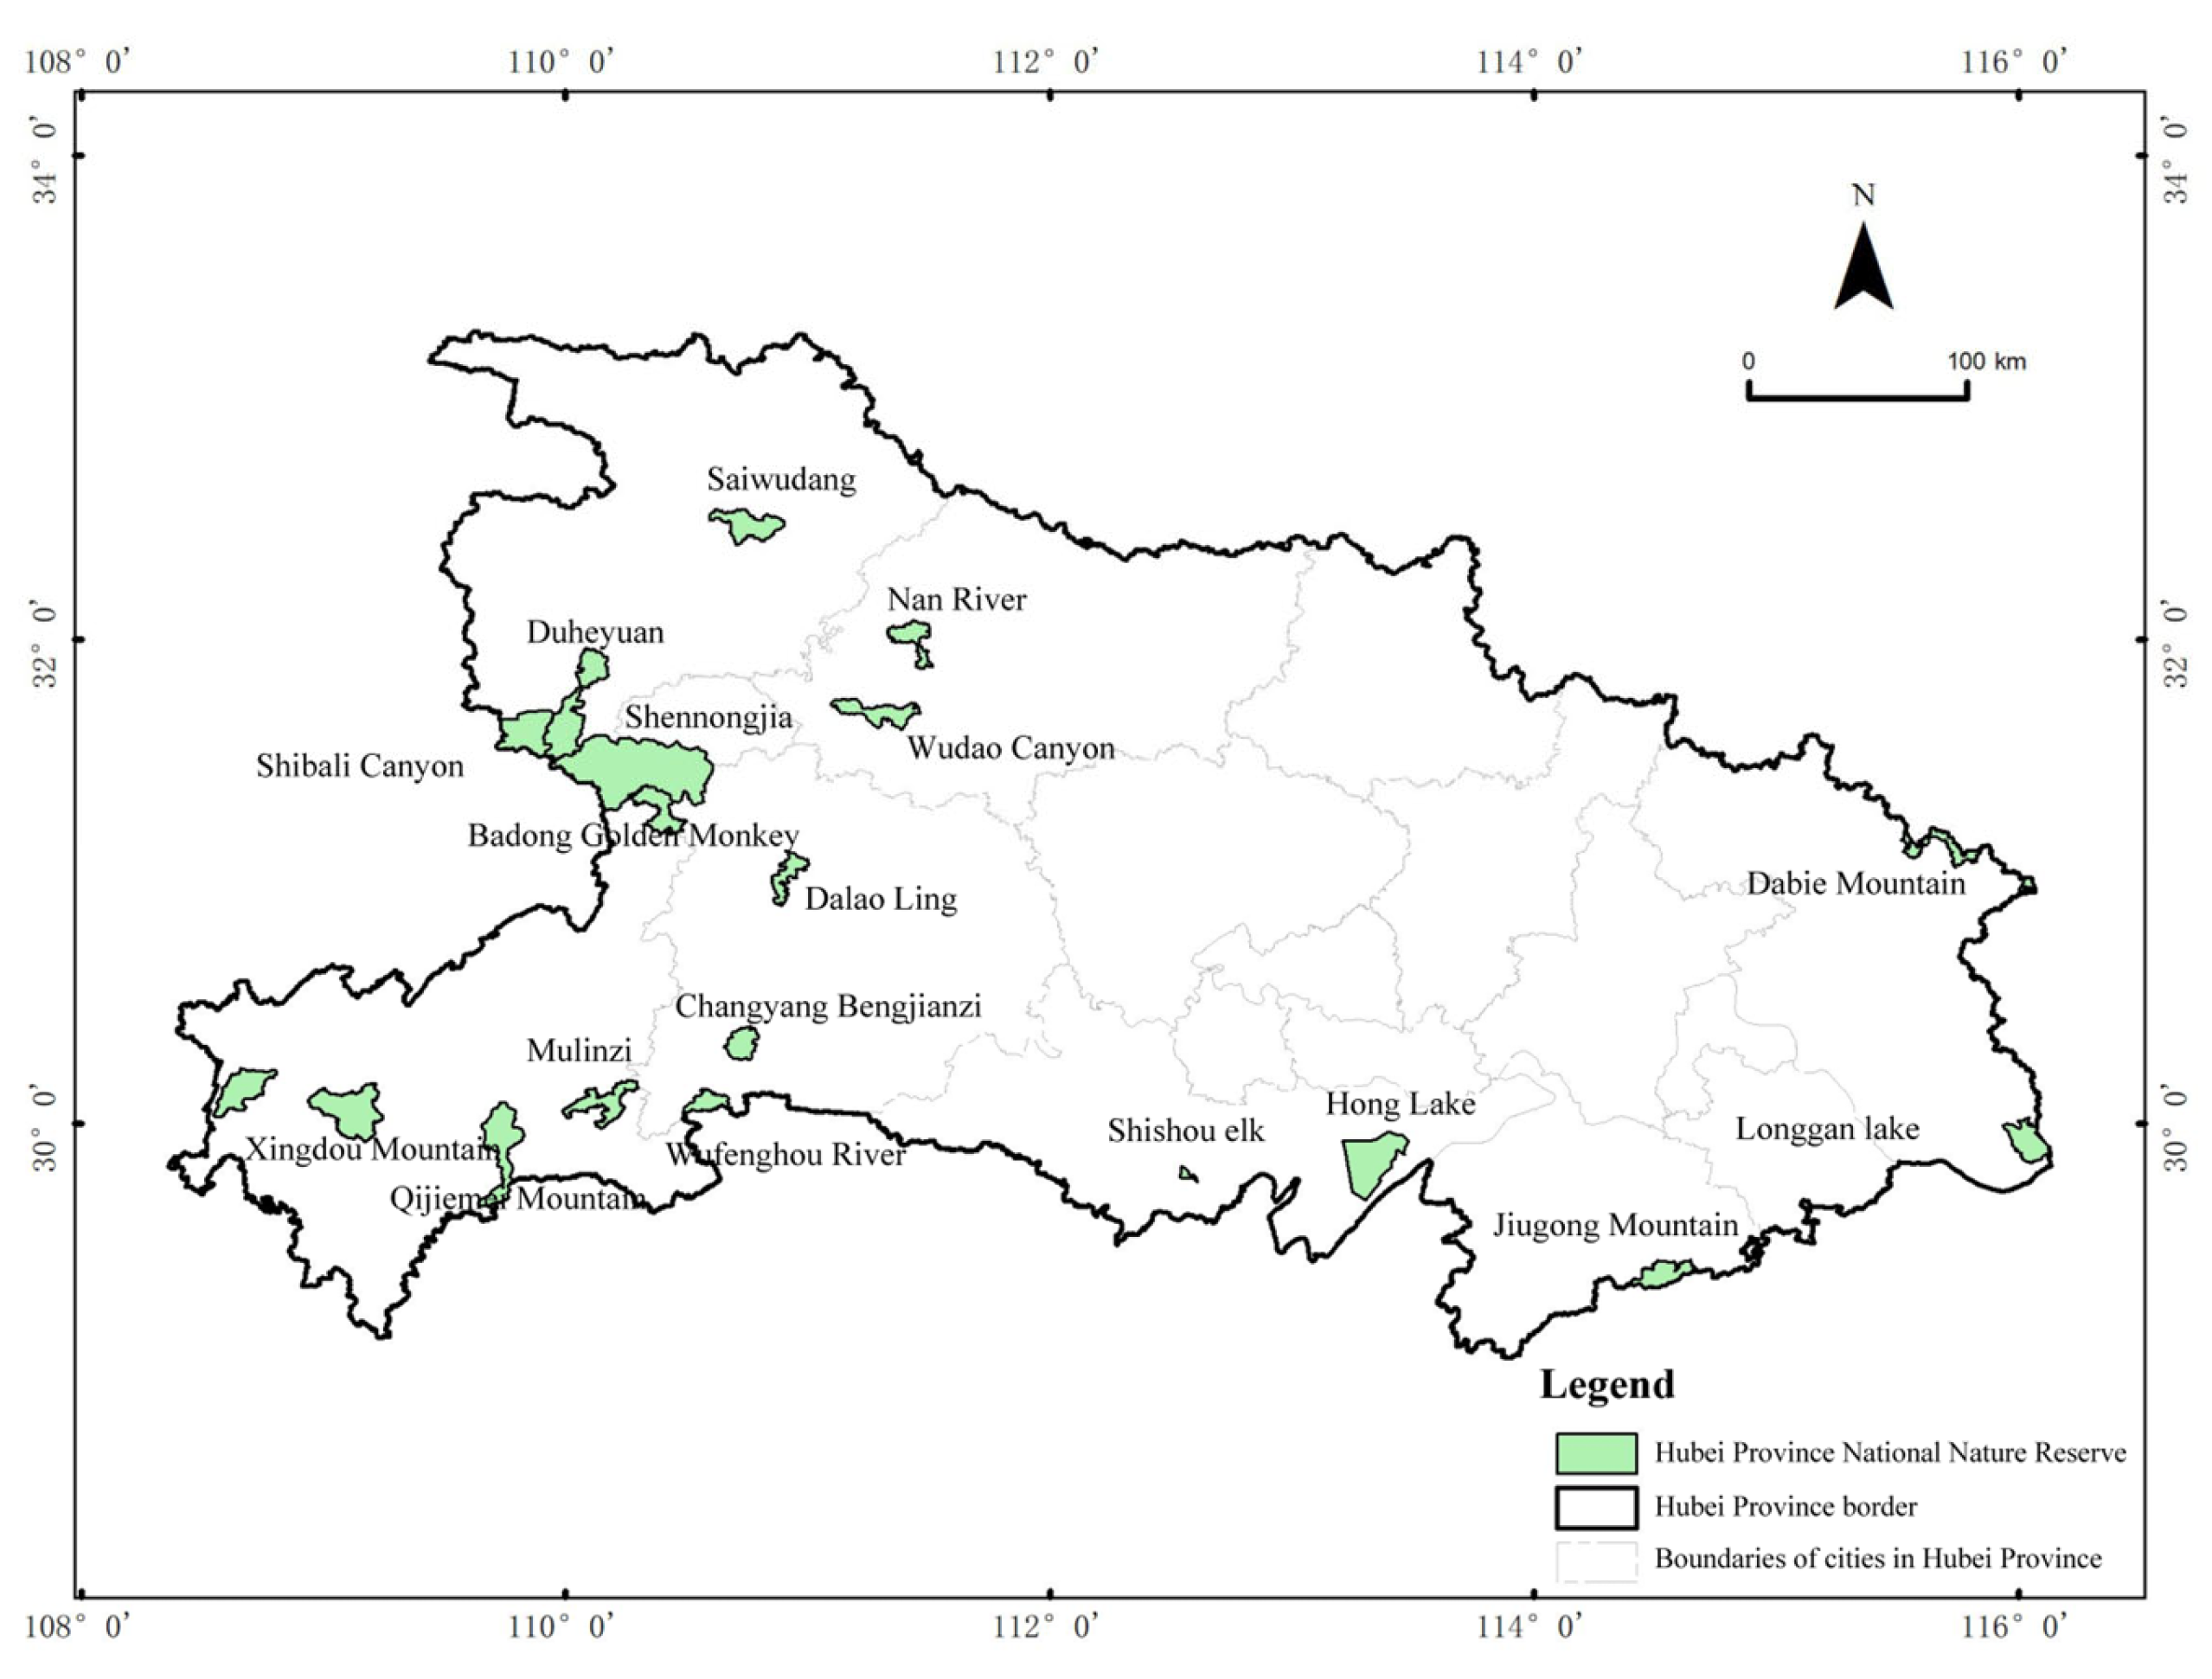
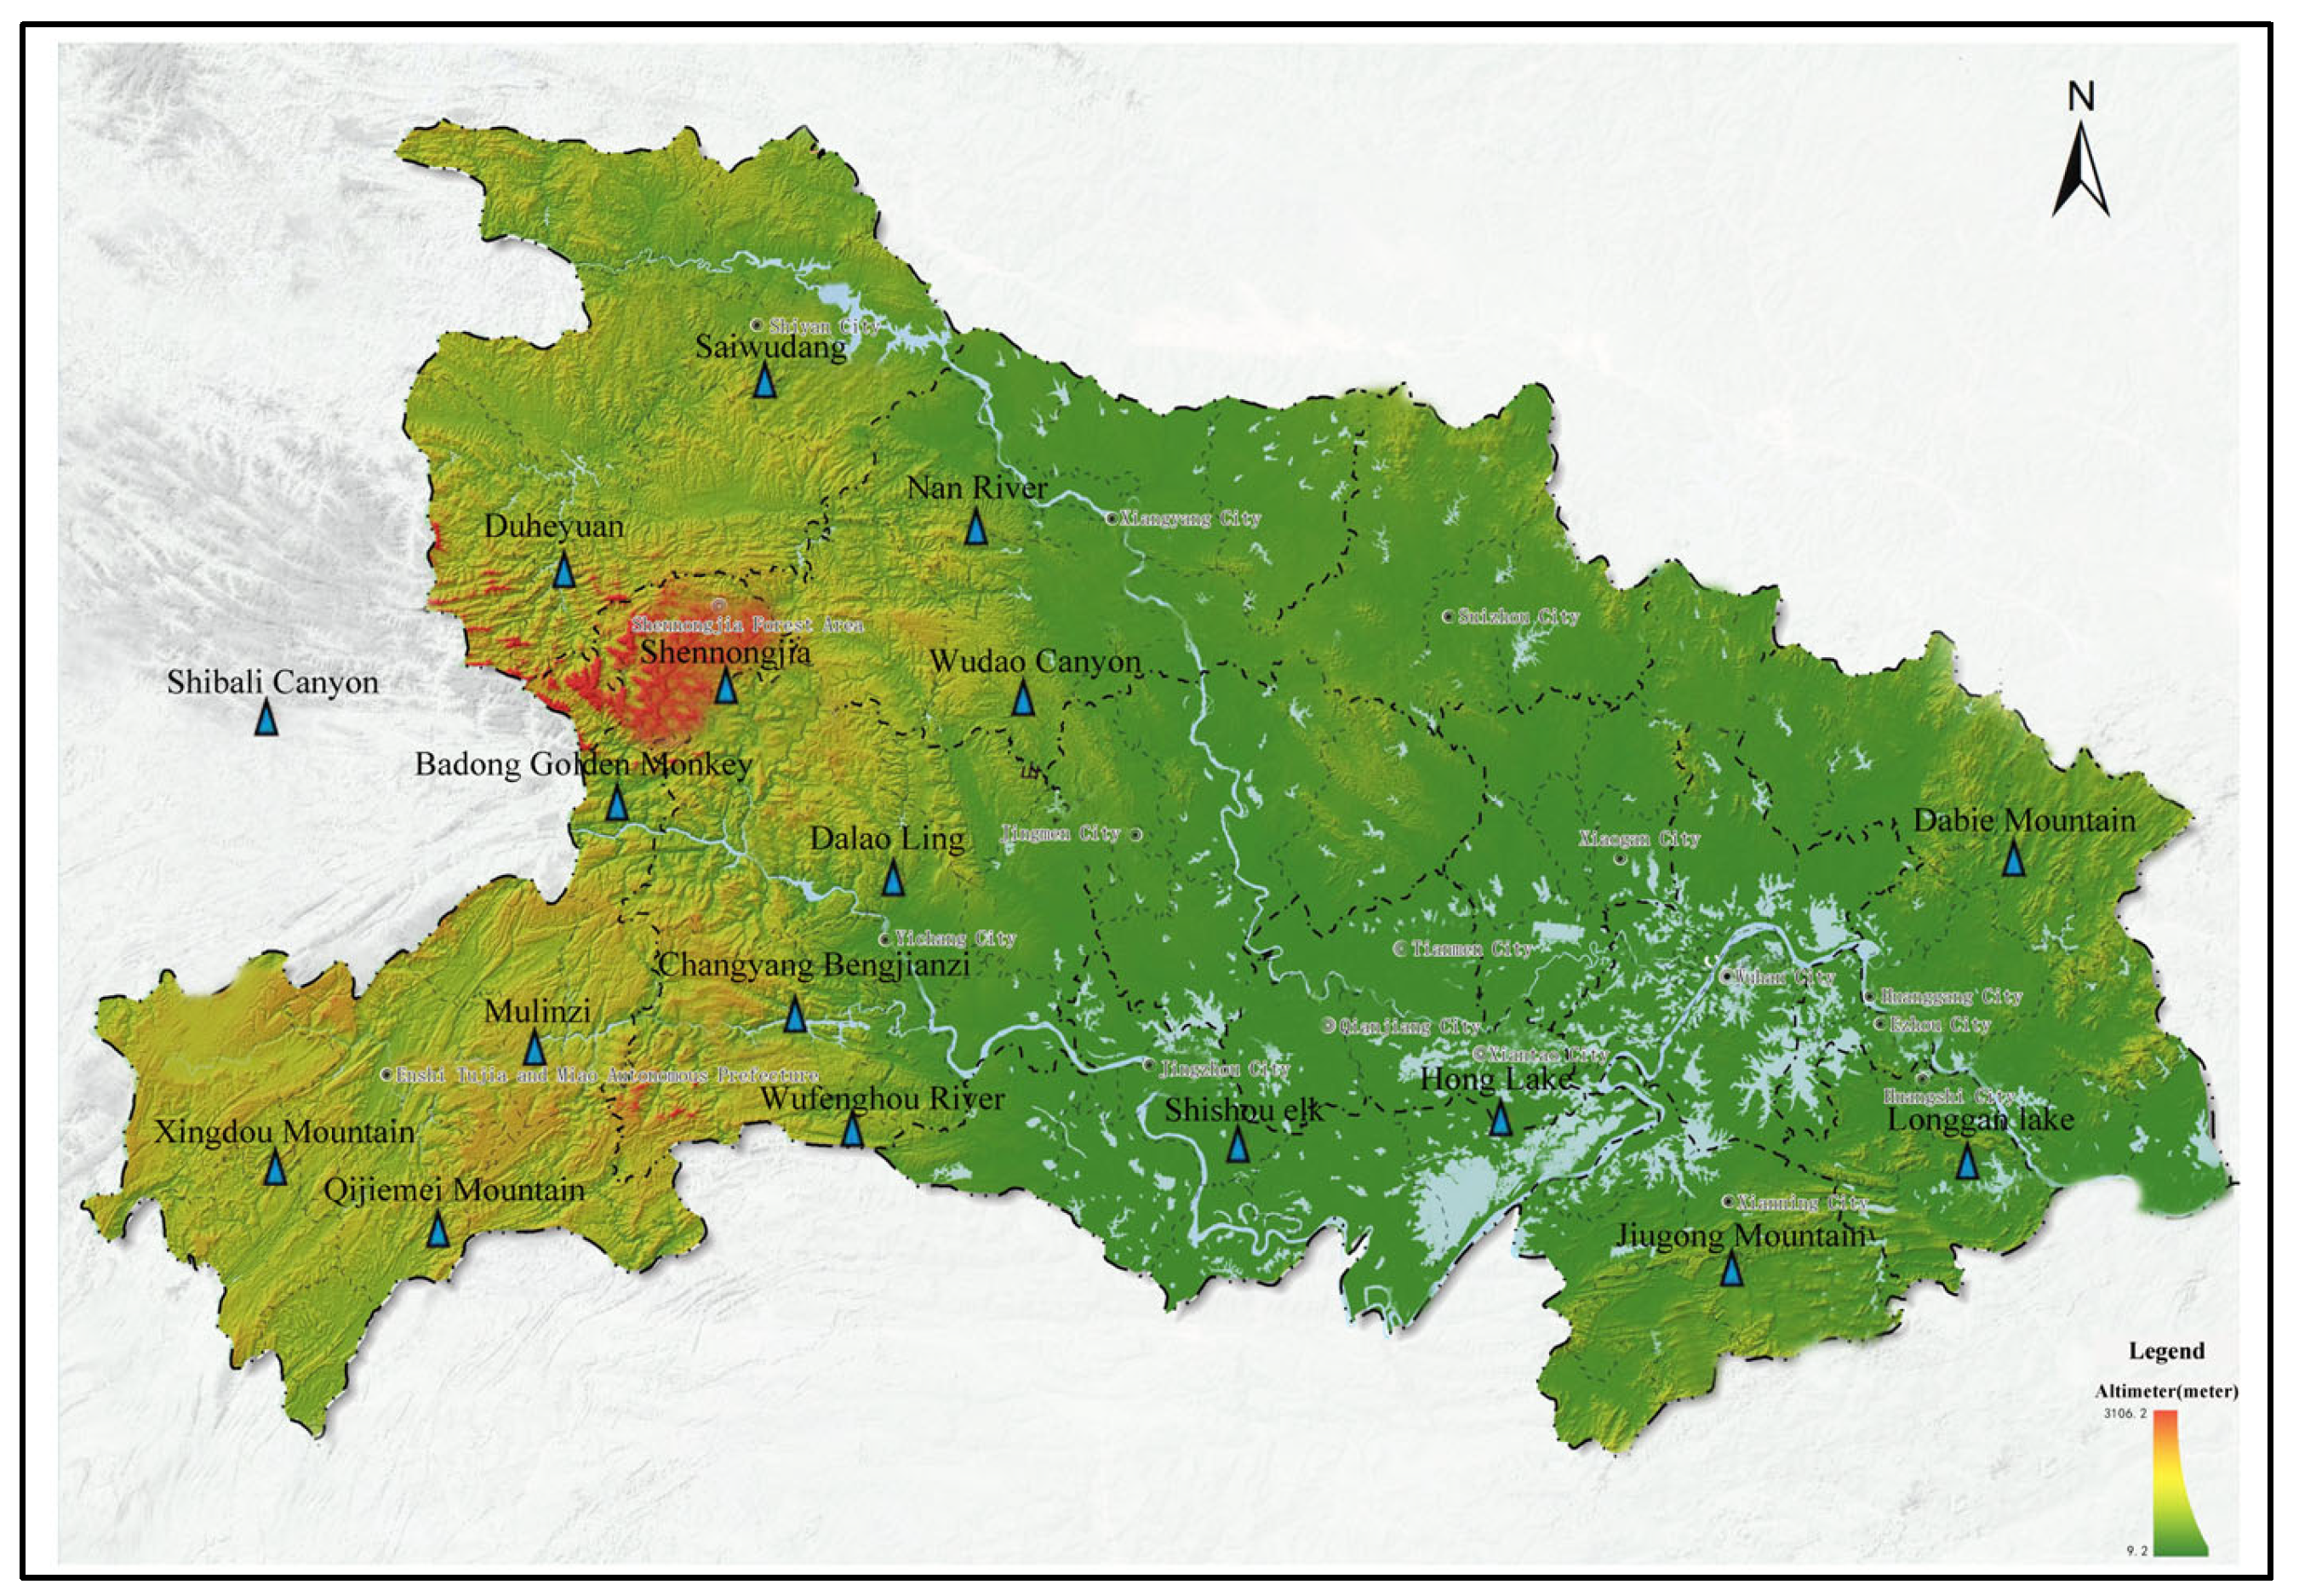
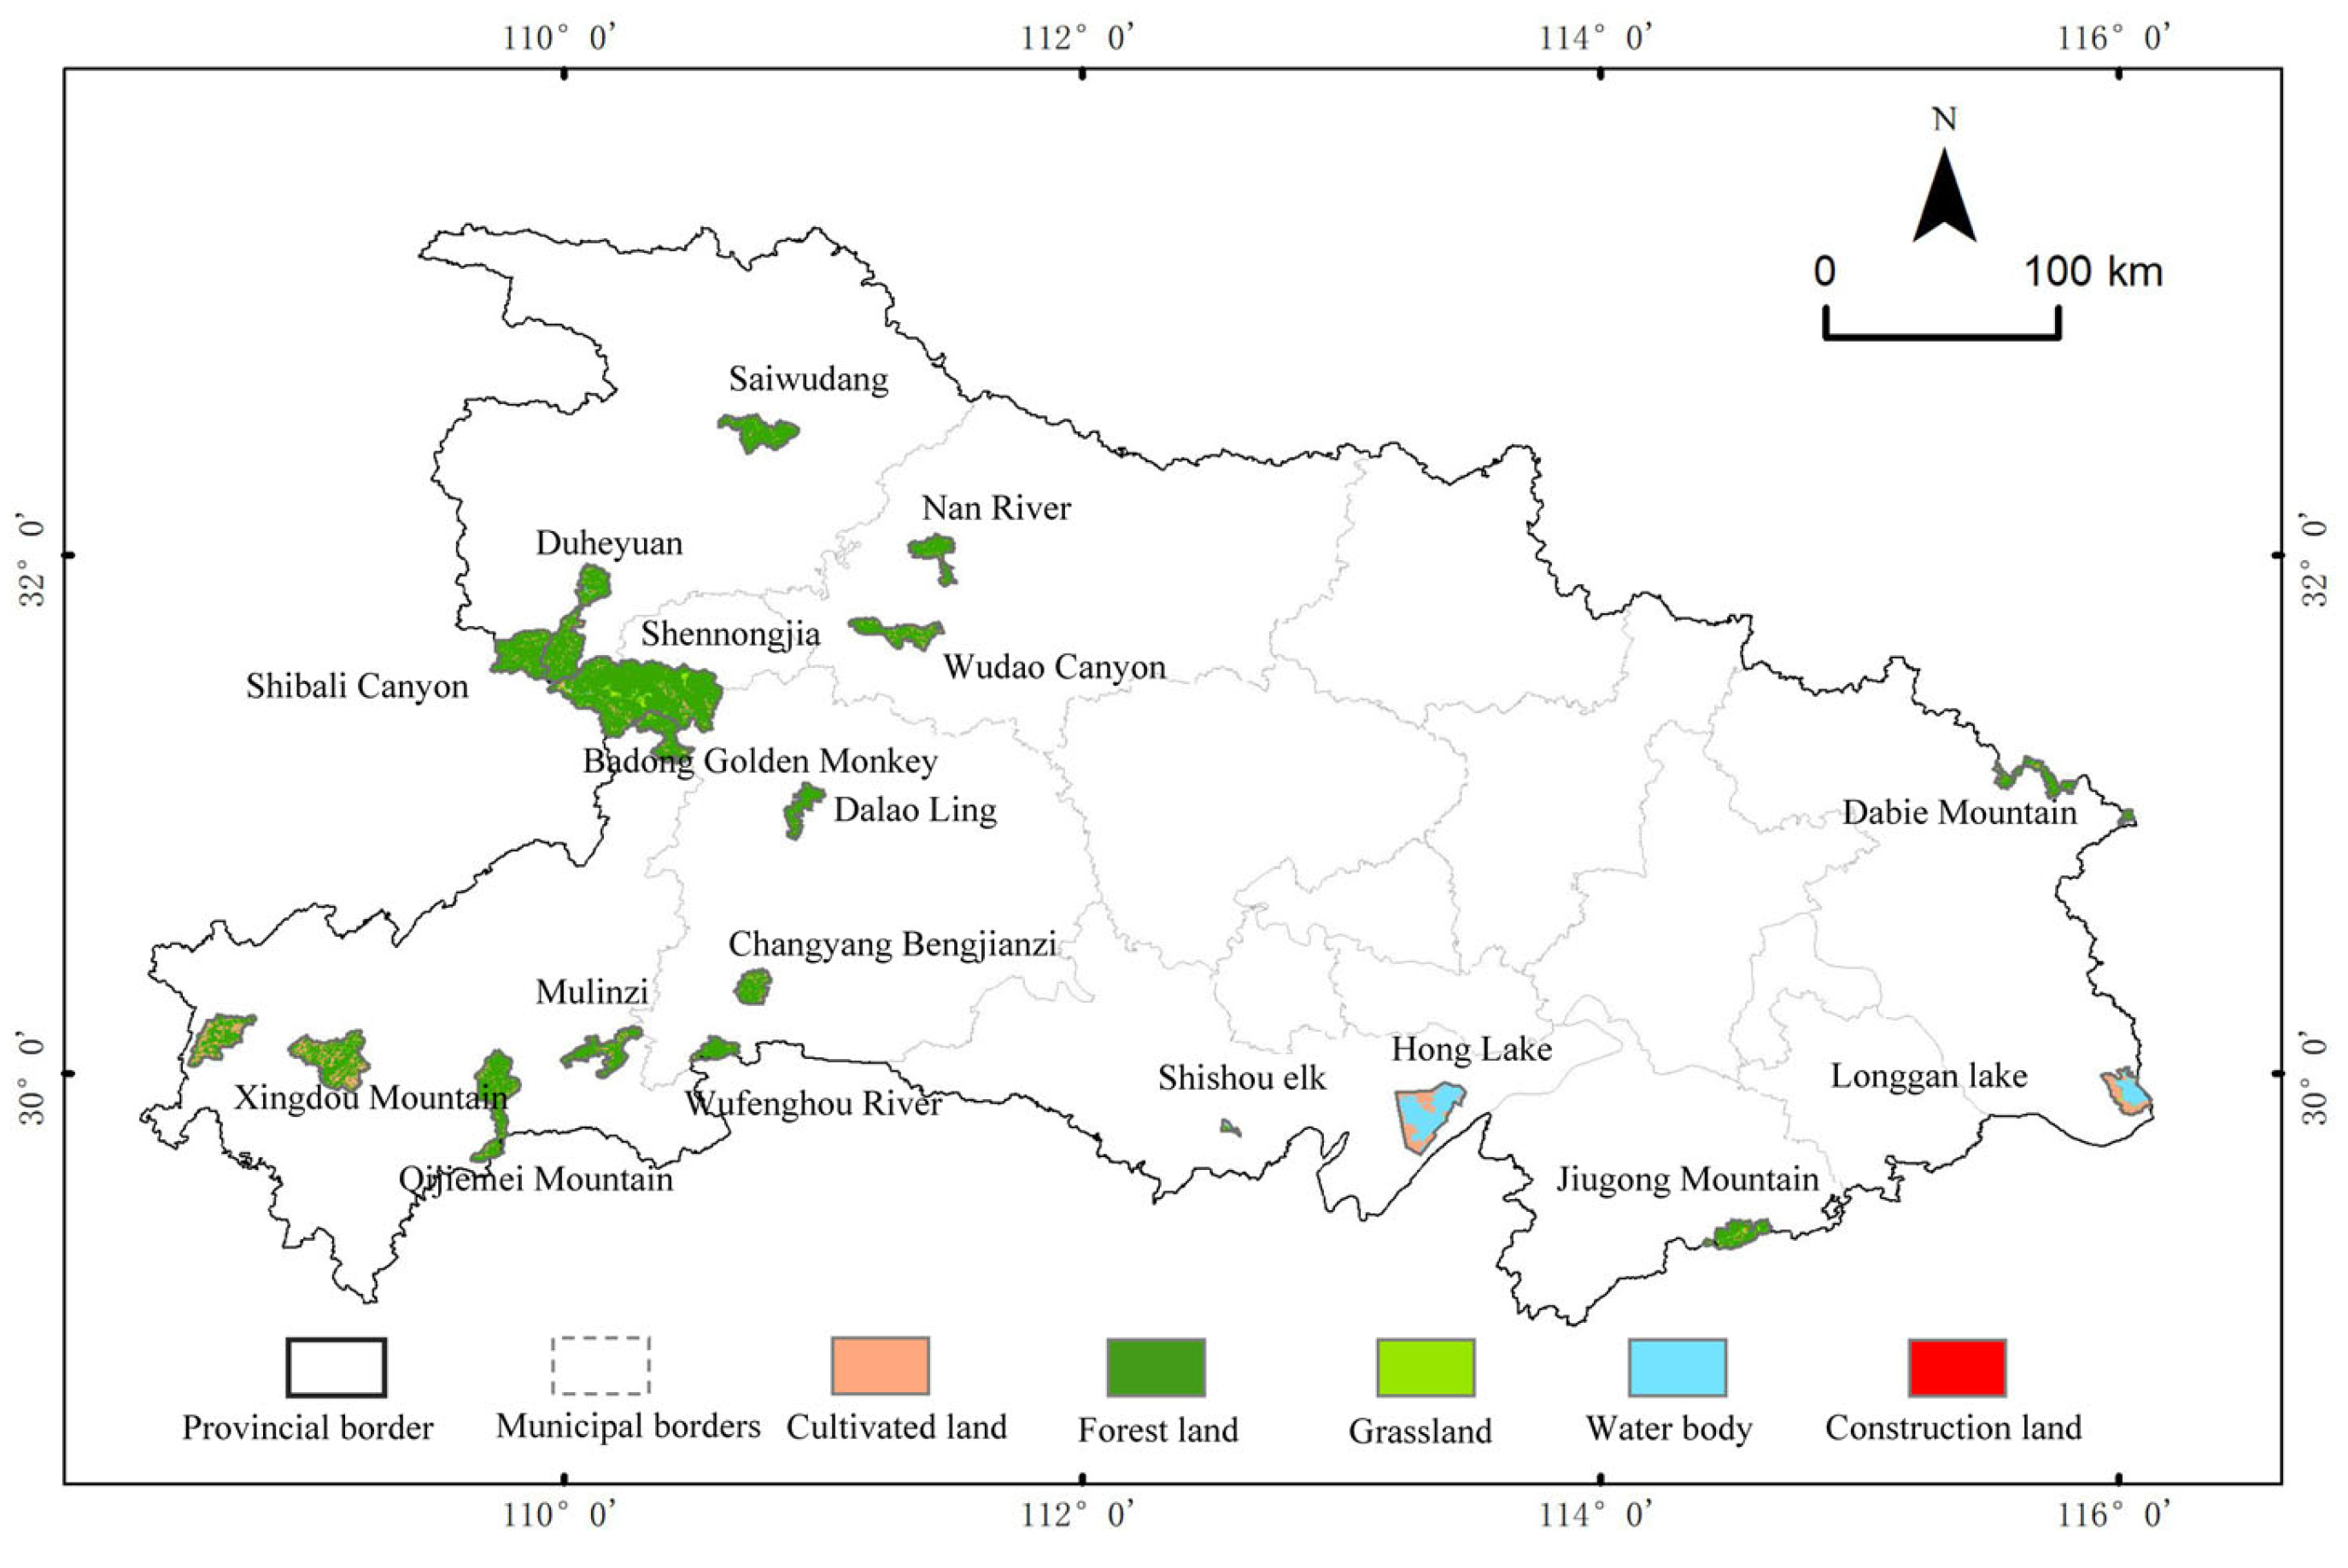
2.1. Overview of the Study Area

According to the Hubei Provincial Department of Ecology and Environment’s directory of nature reserves in Hubei Province, as of 2020, there were a total of 22 national-level nature reserves. Among these, the protection scope of aquatic wildlife reserves is delineated based on the highest historical water levels of the river’s main channel and its tributaries, with a disproportionately high ratio of water area within the reserves, making them unsuitable for habitat quality estimation using this model. Fossil relic reserves contain many exposed paleontological fossils, which have a high degree of similarity to bare ground in the process of land use type extraction from remote sensing images, making them difficult to distinguish and posing significant challenges to the interpretation of remote sensing images. Therefore, excluding these two types of reserves unsuitable for habitat quality estimation using the InVEST model’s Habitat Quality module, the study area includes 18 national nature reserves within Hubei Province (Table 1).
Hubei Province has a diverse array of protected natural areas, covering nearly 10% of the province’s total land area. However, many national-level nature reserves in Hubei are in impoverished regions such as the western Hubei mountain (Figure 1). These areas face heavy burdens due to economic development, ecological protection, and poverty alleviation tasks, leading to significant contradictions between regional ecological environmental protection and poverty alleviation needs. In some places, blind development and construction within the reserves have been pursued for economic gain, damaging ecosystem integrity and causing issues such as habitat fragmentation and a sharp decrease in species quantity and variety. For example, Xingdoushan National Nature Reserve houses nearly 80,000 residents and includes the Fubaosi Development Zone within its boundaries. Longgan Lake National Nature Reserve is home to many permanent basic farmlands, livestock farms, and enterprises, resulting in longstanding conflicts between humans, wetlands, and migratory birds.

2.2. Data Sources and Processing

In terms of data sources, all data were derived from official platforms. Specifically, the boundary data of the study area were sourced from the functional zoning map of Hubei Province national nature reserves provided by the Hubei Provincial Department of Ecology and Environment. The vectorized boundaries were extracted using the geo-registration tool of ArcGIS 10.5. The land use data for Hubei Province’s national nature reserves in 2000, 2010, and 2020 were obtained from the GlobeLand30 global land cover dataset with a 30-meter resolution, using the WGS-84 coordinate system. Road data were sourced from OpenStreetMap (OSM). The Digital Elevation Model (DEM), annual average temperature, annual average precipitation, and Point of Information (POI) data were all obtained from the Data Center for Resources and Environmental Sciences, Chinese Academy of Sciences. Other data were sourced from the Hubei Provincial Department of Natural Resources and the official websites of municipal natural resources and planning bureaus (Table 2). Regarding data quality, the GlobeLand30 dataset employs remote sensing images from Landsat’s TM5, ETM+, OLI, and Gaofen-1 (GF-1) multispectral imagery. The selection principle for these images is to choose the best available multispectral images from the vegetation growing season within ±2 years of the baseline or update year, ensuring minimal to no cloud coverage. For areas where acquisition is challenging, the timeframe for obtaining images may be relaxed to ensure the completeness of global coverage. The accuracy assessment of the GlobeLand30 V2010 data, led by Tongji University, achieved an overall accuracy of 83.50% and a Kappa coefficient of 0.78. The GlobeLand30 V2020 data accuracy assessment, conducted by the Aerospace Information Research Institute of the Chinese Academy of Sciences, reached an overall accuracy of 85.72% and a Kappa coefficient of 0.82. The remaining data were sourced from open statistical platforms and have undergone rigorous data collection, processing, and verification processes, ensuring high accuracy and reliability. In summary, the research data have the following advantages: (1) The integrated use of multi-source data not only enhances the multi-dimensional perspective of the data but also increases its accuracy and reliability through cross-validation between different data sources. (2) Comprehensive geographic information coverage, encompassing various aspects of the natural environment and human activities, provides a holistic view of the research. (3) The use of advanced processing tools and techniques, such as the ArcGIS 10.5 geo-registration tool and the WGS-84 coordinate system, ensures the high quality and precision of the data.
Based on the classification system of the 30 m global land cover data GlobeLand30, and considering the actual situation of land use/land cover in the national nature reserves of Hubei Province, a reclassification was conducted. The 10 primary types of GlobeLand30 data were reclassified into six major categories, as shown in Table 3.

2.3. Research Methods

Our research methodology is divided into three stages encompassing five methods: (1) analyzing the land use change conditions in 18 nature reserves in Hubei Province for the years 2000, 2010, and 2020, including methods of land use transition matrix and land use dynamic degree analysis; (2) investigating the spatiotemporal distribution characteristics of habitat quality in the 18 nature reserves of Hubei Province for 2000, 2010, and 2020 using the INVEST model analysis and spatial autocorrelation analysis; and (3) examining the contribution rates of various factors to changes in habitat quality and exploring the main influencing factors and their evolutionary mechanisms of habitat quality evolution, employing the geographic detector analysis method. Figure 2 illustrates a schematic of our research methods.
(1)
Land Use Transition Matrix
Before assessing the habitat quality index, this article first uses the land use transition matrix to represent the changes in direction and area for various land uses during 2000–2020 and two sub-periods (2000–2010 and 2010–2020) [42,43]. The land use transition matrix is not only a powerful analytical tool but also serves as a bridge between land change data and land management policies. Through in-depth analysis of the land use transition matrix, we can reveal with high precision the relationships and trends between different types of land use in the nature reserves of Hubei Province during 2000, 2010, and 2020. This analysis not only unveils the mutual conversions among various land use types within the reserves, such as arable land, forest land, and construction land but also intricately displays the specific conditions of these land use types after the implementation of certain policy measures, assisting in the analysis of habitat quality index results that follow. The formula for the land use transition matrix is presented as Equation (1):
S i j = S 11 S 12 S 1 n S 21 S 21 S 2 n S n 1 S n 2 S n n
In the equation, S i j represents the total area of the initial land use type i that has changed to land use type j by the study’s end, with n denoting the count of land use categories.
(2)
Land Use Dynamic Degree
Following the land use transition matrix, the analysis of land use dynamic degree becomes an important means to study the characteristics of land use change. The land use dynamic degree refers to the rate of quantitative change in land use types over a certain period, which can reflect the intensity and rate of land use changes within the nature reserves of Hubei Province between 2000, 2010, and 2020. This facilitates the analysis of the reasons behind subsequent changes in the habitat quality index within the reserve. The land use dynamic degree is divided into the single land use dynamic degree and the comprehensive land use dynamic degree [44,45,46,47]. The formulas are as follows:
A single index means the rate of change in a certain land use type in a specific time frame in the study area, focusing on analyzing the changes in each land use type. The calculation formula is shown as (2):
M = U a U b U b × 1 T × 100 %
In the formula, M represents the dynamic degree of land type U within the study duration; T represents the study duration; U a is the initial area of land type U; and U b   is the final area of land type U at the study’s conclusion. Where M is positive, it indicates an increase in the land type over the time T , and a negative M indicates a decrease. A higher absolute value of M indicates a faster rate of change, and a lower value suggests a slower rate.
The comprehensive index describes the overall rate of change in land use for the entire area, focusing on the study of regional variations in land use changes. The calculation formula is shown as (3):
L c = i = 1 n L U i j 2 i = 1 n L U i × 1 T × 100 %
In the formula, L c represents the overall dynamic degree of land use in the study area, L U i is the initial area of the ith land use type, L U i j is the absolute value of the area of the ith land use type converted to the jth land use type during the study period, n is the number of land types (n = 1, 2, 3, …), and T denotes the study period’s length.
(3)
InVEST Model
The InVEST model is used to assess the habitat quality index of national nature reserves in Hubei Province. This model conducts an in-depth analysis of a key principle: by meticulously assessing the sensitivity of various land use types within the nature reserves of Hubei Province and the impact of various threat factors, it generates a detailed map of habitat quality distribution across the reserves. This approach enables us to clearly see the direct link between habitat quality and land use changes within the nature reserves, demonstrating how human land use practices within these areas directly influence the transformation of land use types and significantly impact habitat quality levels. Habitat quality is closely related to land use changes; human utilization of land alters land use types and affects habitat quality levels. The greater the intensity of human activities, the greater the threat to the quality of regional habitats, resulting in lower habitat quality and biodiversity levels. This model is a novel tool for assessing human-made threats to habitat quality in natural ecological areas and has several advantages over other models: (1) It has lower data intensity and relatively higher flexibility [48]. (2) It allows for data adjustments based on actual conditions [49]. (3) It can analyze the spatial habitat quality and connectivity of various land use types and quantify their sensitivity [50].
The model integrates the reclassification of land use data, combines land use data, habitat threat sources, and the habitat’s response to threat factors to generate a habitat quality index map. The calculations are as shown in Equations (4) and (5):
Q x j = H j 1 D x j z D x j z + K z
D x j = r = 1 R y = 1 Y r ω r / r = 1 R ω r r y i r x y β x S j r
In the formula, Q x j represents the habitat quality index for the x t h grid of the j t h land use type, with values from 0 to 1, where higher values signify superior habitat quality; H j represents the habitat suitability of the j t h land use type, with values from 0 to 1; D x j refers to the degradation score, indicating the level of degradation of the x t h grid of the j t h land use type; Z is the scale constant, set by default to 2.5; and k represents the half-saturation constant, calibrated by first running the model once with the InVEST model’s default value of 0.5, then using half of the maximum habitat degradation value as the model’s k value. Following the above steps, the final k value was determined to be 0.02.
R represents the count of threat factors; ω r   is the relative importance value of each threat factor; and Y is the total count of grid units for stressor r, with Y r being the count of grid units affected by threat factor r. r y is the value of the threat factor of type r; β x is the accessibility of various threat factors to the habitat grid, with values ranging from 0 to 1; S j r   measures the sensitivity of the   j t h habitat type to threat factor r, with the value interval located ranging from 0 to 1; and i r x y refers to the distance between the threat and the habitat grid, representing the threat’s impact on the habitat.
The influence of threat factors on habitat is categorized into linear (Equation (6)) and exponential (Equation (7)) distance decay formulas, as follows:
i r x y = 1 d x y d r m a x L i n e a r
i r x y = e x p 2.99 d r m a x d x y E x p o n e n t i a l
In the formula, d x y is the straight-line distance between habitat grid x and y; d r max represents the maximum distance threat r can impact.
To scientifically assess the habitat quality of the national nature reserves in Hubei Province, in conjunction with the actual geographic conditions of the study area, farmland, transportation land, residential areas, and bare land were selected as relevant threat factors based on the InVEST model’s recommended values and previous research [51,52]. Construction land, farmland, railways, expressways, and other roads were ultimately identified as stress factors. Following expert recommendations, the relative sensitivity of each habitat type to each threat factor, habitat suitability, maximum impact distance of threat sources, and the weights of different threat sources were determined, with specific assignments as shown in Table 4 and Table 5.
The determination of the weights of stress factors on habitat types is usually qualitatively based on previous experiences, with quantitative improvements made using the entropy weight method. Firstly, data on stress factors are recorded. Since stress factors lead to a decrease in habitat quality, the relationship between stress factors and habitat quality is negatively correlated. Subsequently, the data are standardized, and the information entropy of each stress factor is calculated using a formula. Finally, the entropy weight of each stress factor is calculated to serve as the weight of its impact on habitat quality.
(4)
Spatial Autocorrelation Analysis
This study utilizes ArcGIS software to analyze the spatial correlation of habitat quality evolution among various grid units within the national nature reserves of Hubei Province. The analysis aims to uncover the fundamental patterns of habitat quality changes within the reserves, particularly how they develop and change geospatially, thereby providing a solid scientific basis for the formulation of conservation measures and the management of the ecological environment. Moran’s I index is a powerful statistical tool used to measure the spatial distribution patterns of specific characteristics (in this study, habitat quality) within an area, to determine whether these characteristics exhibit significant clustering trends or random distribution in space. Therefore, this paper adopts the global Moran’s I index for spatial autocorrelation analysis to reflect whether clustering or outliers occur in space. The hot spot analysis (Getis-Ord Gi*) can measure the spatial aggregation characteristics of habitat quality. The advantages of spatial autocorrelation are as follows: Firstly, it can calculate the similarity and correlation between neighboring areas to reveal the distribution changes in habitat quality in space. Secondly, it can clearly identify the spatial aggregation, which helps to determine the areas with high and low-quality habitats in the ecosystem, and provides substantial direction for ecological resource protection and restoration [53]. The formula for calculation is as follows:
I = n i = 1 n j = 1 n w i j x i X ̄ x j X ̄ i = 1 n x i X ̄ 2 i = 1 n j = 1 n w i j
G i * = j = 1 n w i j x j X ̄ j = 1 n w i j S n j = 1 n w i j 2 ( j = 1 n w i j ) 2 n 1
X ̄ = j = 1 n x j n
S = j = 1 n x j 2 n X ̄ 2
In the formula, I means the Moran’s I index; Gi* is the hot spot index; w i j means the spatial weight between the ith and jth spatial cells; x i and x j mean the values of the ith and jth cells; and X ̄ means the average value of the cells; n means the total number of cells in the study area. The Moran’s I index ranges from [−1, 1], with higher values indicating stronger spatial correlation, less than 0 representing negative correlation, and equal to 0 signifies a random distribution.
Subtract the habitat quality spatial distribution maps of 2020 from those of 2000, then calculate the change in habitat quality using a 300 m × 300 m grid, using the difference in habitat quality as the analysis variable for spatial autocorrelation (Moran I) and hot spot analysis in ArcGIS. Hot spot analysis is divided into seven categories based on Z-score values: Hot spot-99% confidence (Z-score ≥ 2.56), Hot spot-95% confidence (1.96 ≤ Z-score < 2.56), Hot spot-90% confidence (1.65 ≤ Z-score < 1.96), Not significant (Z-score ≤ 1.65 or Z-score ≥ −1.65), Cold spot-90% confidence (−1.96 ≤ Z-score < −1.65), Cold spot-95% confidence (−2.56 ≤ Z-score < −1.96), and Cold spot-99% confidence (Z-score ≤ −2.56). For the period 2000–2020, hot spot and cold spot areas indicate changes in habitat quality within nature reserves, where blue cold spots represent clusters of declining habitat quality and red hot spots represent clusters of increasing habitat quality.
(5)
Geodetector
In the final phase of our study, which is also of paramount importance, we specifically focused on identifying and assessing various potential driving factors that affect the habitat quality index, for which we adopted the advanced statistical analysis method known as the geographical detector. The geographical detector method comprises two key components: the factor detector and the interaction detector. It aims to quantitatively assess the contribution of different factors to habitat quality changes and to delve into the main influencing factors behind habitat quality changes and their mechanisms of action. Compared with traditional statistical analysis methods, a significant advantage of the geographical detector method is its less stringent requirement for hypothesis conditions, allowing for more flexible application across various research domains. It is particularly suited for studying spatial differentiation phenomena and their underlying influencing factors, as it can effectively handle the complexity and variability of spatial data [54,55]. In this study, through the application of the geographical detector, we were not only able to identify the main factors affecting the habitat quality of national nature reserves in Hubei Province but we were also able to gain a deep understanding of how these factors collectively influence habitat quality evolution through various complex interaction mechanisms, providing a scientific basis and guidance for future conservation and management strategies [56,57].
The factor detector primarily measures the explanatory capacity of different influencing factors on the spatial heterogeneity of habitat quality evolution. The calculation formula is as follows:
q = 1 1 N σ 2 h = 1 L N h σ h 2
In the formula, h takes values 1, 2, 3, …, L, where L indicates the number of partitions of variable Y or factor X; N h and N represent the number of units in layer h and the total area, respectively; and q is the uniform driving explanatory power. For partition i, taking values 1, 2, 3, …, L, where L is the number of partition items; N is the total number of sample units in the area; σ h 2 is the variance in layer h; and σ 2 is the variance of the Y values in the entire area. Q represents the explanatory power of factor X on variable Y, with q ranging from [0, 1]. A higher q value indicates a stronger explanatory power of influencing factor X on habitat quality (variable Y) and vice versa.
The interaction detector assesses whether the combined effect of two influencing factors increases or diminishes the explanatory capacity of the dependent variable Y. The relationship between the two factors is shown in Table 6.

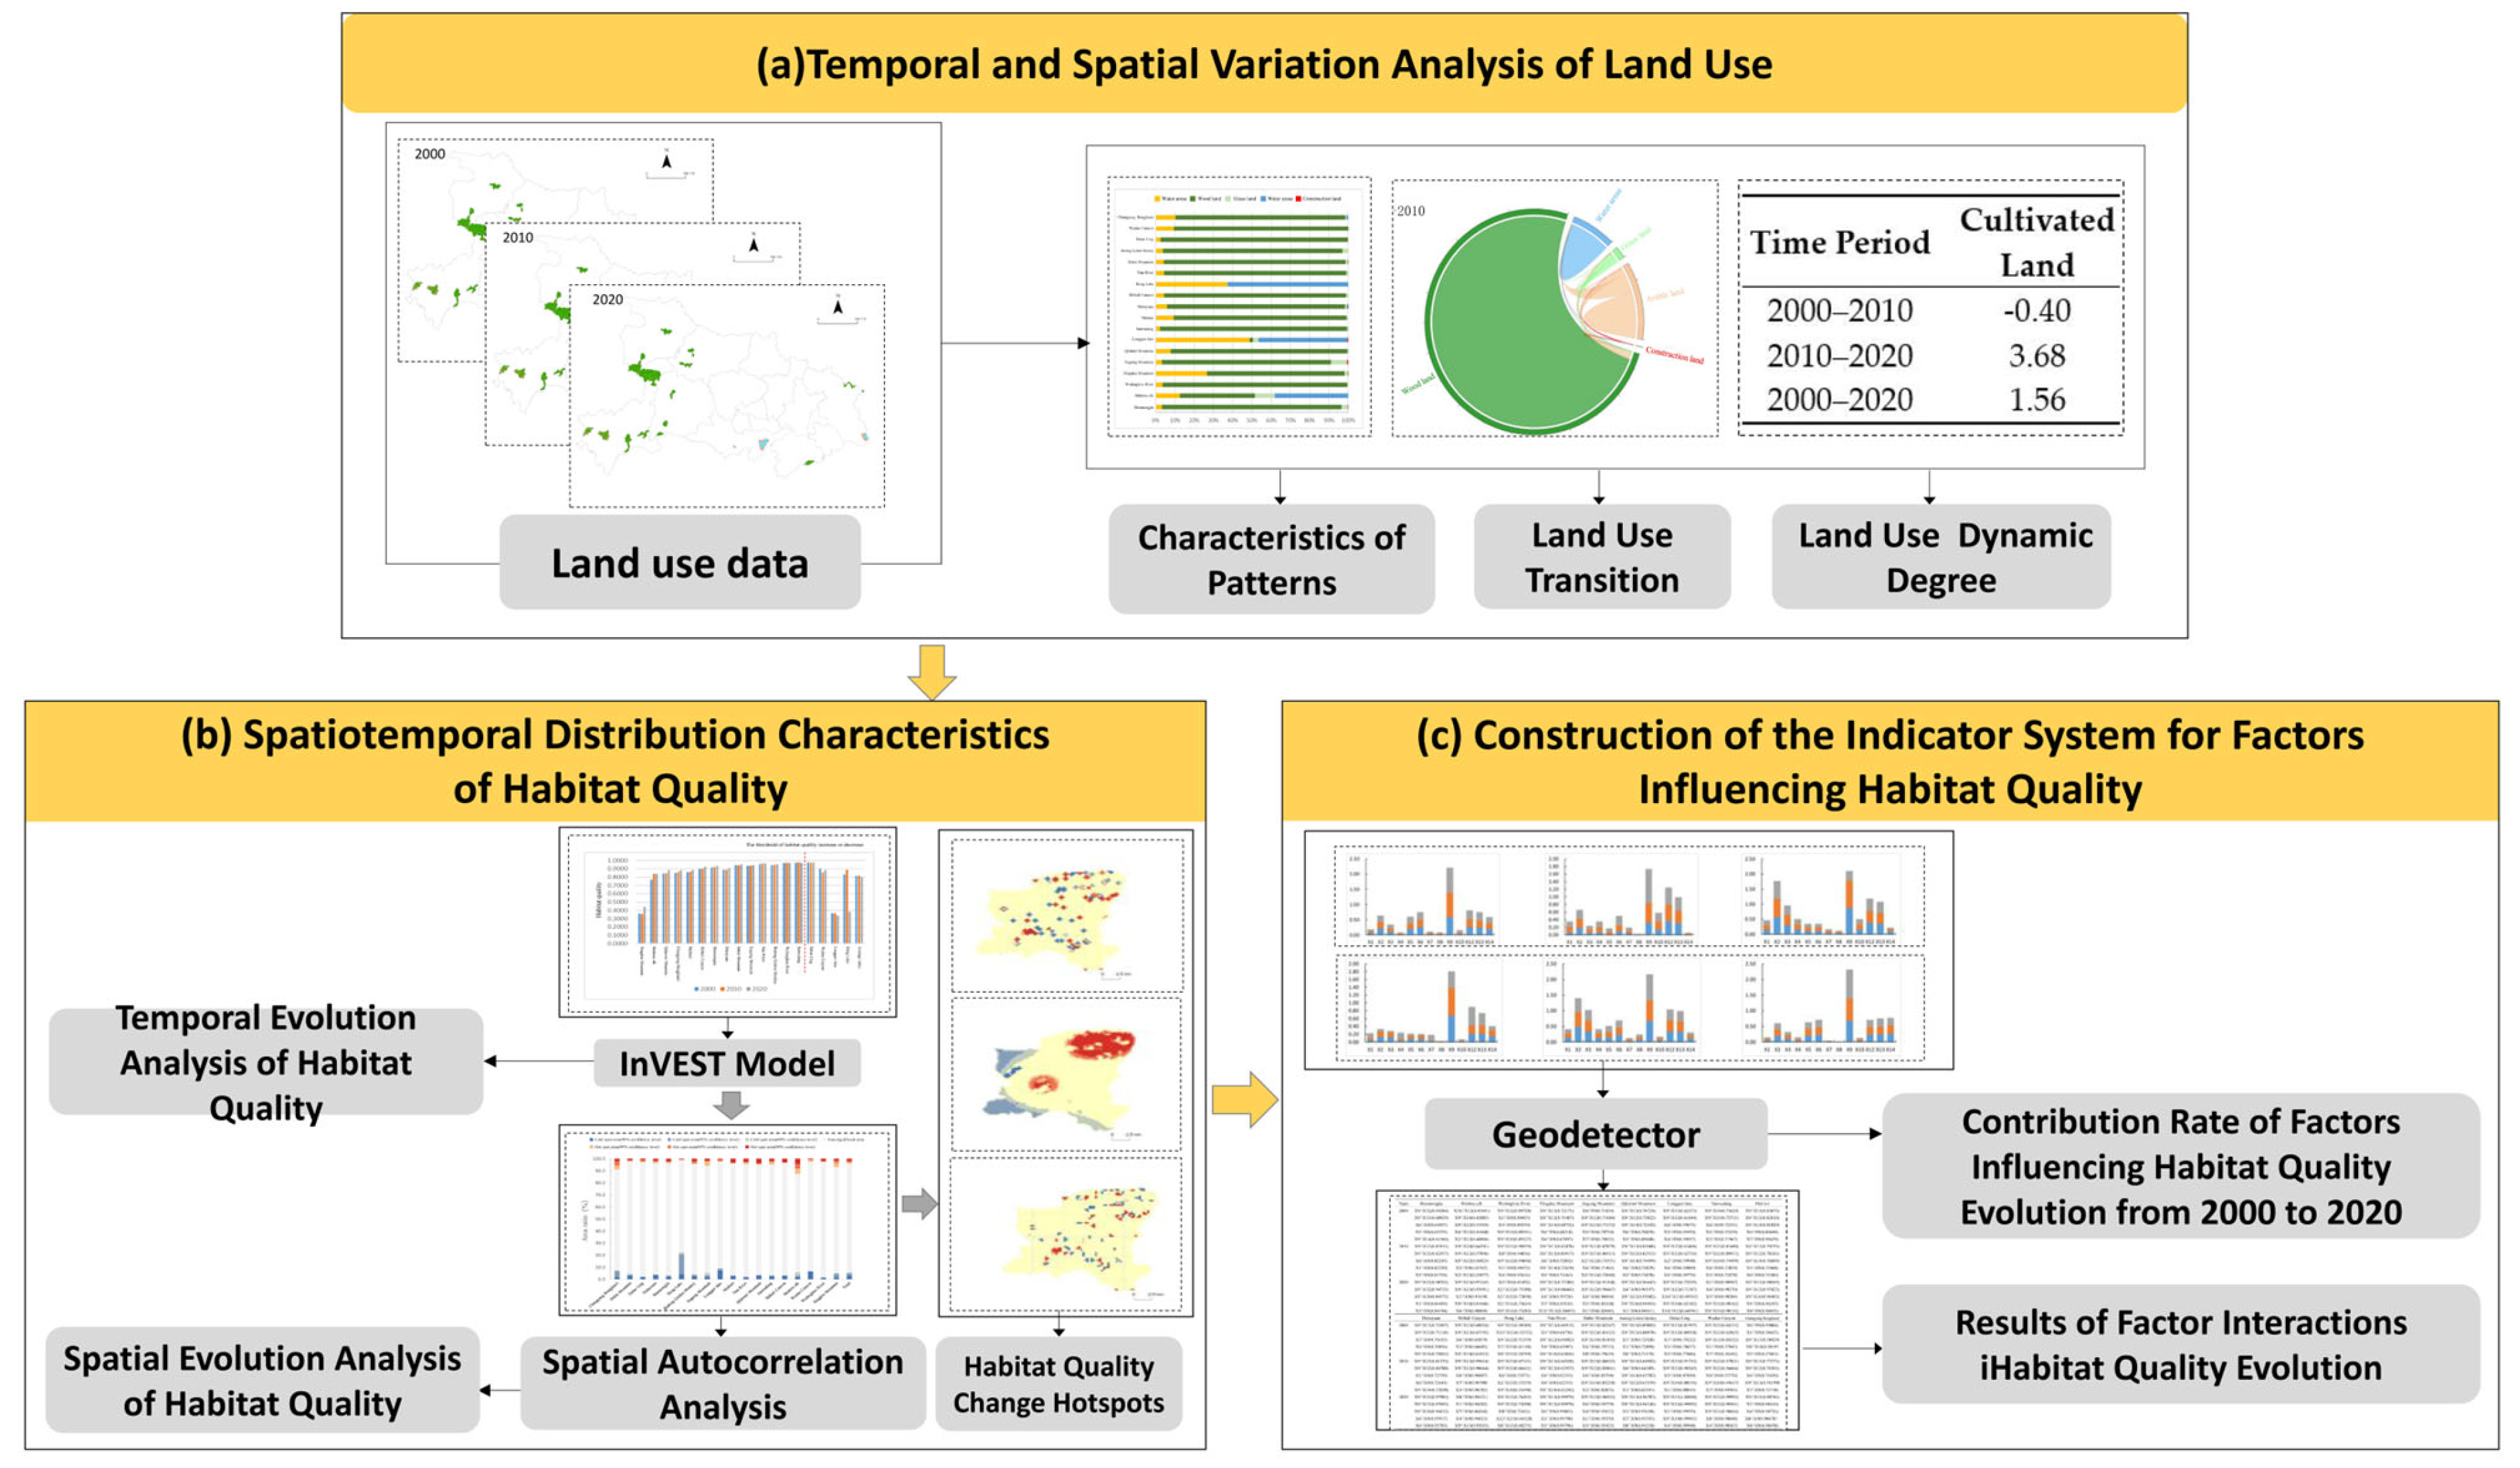
3. Results and Analysis

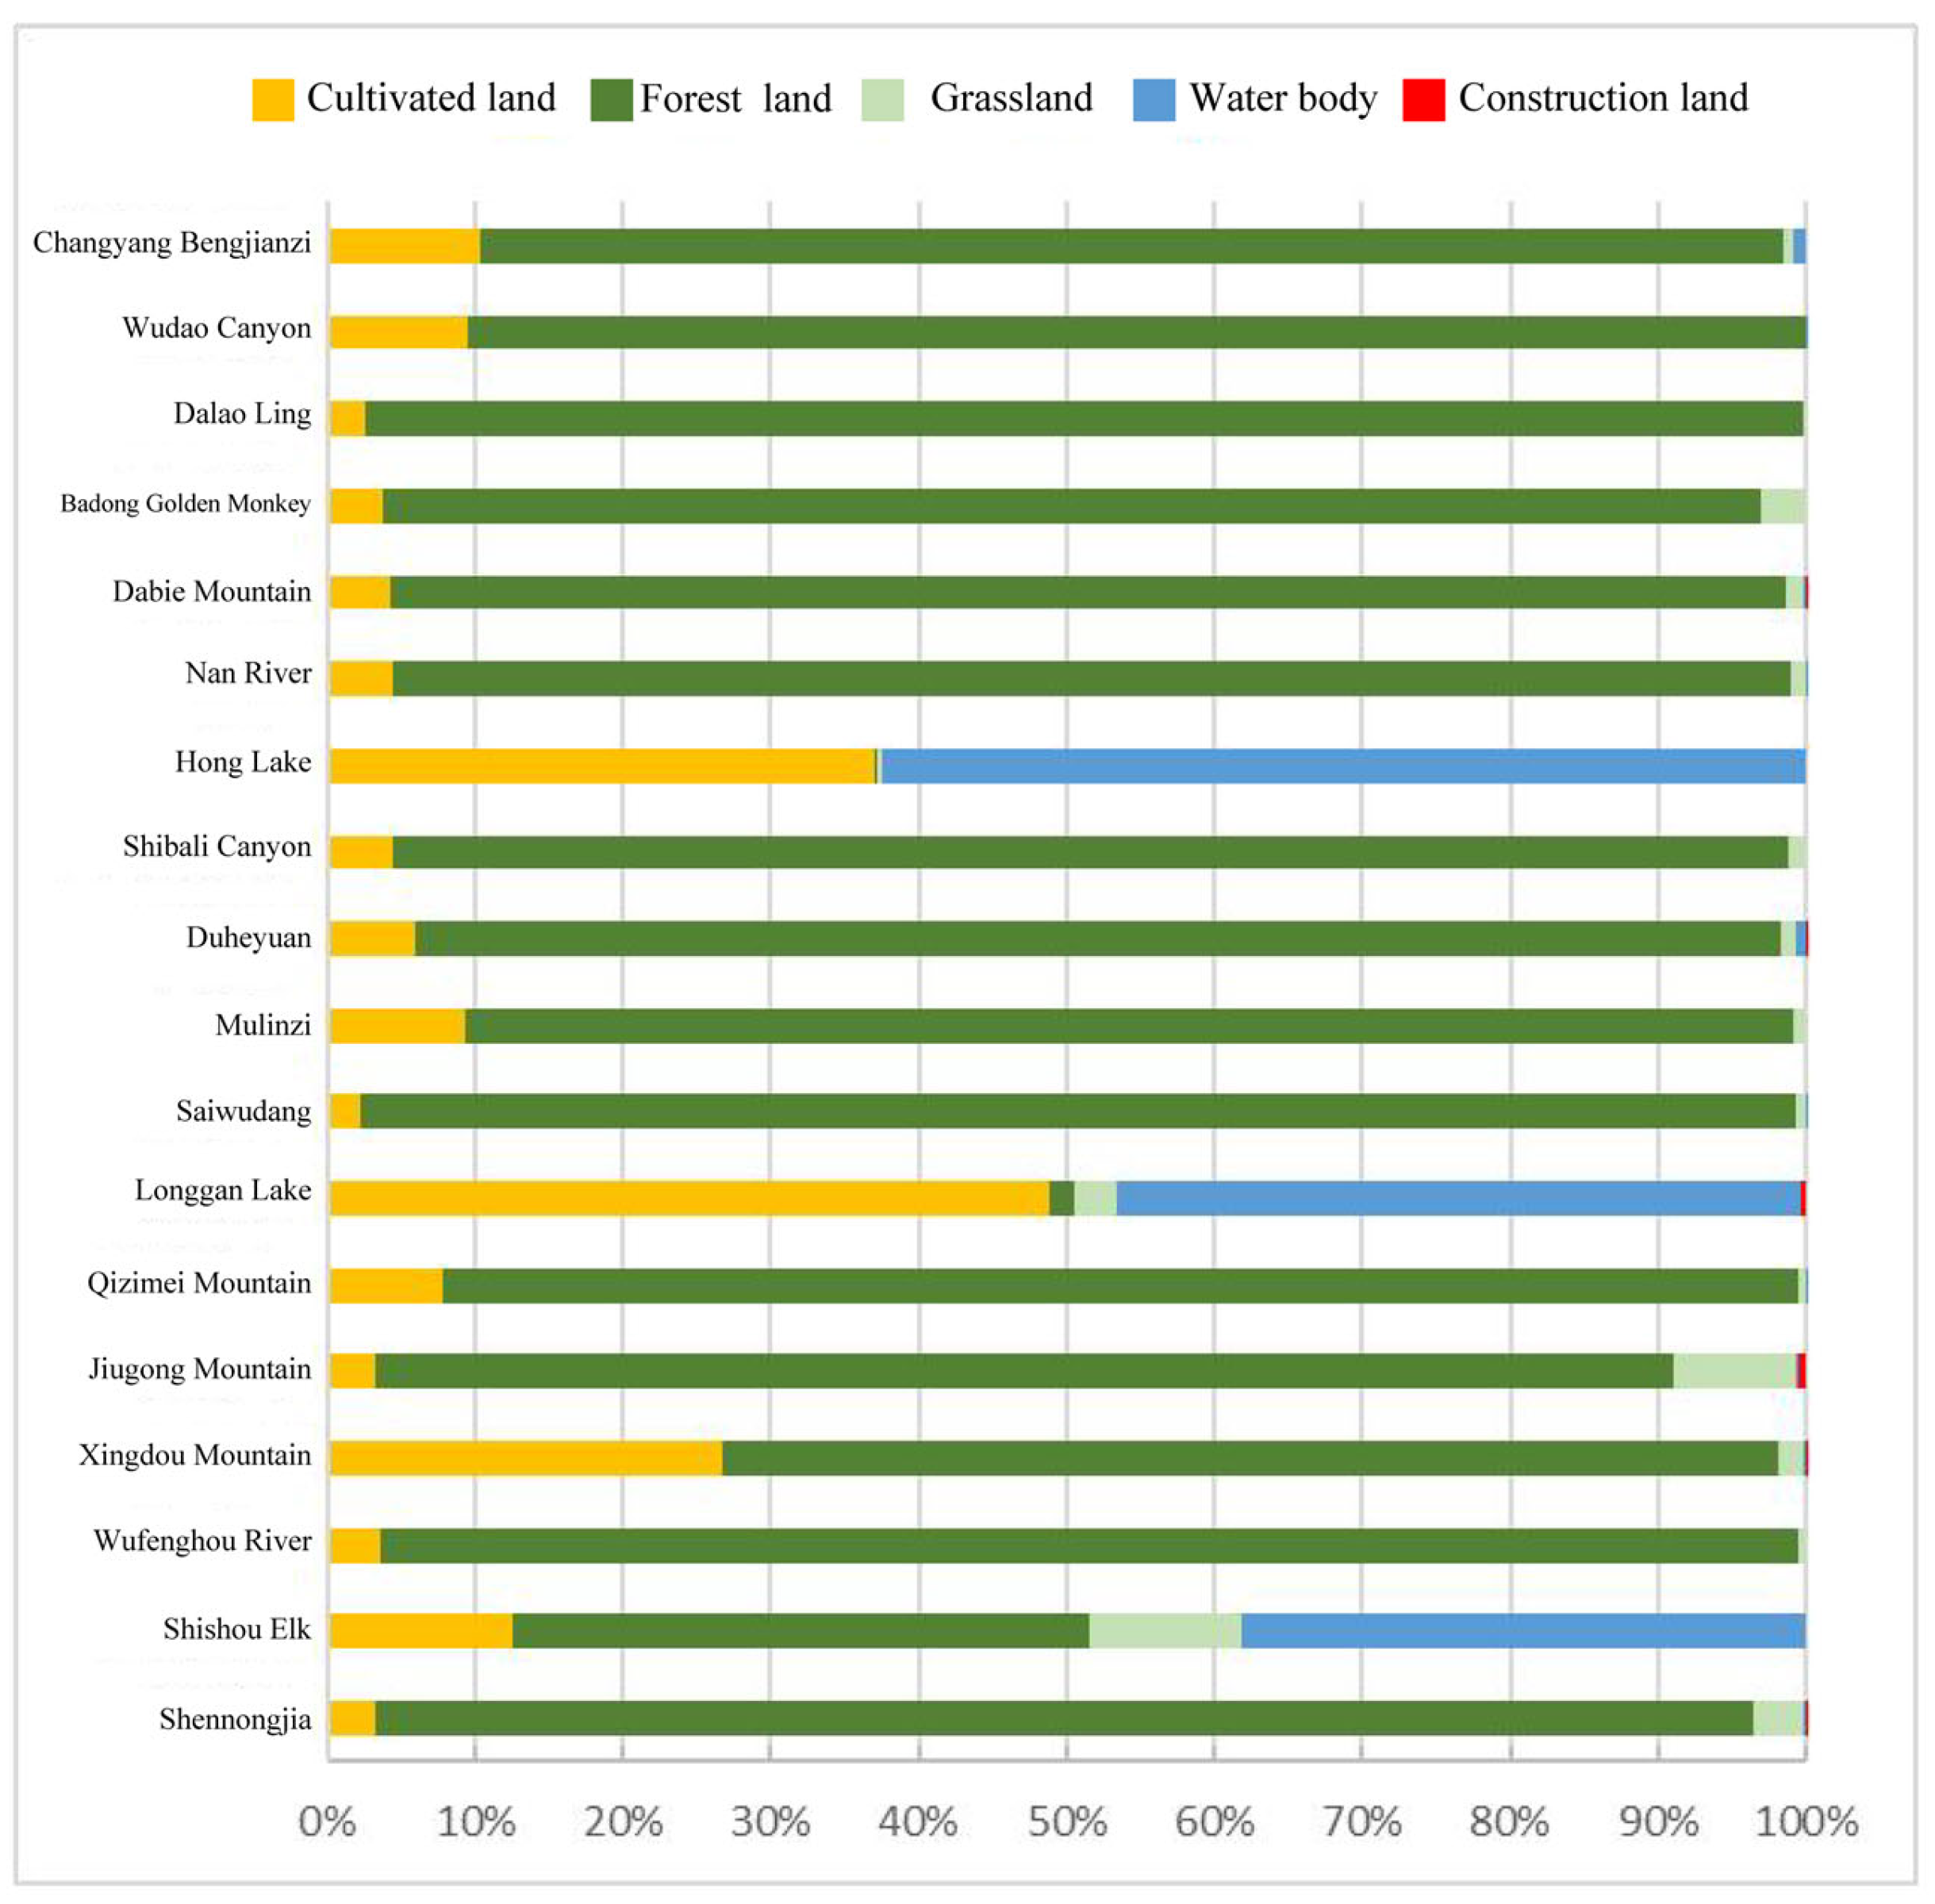
3.1. Analysis of Land Use Change

3.1.1. Characteristics of Land Use Patterns

The land use distribution of the 18 national nature reserves in Hubei Province shows significant regional differences and is relatively dispersed, primarily due to the influence of the region’s natural geographical foundation (Figure 3). Among them, forest ecosystem-type national nature reserves are concentrated in the Daba Mountain foothills in northwestern Hubei and the Wuling Mountain Range area in southwestern Hubei, while wetland-type national nature reserves are located in the middle Hubei along with the Yangtze River (Table 7 and Figure 4).
From a spatial perspective (Figure 5), the main types of land use in the national nature reserves of Hubei Province include forest land, grassland, cultivated land, water body, and construction land. The areas of each land use type, in descending order, are forest land > cultivated land > water body > grassland > construction land.

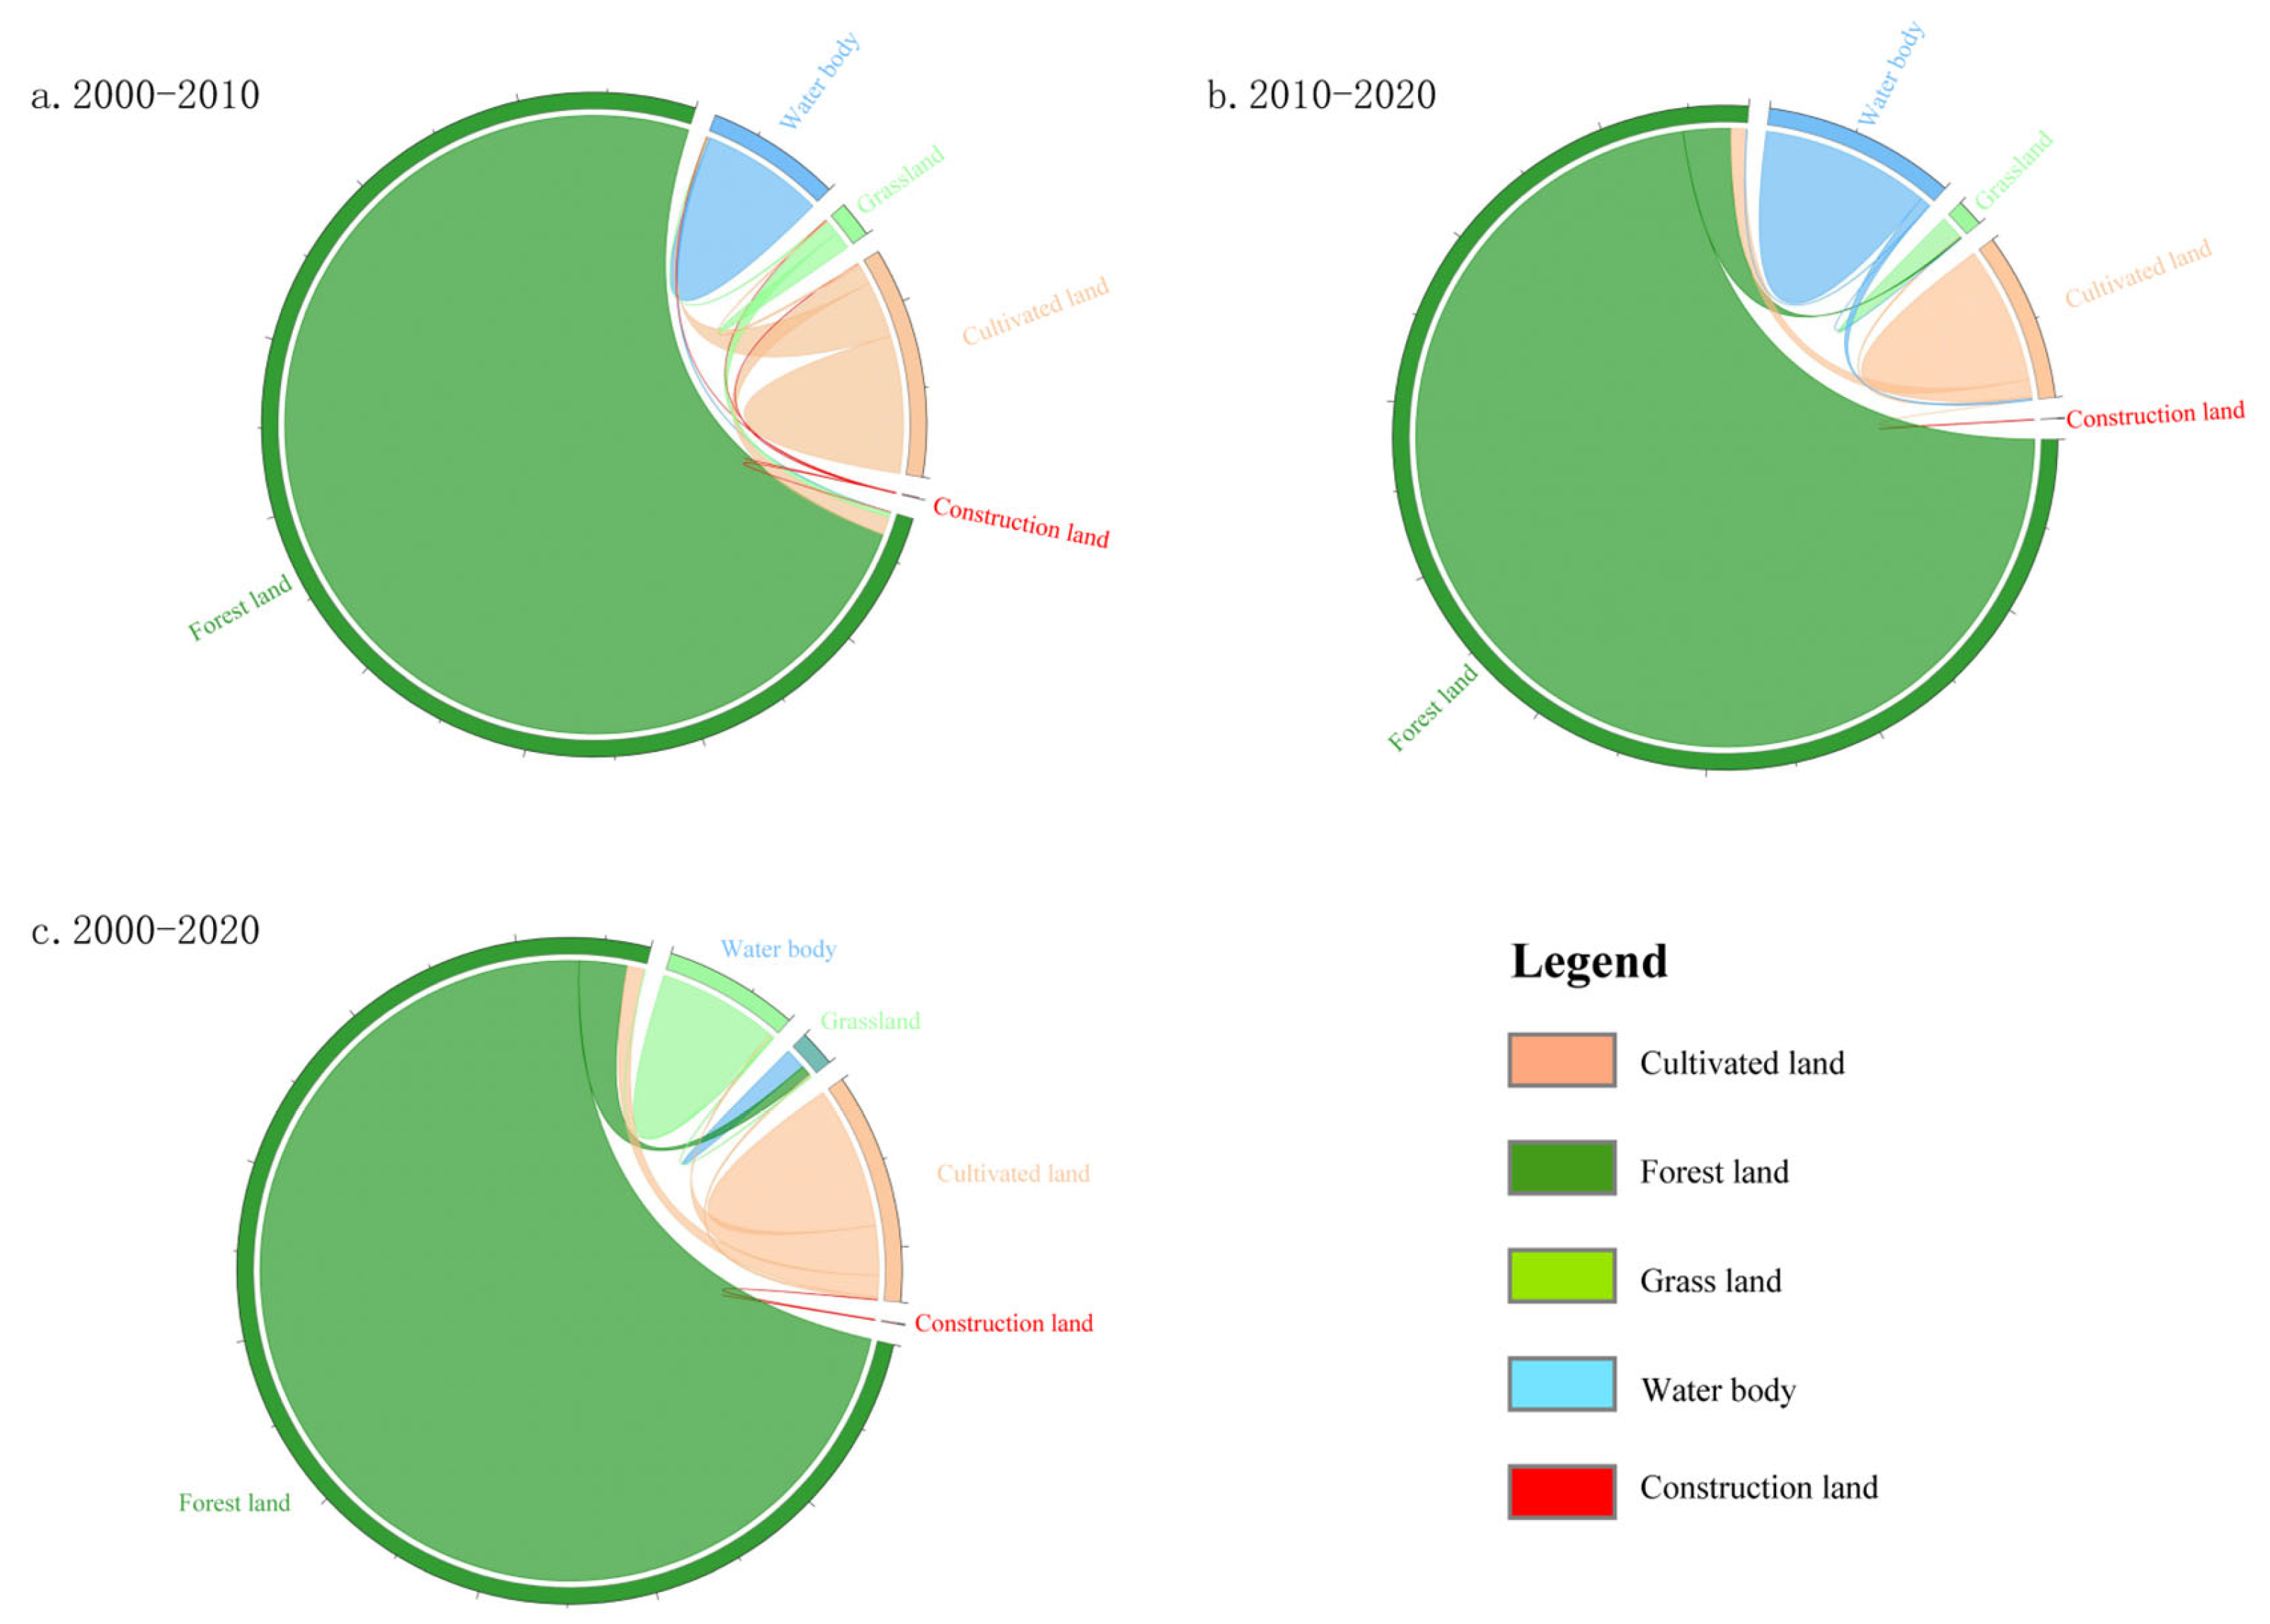
3.1.2. Analysis of Land Use Transition

Looking at the overall land use transition map from 2000 to 2020 for the 18 nature reserves in Hubei Province (Figure 6), overall land use changes show a stable trend. As shown in Table 8, from 2000 to 2010, the largest land transfer area was from grassland to forest land, followed by cultivated land to forest land, with a significant increase in forest land area, possibly related to the implementation of the Grain for Green policy in Hubei Province starting in 2000. Meanwhile, land transfers from forest land, grassland, and water bodies to construction land indicate that small areas within the reserves were encroached upon by human development activities during this period. From 2010 to 2020, the largest land transfer was from water bodies to cultivated land, with a transfer rate of 31.3%, confirming that during the period of rapid urbanization, the study area experienced extensive land reclamation from the lake, leading to significant erosion of ecological water bodies by urban and rural development.
Overall, from 2000 to 2020, the various types of land use in the national nature reserves of Hubei Province were dynamically changing, with various land types interchanging. The overall trend shows significant encroachment of cultivated land on grassland and water bodies, and minor encroachment of construction land on other land types, indicating a clear impact of rapid urbanization on the nature reserves. A slight increase in forest land area indicates the initial effectiveness of Hubei Province’s Grain for Green policy and nature reserve protection policies, but the protection of grassland and water body land use areas is insufficient.

3.1.3. Analysis of Land Use Dynamic Degree

According to Table 9, for the national nature reserves in Hubei Province from 2000 to 2020, the overall dynamic degree of land use increased from 0.27 to 0.34, indicating an accelerated rate of land use change and relatively active land use between 2010 and 2020. The dynamic degrees of construction land, water body, and cultivated land increased, while those of forest land and grassland decreased. Combined with the land use transition matrix analysis, this suggests that rapid urban development has accelerated the encroachment of construction land on cultivated land and water bodies. The dynamic degree of forest land increased from 2000 to 2010 but decreased from 2010 to 2020, with a gradual decrease in area, indicating reduced protection and restoration efforts for forest land during this period, consistent with the previous land use analysis.

3.2. Spatiotemporal Distribution Characteristics of Habitat Quality

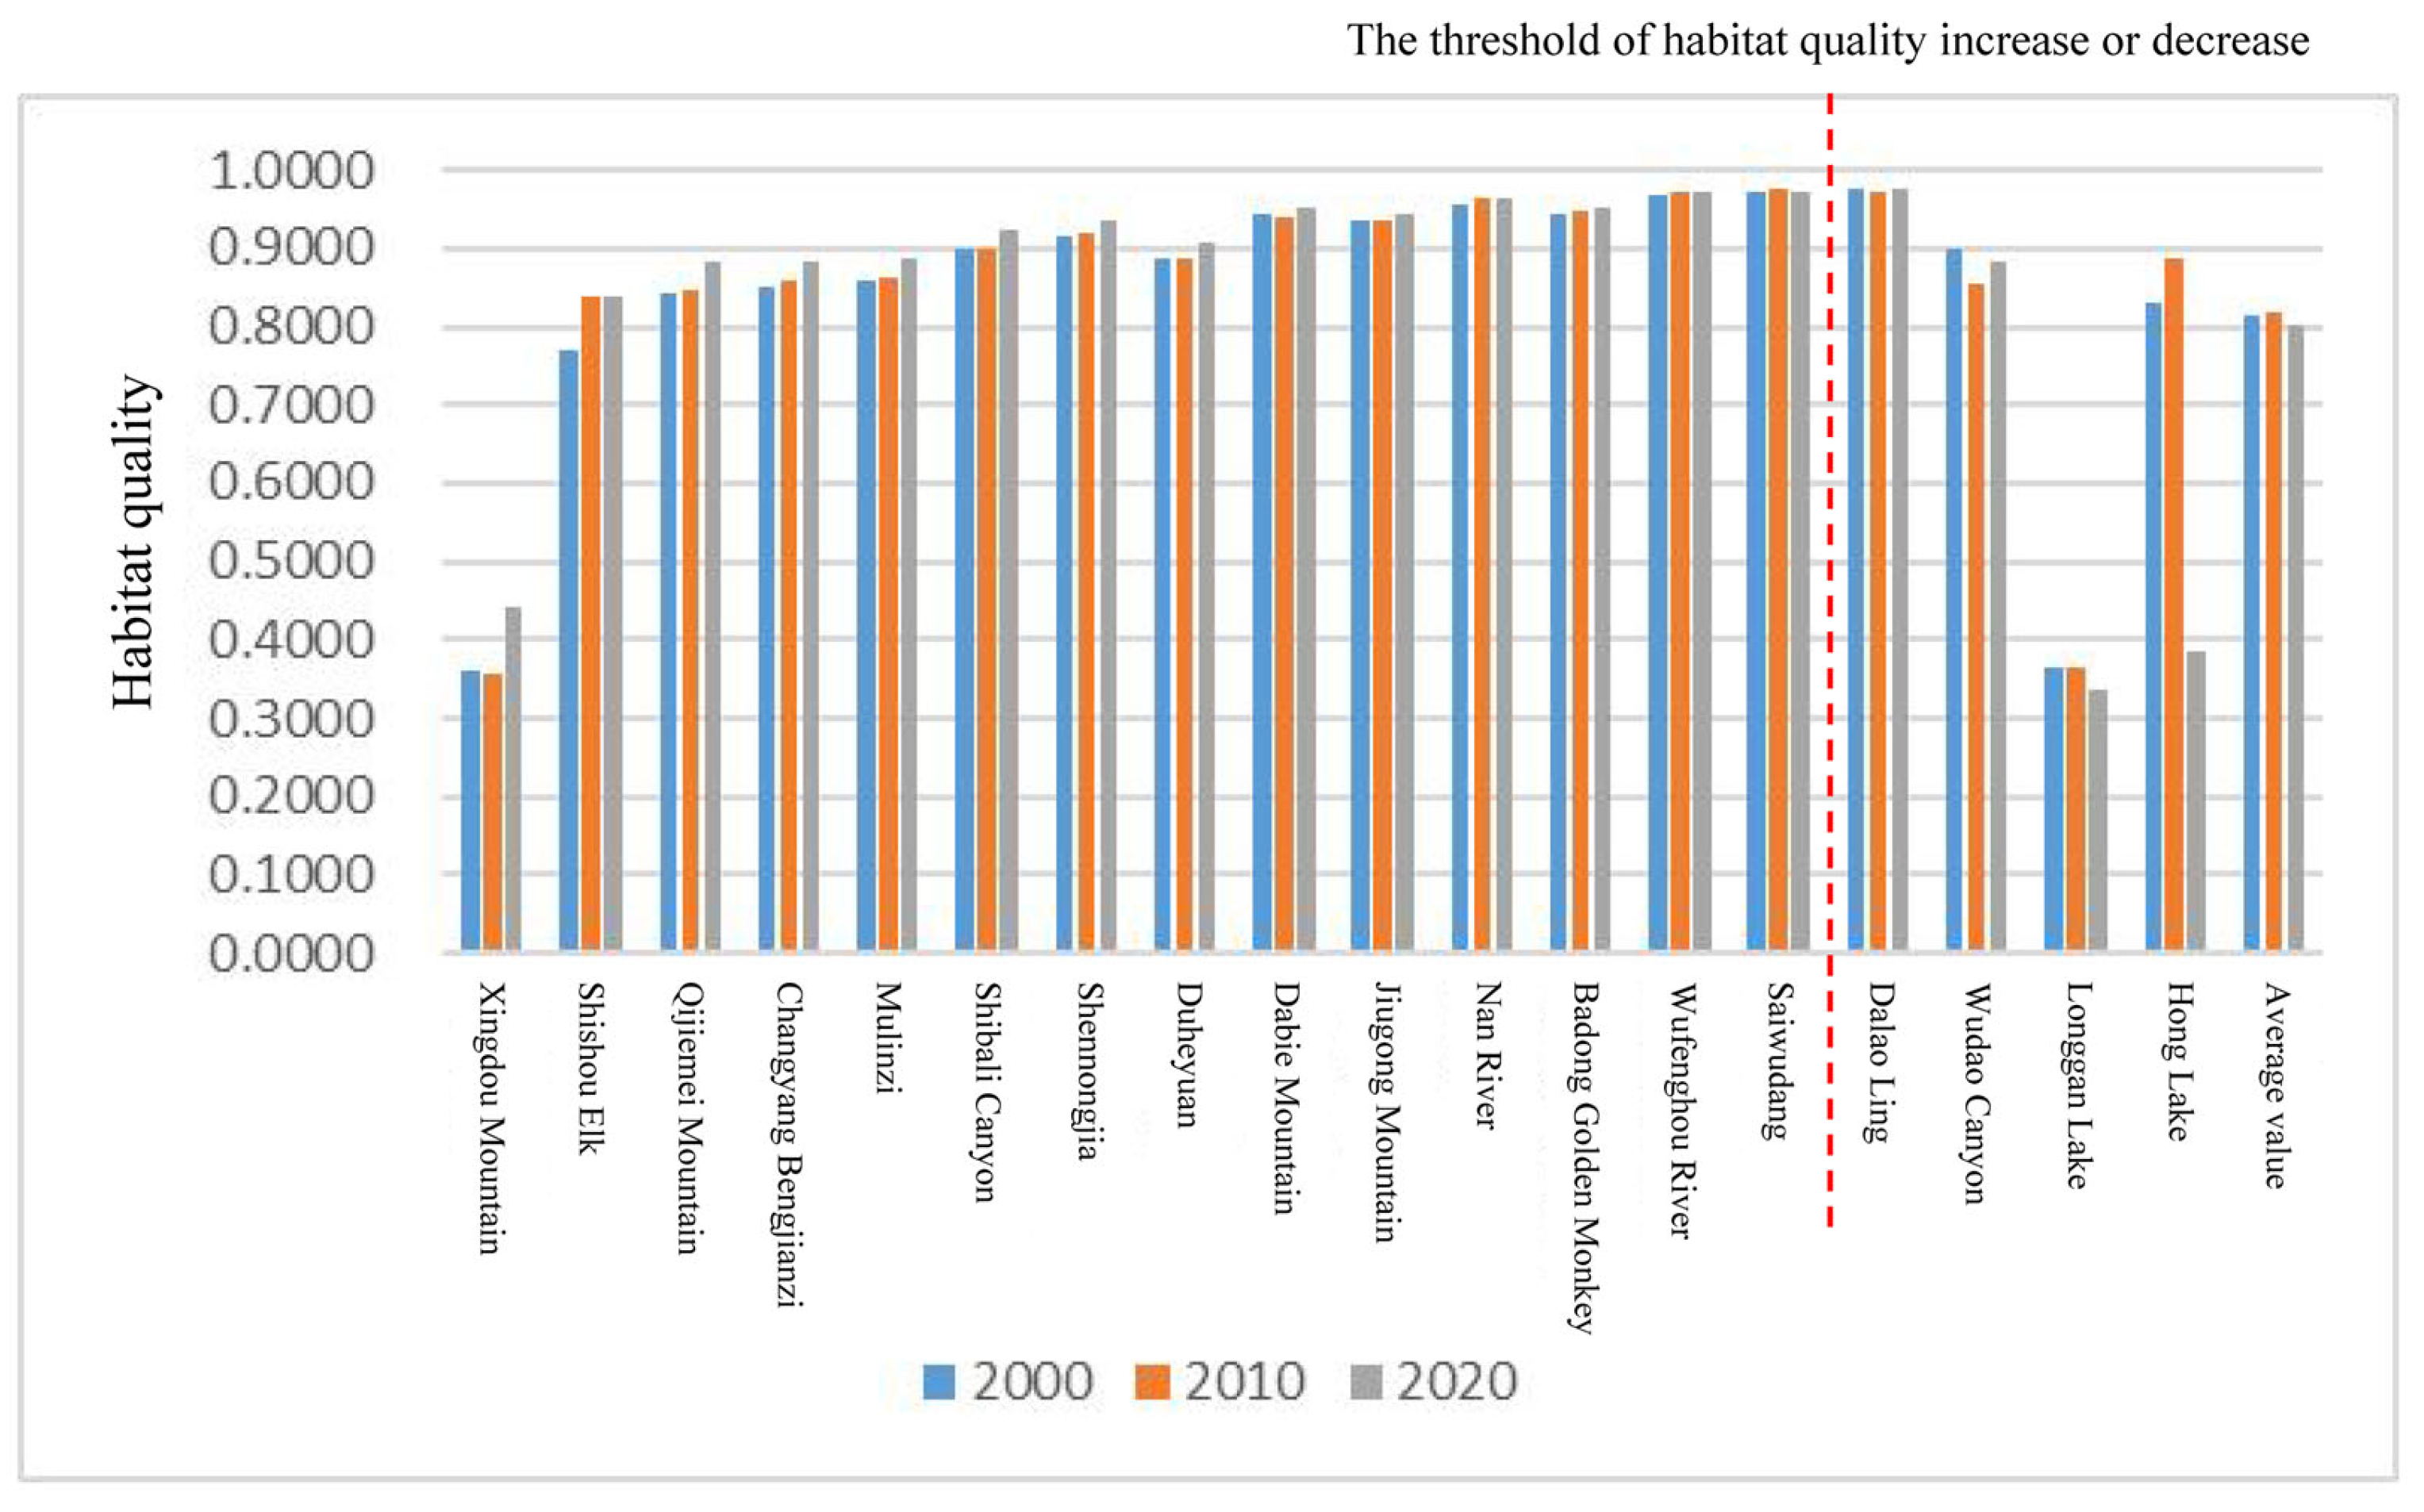
3.2.1. Temporal Evolution Analysis of Habitat Quality

The InVEST model was used to calculate the average habitat quality indices for Hubei Province’s national nature reserves in 2000, 2010, and 2020, which were 0.8147, 0.8196, and 0.8016, respectively (Figure 7). The average habitat quality was 0.8120, which is generally at a higher level. However, the standard deviations were 0.2520, 0.2516, and 0.2728, showing a gradually increasing trend. This indicates that the spatial heterogeneity of habitat quality within the nature reserves has been increasing, which aligns with the analysis of land use dynamics discussed earlier.
Using the equal interval method in ArcGIS, habitat quality was classified into four levels, and a table showing their area proportions was created (Table 10). Analysis in conjunction with Table 8 reveals that although the overall habitat quality in the study area is good, the distribution of high, medium, and low habitat quality areas within the nature reserves is uneven. Taking 2010 as an example, high-quality habitat areas accounted for 78.72% while the combined proportion of the lower and lowest quality areas was 17.42%, with a smaller proportion in the relatively high-quality category. From 2000 to 2020, the proportion of high-quality habitat areas first increased and then decreased, showing an overall downward trend. The proportion of relatively high-quality areas first decreased and then increased, showing an overall upward trend. The areas of low and relatively low-quality habitats continued to grow. The decrease in high-quality habitat areas, along with the increase in relatively high, relatively low, and low-quality areas, is consistent with the slightly declining trend in the habitat quality index mentioned earlier.
Between 2000 and 2020, 14 national nature reserves in Hubei Province experienced an improvement in habitat quality, while 4 saw a slight decline. The four reserves with declining habitat quality were Longgan Lake, Sanxia Dalao Ridge, Honghu, and Wudaoxia, with decreases of 0.0285, 0.0013, 0.4445, and 0.0167, respectively. Analysis of the land use transition matrix shows that the decline in habitat quality in these reserves was due to varying degrees of encroachment of farmland on forests, grasslands, and water bodies. This is attributed to practices where farmers sacrifice natural environments, such as clearing forests and grasslands, to obtain crop yields and economic benefits. This results in a significant loss of living and breeding conditions for many species within the reserves, posing a severe threat to biodiversity and leading to a decline in habitat quality.

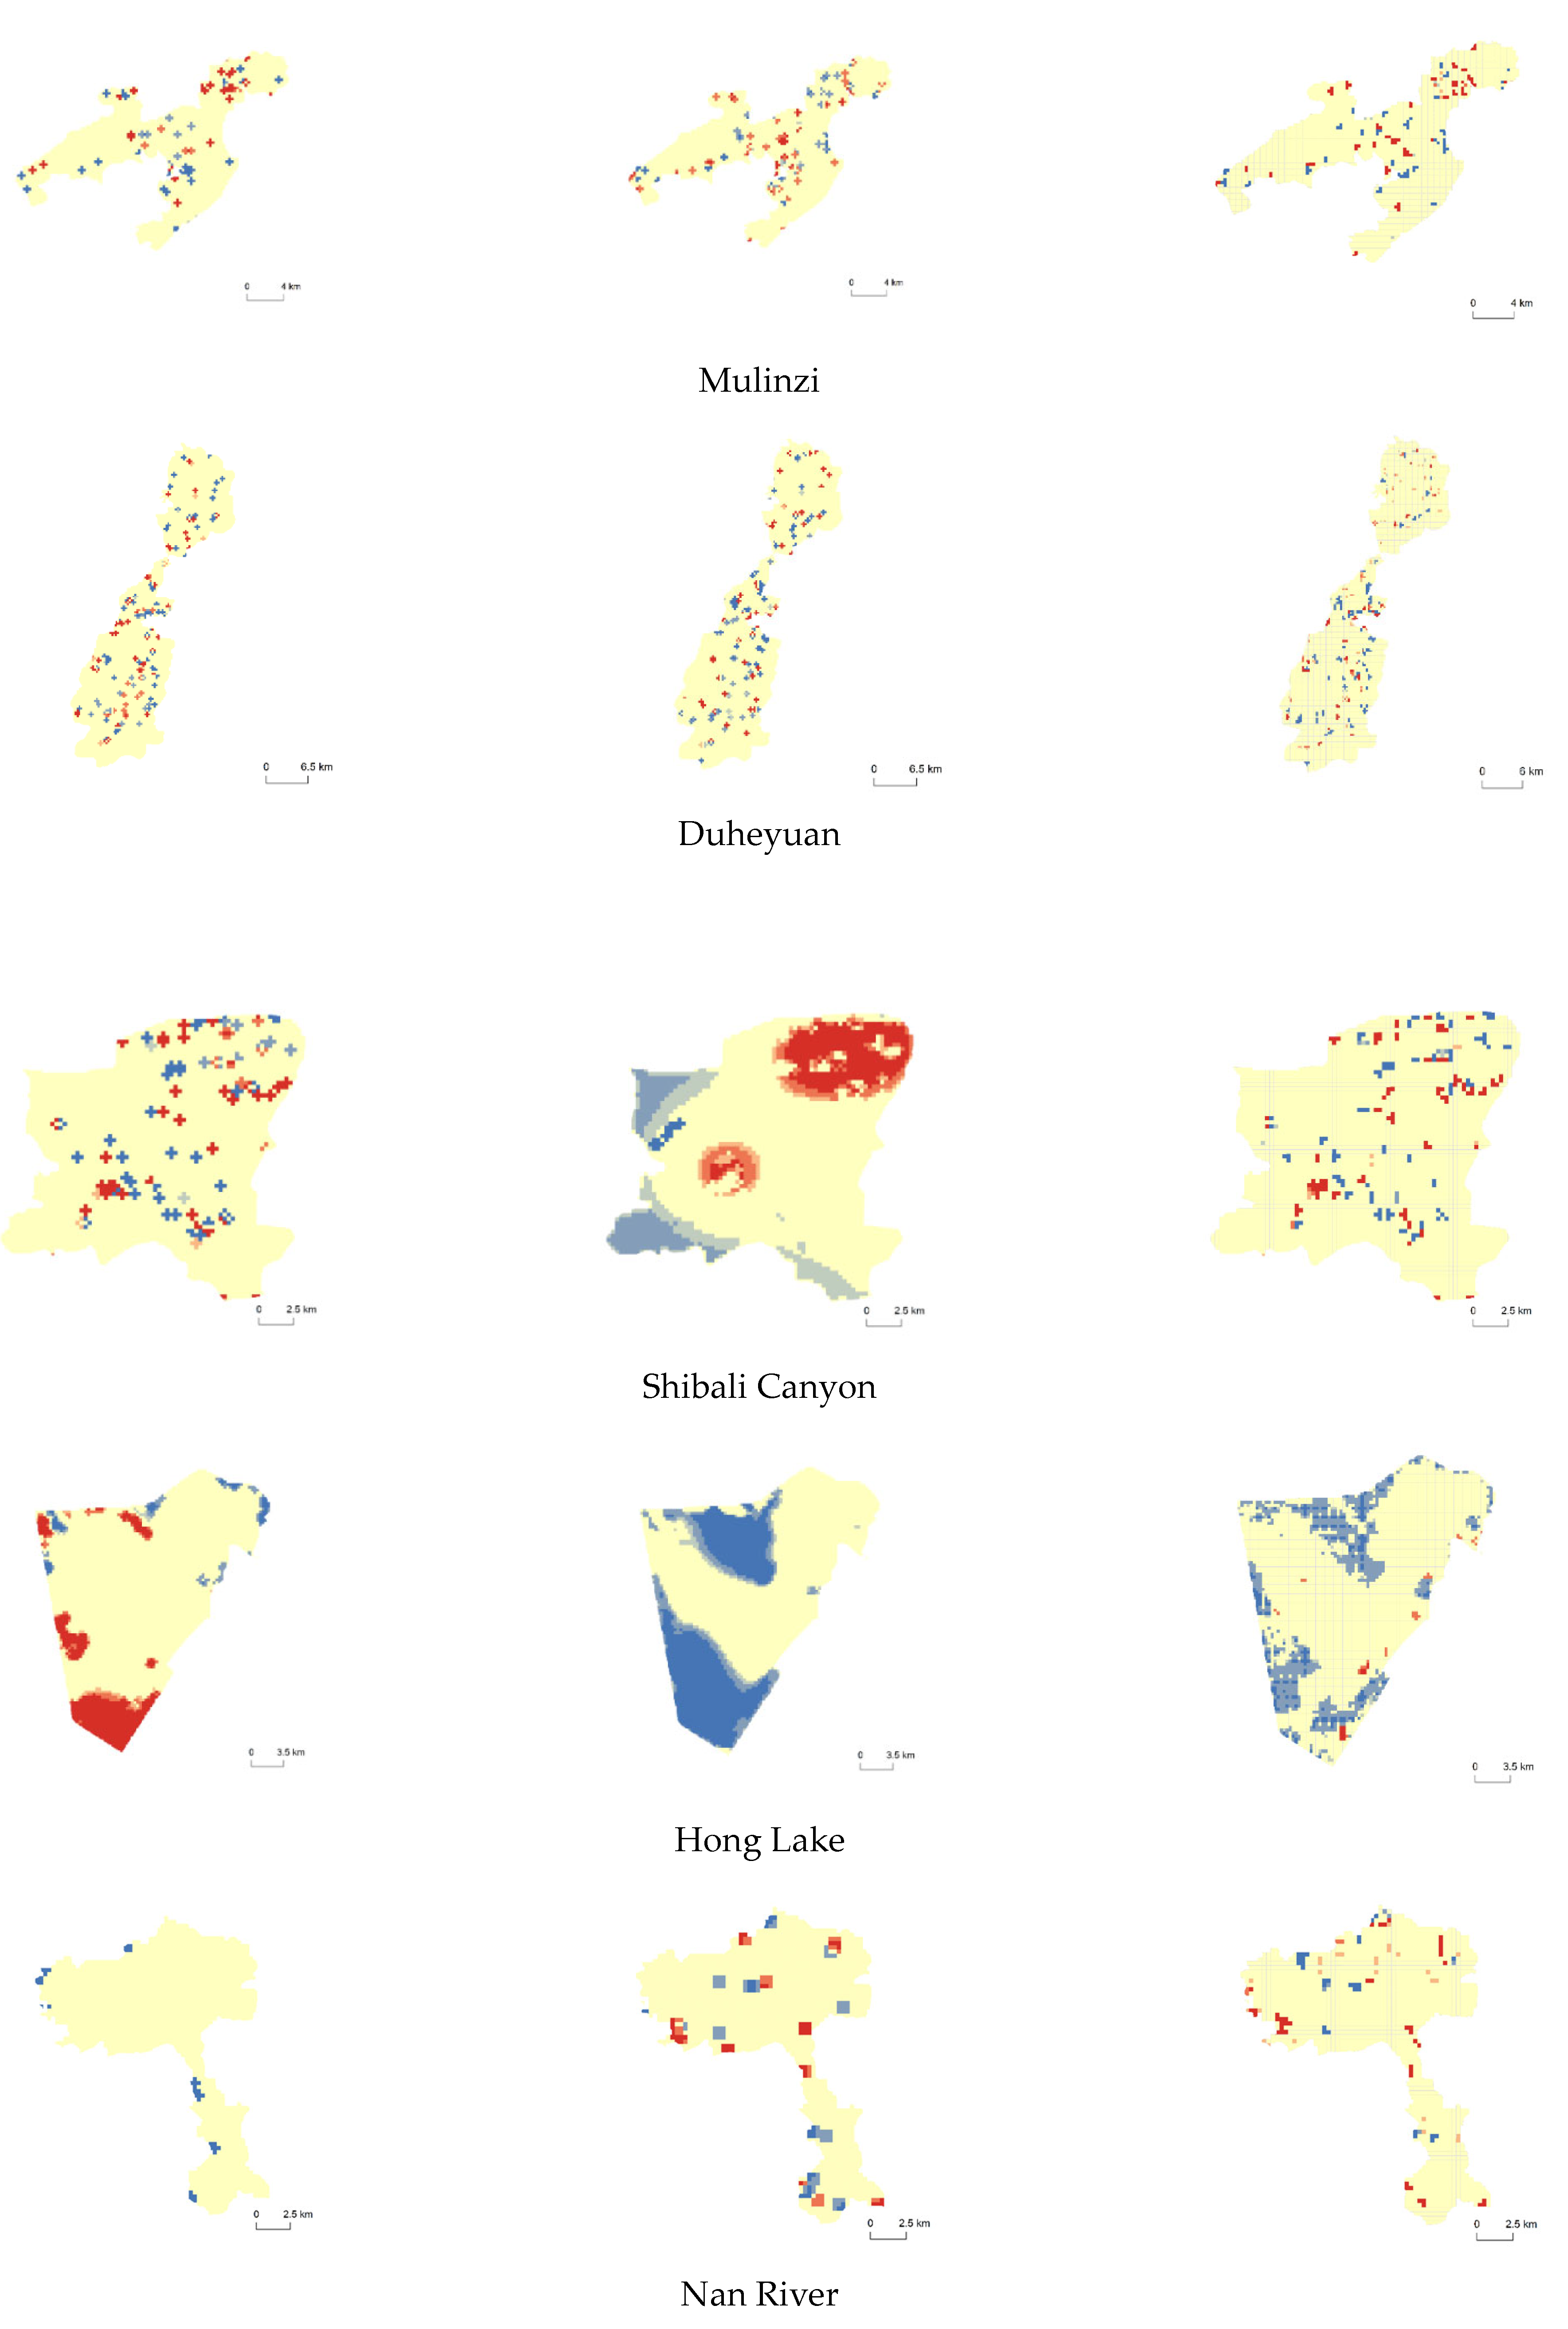
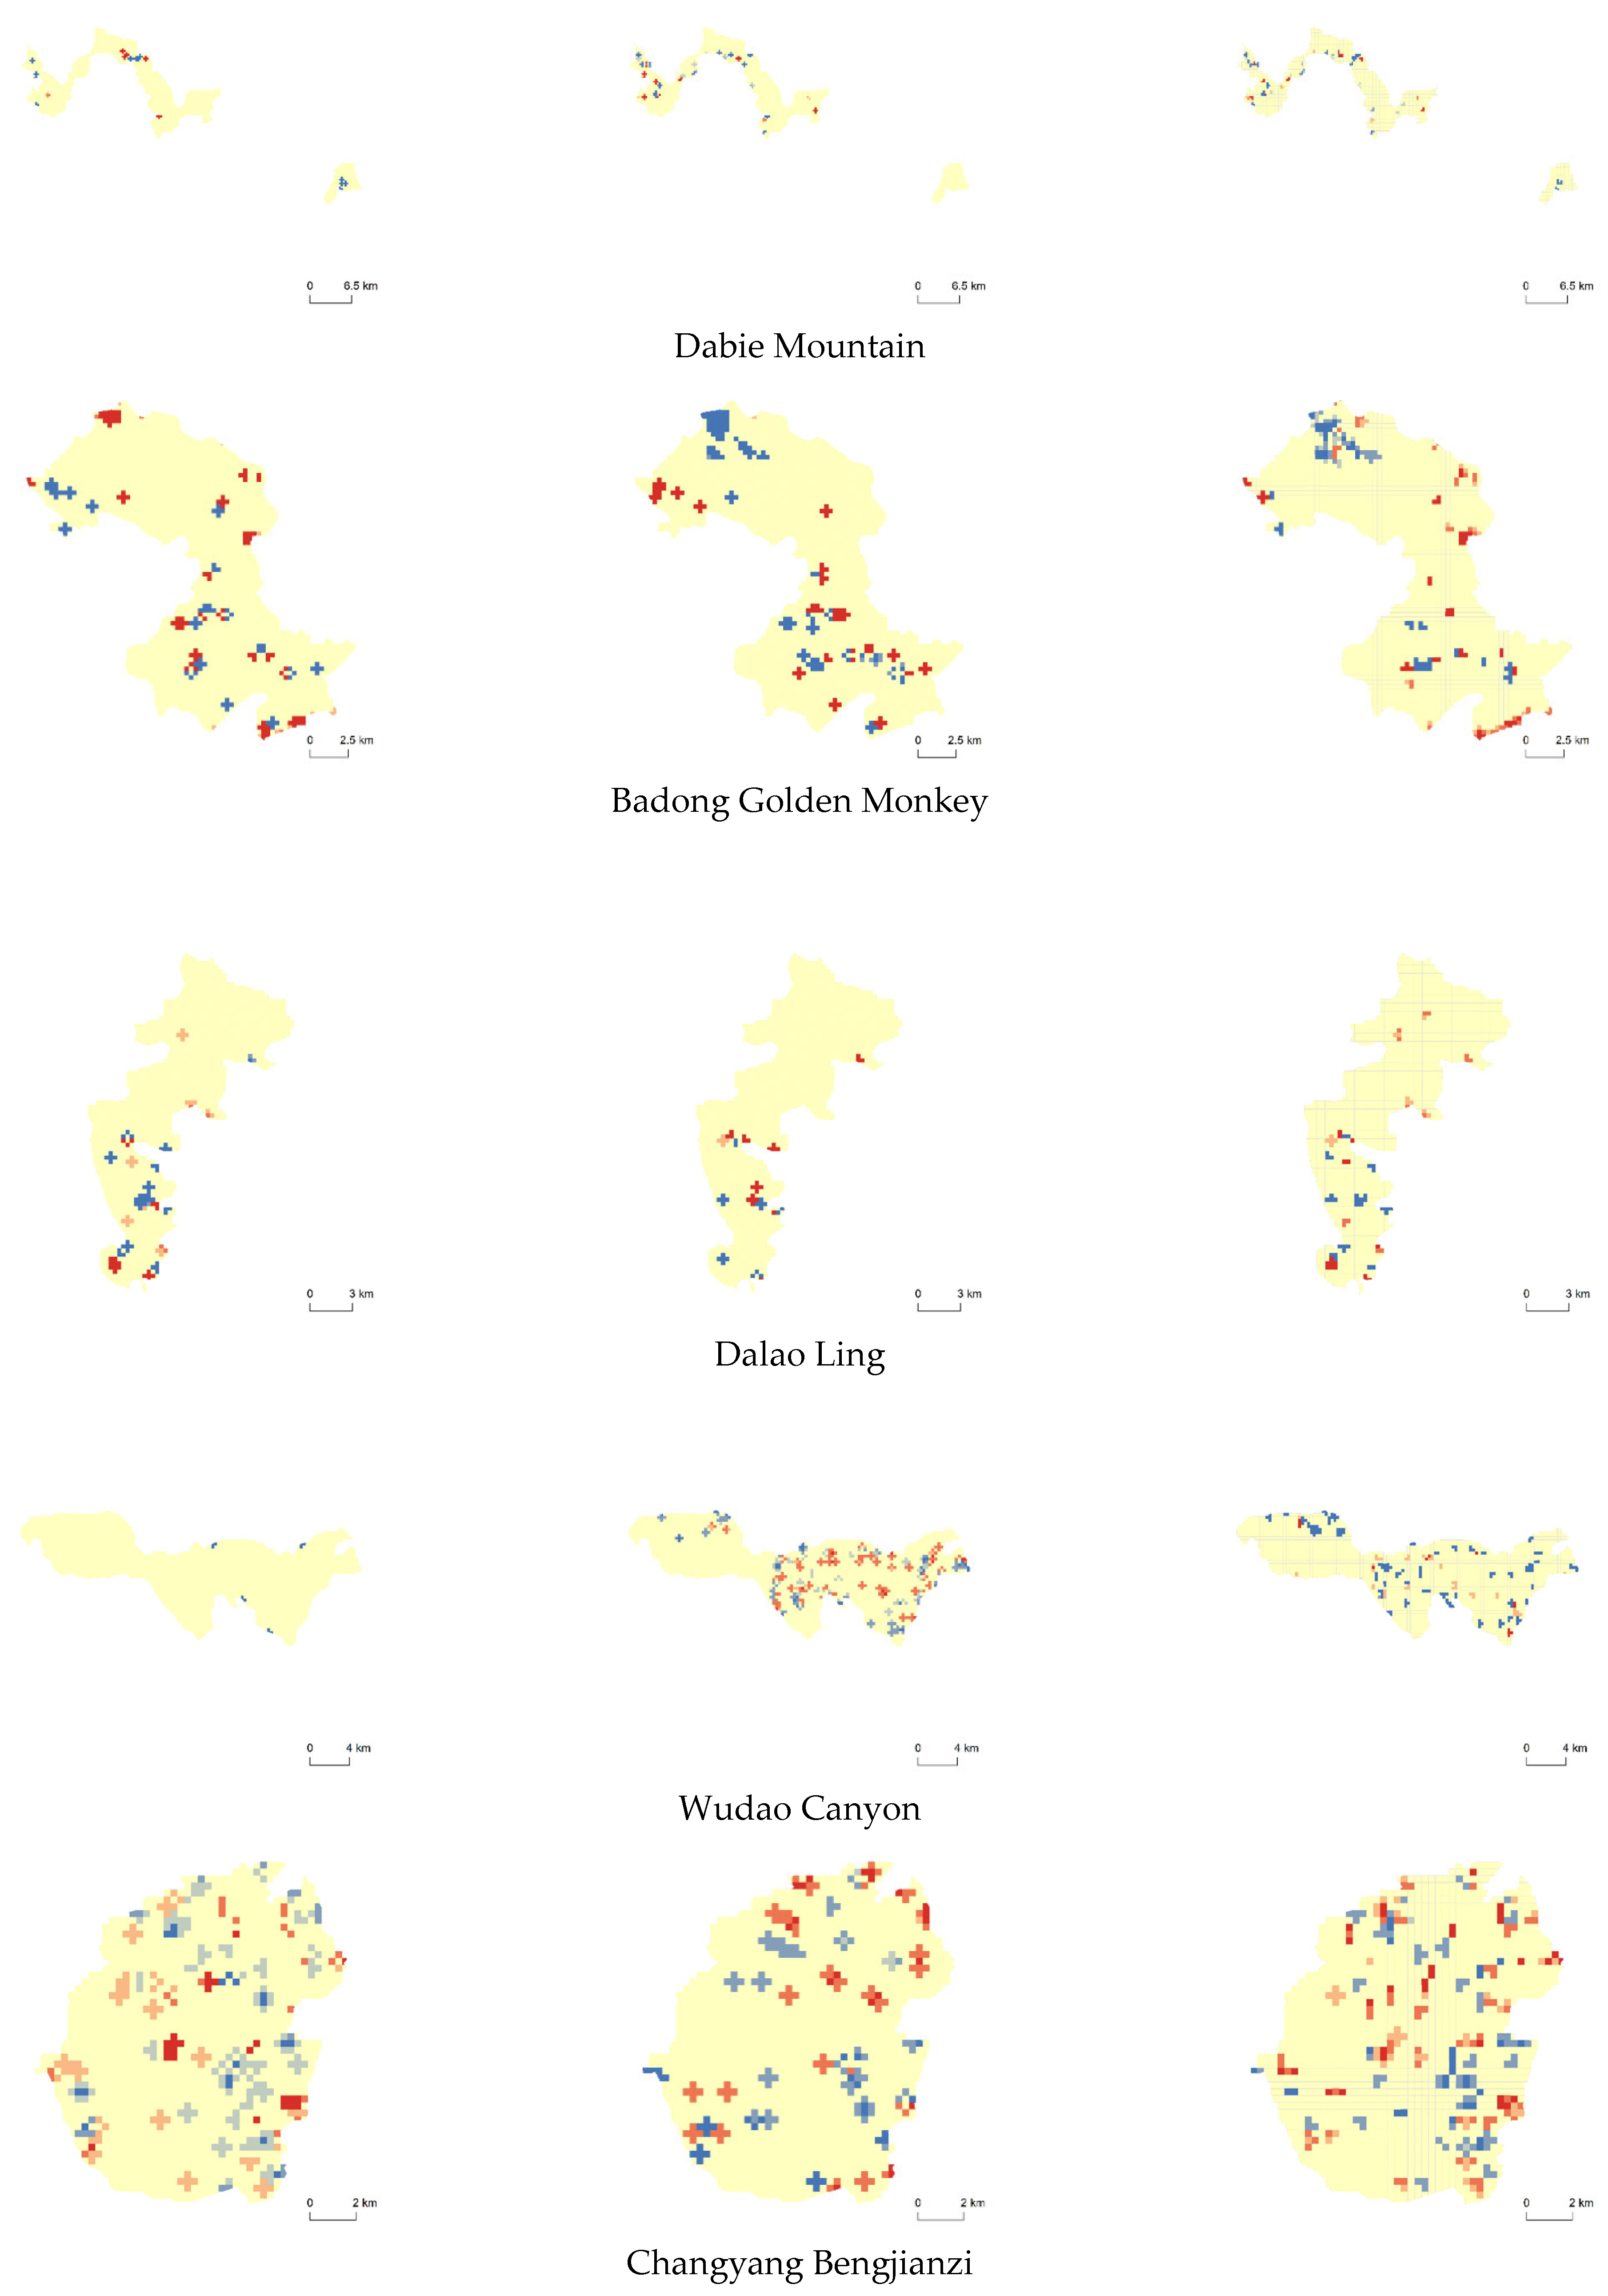
3.2.2. Analysis of Spatial Evolution of Habitat Quality

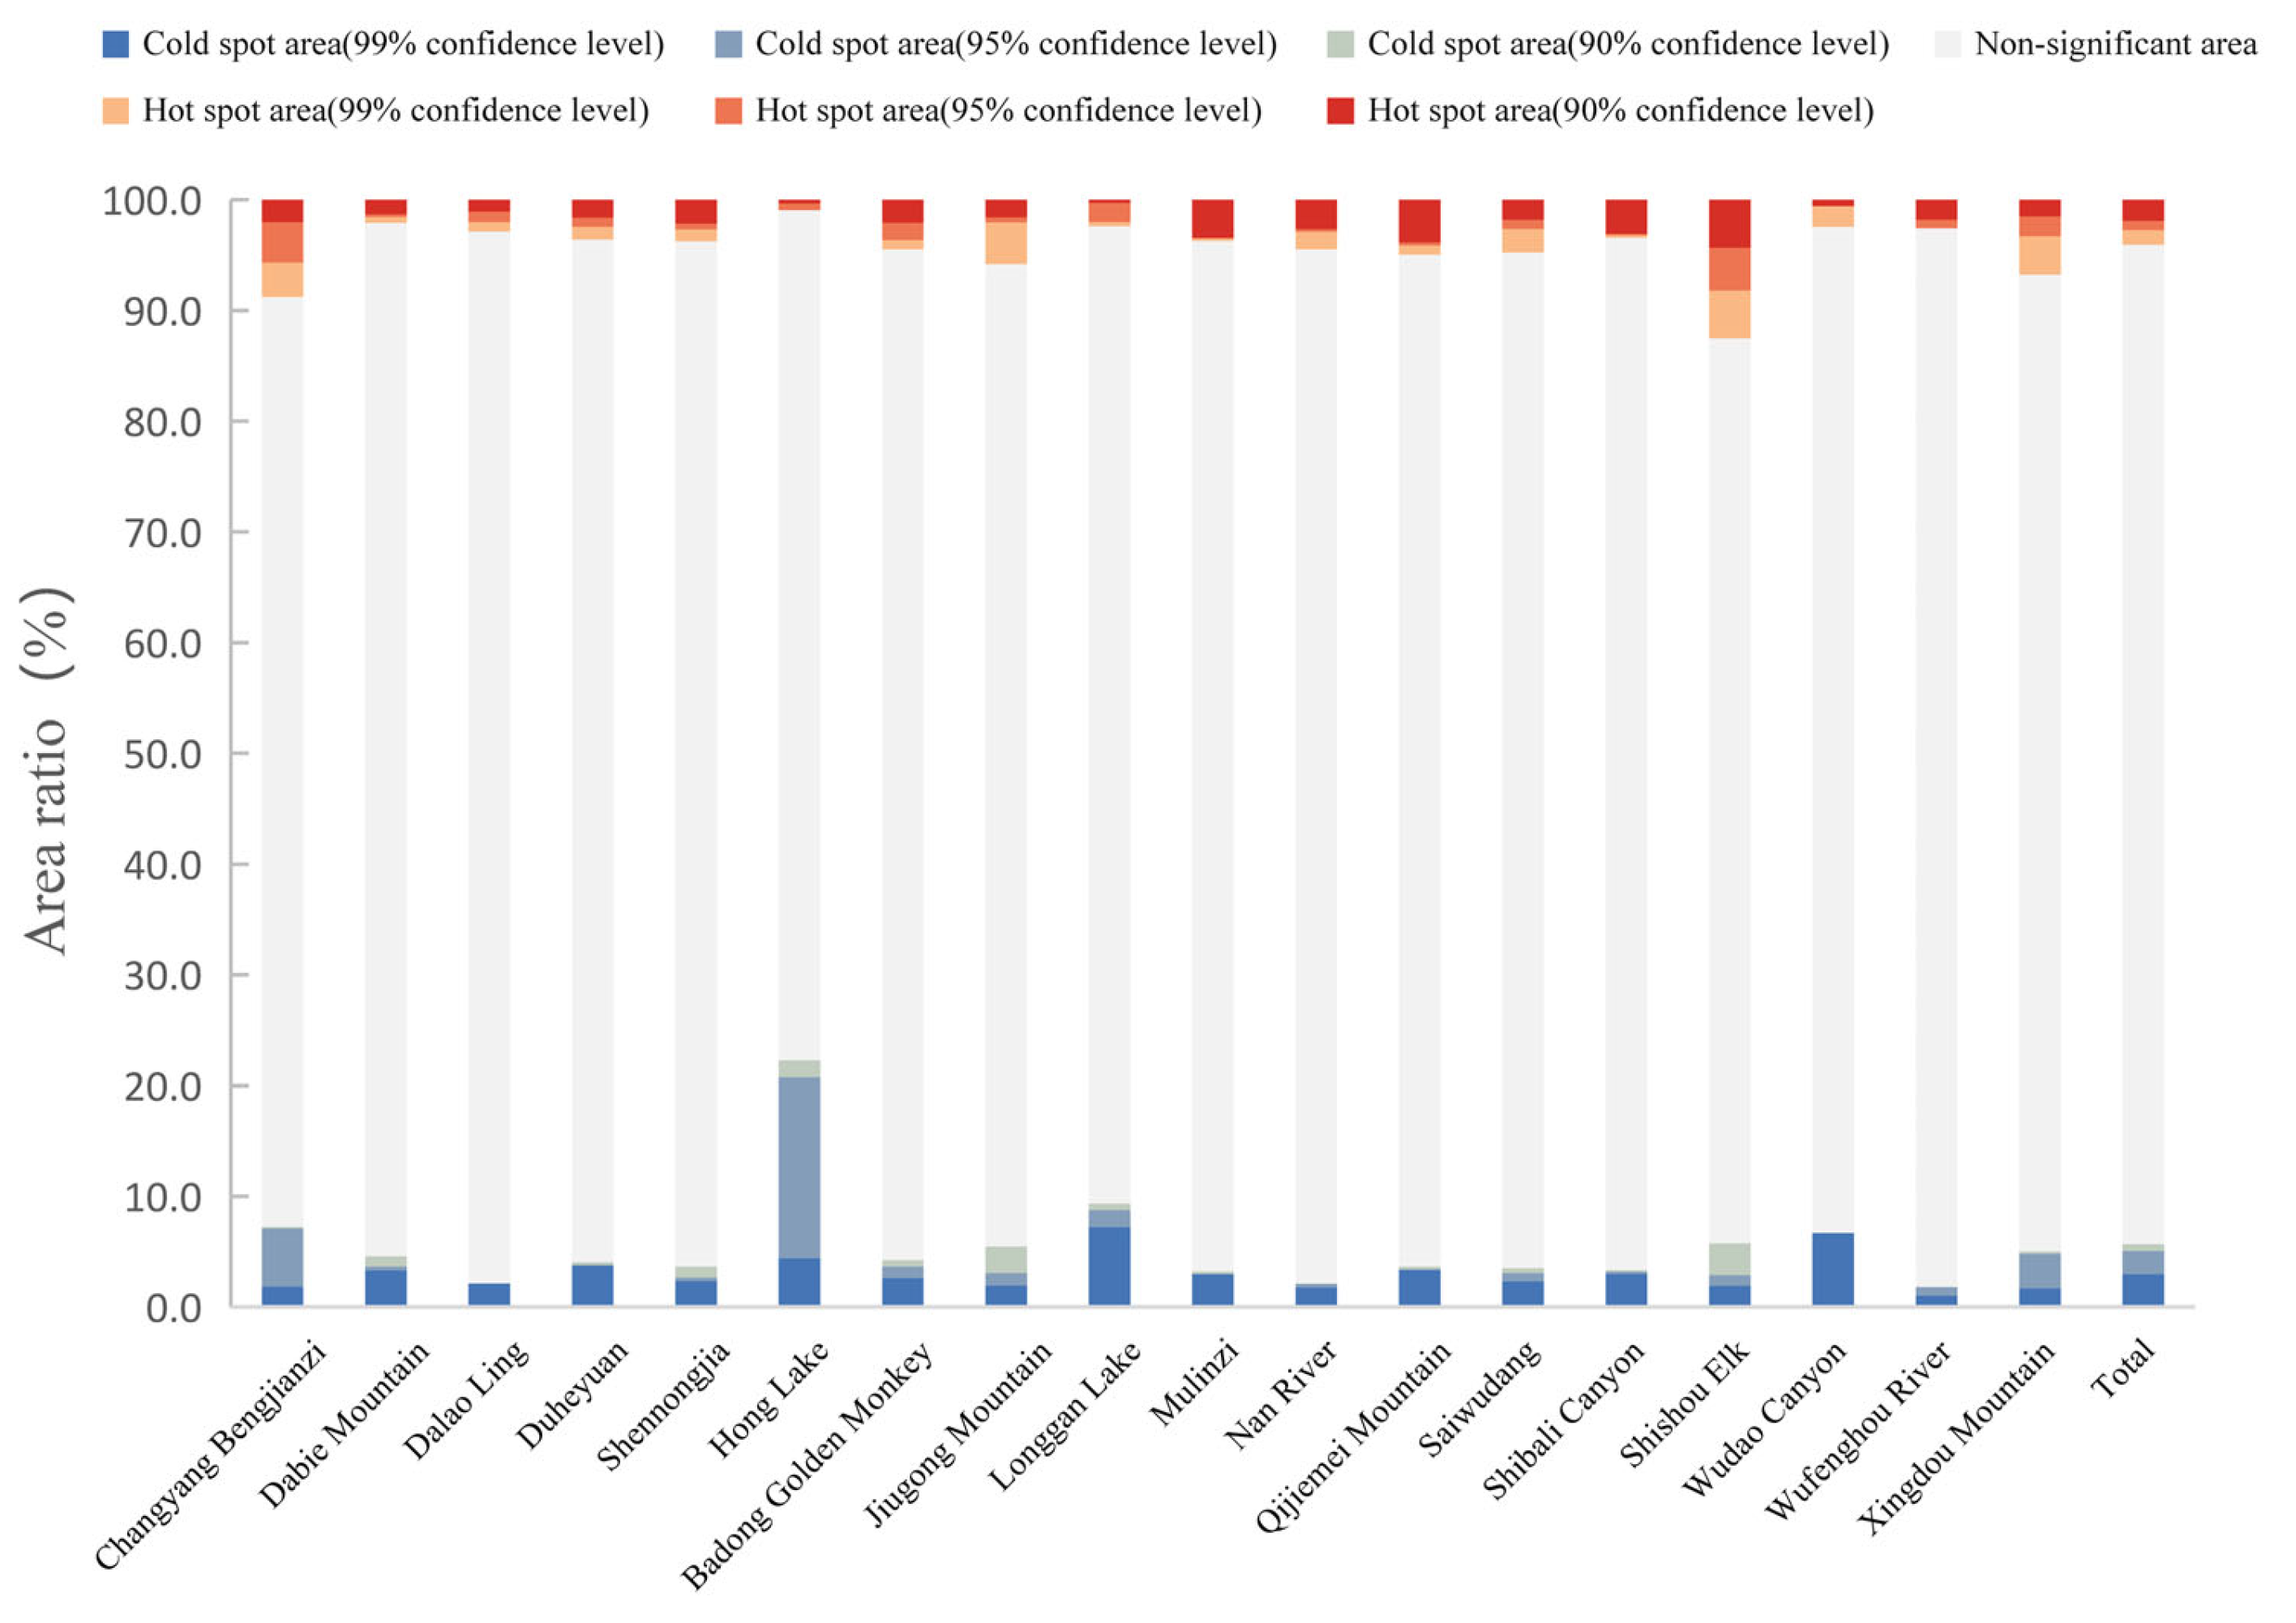
Analysis of Changes in the Proportion of Cold and Hot Spots in Habitat Quality

Looking at the overall proportion of cold and hot spots in the study area (Figure 8), from 2000 to 2020, in Hubei Province’s national nature reserves, areas of insignificant change accounted for 90.2%, cold spot areas for 5.7%, and hot spot areas for 4.1%. The proportion of hot spot areas being slightly less than that of cold spots indicates that the area of habitat quality increase is smaller than that of decrease, aligning with the conclusion of habitat quality decline from 2000 to 2020. National nature reserves with more than 5% in cold spot areas include Honghu, Longgan Lake, Bengjianzi, Wudaoxia, Shishou Milu, Jiugong Mountain, and Xingdou Mountain, totaling seven reserves. The significant decline in habitat quality in these reserves is due to the conflict between poverty alleviation, wealth creation, and ecological conservation, where the residents blindly develop the reserves for economic benefits. As for the reserves with more than 5% in hot spot areas, these include Shishou Milu, Bengjianzi, Xingdou Mountain, Jiugong Mountain, and Qijie Mountain, totaling five reserves. Comparing these with the reserves having more than 5% in cold spots, four of them also exceed 5% in cold spots. The overall habitat quality index changes in these four reserves from 2000 to 2020 were 0.0692, 0.0314, 0.0813, and 0.0074, respectively. This indicates that although the overall habitat quality indices of these four reserves are stable, there exist drastic internal changes in habitat quality. The increases and decreases in different areas offset each other, leading to an overall stable trend in the habitat quality index.

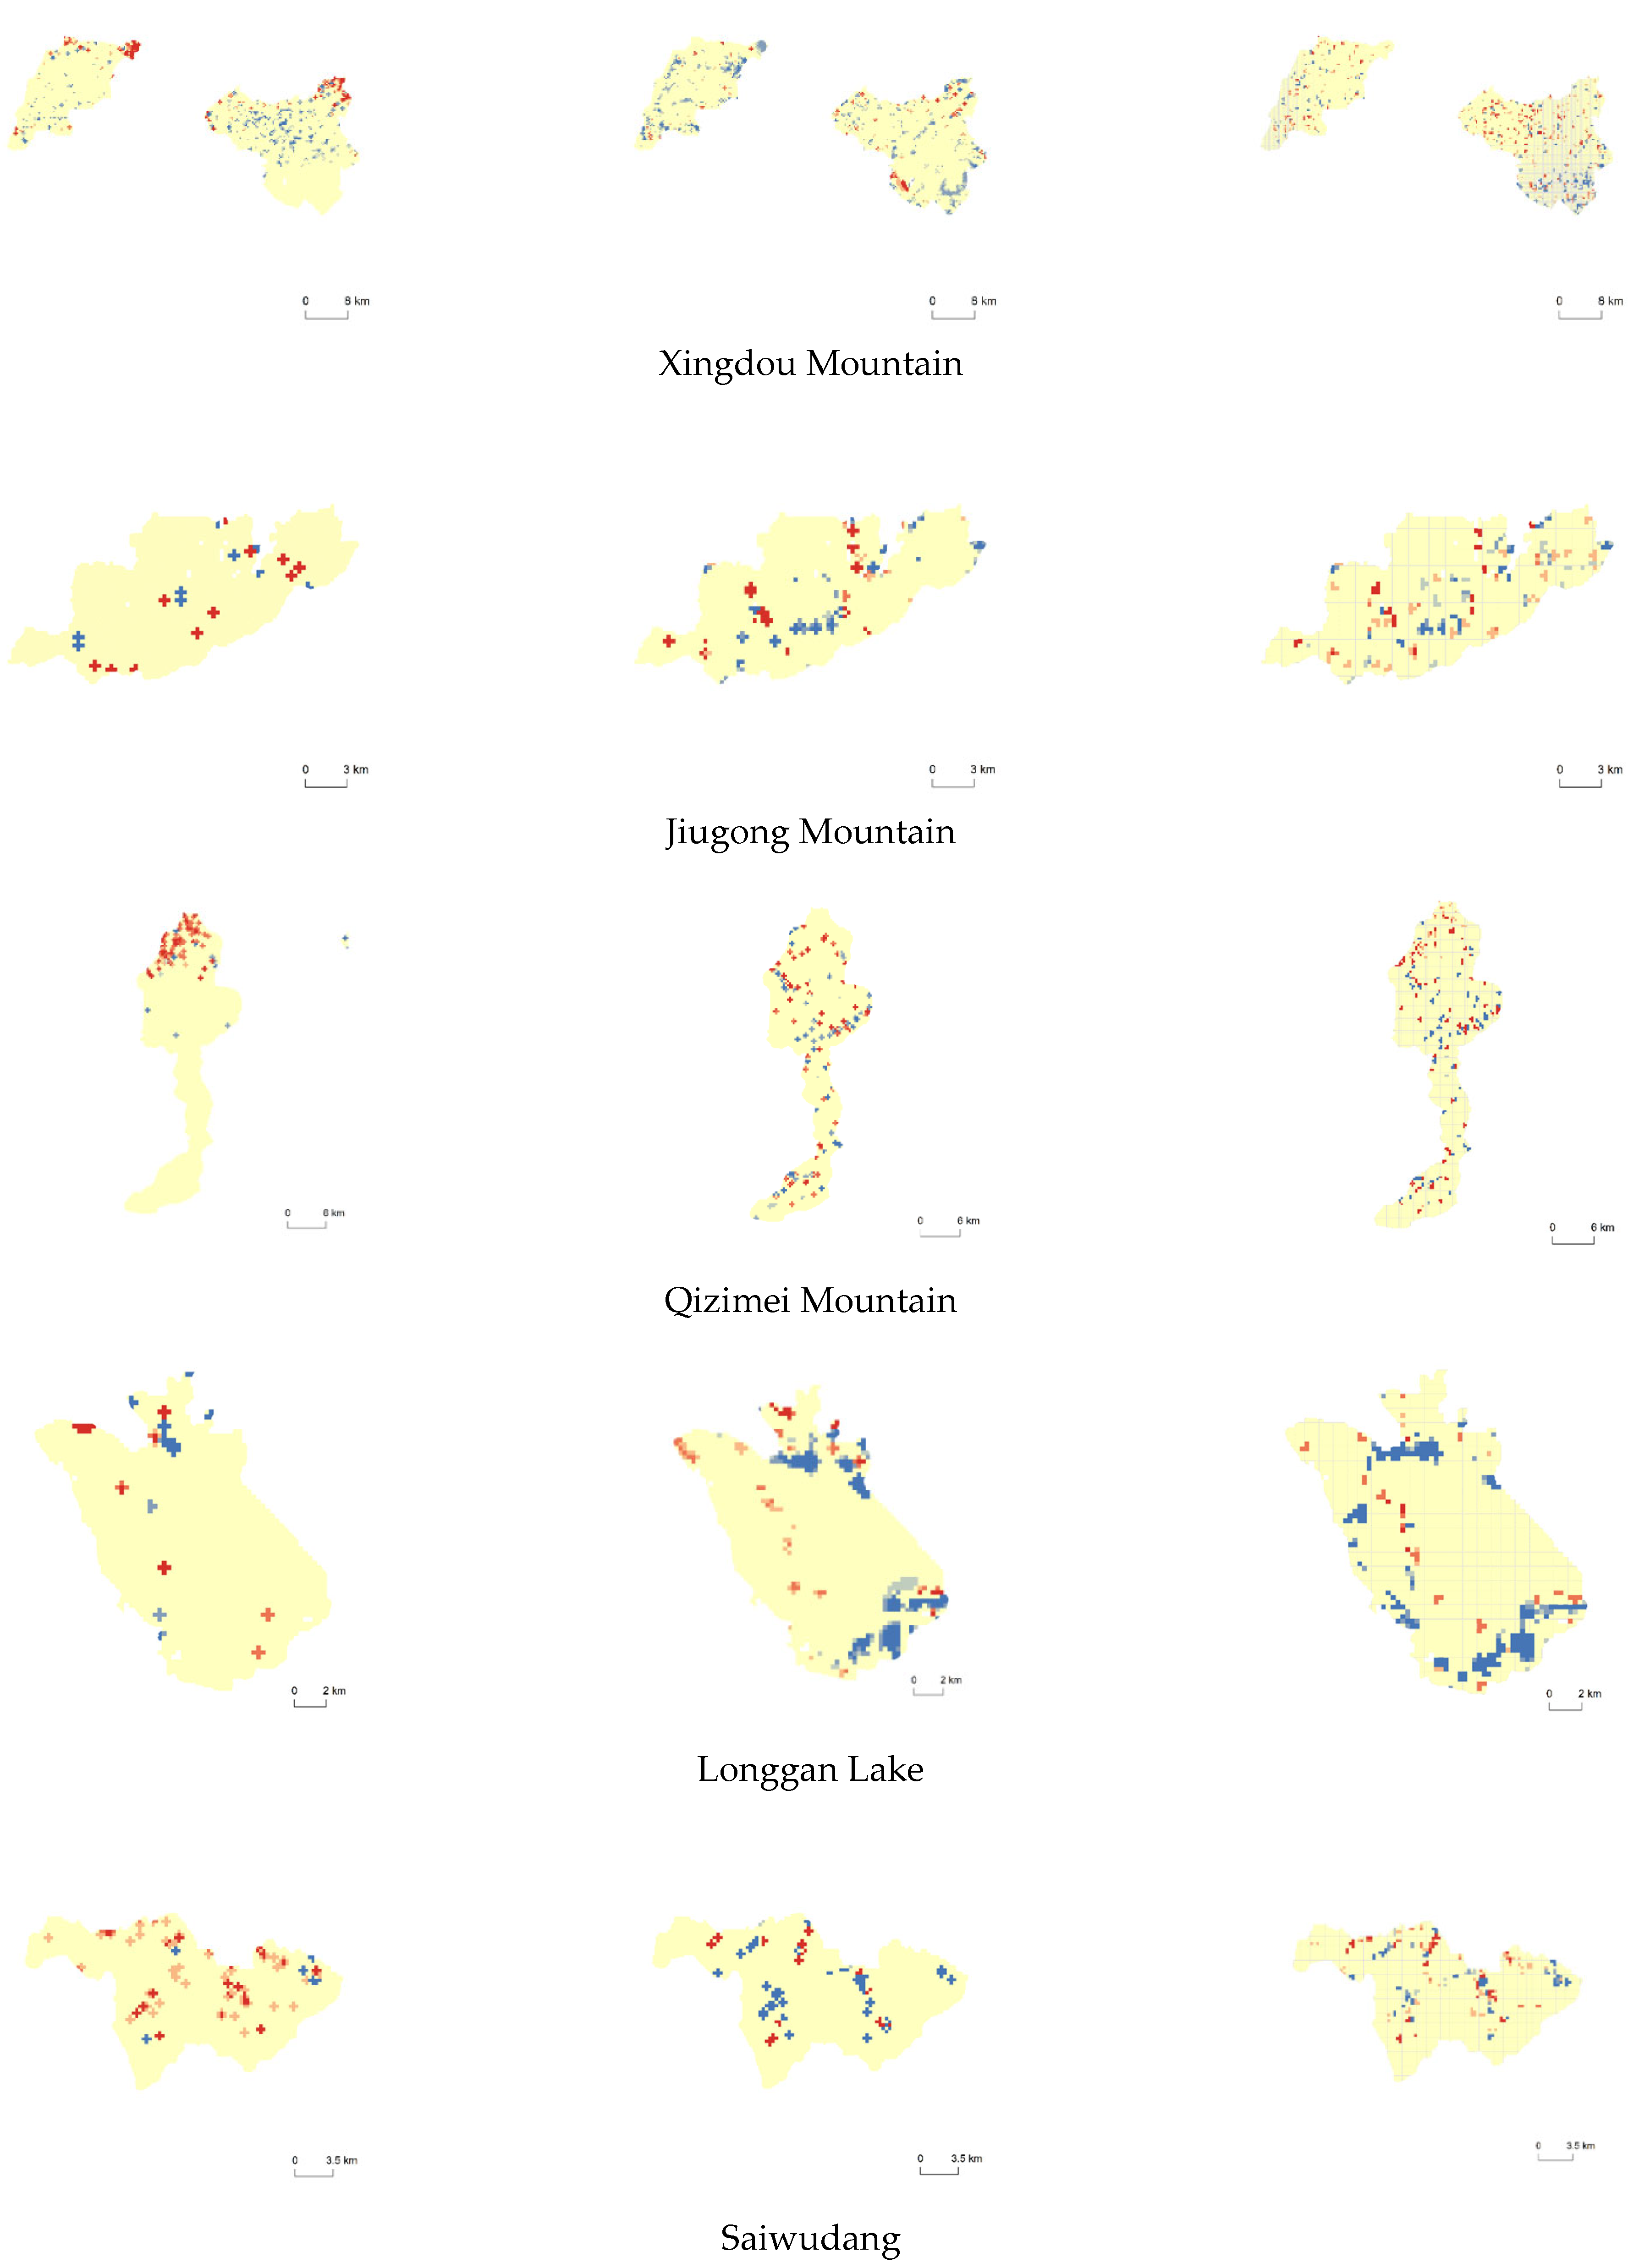
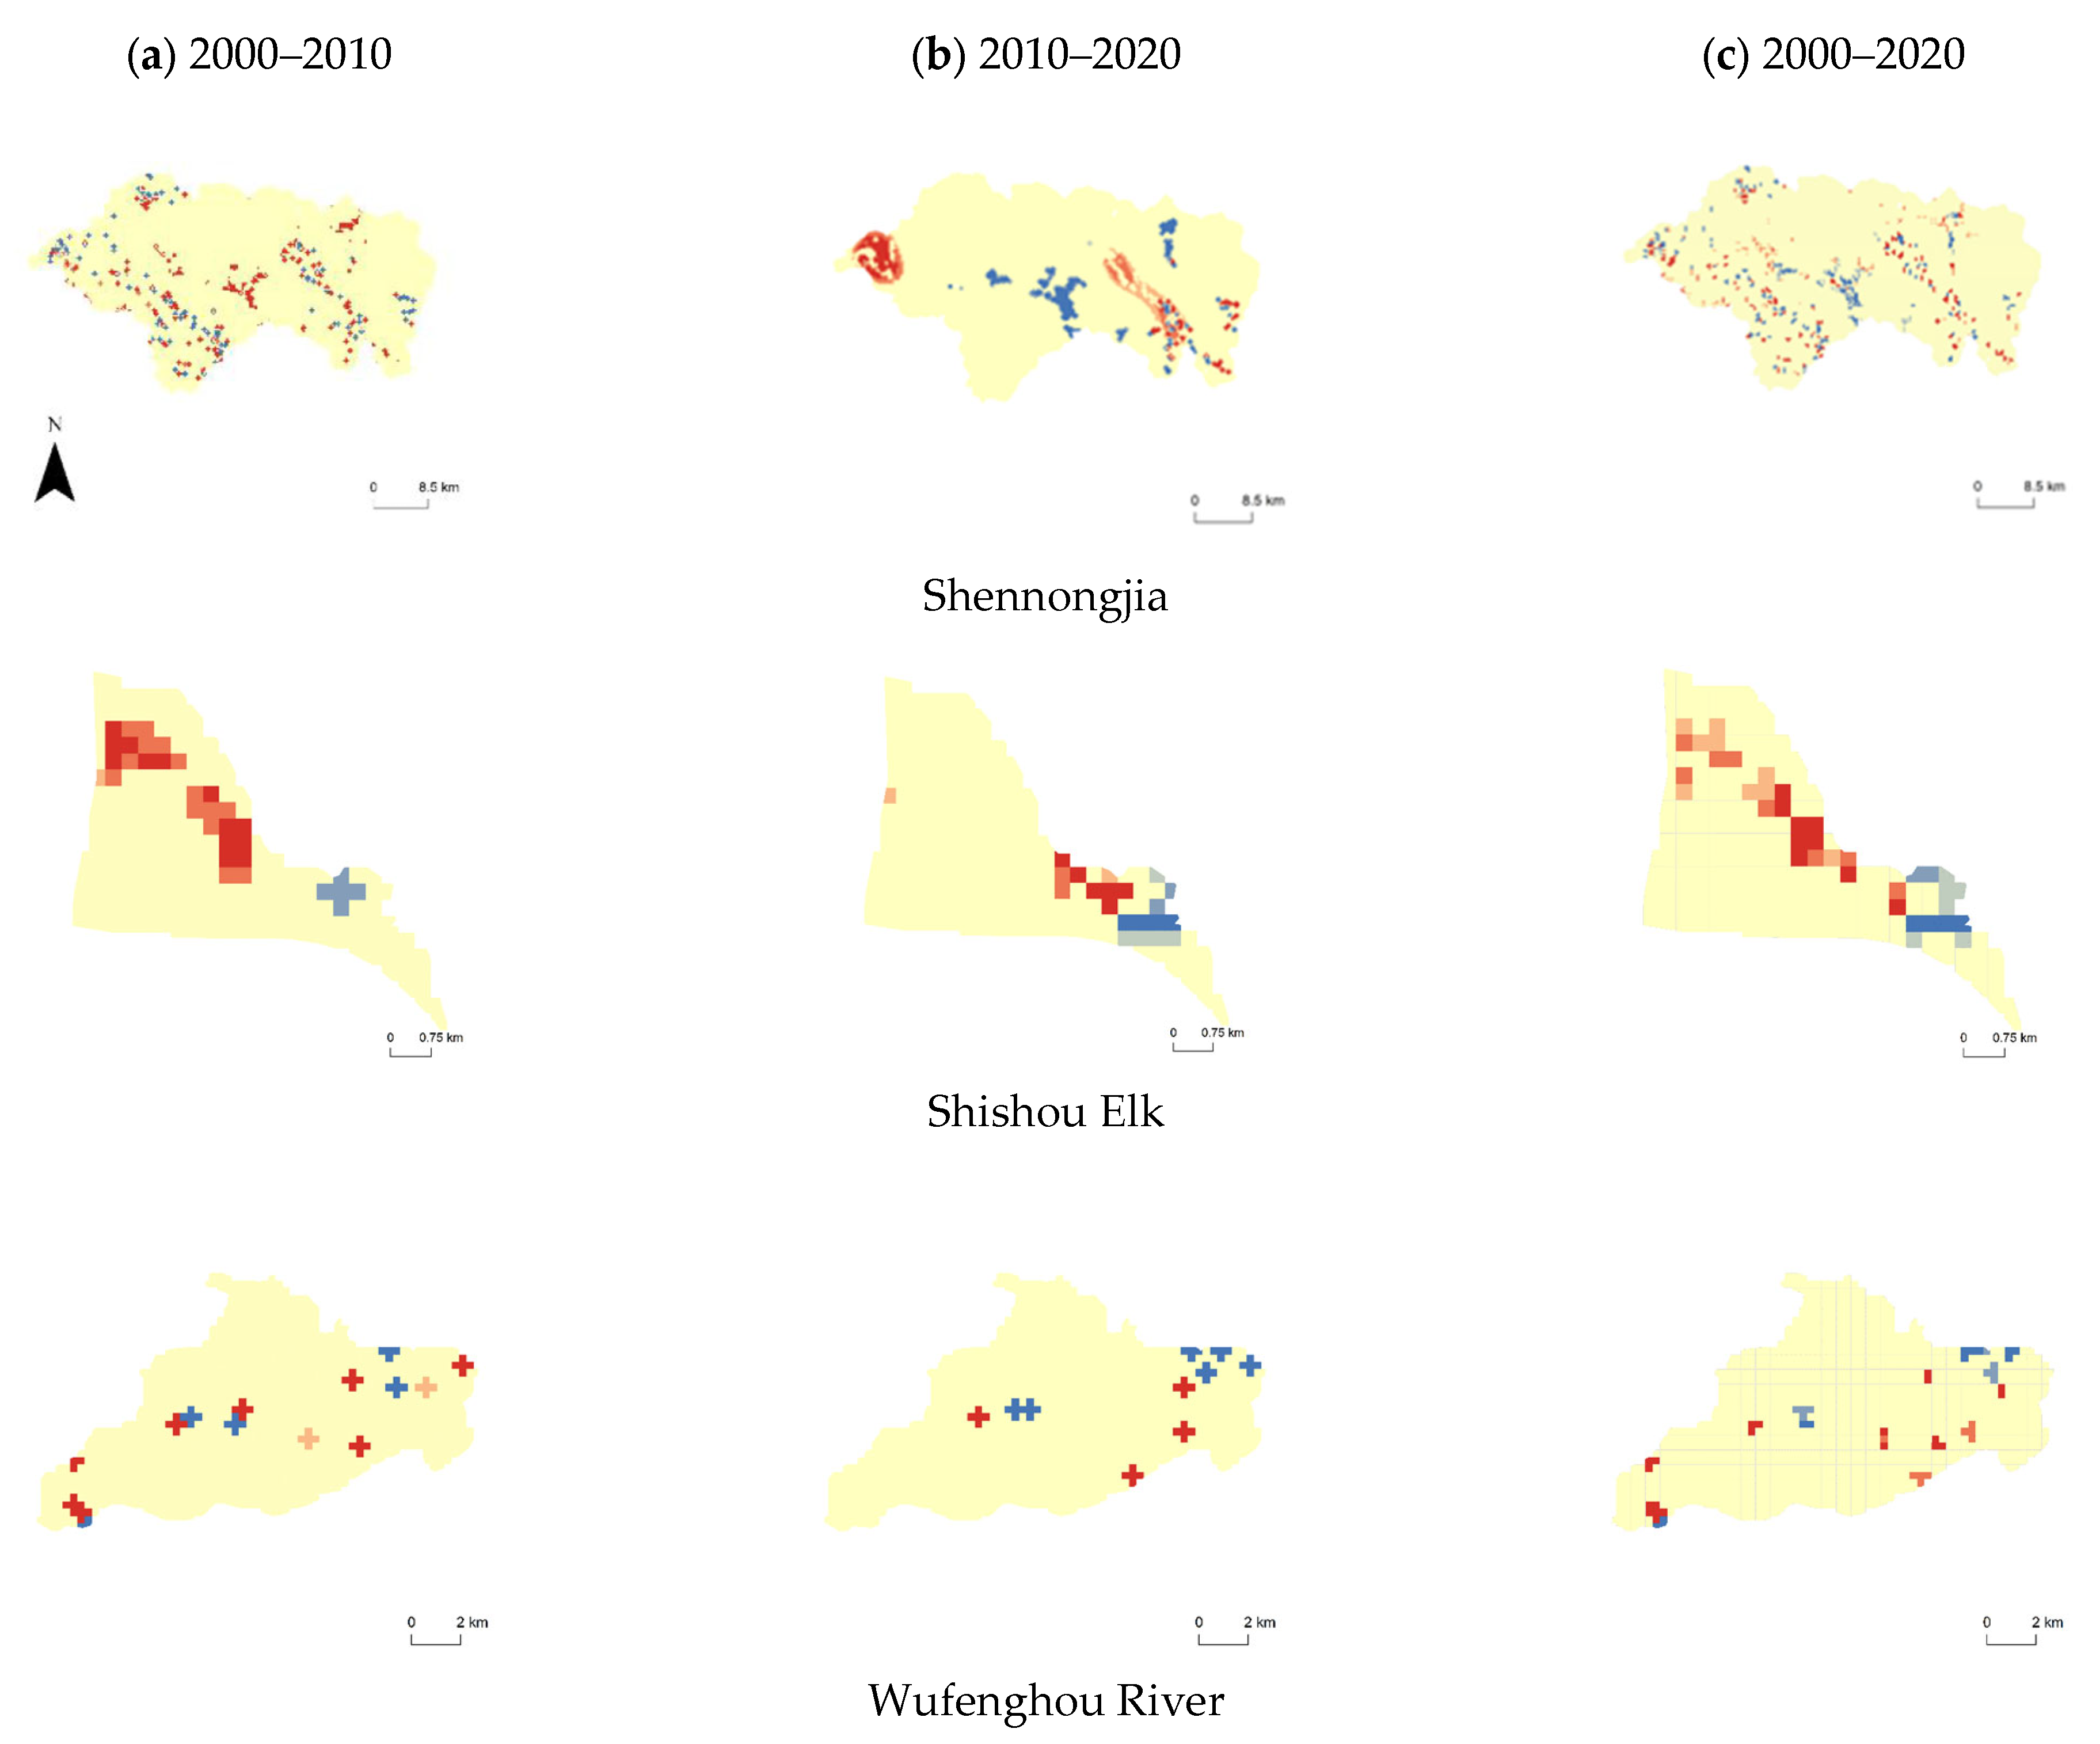
Analysis of Spatial Distribution Characteristics of Cold and Hot Spot Areas

To investigate whether the habitat quality changes in Hubei Province’s national nature reserves between 2000 and 2020 exhibited spatial clustering, the ArcGIS 10.5 software was used for spatial autocorrelation (Moran’s I) analysis. The results showed that 13 nature reserves passed the significance test with a global Moran’s I index Z-score exceeding 2.58 and p < 0.01. Among them, Shennongjia, Wudaoxia, Shishou Milu, Xingdou Mountain, Badong Golden Monkey, and Longgan Lake had Z-scores greater than 8 with p < 0.01, indicating pronounced spatial clustering in habitat quality changes in these reserves, suggesting strong spatial aggregation. In contrast, Sai Wudang, Mulinzi, Shibalichangxia, Dalao Ridge, and Wufeng Houhe nature reserves had global Moran’s I index Z-scores <1.68 and p > 0.1, indicating that habitat changes in these five reserves were randomly distributed in space, without significant clustering.
Overall, the spatiotemporal evolution of habitat quality in the study area is characterized by an overall decline, phased changes, and spatial heterogeneity(Figure 9). The overall habitat quality increased from 2000 to 2010 and declined from 2010 to 2020, possibly due to the enhancement of habitat quality following the implementation of the Grain for Green policy in Hubei Province in 2000. However, post-2010, the indigenous people, driven by economic pressures and national food security policies, resumed deforestation and grass destruction for cultivation in other areas, leading to a decline in quality. Additionally, the intermingling of hot and cold spots within nature reserves may result from some development activities near major transport routes and tourist facilities, resulting in localized sharp declines in quality. Consequently, in the following sections, an analysis is conducted to detect the potential factors causing the aforementioned trends and to further discuss the factors and mechanisms affecting the spatiotemporal evolution of habitat quality.

3.3. Analysis of Spatiotemporal Evolution Influencing Factors of Habitat Quality Based on Geodetector

3.3.1. Construction of the Indicator System for Factors Influencing Habitat Quality

Establishing a habitat quality indicator system is fundamentally important. In light of the actual situation of Hubei Province’s national nature reserves [58], this study selects 14 indicators from three dimensions: natural environment, socio-cultural, and policy regulation, to explore the main factors affecting the habitat quality of national nature reserves in Hubei Province and their mechanisms of evolution (Table 11).
As shown in Table 10, elevation, slope, and terrain ruggedness are selected to represent topography, which is an important component of natural environmental factors and the basis of the formation, development, and evolution of the geographical environment. These are represented by elevation, the degree of steepness of the unit land surface, and the difference between the maximum and minimum elevations within the unit land surface. Distance from water bodies is chosen to represent hydrological factors. Mean patch size and patch density are selected to represent landscape pattern factors. Higher patch density and smaller mean patch size indicate more landscape fragmentation and heterogeneity, reflecting human interference with the natural landscape, a key cause of biodiversity loss in nature reserves. Annual average temperature and annual precipitation are selected to represent climatic conditions, which are fundamental factors affecting plant growth and development. Land use intensity is chosen to represent the activities of indigenous people; it is classified based on the impact on the natural environment, with forest, grassland, and water classified as 1, representing land use in a relatively natural state. Farmland is classified as 2 and constructed land as 3. By comparison, farmland and constructed land may represent areas of more intensive human activity, usually accompanied by large-scale land transformation, vegetation destruction, and habitat degradation, with significant impacts on ecosystems. Different types of land use have varying effects on the quality and function of habitats; for example, farmland and constructed land may have a more significant impact on habitat destruction, while forests and water bodies may offer better protection to ecosystems. The distance from tourist facilities is selected to represent the impact of tourism, with the proximity of these facilities reflecting the level of disturbance to nature reserves by tourism. Data on dining, cultural leisure and entertainment, shopping, and hotels from 2020 POI (Points of Interest) within the study area were extracted and analyzed using Euclidean distance in ArcGIS to indicate the degree of tourism disturbance to nature reserves. Closer proximity may imply higher visitor traffic, disturbance, and pressure, leading to ecosystem degradation, species disturbance, and landscape changes, which negatively affect the species and habitats within the reserves. The distance from highways, national and provincial roads, and county and township roads is chosen to represent traffic location factors, as accessibility is a key factor in human activities impacting habitat quality. The factor of returning farmland to forest is selected to represent policy control factors in nature reserves. Although there may be other factors associated with land use development policies, returning farmland to forest is often considered the most important regulatory measure in nature reserve policies. This significant ecological engineering project measures its regulatory effects by the scale of farmland converted to forest land.

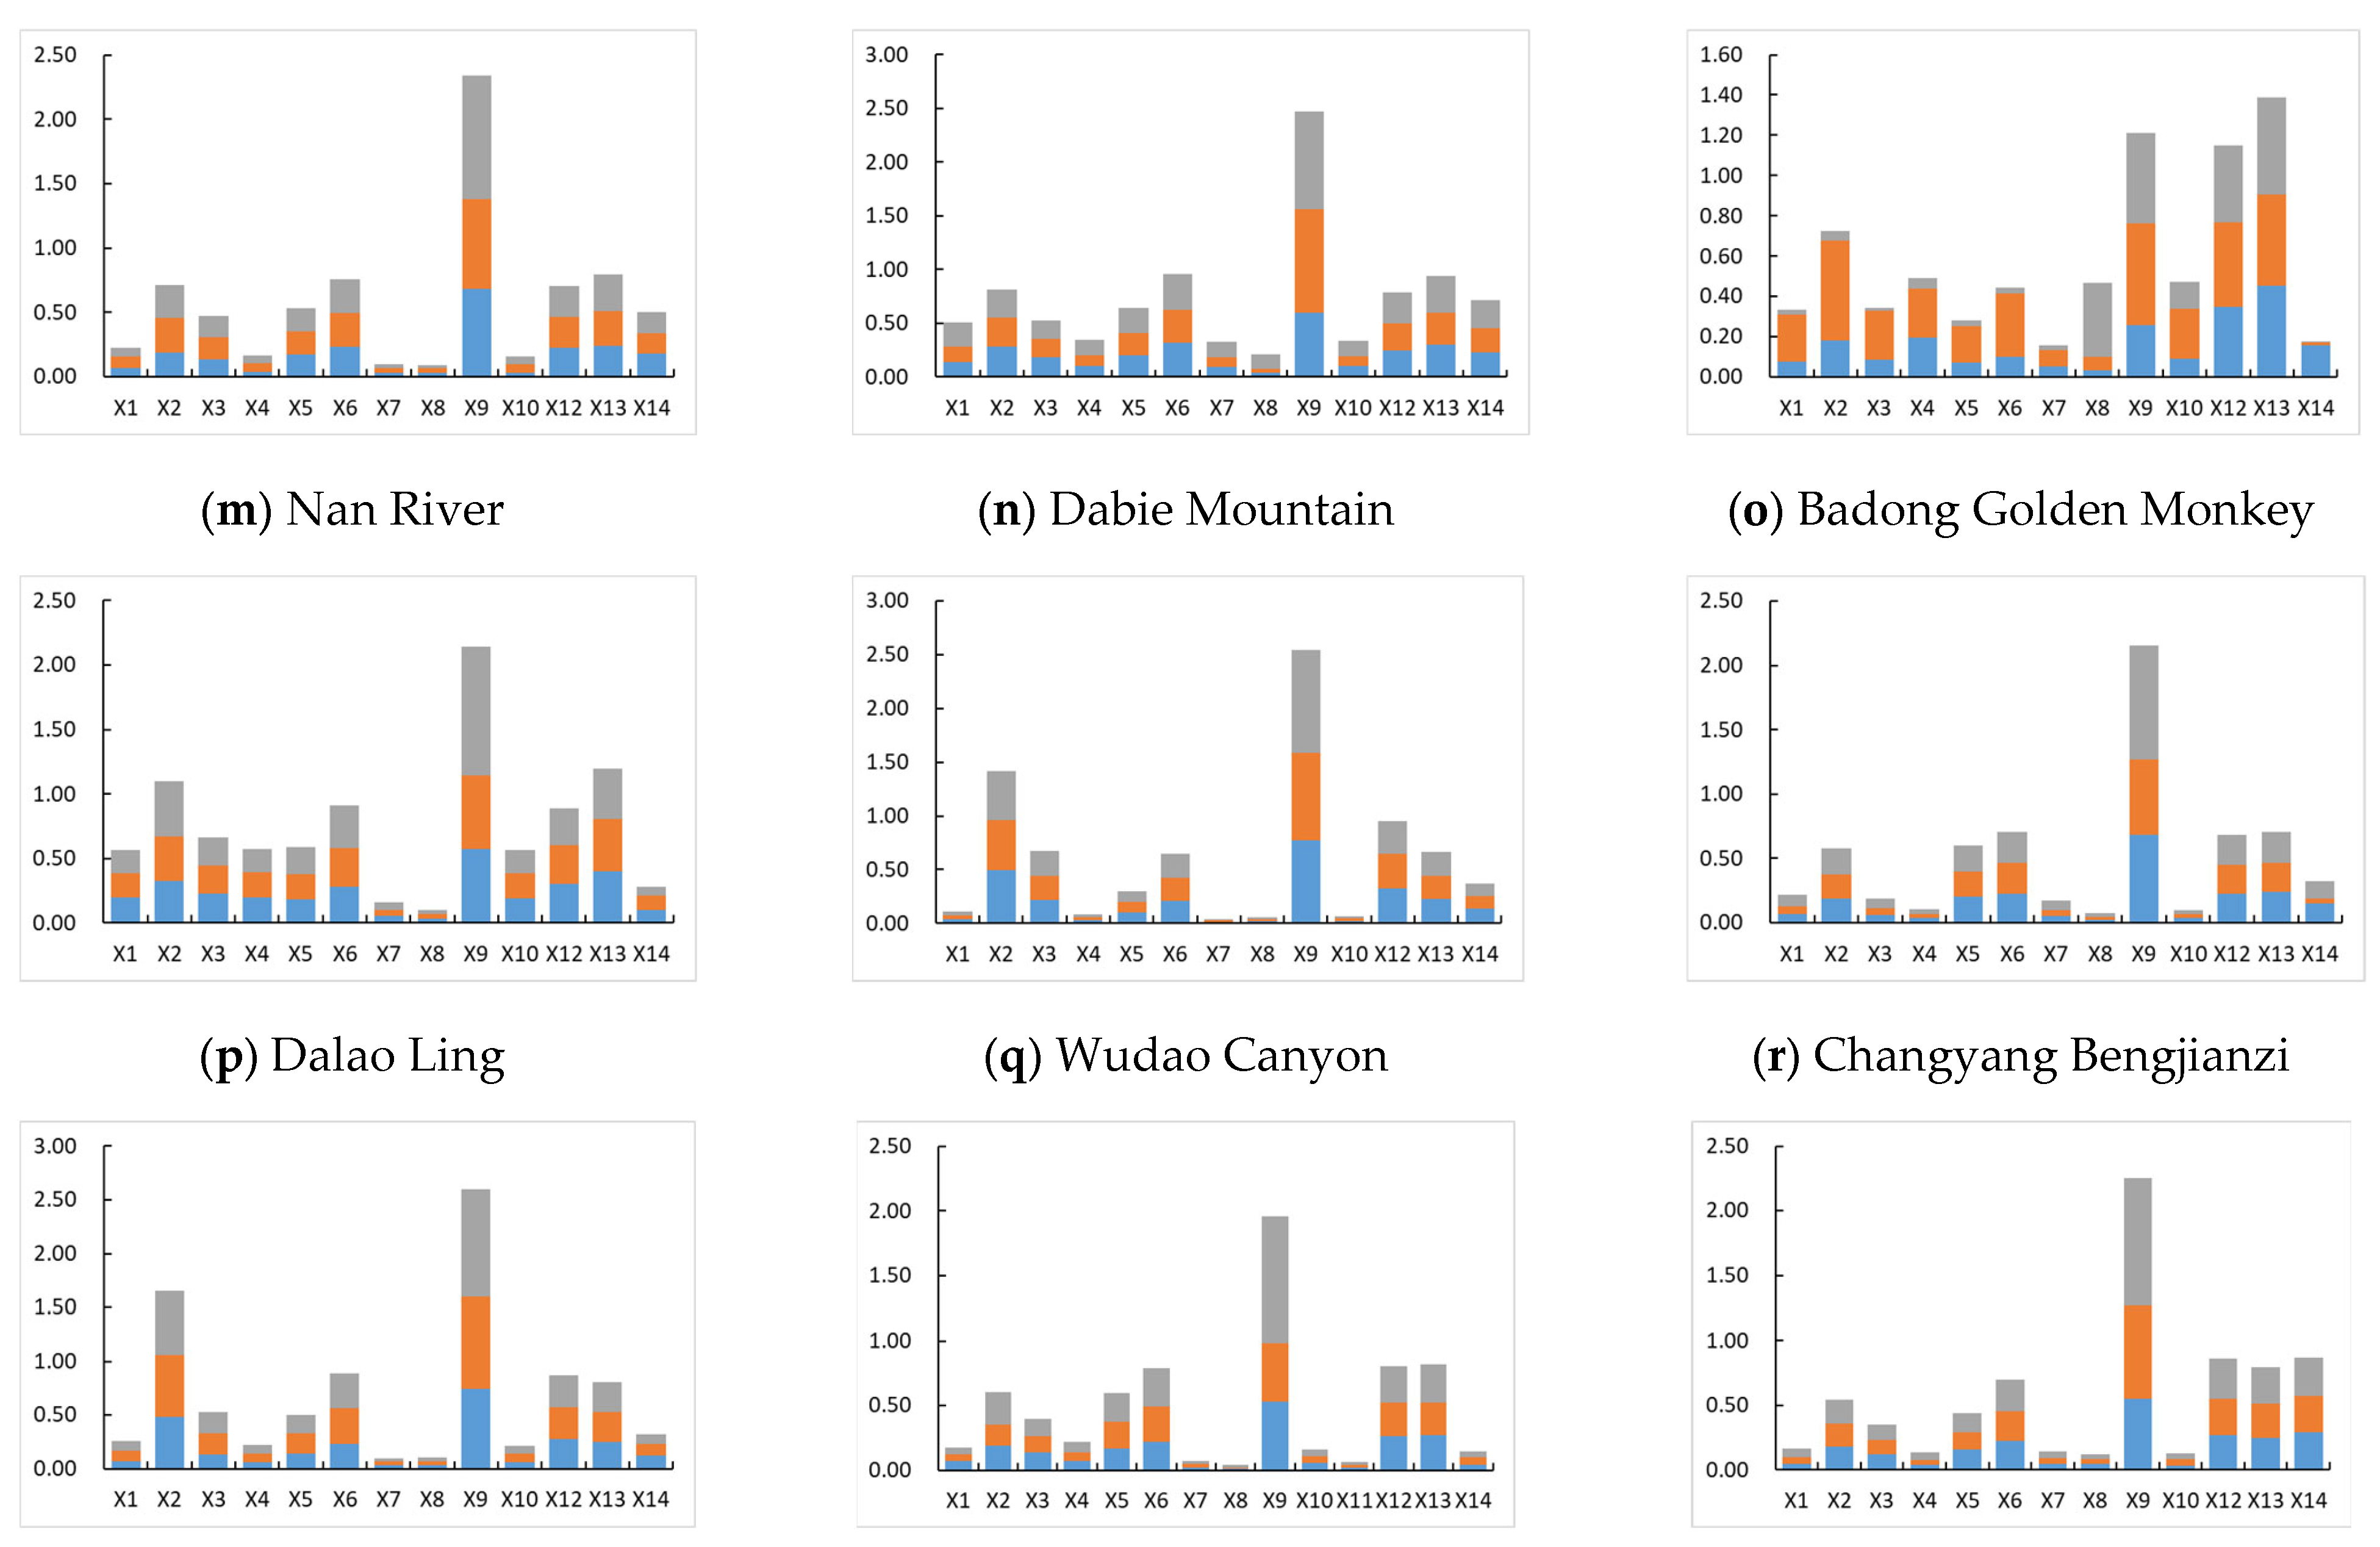
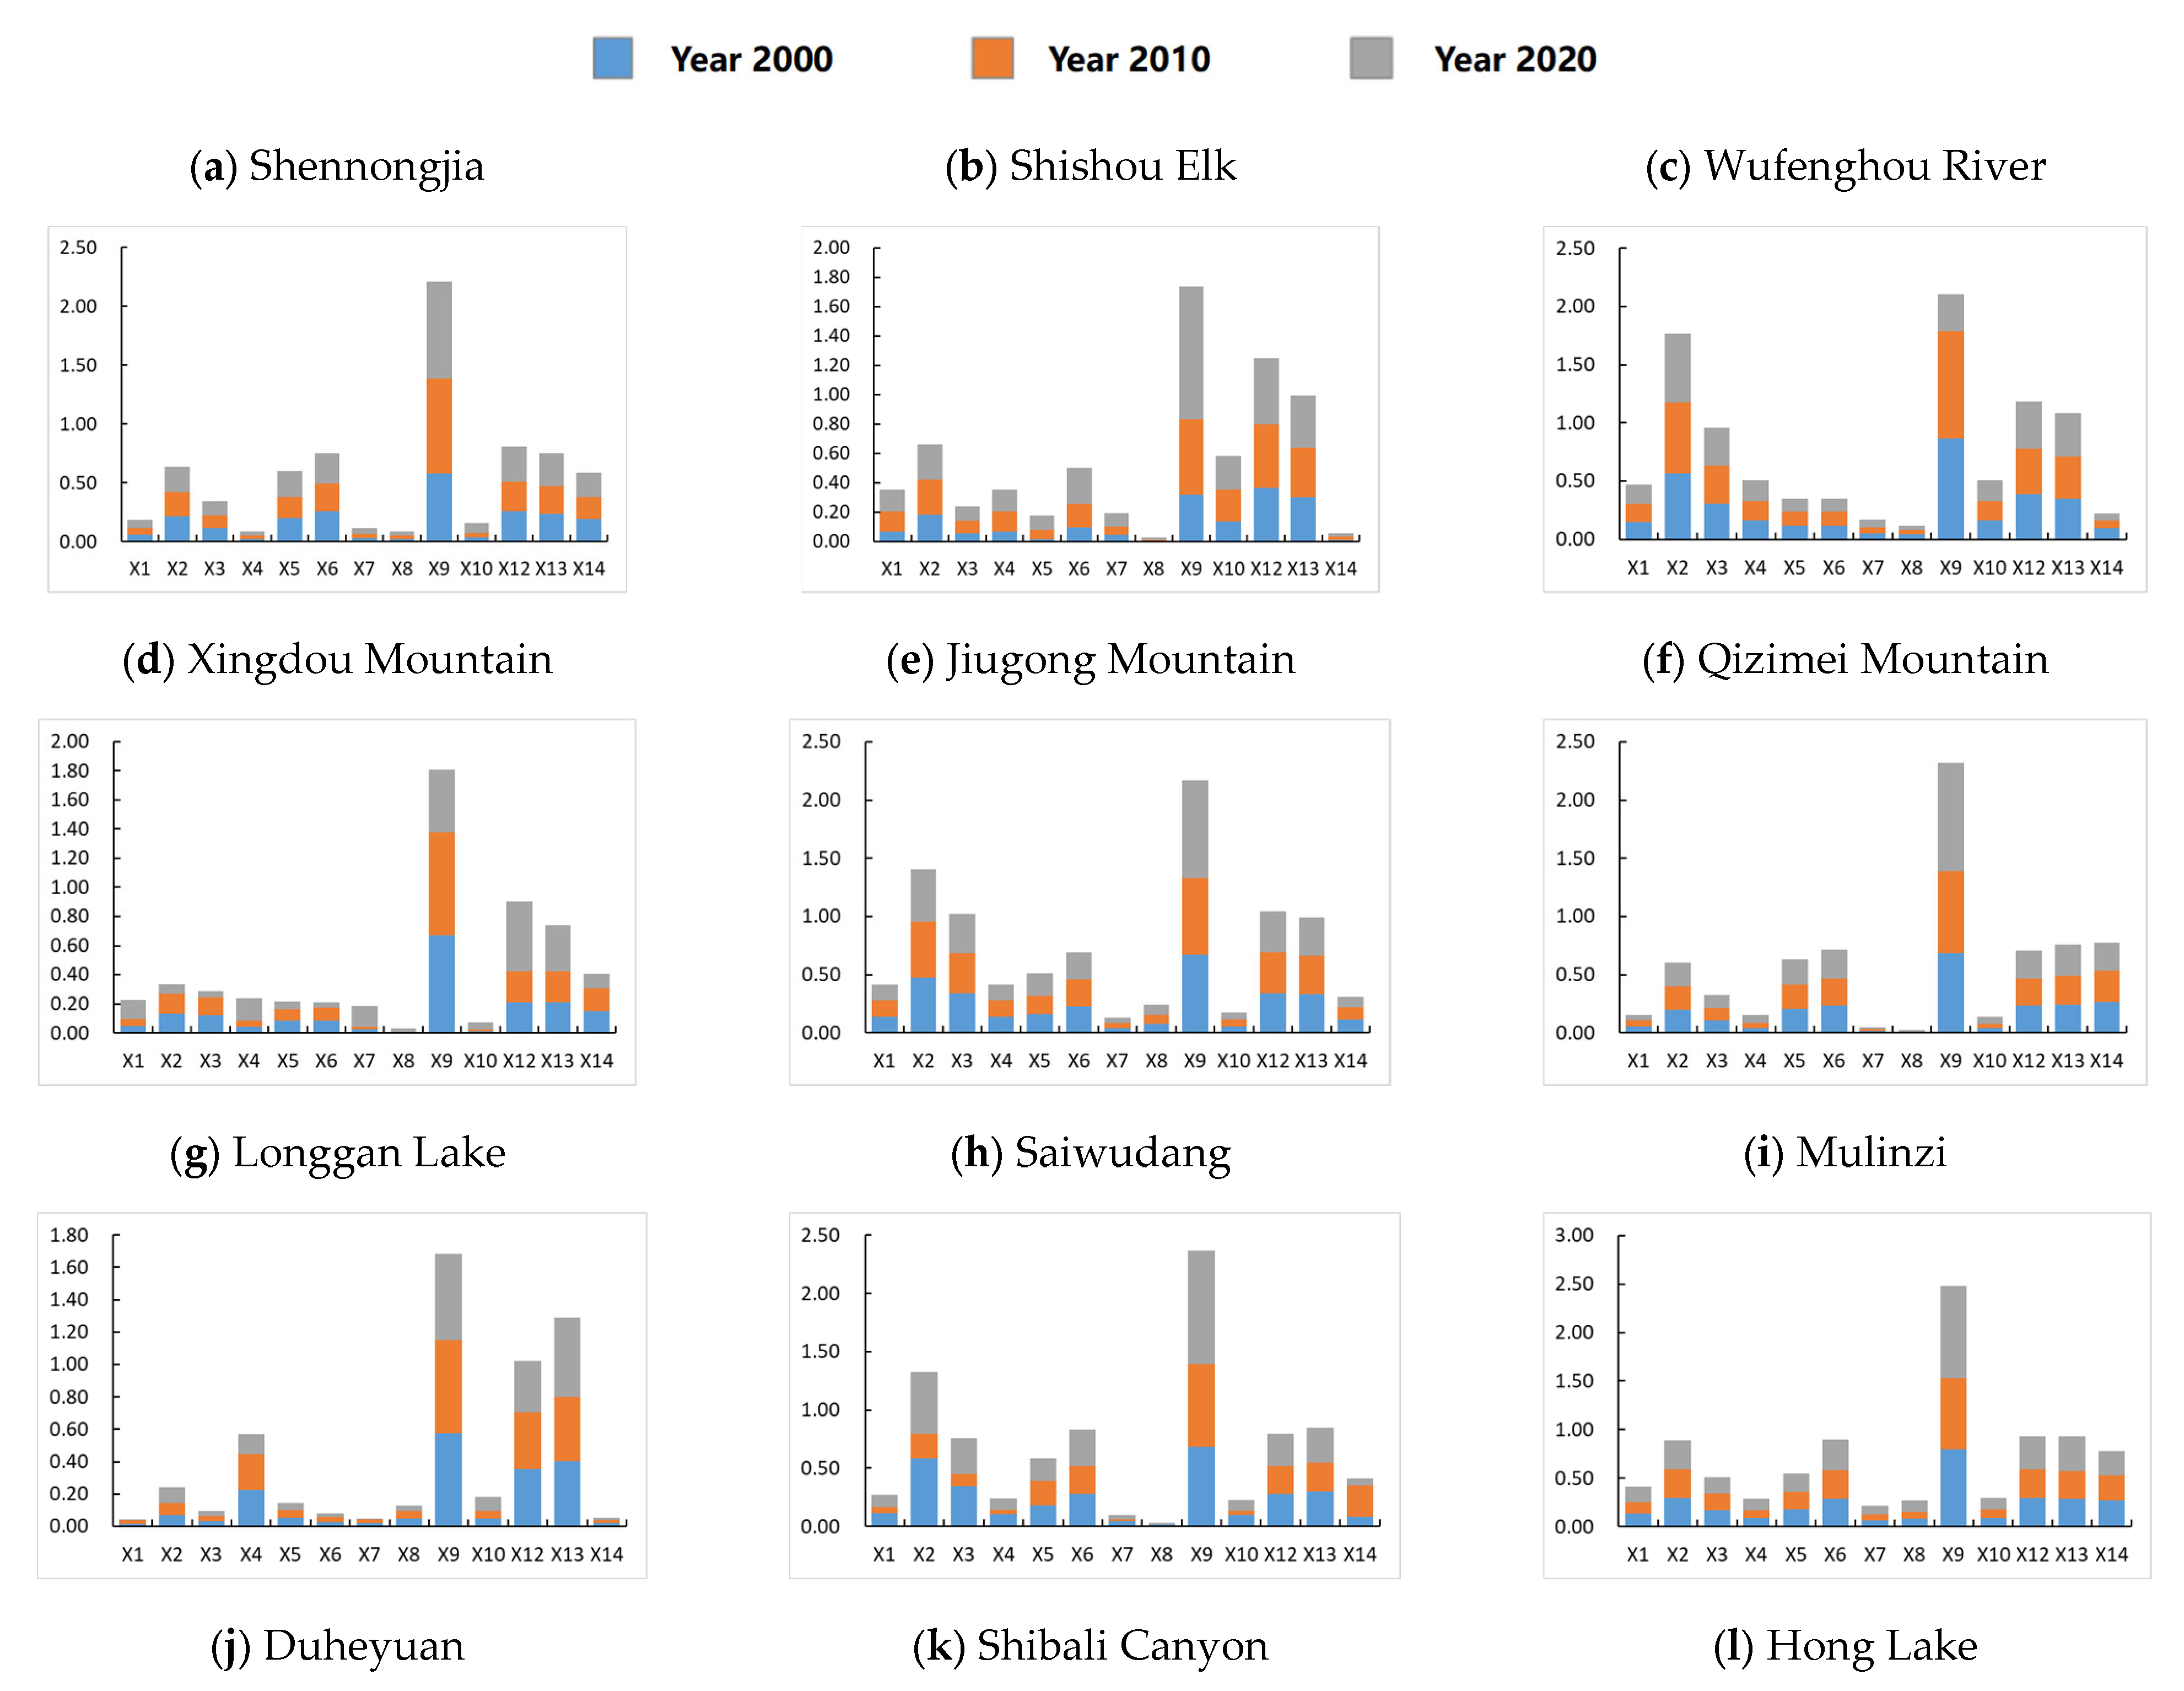
3.3.2. Detection and Analysis of Factors Influencing Habitat Quality

(1)
The Influence of Natural Geographical Factors
Natural geographical factors are the foundation of habitat quality evolution in Hubei Province’s national nature reserves, generally promoting or constraining the evolution of habitat quality. As the average values of factor contribution rates show (Figure 10), topographical conditions make a prominent impact, with slope being the factor with the largest contribution rate among natural geographical factors. The sum of the q-values for each reserve over three periods in descending order is slope (0.296) > fragmentation (0.658) > ruggedness (0.160) > mean patch area (0.153) > distance from water bodies (0.096) > elevation (0.094) > annual mean temperature (0.045) > annual precipitation (0.041). According to the data analysis of Figure 10, hydrological factors significantly influence the habitat quality of wetland-type reserves. The landscape pattern factors widely affect the habitat quality pattern. From 2000 to 2020, except for the contribution rate of terrain ruggedness to habitat quality, which decreased, the contribution rates of all other factors to habitat quality have risen to varying degrees, with annual average rainfall and landscape fragmentation showing the most significant increases in their contribution rates, with q-values rising from 0.031 and 0.203 to 0.060 and 0.227, respectively.
(2)
The Influence of Socio-Cultural Factors
Socio-cultural factors are the fundamental drivers of habitat quality evolution in Hubei Province’s national nature reserves (Figure 10). Indigenous activity factors are the leading influencers of habitat quality evolution, with their explanatory power gradually increasing. Over 20 years, the overall q-value average of land use intensity has gradually increased, from 0.623 in 2000 to 0.945 in 2020. Tourism service facilities are important factors in habitat quality evolution, with significant differences among different reserves. Over 20 years, the average q-value of the tourism service factor has been increasing, with 14 reserves showing an increase and 4 a decrease in q-values, indicating the eco-tourism development influence is gradually increasing. Transportation location factors are key in habitat quality evolution, with lower-grade roads having higher q-values than higher-grade roads. Over 20 years, the average q-values of distance to highways, national/provincial roads, and county/township roads have shown a rising trend, increasing by 0.002, 0.031, and 0.033, respectively, indicating that the impact of transportation location factors is gradually strengthening.
(3)
The Influence of Policy Regulatory Factors
The policy of returning farmland to forest is an effective means to restore damaged ecosystems and a key factor in improving habitat quality. The q-values for the policy in 2000, 2010, and 2020 were 0.145, 0.137, and 0.124, respectively, showing a gradual decline in explanatory power. Over 20 years, the q-value of the policy increased in 14 national nature reserves and decreased in 4, but the overall q-value still slightly declined. This aligns with the trend of initial increase and subsequent decrease in the overall habitat quality of Hubei Province’s national nature reserves from 2000 to 2020. The policy, initiated in 2000, had a significant overall effect, effectively improving habitat quality, but the implementation effectiveness worsened due to a weakening in policy regulation, leading to a decrease in habitat quality.

3.3.3. Detection and Analysis of the Evolution Mechanism of Habitat Quality

The previous section analyzed the contributions of 14 factors to the evolution of habitat quality in national nature reserves in Hubei Province. However, in practice, the complex interactions among different influencing factors jointly promote or constrain the change in habitat quality. Therefore, this section aims to use the interactive detector module of the Geodetector to analyze the interrelationships between the interactions of various influencing factors and the evolution of habitat quality. The detection results show that the interactions among the influencing factors over three years have a synergistic enhancing effect (Table 12, this article only lists the top five interaction values of the factors).
Firstly, the interaction between natural geographical factors and socio-cultural factors is a key driver. Over the past 20 years, there has been a strong interaction between natural geographical factors and socio-cultural factors, with the interaction mechanism among the influencing factors showing synergistic enhancement. Notably, the nonlinear enhancement effect is significantly greater than the dual-factor enhancement. The strength of the interaction effects of different types of influencing factors is ranked as follows: interaction between natural geographical and socio-cultural factors > internal interaction within socio-cultural factors > internal interaction within natural geographical factors.
Secondly, the land use intensity factor had the highest explanatory power among all influencing factors, and it also had the strongest interaction with both natural environmental and socio-cultural factors. Specifically, the interaction of the land use intensity factor with natural environmental factors was greater than its interaction with socio-cultural factors, especially with topographical factors and transportation factors. Land use intensity reflects the degree of human development and construction activities’ disturbance on habitat quality. Within national nature reserves, the strict protection of the ecological environment led to the loss of economic sources for indigenous residents, intensifying the contradiction between the need for poverty alleviation of the indigenous people and the conservation of the ecological environment. Therefore, the impact of land use intensity in conjunction with natural environmental and socio-cultural factors is the most complex.
The influence of policy regulatory factors has gradually weakened, as indicated by the diminishing interaction between the returning farmland to forest factor and natural geographical and socio-cultural factors, with the interaction between 2000 and 2010 being greater than between 2010 and 2020. However, the returning farmland to forest factor still interacts strongly with the land use intensity, especially in national nature reserves like Xingdou Mountain, Qijie Mountain, Sai Wudang, Mulinzi, Duheyuan, and Dabie Mountain.

4. Discussion

For nature reserves, frequent human activities inevitably lead to changes in land use. Historical research has identified land use changes as significant risk factors affecting habitat quality [9,10,11,12,13,14]. In recent years, numerous studies have further explored the impacts of other factors such as location, topography, landscape patterns, and urbanization on habitat quality. However, there are few studies on the comprehensive assessment and interaction effects of the above natural geographic factors with human activity factors such as socio-cultural aspects and policy implementation [28,29,30,31]. This study, focusing on the 18 nature reserves in Hubei Province, innovatively employs the geographical detector model and the InVEST evaluation model from three aspects: the natural environment, socio-cultural factors, and policy regulation, to perform a quantitative assessment and comparative analysis of the impacts on habitat quality in different types of nature reserves.
The research results make some theoretical contributions to the geographical study of habitat quality, which can be reflected in the following two aspects:
Firstly, natural geographic factors are the foundation of habitat quality evolution in nature reserves, having a stable and continuous impact. Socio-cultural factors are the most significant dimension of influence, whereas policy elements have a smaller direct impact but a significant temporal follow-up effect. From the single-factor detection results of the natural geographic dimension, slope is the factor with the largest contribution rate among natural geographic factors. Hydrology, water bodies, and landscape patterns also broadly affect habitat quality changes in various types of nature reserves. From the single-factor detection results of the socio-cultural dimension, although the study’s findings on the explanatory power of single factors in land use are consistent with the existing literature [28,29,30,31,39,40,41], this paper also makes further discoveries. Among subsequent influencing factors, the impact of open, lower-grade roads exceeds that of closed, higher-grade roads, showing an annually increasing trend, which reminds us to pay more attention to the control intensity of development along roads. From the policy dimension detection results, the effect of the Grain for Green policy implementation is consistent with the spatiotemporal evolution of habitat quality, highlighting the need to consider the potential impact of changes in policy implementation intensity on habitat quality.
Secondly, over the past 20 years, the interaction mechanism among influencing factors has shown a synergistic enhancement, collectively driving changes in the habitat quality of nature reserves. The strength of interactions is ranked as follows: the interaction between natural geographic and socio-cultural factors > the internal interaction of socio-cultural factors > the internal interaction of natural geographic factors. Among them, the interaction between the land use intensity factor and natural environmental factors is greater than that with socio-cultural factors; especially, the interaction with topographic features is the strongest. It is evident that in nature reserves with significant topographical variations, changes in land use intensity will further exacerbate the damage to habitat quality. This impact may arise from the indigenous population’s high dependency on limited arable land, where flat land as a means of production is scarcer in these areas, thereby mutually amplifying the impact effect.
The practical application value of this article lies in providing evidence for the formulation and management of territorial space development protection and land use planning. Specifically, it applies to the establishment, adjustment, and optimization of regional nature reserve systems. Based on the conclusions of this study, the interaction between physical geography and socio-cultural factors has a significant impact. Therefore, it is recommended that various nature reserves within the same geographical unit, which are adjacent and connected, could break through the unreasonable settings caused by administrative divisions or resource classifications, and be reorganized according to principles of ecological system integrity, species habitat connectivity, and unified protection management. The 2019 Chinese Government’s “Guidance on Establishing a Nature Re-serve System Centered on National Parks” [59] provides policy support for this. In the ongoing compilation of Hubei Province’s territorial space master plan, we have proposed corresponding adjustment suggestions based on the results of this study. For instance, Shennongjia and the Badong Golden Monkey national nature reserves, located in the Qinba Mountains and belonging to the forest ecological type of national nature reserves, are spatially adjacent to interconnected species habitats. The distribution of hot and cold spots of habitat quality within them shows a unified trend, and the structure of influencing factor contributions is similar. Therefore, they can be merged, with Shennongjia as the core, to establish a national park, integrating surrounding nature reserves for unified management.
On the other hand, this article can offer recommendations for categorizing strategies for the ecological restoration zoning, determination of ecological restoration units, and generation of land use planning strategies for nature reserves and their surrounding urbanized areas. Based on regions with significant spatiotemporal changes in habitat quality and intense transitions between land use types identified in this article, these areas should be classified as sensitive and key units for ecological restoration. Depending on the strength of influencing factors such as land use, county and township roads, and tourism service facilities within different nature reserves, a graded and differentiated list of territorial space development control measures and policies should be established. For example, due to the significantly higher impact of open county and township roads compared with closed highways, it is necessary to strengthen the development control along these roads to ensure regional ecological security.
Meanwhile, due to the selection of many study subjects and the difficulty in obtaining uniform and comprehensive socio-economic data, the impact of development activities with industrial characteristics has not been assessed. Further research could be conducted on specific areas in the next step.
This study has some limitations. First, the introduction of the InVEST model provides a feasible method for the quantitative assessment of habitat quality, but its results are based on remote sensing images, meteorological data, and vegetation data, and the accuracy of the habitat quality evaluation remains to be verified. Moreover, assessing habitat quality in large-scale regions is a complex issue, which is a common challenge for scholars. The future direction of quantitative habitat quality assessment will aim to establish a connection between habitat quality evaluations based on remote sensing images and on-the-ground habitat quality measurements. Second, in studying the factors affecting habitat quality and their evolutionary mechanisms using the geographic detector model, the author, drawing on previous research, discretized the independent variables using the natural break method in ArcGIS. Due to the lack of clear classification standards, different discretization methods may lead to different results. Future research needs to strengthen the classification standards for the discretization of independent variables to improve the reliability of detection results.

5. Conclusions

This study analyzed the spatiotemporal evolution characteristics of land use and habitat quality within 18 nature reserves in Hubei Province from 2000 to 2020, employing the INVEST model and the Geodetector model to quantitatively assess the extent of the impact and the interaction mechanisms of various elements within natural geography, socio-cultural, and policy regulation dimensions on habitat quality.
The results of this study indicate that the habitat quality of the 18 nature reserves in Hubei Province is superior, with an average habitat quality reaching 0.8120. The density changes in habitat quality evolution from 2000 to 2020 exhibit characteristics of periodicity and spatial heterogeneity. The spatiotemporal differentiation characteristics of habitat quality in the study area are influenced by the combined effects of natural, cultural, and policy factors, with the strength of their interactions ranked as follows: interaction between natural geographical and socio-cultural factors > interaction within socio-cultural factors > interaction within natural geographical factors. This finding is consistent with the understanding that ecosystems are easily and rapidly degraded by human activities, while natural restoration is difficult and slow. It reminds us of the need to pay more attention to the destructive impact of human activities on nature reserves. In future research, we must continue to focus on the complex process of how diverse elements related to human activities intervene in habitat quality.

Author Contributions

Conceptualization, Y.L.; methodology, Y.L. and R.L.; formal analysis, Y.L. and X.Z.; investigation, H.Z, R.L. and X.Z.; resources, Y.L., H.Z. and R.L.; writing—original draft preparation, Y.L. and R.L.; writing—review and editing, Y.L., X.Z. and H.Z.; supervision, Y.L. and H.Z. All authors have read and agreed to the published version of the manuscript.

Funding

This research was funded by the National Natural Science Foundation of China’s Young Scientists Fund, grant numbers 51908232 and 52108035; the Hubei Province Science and Technology Innovation Talent and Services Special Soft Science Research Project, grant number 2022EDA052; the Key project of National Social Science Foundation, grant number 21AZD048; and the Science and Technology Plan Project of the Ministry of Housing and Urban-Rural Development of China, Grant/Award Number: 2022-K-014.

Institutional Review Board Statement

Not applicable.

Informed Consent Statement

Not applicable.

Data Availability Statement

The land use data for Hubei Province national nature reserves in 2000, 2010, and 2020 are derived from the 30 m Global Land Cover Data, GlobeLand30, a global geographic information public product (www.globeland30.org, (accessed on 5 November2022)). The Digital Elevation Model (DEM) is sourced from the Data Center for Resources and Environmental Sciences, Chinese Academy of Sciences (http://www.resdc.cn, (accessed on 7 January 2023)).

Acknowledgments

The research idea is derived from the project “Territorial spatial changes research in key protected areas” commissioned by Guangzhou City Planning and Design Institute. Thanks for the support by Xu Lige, Zhu Hui, Xia Yuan, Liu Helin, Wang Zhiyong, Huang Yulin and all colleagues in the project. Special thanks are given to the anonymous reviewers and editor for their insightful suggestions.

Conflicts of Interest

Author Runtian Li was employed by the company Beijing Tsinghua Tongheng Planning and Design Institute Co., Ltd. The remaining authors declare that the research was conducted in the absence of any commercial or financial relationships that could be construed as a potential conflict of interest.

References

  1. Fahrig, L. Effects of Habitat Fragmentation on Biodiversity. Annu. Rev. Ecol. Evol. Syst. 2003, 34, 487–515. [Google Scholar] [CrossRef]
  2. Debinski, D.M.; Holt, R.D. Review: A Survey and Overview of Habitat Fragmentation Experiments. Conserv. Biol. 2000, 14, 342–355. [Google Scholar] [CrossRef]
  3. Chen, X.; Yu, L.; Du, Z.; Xu, Y.; Zhao, J.; Zhao, H.; Zhang, G.; Peng, D.; Gong, P. Distribution of ecological restoration projects associated with land use and land cover change in China and their ecological impacts. Sci. Total. Environ. 2022, 825, 153938. [Google Scholar] [CrossRef]
  4. Nagendra, H.; Lucas, R.; Honrado, J.P.; Jongman, R.H.; Tarantino, C.; Adamo, M.; Mairota, P. Remote sensing for conservation monitoring: Assessing protected areas, habitat extent, habitat condition, species diversity, and threats. Ecol. Indic. 2013, 33, 45–59. [Google Scholar] [CrossRef]
  5. Chu, M.; Lu, J.; Sun, D. Influence of Urban Agglomeration Expansion on Fragmentation of Green Space: A Case Study of Beijing-Tianjin-Hebei Urban Agglomeration. Land 2022, 11, 275. [Google Scholar] [CrossRef]
  6. Wu, L.; Sun, C.; Fan, F. Estimating the Characteristic Spatiotemporal Variation in Habitat Quality Using the InVEST Model—A Case Study from Guangdong–Hong Kong–Macao Greater Bay Area. Remote. Sens. 2021, 13, 1008. [Google Scholar] [CrossRef]
  7. Yohannes, H.; Soromessa, T.; Argaw, M.; Dewan, A. Spatio-temporal changes in habitat quality and linkage with landscape characteristics in the Beressa watershed, Blue Nile basin of Ethiopian highlands. J. Environ. Manag. 2021, 281, 111885. [Google Scholar] [CrossRef]
  8. Zhu, C.; Zhang, X.; Zhou, M.; He, S.; Gan, M.; Yang, L.; Wang, K. Impacts of urbanization and landscape pattern on habitat quality using OLS and GWR models in Hangzhou, China. Ecol. Indic. 2020, 117, 106654. [Google Scholar] [CrossRef]
  9. Wang, J.; Chen, Y.; Shao, X.; Zhang, Y.; Cao, Y. Land-use changes and policy dimension driving forces in China: Present, trend and future. Land Use Policy 2012, 29, 737–749. [Google Scholar] [CrossRef]
  10. Costanza, R.; d’Arge, R.; De Groot, R.; Farber, S.; Grasso, M.; Hannon, B.; Limburg, K.; Naeem, S.; O’neill, R.V.; Paruelo, J.; et al. The value of the world’s ecosystem services and natural capital. Nature 1997, 387, 253–260. [Google Scholar] [CrossRef]
  11. Fang, L.; Wang, L.; Chen, W.; Sun, J.; Cao, Q.; Wang, S.; Wang, L. Identifying the impacts of natural and human factors on ecosystem service in the Yangtze and Yellow River Basins. J. Clean. Prod. 2021, 314, 127995. [Google Scholar] [CrossRef]
  12. Zhao, L.; Yu, W.; Meng, P.; Zhang, J.; Zhang, J. InVEST model analysis of the impacts of land use change on landscape pattern and habitat quality in the Xiaolangdi Reservoir area of the Yellow River basin, China. Land Degrad. Dev. 2022, 33, 2870–2884. [Google Scholar] [CrossRef]
  13. Ma, S.; Wang, L.-J.; Jiang, J.; Zhao, Y.-G. Direct and indirect effects of agricultural expansion and landscape fragmentation processes on natural habitats. Agric. Ecosyst. Environ. 2023, 353, 108555. [Google Scholar] [CrossRef]
  14. Zhu, S.; Li, L.; Wu, G.; Liu, J.; Slate, T.J.; Guo, H.; Li, D. Assessing the Impact of Village Development on the Habitat Quality of Yunnan Snub-Nosed Monkeys Using the INVEST Model. Biology 2022, 11, 1487. [Google Scholar] [CrossRef] [PubMed]
  15. Van Horne, B. Density as a Misleading Indicator of Habitat Quality. J. Wildl. Manag. 1983, 47, 893. [Google Scholar] [CrossRef]
  16. Engel, D.W.; Thayer, G.W.; Evans, D.W. Linkages between fishery habitat quality, stressors, and fishery populations. Environ. Sci. Policy 1999, 2, 465–475. [Google Scholar] [CrossRef]
  17. Mortelliti, A.; Amori, G.; Boitani, L. The role of habitat quality in fragmented landscapes: A conceptual overview and prospectus for future research. Oecologia 2010, 163, 535–547. [Google Scholar] [CrossRef] [PubMed]
  18. Grafius, D.R.; Corstanje, R.; Warren, P.H.; Evans, K.L.; Hancock, S.; Harris, J.A. The impact of land use/land cover scale on modelling urban ecosystem services. Landsc. Ecol. 2016, 31, 1509–1522. [Google Scholar] [CrossRef]
  19. Li, M.; Liang, D.; Xia, J.; Song, J.; Cheng, D.; Wu, J.; Cao, Y.; Sun, H.; Li, Q. Evaluation of water conservation function of Danjiang River Basin in Qinling Mountains, China based on InVEST model. J. Environ. Manag. 2021, 286, 112212. [Google Scholar] [CrossRef]
  20. Zhong, L.; Wang, J. Evaluation on effect of land consolidation on habitat quality based on InVEST model. Trans. Chin. Soc. Agric. Eng. 2017, 33, 250–255. [Google Scholar]
  21. Hasan, S.S.; Zhen, L.; Miah, M.G.; Ahamed, T.; Samie, A. Impact of land use change on ecosystem services: A review. Environ. Dev. 2020, 34, 100527. [Google Scholar] [CrossRef]
  22. Babbar, D.; Areendran, G.; Sahana, M.; Sarma, K.; Raj, K.; Sivadas, A. Assessment and prediction of carbon sequestration using Markov chain and InVEST model in Sariska Tiger Reserve, India. J. Clean. Prod. 2021, 278, 123333. [Google Scholar] [CrossRef]
  23. Sallustio, L.; De Toni, A.; Strollo, A.; Di Febbraro, M.; Gissi, E.; Casella, L.; Geneletti, D.; Munafò, M.; Vizzarri, M.; Marchetti, M. Assessing habitat quality in relation to the spatial distribution of protected areas in Italy. J. Environ. Manag. 2017, 201, 129–137. [Google Scholar] [CrossRef]
  24. Terrado, M.; Sabater, S.; Chaplin-Kramer, B.; Mandle, L.; Ziv, G.; Acuña, V. Model development for the assessment of terrestrial and aquatic habitat quality in conservation planning. Sci. Total. Environ. 2016, 540, 63–70. [Google Scholar] [CrossRef]
  25. Li, F.; Wang, L.; Chen, Z.; Clarke, K.C.; Li, M.; Jiang, P. Extending the SLEUTH model to integrate habitat quality into urban growth simulation. J. Environ. Manag. 2018, 217, 486–498. [Google Scholar] [CrossRef]
  26. Chen, X.; Yu, L.; Cao, Y.; Xu, Y.; Zhao, Z.; Zhuang, Y.; Liu, X.; Du, Z.; Liu, T.; Yang, B.; et al. Habitat quality dynamics in China’s first group of national parks in recent four decades: Evidence from land use and land cover changes. J. Environ. Manag. 2023, 325, 116505. [Google Scholar] [CrossRef]
  27. Liu, C.; Wang, C.; Liu, L. Spatiotemporal Differences and Formation Mechanisms of Habitat Quality in the Transition Zones of Three Major Natural Regions: A Case Study of Yuzhong County. Geogr. Res. 2018, 37, 419–432. [Google Scholar]
  28. Jia, L.; Yao, S.B.; Deng, Y.J.; Hou, M.Y.; Ding, Z.M.; Li, Y.Y.; Gong, Z.W.; Liu, G.Q. Spatial and temporal evolution of habitat quality and its topographic gradient effect in Qinba Mountain area of Shaanxi Province from 2000 to 2020. Resour. Environ. Yangtze Basin 2019, 31, 398–413. [Google Scholar]
  29. Zheng, B.C.; Xie, B.G.; You, X.B. Characteristics of habitat quality change in the Guangdong-Hong Kong-Macao Greater Bay Area from 1980 to 2020. Econ. Geogr. 2002, 42, 41–50. [Google Scholar]
  30. Bai, L.; Xiu, C.; Feng, X.; Liu, D. Influence of urbanization on regional habitat quality: A case study of Changchun City. Habitat Int. 2019, 93, 102042. [Google Scholar] [CrossRef]
  31. Honnay, O.; Hermy, M.; Coppin, P. Impact of habitat quality on forest plant species colonization. For. Ecol. Manag. 1999, 115, 157–170. [Google Scholar] [CrossRef]
  32. Liu, J.; Linderman, M.; Ouyang, Z.; An, L.; Yang, J.; Zhang, H. Ecological Degradation in Protected Areas: The Case of Wolong Nature Reserve for Giant Pandas. Science 2001, 292, 98–101. [Google Scholar] [CrossRef] [PubMed]
  33. Li, W. Environmental management indicators for ecotourism in China’s nature reserves: A case study in Tianmushan Nature Reserve. Tour. Manag. 2004, 25, 559–564. [Google Scholar] [CrossRef]
  34. Wu, R.; Zhang, S.; Yu, D.W.; Zhao, P.; Li, X.; Wang, L.; Yu, Q.; Ma, J.; Chen, A.; Long, Y. Effectiveness of China’s nature reserves in representing ecological diversity. Front. Ecol. Environ. 2011, 9, 383–389. [Google Scholar] [CrossRef] [PubMed]
  35. Regulations on the Nature Protection Regions of the People’s Republic of China. Available online: https://www.gov.cn/zhengce/202203/content_3338421.htm. (accessed on 4 January 2023).
  36. Several Opinions of the Central Committee of the Communist Party of China and The State Council on the Establishment of a Territorial Spatial Planning System and the Supervision of its Implementation. (Zhong Fa [2019] No.18). Available online: https://www.gov.cn/zhengce/2019-05/23/content_5394187.htm. (accessed on 5 January 2023).
  37. Lu, H.; Campbell, D.; Chen, J.; Qin, P.; Ren, H. Conservation and economic viability of nature reserves: An emergy evaluation of the Yancheng Biosphere Reserve. Conserv. Biol. 2007, 139, 415–438. [Google Scholar] [CrossRef]
  38. Ren, G.; Young, S.S.; Wang, L.; Wang, W.; Long, Y.; Wu, R.; Li, J.; Zhu, J.; Yu, D.W. Effectiveness of China’s national forest protection program and nature reserves. Conserv. Biol. 2015, 29, 1368–1377. [Google Scholar] [CrossRef] [PubMed]
  39. Xiao, P.; Zhou, Y.; Li, M.; Xu, J. Spatiotemporal patterns of habitat quality and its topographic gradient effects of Hubei Province based on the InVEST model. Environ. Dev. Sustain. 2023, 25, 6419–6448. [Google Scholar] [CrossRef]
  40. Chen, S.; Liu, W. Impacts of different levels of urban expansion on habitats at the regional scale and their critical distance thresholds. Environ. Res. Lett. 2023, 18, 044001. [Google Scholar] [CrossRef]
  41. Li, M.; Zhou, Y.; Xiao, P.; Tian, Y.; Huang, H.; Xiao, L. Evolution of Habitat Quality and Its Topographic Gradient Effect in Northwest Hubei Province from 2000 to 2020 Based on the InVEST Model. Land 2021, 10, 857. [Google Scholar] [CrossRef]
  42. Lü, D.; Gao, G.; Lü, Y.; Xiao, F.; Fu, B. Detailed land use transition quantification matters for smart land management in drylands: An in-depth analysis in Northwest China. Land Use Policy 2020, 90, 104356. [Google Scholar] [CrossRef]
  43. López, E.; Bocco, G.; Mendoza, M.; Duhau, E. Predicting land-cover and land-use change in the urban fringe: A case in Morelia city, Mexico. Landsc. Urban Plan. 2001, 55, 271–285. [Google Scholar] [CrossRef]
  44. Liu, X.; Andersson, C. Assessing the impact of temporal dynamics on land-use change modeling. Comput. Environ. Urban Syst. 2004, 28, 107–124. [Google Scholar] [CrossRef]
  45. Wang, G.; Liu, Y.; Li, Y.; Chen, Y. Dynamic trends and driving forces of land use intensification of cultivated land in China. J. Geogr. Sci. 2014, 25, 45–57. [Google Scholar] [CrossRef]
  46. Li, P.; Zuo, D.; Xu, Z.; Zhang, R.; Han, Y.; Sun, W.; Pang, B.; Ban, C.; Kan, G.; Yang, H. Dynamic changes of land use/cover and landscape pattern in a typical alpine river basin of the Qinghai-Tibet Plateau, China. Land Degrad. Dev. 2021, 32, 4327–4339. [Google Scholar] [CrossRef]
  47. Wang, S.-Y.; Liu, J.-S.; Ma, T.-B. Dynamics and changes in spatial patterns of land use in Yellow River Basin, China. Land Use Policy 2010, 27, 313–323. [Google Scholar] [CrossRef]
  48. He, C.; Zhang, D.; Huang, Q.; Zhao, Y. Assessing the potential impacts of urban expansion on regional carbon storage by linking the LUSD-urban and InVEST models. Environ. Model. Softw. 2016, 75, 44–58. [Google Scholar] [CrossRef]
  49. Zhao, M.; He, Z.; Du, J.; Chen, L.; Lin, P.; Fang, S. Assessing the effects of ecological engineering on carbon storage by linking the CA-Markov and InVEST models. Ecol. Indic. 2019, 98, 29–38. [Google Scholar] [CrossRef]
  50. Nie, X.; Lu, B.; Chen, Z.; Yang, Y.; Chen, S.; Chen, Z.; Wang, H. Increase or decrease? Integrating the CLUMondo and InVEST models to assess the impact of the implementation of the Major Function Oriented Zone planning on carbon storage. Ecol. Indic. 2020, 118, 106708. [Google Scholar] [CrossRef]
  51. Huang, C.; Zhang, C.; Li, H. Assessment of the Impact of Rubber Plantation Expansion on Regional Carbon Storage Based on Time Series Remote Sensing and the InVEST Model. Remote Sens. 2022, 14, 6234. [Google Scholar] [CrossRef]
  52. Yang, D.; Liu, W.; Tang, L.; Chen, L.; Li, X.; Xu, X. Estimation of water provision service for monsoon catchments of South China: Applicability of the InVEST model. Landsc. Urban Plan. 2019, 182, 133–143. [Google Scholar] [CrossRef]
  53. Dormann, C.F. Effects of incorporating spatial autocorrelation into the analysis of species distribution data. Glob. Ecol. Biogeogr. 2007, 16, 129–138. [Google Scholar] [CrossRef]
  54. Zhu, L.; Meng, J.; Zhu, L. Applying Geodetector to disentangle the contributions of natural and anthropogenic factors to NDVI variations in the middle reaches of the Heihe River Basin. Ecol. Indic. 2020, 117, 106545. [Google Scholar] [CrossRef]
  55. Zhao, R.; Zhan, L.; Yao, M.; Yang, L. A geographically weighted regression model augmented by Geodetector analysis and principal component analysis for the spatial distribution of PM2.5. Sustain. Cities Soc. 2020, 56, 102106. [Google Scholar] [CrossRef]
  56. Zeng, W.; Wan, X.; Lei, M.; Gu, G.; Chen, T. Influencing factors and prediction of arsenic concentration in Pteris vittata: A combination of geodetector and empirical models. Environ. Pollut. 2022, 292, 118240. [Google Scholar] [CrossRef]
  57. Zhao, Y.; Liu, L.; Kang, S.; Ao, Y.; Han, L.; Ma, C. Quantitative Analysis of Factors Influencing Spatial Distribution of Soil Erosion Based on Geo-Detector Model under Diverse Geomorphological Types. Land 2021, 10, 604. [Google Scholar] [CrossRef]
  58. Lopes, N.D.R.; Li, T.; Qian, D.; Matomela, N.; Sá, R.M. Factors influencing coastal land cover change and corresponding impact on habitat quality in the North-western Coastline of Guinea-Bissau (NC-GB). Ocean Coast. Manag. 2022, 224, 106181. [Google Scholar] [CrossRef]
  59. Guiding Opinions on Establishing a System of Protected Natural Areas with National Parks as the Main Body; General Office of the CPC Central Committee and The General Office of the State Council: Beijing, China, 2019. Available online: https://www.gov.cn/zhengce/2019-06/26/content_5403497.htm. (accessed on 6 January 2023).
Figure 1. Location map of the 18 national nature reserves in Hubei Province.
Land 13 00363 g001
Figure 2. Schematic diagram of research methods.
Land 13 00363 g002
Figure 3. Topographic map of Hubei Province.
Land 13 00363 g003
Figure 4. The 2020 land use status map of national nature reserves in Hubei Province. Note: The abbreviations stand for SWD—Saiwudang, NH—Nan River, WDX—Wudao Canyon, SBL—Shibali, DHY—Duheyuan, SNJ—Shennongjia, BDJSH—Badong Golden Monkey, DLL—Dalao Ling, XDS—Xingdou Mountain, QJMS—Qijiemei Mountain, MLZ—Mulinzi, WFHH—Wufenghou River, CYBJZ—Changyang Bengjianzi, SSML—Shishou Elk, HH—Hong Lake, JGS—Jiugong Mountain, LGH—Longgan Lake, DBS—Dabie Mountain.
Land 13 00363 g004
Figure 5. The 2020 land use structure map of national nature reserves in Hubei Province.
Land 13 00363 g005
Figure 6. Chord diagram of land use transition in national nature reserves of Hubei Province, 2000–2020.
Land 13 00363 g006
Figure 7. Habitat quality in national nature reserves of Hubei Province from 2000 to 2020. Note: The red dotted line indicates an increase in habitat quality on the left and a decrease on the right.
Land 13 00363 g007
Figure 8. Percentage of area in cold and hot spots of habitat quality changes from 2000 to 2020.
Land 13 00363 g008
Figure 9. Spatial distribution map of habitat quality change hot spots from 2000 to 2020.
Land 13 00363 g009aLand 13 00363 g009bLand 13 00363 g009cLand 13 00363 g009dLand 13 00363 g009e
Figure 10. The contribution rate of factors influencing habitat quality evolution from 2000 to 2020. Note: X1: elevation; X2: slope; X3: terrain ruggedness; X4: distance from water systems; X5: average patch density; X6: landscape fragmentation; X7: annual mean temperature change; X8: annual mean precipitation change; X9: land use intensity; X10: distance from tourist service facilities; X11: distance from highways; X12: distance from national and provincial roads; X13: distance from county and township roads; and X14: scale of returning farmland to forest.
Land 13 00363 g010aLand 13 00363 g010b
Table 1. Directory of national nature reserves in Hubei Province.
NumberTypeName of National Nature Reserve in HubeiArea (ha)Establishment YearConservation TargetsSelected
1Forest ecologyShennongjia70,4671986Forest ecosystems, flora and faunaYes
2Wufeng Houhe10,3402000
3Xingdoushan68,3392003
4Jiugongshan16,6082007
5Qizimei Mountains34,5502008
6Saiwudang21,2032011
7Mulinzi20,8382012
8Duheyuan National47,1732013
9Shibalichangxia25,6052013
10Nanhe14,8332014
11Dabie Mountains16,0482014
12Badong Golden Monkey20,9102016
13Three Gorges Dalao Ridge14,2252017
14Wudaoxia20,8602017
15Changyang Bengjianzi13,3132017
16Inland wetlandLonggan Lake22,3222009Wetland plants, animals
17Honghu41,4122014
18WildlifeShishou Milu Deer15671998Wildlife resources
19Aquatic wildlifeHubei Yangtze River Xintan Baiji Dolphin40,0001992Aquatic wildlife and habitatsNo
20Hubei Yangtze River Tian’ezhou Baiji Dolphin15,2501992
21Hubei Zhongjian River Giant Salamander10432012
22Paleontological relicsHubei Qinglongshan Dinosaur Egg Fossil4552001Paleontological relics and fossils
Data Source: Compiled by the author based on the “Directory of Nature Reserves in Hubei Province”. Hubei Provincial Department of Ecology and Environment. Directory of Nature Reserves in Hubei Province [EB/OL] [19 November 2018].
Table 2. Research data and sources.
CategoryNameFormatTimeSource
Land use dataLand Use DataRaster data (30 m)2000, 2010, 202030 Meters Global Land Cover Data GlobeLobe30 (http://globeland30.org, (accessed on 5 November 2022))
Basic geographic dataRoad DataVector data2020OpenStreetMap (https://www.openstreetmap.org, (accessed on 10 December 2022))
Water System DataVector data2020
Research Area BoundaryImage2020Hubei Provincial Department of Ecology and Environment (https://sthjt.hubei.gov.cn, (accessed on 11 December 2022))
Digital Elevation ModelRaster data (30 m)-Data Center for Resources and Environmental Sciences, Chinese Academy of Sciences (http://www.resdc.cn, (accessed on 7 January 2023))
Natural environment dataAnnual Average TemperatureRaster data (1 km)2000, 2010, 2020
Annual Average PrecipitationRaster data (1 km)2000, 2010, 2020
Socio-cultural dataPOIVector data2000, 2010, 2020
OtherHubei Province and Municipal Land and Space PlanningDocument2020Hubei Provincial Department of Natural Resources and municipal natural resources and planning bureaus official website
Table 3. Classification of land use/cover in national nature reserves of Hubei Province.
Land Type NameGlobeLand30 Land Types and Codes
01Cultivated land10 cultivated land
02Forest land20 forest land, 40 shrubland
03Grassland30 grassland
04Water body50 wetlands, 60 water bodies, 100 glaciers and permanent snow
05Urban, industrial, and residential land (construction land)80 artificial surfaces
06Unused land90 bare land, 70 tundra
Note: There is no tundra (70) or bare land (90) within the study area.
Table 4. Habitat quality threat factor attributes.
Threat FactorMaximum Impact Distance (Km)WeightSpatial Decay Type
Cultivated land40.5Exponential
Construction land80.8Exponential
Railway20.6Linear
Expressway60.5Linear
Other roads50.65Linear
Table 5. Relative sensitivity of each habitat type to each threat factor.
Land Use TypeHabitat
Suitability
Threat Factor
Cultivated LandConstruction LandRailwayExpresswayRoads
Cultivated land0.30.30.40.350.350.3
Forest land10.80.60.70.650.6
Grassland0.70.50.60.70.650.6
Water body0.90.650.70.60.60.65
Construction land000000
Table 6. Types of dual-factor interactions.
Judgment TypeType
q(X1∩X2) < min(q(X1),q(X2))Nonlinear diminishing
min(q(X1),q(X2)) < q(X∩X2) < max(q(X1),q(X2))Single-factor nonlinear diminishing
q(X1∩X2) > max(q(X1),q(X2))Dual-factor enhancement
q(X1∩X2) = q(X1) + q(X2)Independent
q (X1∩X2) > q(X1) + q(X2)Nonlinear enhancement
Table 7. Classification of national nature reserves in Hubei Province.
LocationMountain Range or River SystemName of National Nature Reserves in Hubei Province
Western Hubei
(13)
Daba MountainsSaiwudang, Nan River, Wudao Canyon, Shibalili, Duheyuan, Shennongjia, Badong Golden Monkey, Dalao Ling
Wuling Mountain RangeXingdou Mountain, Qijiemei Mountain, Mulinzi, Wufenghou River, Changyang Bengjianzi
Central Hubei (2)Middle Yangtze RiverShishou Elk, Honghu
Eastern Hubei
(3)
Dabie MountainsDabie Mountain
Middle and Lower Yangtze RiverLonggan Lake
Mufu Mountain RangeJiugong Mountain
Table 8. Land use transition matrix for national nature reserves in Hubei Province, 2000–2020 (ha).
Time PeriodLand Use
Type
Cultivated
Land
Forest LandGrasslandWater BodyConstruction LandTotal
2000–2010Cultivated land4709.07432.993141.097.0249,780.62
Forest land5197.86376.83148.681.53428,360.9
Grassland584.8214,452.5653.014.8622,042.8
Water body492.93113.6744.281.4451,734.07
Construction land9.002.700.090.00139.59
Total47,775.06441,9147801.7454,424.53142.65552,058
2010–2020Cultivated land5459.22270.9317.43141.2147,775.06
Forest land5932.714411.62587.0746.8441,914
Grassland675.991472.76196.5628.717801.74
Water body17,055.54108.54257.859.9954,424.53
Construction land95.944.050.630.99142.65
Total65,346.48437,980.410,368.7238,094.66267.75552,058
2000–2020Cultivated land5315.58506.16785.34145.5349,780.62
Forest land6440.673294.09572.7643.2428,203.5
Grassland853.0214,549.31277.6540.1422,042.8
Water body14,921.19101.88245.077.4751,734.07
Construction land103.593.420.720.45139.59
Total65,346.48437,82310,368.7238,094.66267.755520.58
Table 9. Land use dynamic degree of national nature reserves in Hubei Province, 2000–2020 (%).
Time PeriodCultivated LandForest
Land
Grassland Water BodyConstruction LandTotal
2000–2010−0.400.32−6.400.50−1.280.27
2010–20203.68−0.093.25−3.0111.460.34
2000–20201.560.11−2.62−1.334.350.22
Table 10. Area proportions of each habitat quality level (%).
Years200020102020
Habitat QualityHighest LevelHigher LevelLower LevelLowest LevelHighest LevelHigher LevelLower LevelLowest LevelHighest LevelHigher LevelLower LevelLowest Level
Shennongjia92.39 4.21 3.40 0.00 93.99 2.64 3.36 0.00 93.30 3.39 3.28 0.03
Shishou Elk65.13 12.28 22.59 0.00 74.22 12.44 13.34 0.00 77.17 10.29 12.54 0.00
Wufenghou River95.45 0.65 3.90 0.00 95.98 0.43 3.59 0.00 95.96 0.44 3.60 0.00
Xingdou Mountain2.51 12.60 65.16 19.74 3.38 11.14 66.38 19.10 6.36 23.67 68.43 1.54
Jiugong Mountain88.12 8.39 3.49 0.00 88.13 8.37 3.51 0.00 87.97 7.78 3.18 1.07
Qijiemei Mountain86.90 5.07 8.03 0.00 88.31 3.68 8.02 0.00 91.66 0.52 7.82 0.00
Longgan Lake0.26 23.22 42.18 34.35 0.28 23.31 42.48 33.93 0.12 17.75 41.47 40.66
Saiwudang95.67 2.16 1.78 0.38 97.57 0.06 1.99 0.38 97.00 0.72 2.28 0.00
Mulinzi86.06 4.28 9.66 0.00 86.49 4.10 9.40 0.00 89.77 0.89 9.35 0.00
Duheyuan92.51 1.50 5.69 0.31 92.92 1.06 5.71 0.31 92.85 1.05 6.03 0.06
Shibali Canyon94.12 1.42 4.46 0.00 94.55 1.03 4.43 0.00 94.43 1.11 4.46 0.00
Hong Lake89.02 3.86 7.12 0.00 98.20 0.18 1.62 0.00 5.07 19.93 43.23 31.77
Nan River92.24 3.78 3.88 0.10 95.45 0.00 4.41 0.14 95.46 0.00 4.50 0.04
Dabie Mountain94.52 1.36 4.12 0.00 94.29 1.34 4.37 0.00 94.37 1.26 4.28 0.09
Badong Golden Monkey93.08 3.36 3.56 0.00 94.88 1.33 3.80 0.00 93.12 3.13 3.76 0.00
Dalao Ling97.58 0.43 1.99 0.00 97.26 0.13 2.61 0.00 97.28 0.14 2.59 0.00
Wudao Canyon92.23 0.88 6.89 0.00 90.54 0.00 9.46 0.00 90.51 0.00 9.49 0.00
Changyang Bengjianzi87.18 1.94 10.47 0.40 88.61 0.66 10.32 0.40 88.95 0.66 10.38 0.00
Total77.10 5.20 13.95 3.75 78.72 3.85 13.77 3.66 71.77 6.70 17.29 4.23
Table 11. Table of indicators for factors influencing habitat quality changes.
CategoryElementCodeFactorCalculation Method and Dimension
Dependent variableHabitat qualityHabitat qualityY1Habitat quality in 2000
Y2Habitat quality in 2010
Y3Habitat quality in 2020
Independent variableNatural geographyTopographyX1ElevationDEM data extraction (m)
X2SlopeElevation Difference/water Distance × 100% (%)
X3Terrain RuggednessHighest elevation—lowest elevation (m)
HydrologyX4Distance from water bodiesEuclidean distance (m)
Landscape patternX5Average patch areaTotal patch area/number of patches
X6landscape fragmentationNumber of patches/total patch area
Climatic conditionsX7Annual average temperature°C
X8Annual average precipitationmm
Socio-culturalIndigenous activitiesX9Land use intensityForest, grassland, water = 1; farmland = 2;
construction land = 3
Tourism facilitiesX10Distance from tourist service facilitiesEuclidean distance (m)
Transportation locationX11Distance from highwaysEuclidean distance (m)
X12Distance from national and provincial roads
X13Distance from county and township roads
Policy regulationReturning farmland to forestX14Scale of returning farmland to forestScale of returning farmland to forest (ha)
Table 12. The results of factor interactions in habitat quality evolution.
YearsShennongjiaShishou ElkWufenghou RiverXingdou MountainJiugong MountainQijiemei MountainLonggan LakeSaiwudangMulinzi
2000X9∩X12(0.69284)X10∩X12(0.45401)X9∩X12(0.89728)X9∩X13(0.72173)X6∩X9(0.71834)X9∩X13(0.74724)X9∩X13(0.62373)X9∩X14(0.73629)X9∩X13(0.83875)
X9∩X13(0.68929)X9∩X10(0.42885)X1∩X9(0.89455)X9∩X12(0.71407)X9∩X12(0.71684)X9∩X12(0.73822)X9∩X12(0.61644)X9∩X13(0.72731)X9∩X12(0.82016)
X6∩X9(0.64037)X9∩X12(0.41950)X4∩X9(0.89270)X9∩X14(0.68752)X9∩X13(0.71572)X9∩X14(0.72442)X6∩X9(0.59673)X6∩X9(0.72551)X9∩X14(0.81820)
X5∩X9(0.62275)X6∩X12(0.41668)X9∩X13(0.89241)X6∩X9(0.68518)X5∩X9(0.70724)X6∩X9(0.70839)X5∩X9(0.59470)X5∩X9(0.72529)X6∩X9(0.80644)
X9∩X14(0.61566)X2∩X12(0.40804)X9∩X10(0.89227)X4∩X9(0.67897)X7∩X9(0.70632)X5∩X9(0.89608)X4∩X9(0.59057)X2∩X5(0.71967)X7∩X9(0.90439)
2010X9∩X13(0.83911)X9∩X10(0.64501)X9∩X13(0.96939)X9∩X13(0.81878)X9∩X12(0.87879)X9∩X13(0.83680)X9∩X12(0.63406)X9∩X13(0.81680)X9∩X13(0.79255)
X9∩X12(0.82957)X9∩X13(0.57896)X8∩X9(0.94814)X9∩X12(0.80917)X9∩X13(0.86913)X9∩X12(0.82933)X9∩X12(0.62736)X9∩X12(0.80933)X9∩X12(0.78181)
X6∩X9(0.82245)X9∩X12(0.56823)X9∩X12(0.94606)X6∩X9(0.72852)X2∩X12(0.73371)X9∩X14(0.74499)X2∩X9(0.59948)X9∩X14(0.74499)X9∩X14(0.76069)
X1∩X9(0.82239)X5∩X9(0.55707)X1∩X9(0.94375)X9∩X14(0.72674)X6∩X9(0.71462)X6∩X9(0.72829)X6∩X9(0.59899)X6∩X9(0.72829)X3∩X9(0.75468)
X5∩X9(0.81734)X2∩X12(0.53877)X4∩X9(0.93614)X5∩X9(0.71561)X2∩X13(0.73060)X3∩X9(0.71878)X5∩X9(0.59774)X3∩X9(0.72278)X6∩X9(0.75380)
2020X9∩X13(0.98701)X9∩X13(0.93165)X2∩X9(0.81092)X9∩X12(0.73380)X9∩X13(0.91368)X9∩X13(0.96443)X9∩X13(0.72295)X1∩X9(0.98947)X9∩X13(0.98505)
X9∩X12(0.94731)X9∩X13(0.93091)X2∩X12(0.75188)X9∩X13(0.68441)X9∩X12(0.90447)X4∩X9(0.96197)X9∩X12(0.71187)X6∩X9(0.98370)X9∩X12(0.97423)
X9∩X10(0.84571)X1∩X9(0.91038)X3∩X12(0.73858)X4∩X9(0.59726)X6∩X9(0.86004)X9∩X12(0.95682)X10∩X13(0.69542)X5∩X9(0.98284)X9∩X10(0.96403)
X1∩X9(0.84439)X9∩X10(0.91006)X2∩X13(0.73634)X7∩X9(0.59535)X5∩X9(0.85328)X9∩X10(0.94953)X9∩X10(0.65182)X9∩X12(0.98162)X4∩X9(0.96247)
X5∩X9(0.84194)X6∩X9(0.90809)X9∩X13(0.73285)X12∩X13(0.58457)X1∩X9(0.85045)X1∩X9(0.94011)X10∩X12(0.64741)X9∩X13(0.98132)X8∩X9(0.96033)
DuheyuanShibali CanyonHong LakeNan RiverDabie MountainBadong Golden MonkeyDalao LingWudao CanyonChangyang Bengjianzi
2000X9∩X13(0.72497)X9∩X13(0.68024)X9∩X13(0.58189)X9∩X13(0.66915)X9∩X13(0.82347)X9∩X12(0.89805)X9∩X13(0.81997)X9∩X13(0.64312)X6∩X9(0.59884)
X9∩X12(0.71118)X9∩X12(0.67392)X12∩X13(0.52352)X1∩X9(0.64730)X9∩X12(0.81622)X9∩X13(0.88878)X9∩X12(0.80938)X9∩X12(0.62065)X1∩X9(0.58435)
X7∩X9(0.70103)X6∩X9(0.65879)X9∩X12(0.51559)X9∩X12(0.64002)X9∩X14(0.81403)X7∩X9(0.72928)X7∩X9(0.79232)X9∩X11(0.60312)X9∩X13(0.58429)
X6∩X9(0.70056)X2∩X9(0.66685)X2∩X13(0.61138)X4∩X9(0.63907)X6∩X9(0.79715)X1∩X9(0.72809)X3∩X9(0.78677)X1∩X9(0.57042)X9∩X10(0.58197
X9∩X14(0.70002)X9∩X14(0.63453)X8∩X13(0.50749)X9∩X10(0.63826)X8∩X9(0.79619)X8∩X9(0.71170)X5∩X9(0.77686)X7∩X9(0.56542)X5∩X9(0.57601)
2010X9∩X13(0.81572)X9∩X13(0.99616)X9∩X13(0.67113)X9∩X13(0.64528)X9∩X13(0.86025)X9∩X13(0.64902)X9∩X13(0.91732)X9∩X13(0.57821)X9∩X13(0.77273)
X9∩X12(0.80788)X9∩X12(0.98664)X9∩X12(0.66411)X9∩X12(0.62937)X9∩X12(0.85861)X6∩X9(0.64189)X9∩X12(0.90545)X9∩X12(0.56664)X9∩X12(0.76301)
X1∩X9(0.72739)X6∩X9(0.96887)X6∩X9(0.53571)X4∩X9(0.62351)X6∩X9(0.83706)X9∩X14(0.63782)X5∩X9(0.87690)X6∩X9(0.53776)X6∩X9(0.74430)
X6∩X9(0.72641)X7∩X9(0.96788)X2∩X13(0.53559)X4∩X9(0.62351)X9∩X14(0.83218)X9∩X12(0.63539)X9∩X14(0.88156)X9∩X10(0.49617)X9∩X13(0.741998
X9∩X14(0.72038)X3∩X9(0.96782)X9∩X10(0.53348)X9∩X10(0.62242)X2∩X9(0.82873)X1∩X9(0.62391)X1∩X9(0.88033)X7∩X9(0.49503)X7∩X9(0.73718)
2020X9∩X12(0.97985)X8∩X9(0.94521)X9∩X13(0.76203)X9∩X13(0.99979)X9∩X12(0.96925)X9∩X13(0.96787)X9∩X13(1.00000)X9∩X13(0.99993)X9∩X11(0.98745)
X9∩X13(0.97692)X1∩X9(0.94282)X9∩X12(0.74298)X9∩X12(0.99979)X6∩X9(0.95779)X9∩X12(0.94340)X9∩X12(0.99992)X9∩X12(0.99561)X1∩X9(0.98410)
X9∩X10(0.96012)X7∩X9(0.84260)X8∩X9(0.72411)X6∩X9(0.99801)X4∩X9(0.95632)X1∩X9(0.93658)X1∩X9(0.99970)X9∩X11(0.98666)X4∩X9(0.98726)
X4∩X9(0.95917)X4∩X9(0.94023)X12∩X13(0.64128)X1∩X9(0.99798)X1∩X9(0.95550)X7∩X9(0.93393)X9∩X10(0.99963)X8∩X9(0.98648)X8∩X9(0.98478)
X6∩X9(0.95705)X9∩X13(0.93035)X8∩X13(0.60275)X3∩X9(0.99796)X5∩X9(0.95433)X8∩X9(0.91218)X4∩X9(0.99948)X4∩X9(0.98567)X8∩X9(0.98478)
Disclaimer/Publisher’s Note: The statements, opinions and data contained in all publications are solely those of the individual author(s) and contributor(s) and not of MDPI and/or the editor(s). MDPI and/or the editor(s) disclaim responsibility for any injury to people or property resulting from any ideas, methods, instructions or products referred to in the content.

