


Soil Erosion Characteristics in Tropical Island Watersheds Based on CSLE Model: Discussion of Driving Mechanisms


Abstract
1. Introduction
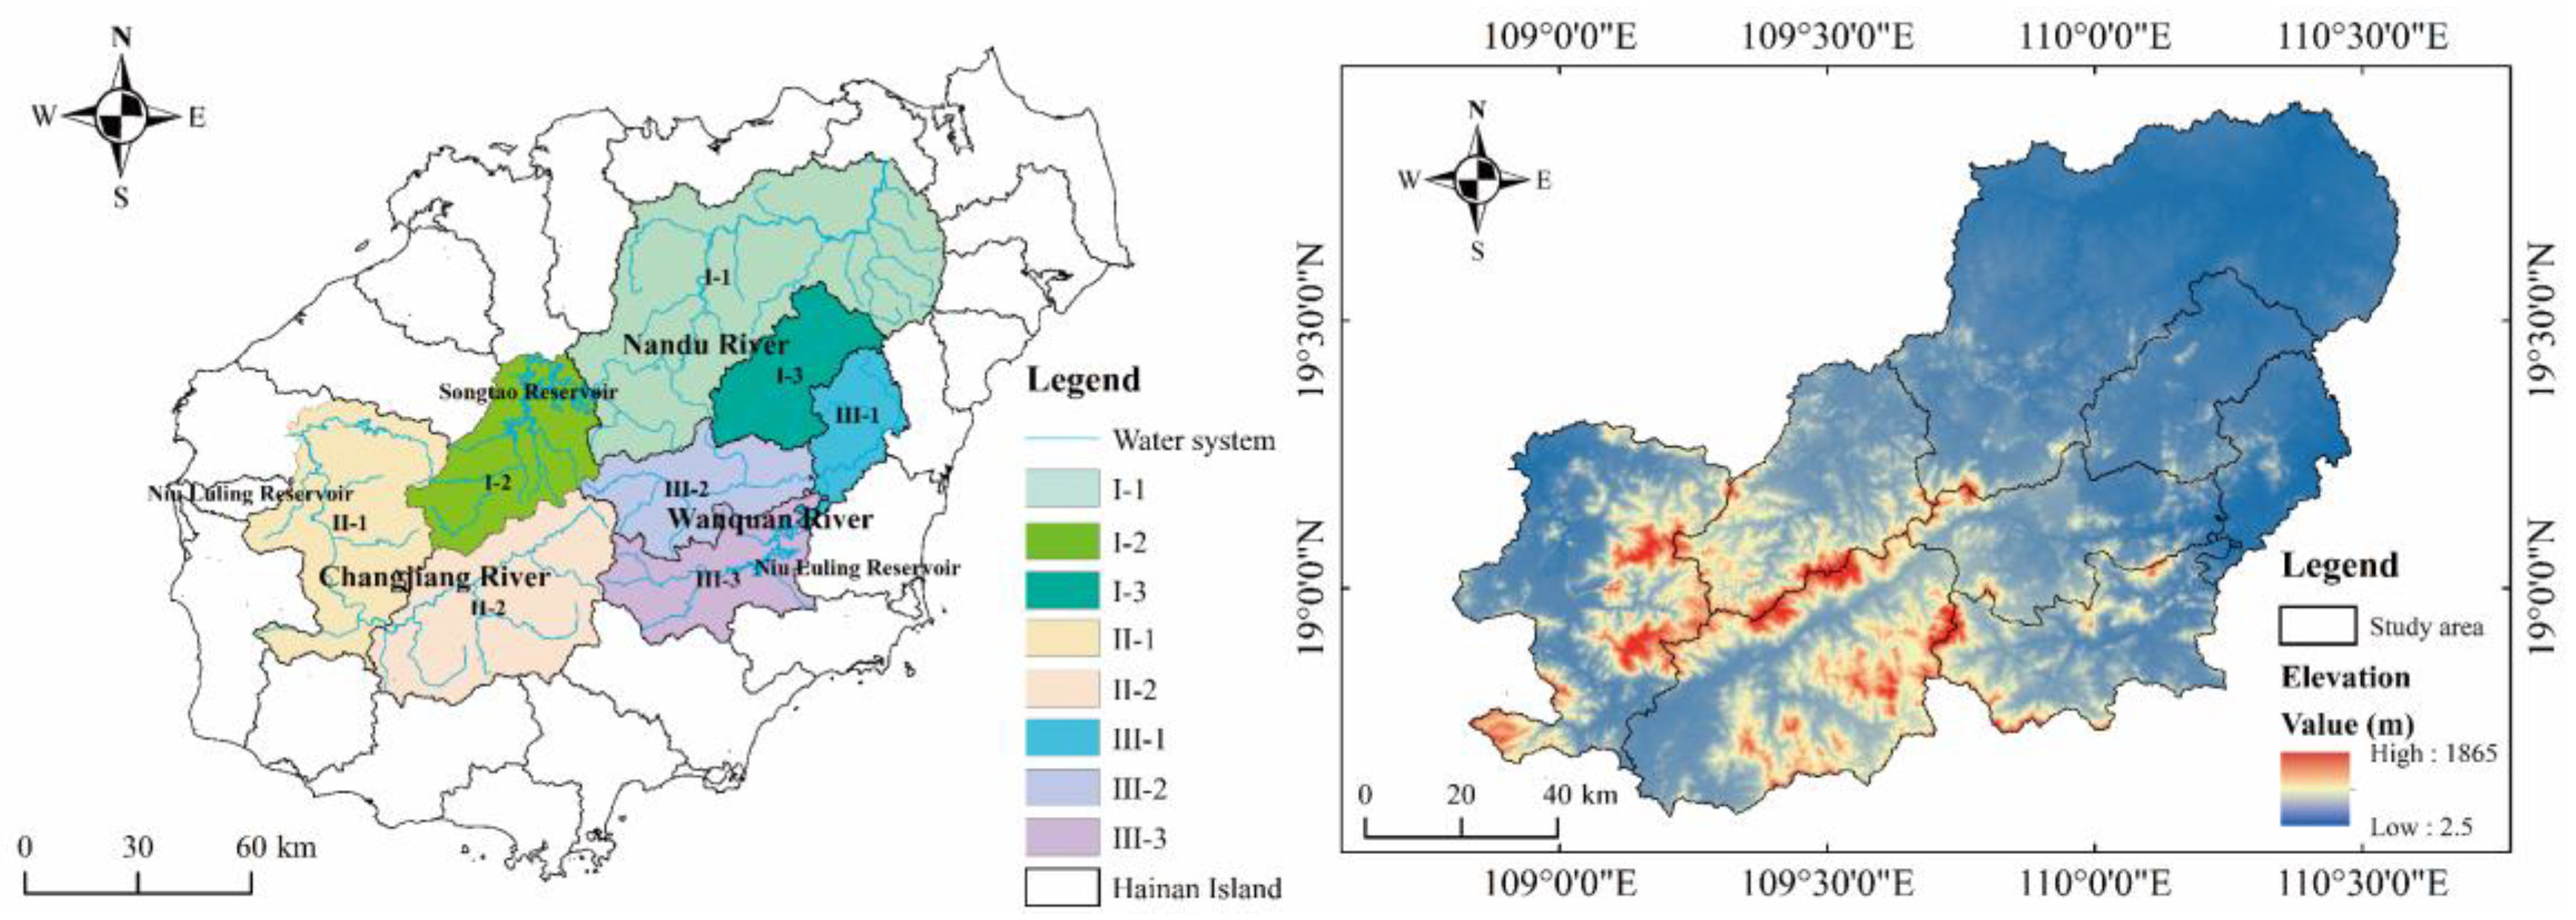
2. Study Area
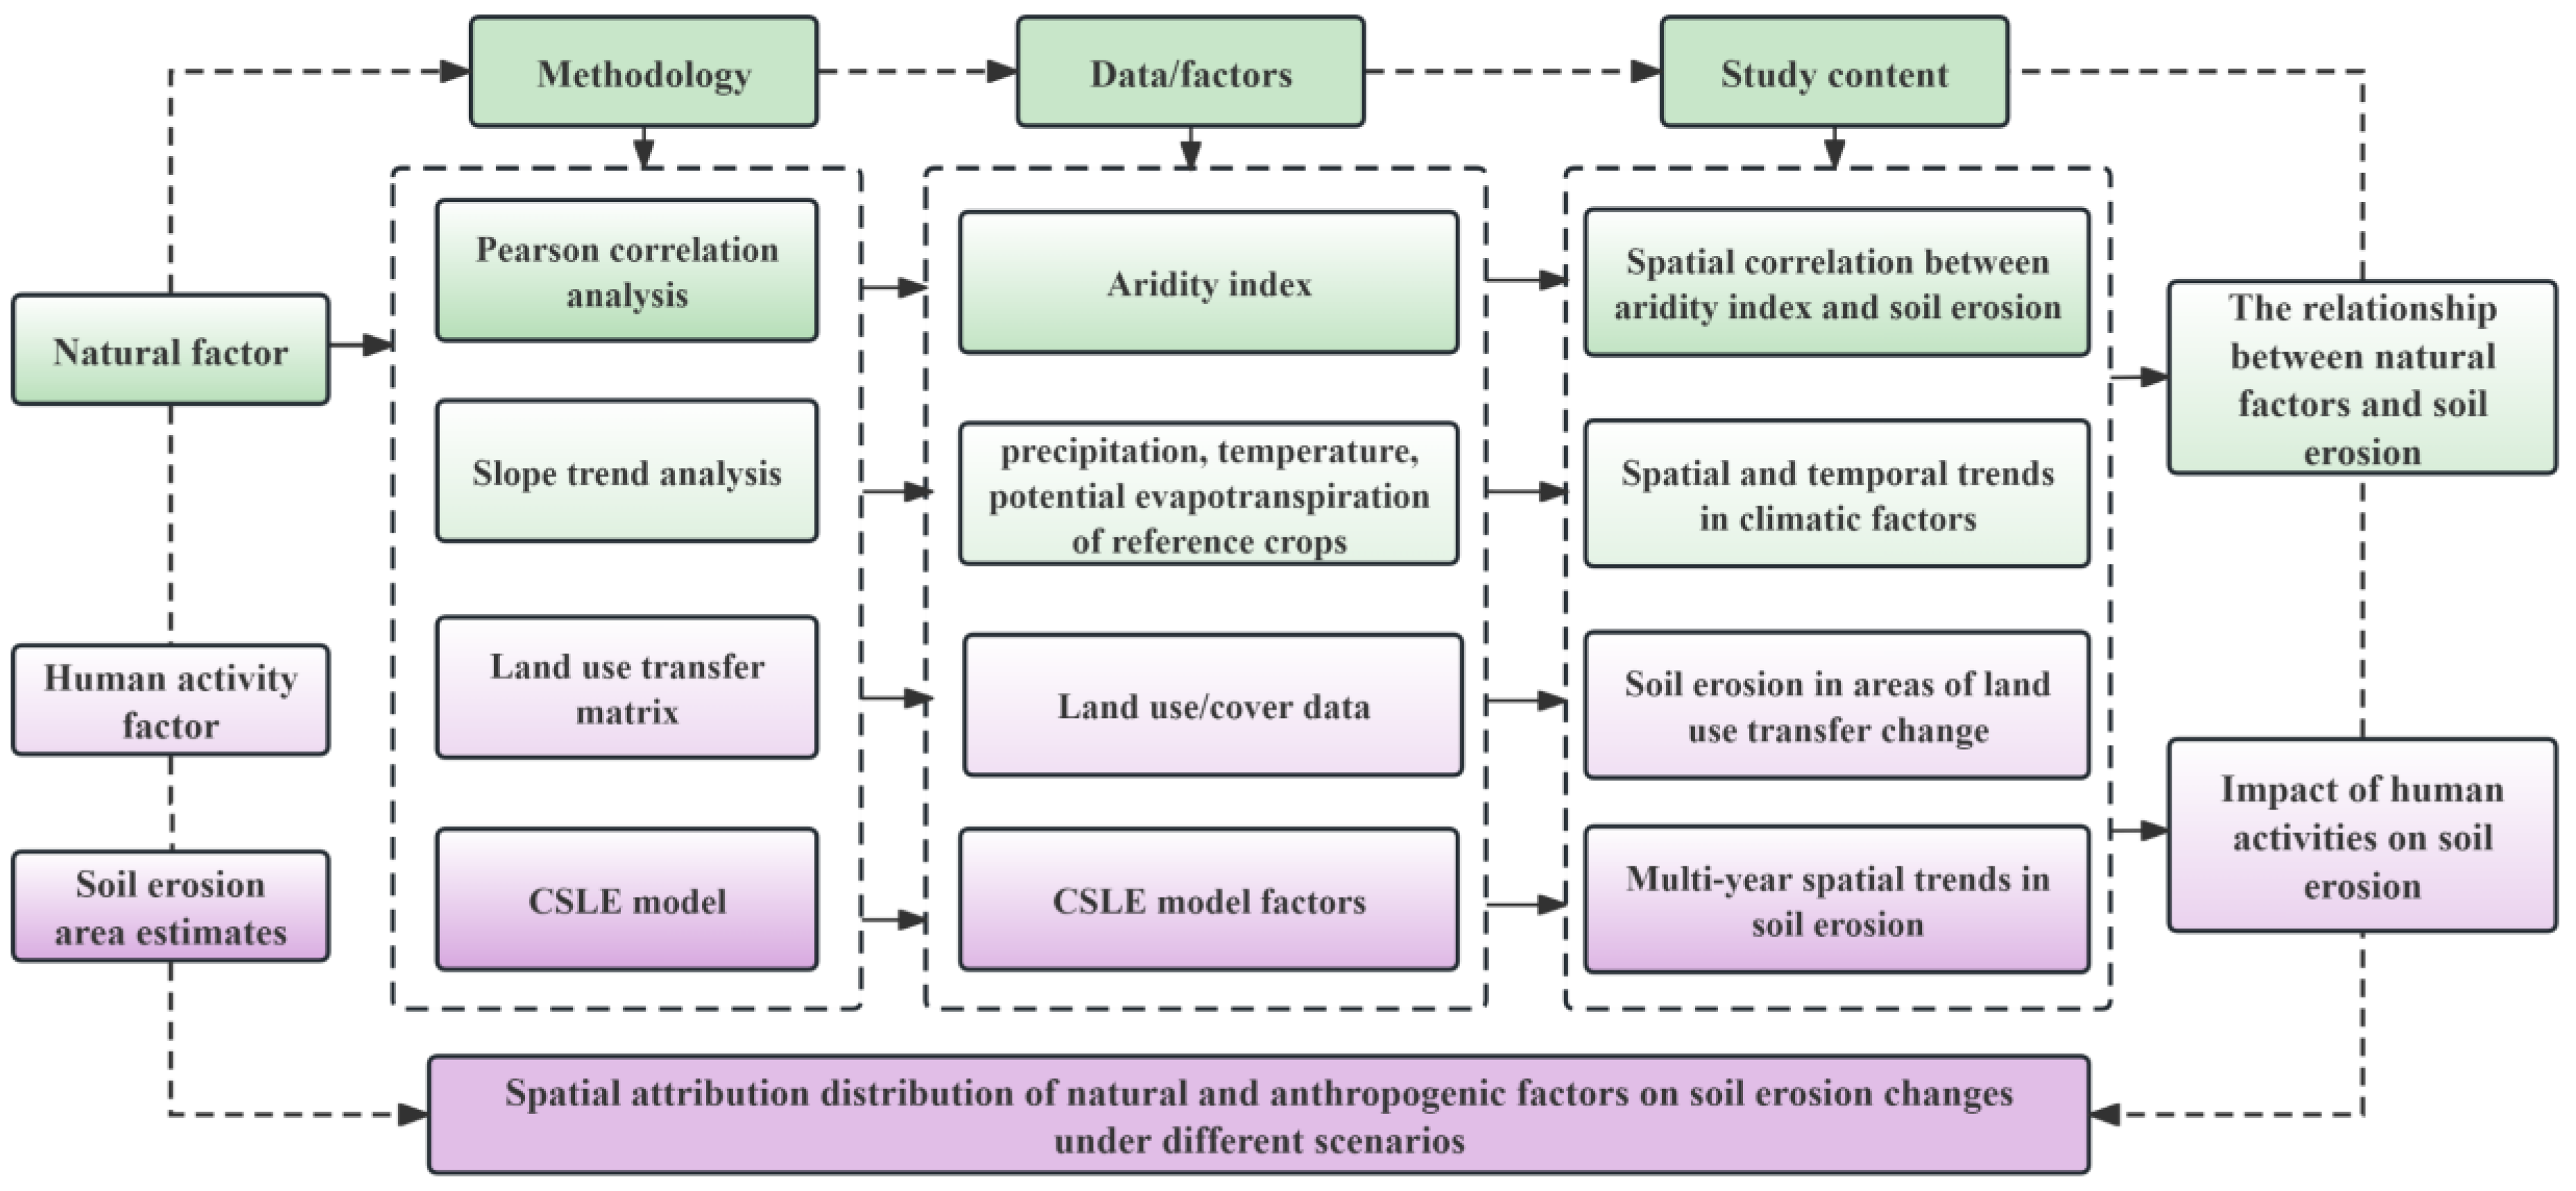
3. Method
3.1. Data Sources
3.2. Linear Regression Analysis
3.3. Aridity Index
3.4. Transition Matrix Method
3.5. Spatial Attribution Analysis
3.6. Soil Erosion Model
4. Result Analysis
4.1. Spatial and Temporal Characteristics of Hydrothermal Factors
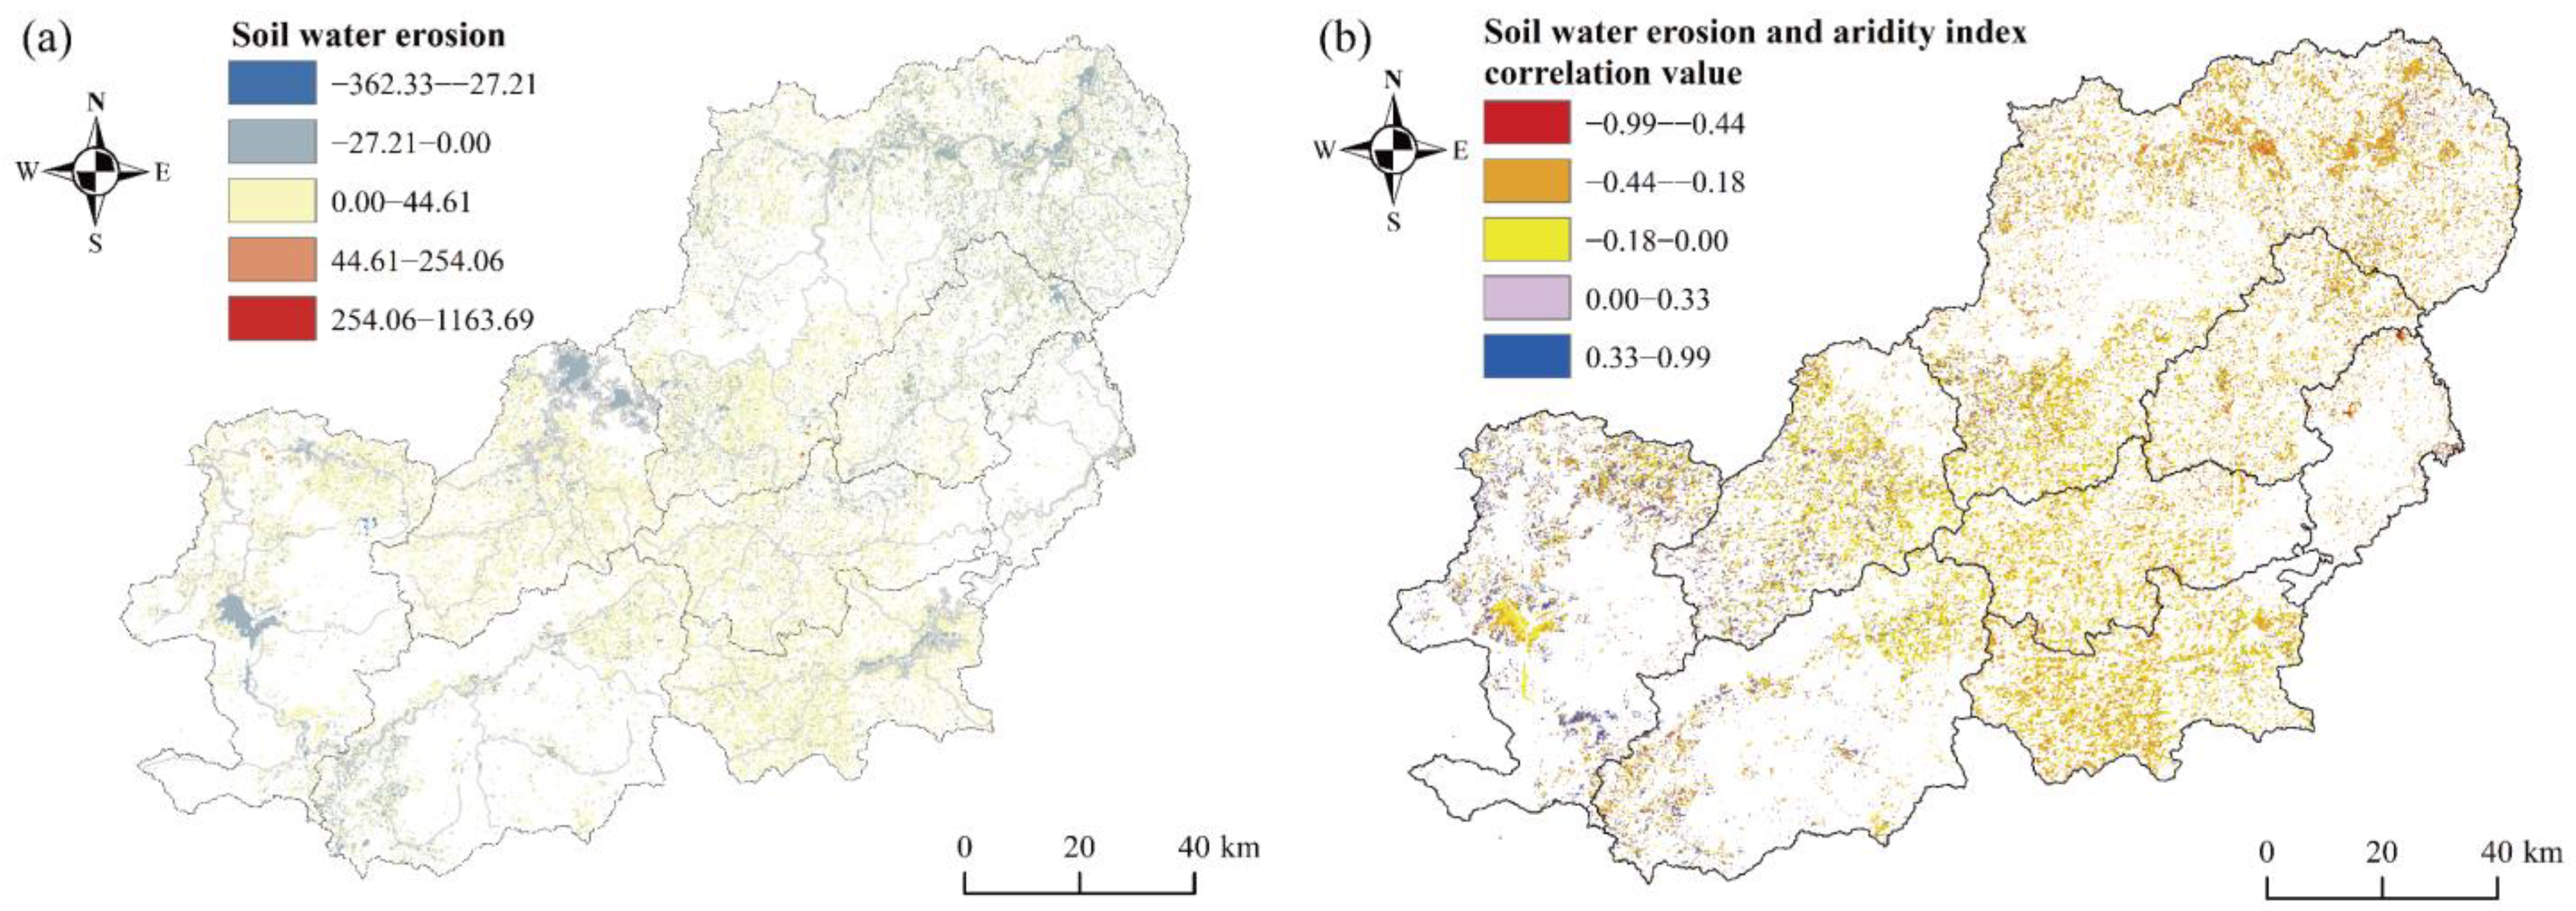
4.2. Correlation Analysis of Soil Erosion and Aridity Index
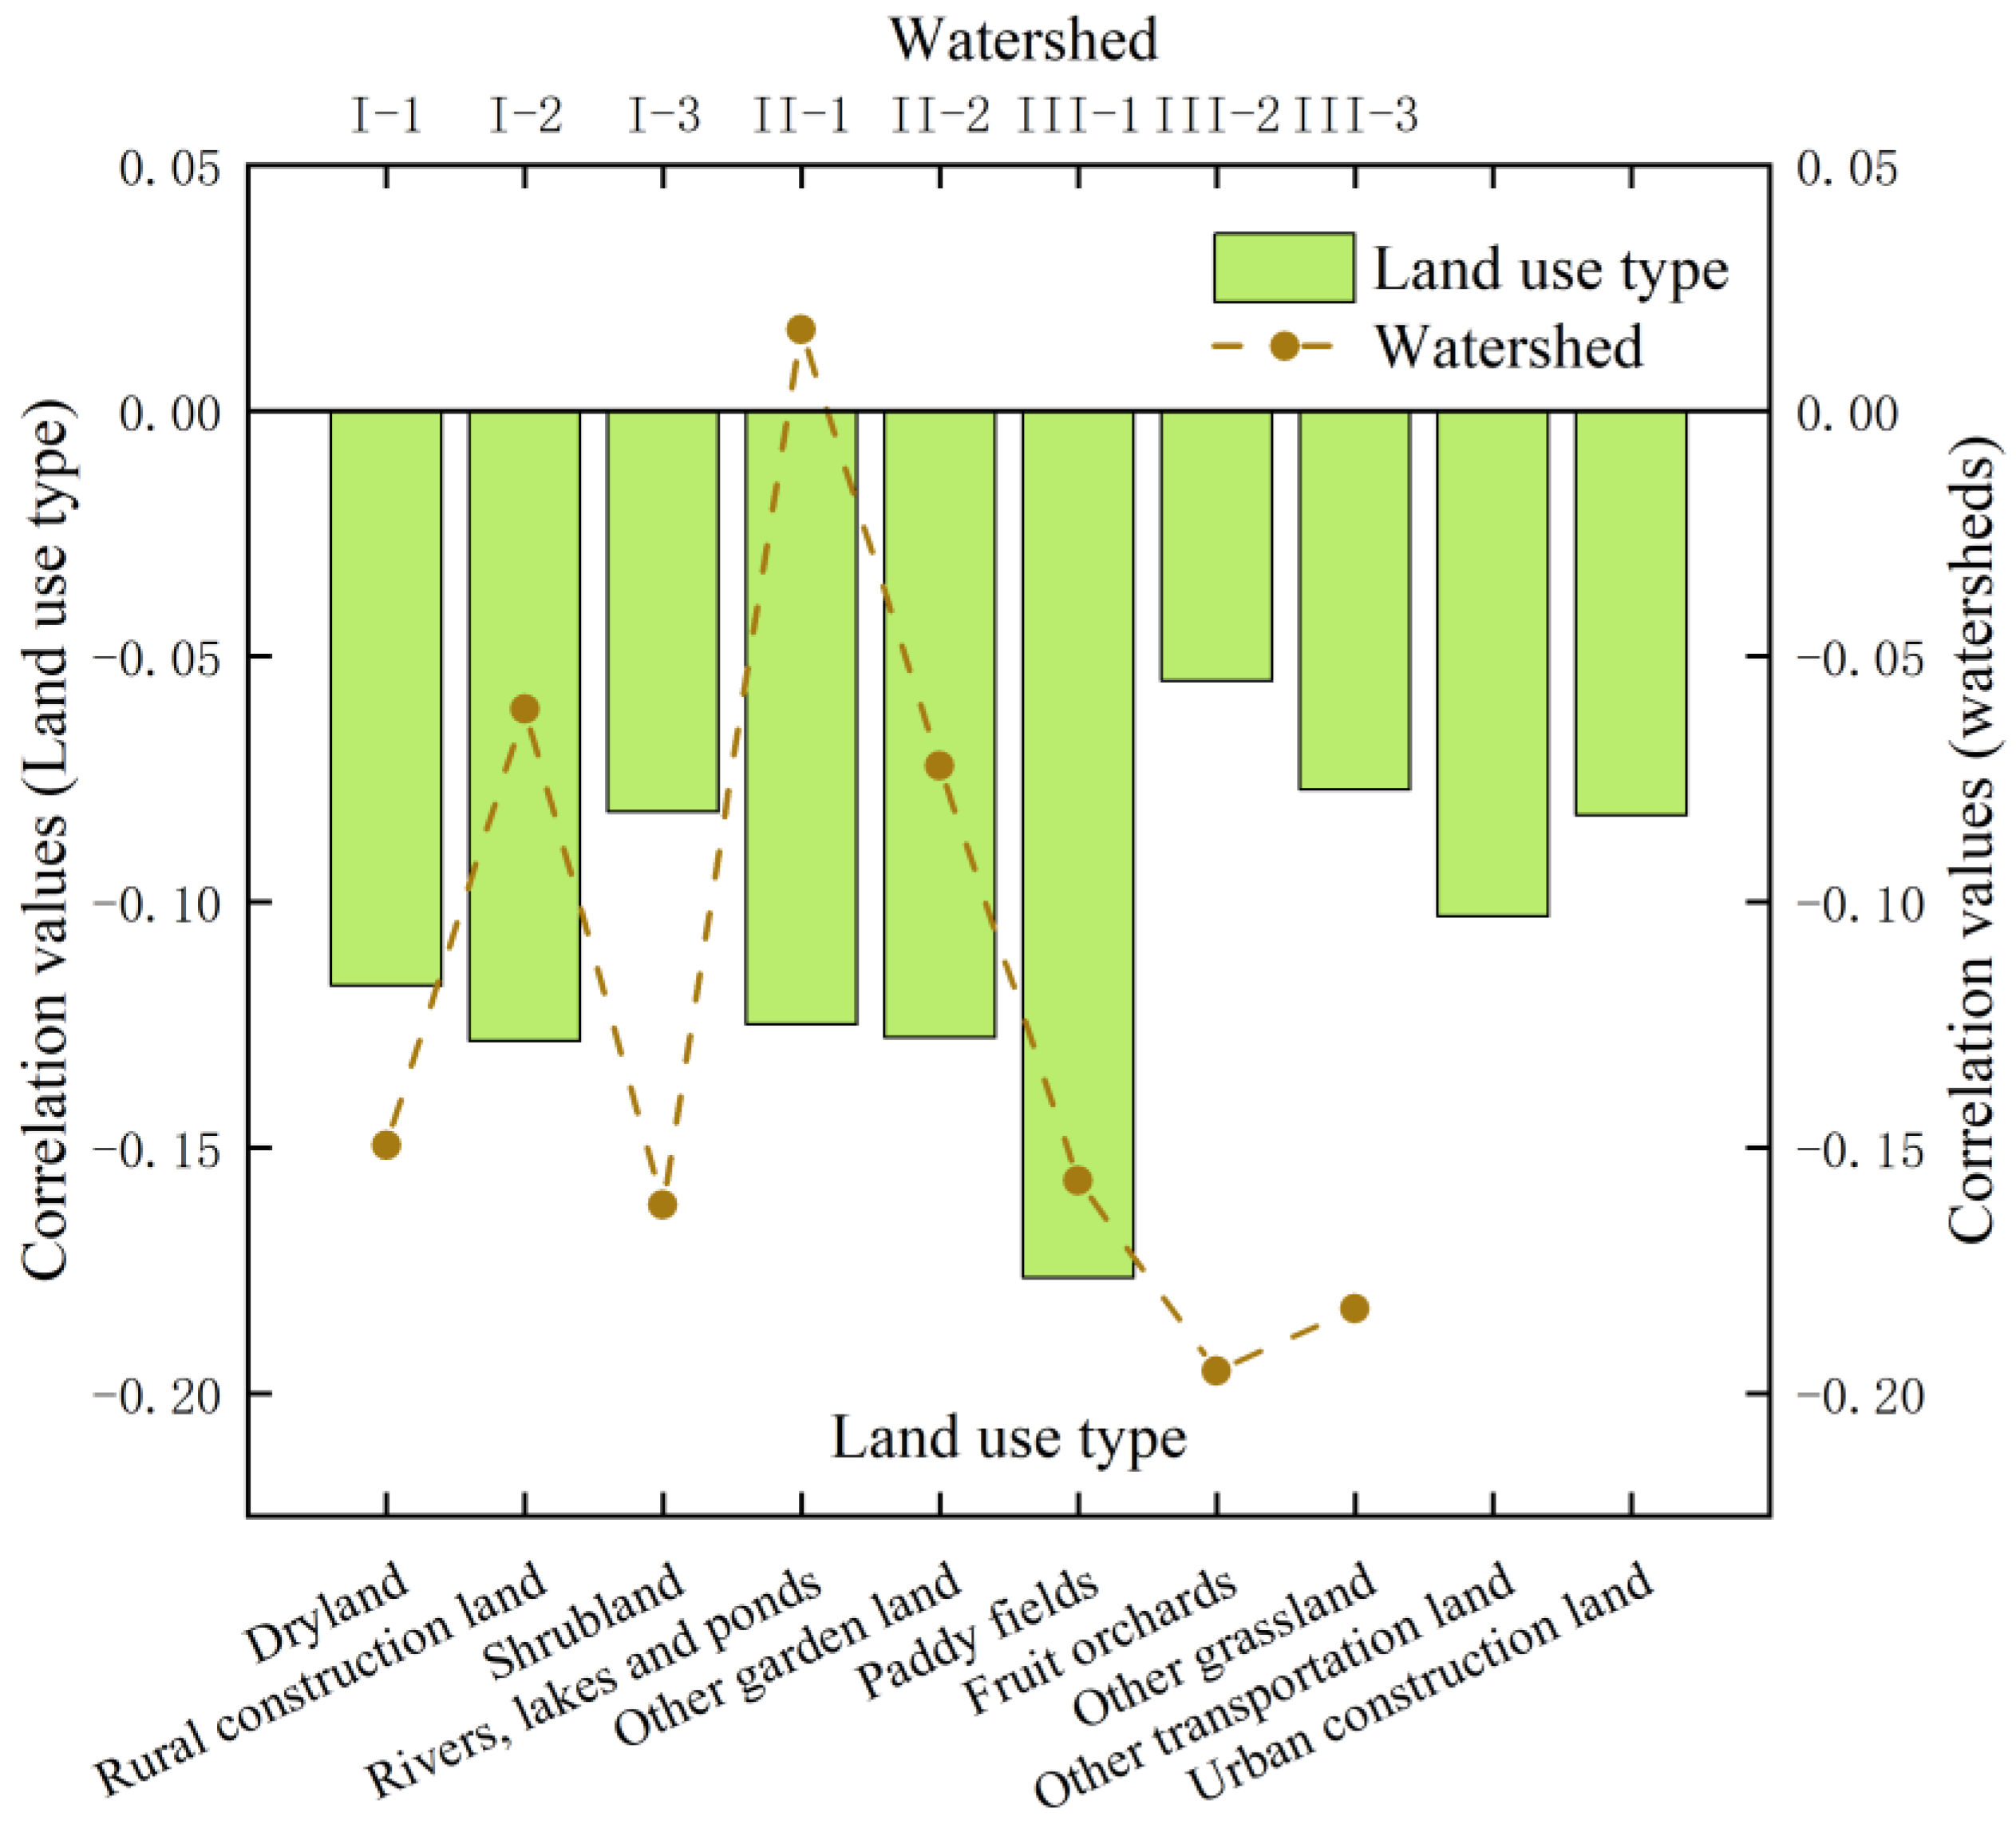
4.3. Analysis of the Influence of Human Activities on Soil Water Erosion
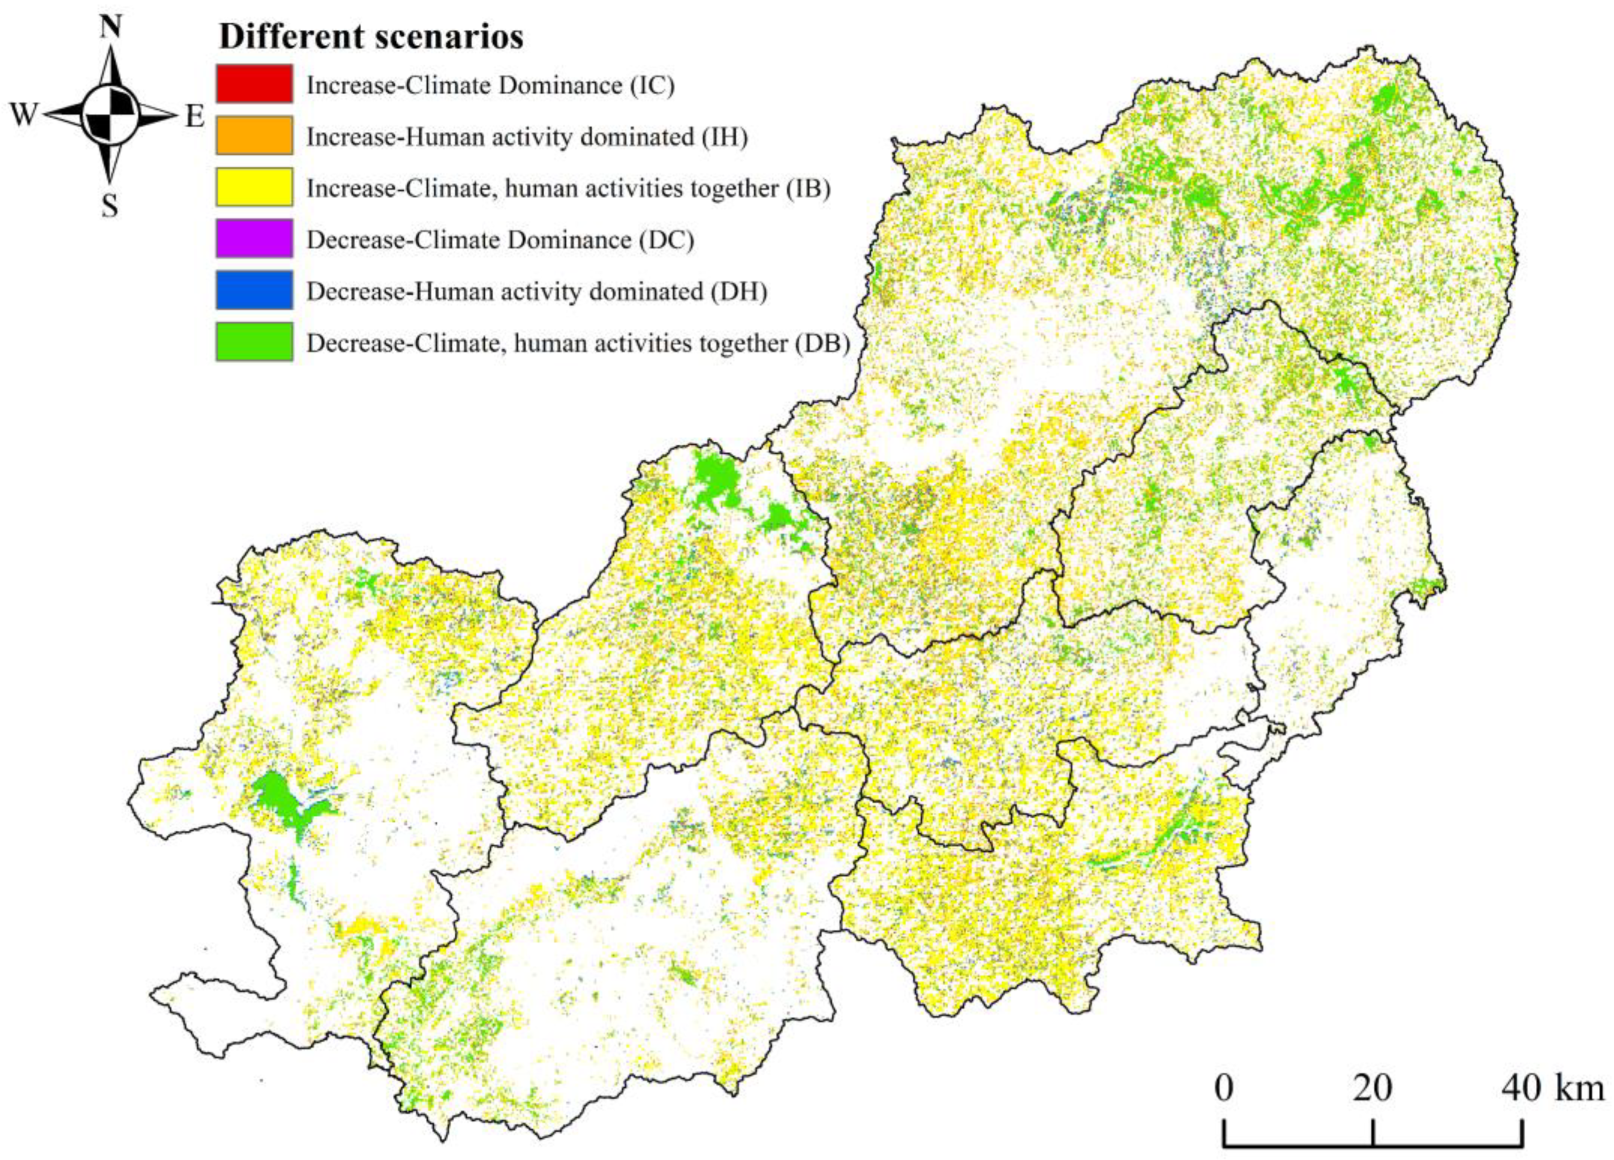
4.4. Spatial Attribution Analysis of Soil Erosion Driving Mechanisms
5. Discussion
5.1. Divergence of Soil Erosion Driving Mechanisms in Different Climatic Zones
5.2. Analysis of the Causes of Soil Erosion Changes under the Action of Each Dominant Factor
5.3. Causes and Countermeasures of Watersheds with Dense Spatial Distribution
6. Conclusions
Author Contributions
Funding
Data Availability Statement
Conflicts of Interest
References
- Amundson, R.; Berhe, A.A.; Hopmans, J.W.; Olson, C.; Sztein, A.E.; Sparks, D.L. Soil and human security in the 21st century. Science 2015, 348, 1261071. [Google Scholar] [CrossRef] [PubMed]
- Robinson, D.A.; Panagos, P.; Borrelli, P.; Jones, A.; Montanarella, L.; Tye, A.; Obst, C.G. Soil natural capital in europe; a framework for state and change assessment. Sci. Rep. 2017, 7, 6706. [Google Scholar] [CrossRef]
- Lamane, H.; Moussadek, R.; Baghdad, B.; Mouhir, L.; Briak, H.; Laghlimi, M.; Zouahri, A. Soil water erosion assessment in Morocco through modeling and fingerprinting applications: A review. Heliyon 2022, 8, e10209. [Google Scholar] [CrossRef]
- Rao, W.; Shen, Z.; Duan, X. Spatiotemporal patterns and drivers of soil erosion in Yunnan Southwest China: RULSE assessments for recent 30 years and future predictions based on CMIP6. Catena 2023, 220, 106703. [Google Scholar] [CrossRef]
- Peng, Q.; Wang, R.; Jiang, Y.; Zhang, W.; Liu, C.; Zhou, L. Soil erosion in Qilian Mountain National Park: Dynamics and driving mechanisms. J. Hydrol. Reg. Stud. 2022, 42, 101144. [Google Scholar] [CrossRef]
- Ayele, G.K.; Gessess, A.A.; Addisie, M.B.; Tilahun, S.A.; Tebebu, T.Y.; Tenessa, D.B.; Langendoen, E.J.; Nicholson, C.F.; Steenhuis, T.S. A Biophysical and Economic Assessment of a Community-based Rehabilitated Gully in the Ethiopian Highlands. Land. Degrad. Dev. 2016, 27, 270–280. [Google Scholar] [CrossRef]
- Li, N.; Zhang, Y.; Wang, T.; Li, J.; Yang, J.; Luo, M. Have anthropogenic factors mitigated or intensified soil erosion over the past three decades in South China? J. Environ. Manag. 2022, 302, 114093. [Google Scholar] [CrossRef] [PubMed]
- Zhang, J.; Wang, N.; Wang, Y.; Wang, L.; Hu, A.; Zhang, D.; Su, X.; Chen, J. Responses of soil erosion to land-use changes in the largest tableland of the Loess Plateau. Land. Degrad. Dev. 2021, 32, 3598–3613. [Google Scholar] [CrossRef]
- Kinnell, P.I.A. Geographic Variation of USLE/RUSLE Erosivity and Erodibility Factors. J. Hydrol. Eng. 2015, 20, C4014012. [Google Scholar] [CrossRef]
- Hou, W.; Gao, J.; Wu, S.; Dai, E. Interannual Variations in Growing-Season NDVI and Its Correlation with Climate Variables in the Southwestern Karst Region of China. Remote Sens. 2015, 7, 11105–11124. [Google Scholar] [CrossRef]
- Marcinkowski, P.; Szporak-Wasilewska, S.; Kardel, I. Assessment of soil erosion under long-term projections of climate change in Poland. J. Hydrol. 2022, 607, 127468. [Google Scholar] [CrossRef]
- Lu, D.; Li, G.; Valladares, G.S.; Batistella, M. Mapping soil erosion risk in Rondnia Brazilian Amazonia: Using RUSLE remote sensing and GIS. Land. Degrad. Dev. 2004, 15, 499–512. [Google Scholar] [CrossRef]
- Zhang, X.C.; Liu, W.Z. Simulating potential response of hydrology soil erosion and crop productivity to climate change in Changwu tableland region on the Loess Plateau of China. Agric. For. Meteorol. 2005, 131, 127–142. [Google Scholar] [CrossRef]
- Thomas, J.; Joseph, S.; Thrivikramji, K.P. Assessment of soil erosion in a tropical mountain river basin of the southern Western Ghats India using RUSLE and GIS. Geosci. Front. 2018, 9, 893–906. [Google Scholar] [CrossRef]
- Laflen, J.M.; Lane, L.J.; Foster, G.R. WEPP: A new generation of erosion prediction technology. J. Soil Water Conserv. 1991, 46, 34–38. [Google Scholar]
- Renard, K.G.; Foster, G.R.; Weesies, G.R.; McCool, D.K. Predicting Soil Erosion by Water: A Guide to Conservation Planning with the Revised Universal Soil Loss Equation (RUSLE); USDA Agricultural Research Service: Washington, DC, USA, 1997. [Google Scholar]
- Demirci, A.; Karaburun, A. Estimation of soil erosion using RUSLE in a GIS framework: A case study in the Buyukcekmece Lake watershed northwest Turkey. Environ. Earth Sci. 2011, 66, 903–913. [Google Scholar] [CrossRef]
- Karamesouti, M.; Petropoulos, G.P.; Papanikolaou, I.D.; Kairis, O.; Kosmas, K. Erosion rate predictions from PESERA and RUSLE at a Mediterranean site before and after a wildfire: Comparison & implications. Geoderma 2016, 261, 44–58. [Google Scholar] [CrossRef]
- Liu, B.Y.; Nearing, M.A.; Risse, L.M. Slope Gradient Effects on Soil Loss for Steep Slopes. Trans. ASAE 1994, 37, 1835–1840. [Google Scholar] [CrossRef]
- Wang, B.W.; Yang, Q.K.; Liu, Z.H. Extraction of RUSLE-LS factors using DEM data and GIS techniques. Sci. Soil Water Conserv. 2007, 2, 18–23. (In Chinese) [Google Scholar] [CrossRef]
- Liu, B.; Zhang, K.; Yun, X. An Empirical Soil Loss Equation. In Proceedings of the 12th International Soil Conservation Organization Conference, Beijing, China, 26–31 May 2002. [Google Scholar]
- Fu, S.; Cao, L.; Liu, B.; Wu, Z.; Savabi, M.R. Effects of DEM grid size on predicting soil loss from small watersheds in China. Environ. Earth Sci. 2014, 73, 2141–2151. [Google Scholar] [CrossRef]
- Shi, W.; Huang, M.; Barbour, S.L. Storm-based CSLE that incorporates the estimated runoff for soil loss prediction on the Chinese Loess Plateau. Soil. Tillage Res. 2018, 180, 137–147. [Google Scholar] [CrossRef]
- Panda, K.C.; Singh, R.M.; Singh, V.K.; Singla, S.; Paramaguru, P.K. Impact of climate change induced future rainfall variation on dynamics of arid-humid zone transition in the western province of India. J. Environ. Manag. 2023, 325, 116646. [Google Scholar] [CrossRef]
- Ashraf, M.; Ullah, K.; Adnan, S. Satellite based impact assessment of temperature and rainfall variability on drought indices in Southern Pakistan. Int. J. Appl. Earth Obs. Geoinf. 2022, 108, 102726. [Google Scholar] [CrossRef]
- Aragão, J.R.V.; Zuidema, P.A.; Groenendijk, P. Climate-growth relations of congeneric tree species vary across a tropical vegetation gradient in Brazil. Dendrochronologia 2022, 71, 125913. [Google Scholar] [CrossRef]
- Lee, X.; Goulden, M.L.; Hollinger, D.Y.; Barr, A.; Black, T.A.; Bohrer, G.; Bracho, R.; Drake, B.; Goldstein, A.; Gu, L.; et al. Observed increase in local cooling effect of deforestation at higher latitudes. Nature 2011, 479, 384–387. [Google Scholar] [CrossRef] [PubMed]
- Waide, R.B. Tropical Rainforest. In Encyclopedia of Ecology (Second Edition); Fath, B., Ed.; Elsevier: Oxford, UK, 2008; pp. 679–683. [Google Scholar]
- Erinjery, J.J.; Singh, M.; Kent, R. Mapping and assessment of vegetation types in the tropical rainforests of the Western Ghats using multispectral Sentinel-2 and SAR Sentinel-1 satellite imagery. Remote Sens. Environ. 2018, 216, 345–354. [Google Scholar] [CrossRef]
- Sen Chakraborty, K.; Chakraborty, A.; Berrens, R.P. Valuing soil erosion control investments in Nigerian agricultural lands: A hedonic pricing model. World Dev. 2023, 170, 106313. [Google Scholar] [CrossRef]
- Tian, P.; Tian, X.; Geng, R.; Zhao, G.; Yang, L.; Mu, X.; Gao, P.; Sun, W.; Liu, Y. Response of soil erosion to vegetation restoration and terracing on the Loess Plateau. Catena 2023, 227, 107103. [Google Scholar] [CrossRef]
- Wang, H.; Gao, J.; Hou, W. Quantitative attribution analysis of soil erosion in different geomorphological types in karst areas: Based on the geodetector method. J. Geogr. Sci. 2019, 29, 271–286. [Google Scholar] [CrossRef]
- Wang, K.; Zhou, J.; Tan, M.; Lu, P.; Xue, Z.; Liu, M.; Wang, X. Impacts of vegetation restoration on soil erosion in the Yellow River Basin, China. Catena 2024, 234, 107547. [Google Scholar] [CrossRef]
- Zhao, Y.; Liu, L.; Kang, S.; Ao, Y.; Han, L.; Ma, C. Quantitative analysis of factors influencing spatial distribution of soil erosion based on geo-detector model under diverse geomorphological types. Land 2021, 10, 604. [Google Scholar] [CrossRef]
- Rosas, M.A.; Gutierrez, R.R. Assessing soil erosion risk at national scale in developing countries: The technical challenges a proposed methodology and a case history. Sci. Total Environ. 2020, 703, 135474. [Google Scholar] [CrossRef]
- Labrière, N.; Locatelli, B.; Laumonier, Y.; Freycon, V.; Bernoux, M. Soil erosion in the humid tropics: A systematic quantitative review. Agric. Ecosyst. Environ. 2015, 203, 127–139. [Google Scholar] [CrossRef]
- Han, X.; Zhiyun, O.; Jingzhu, Z.; Xiaoke, W.; Yishi, H. The spatial distribution characteristics and eco-economic value of soil conservation service of ecosystems in Hainan Island by GIS. Acta Ecol. Sin. 2000, 20, 552–558. [Google Scholar]
- Sun, R.; Wu, Z.; Chen, B.; Yang, C.; Qi, D.; Lan, G.; Fraedrich, K. Effects of land-use change on eco-environmental quality in Hainan Island China. Ecol. Indic. 2020, 109, 105777. [Google Scholar] [CrossRef]
- Wu, W.; Zhang, J.; Sun, Z.; Yu, J.; Liu, W.; Yu, R.; Wang, P. Attribution analysis of land degradation in Hainan Island based on geographical detector. Ecol. Indic. 2022, 141, 109119. [Google Scholar] [CrossRef]
- Li, T.; Hong, X.; Liu, S.; Wu, X.; Fu, S.; Liang, Y.; Li, J.; Li, R.; Zhang, C.; Song, X.; et al. Cropland degradation and nutrient overload on Hainan Island: A review and synthesis. Environ. Pollut. 2022, 313, 120100. [Google Scholar] [CrossRef] [PubMed]
- Liang, Y.; Li, D.; Lu, X.; Yang, X.; Pan, X.; Mu, H.; Shi, D.; Zhang, B. Soil erosion changes over the past five decades in the red soil region of southern China. J. Mt. Sci. 2010, 7, 92–99. [Google Scholar] [CrossRef]
- Ren, B.; Wang, Q.; Zhang, R.; Zhou, X.; Wu, X.; Zhang, Q. Assessment of ecosystem services: Spatio-temporal analysis and the spatial response of influencing factors in Hainan Province. Sustainability 2022, 14, 9145. [Google Scholar] [CrossRef]
- Ye, C.; Zou, Y.; He, Y.; Lin, Y.; Li, D.; Zhu, L. Temporal and spatial distribution characteristics of drought and flood considering the influence of underlying surface in Hainan Island tropical areas of China. Theor. Appl. Climol. 2022, 150, 507–520. [Google Scholar] [CrossRef]
- Jiang, L.; Guli, J.; Bao, A.; Guo, H.; Ndayisaba, F. Vegetation dynamics and responses to climate change and human activities in Central Asia. Sci. Total Environ. 2017, 599, 967–980. [Google Scholar] [CrossRef]
- Allen, R.G.; Pereira, L.S.; Raes, D.; Smith, M.J.F. Crop Evapotranspiration-Guidelines for Computing Crop Water Requirements-FAO Irrigation and Drainage Paper 56. FAO: Rome, Italy, 1998; Volume 300, p. D05109. [Google Scholar]
- Hunasigi, P.; Jedhe, S.; Mane, M.; Patil-Shinde, V. Multilayer perceptron neural network based models for prediction of the rainfall and reference crop evapotranspiration for sub-humid climate of Dapoli Ratnagiri District India. Acta Ecol. Sin. 2022, 43, 154–201. [Google Scholar] [CrossRef]
- Vásquez, C.; Célleri, R.; Córdova, M.; Carrillo-Rojas, G. Improving reference evapotranspiration (ET0) calculation under limited data conditions in the high Tropical Andes. Agric. Water Manag. 2022, 262, 107439. [Google Scholar] [CrossRef]
- Wu, S.; Yin, Y.; Du, Z.; Qinye, Y. A study on the dry and wet conditions of the Chinese land surface in the last 30 years. China Sci. Earth Sci. 2005, 35, 276–283. (In Chinese) [Google Scholar]
- Liu, B.; Pan, L.; Qi, Y.; Guan, X.; Li, J. Land use and land cover change in the Yellow River Basin from 1980 to 2015 and its impact on the ecosystem services. Land 2021, 10, 1080. [Google Scholar] [CrossRef]
- Wang, H. The Spatiotemporal Variations and Drivers Analysis of Soil Erosion in the Northern North China’s Region. Ph.D. Thesis, Beijing Forestry University, Beijing, China, 2020. [Google Scholar]
- Zhang, H.; Zhang, R.; Qi, F.; Liu, X.; Niu, Y.; Fan, Z.; Zhang, Q.; Li, J.; Yuan, L.; Song, Y.; et al. The CSLE model based soil erosion prediction: Comparisons of sampling density and extrapolation method at the county level. Catena 2018, 165, 465–472. [Google Scholar] [CrossRef]
- Jin, F.; Yang, W.; Fu, J.; Li, Z. Effects of vegetation and climate on the changes of soil erosion in the Loess Plateau of China. Sci. Total Environ. 2021, 773, 145514. [Google Scholar] [CrossRef]
- Guo, X.; Shao, Q. Spatial pattern of soil erosion drivers and the contribution rate of human activities on the Loess Plateau from 2000 to 2015: A boundary line from northeast to southwest. Remote Sens. 2019, 11, 2429. [Google Scholar] [CrossRef]
- Li, H.; Guan, Q.; Sun, Y.; Wang, Q.; Liang, L.; Ma, Y.; Du, Q. Spatiotemporal analysis of the quantitative attribution of soil water erosion in the upper reaches of the Yellow River Basin based on the RUSLE-TLSD model. Catena 2022, 212, 106081. [Google Scholar] [CrossRef]
- Li, P.; Chen, J.; Zhao, G.; Holden, J.; Liu, B.; Chan, F.K.S.; Hu, J.; Wu, P.; Mu, X. Determining the drivers and rates of soil erosion on the Loess Plateau since 1901. Sci. Total Environ. 2022, 823, 153674. [Google Scholar] [CrossRef] [PubMed]
- Leh, M.; Bajwa, S.; Chaubey, I. Impact of land use change on erosion risk: An integrated remote sensing, geographic information system and modeling methodology. Land. Degrad. Dev. 2013, 24, 409–421. [Google Scholar] [CrossRef]
- Xin, Z.; Ran, L.; Lu, X. Soil erosion control and sediment load reduction in the Loess Plateau: Policy perspectives. Int. J. Water Resour. D 2012, 28, 325–341. [Google Scholar] [CrossRef]
- Liao, J.; Zhou, Y. Integration of Resources and Environment in Western Hainan. Resour. Dev. Mark. 2012, 28, 151–154. (In Chinese) [Google Scholar]


| SA > 0 | SP | SR | SA < 0 | SP | SR | The Role of Climate and Human Activities |
|---|---|---|---|---|---|---|
| IC | >0 | <0 | DC | <0 | >0 | Climate Dominance |
| IH | <0 | >0 | DH | >0 | <0 | Human activity dominated |
| IB | >0 | >0 | DB | <0 | <0 | Climate and human activities together |
| 1990/2020 | Grassland | Cropland | Construction Land | Woodland | Bare Land | Water Area | Sum |
|---|---|---|---|---|---|---|---|
| Grassland | 0.28 | 19.44 | 1.62 | 75.60 | 0.01 | 3.05 | 4.79 |
| Cropland | 0.51 | 70.60 | 6.31 | 16.37 | 0.03 | 6.17 | 18.60 |
| Construction Land | 1.67 | 35.86 | 40.90 | 17.05 | 0.06 | 4.46 | 1.02 |
| Woodland | 0.25 | 35.36 | 1.87 | 60.64 | 0.01 | 1.87 | 73.08 |
| Bare land | 0.81 | 24.93 | 1.49 | 9.32 | 0.00 | 63.46 | 0.33 |
| Water area | 0.33 | 16.70 | 1.02 | 9.14 | 0.02 | 72.79 | 2.19 |
| Sum | 0.32 | 40.72 | 3.06 | 51.38 | 0.02 | 4.51 | 100.00 |
| Unchanged Area | Area Percentage | Type of Change | Area Percentage |
|---|---|---|---|
| Cropland | 8.91 | Cropland–Woodland | 41.25 |
| Woodland | 90.67 | Grassland–Woodland | 21.60 |
| Water area | 0.04 | Woodland–Water area | 12.80 |
| Construction Land | 0.36 | Grassland–Cropland | 9.06 |
| Grassland | 0.02 | Cropland–Construction land | 6.64 |
| Watersheds/Scenarios | IC | IH | IB | DC | DH | DB |
|---|---|---|---|---|---|---|
| I-1 | 22.70 | 56.13 | 25.26 | 52.82 | 21.47 | 46.63 |
| I-2 | 17.99 | 7.33 | 15.18 | 6.59 | 12.75 | 11.79 |
| I-3 | 6.50 | 14.27 | 5.20 | 9.27 | 2.03 | 10.82 |
| II-1 | 8.32 | 4.59 | 12.91 | 10.23 | 17.70 | 10.06 |
| II-2 | 9.50 | 7.01 | 9.49 | 6.07 | 9.88 | 9.05 |
| III-1 | 1.74 | 2.67 | 1.57 | 2.94 | 3.21 | 2.56 |
| III-2 | 14.61 | 6.13 | 12.25 | 6.35 | 15.61 | 4.34 |
| III-3 | 18.64 | 1.88 | 18.15 | 5.72 | 17.34 | 4.74 |
Disclaimer/Publisher’s Note: The statements, opinions and data contained in all publications are solely those of the individual author(s) and contributor(s) and not of MDPI and/or the editor(s). MDPI and/or the editor(s) disclaim responsibility for any injury to people or property resulting from any ideas, methods, instructions or products referred to in the content. |
© 2024 by the authors. Licensee MDPI, Basel, Switzerland. This article is an open access article distributed under the terms and conditions of the Creative Commons Attribution (CC BY) license (https://creativecommons.org/licenses/by/4.0/).
Share and Cite
Zou, Y.; Wang, Y.; He, Y.; Zhu, L.; Xue, S.; Liang, X.; Ye, C. Soil Erosion Characteristics in Tropical Island Watersheds Based on CSLE Model: Discussion of Driving Mechanisms. Land 2024, 13, 302. https://doi.org/10.3390/land13030302
Zou Y, Wang Y, He Y, Zhu L, Xue S, Liang X, Ye C. Soil Erosion Characteristics in Tropical Island Watersheds Based on CSLE Model: Discussion of Driving Mechanisms. Land. 2024; 13(3):302. https://doi.org/10.3390/land13030302
Chicago/Turabian StyleZou, Yi, Yimei Wang, Yanhu He, Lirong Zhu, Shiyu Xue, Xu Liang, and Changqing Ye. 2024. "Soil Erosion Characteristics in Tropical Island Watersheds Based on CSLE Model: Discussion of Driving Mechanisms" Land 13, no. 3: 302. https://doi.org/10.3390/land13030302
APA StyleZou, Y., Wang, Y., He, Y., Zhu, L., Xue, S., Liang, X., & Ye, C. (2024). Soil Erosion Characteristics in Tropical Island Watersheds Based on CSLE Model: Discussion of Driving Mechanisms. Land, 13(3), 302. https://doi.org/10.3390/land13030302