
Exploring the Built Environment Factors Influencing Town Image Using Social Media Data and Deep Learning Methods


Abstract
1. Introduction
2. Literature Review
2.1. Town Image
2.2. Image and BE
3. Data and Methods
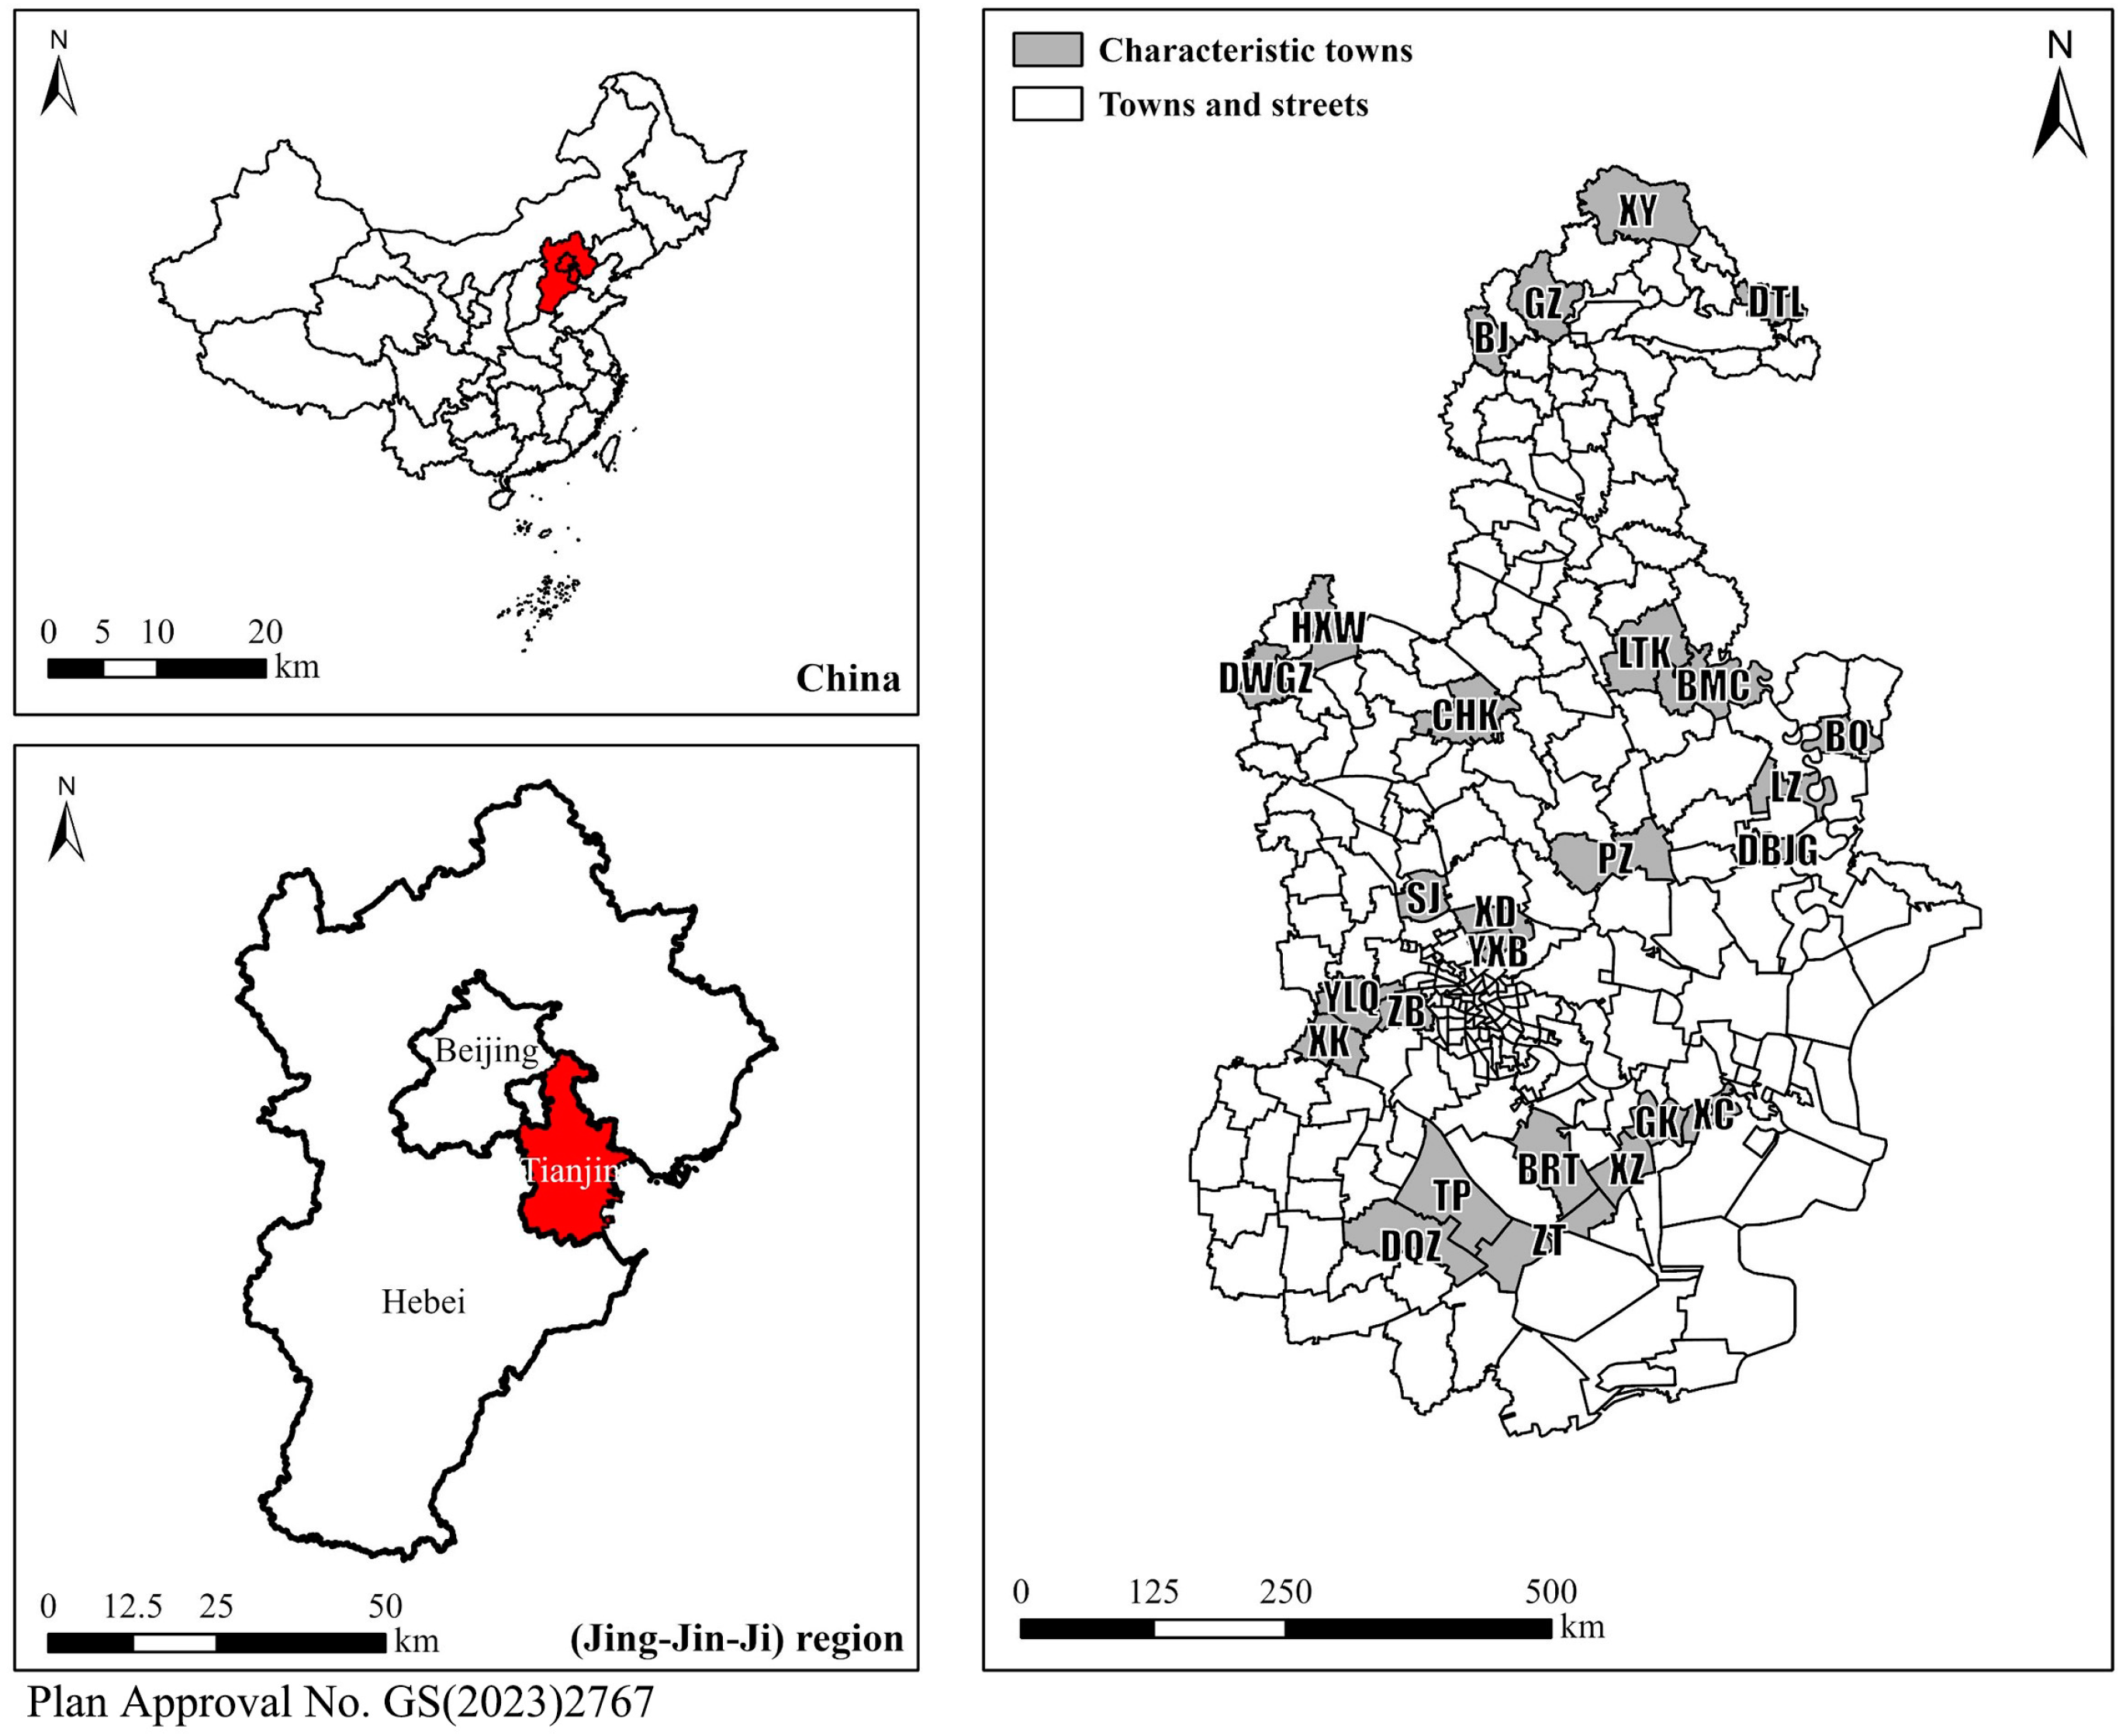
3.1. Research Area
3.2. Methods
3.2.1. Research Process
3.2.2. Research Model
3.3. Data
3.4. Measurement
3.4.1. Image
3.4.2. BE
3.4.3. Text Emotions
3.5. Variable Summary
4. Results
4.1. Baseline Results
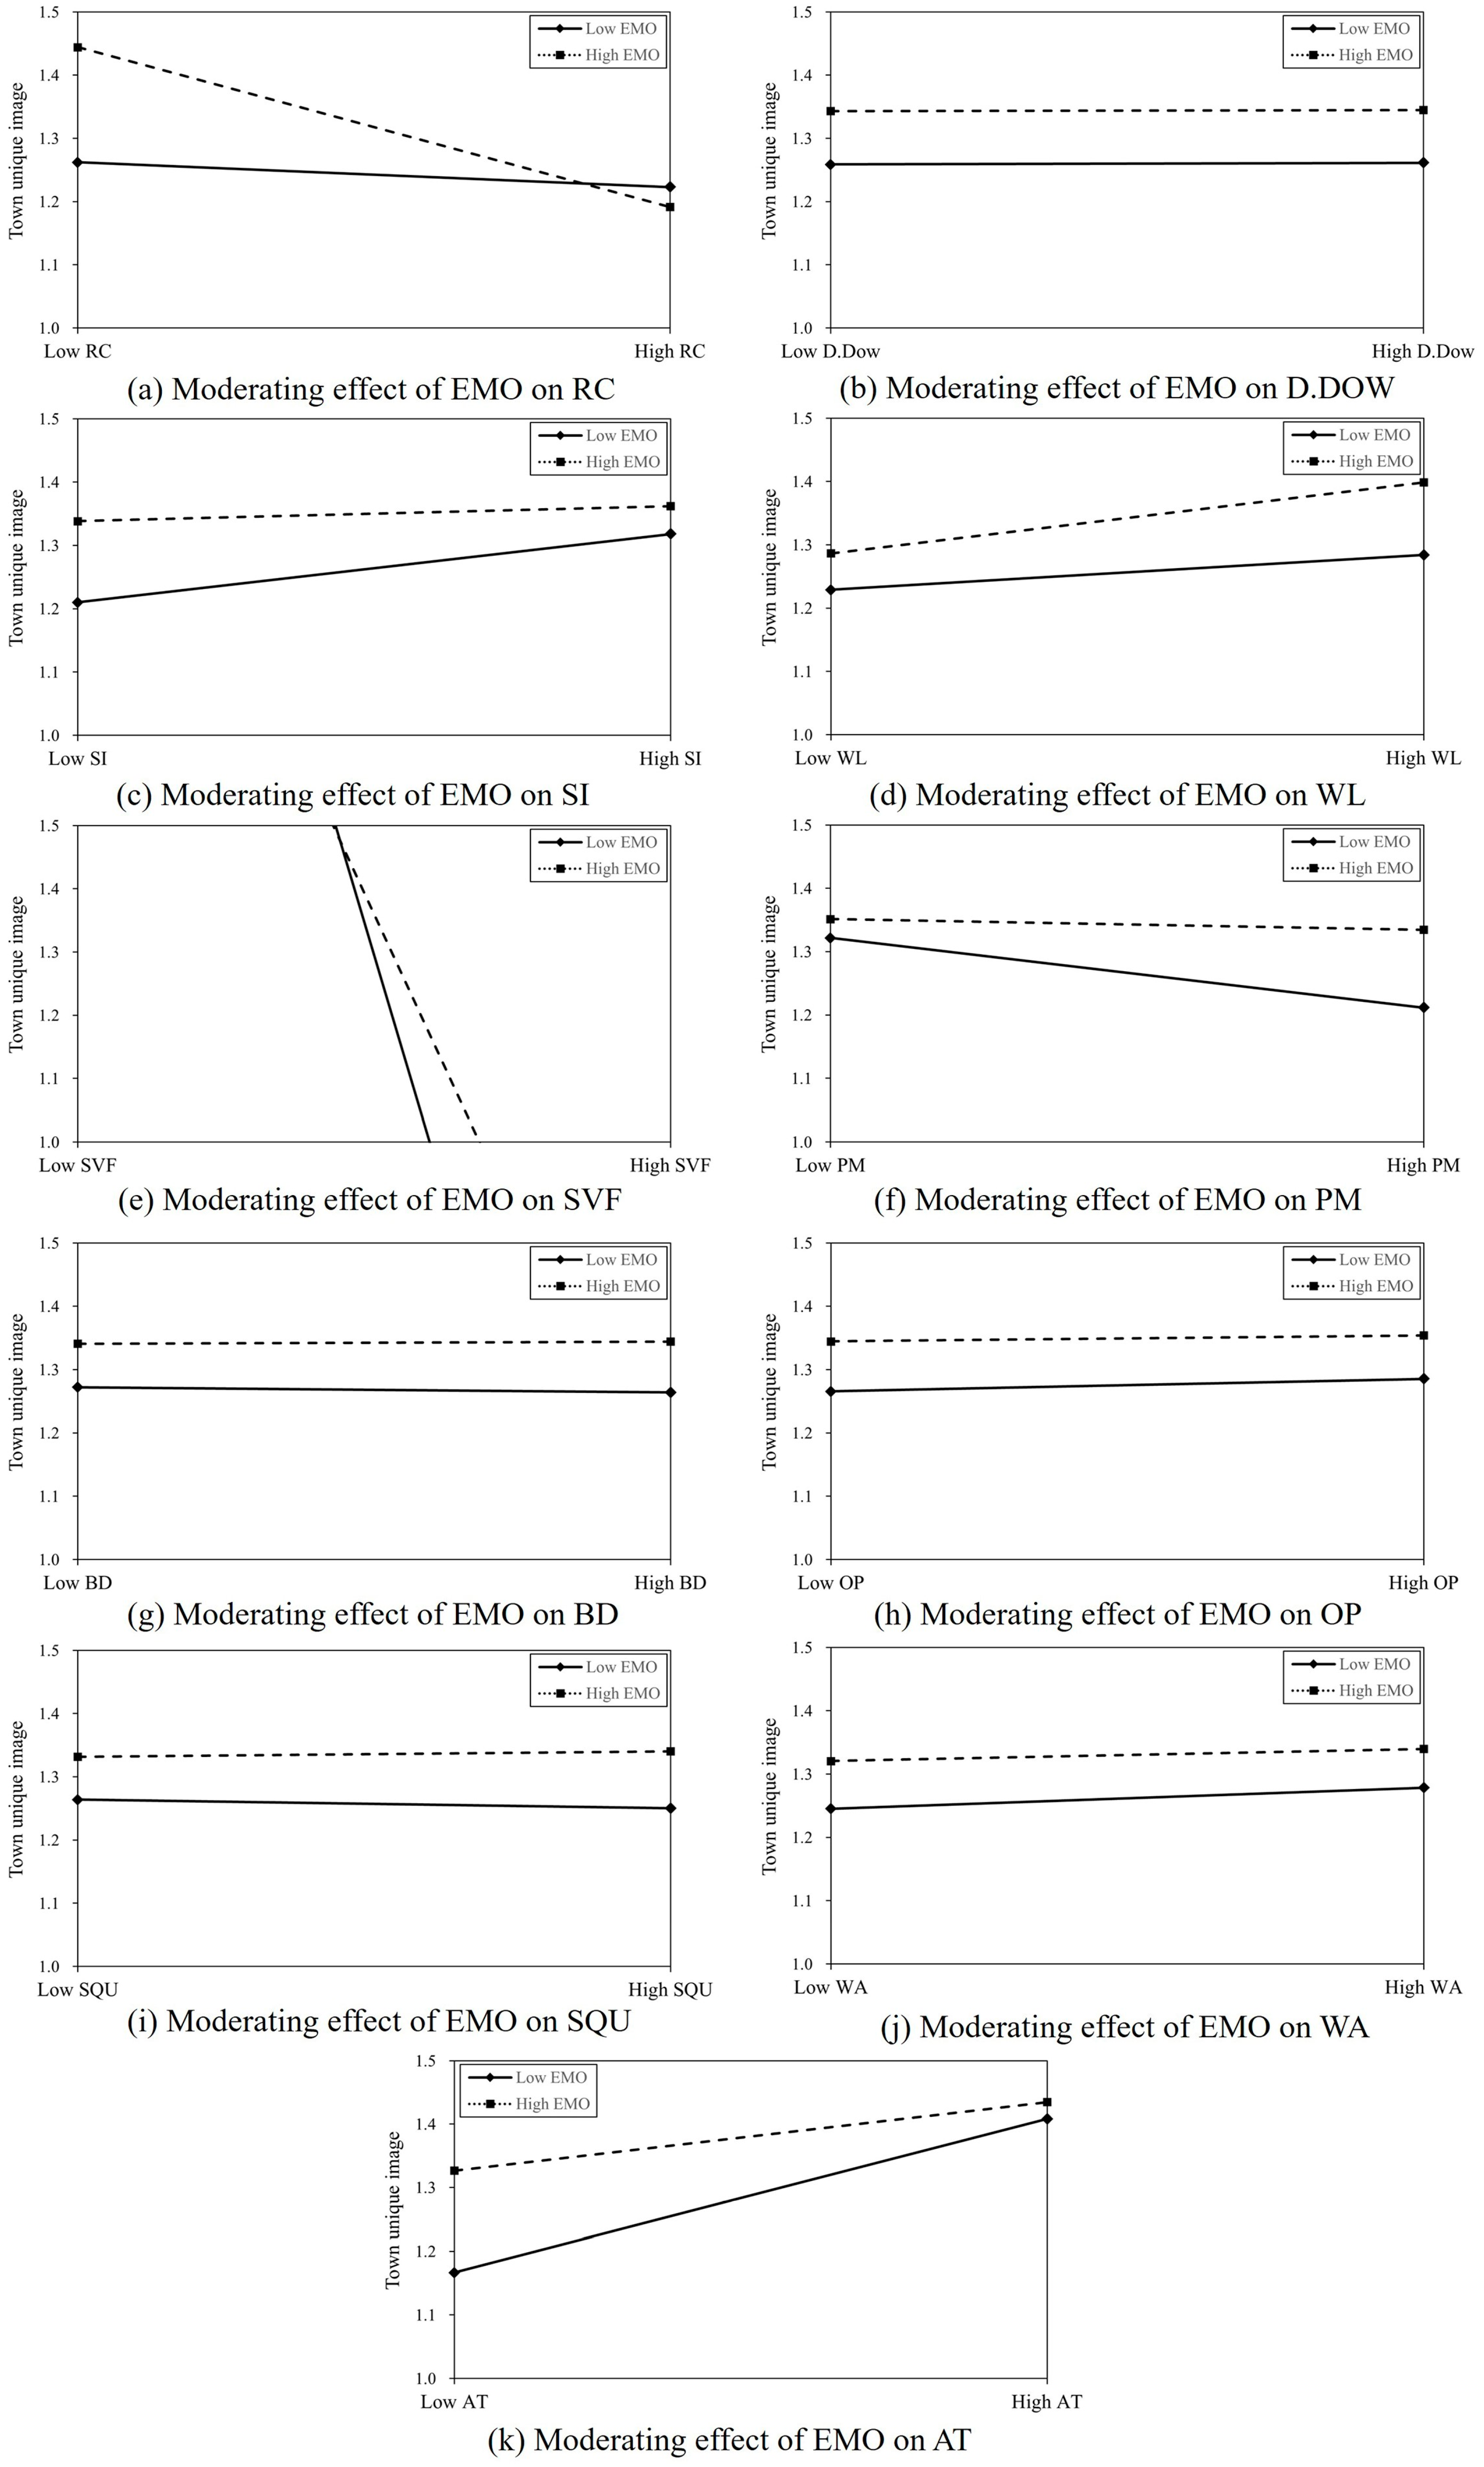
4.2. Moderating Effects
5. Discussion
6. Conclusions and Limitations
- (1)
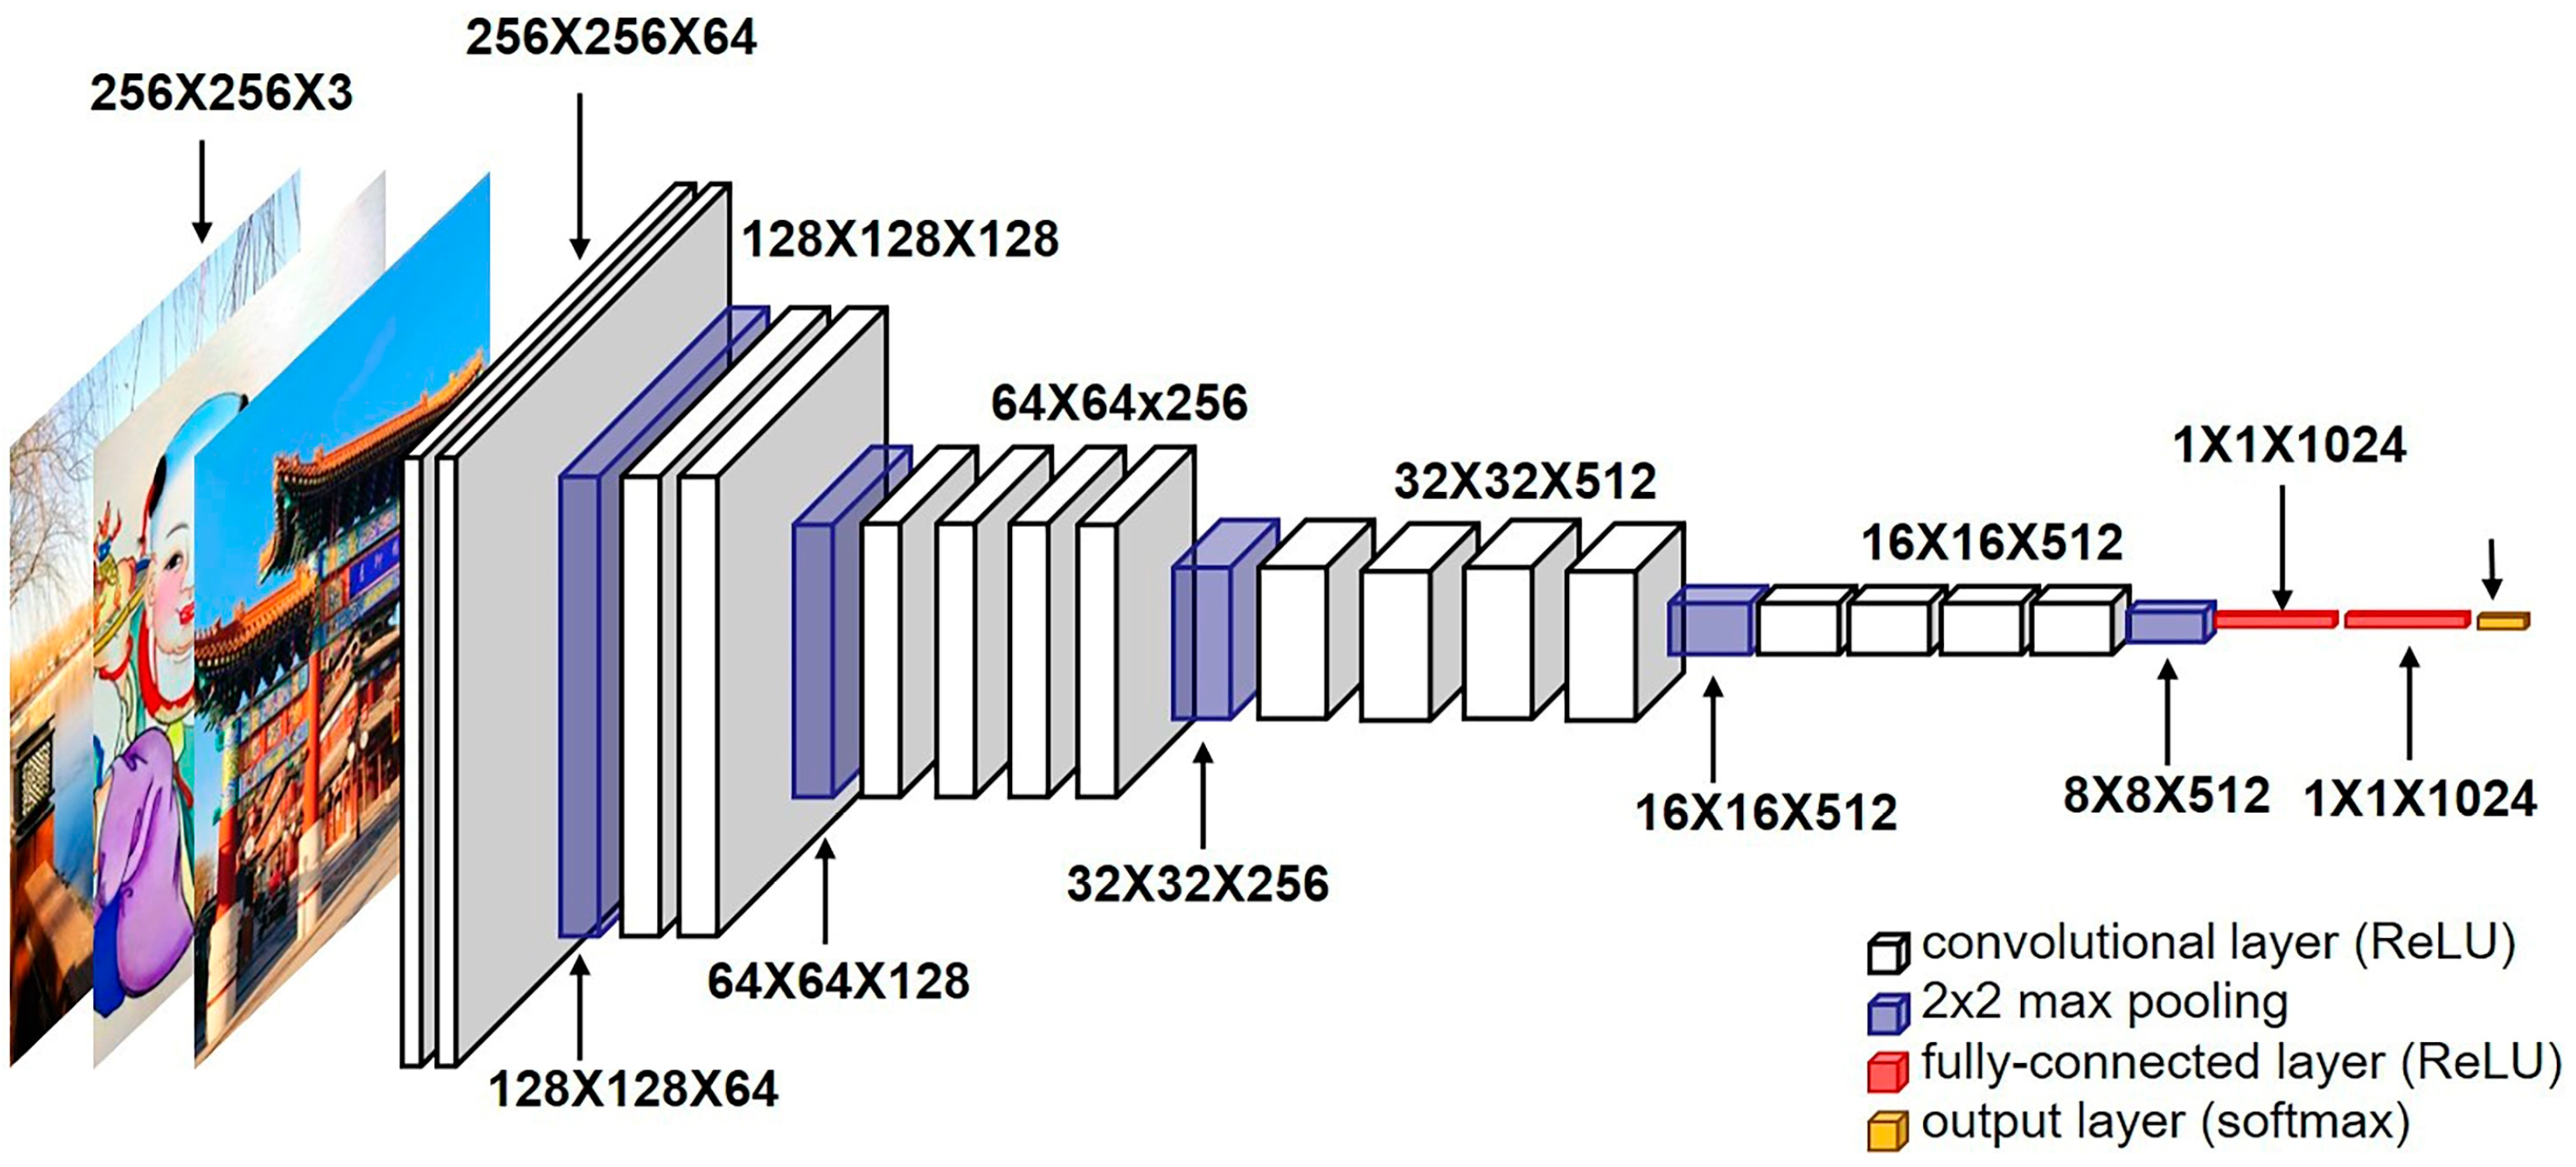
- The acquisition of multi-source big data and the method of deep learning, so that the image can be accurately quantified. As Lynch puts it, “If enough probe arrays are used, a comprehensive picture is not far from the truth” [68].
- (2)
- The exploration of the influence of the BE on the UI at the town scale.
- (3)
- The reveal of how positive emotion regulates the relationship between different BE variables and the UI.
Author Contributions
Funding
Data Availability Statement
Conflicts of Interest
Appendix A

| Domains | Variable | Mean | Std. | Min | Max | Definition |
|---|---|---|---|---|---|---|
| Dependent variable | Uniqueness image (UI) | 1.263 | 0.126 | 1.016 | 1.628 | The degree of dispersion of the town uniqueness image |
| Explanatory variables | ||||||
| Path (P) | Road connectivity (RC) | 2.162 | 0.270 | 1.625 | 2.800 | Strength of interconnection between nodes by roads |
| Road network (RN) | 3.150 | 0.583 | 2.400 | 4.580 | The ratio of the length of the road to the area of the town | |
| Time to downtown (T.Dow) | 103.500 | 35.881 | 55.000 | 196.000 | Actual time to downtown center (minute) | |
| Distance to downtown (D.Dow) | 65.607 | 42.721 | 20.422 | 186.730 | Driving distance to the downtown center (km) | |
| Sidewalk (SI) | 1.314 | 0.498 | 0.509 | 2.570 | The ratio of the length of the sidewalk to the area of the town (/km) | |
| Edge (E) | Water length (WL) | 1.152 | 0.880 | 0.047 | 3.963 | The ratio of the length of the river system to the area of the town (%) |
| Sky view factor (SVF) | 0.955 | 0.034 | 0.854 | 0.989 | Proportion of the sky visible from the street valley | |
| Street length (SL) | 338.033 | 115.435 | 169.768 | 673.772 | Average length of street (m) | |
| Street width to height ratio (S.RA) | 1.540 | 0.454 | 0.711 | 2.607 | The ratio of street width to building height along the street | |
| District (D) | POI Mix (PM) | 1.266 | 0.436 | 0.340 | 1.883 | Mean entropy of town POI categories |
| Commercial (COM) | 13.279 | 14.973 | 1.255 | 63.934 | The density of commercial facilities (/km2) | |
| Leisure (LEI) | 0.625 | 1.211 | 0.000 | 4.919 | The ratio of the number of transportation facilities to the area of the town (/km2) | |
| Transportation (TR) | 0.785 | 0.584 | 0.129 | 2.480 | The ratio of the number of commercial facilities to the area of the town (/km2) | |
| Building density (BD) | 3.726 | 2.894 | 0.315 | 10.952 | The ratio of the base area of the building to the area of the town (%) | |
| Floor-area ratio (FAR) | 0.203 | 0.169 | 0.013 | 0.753 | Total areas of building space of all kinds divided by the total areas within a plot (%) | |
| Building height (BH) | 14.495 | 3.771 | 11.677 | 27.613 | Average height of the building (m) | |
| Block area (BA) | 7.577 | 10.114 | 0.849 | 35.665 | The average size of the block (ha) | |
| Reachability (REA) | 48.822 | 20.158 | 13.093 | 117.900 | Average travel time from town to other towns (min) | |
| Node (N) | Open space (OP) | 6.028 | 2.872 | 1.051 | 10.798 | The ratio of the total area of parks and green spaces to the area of the town (%) |
| Square (SQU) | 1.277 | 2.037 | 0.000 | 7.832 | The ratio of the area of the square to the area of the town (%) | |
| Water area (WA) | 4.658 | 1.946 | 0.373 | 6.965 | The ratio of the area of the water system to the area of the town (%) | |
| Landmark (L) | Tourist Attraction (AT) | 0.253 | 0.271 | 0.000 | 0.995 | The ratio of the number of tourist attractions to the area of the town. (/km2) |
| Moderating variables | Positive emotions (EMO) | 69.256 | 3.336 | 64.179 | 82.707 | Confidence probability of positive sentiment of the text (%) |
| Control variables | Industrial enterprises (IE) | 292.846 | 326.982 | 7.000 | 1137.000 | Number of industrial establishments |
| Population density (Pop) | 706.345 | 433.635 | 144.322 | 1836.771 | Number of permanent residents per net area (/km2) |
| Variables | Model 1-1 | Model 1-2 | Model 2-1 | Model 2-2 | Model 3-1 | Model 3-2 | Model 4-1 | Model 4-2 | Model 5-1 | Model 5-2 | Model 6-1 | Model 6-2 | |
|---|---|---|---|---|---|---|---|---|---|---|---|---|---|
| B (S.E.) | B (S.E.) | B (S.E.) | B (S.E.) | B (S.E.) | B (S.E.) | B (S.E.) | B (S.E.) | B (S.E.) | B (S.E.) | B (S.E.) | B (S.E.) | ||
| Explanatory variable | |||||||||||||
| Path | RC | 0.009 (0.055) | −0.014 (0.039) | −0.004 (0.018) | −0.010 (0.021) | ||||||||
| D.Dow | 0.002 *** (0.000) | 0.001 ** (0.000) | 0.001 *** (0.000) | 0.001 *** (0.000) | |||||||||
| SI | 0.098 ** (0.036) | 0.067 ** (0.026) | 0.080 *** (0.014) | 0.076 *** (0.016) | |||||||||
| Boundary | WL | −0.009 (0.030) | 0.020 (0.014) | −0.006 (0.006) | −0.003 (0.008) | ||||||||
| SVF | −1.496 (1.098) | −0.953 * (0.520) | −0.368 (0.251) | −0.327 (0.268) | |||||||||
| SL | 0.000 (0.000) | 0.000 (0.000) | 0.000 *** (0.000) | 0.000 *** (0.000) | |||||||||
| District | PM | −0.096 (0.060) | −0.067 ** (0.028) | −0.025 (0.014) | −0.024 (0.015) | ||||||||
| BD | −0.020 ** (0.008) | −0.008 * (0.004) | −0.008 *** (0.002) | −0.008 *** (0.002) | |||||||||
| BA | 0.002 (0.002) | 0.002 ** (0.001) | −0.001 ** (0.001) | −0.001 (0.001) | |||||||||
| Code | OP | 0.024 *** (0.005) | 0.013 ** (0.005) | 0.010 *** (0.002) | 0.010 *** (0.002) | ||||||||
| SQU | −0.011 (0.007) | −0.006 (0.006) | −0.007 ** (0.003) | −0.006 * (0.003) | |||||||||
| WA | 0.031 *** (0.007) | 0.021 *** (0.006) | 0.012 ** (0.004) | 0.012 ** (0.004) | |||||||||
| Sign | AT | 0.268 ** (0.108) | −0.021 (0.073) | 0.106 *** (0.027) | 0.092 ** (0.037) | ||||||||
| Moderating variables | |||||||||||||
| EMO | 0.024 *** (0.005) | 0.035 *** (0.004) | 0.002 *** (0.001) | 0.018 *** (0.005) | 0.036 *** (0.005) | 0.003 (0.004) | |||||||
| Control variables | |||||||||||||
| IE | 0.000 (0.000) | 0.000 (0.000) | 0.000 (0.000) | 0.000 (0.000) | 0.000 (0.000) | 0.000 * (0.000) | 0.000 *** (0.000) | 0.000 (0.000) | 0.000 (0.000) | 0.000 (0.000) | 0.000 ** (0.000) | 0.000 ** (0.000) | |
| Pop | 0.000 (0.000) | 0.000 (0.000) | 0.000 (0.000) | 0.000 (0.000) | 0.000 (0.000) | 0.000 (0.000) | 0.000 (0.000) | 0.000 (0.000) | 0.000 (0.000) | 0.000 (0.000) | 0.000 ** (0.000) | 0.000 ** (0.000) | |
| Adj.R2 | 0.663 | 0.834 | −0.010 | 0.777 | 0.300 | 0.845 | 0.783 | 0.874 | 0.199 | 0.750 | 0.978 | 0.977 | |
| F | 10.836 *** | 21.873 *** | 0.950 | 15.498 *** | 3.141 ** | 23.794 *** | 19.042 *** | 29.783 *** | 3.065 ** | 19.765 *** | 75.544 *** | 66.242 *** | |
| Variables | Model-1 | Model-2 | Model-3 | Model-4 | Model-5 | Model-6 | Model-7 | Model-8 | Model-9 | Model-10 | Model-11 | Model-12 | Model-13 |
|---|---|---|---|---|---|---|---|---|---|---|---|---|---|
| B (S.E.) | B (S.E.) | B (S.E.) | B (S.E.) | B (S.E.) | B (S.E.) | B (S.E.) | B (S.E.) | B (S.E.) | B (S.E.) | B (S.E.) | B (S.E.) | B (S.E.) | |
| RC | −0.073 (0.047) | ||||||||||||
| RC × EMO | −0.053 * (0.029) | ||||||||||||
| D.Dow | 0.001 *** (0.000) | ||||||||||||
| D.Dow × EMO | 0.000 *** (0.000) | ||||||||||||
| SI | 0.032 (0.025) | ||||||||||||
| SI × EMO | −0.021 *** (0.006) | ||||||||||||
| WL | 0.042 ** (0.018) | ||||||||||||
| WL × EMO | 0.014 ** (0.006) | ||||||||||||
| SVF | −1.295 ** (0.525) | ||||||||||||
| SVF × EMO | 0.281 * (0.135) | ||||||||||||
| SL | 0.000 (0.000) | ||||||||||||
| SL × EMO | 0.000 (0.000) | ||||||||||||
| PM | −0.032 (0.034) | ||||||||||||
| PM × EMO | 0.023 ** (0.011) | ||||||||||||
| BD | −0.001 (0.006) | ||||||||||||
| BD × EMO | 0.003 ** (0.001) | ||||||||||||
| BA | 0.004 ** (0.002) | ||||||||||||
| BA × EMO | 0.001 (0.001) | ||||||||||||
| OP | 0.007 (0.006) | ||||||||||||
| OP × EMO | −0.003 ** (0.001) | ||||||||||||
| SQU | −0.001 (0.008) | ||||||||||||
| SQU × EMO | 0.006 * (0.003) | ||||||||||||
| WA | 0.013 (0.008) | ||||||||||||
| WA × EMO | −0.004 ** (0.002) | ||||||||||||
| AT | 0.087 (0.063) | ||||||||||||
| AT × EMO | −0.033 *** (0.009) | ||||||||||||
| EMO | 0.038 *** (0.004) | 0.042 ** (0.005) | 0.043 *** (0.004) | 0.043 *** (0.005) | 0.033 *** (0.004) | 0.036 *** (0.005) | 0.038 *** (0.004) | 0.037 *** (0.005) | 0.040 *** (0.005) | 0.037 *** (0.006) | 0.040 *** (0.005) | 0.034 *** (0.006) | 0.047 *** (0.005) |
| IE | 0.000 (0.000) | 0.000 (0.000) | 0.000 (0.000) | 0.000 (0.000) | 0.000 (0.000) | 0.000 (0.000) | 0.000 (0.000) | 0.000 (0.000) | 0.000 (0.000) | 0.000 (0.000) | 0.000 (0.000) | 0.000 (0.000) | 0.000 (0.000) |
| Pop | 0.000 (0.000) | 0.000 (0.000) | 0.000 (0.000) | 0.000 (0.000) | 0.000 (0.000) | 0.000 (0.000) | 0.000 (0.000) | 0.000 (0.000) | 0.000 (0.000) | 0.000 (0.000) | 0.000 (0.000) | 0.000 (0.000) | 0.000 * (0.000) |
| R2 | 0.826 | 0.915 | 0.891 | 0.840 | 0.846 | 0.790 | 0.863 | 0.863 | 0.833 | 0.883 | 0.82 | 0.889 | 0.880 |
| F | 19.019 *** | 43.220 *** | 32.722 *** | 21.028 *** | 21.984 *** | 15.071 ** | 25.121 *** | 25.087 *** | 19.954 *** | 30.099 *** | 18.209 *** | 31.887 *** | 29.239 *** |
References
- Liu, Y.; Dong, W.; Wang, N.; Ding, T.; Dong, Y. Analysis on the Coupling Coordination Relationship Between Characteristic Culture City and New Urbanization: A Case Study of Five Cities in China. Urban Dev. Stud. 2021, 28, 27–36. [Google Scholar]
- Abid, E.H.; Alkinani, A.S.; Abudlmunim, S.A. The Compact City and Urban Image of the Traditional City Center. In Proceedings of the 4th International Conference on Buildings, Construction and Environmental Engineering, Istanbul, Turkey, 7–9 October 2019; Volume 737. [Google Scholar]
- Liu, Y.; Li, Y. Revitalize the World’s Countryside. Nature 2017, 548, 275–277. [Google Scholar] [CrossRef]
- Liu, Y. Research on the Urban-Rural Integration and Rural Revitalization in the New Era in China. Acta Geogr. Sin. 2018, 73, 637–650. [Google Scholar]
- Huang, J.X.; Obracht-Prondzynska, H.; Kamrowska-Zaluska, D.; Sun, Y.M.; Li, L.S. The Image of the City on Social Media: A Comparative Study Using “Big Data” and “Small Data” Methods in the Tri-City Region in Poland. Landsc. Urban Plan. 2021, 206, 103977. [Google Scholar] [CrossRef]
- Montgomery, C. Happy City: Transforming Our Lives through Urban Design; Penguin: London, UK, 2013; ISBN 0141957158. [Google Scholar]
- Tammaru, T.; Kliimask, J.; Kalm, K.; Zālīte, J. Did the Pandemic Bring New Features to Counter-Urbanisation? Evidence from Estonia. J. Rural Stud. 2023, 97, 345–355. [Google Scholar] [CrossRef] [PubMed]
- Hovardaoğlu, O.; Calisir-Hovardaoğlu, S. Tendency of Older Adults to Leave Big Cities in the COVID-19 Pandemic: A Qualitative Regional Analysis in Turkey. Reg. Sci. Policy Pract. 2023, 15, 585–605. [Google Scholar] [CrossRef]
- Derks, J.; Giessen, L.; Winkel, G. COVID-19-Induced Visitor Boom Reveals the Importance of Forests as Critical Infrastructure. For. Policy Econ. 2020, 118, 102253. [Google Scholar] [CrossRef] [PubMed]
- Donaldson, R. Small Town Tourism in South Africa; Springer: Berlin/Heidelberg, Germany, 2018; ISBN 3319680889. [Google Scholar]
- Abesinghe, S.; Kankanamge, N.; Yigitcanlar, T.; Pancholi, S. Image of a City through Big Data Analytics: Colombo from the Lens of Geo-Coded Social Media Data. Future Internet 2023, 15, 32. [Google Scholar] [CrossRef]
- Kotler, P. Marketing Management Analysis, Planning, Implementation and Control; Practice Hall International Inc.: Upper Saddle River, NJ, USA, 1997. [Google Scholar]
- Dinnie, K. National Image and Competitive Advantage: The Theory and Practice of Country-of-Origin Effect. J. Brand Manag. 2002, 9, 396–398. [Google Scholar] [CrossRef]
- Mehrabian, A.; Russell, J.A. An Approach to Environmental Psychology; The MIT Press: Cambridge, MA, USA, 1974; ISBN 0262130904. [Google Scholar]
- Lynch, K. The Image of the Environment. Image City 1960, 11, 1–13. [Google Scholar]
- Mondschein, A.; Moga, S.T. New Directions in Cognitive-Environmental Research: Applications to Urban Planning and Design. J. Am. Plan. Assoc. 2018, 84, 263–275. [Google Scholar] [CrossRef]
- Al-ghamdi, S.A.; Al-Harigi, F. Rethinking Image of the City in the Information Age. Procedia Comput. Sci. 2015, 65, 734–743. [Google Scholar] [CrossRef]
- Marshall, S. Science, Pseudo-Science and Urban Design. Urban Des. Int. 2012, 17, 257–271. [Google Scholar] [CrossRef]
- Filomena, G.; Verstegen, J.A.; Manley, E. A Computational Approach to ‘The Image of the City’. Cities 2019, 89, 14–25. [Google Scholar] [CrossRef]
- Fahmi, F.Z.; Hudalah, D.; Rahayu, P.; Woltjer, J. Extended Urbanization in Small and Medium-Sized Cities: The Case of Cirebon, Indonesia. Habitat Int. 2014, 42, 1–10. [Google Scholar] [CrossRef]
- Hernández-Moreno, Á.; Reyes-Paecke, S. The Effects of Urban Expansion on Green Infrastructure along an Extended Latitudinal Gradient (23 S–45 S) in Chile over the Last Thirty Years. Land Use Policy 2018, 79, 725–733. [Google Scholar] [CrossRef]
- Colsaet, A.; Laurans, Y.; Levrel, H. What Drives Land Take and Urban Land Expansion? A Systematic Review. Land Use Policy 2018, 79, 339–349. [Google Scholar] [CrossRef]
- The Population Division of the Department of Economic and Social Affairs. The World’s Cities in 2018—Data Booklet (ST/ESA/SER. A/417); United Nations: New York, NY, USA, 2018. [Google Scholar]
- Agael, F.; Özer, Ö. Human Perception in the Libyan Built Environment: Al-Khums and Bani Walid Cities as Case Studies. ArchNet-IJAR: Int. J. Archit. Res. 2017, 11, 157. [Google Scholar] [CrossRef]
- Li, D.; Sullivan, W.C. Impact of Views to School Landscapes on Recovery from Stress and Mental Fatigue. Landsc. Urban Plan. 2016, 148, 149–158. [Google Scholar] [CrossRef]
- Subiza-Pérez, M.; Vozmediano, L.; San Juan, C. Green and Blue Settings as Providers of Mental Health Ecosystem Services: Comparing Urban Beaches and Parks and Building a Predictive Model of Psychological Restoration. Landsc. Urban Plan. 2020, 204, 103926. [Google Scholar] [CrossRef]
- Kotsi, F.; Pike, S. Destination Brand Positioning Theme Development Based on Consumers’ Personal Values. J. Hosp. Tour. Res. 2021, 45, 573–587. [Google Scholar] [CrossRef]
- Baloglu, S.; McCleary, K.W. A Model of Destination Image Formation. Ann. Tour. Res. 1999, 26, 868–897. [Google Scholar] [CrossRef]
- Beerli, A.; Martin, J.D. Factors Influencing Destination Image. Ann. Tour. Res. 2004, 31, 657–681. [Google Scholar] [CrossRef]
- Li, Q.; Yu, K.Y.; Chen, D. SolarDiagnostics: Automatic Damage Detection on Rooftop Solar Photovoltaic Arrays. Sustain. Comput.-Inform. Syst. 2021, 32, 100595. [Google Scholar] [CrossRef]
- Shen, X.; Ge, M.; Wang, Q.; Padua, M.G.; Chen, D. Restoring, Remaking and Greening Freshwater Ecosystems: A Review of Projects in China. Ecol. Restor. 2022, 40, 172–178. [Google Scholar] [CrossRef]
- Luque-Martínez, T.; Del Barrio-García, S.; Ibáñez-Zapata, J.Á.; Molina, M.Á.R. Modeling a City’s Image: The Case of Granada. Cities 2007, 24, 335–352. [Google Scholar] [CrossRef]
- Gohari, H. Structural Analysis of the Elements of Lynch’s Image of the City Based on Space Syntax. Proc. Inst. Civ. Eng.-Urban Des. Plan. 2019, 172, 141–158. [Google Scholar] [CrossRef]
- Tomaž, K.; Walanchalee, W. One Does Not Simply… Project a Destination Image within a Participatory Culture. J. Destin. Mark. Manag. 2020, 18, 100494. [Google Scholar] [CrossRef]
- Bahrehdar, A.R.; Adams, B.; Purves, R.S. Streets of London: Using Flickr and OpenStreetMap to Build an Interactive Image of the City. Comput. Environ. Urban Syst. 2020, 84, 101524. [Google Scholar] [CrossRef]
- Su, L.; Chen, W.; Zhou, Y.; Fan, L. Exploring City Image Perception in Social Media Big Data through Deep Learning: A Case Study of Zhongshan City. Sustainability 2023, 15, 3311. [Google Scholar] [CrossRef]
- Bertrand, K.Z.; Bialik, M.; Virdee, K.; Gros, A.; Bar-Yam, Y. Sentiment in New York City: A High Resolution Spatial and Temporal View. arXiv 2013, arXiv:1308.5010. [Google Scholar]
- Liu, L.; Zhou, B.; Zhao, J.; Ryan, B.D. C-IMAGE: City Cognitive Mapping through Geo-Tagged Photos. Geo J. 2016, 81, 817–861. [Google Scholar] [CrossRef]
- Luo, Q.; Zhai, X. “I Will Never Go to Hong Kong Again!” How the Secondary Crisis Communication of “Occupy Central” on Weibo Shifted to a Tourism Boycott. Tour. Manag. 2017, 62, 159–172. [Google Scholar] [CrossRef] [PubMed]
- Hodgetts, D.; Chamberlain, K.; Groot, S. 20 Reflections on the Visual in Community Research and Action. In Visual Methods in Psychology: Using and Interpreting Images in Qualitative Research; Routledge: Abingdon, UK, 2012; p. 299. [Google Scholar]
- Whitehand, J.W.R.; Samuels, I.; Conzen, M.P.; Conzen, M.R.G. 1960: Alnwick, Northumberland: A study in town-plan analysis. Institute of British Geographers Publication 27. London: George Philip. Prog. Hum. Geogr. 2009, 33, 859–864. [Google Scholar] [CrossRef]
- Song, Y.; Merlin, L.; Rodriguez, D. Comparing Measures of Urban Land Use Mix. Comput. Environ. Urban Syst. 2013, 42, 1–13. [Google Scholar] [CrossRef]
- Braun, L.M.; Malizia, E. Downtown Vibrancy Influences Public Health and Safety Outcomes in Urban Counties. J. Transp. Health 2015, 2, 540–548. [Google Scholar] [CrossRef]
- De Koning, R.E.; Van Nes, A.; Ye, Y.; Roald, H.J. Strategies for Integrated Densification with Urban Qualities: Combining Space Syntax with Building Density, Land Usage, Public Transport and Property Rights in Bergen City. In Proceedings of the XI SSS: 11th International Space Syntax Symposium, Lisbon, Portugal, 3–7 July 2017; Instituto Superior Técnico: Lisbon, Portugal, 2017; pp. 51–56. [Google Scholar]
- Śleszyński, P. Społeczno-Ekonomiczne Skutki Chaosu Przestrzennego Dla Osadnictwa i Struktury Funkcjonalnej Terenów. Stud. KPZK 2018, 182, 29–80. [Google Scholar]
- Glass, R.J.; Glass, L.M.; Beyeler, W.E.; Min, H.J. Targeted Social Distancing Designs for Pandemic Influenza. Emerg. Infect. Dis. 2006, 12, 1671. [Google Scholar] [CrossRef]
- Ahsan, M.M. Strategic Decisions on Urban Built Environment to Pandemics in Turkey: Lessons from COVID-19. J. Urban Manag. 2020, 9, 281–285. [Google Scholar] [CrossRef]
- Sim, D. Soft City: Building Density for Everyday Life; Island Press: Washington, DC, USA, 2019; ISBN 1642830186. [Google Scholar]
- Zamparini, A.; Gualtieri, G.; Lurati, F. Iconic Buildings in the Making of City Identity: The Role of Aspirational Identity Artefacts. Urban Stud. 2023, 60, 00420980221144157. [Google Scholar] [CrossRef] [PubMed]
- Kornberger, M.; Meyer, R.E.; Höllerer, M.A. Exploring the Long-Term Effect of Strategy Work: The Case of Sustainable Sydney 2030. Urban Stud. 2021, 58, 3316–3334. [Google Scholar] [CrossRef]
- Zhao, P.; Yu, Z. Rural Poverty and Mobility in China: A National-Level Survey. J. Transp. Geogr. 2021, 93, 103083. [Google Scholar] [CrossRef]
- Kolodinsky, J.M.; DeSisto, T.P.; Propen, D.; Putnam, M.E.; Roche, E.; Sawyer, W.R. It Is Not How Far You Go, It Is Whether You Can Get There: Modeling the Effects of Mobility on Quality of Life in Rural New England. J. Transp. Geogr. 2013, 31, 113–122. [Google Scholar] [CrossRef]
- Cheng, M.; Edwards, D. Social Media in Tourism: A Visual Analytic Approach. Curr. Issues Tour. 2015, 18, 1080–1087. [Google Scholar] [CrossRef]
- Song, Y.; Wu, Y. Tracking the Viral Spread of Incivility on Social Networking Sites: The Case of Cursing in Online Discussions of Hong Kong–Mainland China Conflict. Commun. Public 2018, 3, 46–61. [Google Scholar] [CrossRef]
- Li, Q.; Feng, Y.Z.; Leng, Y.Y.; Chen, D. IEEE SolarFinder: Automatic Detection of Solar Photovoltaic Arrays. In Proceedings of the 2020 19th ACM/IEEE International Conference on Information Processing in Sensor Networks (IPSN 2020), Sydney, NSW, Australia, 21–24 April 2020; pp. 193–204. [Google Scholar]
- Anzoise, V.; Slanzi, D.; Poli, I. Local Stakeholders’ Narratives about Large-Scale Urban Development: The Zhejiang Hangzhou Future Sci-Tech City. Urban Stud. 2020, 57, 655–671. [Google Scholar] [CrossRef]
- Nasukawa, T.; Yi, J. Sentiment Analysis: Capturing Favorability Using Natural Language Processing. In Proceedings of the 2nd International Conference on Knowledge Capture, Sanibel Island, FL, USA, 23–25 October 2003; pp. 70–77. [Google Scholar]
- Norberg-Schulz, C. Existence, Space & Architecture; Praeger Publishers: West Westport, CT, USA, 1971. [Google Scholar]
- Zhao, B.X.; Meng, C.L. Analysis on Building Readable Image of Urban Public Spaces. Appl. Mech. Mater. 2013, 409, 883–886. [Google Scholar] [CrossRef]
- Chang, T.C.; Huang, S. Reclaiming the City: Waterfront Development in Singapore. Urban Stud. 2011, 48, 2085–2100. [Google Scholar] [CrossRef]
- Erbil, A.Ö.; Erbil, T. Redevelopment of Karaköy Harbor, Istanbul: Need for a New Planning Approach in the Midst of Change. Cities 2001, 18, 185–192. [Google Scholar] [CrossRef]
- Paniagua, A. Farmers in Remote Rural Areas: The Worth of Permanence in the Place. Land Use Policy 2013, 35, 1–7. [Google Scholar] [CrossRef]
- Pasanen, T.P.; White, M.P.; Wheeler, B.W.; Garrett, J.K.; Elliott, L.R. Neighbourhood Blue Space, Health and Wellbeing: The Mediating Role of Different Types of Physical Activity. Environ. Int. 2019, 131, 105016. [Google Scholar] [CrossRef] [PubMed]
- Hunt, E. Blue Spaces: Why Time Spent near Water Is the Secret of Happiness. The Guardian, 3 November 2019; 3. [Google Scholar]
- Kim, M.J.; Lee, C.-K.; Jung, T. Exploring Consumer Behavior in Virtual Reality Tourism Using an Extended Stimulus-Organism-Response Model. J. Travel Res. 2020, 59, 69–89. [Google Scholar] [CrossRef]
- Nel, E.; Connelly, S.; Stevenson, T. New Zealand’s Small Town Transition: The Experience of Demographic and Economic Change and Place Based Responses. New Zealand Geogr. 2019, 75, 163–176. [Google Scholar] [CrossRef]
- Powe, N.A.; Connelly, S.; Nel, E. Planning for Small Town Reorientation: Key Policy Choices within External Support. J. Rural Stud. 2022, 90, 65–75. [Google Scholar] [CrossRef]
- Lynch, K. Reconsidering the Image of the City; Springer: Berlin/Heidelberg, Germany, 1984; ISBN 1475796994. [Google Scholar]
- Rost, M.; Barkhuus, L.; Cramer, H.; Brown, B. Representation and Communication: Challenges in Interpreting Large Social Media Datasets. In Proceedings of the 2013 Conference on Computer Supported Cooperative Work, San Antonio, TX, USA, 23–27 February 2013; pp. 357–362. [Google Scholar]

| Data | Data Source | Data Type |
|---|---|---|
| Town image | Sina Weibo (https://m.weibo.cn, accessed on 22 December 2023) Little Red Book (https://www.xiaohongshu.com/explore, accessed on 20 December 2023) | Social media |
| Text emotions | Sina Weibo (https://m.weibo.cn, accessed on 22 December 2023) Little Red Book (https://www.xiaohongshu.com/explore, accessed on 20 December 2023) | Social media |
| POI | Gaode Map (https://ditu.amap.com, accessed on 18 December 2023) | Social sensing |
| Environmental attributes | OpenStreetMap (https://www.openstreetmap.org, accessed on 15 December 2023) Gaode Map (https://ditu.amap.com, accessed on 18 December 2023) | Crowd source |
| Town social economy | China Statistical Yearbook (Township) (http://www.stats.gov.cn/zs/tjwh/tjkw/tjzl/202302/t20230215_1908003.html, accessed on 15 December 2023) | Government |
| Gene Type | Scenes |
|---|---|
| Building | Windows, building components, building interiors, building exteriors, building roofs, building nightscapes, stairs, doors, walls, theatres |
| Public space | Ground, square, hutong, street, corridor, waterfront, water pavilion, courtyard |
| Landmark | Carving, statues, attraction signs, road signs, door signs, tickets, pagodas, bridges |
| Cultural custom | Ornaments, performances, lanterns, non-heritage items, windmills, lanterns, paper-cutting, festive events, food, models, New Year paintings, balloons, rickshaws, lion dances, fireworks, writing, characters, folk crafts |
| Mountain | Mountains, artificial rockery |
| Water | Water, boating |
| Animal | Dogs, cats, monkeys, bees, butterflies, deer, dragonflies, tigers, lions, elephants, ornamental fish, peacocks |
| Plant | Flowers, trees, grass, leaves |
| Sky | Blue sky, white clouds, night sky, sunset |
Disclaimer/Publisher’s Note: The statements, opinions and data contained in all publications are solely those of the individual author(s) and contributor(s) and not of MDPI and/or the editor(s). MDPI and/or the editor(s) disclaim responsibility for any injury to people or property resulting from any ideas, methods, instructions or products referred to in the content. |
© 2024 by the authors. Licensee MDPI, Basel, Switzerland. This article is an open access article distributed under the terms and conditions of the Creative Commons Attribution (CC BY) license (https://creativecommons.org/licenses/by/4.0/).
Share and Cite
Xu, W.; Zeng, P.; Liu, B.; Cai, L.; Sun, Z.; Liu, S.; Tang, F. Exploring the Built Environment Factors Influencing Town Image Using Social Media Data and Deep Learning Methods. Land 2024, 13, 291. https://doi.org/10.3390/land13030291
Xu W, Zeng P, Liu B, Cai L, Sun Z, Liu S, Tang F. Exploring the Built Environment Factors Influencing Town Image Using Social Media Data and Deep Learning Methods. Land. 2024; 13(3):291. https://doi.org/10.3390/land13030291
Chicago/Turabian StyleXu, Weixing, Peng Zeng, Beibei Liu, Liangwa Cai, Zongyao Sun, Sicheng Liu, and Fengliang Tang. 2024. "Exploring the Built Environment Factors Influencing Town Image Using Social Media Data and Deep Learning Methods" Land 13, no. 3: 291. https://doi.org/10.3390/land13030291
APA StyleXu, W., Zeng, P., Liu, B., Cai, L., Sun, Z., Liu, S., & Tang, F. (2024). Exploring the Built Environment Factors Influencing Town Image Using Social Media Data and Deep Learning Methods. Land, 13(3), 291. https://doi.org/10.3390/land13030291