Abstract
This study investigates, for the first time, the urbanization effect (UE) on local extreme climate events in Urumqi, China, based on 22 indices of climate extremes, which are calculated with daily observation data from 1976 to 2018. These analyses reveal a pronounced nocturnal urban heat island (UHI) effect and a daytime urban cold island (UCI) effect. Due to Urumqi’s arid climate background, the UCI effect is considered a unique feature of the UE, which significantly differs from those in eastern and northern China. The UE on the TR20 index (number of days with minimum daily temperature exceeding 20 °C) reached 5.22 d/10a, indicating that urbanization has led to a fast increase in the number of hot nights in Urumqi. The absolute averaged UE on the indices measuring the frequency of warm events is about twice as large as that on the indices measuring the frequency of cold events, while that on the indices measuring the intensity of warm events is about one third of that on the indices measuring the intensity of cold events. The highest averaged urbanization contributions (UCs) to the extreme warm and cold events are represented by the frequency indices and the intensity indices, respectively, while those contributing to the extreme precipitation events are represented by the duration indices. Moreover, urbanization probably exacerbates the degree of wetting in the overall “warming and wetting” climate trend of the region. These findings can be seen as new evidence to provide scientific basis for further investigation of the UE on climate changes in arid regions.
1. Introduction
As global warming continues, the frequency, intensity, and duration of extreme events (e.g., floods, heat waves, heavy precipitation, droughts, and extreme storms) are increasing in many parts of the world [1,2,3,4,5,6,7,8,9,10,11,12,13,14,15]. The IPCC Sixth Assessment Report (AR6) conducted a comprehensive assessment of many extreme events and concluded that the urbanization effects (UEs), such as land use changes and anthropogenic aerosol emissions, play a dominant role in the changes in extreme events in many regions with high confidence [9]. Zhai et al. [11] stated that climate change caused by human activities may have been the main driving factor for the increase in the frequency and intensity of extreme precipitation in most areas since the 1950s.
In the course of urbanization, the physical properties of urban areas further alter energy, momentum, and water vapor exchanges, which, in turn, affect the regional weather and climate [16,17,18,19,20,21,22,23]. Numerous studies on the urban environment in relation to weather and climate have largely focused on the urban heat island (UHI) effect, which refers to the increased temperature in urban areas compared to their natural surroundings [22]. Moreover, urbanization also affects the structure of the atmospheric boundary layer, the dispersion of air pollutants, atmospheric moisture, wind, cloud formation, precipitation, storms, and heat waves [22]. Currently, more than 3.5 billion individuals, which constitute half of the worldwide population, reside in urban areas. It is predicted that the proportion of urban dwellers will escalate to approximately 68% by the mid-21st century [22]. Consequently, the UE on regional weather and climate is widely studied around the world [11,14,24,25,26,27,28]. For example, Zhao et al. [29] analyzed the temperature changes in urban and rural areas of Beijing and found that the trend of temperature is more pronounced in urban areas than it is in rural areas; especially since 1990, the UHI effect has been steadily growing. Kug and Ahn [30] found that the UE on summer precipitation was distinctively larger than that of the other seasons by examining 30-year time series precipitation data from 40 stations in Korea. Tysa et al. [31] investigated the UE on surface air temperature (SAT) anomaly series for the periods of 1980–2015 and 1960–2015 and found that the urbanization level is significantly positively correlated to the linear trends of the annual mean Tmean and minimum SAT. Wen et al. [32] analyzed the SAT change in mainland China based on 763 national stations and found that the annual mean SAT as a whole rose by 1.248 °C in the last 55 years, with a warming rate of 0.238 °C/10a (degrees Celsius per decade).
There has been a high incidence of extreme climate events in recent years, and these extreme climate events in China have also been studied extensively [4,6,33,34,35,36]. For instance, Li et al. [36] studied the temporal–spatial distribution of extreme indices in central China (i.e., the Henan, Hubei, Hunan, and Jiangxi provinces) between 1988 and 2017 and found a noticeable decrease in the cold spell duration indicator (CSDI) at −0.19 d/10a. Additionally, the warm spell duration indicator (WSDI) and the highest annual value of daily maximum temperature increased at rates of 0.25 d/10a and 0.30 °C/10a, respectively. Zhai et al. [3] found that the occurrence of extreme precipitation in northwest China shows a clear increasing trend, and Zhai and Liu [6] found that heavy precipitation events have occurred more frequently in the middle-to-lower reaches of the Yangtze River, while droughts have become more noticeable in the northeast and the southwest. However, it is still unclear to what extent the UE has impacted the trends of extreme events [22]. It is clear that extreme climate events are frequent in northwest China, but the impact of anthropogenic factors, especially urbanization, on climate extremes is poorly understood.
Urumqi, the provincial capital of Xinjiang, is the largest and the most-developed city in Xinjiang. It is located in the arid region of northwestern China, whose weather and climate are very sensitive to climate change [12,37,38,39,40]. Therefore, it is important to study the UE on the local extreme climate events in Urumqi. The understanding of the UE in Urumqi can also provide valuable insights for similar arid regions worldwide, especially in central Asia, where observations are scarce.
Most studies of the UE on local extreme climate events are conducted via comparison between the urban and rural data (also called the Urban Minus Rural method, i.e., UMR method) [31,32,41]. UMR is a commonly used method and is usually regarded as the most reliable and robust way to investigate the UE [31,42]. Therefore, the UMR method is adopted to investigate the UE on the changes in extreme climate events in Urumqi. Twenty-two extreme climate indices are calculated based on precipitation and temperature observations from both the urban and rural areas of Urumqi from 1976 to 2018. Linear regression of the indices is conducted, along with further analysis to separate the urbanization contributions (UCs). Below is the nomenclature of technical terms used in this paper.
2. Data and Methods
2.1. Data
In this study, daily temperature (unit: °C) and precipitation (unit: mm) observations at Urumqi, Midong, and Dabancheng stations from 1976 to 2018 are used. The data are obtained from the China Meteorological Data Network (http://data.cma.cn/ (accessed on 20 May 2019)). Other urbanization-related data, e.g., population (Pop.), impervious surface area (ISA), and gross domestic product (GDP), are obtained from the Urumqi Statistical Yearbook.
The selection of rural stations follows a few simple rules [43]. The rural station must be located in proximity to an urban station, so that they share the same climatological background. The rural stations must have sufficiently long and continuous observation data, be away from densely populated urban areas, and should have no record of station relocation during the observation period.
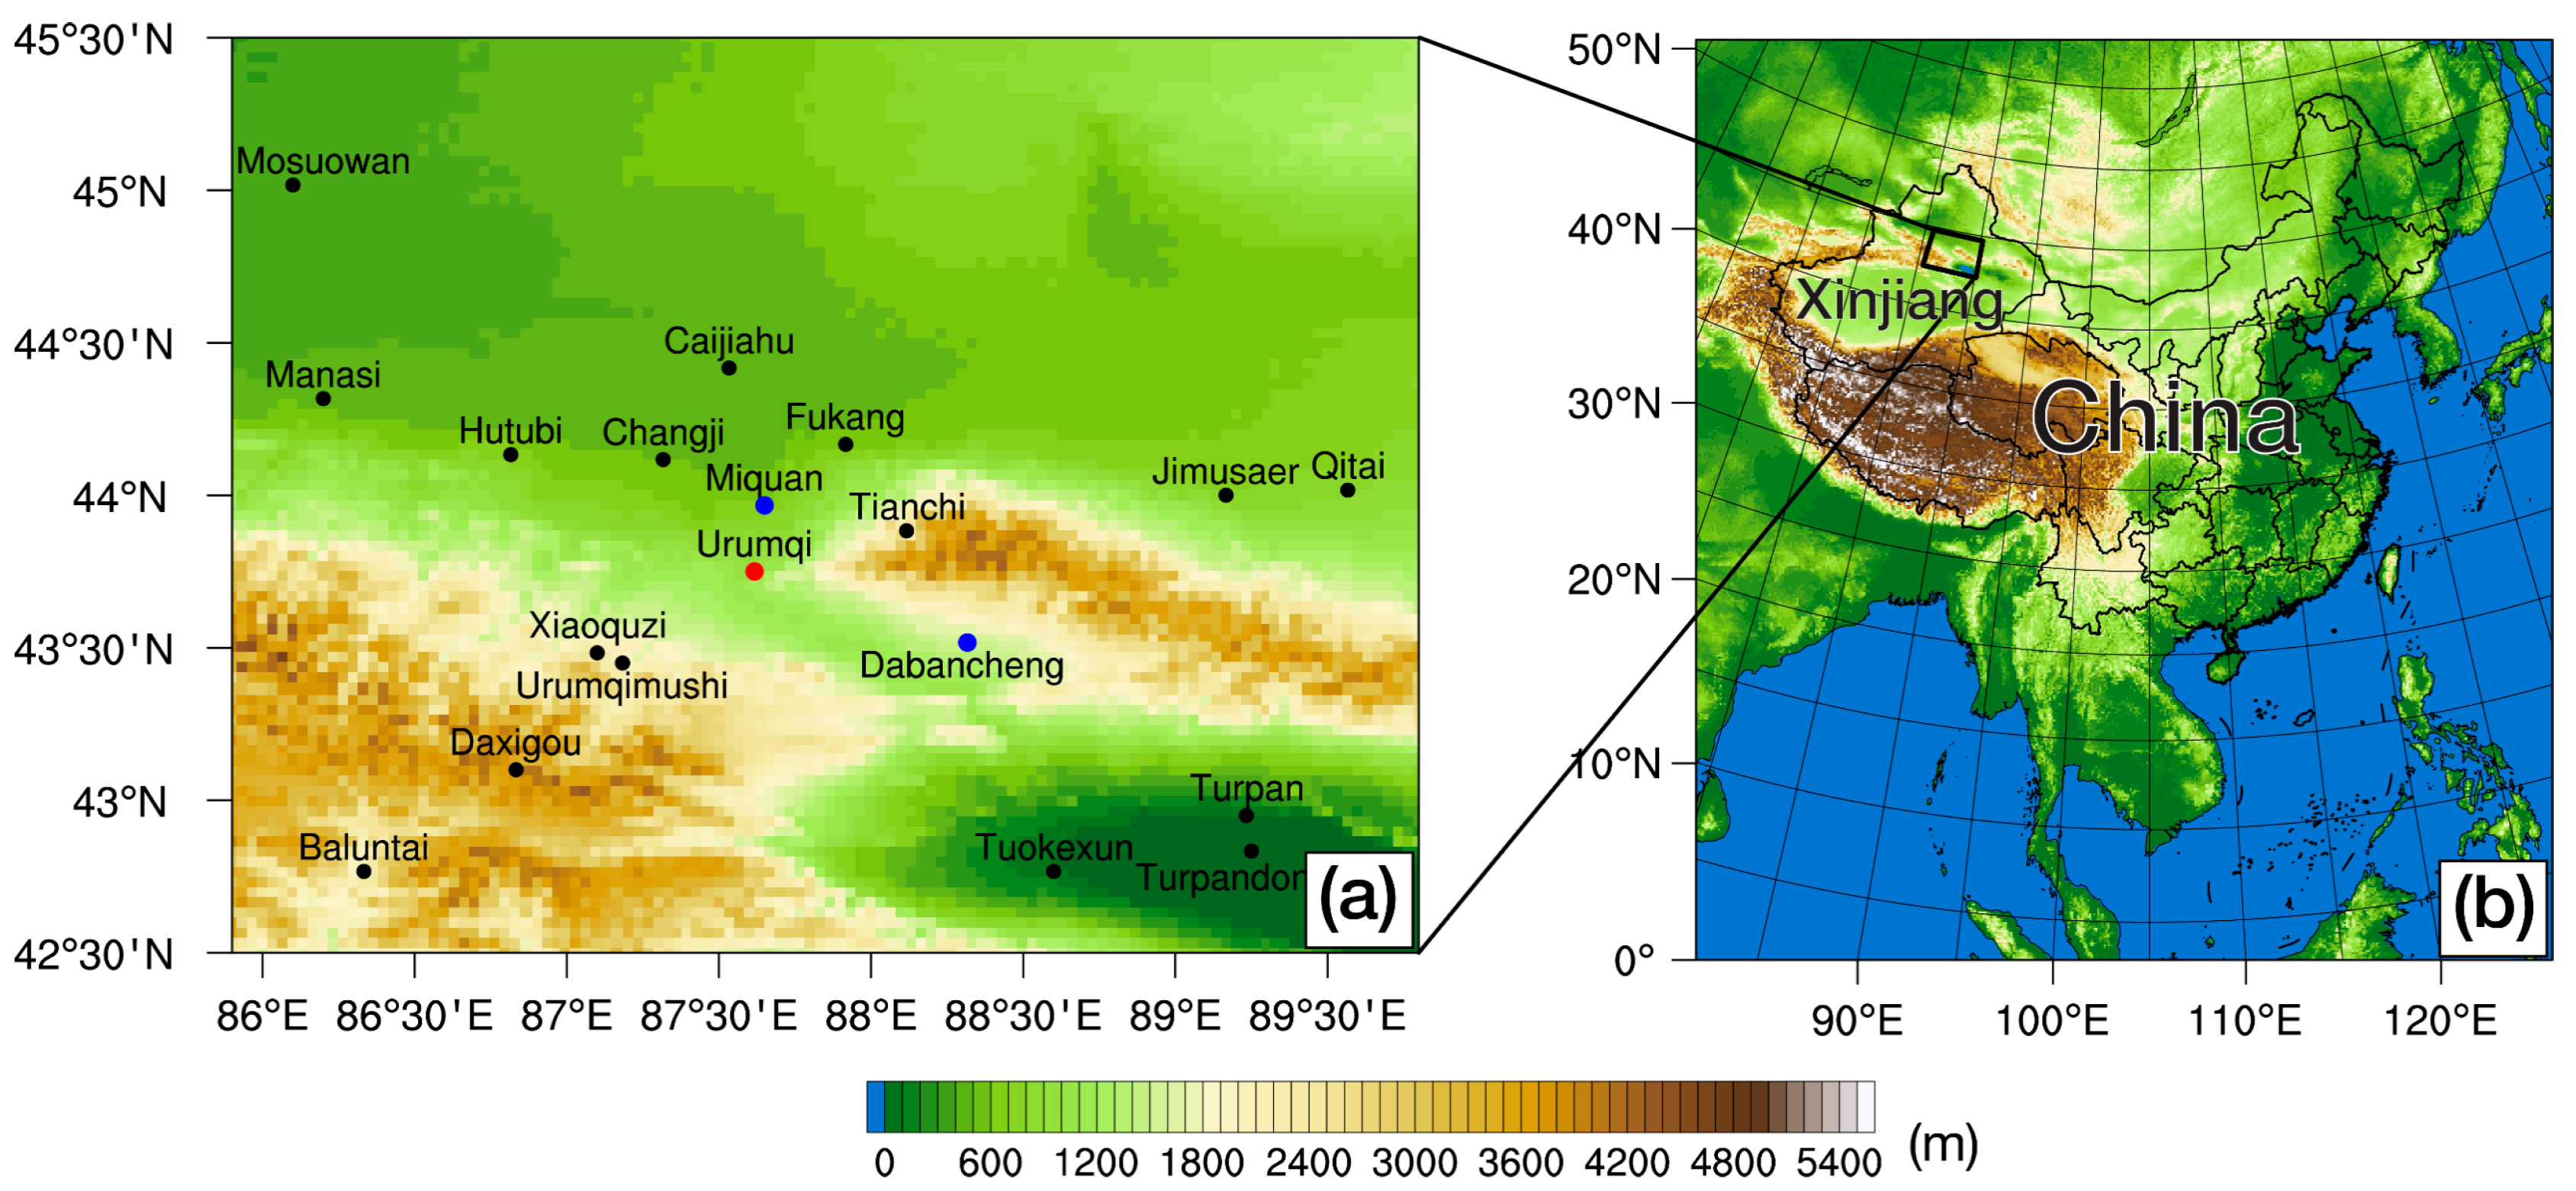
As shown in Figure 1a, there are nine meteorological stations that have long time series of observations within a radius of about 80 km centered around Urumqi station (i.e., Miquan, Changji, Dabancheng, Caijiahu, Hutubi, Tianchi, Xiaoquzi, and Urumqimushi stations; see Table 1 below for their information). In this study, the Changji and Fukang stations are excluded due to urbanization development of these two cities. Tianchi, Xiaoquzi, Urumqimushi, Caijiahu, and Hutubi stations are also excluded because of the large differences in altitudes with Urumqi station and/or relatively long distance from Urumqi station. Miquan and Dabancheng stations are selected as rural stations because they have the same climatic background and have not been affected by urbanization. In addition, these two stations are close to Urumqi station and have small altitude differences.
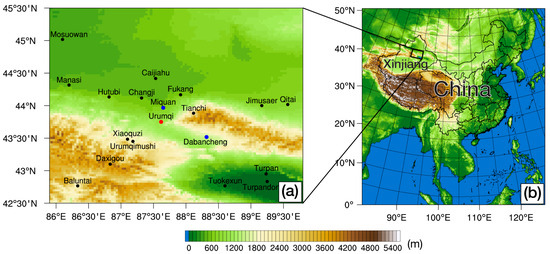
Figure 1.
(a) Geographical location of meteorological sites and topography (shading, unit: m) around Urumqi. Solid red dot marks the location of Urumqi station (i.e., urban station), while blue dots denote the locations of the rural stations (i.e., Miquan and Dabancheng) used in this study. Black dots indicate locations of all other stations which had long-term observation data. (b) Geographical location of the study area (black box) in China.

Table 1.
Information of Urumqi station and other stations which had long time series observation data (mainly based on Liu et al. [44]); three stations used in this study are highlighted with five-pointed stars (★) in the first column.
In order to minimize the influence of altitude between stations, we adjust the temperature from the two rural stations to the same altitude level as Urumqi station using the dry adiabatic lapse rate (i.e., 0.98 °C/100 m). The average of meteorological element from these two stations are used as the benchmark rural value.
2.2. Methods
2.2.1. Extreme Climate Indices
The Climate Change Detection and Indicators (CCDIs) recommended by the Climate Committee of the WMO has identified 27 extreme climate indices (https://community.wmo.int/en/climate-change-detection-and-indices (accessed on 20 May 2019)). These indices are calculated using daily data of precipitation and maximum and minimum temperatures. They have been studied to understand extreme events under global climate change in many parts of the globe [12,34,38,45,46,47,48]. In this study, 16 extreme indices of temperature and 6 extreme indices of precipitation (considering the characteristics of precipitation in this arid region, indices R25mm, R99p, Rx1day, Rx5day, and Rnn are not included in this study) are selected (shown in Table 2 below; for more information about these indices, readers can visit http://etccdi.pacificclimate.org/list_27_indices.shtml (accessed on 20 May 2019)) to study the UE on extreme climate events in Urumqi. RClimDex (v1.1) software developed by the Climate Research Branch of the Meteorological Service of the Canada (http://etccdi.pacificclimate.org/software.shtml (accessed on 20 May 2019)) was used for the calculations and related data quality control [12,45,47,49,50].
Table 2.
Definitions of extreme climate indices utilized in this work. (Tmean, Tmax, and Tmin indicate the daily mean, maximum, and minimum temperatures, respectively. Values of the TNx, TXx, TXn, TNn, and DTR analyzed in this study are their annual mean values.)
2.2.2. Correlation Analysis
The Pearson correlation coefficient measures the correlation between two variables [34] and is used to investigate the correlation between the extreme climate indices and related urbanization factors in this work. The Pearson correlation coefficient r is calculated as
where n is the sample size, xi and yi are the extreme climate index and the urbanization factor in year i, and and are the averages of x and y, respectively. r varies between −1 and 1. In this study, Student’s t-test was utilized to test the significance level of the calculated results (p values smaller than 0.05 are labeled with *, while p ≤ 0.01 are labeled with **).
2.2.3. Urbanization Effect and Urbanization Contribution
As mentioned in Section 1 above, the general method to investigate the UE is to compare the urban and rural stations, which is also referred to as the UMR method [31,51,52]. The urbanization contribution (UC) is calculated as the percent proportion of the UE to the overall changing trend, and it can objectively quantify the impact of urbanization on extreme climate events in urban areas [31,52]. The UE is obtained by first calculating
where is the trend of an extreme climate index in the urban station, and represents that of the rural station. The UC is then expressed as
With the absolute sign, the UC is confined to a range between 0 and 100%. When UC = 0, it means that urbanization has no contribution to the extreme climate index; when UC = 100%, changes in the trend of the extreme climate index derived from the urban station data are attributed to the UE. In the actual calculation, there may be cases where the UC is greater than 100%, which will be treated as 100% [53,54].
2.2.4. Mann–Kendall Test
The changing trend analysis of extreme events is conducted using the simple linear regression method, and the significance of the trend coefficients is tested using the t-test. In order to determine the UE on the timing of abrupt changes in trends of the extreme indices, the Mann–Kendall (M-K) abrupt change test [48] is utilized. The M-K significance test is expressed as follows:
where the Z represents the standardized test statistic parameter; S indicates the test statistic parameter; and n is the sample number of samples. When n ≥ 8, S approximates a positive terrestrial distribution. Standardized Z conforms to a standard orthogonal distribution, and when |Z| > Z1−α/2, this indicates a significant trend of change, where Z1-α/2 is the value of the standard orthogonal distribution function table at confidence level α. The M-K test at the confidence level of 0.05 shows two results: significant change (|Z| > 1.96) and insignificant change (−1.96 ≤ Z ≤ 1.96).
3. Results
In order to investigate the UE on the local extreme events in Urumqi, linear regression of the extreme climate indices is conducted to obtain the temporal trends at the urban and rural stations, while the UCs are computed accordingly. The main findings of this study are given as follows.
3.1. Urbanization Effects on Tmean, Tmax, and Tmin
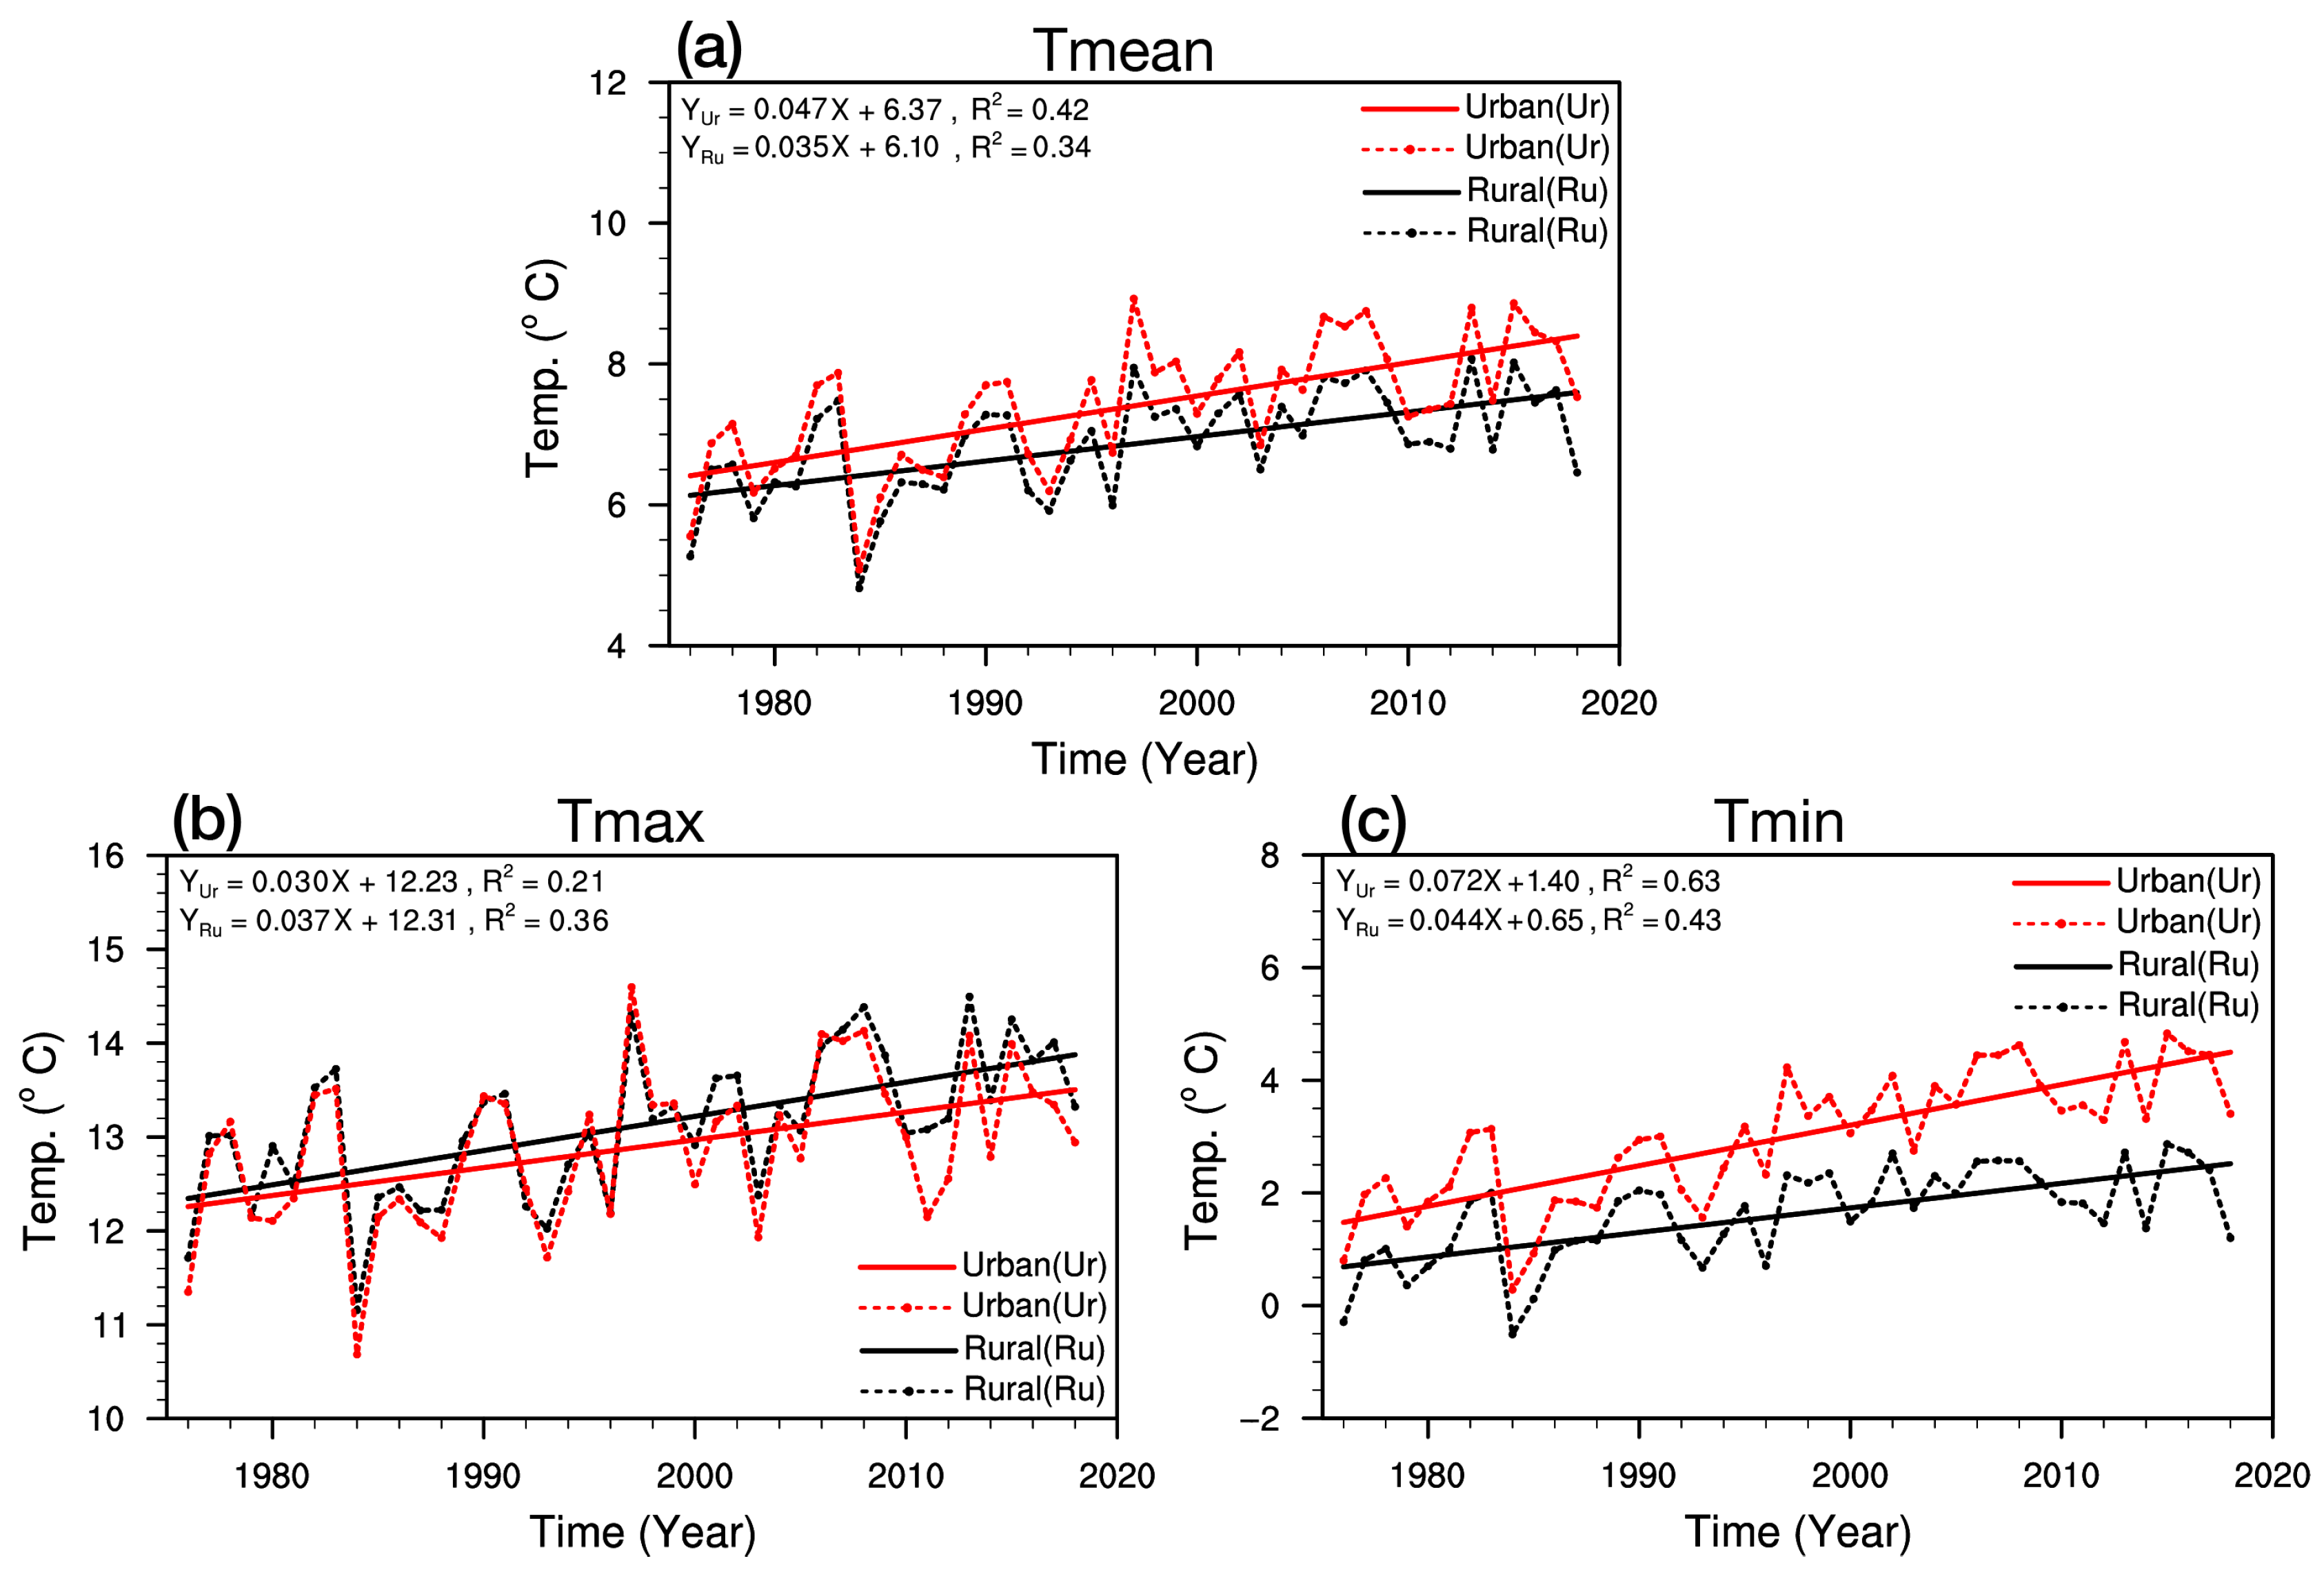
As shown in Figure 2 and Table 3, the annual mean Tmean, Tmax, and Tmin for both the urban and rural stations show increasing trends during the period between 1976 and 2018. The rates of increase in both Tmean and Tmin at the urban station are higher than those of the rural station, while the rate of the increase in Tmax at the urban station is lower than that of the rural station. The difference in the warming rates caused by the UE on Tmean and Tmin are 0.12 °C/10a and 0.28 °C/10a, respectively, with corresponding UCs of 25.53% and 38.89%. However, the UE on Tmax is negative (−0.07 °C/10a), with a UC of 23.33%. It should be noted that all three temperature trends passed the significance level of 0.01.
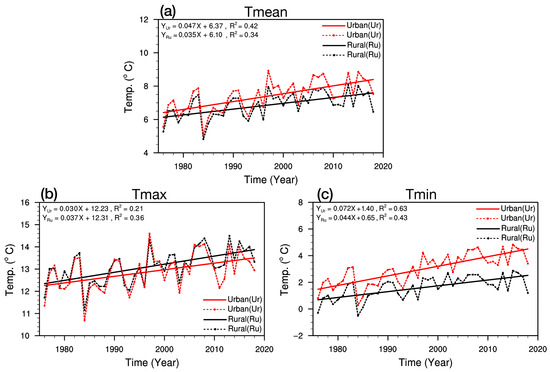
Figure 2.
Time variations and linear trends of the daily (a) mean, (b) maximum, and (c) minimum temperatures in Urumqi during 1976–2018.
Table 3.
Urbanization effects and urbanization contributions to Tmean, Tmax, and Tmin of Urumqi from 1976 to 2018.
Among these three temperature factors, the highest UE and UC are found with Tmin, meaning that urbanization in Urumqi has caused a significant increase in Tmin in the urban area, suggesting a strong urban heat island (UHI) effect during the nighttime. However, Tmax in the urban area increased at a rate smaller than that of the rural area, reflecting the existence of a certain cooling effect, i.e., an urban cold island (UCI) effect during the daytime [55]. This kind of characteristic is significantly different from those of the regions in eastern or southeastern China [55]. Urumqi, as the largest city in arid region in northwest China, is located in an oasis surrounded by the Gobi desert. Evapotranspiration in the oasis region can lead to cooling during the day, and this kind of cooling can mask (or exceed) the urban heat island (UHI) effect. Consequently, cooling due to the evapotranspiration of vegetation in an oasis (which is called the “oasis effect” or “oasis cooling effect”) may be responsible for the daytime UCI in Urumqi.
3.2. Urbanization Effects on Extreme Warm Climate Indices
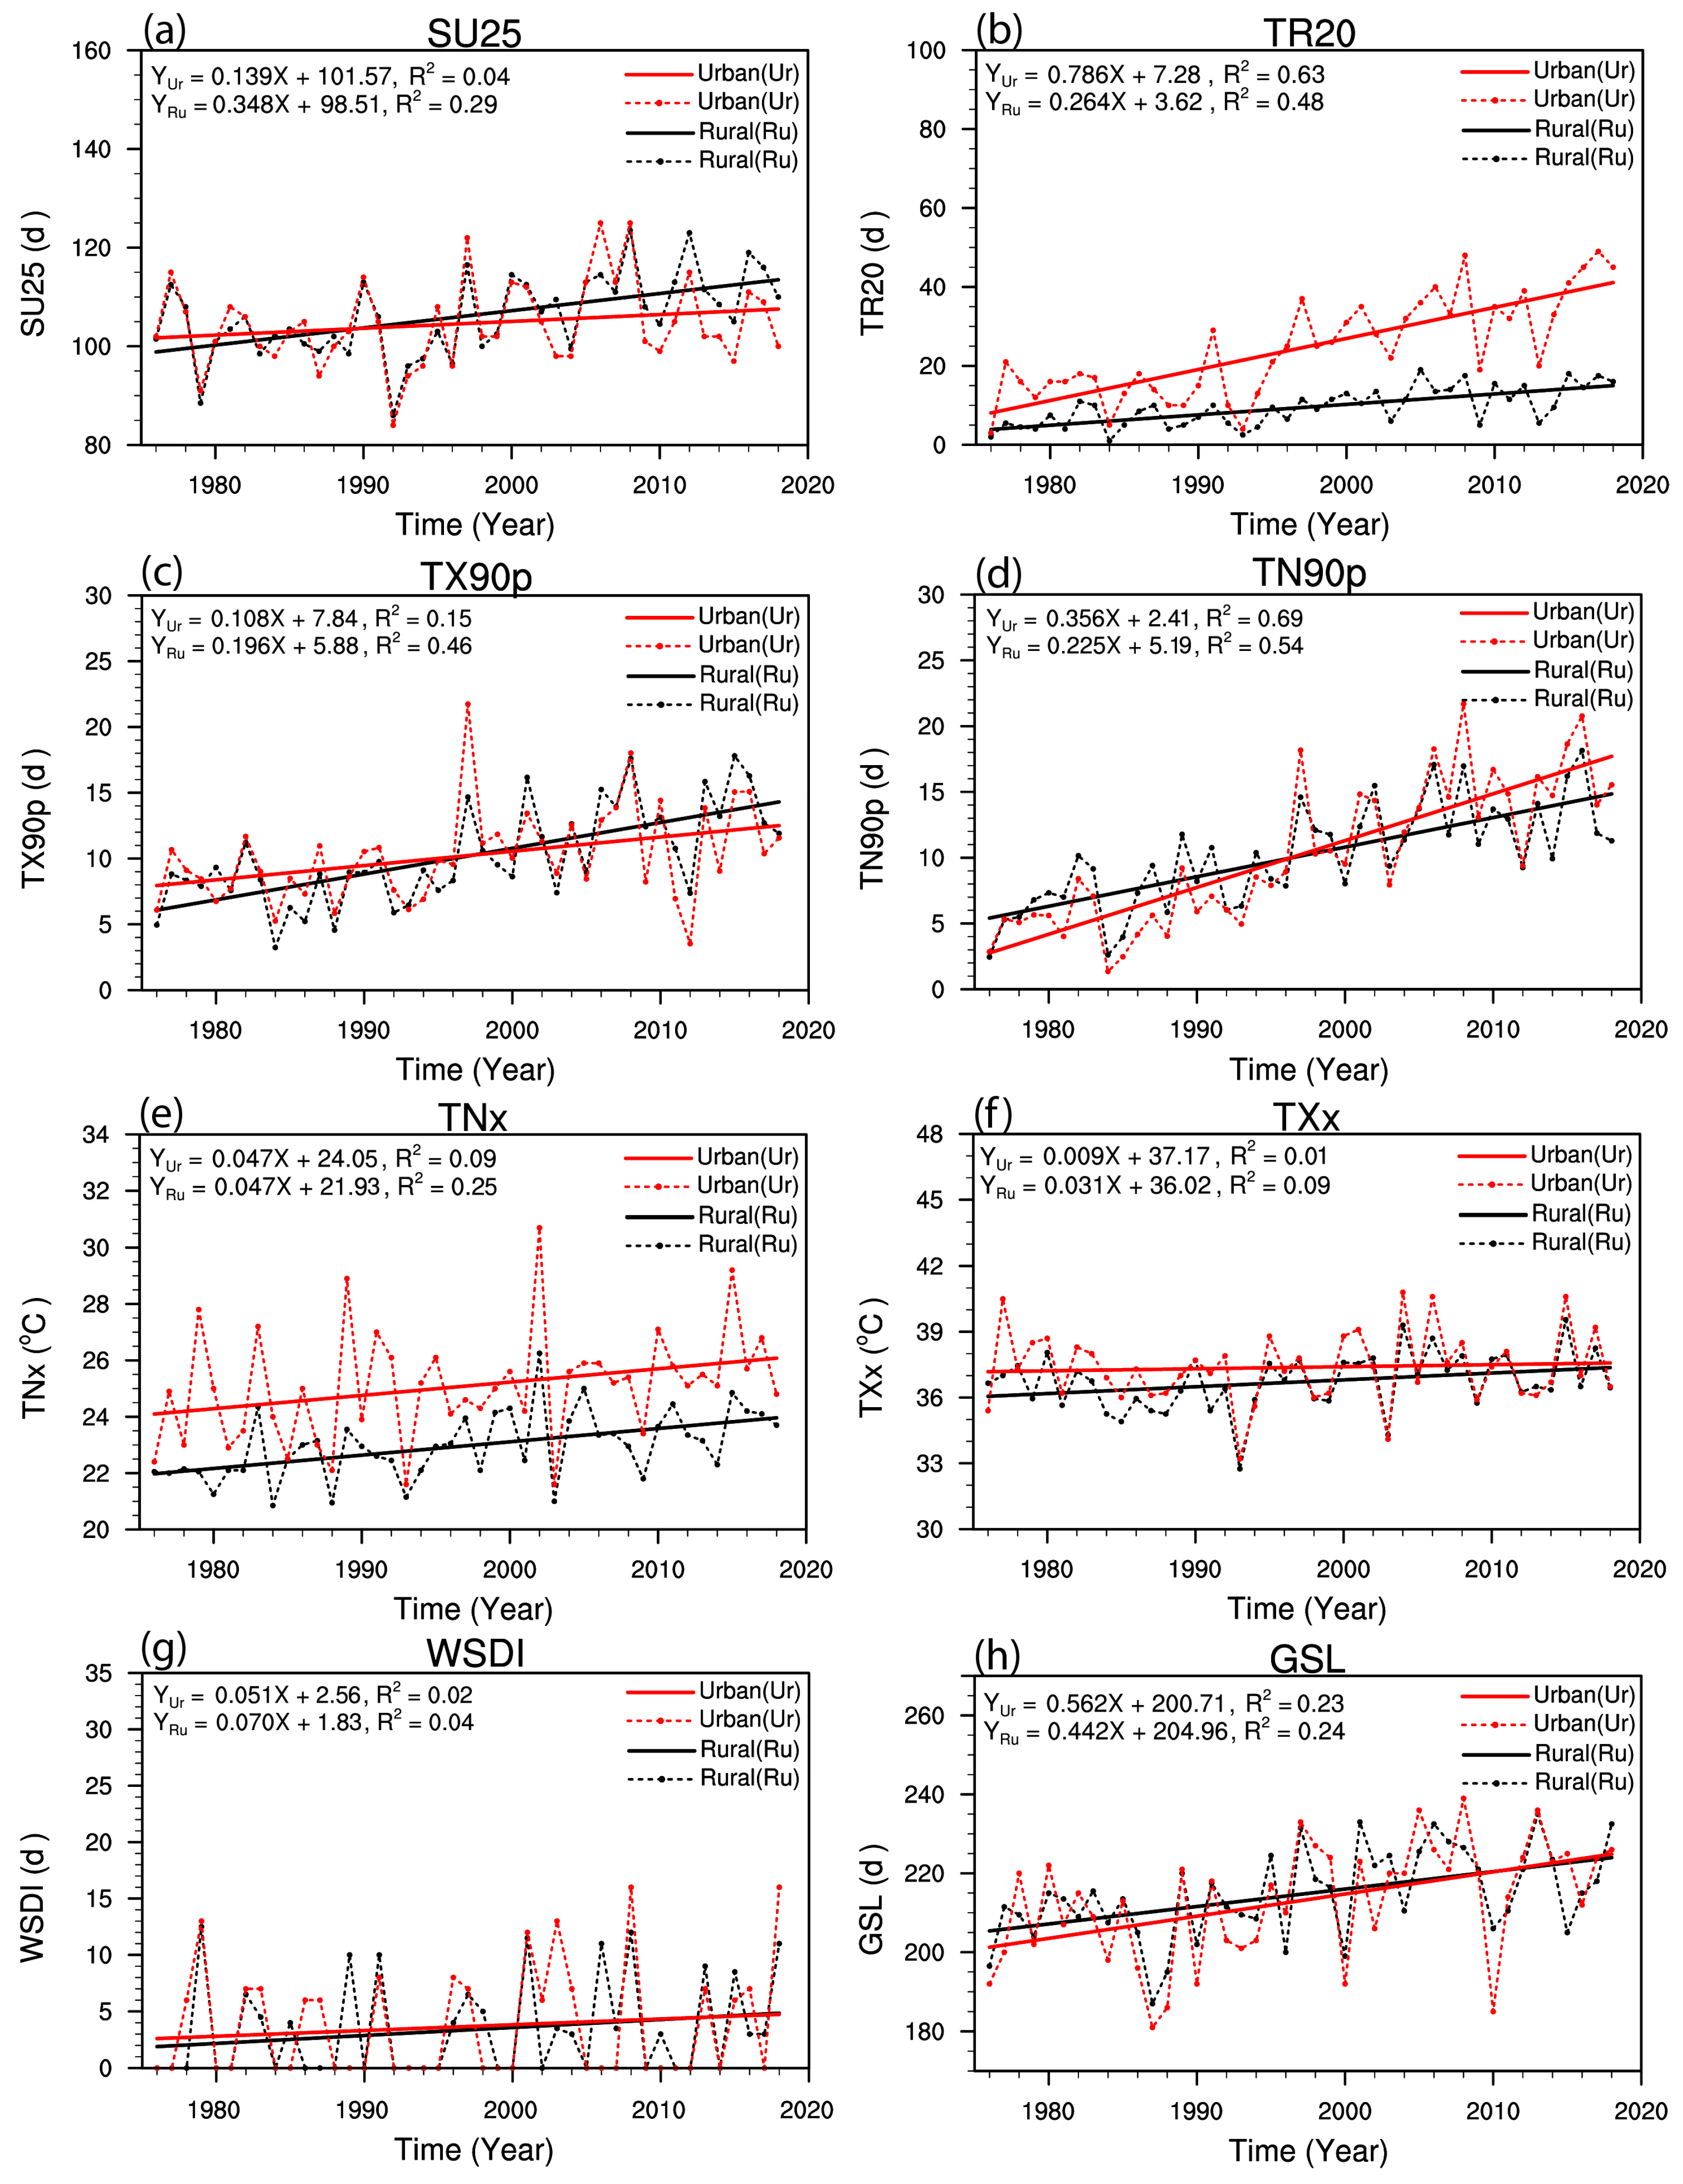
Generally speaking, all the extreme warm climate indices at both the rural and urban stations presented in Figure 3 and Table 4 show increasing trends over the study period. But the trends of the extreme warm indices in the urban and rural stations exhibit obvious differences, especially for the frequency indices (SU25, TR20, TX90p, and TN90p). In particular, SU25 at the urban and rural stations shows increasing trends, with tendencies of 1.39 d/10a and 3.48 d/10a, respectively. The corresponding UE and UC are −2.09 d/10a and 100%. TX90p show a less-negative UE (−0.87 d/10a), but with high UC of 80.62%. TR20 and TN90p reveal positive UEs (5.22 d/10a and 1.31 d/10a, respectively), with relatively lower UCs (66.36% and 36.86%).
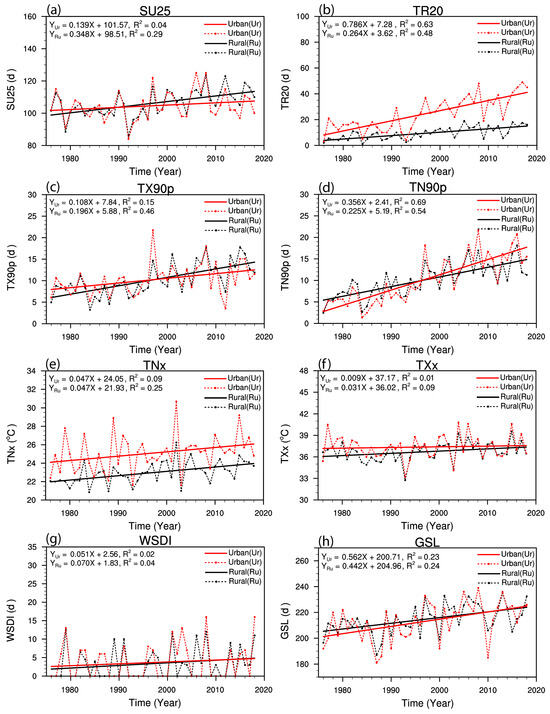
Figure 3.
This is similar to Figure 2, but for the eight extreme warm climate indices, (a–h) indicate the time variations and linear trends of indices SU25, TR20, TX90p, TN90p, TNx, TXx, WSDI, and GSL, respectively.
Table 4.
Urbanization effects and urbanization contributions to the warm climate indices of Urumqi from 1976 to 2018.
For the intensity indices (TNx and TXx), TNx at both the urban and rural stations shows the same increasing trend, at a rate of 0.47 °C/10a; therefore, its UE and UC are 0. TXx at the urban and rural stations reflects increasing trends, with rates of 0.09 °C/10a and 0.31 °C/10a, respectively, giving a UE of −0.22 °C/10a and a 100% UC. For the duration indices (WSDI and GSL), it can be seen that both WSDI and GSL also show increasing trends at both the urban and rural stations, with UEs of −0.19 d/10a and 1.2 d/10a, respectively, along with 38.13% and 21.28% UCs, respectively.
Among these eight warm indices, the UE on TR20 is the highest one (up to 5.22 d/10a). The absolute averaged UE on the warm frequency, intensity, and duration indices are 2.37 d/10a, 0.11 °C/10a, and 0.695 d/10a. The UCs according to the extreme warm indices in Urumqi are ranked in descending order as follows: SU25 = TXx > TX90p > TR20 > WSDI > TN90p > GSL > TNx. Moreover, the UCs of the extreme warm indices can be ranked according to the average value as follows: frequency indices > intensity indices > duration indices. It should be noted that except for SU25 at the urban station and TXx and WSDI at the rural station, all the other extreme warm indices passed the significance level of either 0.05 or 0.01.
In general, most of the frequency indices, except TN90p, show a rather high UC (>66%), while the duration indices show a moderate (<39%) UC. Moreover, the warm indices calculated based on Tmax (SU25, TX90p, TXx, and WSDI) show negative UEs (i.e., the increasing rates of these indices at the urban station are lower than those at the rural station), with a rather high UC (>80%, except WSDI). Indices calculated based on Tmin (TR20 and TN90p) depict a positive UE (i.e., the increasing rates of these indices at the urban station are higher than those at the rural station). Consequently, it can be concluded again based on these warm indices that Urumqi is controlled by the UCI effect during the day and the UHI effect at night.
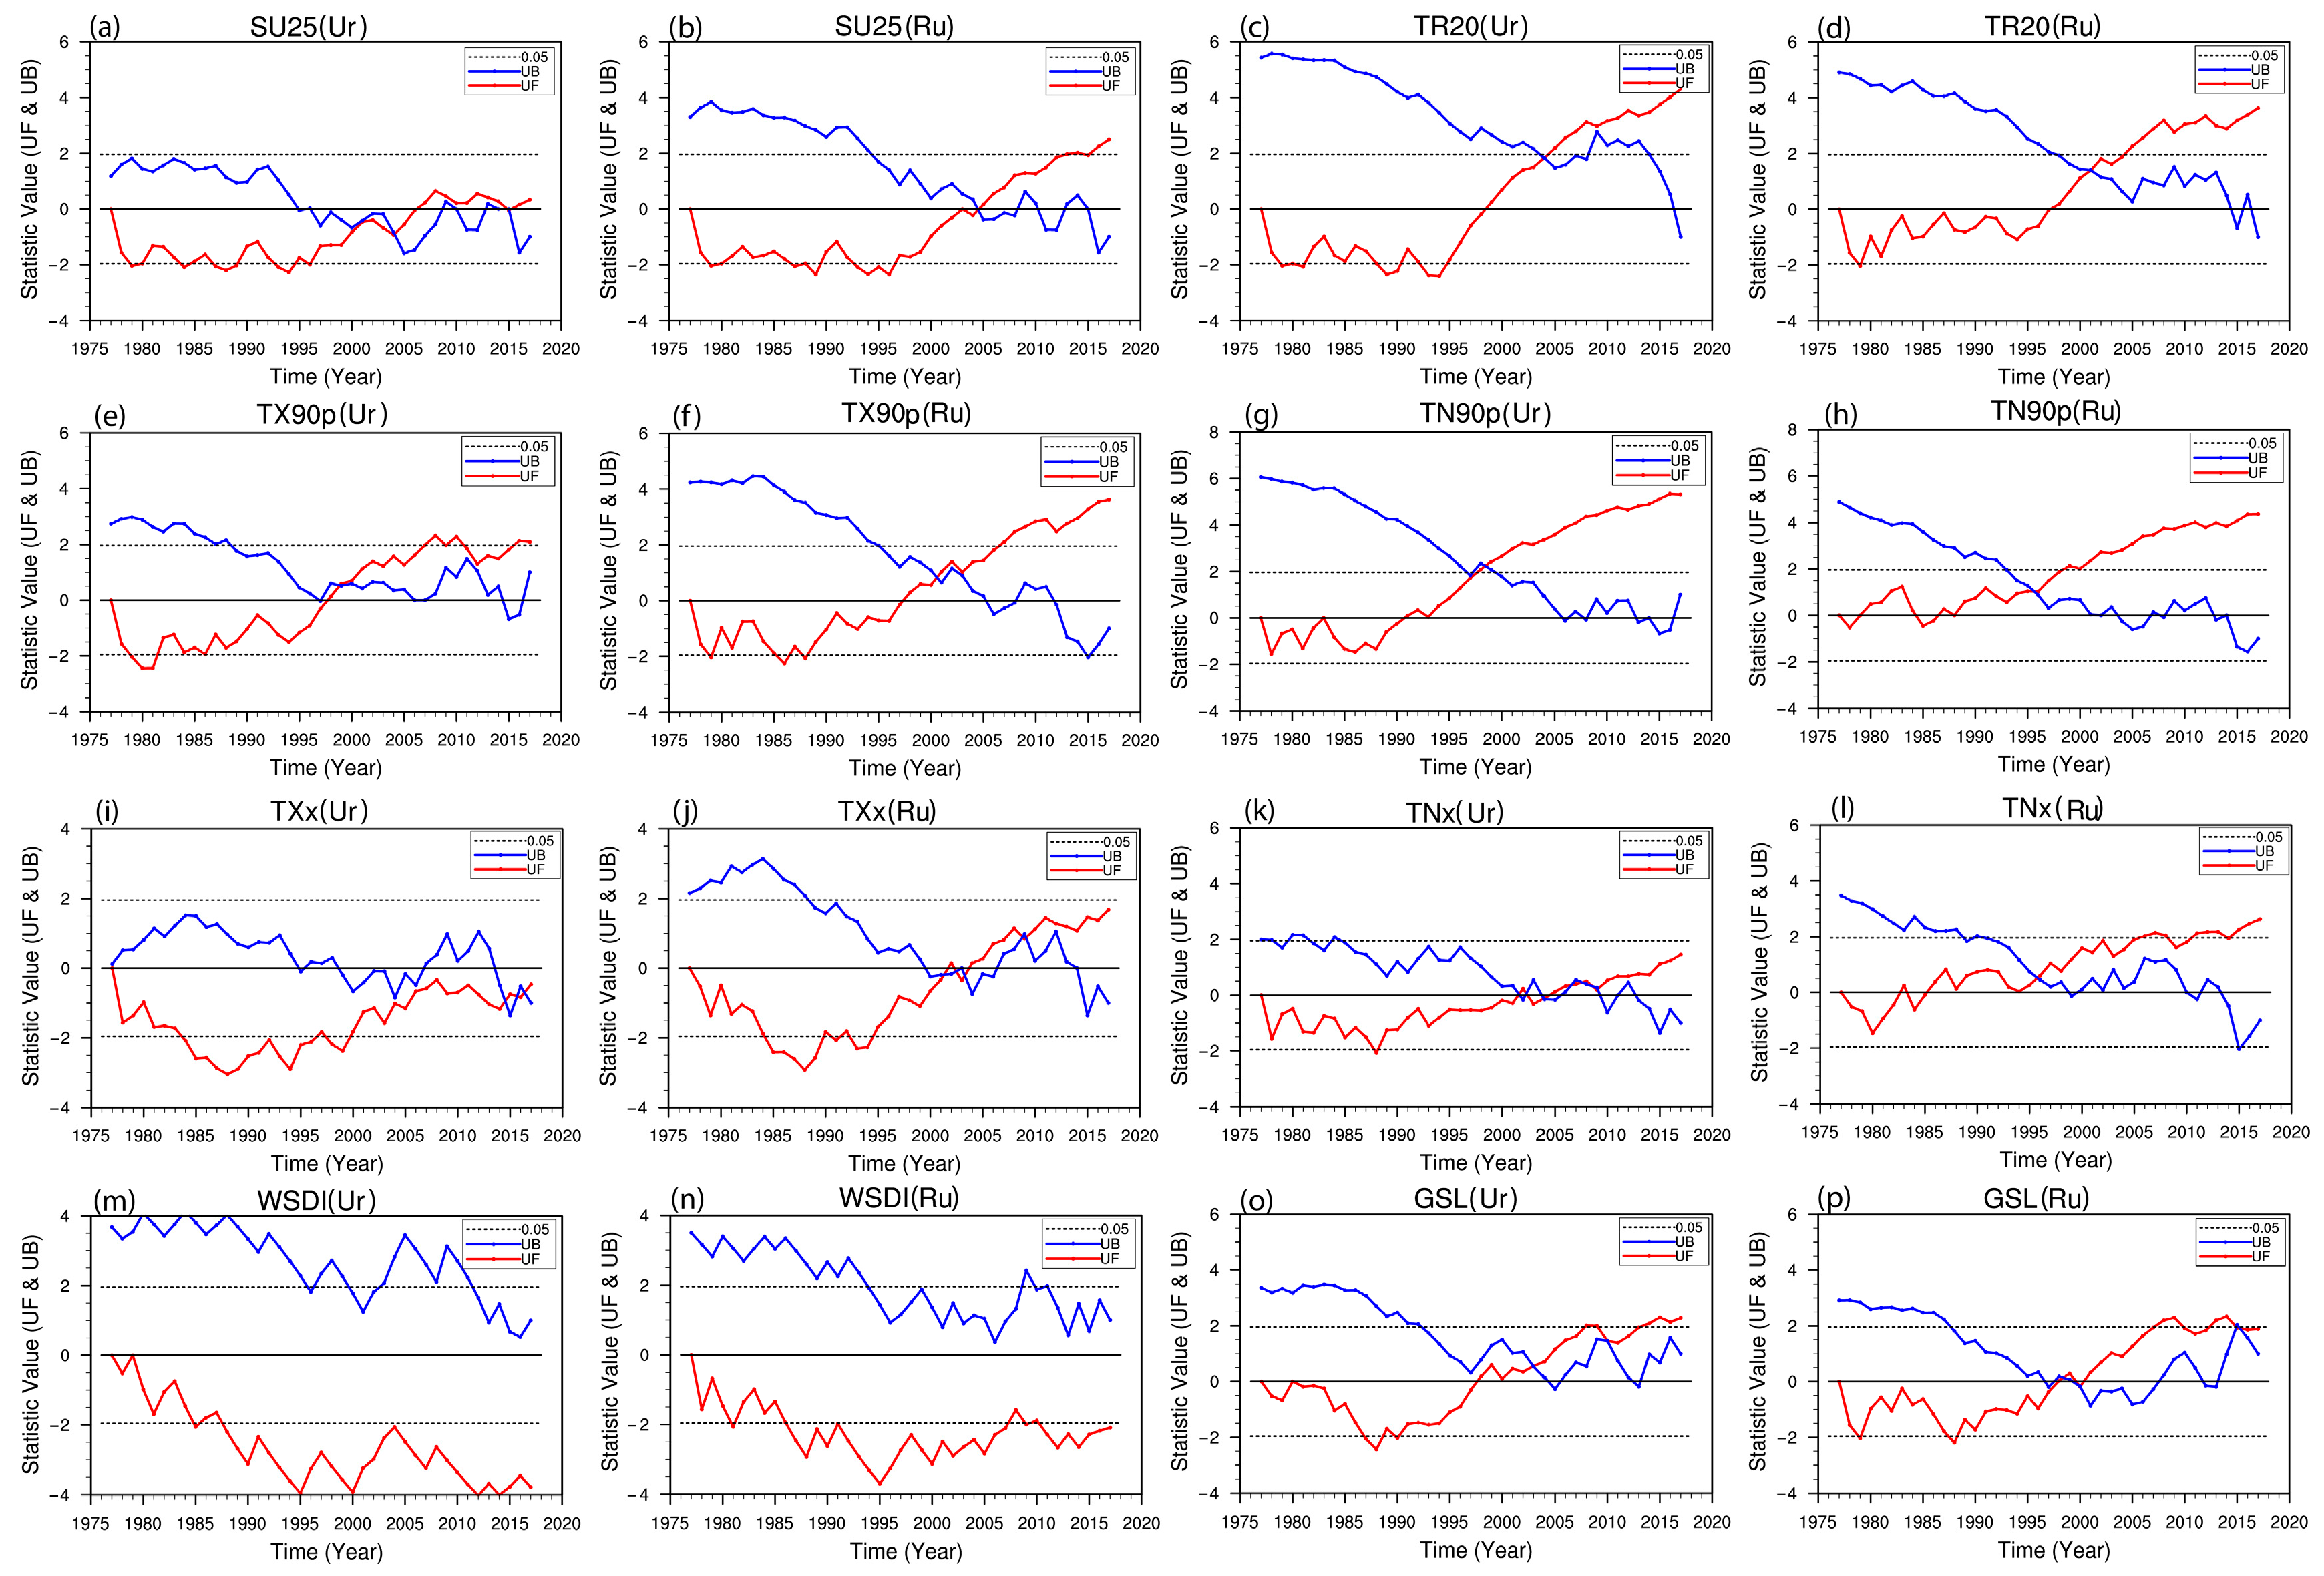
In addition, Mann–Kendall (M-K) tests were conducted to detect abrupt changes (ACs) in the extreme indices at both the urban and rural stations in order to investigate the differences in the timing of ACs in the trends of the indices. Among the M-K test curves, if the value of UFK is greater than 0, it indicates an increasing trend of the corresponding index, and when it is less than 0, it indicates a decreasing trend. If the values of UFK and UBK exceed the confidence level of 0.05, it indicates a significant increasing or decreasing trend. If the UFK curve and UBK curve intersect, the time corresponding to the intersection point between the confidence level of 0.05 is considered as the time when the AC begins. The M-K test results for ACs in extreme climate warm indices at the urban and rural stations from 1976 to 2018 (Figure 4 and Table 5) indicate that all the indices underwent ACs, except for the WSDI. SU25 at the urban (rural) station experienced an AC in 2004 (2005), and the difference in rates after and before the AC was −7.7 d/10a (−2.54 d/10a). Moreover, the rate of decrease in the trend is more significant in the urban station both before and after the AC, and the changing trend after the AC at the urban station is more intense. The AC for TX90p at the urban station occurred 2 years earlier than that in the rural station, and the difference in rates after and before the AC at the urban station is greater than those in the rural station, and the trends after the AC at the urban station is more intense. The timings of the ACs for TR20, TN90p, TNx, and GSL at the urban station were delayed by 3, 2, 6, and 3 years, respectively, compared to those at the rural station. The GSL showed increasing trends both before and after the AC (4.65 d/10a and 0.50 d/10a, respectively) at the rural station, while exhibiting an increasing trend (4.36 d/10) before the AC and a decreasing trend (−1.34 d/10) after the AC at the other station. The AC for TR20 at the urban (rural) station occurred in 2004 (2001), and both the urban and rural stations showed significant ascending trends after the AC. Moreover, the AC for TX90p at the urban (rural) station occurred in 1999 (2001), and there has been a significant increase in TX90p at the rural station since 2006. The AC for TN90p at the urban (rural) station occurred in 1998 (1996), and there was an overall significant ascending trend after the AC, and the AC for TNx at the urban (rural) station occurred in 2002 (1996). For the TXx, there was no significant AC at the urban station, but the data showed an AC at rural station in 2002.
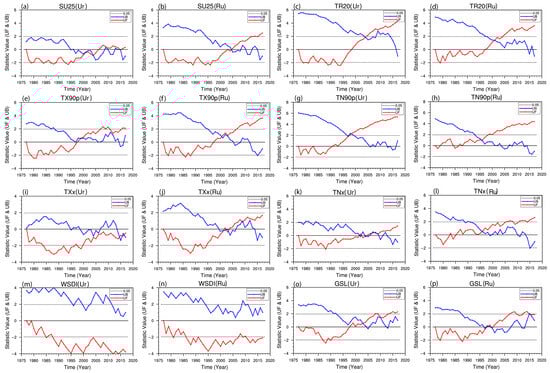
Figure 4.
The M-K test of the extreme warm climate indices in both urban (Ur) and rural (Ru) stations during 1976–2018. Panels (a–p) show the variations indices SU25(Ur), SU25(Ru), TR20(Ur), TR20(Ru), TX90p(Ur), TX90p(Ru), TN90p(Ur), TN90p(Ru), TNx(Ur), TNx(Ru), TXx(Ur), TXx(Ru), WSDI(Ur), WSDI(Ru), GSL(Ur), GSL(Ru) respectively.
Table 5.
Comparison of the timing of abrupt changes (ACs) in the trends of warm climate indices at urban and rural stations based on the M-K test and related characteristics before and after the ACs. The difference in average value indicates the averaged value of an index after the AC minus the averaged value of the index before the AC. The symbol “-“ indicates that there is no AC and corresponding value.
3.3. Urbanization Effects on Extreme Cold Climate Indices and Diurnal Temperature Range
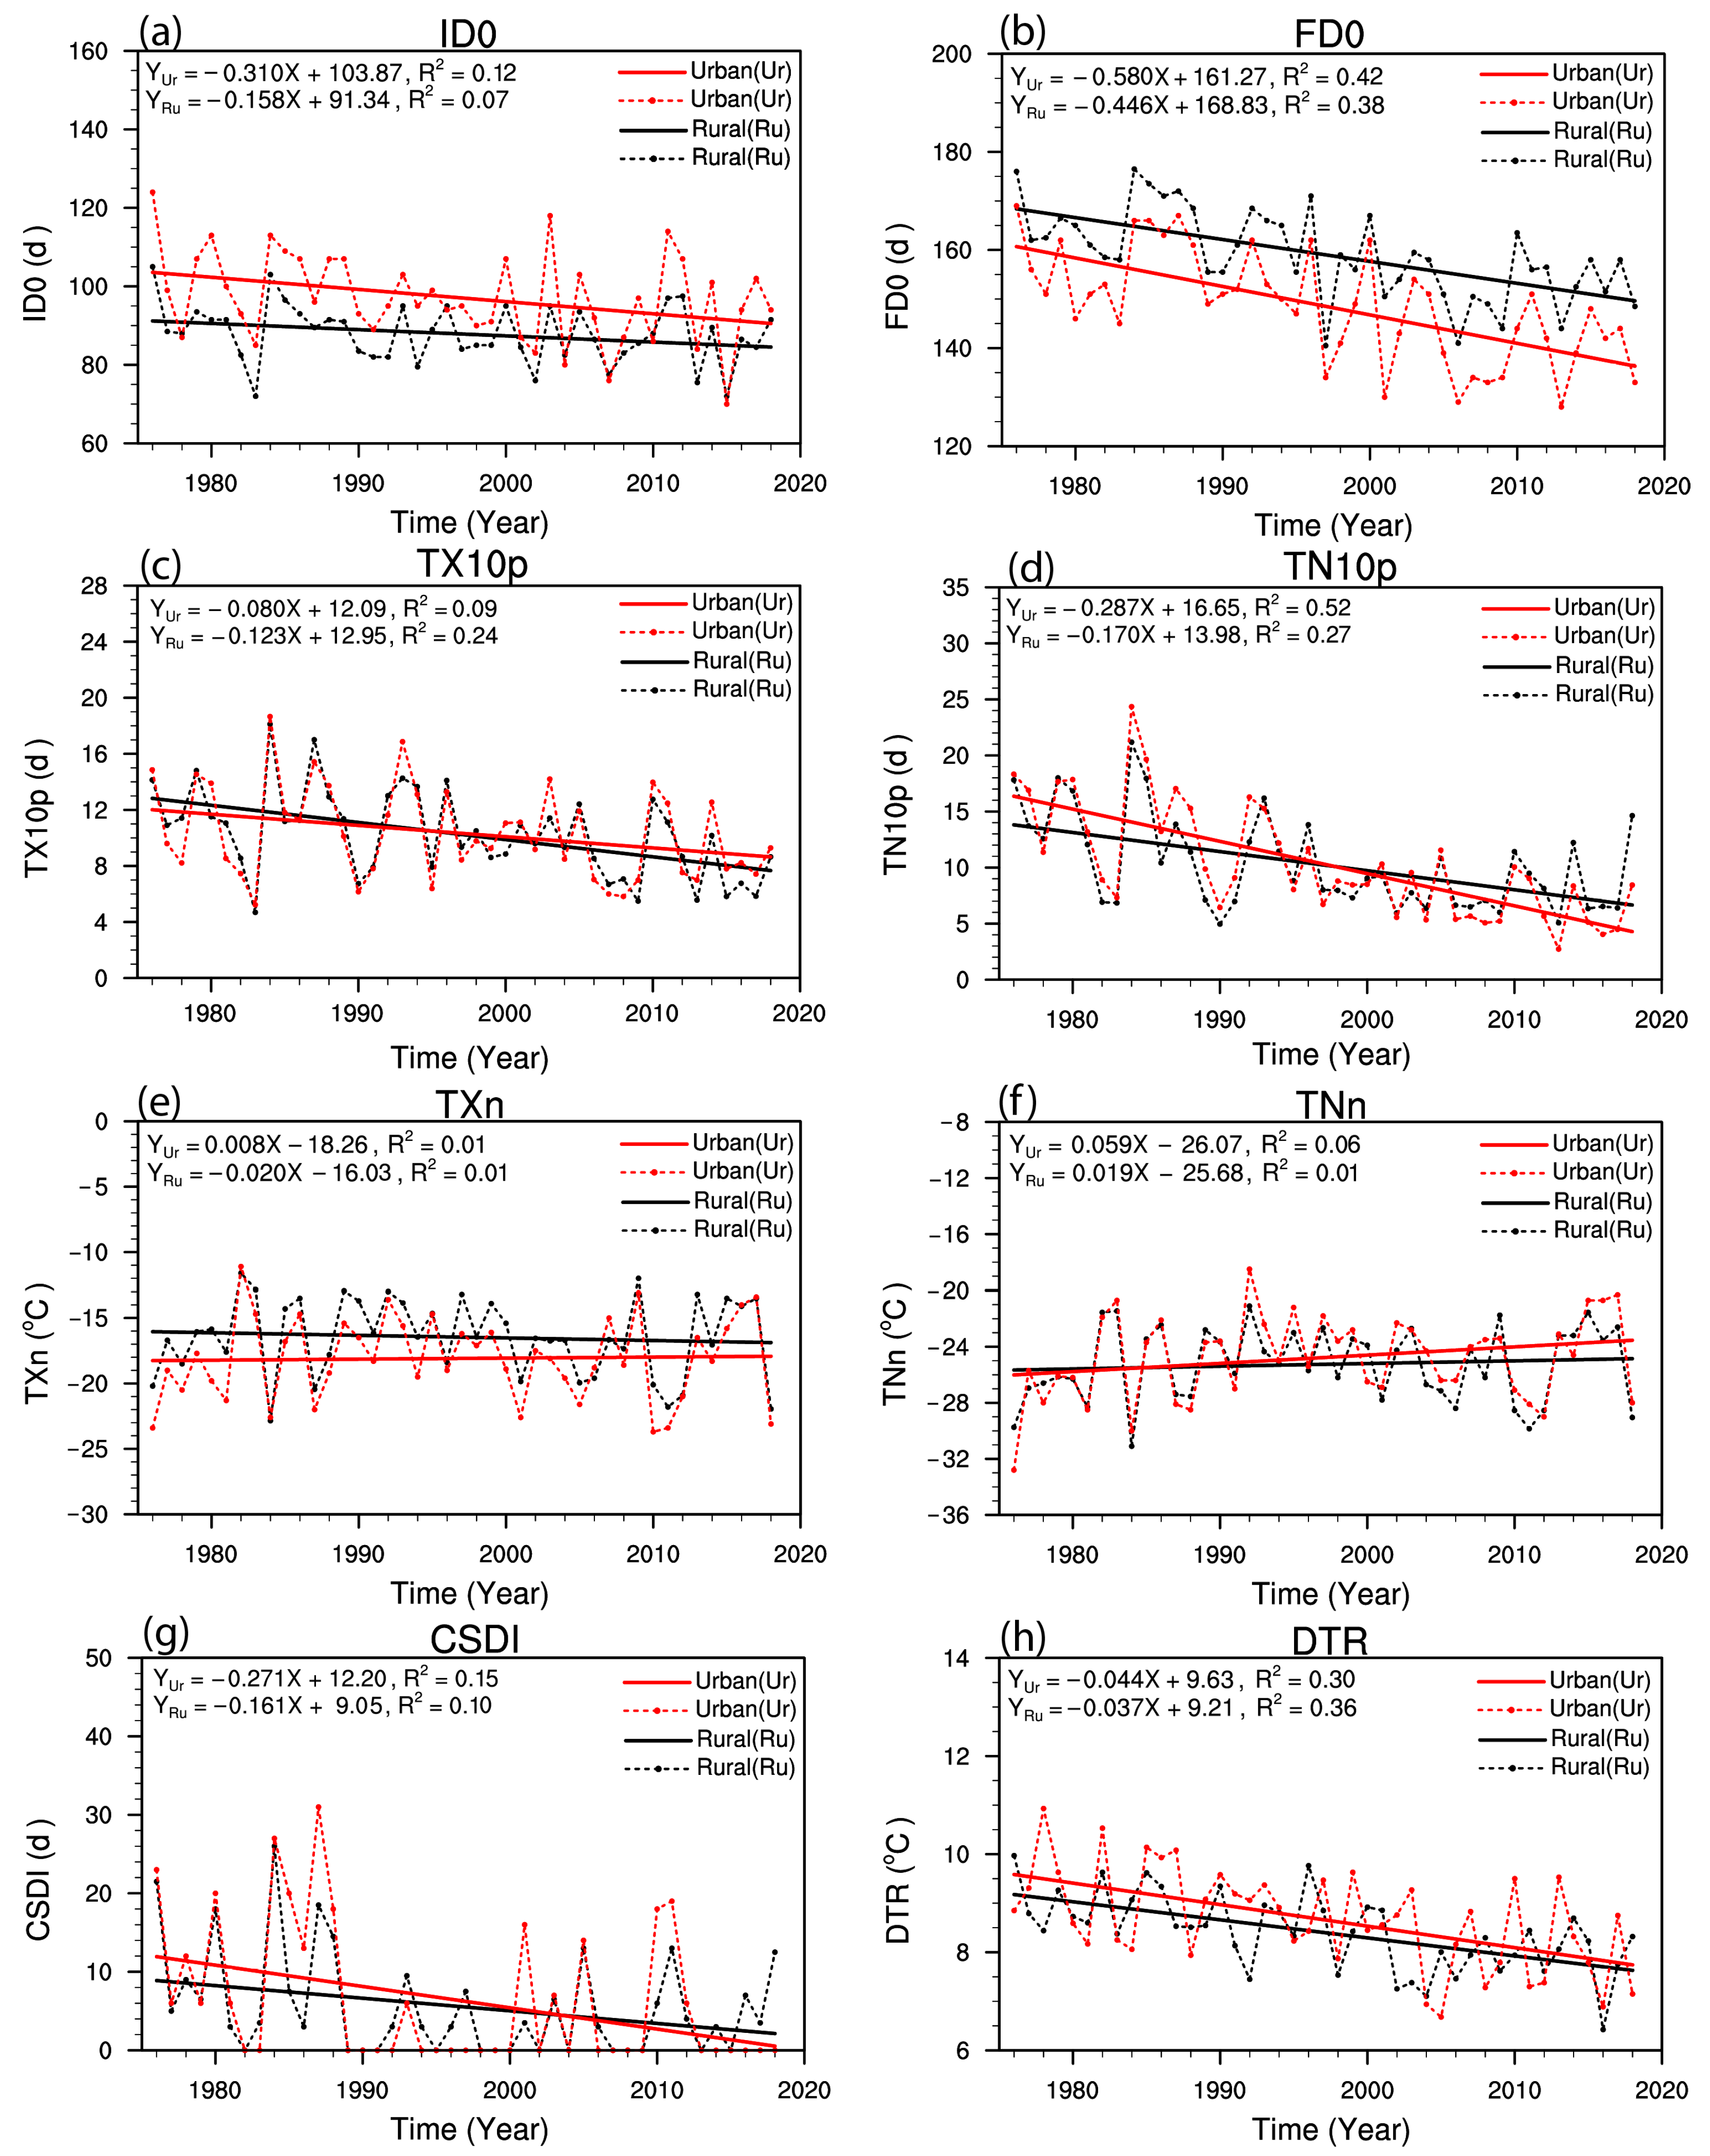
As presented in Figure 5 and Table 6, the time variations and linear trends of the cold extreme climate indices and diurnal temperature range (DTR) in Urumqi show significant differences for the extreme cold indices between the urban and rural areas. Specifically, for the frequency indices (ID0, FD0, TX10p, and TN10p), it can be seen that ID0 at the urban and rural stations tends to decrease at the rates of −3.1 d/10a and −1.58 d/10a, respectively, and the corresponding UE and UC are −1.52 d/10a and 48.95%. FD0 and TN10p also show almost similar negative UEs (−1.33 d/10a and −1.17 d/10a, respectively) and relatively lower UCs (23.02% and 40.78%). However, TX10p reveals a positive UE (0.43 d/10a) with a relatively higher UC (52.95%). For the intensity indices, both TXn and TNn indicate positive UEs (0.28 °C/10a and 0.4 °C/10a, respectively) with rather high UCs (100% and 67.34%, respectively). The CSDI at the urban (rural) station shows a decreasing trend with a rate of −2.71 d/10a (−1.61 d/10a), with an UE and UC of −1.10 d/10a and 40.82%, respectively.
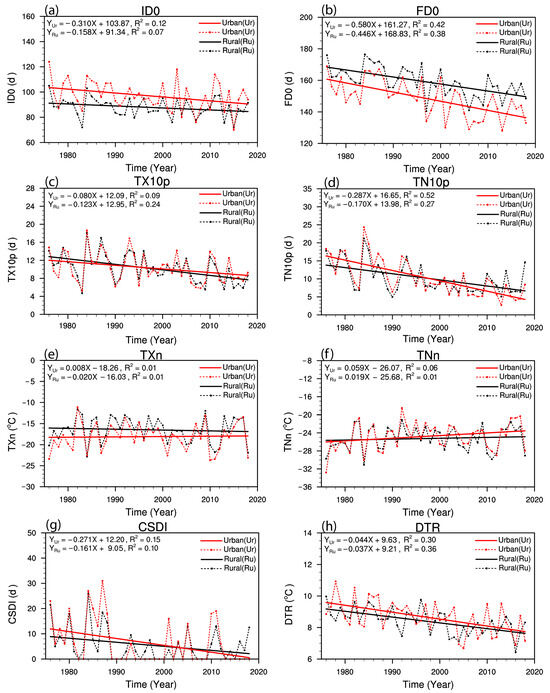
Figure 5.
Similar to Figure 2, but for 7 extreme cold climate indices and the diurnal temperature range. Panels (a–h) indicate the time variations and linear trends of indices ID0, FD0, TX10p, TN10p, TXn, TNn, CSDI and DTR, respectively.
Table 6.
Urbanization effect and urbanization contribution to the extreme cold climate indices and DTR of Urumqi from 1976 to 2018.
The DTR in Xinjiang is relatively high in comparison to that in eastern China [56], and the DTR is an index that has a large impact on the health of urban residents [35]. It was found that the DTR in the urban and rural stations of Urumqi exhibits decreasing trends, with rates of −0.44 °C/10a and −0.37 °C/10a, respectively. The UE on the DTR is negative (−0.07 °C/10a), which is consistent with the previous findings that the UCI in the day and the UHI at night lead to a decrease in the DTR.
Unlike the characteristics of extreme warm climate indices analyzed above, most of the extreme cold climate indices calculated based on Tmax (TX10p and TXn) show a positive UE, while the extreme cold indices calculated based on Tmin (FD0, TN10p, and CSDI) and the DTR exhibit a negative UE (except for the TNn). These findings largely confirms that the UCI effect dominates during the day, while the UHI effect dominates at night in Urumqi. The absolute averaged UEs on the cold frequency, intensity, and duration indices are 1.11 d/10a, 0.34 °C/10a, and 0.585 d/10a. The ranking orders of the UCs for the above indices are TXn > TNn > TX10p > ID0 > CSDI > TN10p > FD0 > DTR. In general, most of the extreme cold indices (except for the TXn and TNn) have decreased in both the urban and rural stations, and for most of the cold indices (except for the ID0 and CSDI), urbanization causes a faster decrease in the urban areas.
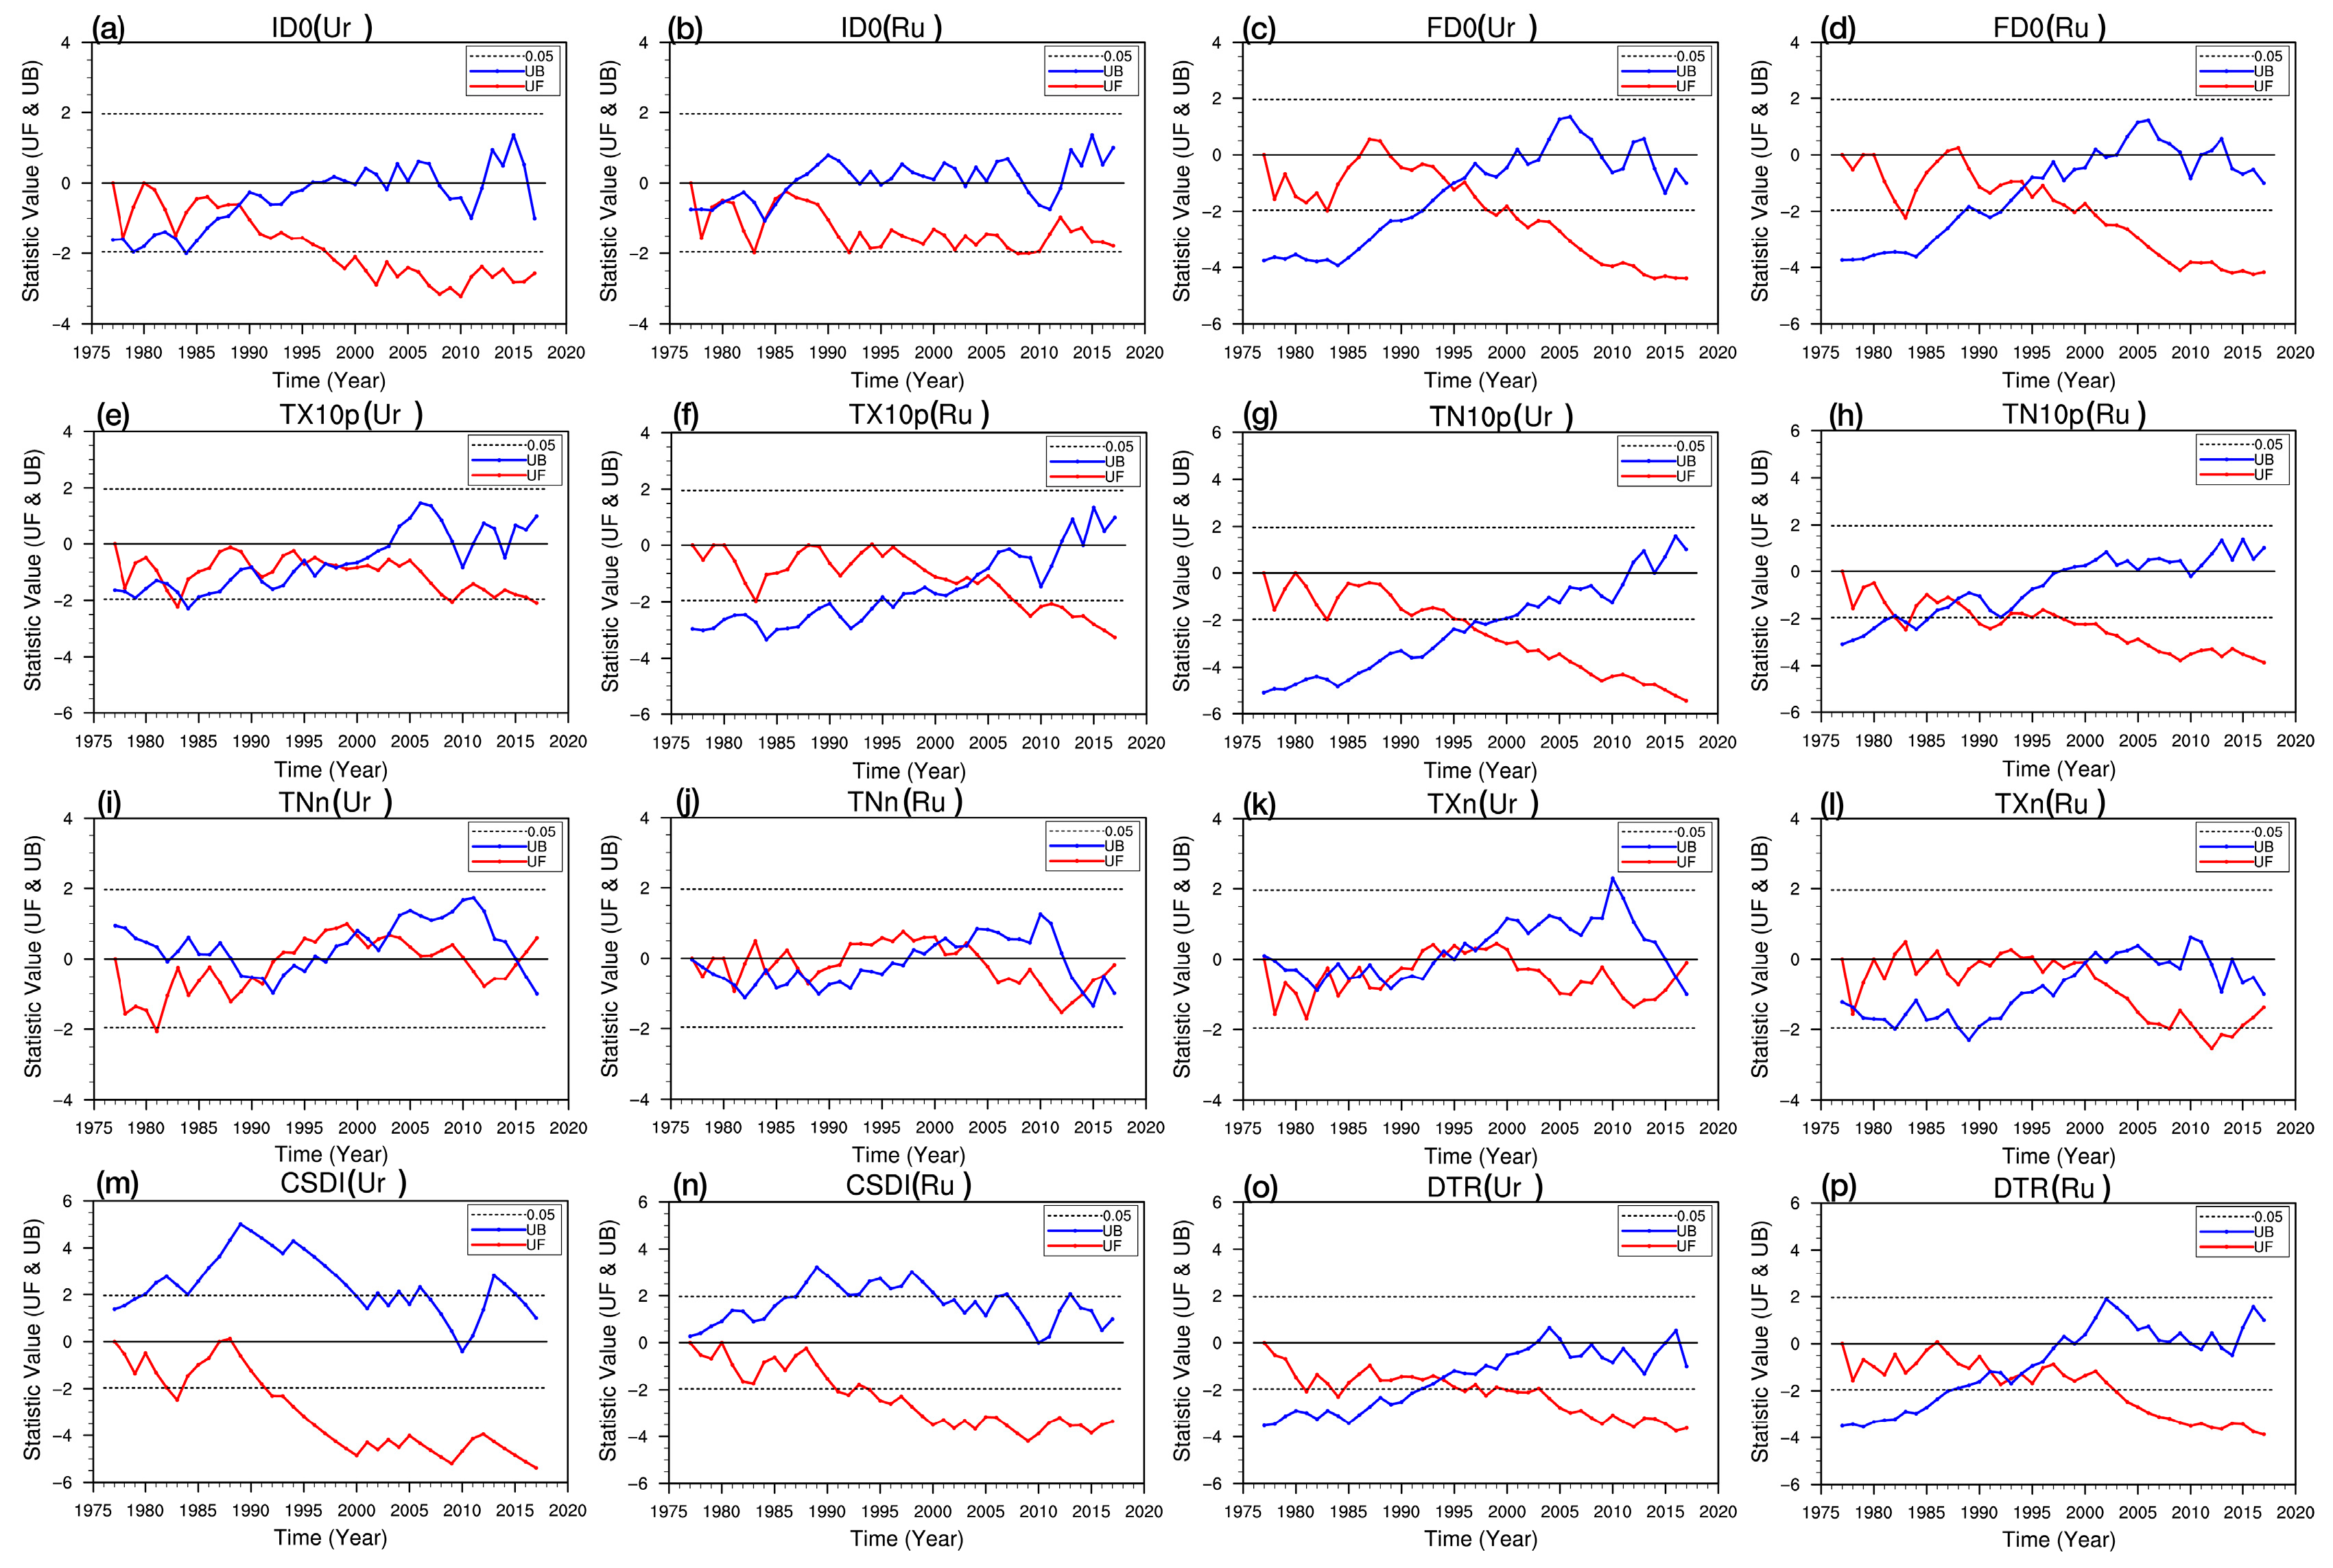
The M-K test results for ACs in extreme cold climate indices at the urban and rural stations from 1976 to 2018 (Figure 6 and Table 7) show that all the indices underwent ACs, except for the CSDI. The ID0 experienced an AC (in 1989) only at the urban station, with rates of −2.53 d/10a and −1.44 d/10a, respectively, before and after the AC, but no AC occurred at the rural station. The ACs for FD0 and TNn at urban station occurred 1 and 3 years later, respectively, than those at the rural station, while the ACs for other cold indices at urban station occurred earlier than those at the rural station. FD0 in the urban (rural) station experienced an AC in 1995, with a difference in rates after and before the AC of −2.60 d/10a (−1.66 d/10a), showing a significant decreasing trend. The AC for TX10p at the urban (rural) station occurred in 1997 (2003), and the difference in rates after and before the AC of TX10p at urban (rural) was −0.64 d/10a (−1.32d/10a). The timing of the AC for TXn at the urban station was advanced by 4 years, and the difference in rates after and before the AC at the urban station is greater than that in the rural station, and the trend at the urban station after the AC was more intense. The AC for the DTR at both the urban and rural stations occurred in 1994, but the difference in rates after and before the AC at the urban (rural) station was 0.30 d/10a (0.09 d/10a), and the increasing trend of the DTR after the AC at the urban station was more dramatic.
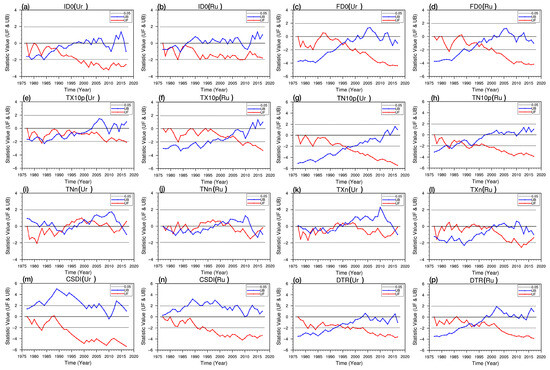
Figure 6.
Similar to Figure 4, but for the eight extreme cold climate indices. Panels (a–p) indicate the variations of indices ID0(Ur), ID0(Ru), FD0(Ur), FD0(Ru), TX10p(Ur), TX10p(Ru), TN10p(Ur), TN10p(Ru), TXn(Ur), TXn(Ru), TNn(Ur), TNn(Ru), CSDI(Ur), CSDI(Ru), DTR(Ur), DTR(Ru), respectively.
Table 7.
Comparison of the timing of abrupt changes (ACs) in the trends of cold climate indices at urban and rural stations based on the M-K test and related characteristics before and after the ACs. The difference in average value indicates the averaged value of an index after the AC minus the averaged value of the index before the AC. The symbol “-“ indicates that there is no AC and corresponding value.
3.4. Urbanization Effects on Extreme Precipitation Indices
The UE on regional precipitation is of great interest [4,5,22]. Urbanization affects the formation, timing, duration, and phase of precipitation by changing the roughness of the subsurface and through UHI circulation [57]. Lin et al. [58] found urbanization to have a negative impact on extreme precipitation in coastal areas of China, while it has a positive impact on extreme precipitation events in inland cities. However, the UEs on precipitation in arid regions have seldom been explored, and the effects could be different from humid regions due to the differences in evapotranspiration and convective efficiencies [59].
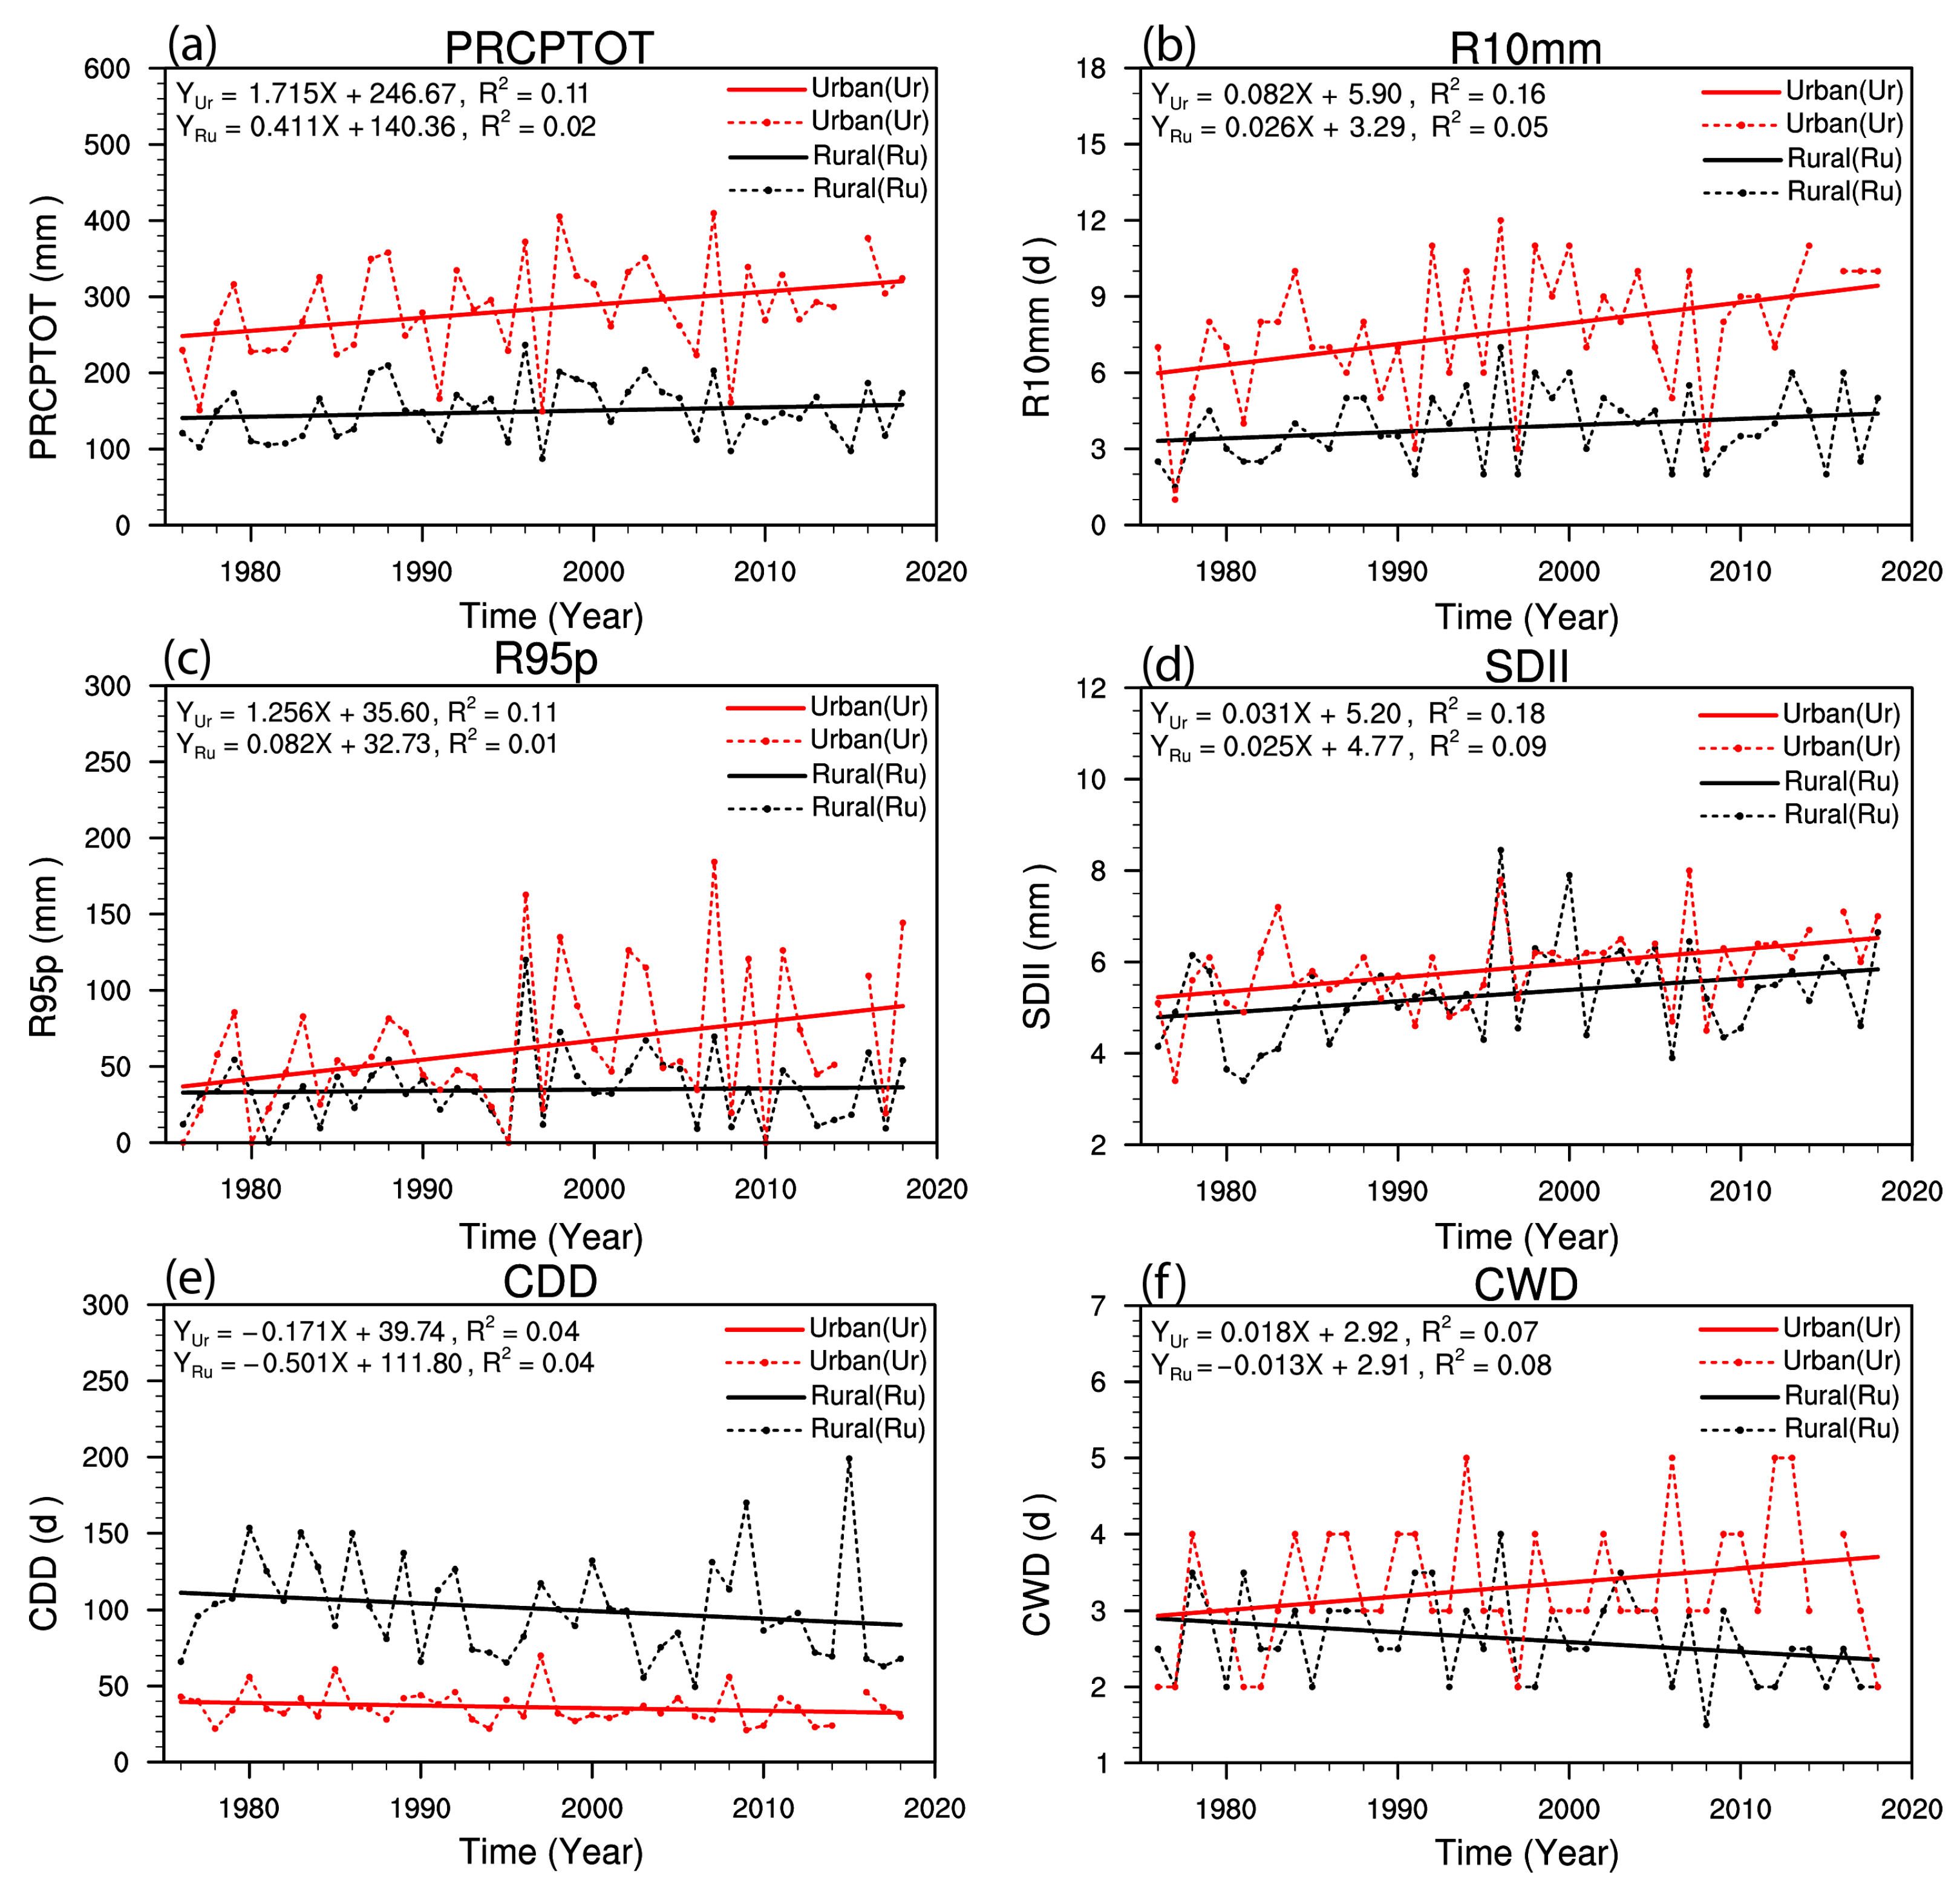
As shown in Figure 7 and Table 8 below, for the major intensity indices, such as PRCPTOT and R95p, their UEs are rather high (reaching 13.04 mm/10a and 11.74 mm/10a, respectively), along with the UC (76.01% and 93.45%). However, the SDII only shows a very low UE (0.06 mm/10a) and UC (19.15%). R10mm, as the only frequency index for precipitation, reflects a UE of 0.56 d/10a and a relatively high UC (68.79%). For the duration indices, the CDD at the urban and rural stations declines at respective rates of −1.71 d/10a and −5.01 d/10a, with a 3.3 d/10a UE and a 100% UC. Moreover, the number of CDDs in the urban station is significantly lower (about 20 ~70 days) than those in the rural station, whereas the number of CWDs at the urban (rural) station increases (decreases) at the rate of 0.18 d/10a (−0.13 d/10a), resulting in a rather low UE (0.31 d/10a), but a high UC (100%). The absolute averaged UEs on the precipitation frequency, intensity, and duration indices are 8.27 mm/10a, 0.56 d/10a, and 1.805 d/10a. The UCs for each index are ranked from the highest to lowest values as CDD = CWD > R95pd > PRCPTOT > R10mm > SDII. The contribution of urbanization to the extreme precipitation indices ranked according to the mean value is duration indices > frequency indices > intensity indices.
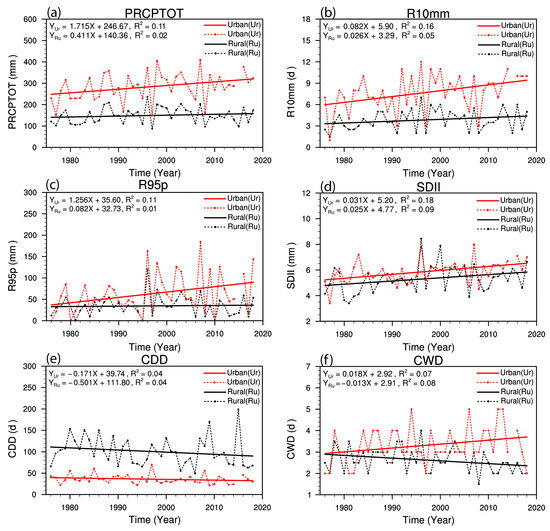
Figure 7.
(a–f) Similar to Figure 2, but for extreme precipitation indices of Urumqi during 1976–2018. Panels (a–f) indicate the variations of indices PRCPTOT, R10mm, R95p, SDII, CDD and CWD, respectively.
Table 8.
Urbanization effect and urbanization contribution to extreme precipitation indices of Urumqi from 1976 to 2018.
In general, urbanization has an effect on the intensity, frequency, and duration of extreme precipitation to some extent. Based on the temporal trends of extreme precipitation indices, it was found that urbanization probably exacerbates the degree of “wetting” in the overall “warming and wetting” trend [60,61,62,63] of the climate in the region, which means that urbanization probably increases local precipitation and alleviates droughts to some extent. However, the driving factors and generation mechanisms of precipitation are very complex. Oke [57] has also shown that the urban–rural difference depends critically on the choice of rural station. This means that different rural reference stations may lead to different research results to some extent.
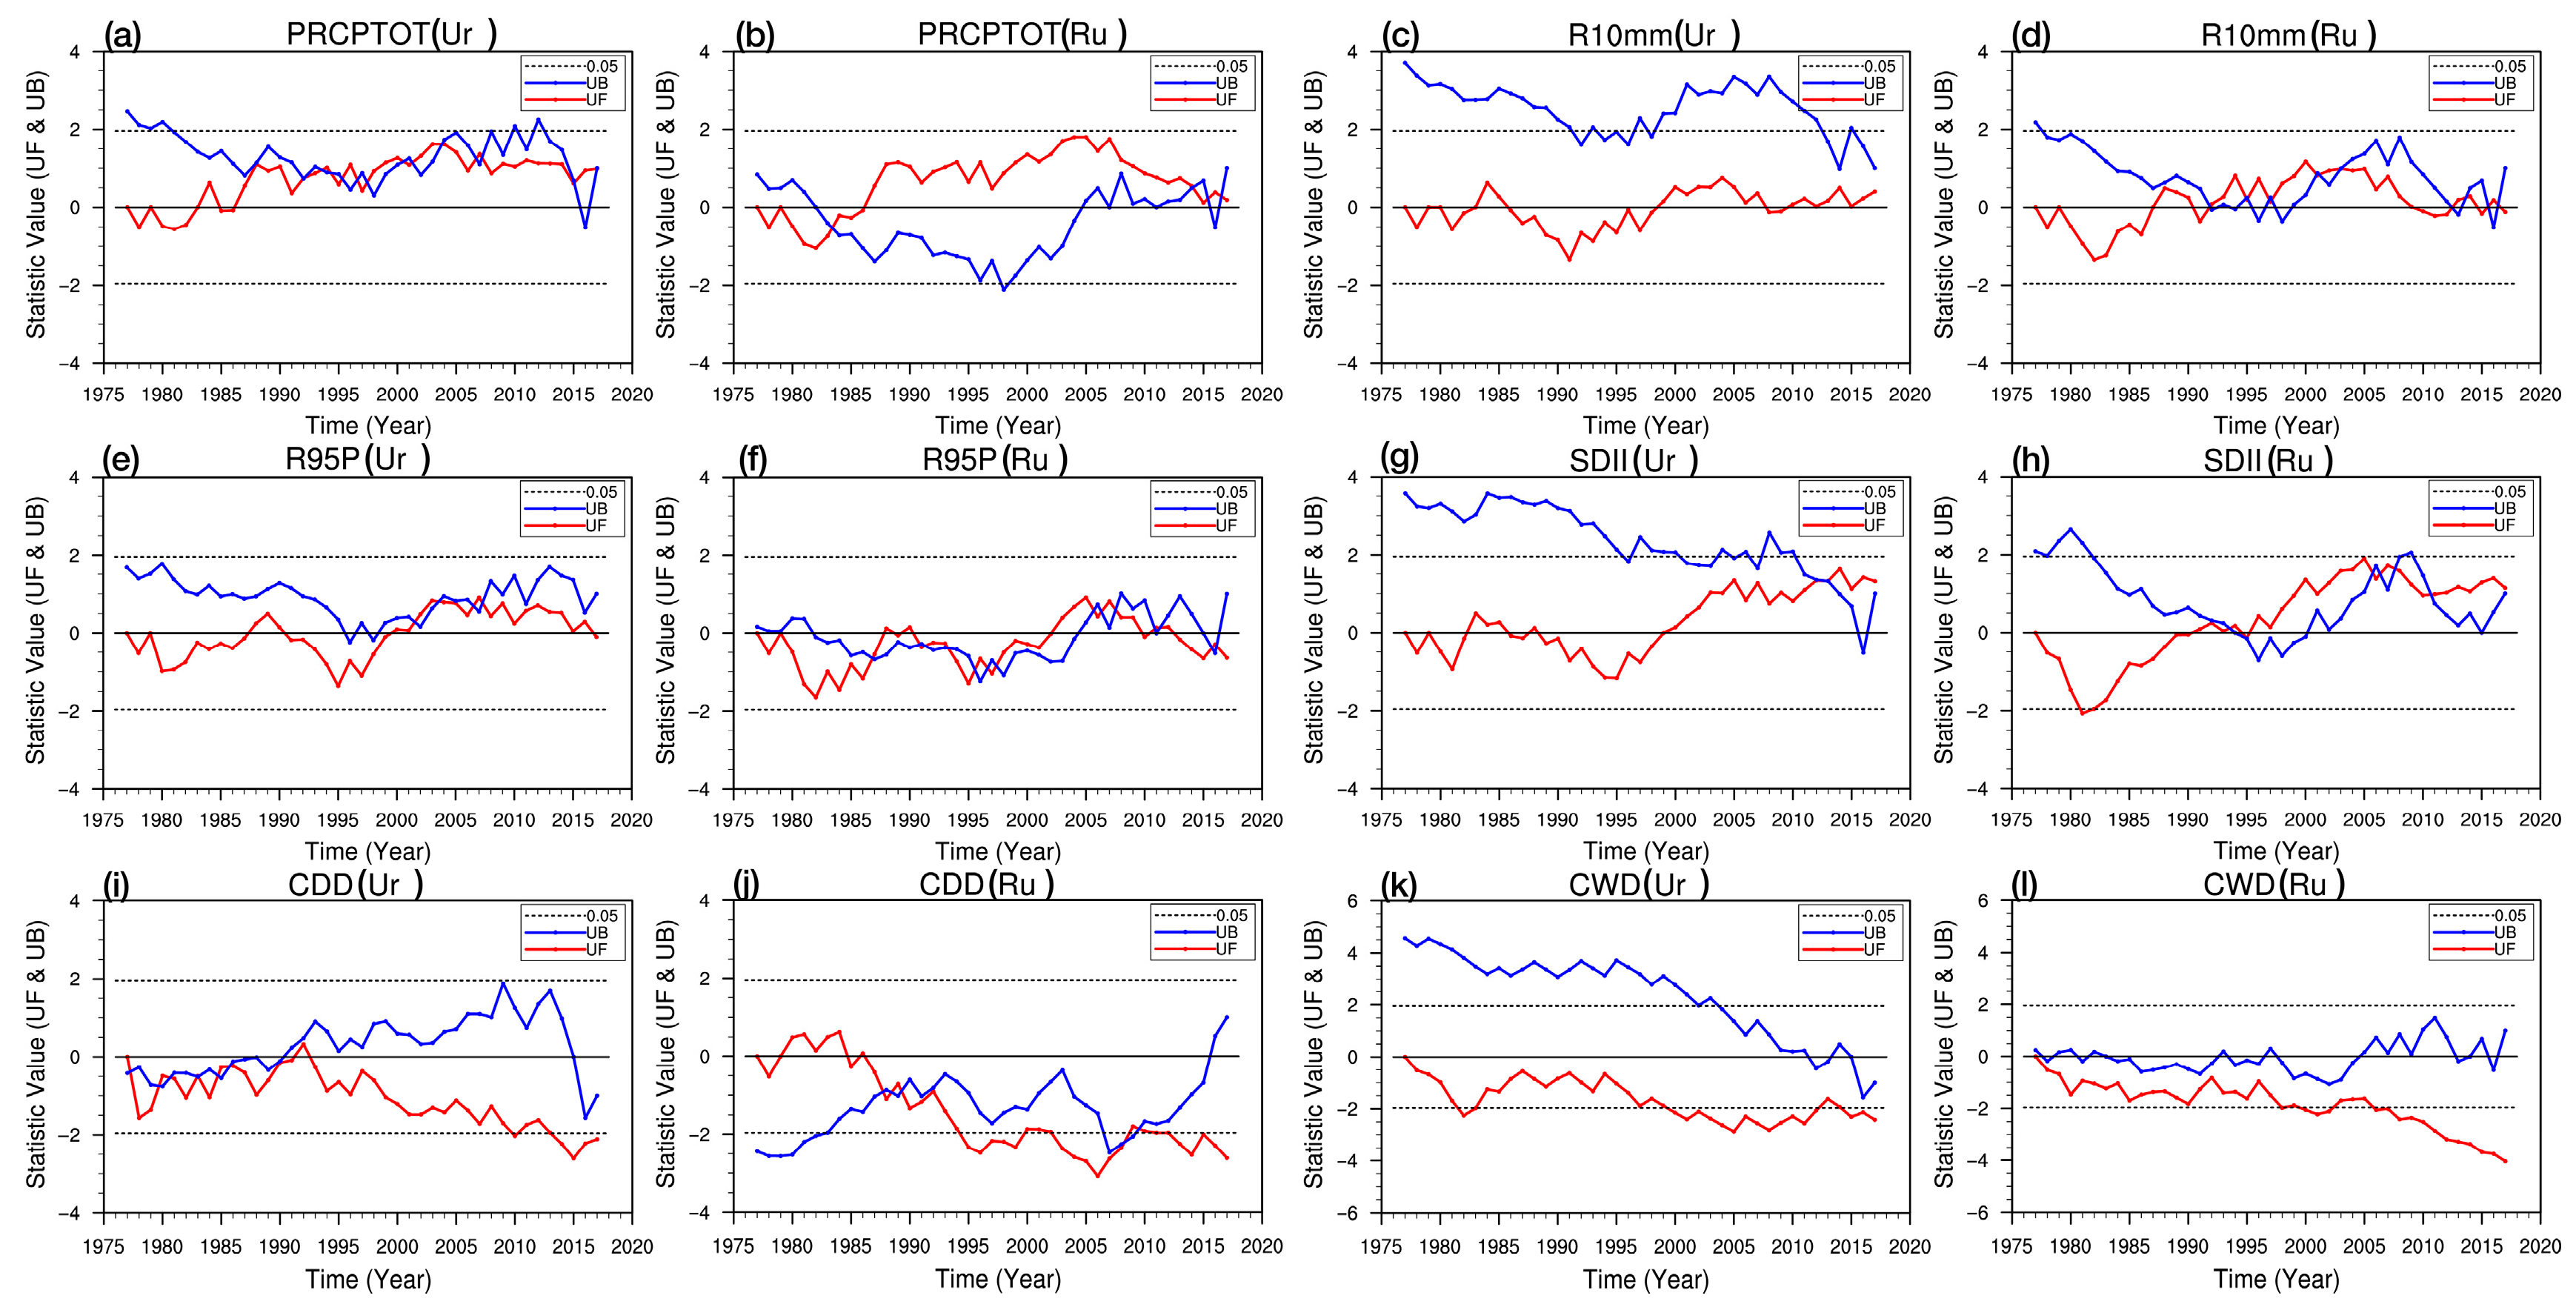
The M-K test results for ACs in extreme precipitation indices at the urban and rural stations from 1976 to 2018 (Figure 8 and Table 9) exhibited that only the SDII experienced an AC at both the urban and rural stations (in 2013 and 1994, respectively), with differences in the rates after and before the AC of 0.58 d/10a and −0.60 d/10a, respectively, but no significant increasing trend was found after the AC. In addition, PRCPTOT only underwent an AC in the rural station in 1983, with a difference in the rates after and before the AC of 23.71 mm/10a. Similarly, the CDD only underwent an AC at the rural station in 1989, with a difference in rates after and before the AC of −13.87 d/10a. These two indices did not show a significant AC at the urban station. The other three precipitation indices (R10mm, R95p, and CWD) did not show significant ACs at both the urban and rural stations.
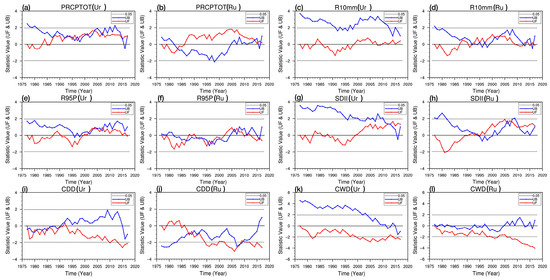
Figure 8.
Similar to Figure 4, but for the six extreme precipitation indices. Panels (a–l) indicate the variations of indices PRCPTOT(Ur), PRCPTOT(Ru), R10mm(Ur), R10mm(Ru), R95p(Ur), R95p(Ru), SDII(Ur), SDII(Ru), CDD(Ur), CDD(Ru), CWD(Ur), CWD(Ru), respectively.
Table 9.
Comparison of the timings of abrupt changes (ACs) in the trends of extreme precipitation indices at urban and rural stations based on the M-K test and related characteristics before and after the ACs. The difference in average value indicates the averaged value of an index after the AC minus the averaged value of the index before the AC. The symbol “-“ indicates that there is no AC and corresponding value.
4. Correlation between Extreme Climate Events and Urbanization Factors
Previous studies such as the one by Du et al. [55] have shown correlations between the urbanization factors and UHI intensity, where urbanization is measured by a comprehensive metric that includes economic, population, and land urbanization factors [64]. Therefore, to gain insight into the correlations between the extreme climate indices and the different urbanization factors in Urumqi, we shall further explore the correlations between all 22 extreme climate indices and the population (Pop.), impervious surface area (ISA), and gross domestic product (GDP) in Urumqi from 1990 to 2018. Note that the data of these urbanization factors in Urumqi are only available for this time period, and the time resolution of these data is 1 year.
As shown in Figure 9, there are relatively high correlations between each urbanization factor and some of the extreme climate indices. Specifically, the extreme warm indices are positively correlated with all three urbanization factors, among which TR20 and TN90p are significantly correlated at the 0.01 significance level. TR20 has the highest correlation (0.774) with the Pop., while TN90p has the highest correlation (0.745) with the ISA. The extreme cold indices are negatively correlated with these three urbanization factors, and the FD0 and TN10p are significantly correlated at the 0.05 significance level. Compared to the warm indices, the cold indices show relatively weaker correlations. FD0 has the highest correlation (−0.541) with the ISA, while TN10p exhibits the highest correlation (−0.571) with Pop. As mentioned in Section 3.3, the TR20, TN90p, FD0, and TN10p indices calculated based on the Tmin show a significant UE possibly via the nighttime UHI effect, and now it can be inferred that these four indices are strongly correlated with the Pop. and ISA of Urumqi.
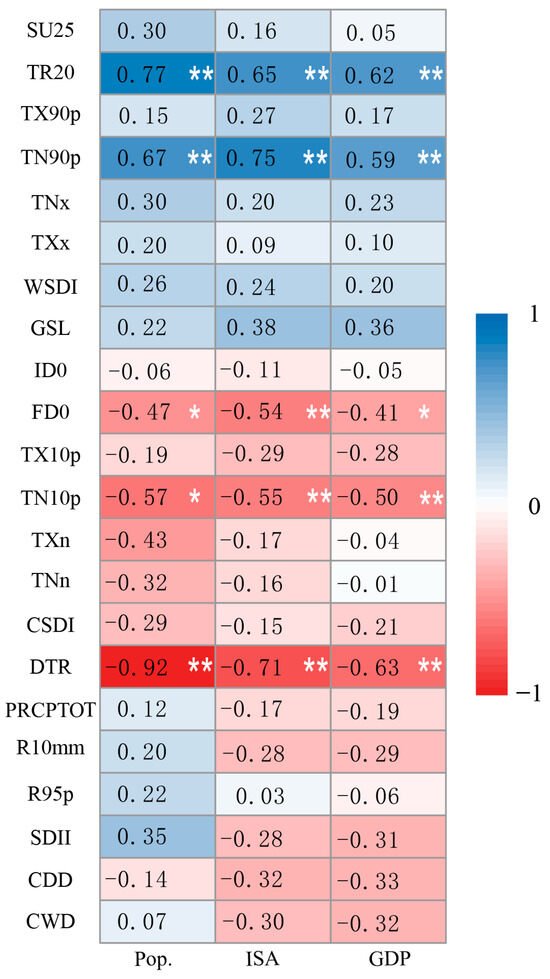
Figure 9.
Pearson correlation coefficients between the extreme climate indices and three major urbanization factors, i.e., population (Pop.), impervious surface area (ISA), and gross domestic product (GDP), in Urumqi based on the data of each year in the period from 1990 to 2018. Values labeled with * and ** indicate significance levels of 0.05 and 0.01, respectively.
In addition, there are significant (up to 0.01 level of significance) negative correlations between the DTR and all three urbanization factors. The highest correlation is found between the DTR and Pop., with a correlation coefficient of −0.917. It may be inferred that the decrease in DTR, which is probably due to the daytime UCI effect and nighttime UHI effect, is mostly affected by the increasing population in Urumqi. However, the correlation between the extreme precipitation indices and the three urbanization factors are not significant compared to the extreme warm and cold indices, with a low correlation coefficient between −0.33 and 0.35.
In general, among the three urbanization factors, the correlations between the Pop. and ISA with the extreme climate indices are the strongest, especially with the warm and cold indices and the DTR. Therefore, it can be deduced that the changes in population and land use and land cover are the most important urbanization factors to affect the local climatology. The UE on the local climate is complicated and can be related to complex dynamic, thermal, and moisture aspects, together with UHI circulation and aerosol emissions. Therefore, this needs to be further studied in depth using high-resolution numerical models.
5. Conclusions
This work can be considered as the first investigation about the urbanization effect and urbanization contribution to the changes in extreme climate events in Urumqi, Xinjiang, northwest China, and it is believed that the findings in this work can fill the gap in understanding the extent to which the UE has impacted the trends in extreme events in this arid region. These analyses are mainly based on the trends of the annual Tmax, Tmean, Tmin, and 22 extreme climate indices calculated at urban and rural stations from 1976 to 2018 using the UMR method. The major findings are as follows.
The variations and linear trends of Tmax, Tmean, and Tmin show that urbanization in Urumqi has caused a significant increase in Tmin mostly through the nocturnal urban heat island (UHI) effect. In contrast, Tmax in the urban area rises at a rate smaller than that in the rural area, reflecting the existence of a certain cooling effect, i.e., the urban cold island (UCI) effect, during the daytime.
From the perspective of the UE on extreme warm climate indices, most of the frequency indices show a rather high UC (>66%), while the duration indices show a rather low UC (<39%). The UE of TR20 reached 5.22 d/10a, indicating that urbanization has led to a relatively faster increase in the number of hot nights in Urumqi. Moreover, most of the warm indices calculated based on the Tmax (or Tmin) show a negative (or positive) UE with a relatively higher (lower) high UC. Consequently, it can be concluded again based on the warm indices that Urumqi shows a significant UCI effect during the day, along with a UHI effect at night.
For the extreme cold indices, most of them showed a decreasing trend at both the urban and rural stations, while the rate of decrease due to urbanization is faster for most cold indices. Furthermore, most of the cold indices calculated based on Tmax (or Tmin) show a positive (or negative) UE. This is in agreement with the dominating effect of the UCI during the day and UHI at nighttime in Urumqi. The absolute averaged UEs on the cold frequency, intensity, and duration indices are 1.11 d/10a, 0.34 °C/10a, and 0.585 d/10a. It is noteworthy that the absolute averaged UE on the indices measuring the frequency of warm events is about twice as large as that on the cold indices, while that on the indices measuring the intensity of warm events is about one third of that on the indices measuring the intensity of cold events.
Urbanization has an effect on the intensity, frequency, and duration of extreme precipitation to some extent. It was found from evolving trends of extreme precipitation indices that urbanization probably exacerbates the degree of wetting in the overall “warming and wetting” trend of the climate in the region [60,61,62,63], which means that urbanization probably increases local precipitation and alleviates droughts in the region.
Among the three major urbanization factors, i.e., the population (Pop.), impervious surface area (ISA), gross domestic product (GDP), the correlations between the Pop. and ISA with the extreme climate indices are the most significant, especially for the warm and cold indices and DTR. This implies that changes in population and ISA are the most important factors in the urbanization to affect the local climatology.
6. Discussion and Future Work
Although this study was conducted to investigate the urbanization effect and the urbanization contribution to the changes in extreme climate events in only one city, since Urumqi is the only city that can be considered as a large city with a population of more than three million in Xinjiang and one of the most typical oasis cities in the arid zone of northwest China (according to the Xinjiang Statistical Yearbook), this study is important to discover new evidence to provide the scientific basis for further investigations of the UE on climate changes in arid regions.
In general, urbanization in Urumqi over the last 34 years has affected the frequency, duration, and intensity of extreme warm, cold, and precipitation indices. However, Table 10 shows unique regional characteristics that are different from those found in other parts of China, such as northern China [65], Nanjing [66], and Chengdu [67]. The SU25 index shows a relatively large negative UE of −2.09 d/10a in Urumqi, but very small positive values of 0.167 d/10a and 0.31 d/10a in North China and Nanjing, respectively. Similarly, the TXx index shows a negative value of −0.22 °C/10a in Urumqi, while those of North China and Nanjing are close to zero. For WSDI, the UE of Urumqi is negative (−0.19 d/10a), while that of Nanjing is positive (0.35 d/10a). In addition, the other two cold extreme indices, TX10p and TXn, show positive UEs (0.43 d/10a and 0.28 d/10a), while those of North China and Nanjing are negative or near zero. The differences are likely due to the unique UCI effect of the arid region, as the UEs are closely related to the background climate [22,68]. The physical processes and phenomena in the urban atmosphere are influenced by a wide range of factors, such as the latitude, altitude, and proximity to water bodies. A city’s intrinsic controls include its unique combination of urban surface properties and the size of the city, with urban surface encompassing radiative, thermal, moisture, and aerodynamic factors [57]. Manoli et al. [59] demonstrated that the urban heat island (UHI) is controlled by water or energy limitations on evapotranspiration (ET). In wet climates, energy limitations set an upper limit on the differences in ET between urban and rural environments, while in arid regions, water limitations reduce the magnitude of rural ET, thus limiting the impact of ΔET on the UHI. Consequently, we believe that as Urumqi is a typical arid oasis city, urban greening, irrigation, air conditioning, and water vapor from car exhausts have led to a surplus of water vapor over the urban area, resulting in a cooling effect (i.e., oasis effect). North China and Nanjing are located in the eastern monsoon region close to the ocean and abundant in water vapor, with the rural areas predominantly consisting of forests or croplands. Urbanization has led to the replacement of croplands with impermeable urban layers, altering urban humidity and heat properties and resulting in a significant UHI phenomenon. Consequently, the warm indices SU25, TXx, and WSDI calculated based on the Tmax exhibit more negative urbanization effects in Urumqi, while they do not in North China and Nanjing. Therefore, to specifically explore the similarities and differences in urbanization effects in cities with different climate backgrounds, numerical simulations should be employed to study the surface energy balance of cities, and in-depth analysis should be conducted on the thermal and moisture aspects.
Table 10.
Comparison of UE on the extreme climate indices in Urumqi and other regions in China.
Du et al. [55] studied the surface UHI (SUHI) and the canopy UHI (CUHI) effects in a number of cities in different climatic zones around the globe. They found that the SUHI is stronger than the CUHI over the cities in tropical, subtropical, and high-altitude snowy climates. But for cities in an arid climate, the CUHI is stronger than the SUHI during the daytime. Previous studies have shown that greater regional aridity will increase the potential transpiration of vegetation [69], and the aridity-driven increase in transpiration can result in increases in latent heat flux, which correlates with greater vegetation-derived cooling in arid cities [70]. In addition, studies have also suggested that the urban–rural contrast in vegetation abundance in the arid regions may contribute to weaker SUHI effects through the occurrence of a significant daytime CUHI [55,66]. Therefore, the UCI effect in Urumqi is likely due to the cooling oasis effect masking the heating effect of the UHI.
Although most of the extreme climate indices calculated based on Tmax (Tmin) show the characteristics of a UCI (UHI) effect; ID0 and TNn suggest opposite results, namely, the UHI effect during the day. This, to some extent, indicates that the UHI of Urumqi would not be 100% covered by the cooling oasis effect, and some extreme climate indices still can reflect the UHI of Urumqi during the day. It can also be understood from this perspective that the climatological characteristics portrayed by each extreme climate index are different; these may reflect the characteristics of a UHI or UCI in Urumqi.
The UE of TR20 reaches 5.22 d/10a, indicating that urbanization has led to a relatively faster increase in the number of hot nights in Urumqi. Cities in arid climate have a relatively fragile ecology and poor climate regulation capacity and will be exposed to a greater human health risk. Exposure to extreme urban temperature can bring about severe consequences, including physical health decline, psychological stress, and even increased mortality [71,72]. This suggests that there may be a risk of extreme climate impacts on human health in the urban area of Urumqi. To effectively prevent and assess the human impacts of climate extremes in the region, more locally applicable research on climate-resilient cities and climate extremes and human health is needed.
In the mid-latitudes, the synoptic-scale precipitation process (e.g., frontal precipitation associated with synoptic-scale cyclones) is common, especially in winter (or cold season). The synoptic-scale processes that drive the precipitation systems may mask the UEs and limit the opportunity to test the hypotheses related to urbanization for only a subset of precipitation events. Moreover, the topographic settings of a city must also be considered as other influences (such as coastal and valley circulations), which may also be present, making it difficult to detect the UEs on the precipitation [57]. The surrounding area of Urumqi not only has a certain topographic relief, but frontal precipitation associated with synoptic-scale weather systems are also common in this region. Therefore, numerical simulation may be the most effective method for obtaining quantitative and accurate conclusions about the UEs on precipitation in Urumqi.
Cities can affect precipitation through various factors, such as changes in the urban surface energy balance causing urban heat islands and heat-driven circulation, urban rough subsurface enhancing urban airflow convergence, and aerosol emissions altering urban aerosol particle size distribution, which affects precipitation [27,57,59]. Therefore, our next study will focus on how urbanization in arid regions influences precipitation and how it differs from urban effects on precipitation in humid regions based on numerical simulation.
To account for potential multicollinearity among the extreme indices used in this study, we conducted Pearson correlation analysis and calculated the variance inflation factors (VIFs) to detect any potential multicollinearity. Previous studies [73,74] indicated that multicollinearity shall be considered to exist when the Pearson correlation coefficient is greater than 0.85, or the VIF value is greater than 10. Table 11, Table 12 and Table 13 below show the Pearson correlation coefficients and VIFs of the extreme climate indices. It can be seen that the highest value of the Pearson correlation coefficients is 0.85. According to the calculation method of the extreme climate indices, some of the extreme temperature indices are calculated based on Tmax or Tmin, and the extreme precipitation indices are calculated based on the daily precipitation amount. Therefore, it is inevitable that there are some high correlation values exceeding 0.7 or 0.8 between certain indices. However, extensive research has been conducted on these extreme climate indices, leading us to believe that each extreme climate index holds unique significance. This study aims to explore the urbanization effects on various extreme climate indices; thus, 22 extreme climate indices were selected to be analyzed in this study.
Table 11.
The Pearson correlation coefficients and variance inflation factors (VIFs, shown in round brackets) of the extreme warm climate indices at urban station of Urumqi from 1976 to 2018.
Table 12.
The Pearson correlation coefficients and variance inflation factors (VIFs, shown in round brackets) of the extreme cold climate indices at urban station of Urumqi from 1976 to 2018.
Table 13.
The Pearson correlation coefficients and variance inflation factors (VIFs, shown in round brackets) of the extreme precipitation indices at urban station of Urumqi from 1976 to 2018.
In general, all the extreme climate indices in this study did not exceeded 0.85, and the values of the VIFs for all the extreme climate indices did not exceeded 10. Therefore, it is believed that there is no potential multicollinearity between the indices in this study.
Author Contributions
Conceptualization, A.A. (Aerzuna Abulimiti) and Y.L.; methodology, A.A. (Aerzuna Abulimiti), Y.L., L.Y., A.A. (Abuduwaili Abulikemu), Y.M., S.Y., R.E.; software, A.A. (Aerzuna Abulimiti), L.Y., L.Y., A.A. (Abuduwaili Abulikemu), Y.M., S.Y., R.E., Z.L., A.A. (Abidan Abuduaini) and Z.K.; supervision, Y.L. and L.Y.; validation, A.A. (Aerzuna Abulimiti), Y.L. and L.Y.; formal analysis, A.A. (Aerzuna Abulimiti) and Y.L.; investigation, A.A. (Aerzuna Abulimiti), Y.L.; resources, L.Y.; data curation, A.A. (Aerzuna Abulimiti), Y.L.; writing—original draft preparation, A.A. (Aerzuna Abulimiti), L.Y.; writing—review and editing, A.A. (Aerzuna Abulimiti), A.A. (Abuduwaili Abulikemu); visualization, A.A. (Aerzuna Abulimiti), L.Y., Z.L., A.A. (Abidan Abuduaini) and Z.K.; supervision, Y.L. and L.Y.; project administration, Y.L. and L.Y.; funding acquisition, L.Y. All authors have read and agreed to the published version of the manuscript.
Funding
This research has been supported by the Tianshan Mountains Talent Project (grant no. 2022TSYCLJ0003), Key Research and Development Program of Xinjiang Uygur Autonomous Region (grant no. 2023B03019-1), National Key Research and Development Program of China (grant no. 2019YFC1510505), the National Natural Science Foundation of China (grant no. 42265003), Natural Science Foundation of Xinjiang Uygur Autonomous Region (grant no. 2022D01C359), and Graduate Innovation Project of Xinjiang University (grant no. XJ2020G014).
Institutional Review Board Statement
Not applicable.
Informed Consent Statement
Not applicable.
Data Availability Statement
Data is contained within the article.
Acknowledgments
We thank all our teachers and fellow students for their valuable suggestions, which have improved this work.
Conflicts of Interest
The authors declare that have no conflicts of interest in this article entitled “Urbanization Effect on Changes in Extreme Climate Events in Urumqi, China, from 1976 to 2018” submitted to Land.
Abbreviations
List of technical terms and the corresponding abbreviations.
| UE | Urbanization Effect |
| UC | Urbanization Contribution |
| AC | Abrupt Change |
| RBAC | Rate Before Abrupt Change |
| RAAC | Rate After Abrupt Change |
| Pop. | Population |
| ISA | Impervious Surface Area |
| GDP | Gross Domestic Product |
| PRCP | Precipitation |
| Tmin | Minimum Temperature (daily) |
| Tmax | Maximum Temperature (daily) |
| Tmean | Mean Temperature (daily) |
References
- Zhai, P.; Ren, F. On change of China’s maximum and minimum temperatures in 1951–1990. Acta Meteor. Sin. 1999, 13, 278–290. [Google Scholar]
- Pan, X.; Zhai, P. Analyses of surface air temperature extremes. Meteorol. Mon. 2002, 28, 28–31. [Google Scholar]
- Zhai, P.; Pan, X. Trends in temperature extremes during 1951–1999 in China. Geophys. Res. Lett. 2003, 30, 1913. [Google Scholar] [CrossRef]
- Zhai, P.; Zhang, X.; Wan, H.; Pan, X. Trends in Total Precipitation and Frequency of Daily Precipitation Extremes over China. J. Clim. 2005, 18, 1096–1108. [Google Scholar] [CrossRef]
- Min, S.; Zhang, X.; Zwiers, F.; Hegerl, G. Human contribution to more-intense precipitation extremes. Nature 2011, 470, 378–381. [Google Scholar] [CrossRef]
- Zhai, P.; Liu, J. Extreme weather and climate events and disaster prevention and mitigation under global warming background. Eng. Sci. 2012, 14, 55–63. (In Chinese) [Google Scholar]
- Abulikemu, A.; Wang, Y.; Gao, R.; Wang, Y.; Xu, X. A Numerical Study of Convection Initiation Associated With a Gust Front in Bohai Bay Region, North China. J. Geophys. Res. Atmos. 2019, 124, 13843–13860. [Google Scholar] [CrossRef]
- Liao, Z.; Zhai, P.; Chen, Y.; Lu, H. Differing mechanisms for the 2008 and 2016 wintertime cold events in southern China. Int. J. Climatol. 2020, 40, 4944–4955. [Google Scholar] [CrossRef]
- Seneviratne, S.I.; Zhang, X.; Adnan, M.; Badi, W.; Dereczynski, C.; Di Luca, A.; Ghosh, S.; Iskandar, I.; Kossin, J.; Lewis, S.; et al. Weather and Climate Extreme Events in a Changing Climate. In Climate Change 2021–The Physical Science Basis; Cambridge University Press: Cambridge, UK; New York, NY, USA, 2021; pp. 1513–1766. [Google Scholar]
- Tuholske, C.; Caylor, K.; Funk, C.; Verdin, A.; Sweeney, S.; Grace, K.; Peterson, P.; Evans, T. Global urban population exposure to extreme heat. Proc. Natl. Acad. Sci. USA 2021, 118, e2024792118. [Google Scholar] [CrossRef] [PubMed]
- Zhai, P.; Zhou, B.; Chen, Y.; Yu, R. Several new understandings in the climate change science. Clim. Change Res. 2021, 17, 629–635. (In Chinese) [Google Scholar] [CrossRef]
- Guan, J.; Yao, J.; Li, M.; Li, D.; Zheng, J. Historical changes and projected trends of extreme climate events in Xinjiang, China. Clim. Dyn. 2022, 59, 1753–1774. [Google Scholar] [CrossRef]
- Kong, M.; Abulikemu, A.; Zheng, J.; Aireti, M.; An, D. A Case Study on Convection Initiation Associated with Horizontal Convective Rolls over Ili River Valley in Xinjiang, Northwest China. Water 2022, 14, 1017. [Google Scholar] [CrossRef]
- Massaro, E.; Schifanella, R.; Piccardo, M.; Caporaso, L.; Taubenböck, H.; Cescatti, A.; Duveiller, G. Spatially-optimized urban greening for reduction of population exposure to land surface temperature extremes. Nat. Commun. 2023, 14, 2903. [Google Scholar] [CrossRef]
- Wang, X.; Jiang, W.; Wu, J.; Hou, P.; Dai, Z.; Rao, P.; Ling, Z.; Deng, Y. Extreme hourly precipitation characteristics of Mainland China from 1980 to 2019. Int. J. Clim. 2023, 43, 2989–3004. [Google Scholar] [CrossRef]
- Kalnay, E.; Cai, M. Impact of urbanization and land-use change on climate. Nature 2003, 423, 528–531. [Google Scholar] [CrossRef]
- Yu, R.; Jiang, Z.; Zhai, P. Impact of urban land-use change in eastern China on the East Asian subtropical monsoon: A numerical study. J. Meteorol. Res. 2016, 30, 203–216. [Google Scholar] [CrossRef]
- Chapman, S.; Watson, J.E.M.; Salazar, A.; Thatcher, M.; McAlpine, C.A. The impact of urbanization and climate change on urban temperatures: A systematic review. Landsc. Ecol. 2017, 32, 1921–1935. [Google Scholar] [CrossRef]
- Zhou, B.; Rybski, D.; Kropp, J.P. The role of city size and urban form in the surface urban heat island. Sci. Rep. 2017, 7, 4791. [Google Scholar] [CrossRef] [PubMed]
- Chakraborty, T.; Lee, X. A simplified urban-extent algorithm to characterize surface urban heat islands on a global scale and examine vegetation control on their spatiotemporal variability. Int. J. Appl. Earth Obs. Geoinf. 2019, 74, 269–280. [Google Scholar] [CrossRef]
- Sharma, A.; Wuebbles, D.J.; Kotamarthi, R.; Calvin, K.; Drewniak, B.; Catlett, C.E.; Jacob, R. Urban-Scale Processes in High-Spatial-Resolution Earth System Models. Bull. Am. Meteorol. Soc. 2020, 101, E1555–E1561. [Google Scholar] [CrossRef]
- Qian, Y.; Chakraborty, T.C.; Li, J.; Li, D.; He, C.; Sarangi, C.; Chen, F.; Yang, X.; Leung, L.R. Urbanization Impact on Regional Climate and Extreme Weather: Current Understanding, Uncertainties, and Future Research Directions. Adv. Atmos. Sci. 2022, 39, 819–860. [Google Scholar] [CrossRef]
- Yuan, Y.; Zhai, P. Latest understanding of extreme weather and climate events under global warming and urbanization influences. Trans. Atmos. Sci. 2022, 45, 161–166. (In Chinese) [Google Scholar] [CrossRef]
- Zhang, X.; Zwiers, F.; Hegerl, G.; Lambert, H.; Gillett, N.; Solomon, S.; Stott, P.; Nozawa, T. Detection of human influence on twentieth-century precipitation trends. Nature 2007, 448, 461–465. [Google Scholar] [CrossRef]
- Grimm, N.B.; Faeth, S.H.; Golubiewski, N.E.; Redman, C.L.; Wu, J.; Bai, X.; Briggs, J.M. Global Change and the Ecology of Cities. Science 2008, 319, 756–760. [Google Scholar] [CrossRef]
- Zhai, P.; Yuan, Y.; Yu, R. Climate change and sustainable development for cities. Chin. Sci. Bull. 2019, 64, 1995–2001. (In Chinese) [Google Scholar] [CrossRef]
- Marelle, L.; Myhre, G.; Steensen, B.M.; Hodnebrog, Ø.; Alterskjær, K.; Sillmann, J. Urbanization in megacities increases the frequency of extreme precipitation events far more than their intensity. Environ. Res. Lett. 2020, 15, 124072. [Google Scholar] [CrossRef]
- Milelli, M.; Bassani, F.; Garbero, V.; Poggi, D.; von Hardenberg, J.; Ridolfi, L. Characterization of the Urban Heat and Dry Island effects in the Turin metropolitan area. Urban Clim. 2023, 47, 101397. [Google Scholar] [CrossRef]
- Zhao, N.; Liu, S.; Yu, H. Urbanization effects on local climate in Beijing in recent48years. Chin. J. Atmos. Sci. 2011, 32, 373–385. (In Chinese) [Google Scholar]
- Kug, J.-S.; Ahn, M.-S. Impact of urbanization on recent temperature and precipitation trends in the Korean peninsula. Asia-Pac. J. Atmos. Sci. 2013, 49, 151–159. [Google Scholar] [CrossRef]
- Tysa, S.K.; Ren, G.; Qin, Y.; Zhang, P.; Ren, Y.; Jia, W.; Wen, K. Urbanization Effect in Regional Temperature Series Based on a Remote Sensing Classification Scheme of Stations. J. Geophy. Res. 2019, 124, 10646–10661. [Google Scholar] [CrossRef]
- Wen, K.; Ren, G.; Li, J.; Zhang, A.; Ren, Y.; Sun, X.; Zhou, Y. Recent Surface Air Temperature Change over Mainland China Based on an Urbanization-Bias Adjusted Dataset. J. Clim. 2019, 32, 2691–2705. [Google Scholar] [CrossRef]
- Shi, Z.; Yang, X.-Q. Ensemble simulations of the urban effect on a summer rainfall event in the Great Beijing Metropolitan Area. Atmos. Res. 2015, 153, 318–334. [Google Scholar] [CrossRef]
- Shi, J.; Cui, L.; Ma, Y.; Du, H.; Wen, K. Trends in temperature extremes and their association with circulation patterns in China during 1961–2015. Atmos. Res. 2018, 212, 259–272. [Google Scholar] [CrossRef]
- Wang, Y.; Ding, Z.; Ma, Y. Spatial and temporal analysis of changes in temperature extremes in the non-monsoon region of China from 1961 to 2016. Theor. Appl. Climatol. 2019, 137, 2697–2713. [Google Scholar] [CrossRef]
- Li, Y.; Zhao, J.; Miao, R.; Huang, Y.; Fan, X.; Liu, X.; Wang, X.; Wang, Y.; Shen, Y. Analysis of the Temporal and Spatial Distribution of Extreme Climate Indices in Central China. Sustainability 2022, 14, 2329. [Google Scholar] [CrossRef]
- Abulikemu, A.; Ming, J.; Xu, X.; Zhuge, X.; Wang, Y.; Zhang, Y.; Zhang, S.; Yu, B.; Aireti, M. Mechanisms of Convection Initiation in the Southwestern Xinjiang, Northwest China: A Case Study. Atmosphere 2020, 11, 1335. [Google Scholar] [CrossRef]
- Yao, J.; Chen, Y.; Chen, J.; Zhao, Y.; Tuoliewubieke, D.; Li, J.; Yang, L.; Mao, W. Intensification of extreme precipitation in arid Central Asia. J. Hydro. 2021, 598, 125760. [Google Scholar] [CrossRef]
- He, X.; Abulikemu, A.; Mamtimin, A.; Li, R.; Abulimiti, A.; An, D.; Aireti, M.; Zhou, Y.; Sun, Q.; Li, Z.; et al. On the Mechanisms of a Snowstorm Associated with a Low-Level Cold Front and Low-Level Jet in the Western Mountainous Region of the Junggar Basin, Xinjiang, Northwest China. Atmosphere 2023, 14, 919. [Google Scholar] [CrossRef]
- Sun, Q.; Abulikemu, A.; Yao, J.; Mamatimin, A.; Yang, L.; Zeng, Y.; Li, R.; An, D.; Li, Z. A Case Study on the Convection Initiation Mechanisms of an Extreme Rainstorm over the Northern Slope of Kunlun Mountains, Xinjiang, Northwest China. Remote Sens. 2023, 15, 4505. [Google Scholar] [CrossRef]
- Hinkel, K.M.; Nelson, F.E. Anthropogenic heat island at Barrow, Alaska, during winter: 2001–2005. J. Geophys. Res. Atmos. 2007, 112, D06118. [Google Scholar] [CrossRef]
- Brohan, P.; Kennedy, J.J.; Harris, I.; Tett, S.F.B.; Jones, P.D. Uncertainty estimates in regional and global observed temperature changes: A new data set from 1850. J. Geophys. Res. Atmos. 2006, 111, 12106. [Google Scholar] [CrossRef]
- Ren, G.; Zhang, A.; Chu, Z.; Ren, Y. Principles and procedure for selecting reference surface air temperature stations in China. Meteorol. Sci. Technol. 2010, 38, 85–98. (In Chinese) [Google Scholar]
- Liu, W.; Zhang, F.; Wei, W.; Wang, M. Comparison of Climate Parameters between Urumqi City and Suburb in Recent 30 Years. J. Desert Res. 2010, 30, 681–685. (In Chinese) [Google Scholar]
- Alexander, L.V.; Zhang, X.; Peterson, T.C.; Caesar, J.; Gleason, B.; Klein Tank, A.M.G.; Haylock, M.; Collins, D.; Trewin, B.; Rahimzadeh, F.; et al. Global observed changes in daily climate extremes of temperature and precipitation. J. Geophys. Res. Atmos. 2006, 111, D05109. [Google Scholar] [CrossRef]
- Costa, R.L.; Macedo de Mello Baptista, G.; Gomes, H.B.; Daniel dos Santos Silva, F.; Lins da Rocha Júnior, R.; de Araújo Salvador, M.; Herdies, D.L. Analysis of climate extremes indices over northeast Brazil from 1961 to 2014. Weather. Clim. Extrem. 2020, 28, 100254. [Google Scholar] [CrossRef]
- Lucas, E.W.M.; de Sousa, F.d.A.S.; dos Santos Silva, F.D.; da Rocha Júnior, R.L.; Pinto, D.D.C.; da Silva, V.d.P.R. Trends in climate extreme indices assessed in the Xingu river basin—Brazilian Amazon. Weather. Clim. Extrem. 2021, 31, 100306. [Google Scholar] [CrossRef]
- Sa′adi, Z.; Yaseen, Z.M.; Farooque, A.A.; Mohamad, N.A.; Muhammad, M.K.I.; Iqbal, Z. Long-term trend analysis of extreme climate in Sarawak tropical peatland under the influence of climate change. Weather Clim. Extrem. 2023, 40, 100554. [Google Scholar] [CrossRef]
- Zhang, X.; Hegerl, G.; Zwiers, F.W.; Kenyon, J. Avoiding Inhomogeneity in Percentile-Based Indices of Temperature Extremes. J. Clim. 2005, 18, 1641–1651. [Google Scholar] [CrossRef]
- Shi, J.; Cui, L.; Wen, K.; Tian, Z.; Wei, P.; Zhang, B. Trends in the consecutive days of temperature and precipitation extremes in China during 1961–2015. Environ. Res. 2018, 161, 381–391. [Google Scholar] [CrossRef] [PubMed]
- Karl, T.R.; Diaz, H.F.; Kukla, G. Urbanization: Its Detection and Effect in the United States Climate Record. J. Clim. 1988, 1, 1099–1123. [Google Scholar] [CrossRef]
- Ren, G.; Zhang, L.; Bian, T.; Ren, Y.; Li, J. Urbanization effect on change of daily temperature at Shijiazhuang weather station. Chin. J. Geophys. 2015, 58, 398–410. [Google Scholar] [CrossRef]
- Zhang, L. Urbanization Effect on the Changes of Extreme Temperature in East Asia. Ph.D. Thesis, Nanjing University of Information Science and Technology, Nanjing, China, 2014. [Google Scholar]
- Jiao, Y. Study on the Spatial and Temporal Variation of Extreme Temperature Events in Beijing-Tianjin-Hebei Region and the Impact of Urbanization on Them. Master’s Thesis, China University of Geosciences, Beijing, China, 2019. [Google Scholar]
- Du, H.; Zhan, W.; Liu, Z.; Li, J.; Li, L.; Lai, J.; Miao, S.; Huang, F.; Wang, C.; Wang, C.; et al. Simultaneous investigation of surface and canopy urban heat islands over global cities. ISPRS J. Photogramm. Remote Sens. 2021, 181, 67–83. [Google Scholar] [CrossRef]
- He, B.; Sheng, Y.; Cao, W.; Wu, J. Characteristics of Climate Change in Northern Xinjiang in 1961–2017, China. Chin. Geogr. Sci. 2020, 30, 249–265. [Google Scholar] [CrossRef]
- Oke, T.R.; Mills, G.; Christen, A.; Voogt, J.A. Urban Climates; Cambridge University Press: Cambridge, UK, 2017. [Google Scholar]
- Lin, L.; Gao, T.; Luo, M.; Ge, E.; Yang, Y.; Liu, Z.; Zhao, Y.; Ning, G. Contribution of urbanization to the changes in extreme climate events in urban agglomerations across China. Sci. Total Environ. 2020, 744, 140264. [Google Scholar] [CrossRef] [PubMed]
- Manoli, G.; Fatichi, S.; Schläpfer, M.; Yu, K.; Crowther, T.W.; Meili, N.; Burlando, P.; Katul, G.G.; Bou-Zeid, E. Magnitude of urban heat islands largely explained by climate and population. Nature 2019, 573, 55–60. [Google Scholar] [CrossRef] [PubMed]
- Chen, C. Temporal and spatial distributions of hourly rain intensity under the warm background in Xinjiang. Arid. Land Geogr. 2015, 38, 692–702. (In Chinese) [Google Scholar] [CrossRef]
- Liu, Y.R.; Li, Y.P.; Yang, X.; Huang, G.H.; Li, Y.F. Development of an integrated multivariate trend-frequency analysis method: Spatial-temporal characteristics of climate extremes under global warming for Central Asia. Environ. Res. 2021, 195, 110859. [Google Scholar] [CrossRef] [PubMed]
- Wu, X.; Luo, M.; Meng, F.; Sa, C.; Yin, C.; Bao, Y. New characteristics of spatiotemporal evolution of extreme climate events in Xinjiang under the background of warm and humid climate. Arid. Zone Res. 2022, 39, 1695–1705. (In Chinese) [Google Scholar] [CrossRef]
- Yao, J.; Li, M.; Tuoliewubieke, D.; Chen, J.; Mao, W. The assessment on “warming-wetting” trend in Xinjiang at multi-scale during 1961–2019. Arid Zone Res. 2022, 39, 333–346. (In Chinese) [Google Scholar] [CrossRef]
- Guo, J.; Yu, Z.; Ma, Z.; Xu, D.; Cao, S. What factors have driven urbanization in China? Environ. Dev. Sustain. 2021, 24, 6508–6526. [Google Scholar] [CrossRef]
- Zhou, Y.; Ren, G. Urbanization Effect on Long-Term Trends of Extreme Temperature Events in North China. Plateau Meteorol. 2014, 33, 1589–1598. (In Chinese) [Google Scholar]
- Huang, R.; Gong, N.; Liu, H.; Hu, S.; Duan, C.; Li, X. The Impact of Urbanization on Extreme Air Temperature in Nanjing. Chin. Agric. Sci. Bull. 2017, 33, 118–125. (In Chinese) [Google Scholar]
- Zhang, X.; Liu, M.; Qing, Q. Extreme Temperature Change and Urbanization Contribution in Chengdu from 1960 to 2018. Plateau Mt. Meteorol. Res. 2022, 42, 10–17. (In Chinese) [Google Scholar]
- Zhao, L.; Lee, X.; Smith, R.B.; Oleson, K. Strong contributions of local background climate to urban heat islands. Nature 2014, 511, 216–219. [Google Scholar] [CrossRef] [PubMed]
- Sulman, B.N.; Roman, D.T.; Scanlon, T.M.; Wang, L.; Novick, K.A. Comparing methods for partitioning a decade of carbon dioxide and water vapor fluxes in a temperate forest. Agric. For. Meteorol. 2016, 226–227, 229–245. [Google Scholar] [CrossRef]
- Ibsen, P.C.; Jenerette, G.D.; Dell, T.; Bagstad, K.J.; Diffendorfer, J.E. Urban landcover differentially drives day and nighttime air temperature across a semi-arid city. Sci. Total Environ. 2022, 829, 154589. [Google Scholar] [CrossRef] [PubMed]
- Anderson, G.B.; Bell, M.L. Heat waves in the United States: Mortality risk during heat waves and effect modification by heat wave characteristics in 43 US Communities. Environ. Health Perspect. 2011, 119, 210–218. [Google Scholar] [CrossRef] [PubMed]
- Mullins, J.T.; White, C. Temperature and mental health: Evidence from the spectrum of mental health outcomes. J. Health Econ. 2019, 68, 102240. [Google Scholar] [CrossRef]
- Garbasevschi, O.M.; Taubenböck, H.; Schüle, P.; Baarck, J.; Hufe, P.; Wurm, M.; Peichl, A. Learning income levels and inequality from spatial and sociodemographic data in Germany. Appl. Geogr. 2023, 159, 103058. [Google Scholar] [CrossRef]
- Sáez-Sandino, T.; García-Palacios, P.; Maestre, F.T.; Plaza, C.; Guirado, E.; Singh, B.K.; Wang, J.; Cano-Díaz, C.; Eisenhauer, N.; Gallardo, A.; et al. The soil microbiome governs the response of microbial respiration to warming across the globe. Nat. Clim. Change 2023, 13, 1382–1387. [Google Scholar] [CrossRef]

Disclaimer/Publisher’s Note: The statements, opinions and data contained in all publications are solely those of the individual author(s) and contributor(s) and not of MDPI and/or the editor(s). MDPI and/or the editor(s) disclaim responsibility for any injury to people or property resulting from any ideas, methods, instructions or products referred to in the content. |
© 2024 by the authors. Licensee MDPI, Basel, Switzerland. This article is an open access article distributed under the terms and conditions of the Creative Commons Attribution (CC BY) license (https://creativecommons.org/licenses/by/4.0/).