Abstract
Soil organic carbon (SOC) constitutes a critical component of carbon reservoirs within terrestrial ecosystems. The ramifications of urban land use transitions on SOC dynamics, particularly in rapidly urbanizing regions such as Shanghai, remain insufficiently elucidated. This investigation synergizes a predictive land use change model (Logistic-CA-Markov) with an ecosystem service quantification framework (InVEST), aiming to delineate the interplay between SOC variability and Land Use and Land Cover Change (LUCC) under natural development and ecological protection scenarios. Empirical observations from 2010 to 2020 reveal a contraction in Shanghai’s agricultural land of 34,912.76 hectares, juxtaposed with an expansion of urban built-up areas of 36,048.24 hectares. Projections for 2030 under an ecological protection scenario indicate a moderated urban sprawl, reducing built-up area expansion by 13,518 hectares relative to the natural development scenario. Notably, the net carbon sequestration capacity of Shanghai is anticipated to diminish by approximately 0.418 million tons between 2020 and 2030. This trend is observed under both considered scenarios, forecasting a cumulative reduction in SOC stocks exceeding 1 million tons by 2030. The natural development pathway portends a more pronounced and accelerated depletion of SOC reserves. Although ecological conservation measures show the potential to decelerate this loss, they appear insufficient to reverse the ongoing decline in SOC stocks. This study advocates for strategic urban planning interventions focused on constraining the growth of building densities and augmenting the preservation and management of eco-lands. Such measures are imperative for bolstering Shanghai’s carbon sequestration capacity.
1. Introduction
Land Use and Cover Change (LUCC) fundamentally transforms the structure, processes, and functional dynamics of terrestrial ecosystems, thereby significantly influencing material cycles and energy fluxes within these systems [1,2,3,4]. The control of the global carbon cycle is mostly dependent on terrestrial ecosystems [5] and is integral to both climate change mitigation strategies and carbon-climate feedback mechanisms [6,7]. Concurrent with urban expansion, urban soil organic carbon (SOC) pools have been contributing an increasing amount to the carbon reservoirs of the terrestrial ecosystem as a whole. At the same time that urbanization is increasing, terrestrial ecosystems’ capacity to sequester carbon is decreasing. The emerging disparity between land use regimes and ecosystem sustainability underscores the urgency of exploring the interconnections between changes in land use and carbon stocks. Additionally, forecasting the trajectory of future land use alterations and predicting subsequent urban land carbon stocks assumes critical importance for informed urban planning and climate change mitigation.
Spatiotemporal prediction provides early insights into the dynamics of urban development and facilitates people to adjust urban planning and land use promptly. LUCC under various situations is a multifaceted process with dimensions in both space and time [8], and many models have been developed to predict future LUCC, such as decision trees and support vector machines based on machine learning, back propagation neural networks and convolutional neural networks based on neural networks [9,10], Logistic-CA, RFA-CA [11] and FLUS [12] based on cellular automata (CA), and so on. However, the traditional CA models are simple in structure, focusing only on neighborhood effects, and need to be coupled with other models to perform better [13]. A neural network’s “black-box mechanism” is prone to overfitting and fails to account for the influence of spatial variables on changes in land use. The Markov model is only advantageous in quantitative prediction, and its spatial expression ability is still weak [14]. The CA-Markov model adopted in this paper can effectively simulate land use changes under various scenarios by simultaneously considering policy objectives, climate, and environmental variables [15,16,17].
Even though biogeochemical modeling and biomass approaches are highly accurate in estimating carbon stocks, it is challenging to depict changes in carbon stocks over extended time periods, and the sheer amount of factors needed restricts the application scenarios [18,19]. The InVEST (Integrated Valuation of Environmental Services and Tradeoffs) model can simulate the changes in ecosystem services under different LUCC scenarios [20]. The model’s terrestrial module can precisely evaluate how LUCC affects carbon storage [21]. Many scales of terrestrial ecosystems have been assessed and simulated using the InVEST model. At the national scale, fine-scale processes of LUCC are integrated into a large-scale ecosystem framework to analyze the terrestrial carbon balance in the contiguous United States [22], which can also simulate spatial and temporal changes in carbon stocks caused by land use changes [23]. On a regional level, Chinese academics have conducted case studies on cities such as Inner Mongolia [12], Beijing [24], and Shanghai [25], all of which concluded that carbon stocks would decline under conditions of urban expansion. In this research, the InVEST model and the Logistic-CA-Markov model are combined to predict the effect of LUCC on carbon stock in two future scenarios.
The process of transforming the industrial structure by the Shanghai Municipal Government has resulted in LUCC. Urbanization and industrialization have led to the transformation of vegetated land into industrial land and building land in Shanghai while increasing energy consumption and CO2 emissions [26]. However, due to the rapid rate of urban development, few studies have been conducted to assess the potential consequences of future urban expansion on carbon storage in Shanghai, mainly because long-term modeling can significantly bias the prediction results. In this study, simulation of future LUCC was achieved by coupling multiple models and generating temporal output from a logistic regression model [27].
In order to evaluate the land use structure changes in Shanghai and their effects under various scenarios on carbon stocks in terrestrial ecosystems with accuracy, this study linked the Logistic-CA-Markov model with the InVEST model. It aims to (1) develop a coupled model that can effectively assess future carbon stock changes due to urbanization, (2) estimate how future urban growth and management practices may affect carbon stocks, and (3) analyze the effects of urbanization on local carbon stocks from both historical and future perspectives.
2. Materials and Methods
2.1. Study Area
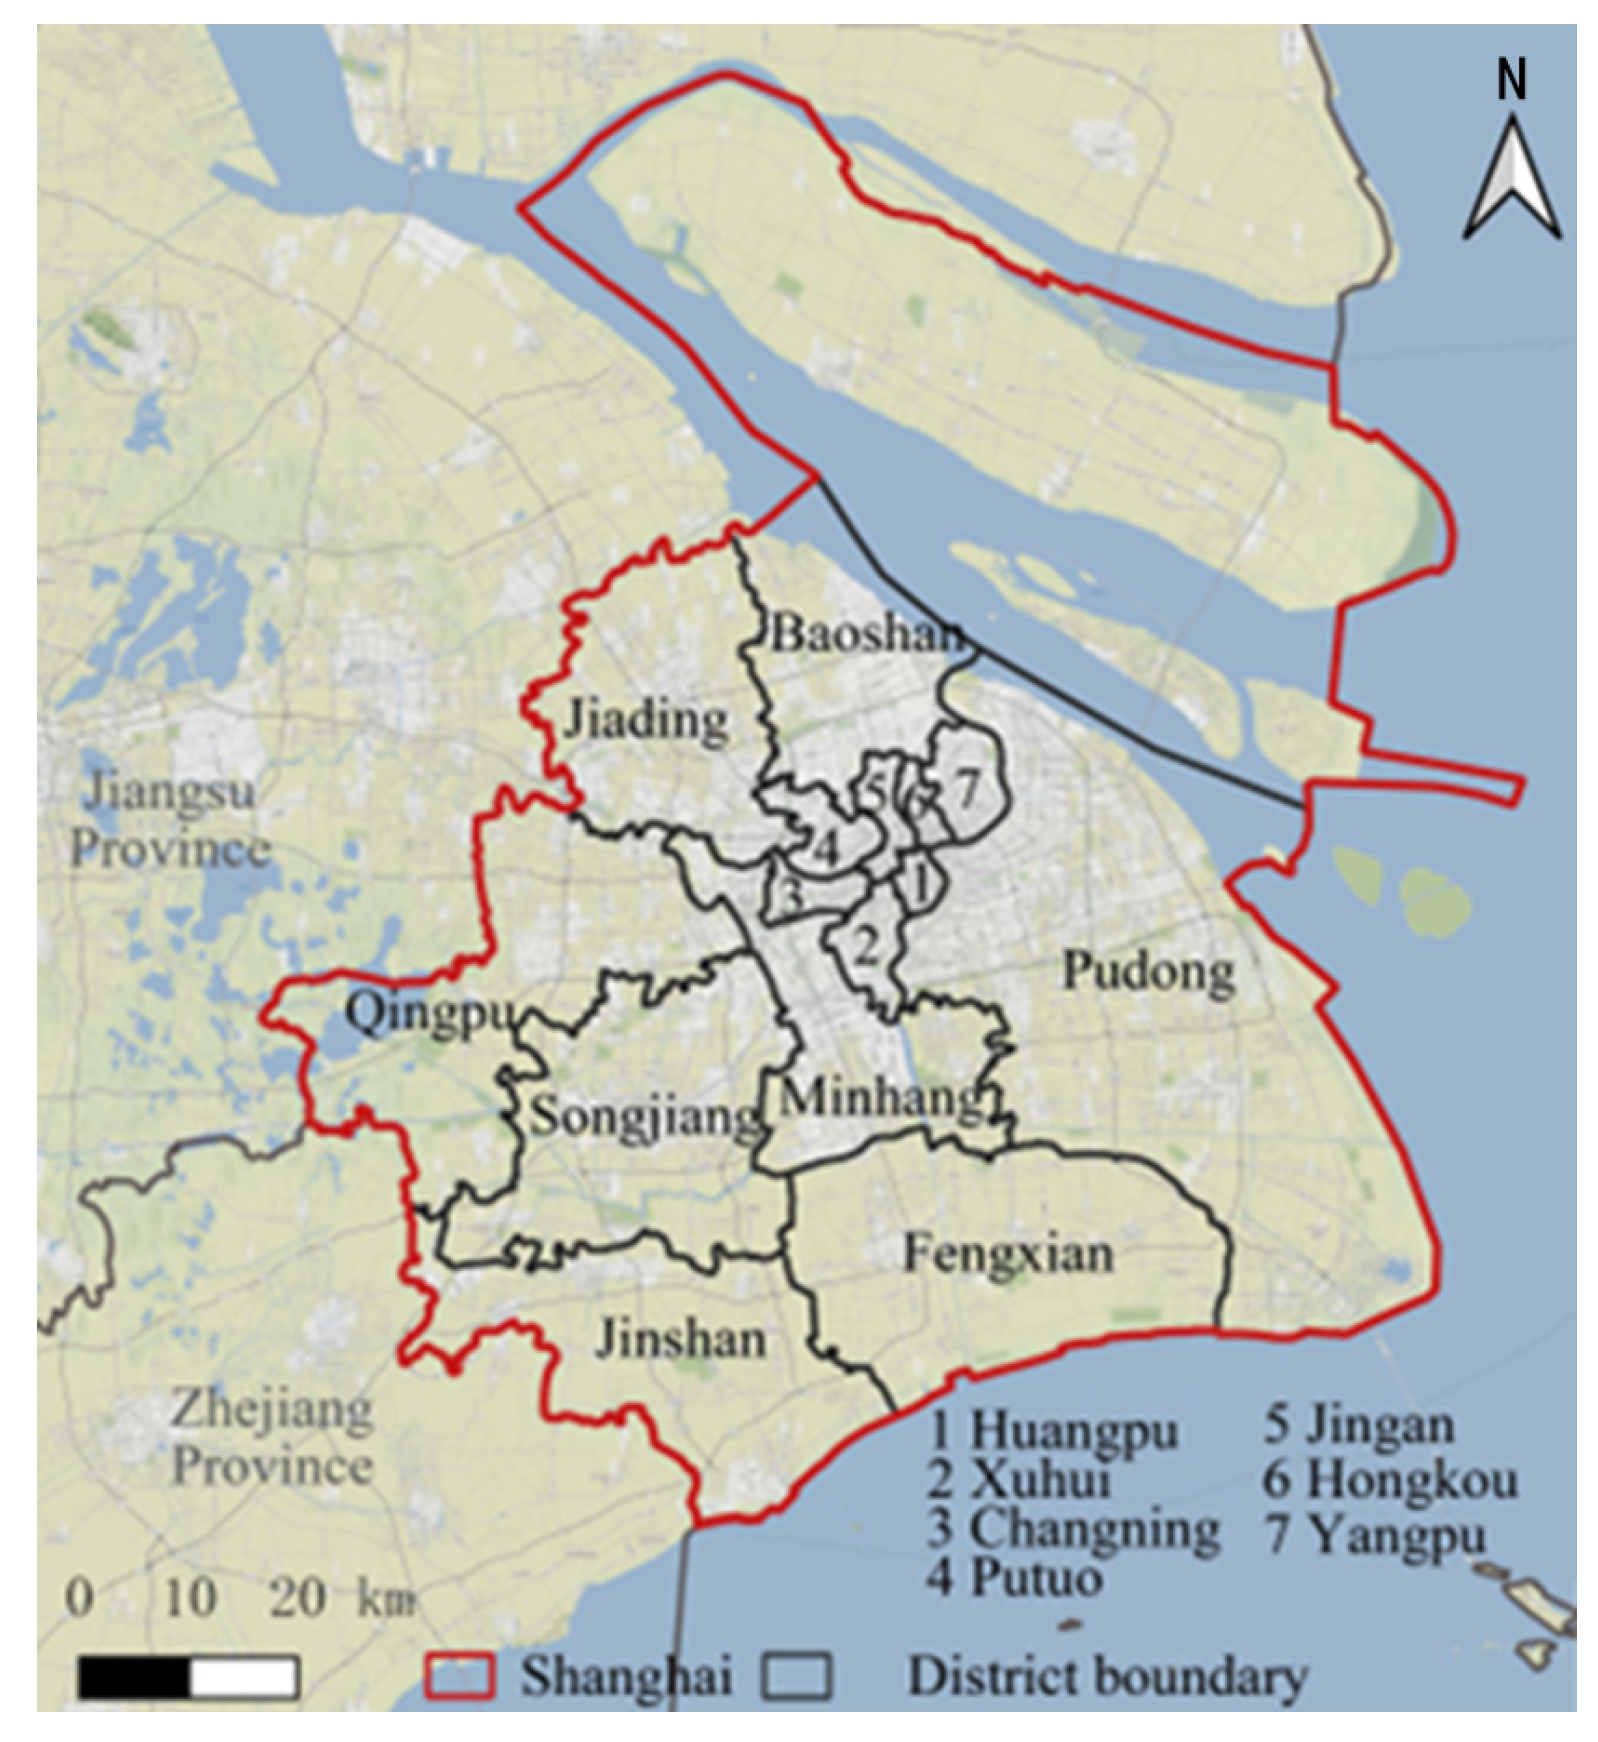
Shanghai (120°52′–122°12′ E, 30°40′–31°53′ N) is a large city in eastern China, located in the Yangtze River Delta region, east of the East China Sea and at the mouth of the Yangtze River (Figure 1). The average elevation of Shanghai is only about 4 m above sea level. The climate of Shanghai is typical of the subtropical monsoon, with an average temperature of about 28 °C in the hottest month, July, and about four °C in the coldest month, January, and an annual precipitation of about 1000 mm. Shanghai comprises 16 administrative districts with a total area of 6340.5 km2 and a current resident population of over 24 million. Shanghai is a hub for technology innovation, trade, banking, shipping, and the national economy. In the last few years, the Shanghai Municipal Government has been promoting the transformation of industrial structure, which has directly led to LUCC [26].
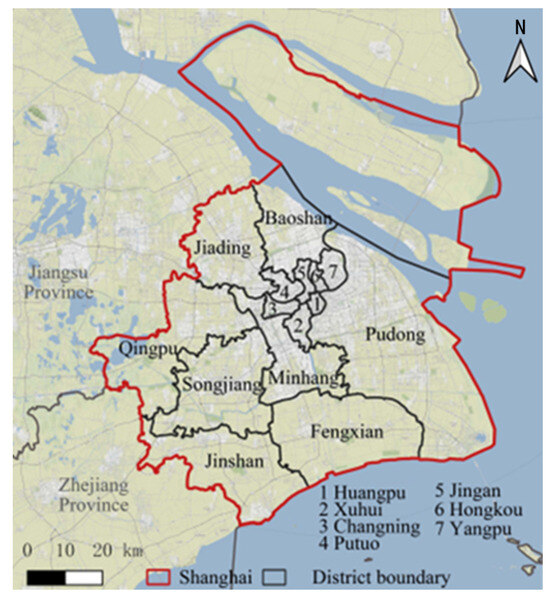
Figure 1.
Location of the study area—Shanghai.
2.2. Data
2.2.1. Natural Geographic and Socio-Economic
The LUCC data are derived from the Global 30 m Land Cover Fine Classification product (GLC_FCS30-2020) based on Landsat data, which are from the Data Sharing Service System of the Chinese Academy of Sciences (https://data.casearth.cn/, accessed on 5 December 2022) with an accuracy of more than 93%, a coordinate system of WGS-84, a spatial resolution of 30 m, a raster data type, and an interval of 5 years. The data periods selected in this study are 2010, 2015, and 2020, and the first-level classification system is adopted, including cropland, forest, grassland, water body, built-up land, and unutilized land.
The Digital Elevation Model (DEM) is from the ASTER GDEM data of NASA and can be downloaded from the Geospatial Data Cloud of the Chinese Academy of Sciences (http://www.gscloud.cn, accessed on 21 December 2022). The spatial resolution is 30 m, the coordinate system is WGS-84, the period is 2010, and the data type is raster data. The Slope and Aspect tool in ArcGIS 10.6 further generates slope and slope direction data from DEM data.
The National Science and Technology Basic Conditions Platform (http://gre.geodata.cn/, accessed on 3 January 2023) provides data on average annual temperature and precipitation. The spatial resolution is 1 km, the coordinate system is WGS-84, the time is 2010, and the data type is raster. The river data are from OpenStreetMap (www.openstreetmap.org, accessed on 26 December 2022), with the same coordinate system and data time as above.
The 2010 Shanghai GDP grid and population density datasets are included in the socio-economic data. These figures are sourced from the Resource and Environmental Science Data Center, Institute of Geographic Sciences and Resources, Chinese Academy of Sciences (http://www.resdc.cn, accessed on 10 January 2023). This dataset divides the country into grid elements of a single standard image of 1 km × 1 km, and the attribute value of each image element is the total population or GDP within the grid. The national 1 km grid population data and national 1 km grid GDP data are extracted using the ArcGIS raster slicing tool Extraction. The spatial resolution is 1 km, the coordinate system is WGS-84, and the data type is raster. The GDP data of Shanghai districts from 2010 to 2020 are taken from each district’s statistical yearbook.
2.2.2. Estimated Carbon Stocks and Their Changes
The four main carbon pools identified by the InVEST model are soil, dead organic matter, below-ground vegetation biomass, and above-ground vegetation biomass in terrestrial ecosystems [18]. In this paper, we analyzed a significant amount of the relevant literature before summarizing the carbon density statistics for Shanghai [28,29,30,31,32,33,34]. Of them, there is little literature that addresses the carbon density of dead organic matter. The carbon pool of dead organic matter has little effect on the overall carbon stock, so dead organic matter possesses a carbon density of 0. According to the InVEST model user manual [35], it is assumed that the carbon density of a particular land use type is treated as a constant by the model carbon storage module. Care should be taken when selecting literature: (i) due to the differences in carbon densities derived by different scholars, data from the same author should be selected as much as possible to avoid too significant a difference in the data; (ii) literature data from East China, especially the Yangtze River Delta (YRD) as the research region, should be selected as much as possible as references. If the carbon density data of the Yangtze River Delta region needs to be included, the latest national carbon density data will be utilized. In the end, the carbon densities of Shanghai’s various land use types are determined (Table 1).

Table 1.
Carbon density data in Shanghai (kg/m2).
2.2.3. Others
Administrative boundary data were obtained from the Resource and Environmental Science Data Center, Institute of Geographic Sciences and Resources, Chinese Academy of Sciences (http://www.resdc.cn, accessed on 10 January 2023), with the coordinate system being WGS-84, and the data type is vector.
Highway and railroad data are from OpenStreetMap (www.openstreetmap.org, accessed on 26 December 2022), the coordinate system is WGS-84, the data time is 2010, and the data type is a vector.
2.3. Methods
2.3.1. Logistic Regression Model
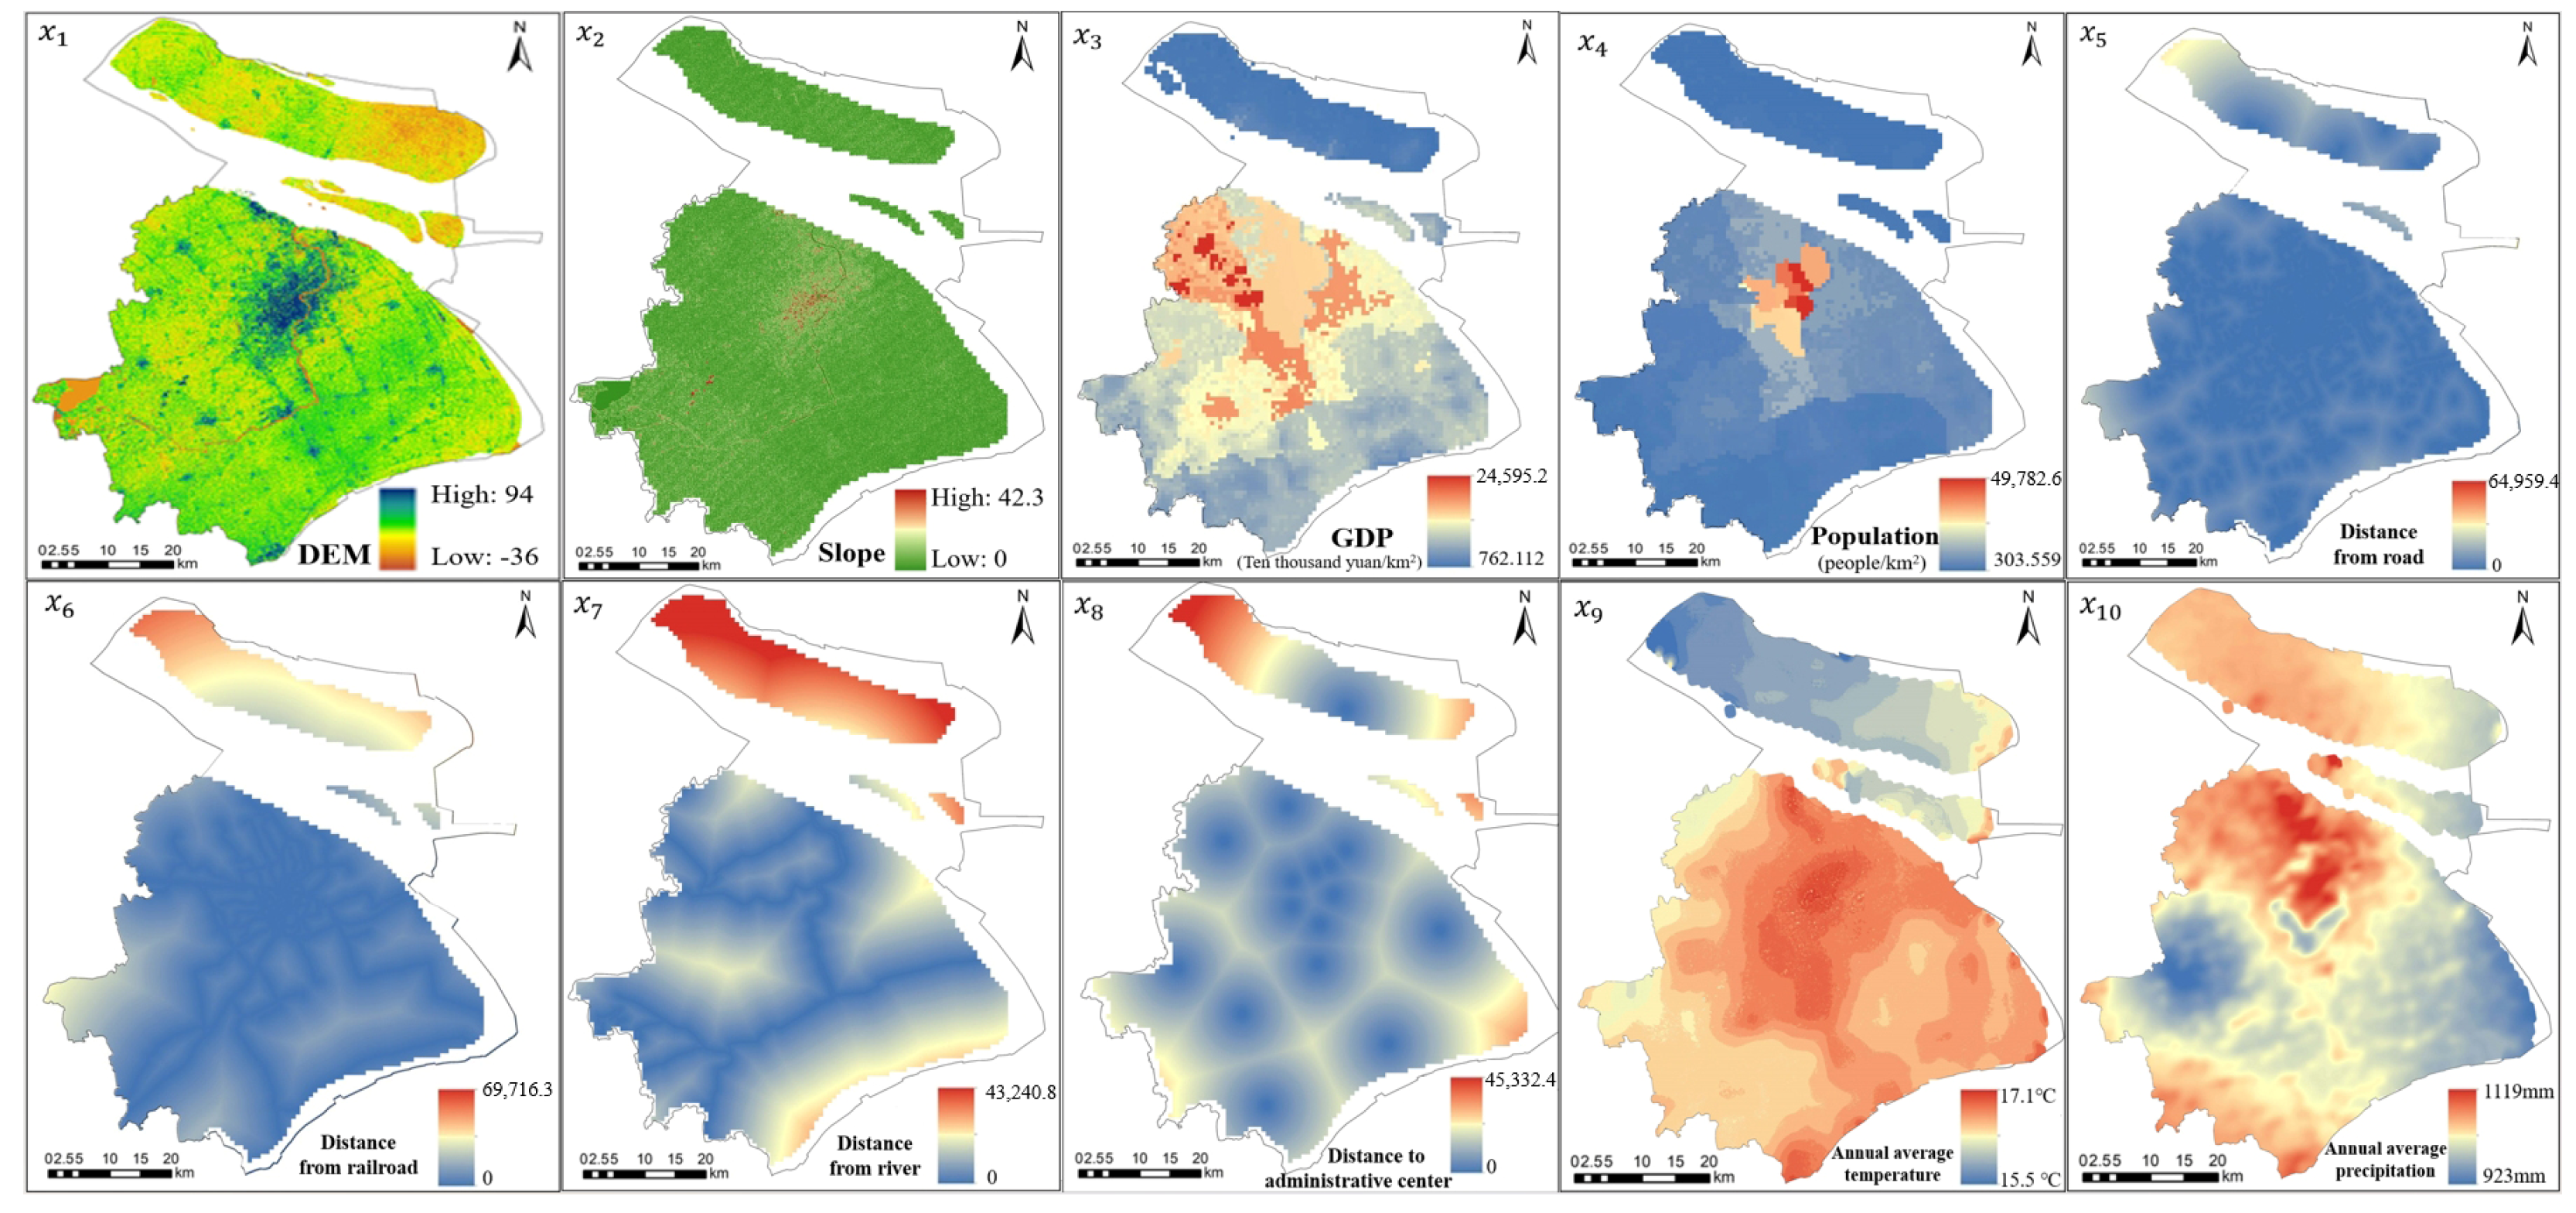
In this paper, the impact of each driving element on the possibility of a change in the land use pattern in the study area is analyzed using the logistic regression model. Logistic regression analysis predicts land use models through the inductive model of evolution [27], which has the advantage that the independent variables do not need to satisfy the normal distribution, and it allows multiple independent variables. In this study, 10 driving factors are selected from four aspects (Table 2 and Figure 2), which are natural factors: elevation () and slope (); socio-economic factors: GDP () and population (); distance factors: distance from highways (), distance from railroads (), distance from rivers (), and distance from the center of the district (); and meteorological factors: average annual precipitation () and yearly average temperature ().
Table 2.
Land use change drivers and their descriptions.
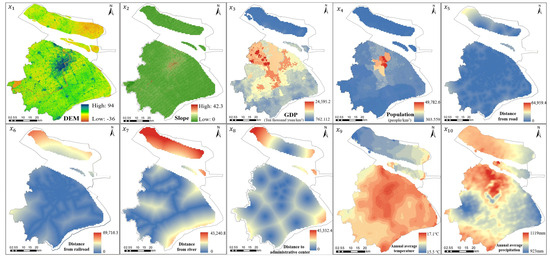
Figure 2.
Raster plot of each driving factor. x1–x10 denote elevation, slope, GDP, population, distance from highways, distance from railroads, distance from rivers, distance from the center of the district, average annual precipitation, and yearly average temperature respectively.
In this paper, the six land use type files and the ten driver files are merged before logistic regression is performed. This process automatically removes null data from the files to form a single record file where each record corresponds to data for one land use type and ten drivers. The single record file for each land use type is analyzed in SPSS 20.0 to derive the regression coefficients β and coefficient indices exp(β) between all of these variables and each type of land use. The regression equation is calculated as in Equations (1) and (2), obtained by deformation, identifying each land use type’s possibility of spatial variability.
where pi is the probability of occurrence of a particular land use type i in each grid; β0 is a constant; are regression coefficients, the larger the value of β, the more significant the correlation between each driver and land use type. Xn,i is the nth driver related to land use type i.
Finally, this study employs PONTIUS R.G.’s ROC (Relative Operating Characteristics) approach [36] to validate the logistic regression analysis results. The Area Under the Curve (AUC) provides a more comprehensive assessment of the performance of the categorical model, especially in the case of category imbalance and threshold insensitivity. AUC values vary from 0.5 to 1.0; values nearer 1.0 denote a better fit, while values nearer 0.5 denote a worse fit. Generally speaking, when the AUC value is greater than 0.75, the model can be considered to have a suitable fit.
2.3.2. CA-Markov Model
The spatial and temporal evolution of many different natural processes, including LUCC, can be simulated by the CA model. There are only a limited number of states for each variable, and the temporal and spatial states are discrete [13]. The rules for state changes reflect local characteristics, and the model is defined as follows:
where denotes the cell state at the moment t + 1; denotes the d-dimensional cell space; denotes the cell loading at the moment t; denotes the combinations resulting from the cell neighborhood states at the moment of showing t; and f denotes the transformation rule.
The Markov model predicts the future land use distribution structure by systematically calculating the excess chances of different states, which have no posteriority and stability. More specifically, Equation (4) can be used to realize the LUCC transition probability matrix from the first to the second period [37] and utilized as the foundation for forecasting the next modifications.
where denotes the current situation of the land use system at the moment t, t + 1, respectively; is the state transfer matrix.
The CA-Markov module that comes with IDRISI can accurately predict the future land use structure and spatial distribution based on Markov chains, and at the same time, the simulation ability of spatial patterns is strengthened by domain relationship analysis [38,39]. The foundation image for prediction is the land usage in 2010. The land use suitability atlas generated by Logistic in 2010 is used as the transformation rule for CA, the 2010–2015 Markov transfer probability matrix is imported, the 5 × 5 filter is set, and the number of loops is 5. The 2020 LUCC-type map of Shanghai is simulated.
In this paper, in order to improve CA and ultimately produce a suitability atlas for each land type, a logistic regression model is used to identify the driving factors that have a more substantial impact on changes in each land use type. The difference between the simulated and true land use maps in 2020 is tested using the Kappa index (Equations (5) and (6)), and comparing the 2020 predicted maps produced by the CA-Markov model alone increases the predictive accuracy of the coupled logistic regression model.
where K is the simulation accuracy index; Pc is the estimated simulation accuracy under the random state; P0 is the actual simulation accuracy; n1 is the samples correctly classified in each land use type; n is the entire amount of samples; and N is the number of classes of land use categories.
2.3.3. Scenario-Based Land Use Prediction
Two scenario models [40,41] (natural development scenario without policy constraints and ecological protection scenario with constraining policies) are introduced to simulate and forecast Shanghai’s land usage in 2025 and 2030. Scenario I is the natural development model. Under the conditions of this scenario, the demand for land use in Shanghai is not affected by policy adjustments.
Specifically, the IDRISI model’s CA-Markov module contains Scenario I, based on real land use data in 2020, adding the suitability atlas corrected by the driving factors, importing the transfer probability matrices for 2010–2015 and 2010–2020, and setting the number of cycles to 5 and 10, respectively, to ultimately simulate and obtain the land use prediction results under the scenarios of Shanghai Municipality’s natural development. Scenario II is the ecological protection model. The Shanghai Urban Master Plan proposes strict measures to control urban expansion. On the one hand, the protection of cropland is strengthened, and the protection of particular ecological function areas, such as nature reserves, forest parks, wetlands, and water sources, is increased; on the other hand, it can be certain that there will be no extra growth or negative growth in the overall amount of the planned building land, and attention is paid to the protection of permanent basic farmland [42]. In this study, the 2025 and 2030 land use prediction results of Shanghai under the ecological protection scenario are obtained by imposing built-up land constraints and changing the parameters of the transfer matrix in the model.
Built-up land constraints refer to the requirements made in the Shanghai Urban Master Plan (2017–2035) for strengthening ecological protection. Restrict the encroachment of built-up land on existing rivers, protected farmland, nature reserves, forests, green areas, and parks. Combine the changed built-up land use suitability maps into the new Shanghai Land Use Suitability Atlas for Ecological Protection Scenarios.
Change the transfer matrix parameters by increasing the transfer probability from cropland to forest land by 0.8% and decreasing the likelihood from cropland to built-up land by 0.8%. Decrease the transfer probability from forest land to cropland by 0.3% and from forest land to built-up land by 0.2%. The probability of transferring built-up land to forest land increased by 0.2%, and the probability of transferring built-up land to grassland increased by 0.2%.
2.3.4. Invest Model
Based on InVEST V3.11.0, this study uses the necessary data for the model (current land use map, land use projection map, and carbon density data) to analyze how changes in land use affect Shanghai’s ability to sequester carbon. Carbon stocks are calculated by applying the product of the carbon density pool and the area of the corresponding land use type. The soil carbon pool, above-ground vegetation carbon pool, underground vegetation carbon pool, and dead organic matter carbon pool are the primary components of the carbon density pool. The following is the calculating formula:
where Cstorage denotes the overall carbon stock of soil and organisms in the study area; Csoil denotes the soil carbon stock per unit area, i.e., soil carbon density (t/hm2); Cabove, Cbelow, and Cdead denote the above-ground vegetation carbon stock per unit area (t/hm2), below-ground vegetation carbon stock (t/hm2), and underground vegetation dead organic matter carbon stock (t/hm2); S denotes the area of the land use type.
3. Results
3.1. Characterization of LUCC and Analysis of Driving Forces
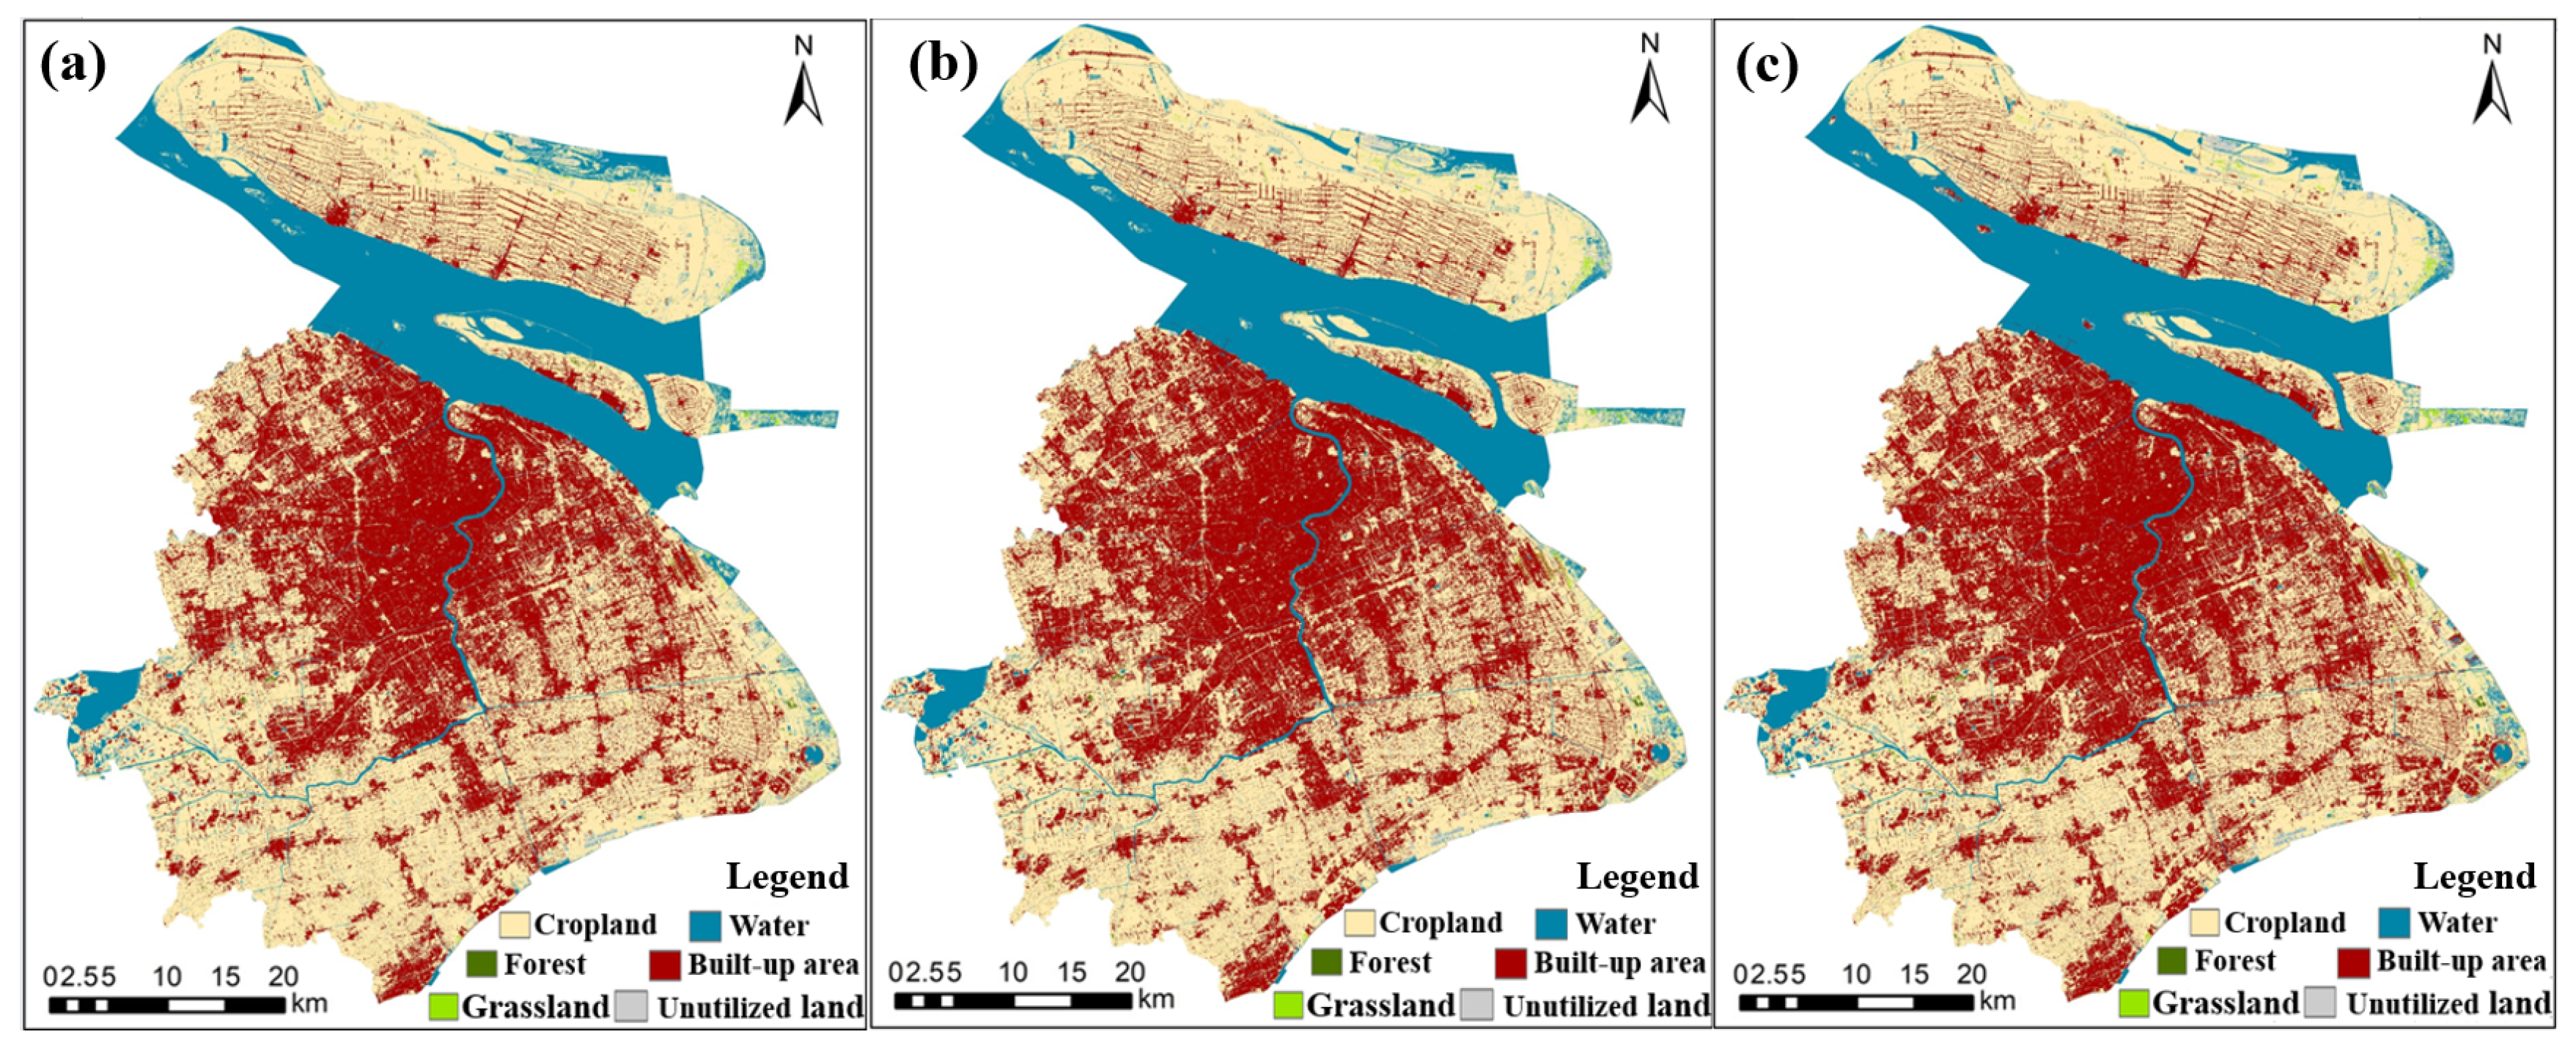
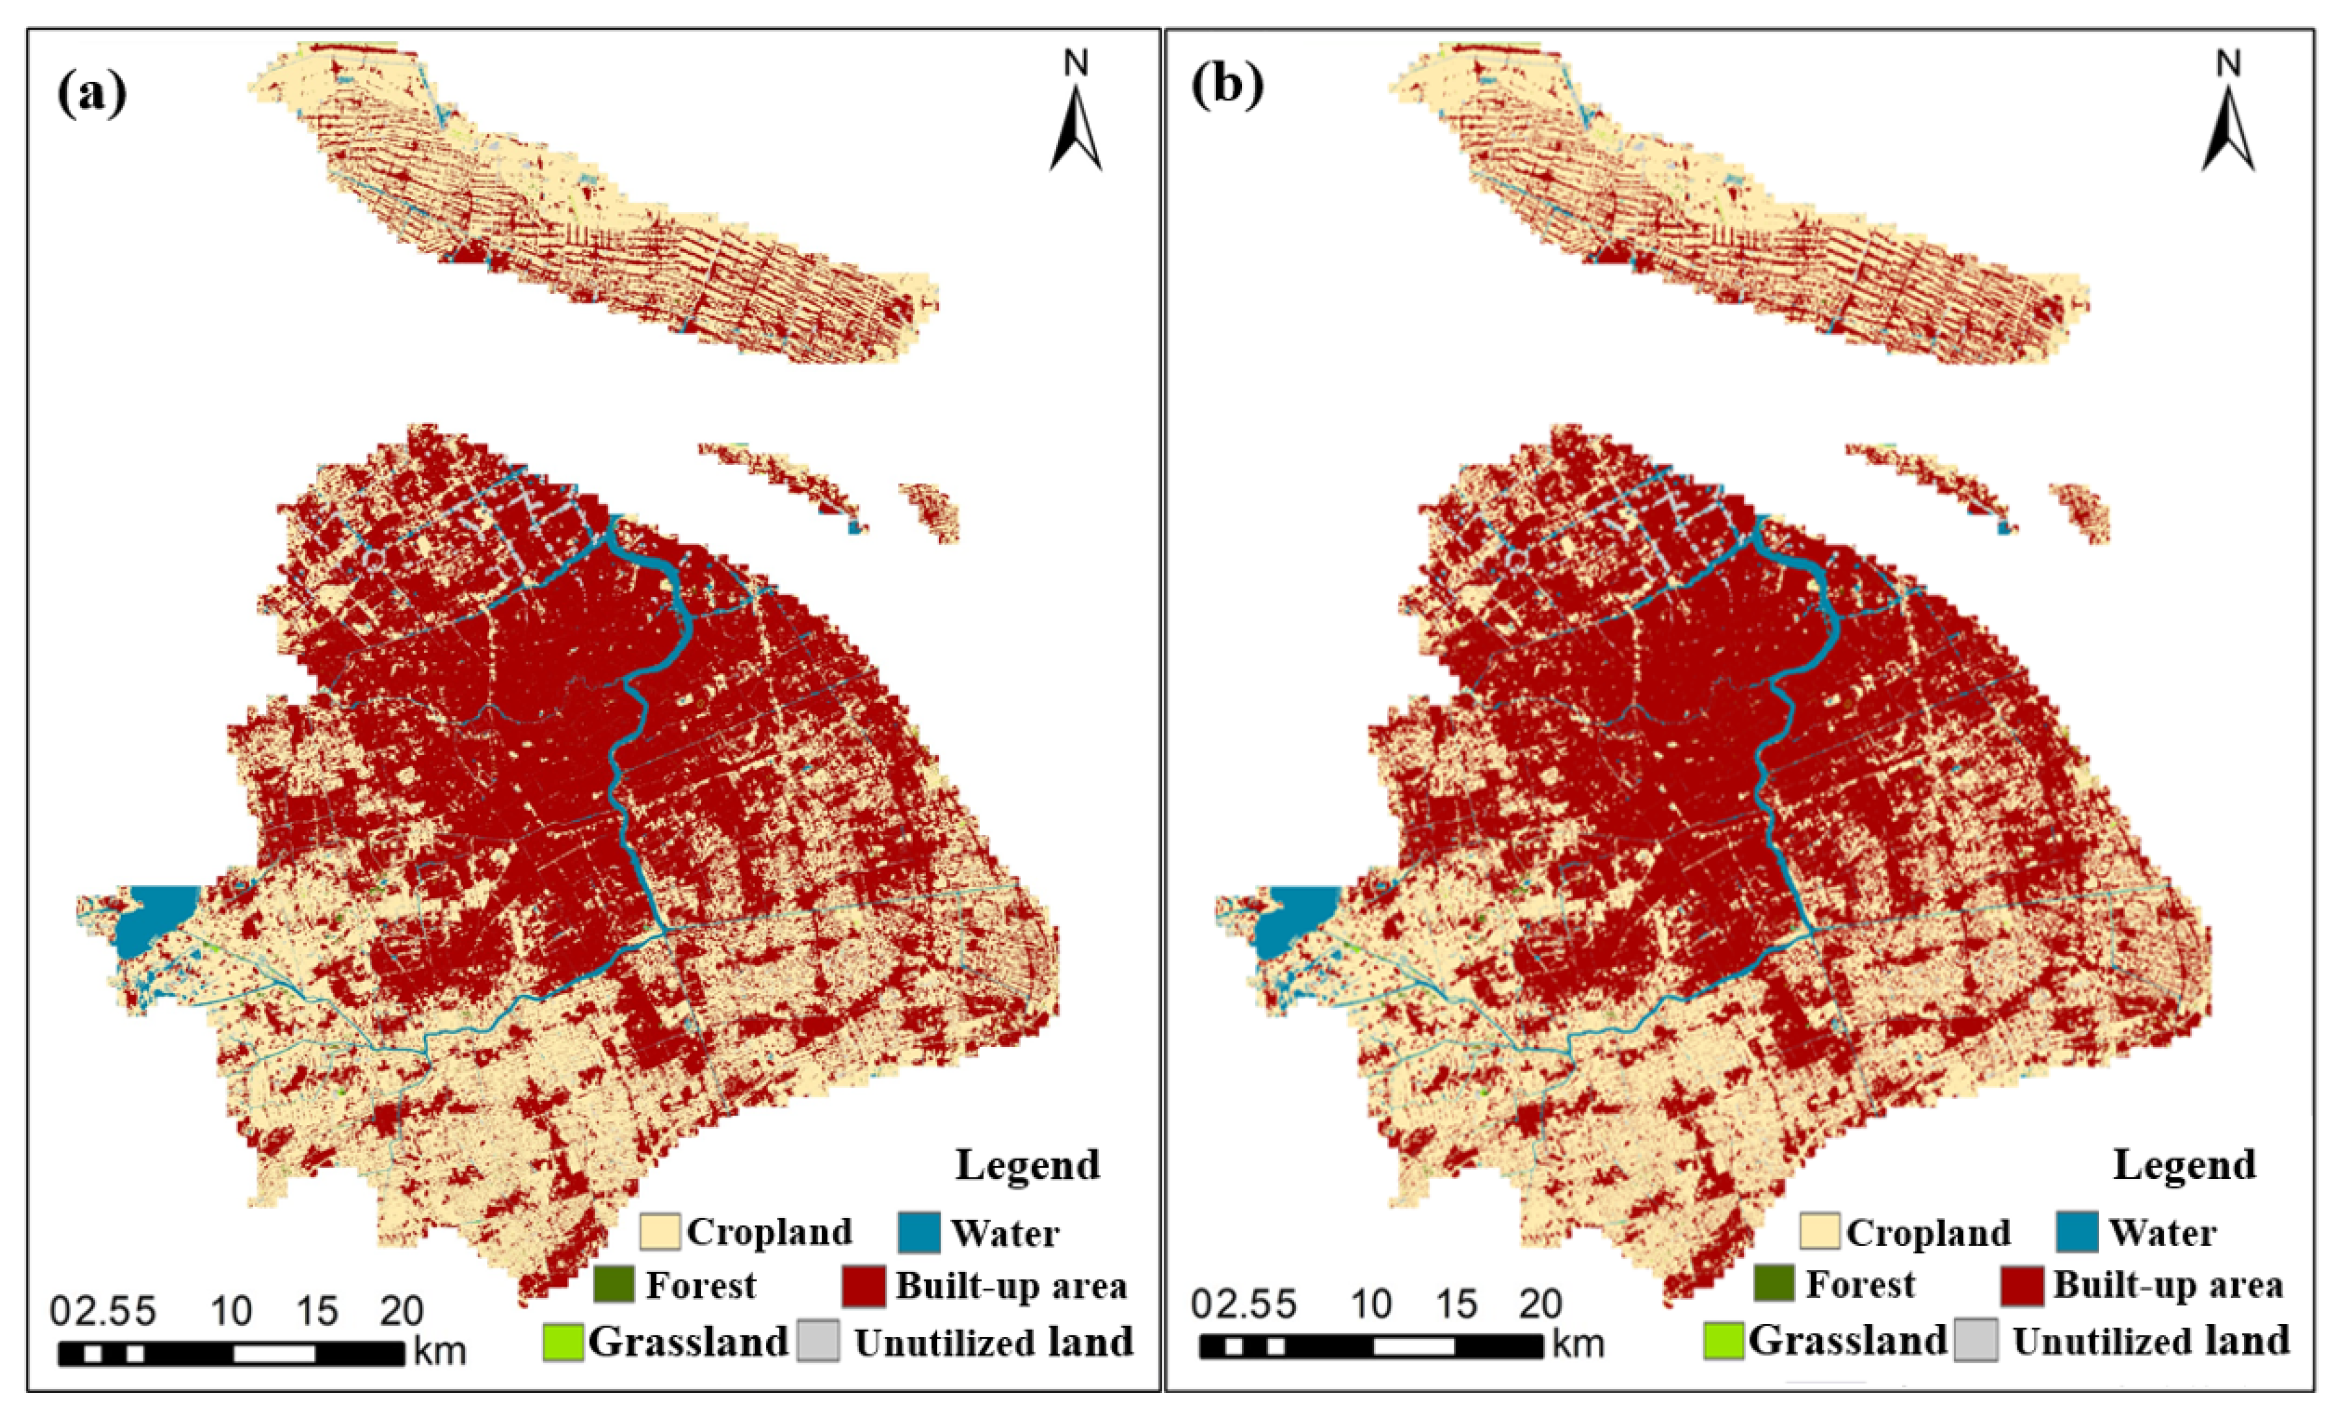
Land use in Shanghai is dominated by built-up land and cropland, and rapid urbanization has taken up a significant proportion of non-construction land between 2010 and 2020. Cropland land and water bodies decrease year by year, and the area of cropland decreases the most, with the area share shrinking from 52.44% to 48.10%, a decrease of 34,912.76 hm2. Forest land area has a small increase in the first 5 years but then declines to a lower level than the previous period in the second 5 years, with a 10-year decrease of 55.68 hm2. Grassland area continues to grow in the 10 years, from 2214.77 hm2, or 0.27%, to 3470.14 hm2, or 0.43%. The area of land that has been developed has been growing annually at a more remarkable rate, from 29.63% to 34.11%, with an increase of 36,048.24 hm2 in 10 years. The area of unutilized land has been increasing slightly yearly, from 1.3% to 1.77%, with a rise of 1932.3 hm2 in 10 years. Regarding distribution, construction land is mainly located in urban and suburban areas. Cropland is primarily distributed in remote suburban regions and Chongming Island. Water bodies are mainly distributed around the urban area and Chongming Island, and grasslands and woodlands are scattered sporadically (Figure 3).
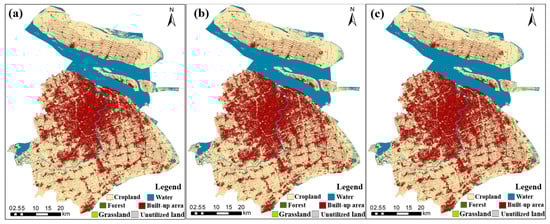
Figure 3.
Map of land use/cover types in Shanghai: 2010 (a), 2015 (b), 2020 (c).
The logistic regression equations for the six land use types in Shanghai and the 10 selected driving factors (—DEM, —slope, —GDP, —population, —distance to highway, —distance to railroad, —distance to river, —distance to the administrative center, —mean annual precipitation, and —mean annual air temperature) are as follows:
- (1)
- Cropland
- (2)
- Forest
- (3)
- Grassland
- (4)
- Water body
- (5)
- Built-up land
- (6)
- Unutilized land
Cropland tends to be distributed in areas with lower temperatures and gentle slopes, contrary to the traditional distribution characteristics of cropland. This is because Shanghai is highly urbanized, and the heat island effect is obvious. Cropland is more often distributed in the suburbs far away from the city center, i.e., in areas with lower temperatures. Built-up land tends to be distributed in areas with higher temperatures and slopes. Due to the gentle topography and low elevation of Shanghai, the higher elevation and slope did not harm the distribution of construction land in Shanghai. The distribution of grassland and forestland is more likely to occur in regions with lower elevations, lower temperatures, and less precipitation. Unutilized land tends to be distributed in areas with lower elevations, gentler slopes, sparser populations, and farther away from highways and administrative centers (Table 3).
Table 3.
Logistic regression results of driving factors for each land use type in Shanghai.
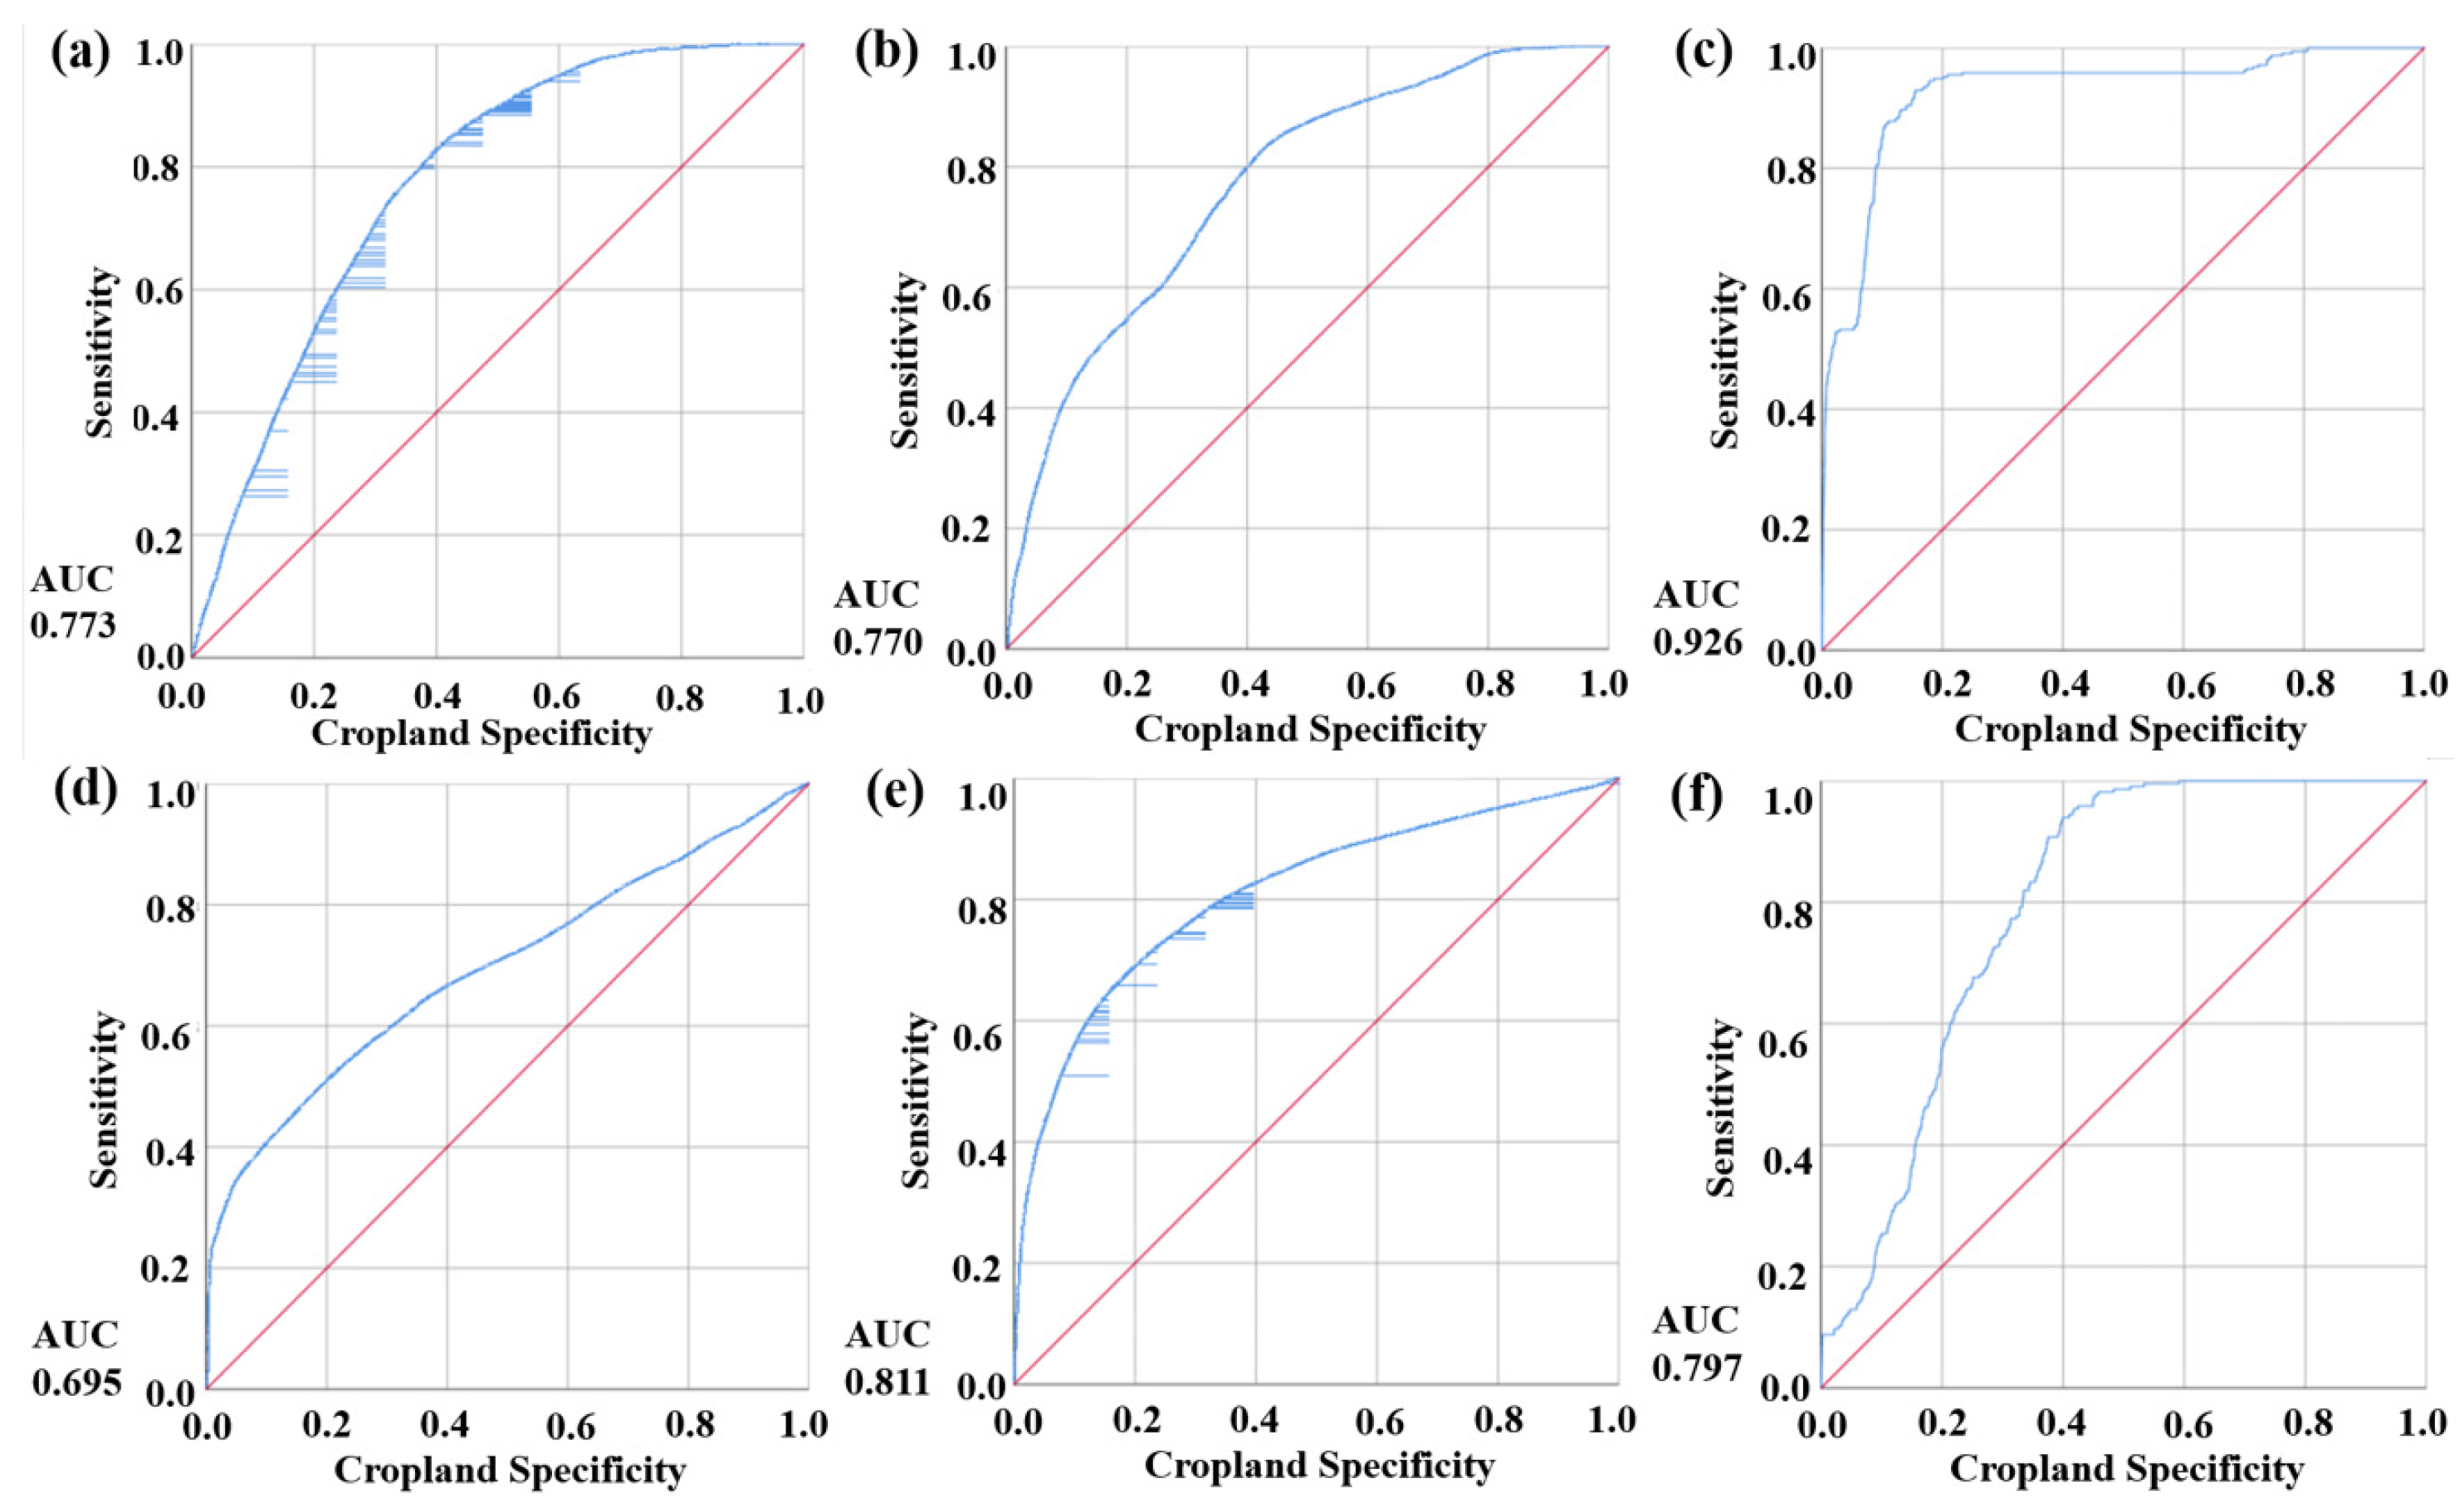
According to the test results of AUC (Table 4, Figure 4), the AUC values of the other five land categories except water bodies exceeded 0.75, reaching a better validation accuracy. Although the AUC value of the water body did not reach 0.75, the regression model still has a suitable level of explanation due to the small area of water in Shanghai. The relationship between the driving variables and the different categories in Shanghai can be more accurately simulated by the logistic regression model that was employed in this study.
Table 4.
AUC detection values.
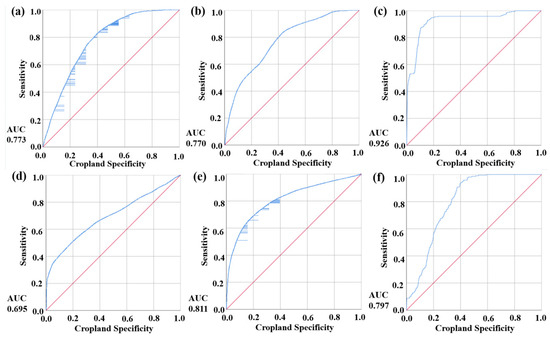
Figure 4.
ROC curves for each category: cropland (a), forest (b), grassland (c), water body (d), built-up land (e), unutilized land (f). The red line indicates that positive and negative samples have the same predictive probability, and the blue line indicates the performance of the model, with the closer to the upper left corner, the better the performance of the model.
3.2. Land Use Prediction Based on the Logistic-CA-Markov Model
This study’s application of the Logistic-CA-Markov model can somewhat increase the accuracy of land use prediction [39] (Figure 5). In this paper, 2020 land use is predicted twice. The first time, the CA-Markov model was the sole tool used for prediction, and no other driving elements related to land use were added; the second time, the influence factors obtained by logistic regression significantly impacted the driving forces of each category. The results demonstrated that the CA-Markov model’s prediction accuracy (Kappa value) was 0.8872, and the prediction accuracy obtained by the Logistic-CA-Markov model with the added driving factors was 0.922.
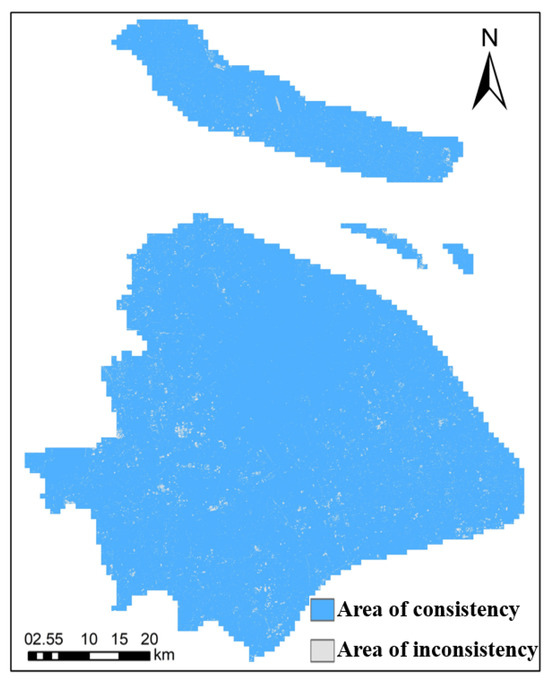
Figure 5.
Differences in land use simulation for 2020 based on the Logistic-CA-Markov model.
In 2025, under the natural development scenario, the projected cropland area is 262,889.36 hm2, which is 33,883 hm2 less than the actual shrinkage in 2020, and it is the land category with the largest shrinkage area. The projected area of forest land is 2083.08 hm2, an increase of 1403 hm2. The projected area of grassland is 2623.8 hm2, a rise of 1466 hm2. The projected area of the water body is 18,279.19 hm2, a rise of 4034 hm2. The projected area of built-up land is 271,643.49 hm2, an increase of 23,304 hm2. The projected area of unutilized land is 11,744.49 hm2, a rise of 5428 hm2. In this scenario, the cropland area is seriously reduced, the area of built-up land is greatly increased, and the extent of forest land, grassland, and water bodies and the amount of unutilized land has considerably grown.
In 2025, the estimated area of cropland under the ecological protection scenario is 278,960.73 hm2, which is 17,811 hm2 less than that in 2020, whereas ecological land increases more than it would in the natural scenario, including forests, grasslands, and water bodies. There is an increase of 2409 hm2 in the amount of forest land, 2035 hm2 in the area of grassland, 4056 hm2 in the area of a water body, and 4560 hm2 in the area of unutilized land. The construction land area expanded by 4752 hm2, which is 17,790 hm2 less than that of the natural development scenario, which indicates that the city’s development based on the premise of ecological preservation can effectively promote the city’s sustainable development (Figure 6, Table 5).

Figure 6.
Predicted natural development scenarios for Shanghai: 2025 (a), 2030 (b).
Table 5.
Differences in area of each land category under the two prediction scenarios for 2025 and 2030 (unit: km2).
Under the natural development scenario, the cropland area falls to 250,310 hm2 in 2030, down 46,462 hm2 from 2020. The built-up land area rises to 285,426 hm2 (an increase of 36,325 hm2). The forest, grassland, and unutilized land areas increased by 274 hm2, 562 hm2, and 5338 hm2, respectively. If this scenario continues to develop, the rapid expansion of built-up land, the rapid shrinkage of cropland, and the weak growth of forest and grassland will lead to the unbalanced development of Shanghai’s ecological structure and the rapid deterioration of the ecological environment.
The cropland area falls by 39,333 hm2 in the ecological protection development scenario in 2030 compared to 2020, which is less than the decrease under the natural development scenario. Comparing the built-up land area to the natural development scenario, 13,518 hm2 is lost. It expands to 271,909 hm2, which shows that the expansion of built-up land is well controlled under the ecological protection scenario. Forestland and grassland grow rapidly in this scenario, increasing by 4066 hm2 and 5034 hm2, respectively, in comparison to 2020. The development of ecological land in Shanghai has increased the amount of eco-friendly land, which has partially compensated for the reduction in cropland (Figure 7, Table 5).
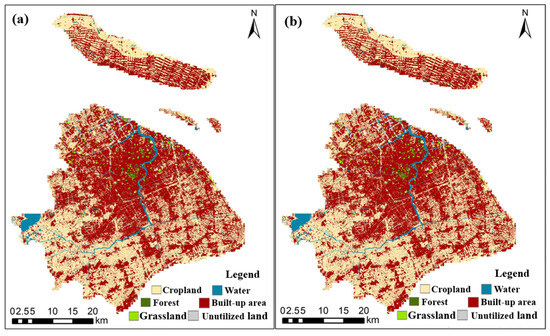
Figure 7.
Predicted ecological protection scenarios for Shanghai: 2025 (a), 2030 (b).
3.3. Analysis of Shanghai’s Carbon Sequestration Capacity
3.3.1. Status of Carbon Sequestration in Shanghai
From 2010 to 2020, the total carbon stock in Shanghai decreased from 66.3069 million tons to 65.8889 million tons. The carbon stock of cropland shrinks year by year with the reduction in area, from 40.9989 million tons to 37.2461 million tons, a decrease of 3.7528 million tons in 10 years. As the area expands, the carbon stock of construction land increases, with rapid growth in the first 5 years and slowing down in the second 5 years, reaching 27.6137 million tons by 2020, with a total growth of 3.2681 million tons in 10 years. Carbon stock in forest land increased by a small amount of 6400 tons during the first five years, then decreased by 10,100 tons during the second five years, with an overall decrease of 3700 tons during the decade. Carbon stocks in grassland continued to increase by a small amount, by 9700 tons in the first five years and by 12,800 tons in the second five years, for an overall increase of 22,500 tons over the decade. Carbon stocks in unutilized land continue to grow, increasing to 0.8196 million tons in 2020. Carbon stocks in the water body are not counted.
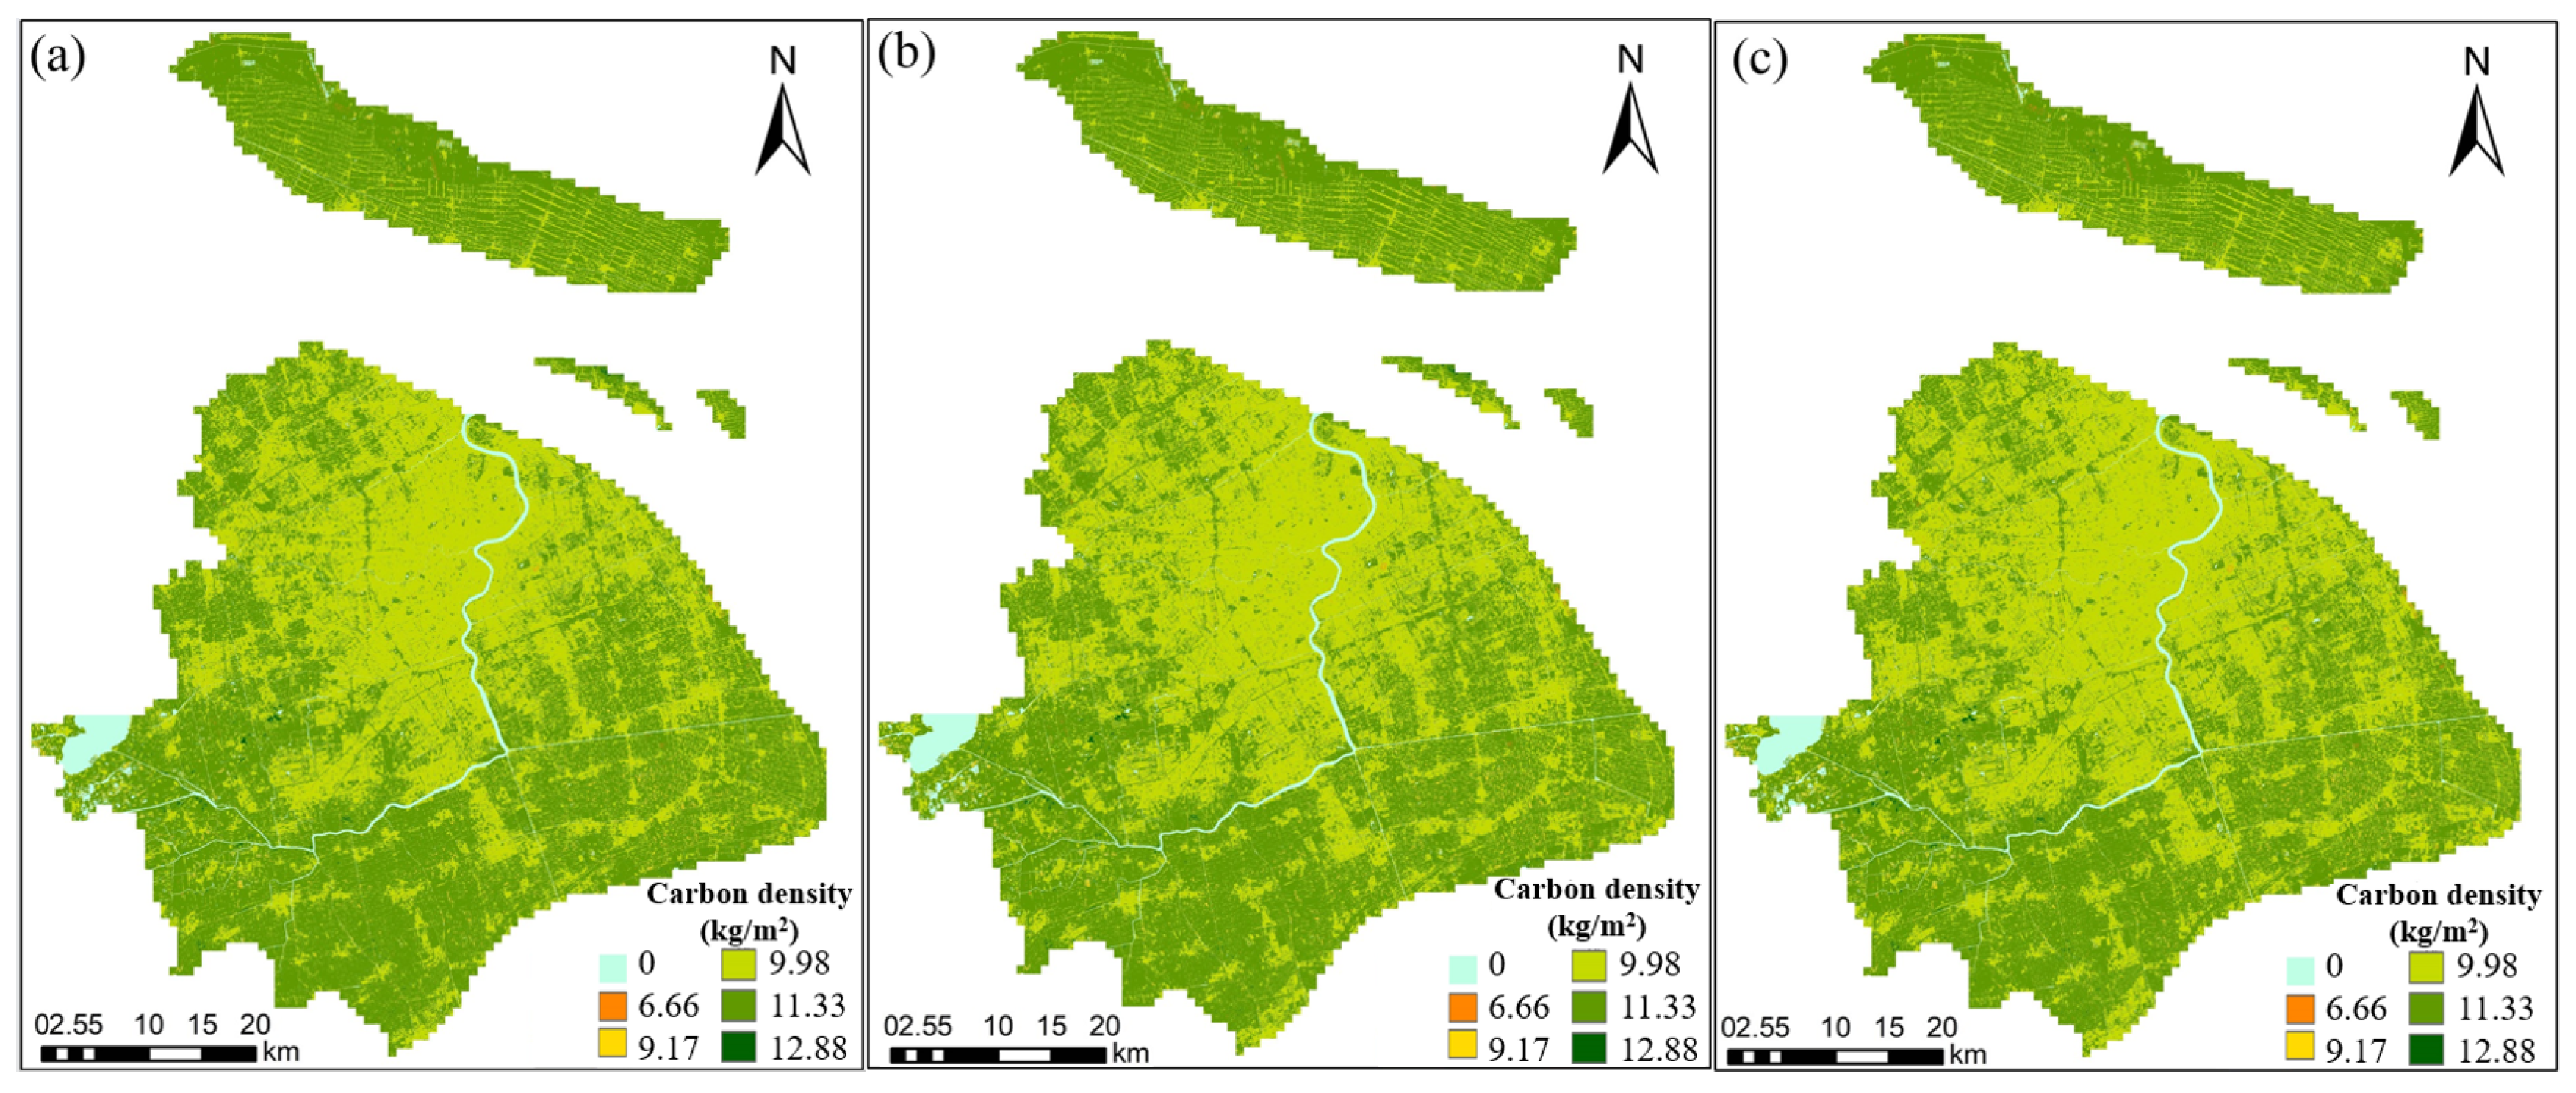
There is no balance of carbon stocks among the various land types in Shanghai. Increased urbanization has led to the encroachment of cropland, and the area of ecological land has remained the same, such as forest and grassland. Cropland’s carbon stock has drastically dropped, and it is challenging to balance the rise in other land types’ carbon stocks. If this trend continues, it may adversely affect urban ecology and lead to unsustainable urban development challenges. Based on data on land use of various land use categories in Shanghai and the carbon density (Table 1), the carbon density distribution map (Figure 8) and carbon stock data (Table 6) of Shanghai in 2010, 2015, and 2020 are obtained.
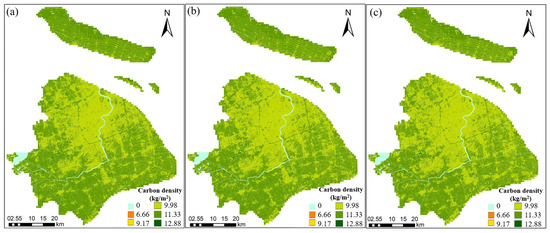
Figure 8.
Carbon intensity distribution of Shanghai: 2010 (a), 2015 (b), 2020 (c).
Table 6.
Changes in carbon stocks in different land use types in Shanghai (×104 t).
From the perspective of administrative divisions, Huangpu District has always been the district with the lowest carbon stock in Shanghai, with the stock not reaching 2.1 × 10⁵ t in any of the three years. The district with the highest carbon stock has always been Pudong New District, with the stock exceeding 1.2 × 10⁷ t in all three years (Figure 9). Huangpu, Xuhui, Jing’an, Putuo, Hongkou, and Yangpu districts all showed growth in carbon stock over the decade. Xuhui District’s carbon stock grew the most, reaching 5.9 × 10⁵ t in 2020, with a growth rate of 0.18%. Hongkou District has the least growth in carbon stock, running 2.5 × 10⁵ t in 2020, with a growth rate of 0.11%. The other 10 districts saw a decrease in carbon stock, with the most significant reduction in Pudong New District, which decreased by 1.2 × 10⁵ t in 10 years, a shrinkage rate of 0.9%. The district with the least decline in carbon stock is Changning District, with a reduction of only 125 t in 10 years, with a shrinkage rate of 0.03%.
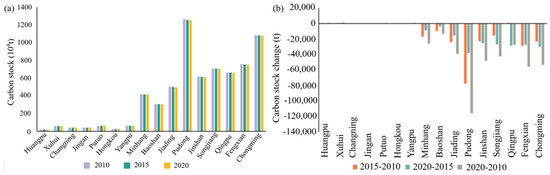
Figure 9.
Carbon stock (a) and its change (b) in each district of Shanghai.
The six districts that showed an increase in carbon stock all belong to the central city of Shanghai. The administration is more concerned with maintaining the center’s landscape and safeguarding its greenery, which leads to an increase in carbon stock in the center of the city. The 10 districts with decreasing carbon stocks belong to the non-central urban areas of Shanghai, which are still in the stage of rapid economic development from 2010 to 2020. The increase in industries will lead to the rapid inflow of foreign population, and the expansion of residential land and industrial land would lose the region’s carbon reserves.
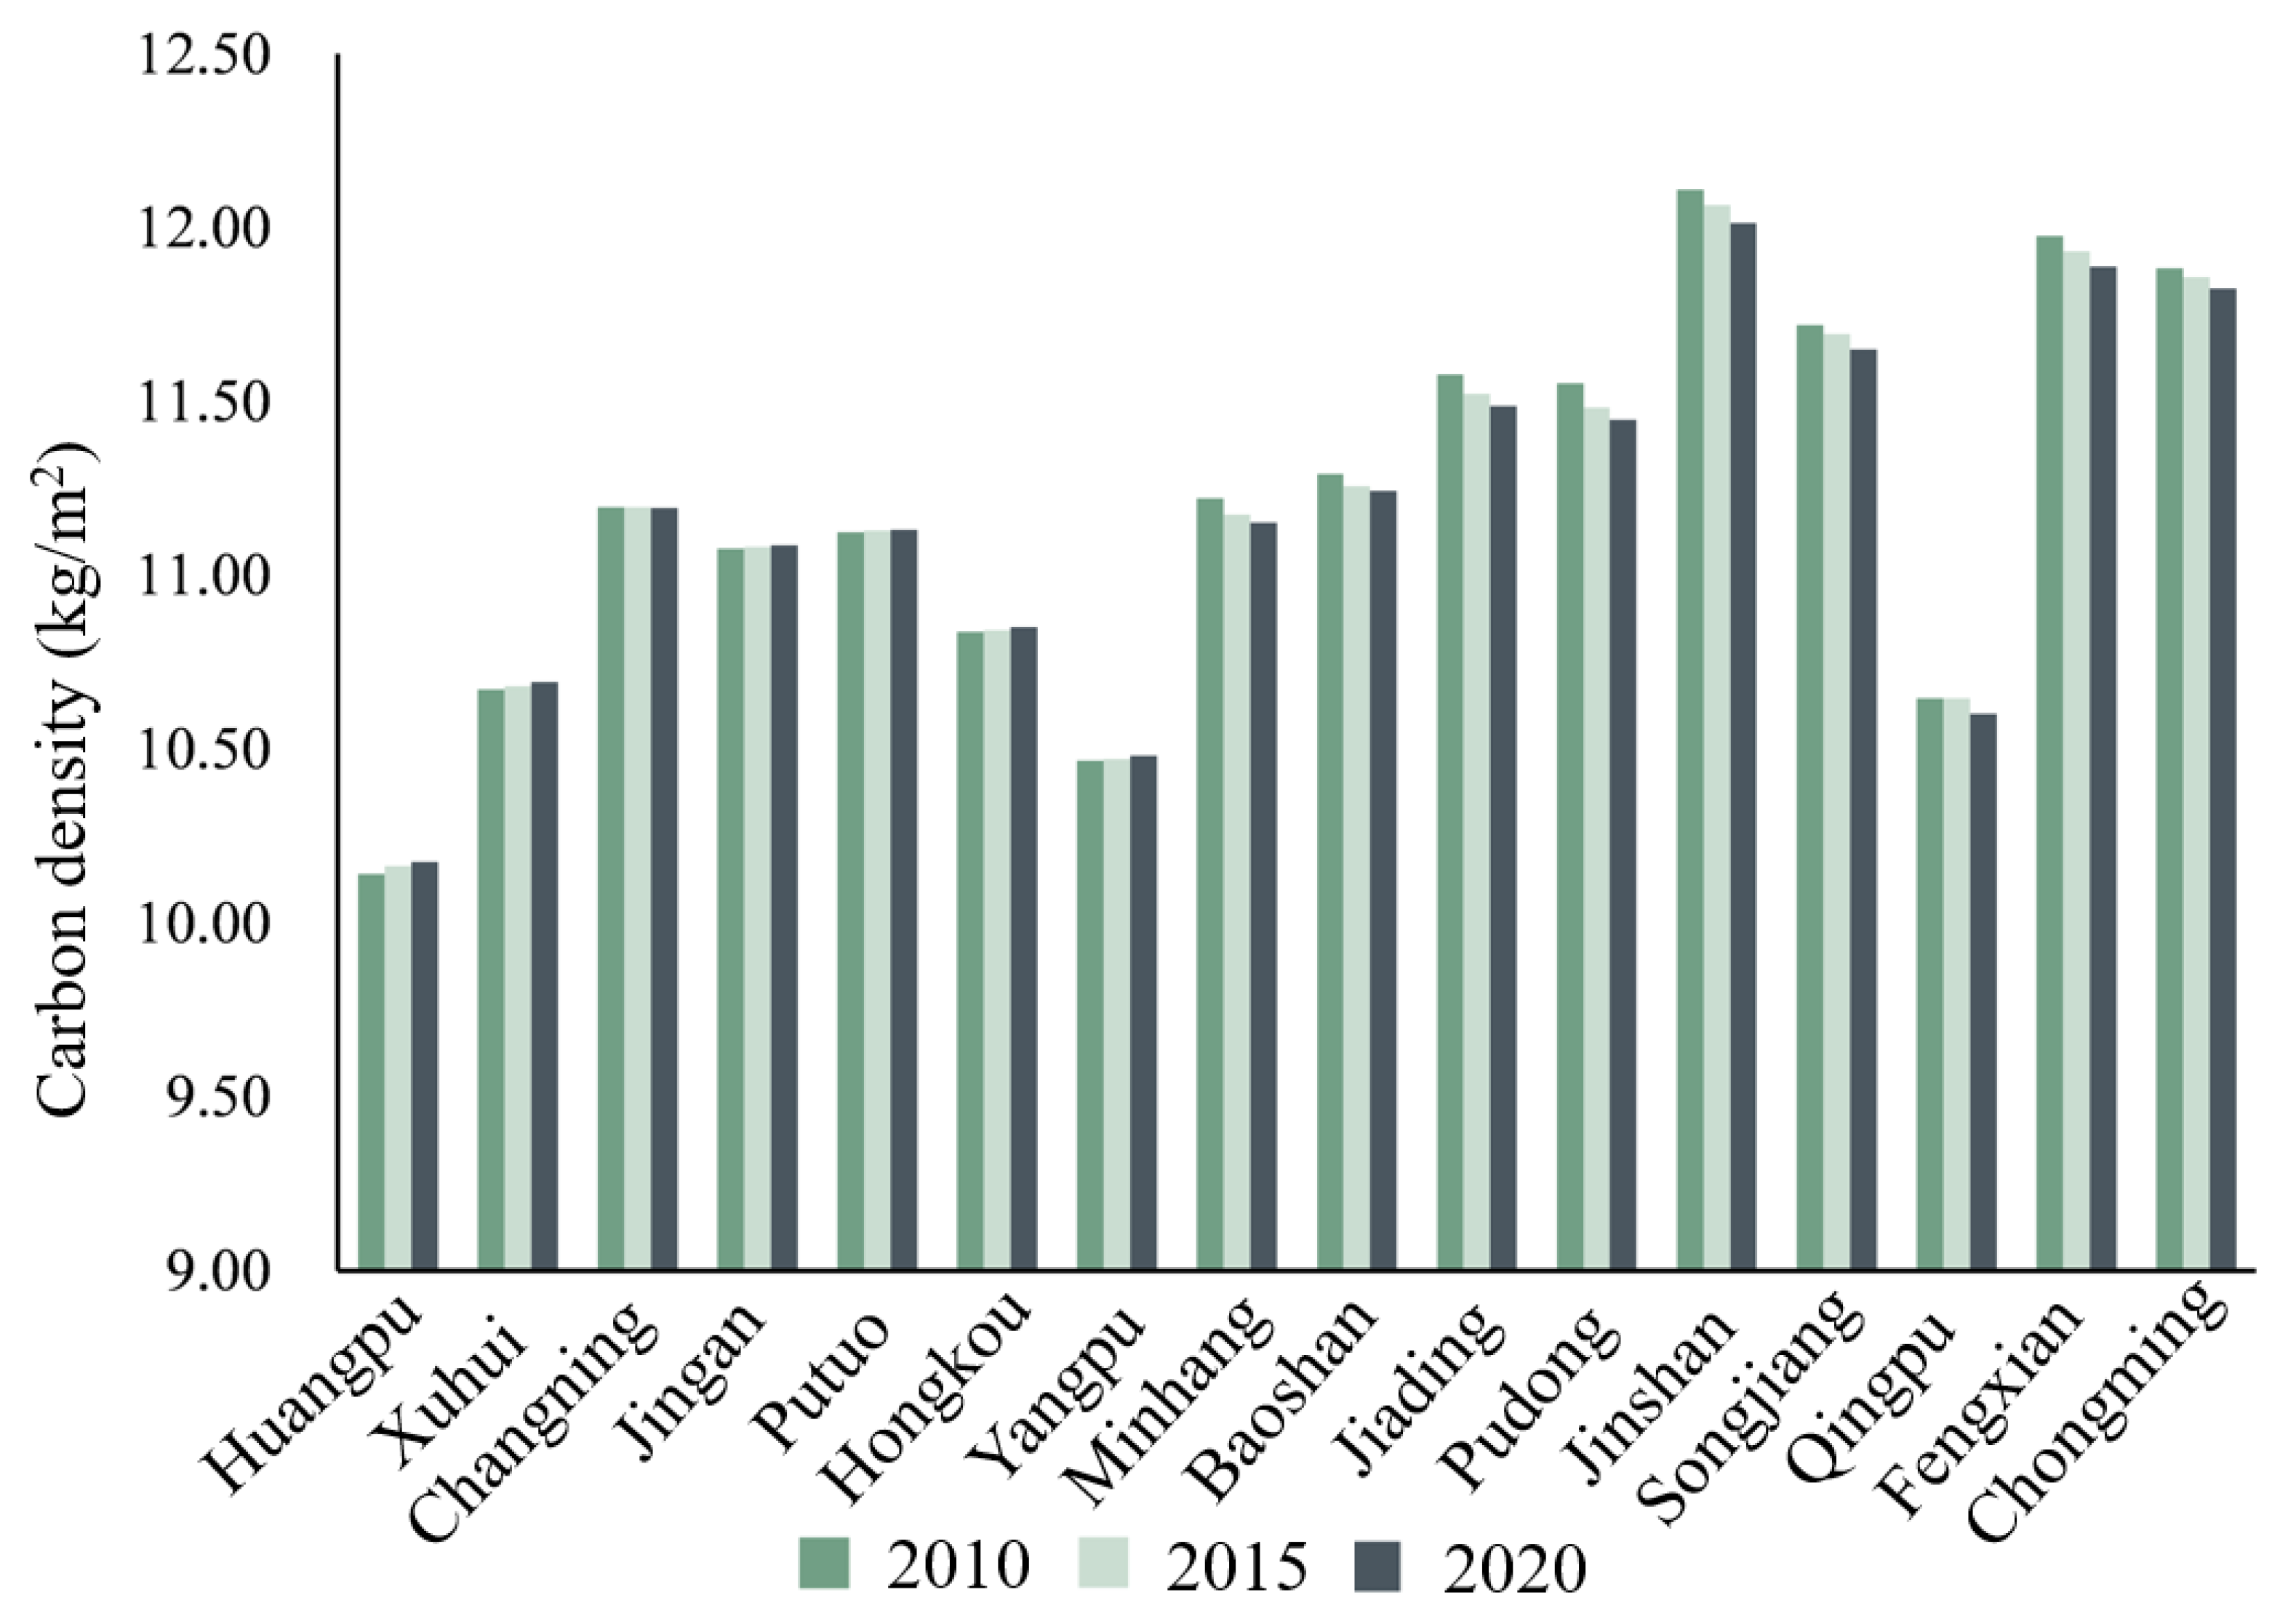
Arranged by the average carbon stock between 2010 and 2020, the carbon densities of Shanghai districts in ascending order are Jinshan District, Fengxian District, Chongming District, Songjiang District, Jiading District, Pudong New District, Baoshan District, Changning District, Minhang District, Putuo District, Jing’an District, Hongkou District, Xuhui District, Qingpu District, Yangpu District, and Huangpu District, respectively (Figure 10 and Table 7). The highest carbon density is in Jinshan District, with a three-year average of 12.06 kg/m2; the lowest is in Huangpu District, with an average of 10.16 kg/m2. Only the central six districts among the 16 administrative districts in Shanghai show a slight increase in carbon density, all within 0.05 kg/m2. The 10 suburban districts show a more obvious decline in carbon density, with Pudong and Fengxian showing the most pronounced decline. The carbon density of Pudong New District decreased by 0.1 kg/m2 in 10 years, and Fengxian decreased by 0.09 kg/m2.
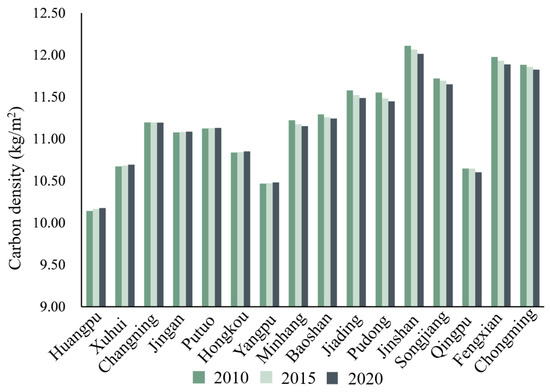
Figure 10.
Carbon density of Shanghai districts in 2010, 2015, and 2020.
Table 7.
Carbon density of Shanghai districts (unit: kg/m2).
The areas with lower carbon density are urban centers with high population and building land density. The areas with higher carbon density belong to the urban non-central regions, where the density of buildings and population is not as high as that of the central urban areas, and there are relatively large areas of cropland, forests, and nature reserves. The areas with lower carbon densities show a slight increase in carbon density between 2010 and 2020, while the areas with relatively high carbon densities show a significant decrease in carbon density during this decade. It can be seen that the improvement of the ecological environment in the central urban area has an important impact on the increase in regional carbon density. In contrast, the industrial development and expansion of built-up land in the non-central urban area will significantly reduce the area’s carbon density.
3.3.2. Carbon Stock Capacity Predictions for Shanghai under Various Scenarios
In the actual composition of the land carbon stock in Shanghai in 2020, cropland has the largest share of carbon stock, which reaches 3.7 × 10⁷ t. Forest and grassland have the smallest shares, 1.1 × 10⁵ t and 1 × 10⁵ t, respectively. Simulation based on the actual data in 2020 obtains the carbon stock data of Shanghai in 2025 and 2030 under the two scenarios (Table 8).
Table 8.
Variations in carbon stocks by type of land use under various scenarios (×104 t).
In 2025, under the natural development scenario, the carbon stock of cropland will be significantly reduced by 4.3992 million tons compared with the actual 2020 figure. There is an increase of 2.5766 million tons in the carbon stock of built-up land and 0.4526 million tons in the carbon stock of unutilized land. Forest land increased by 48,700 tons and grassland by 49,000 tons, both of which increased but not significantly. Owing to the considerable decline in cropland’s carbon stock, the increase in carbon stock in built-up land, unutilized land, forest, and grassland could not be offset, resulting in a decrease of 1.2423 million tons in the overall carbon stock of Shanghai in 2025 under the natural development scenario.
In 2025, under the ecological protection scenario, the carbon stock on cropland decreases by only a tiny amount compared to 2020, by 1.9502 million tons, which is 2.4499 million tons less than the natural scenario. The carbon stock of built-up land increases by 1.0833 million tons, which is 1.4934 million tons less than the natural scenario. The Shanghai Municipality’s Urban Master Plan states that “strictly controlling the scale of the city and insisting on the negative growth of the total scale of the planned built-up land”; this is in line with the ecological protection scenario, which limits the expansion of built-up land. In addition, the growth of carbon sequestration on built-up land slows down due to the restriction of built-up land expansion. The reduction in cropland has controlled the decline of carbon stock in cropland. The carbon stocks of these two forms of ecological green space have significantly increased as a result of the expansion of forests and grasslands.
According to the natural development scenario, Shanghai’s total carbon stock will drop by 1.2396 million tons from 2020 to 2030. Except for the decrease in carbon stock in cropland, the carbon stock of all other land use types increased from 2020. Cropland’s carbon stock decreased by 5.9784 million tons in 2020. The carbon stock of forests increased by 35,900 tons, and the carbon stock of grassland increased by 40,900 tons. There is a 4.1158 million tons increase in the carbon stock of construction land and a 0.5194 million tons increase in the carbon stock of unutilized land.
Shanghai’s total carbon stock will rise by 0.1829 million tons relative to the natural development scenario in 2030 and fall by 1.0834 million tons relative to 2020 under the ecological conservation scenario. The carbon stock of cropland decreased by 4.9257 million tons from 2020 and shrank by 1.0527 million tons compared with the natural development scenario. Carbon stock in forests is 0.5854 million tons, increasing by 0.4777 million tons from 2020 and 0.4418 million tons from the natural development scenario. Grassland has a carbon stock of 0.378 million tons, up 0.235 million tons from the natural development scenario and 0.276 million tons from 2020. Built-up land has a carbon stock of 3.0183 million tons, up 2.5694 million tons from 2020 and down 1.5464 million tons from the scenario of natural development. With a rise of 0.5194 million tons from 2020 and a drop of 300 tons from the natural scenario, the carbon stock of underutilized land is 1.3386 million tons. The development of built-up land cannot be separated from the rise in carbon stock in ecological land, indicating that under the ecological protection scenario, each type of land use has a greater capacity for carbon stock.
4. Conclusions and Discussion
In this paper, we combined the Logistic-CA-Markov and the InVEST to explore and forecast the LUCC and its effects on the geographical and temporal changes of soil terrestrial carbon stocks in Shanghai in two scenarios involving natural development and ecological preservation. The results showed that under the ecological protection scenario, the increase in the area of built-up land in 2030 is less expanded by 13,518 hm2, forest by 3312.54 hm2, and grassland by 3314.34 hm2 compared with the natural development scenario. In terms of carbon stock, the total amount of carbon sequestered in Shanghai decreased by 0.418 million tons from 2010 to 2020, mainly due to the shrinkage of the cropland area, resulting in a loss of 3.7528 million tons of carbon loss. Despite the fact that 3.2681 million tons more carbon was sequestered due to the growth of built-up land, it is still difficult to offset the drastic shrinkage of cropland. Under both projected scenarios, Shanghai’s carbon stock in 2025 and 2030 shows a constant downward trend, with a total decline of more than 1 million tons. Under the natural development scenario, Shanghai will face a continuous and rapid loss of carbon stocks, and the ecological protection scenario can effectively mitigate the loss of carbon stocks. Still, it cannot change the trend of the continuous reduction in carbon stocks.
The main cause of LUCC changes is urbanization, and the direction of urbanization is determined by policies. In addition to natural and social factors, the focus of research on the driver of LUCC change is shifted to the impact of policies. The making of policies determines the way in which land use develops, such as natural development, ecological development, economic development, etc. Most of the past studies clearly point out the influence of natural and social factors on LUCC [17,21,23], but with the further development of the city, the influence of policies on LUCC is becoming more and more prominent. Existing studies have to consider the issue of policy formulation when analyzing LUCC, and different development policies may lead LUCC in completely different directions [43,44]. Liao et al. discussed the impact of policy formulation on the spatial evolution of LUCC in three policy development scenarios with key factors such as topography, GDP, and population [13]. Although Liao used three policy scenarios, natural conditions such as temperature and precipitation are not considered. In this paper, these factors are taken into account and substituted into logistic regression, then validated and simulated the future LUCC through two development scenarios.
Places such as protected areas and forests have more trees and a stronger carbon storage capacity than cities, but with the increase in carbon emissions, these places are under great pressure to sequester carbon. Deepakshi et al. assessed carbon sequestration in protected areas in three phases using the Markov and InVEST models [44], and due to the degradation of the forests and the slow regeneration, the carbon stocks are being lost, and it is still not clear what the future carbon storage capacity. Therefore, the role of cities in carbon storage can be considered. The impact of LUCC on carbon storage due to current urbanization has not been clarified, and studies on carbon storage prediction in conjunction with future LUCC are lacking. Taking this as a starting point, this study sets the ecological green space as a no-conversion zone according to the policy and simulates Shanghai’s land use distribution under two scenarios of natural development and ecological conservation in 2025 and 2030 using the Logistic-CA-Markov coupled model. Considering the outcomes of the simulation, the carbon stock level of each land use type is further predicted, and the main process affecting the carbon stock of land use is the ebb and flow between cropland and built-up land. In order to increase the overall carbon stock of the city, green roofs can be constructed in the city center to form urban mixed green space. Non-central urban areas should protect existing forests, cultivate new forests, and advocate sustainable forest management strategies while limiting the expansion of construction land [25,43,44].
This study explores the effects of future LUCC on Shanghai’s carbon stock under various scenarios using the InVEST model, which is significant for the future understanding of the regional terrestrial ecosystems in Shanghai and also helps to target the implementation of improvement measures in the future. Through the simulated projections of the two scenarios of natural development and ecological protection, it is recommended that the Shanghai Municipal Government (i) strictly control the scale of land for built-up and implement strict cropland protection measures; (ii) implement policies to promote sustainable land use, such as land zoning, conservation easements, and carbon sequestration incentives [45]; and (iii) implement ecological initiatives, such as those that safeguard wetlands and natural forests [19]. As a part of the demonstration zone of green and integrated ecological development of the Yangtze River Delta, Qingpu District has great potential to contribute to the regional carbon stock. As of 2022, Qingpu District has 14,709.96 hm2 of wetlands. The characteristic anoxic conditions of wetlands can slow down decomposition, accumulate large amounts of organic matter, and hold more than 40% of soil carbon [46]. This feature is of significant significance to enhance the overall carbon stock in Shanghai.
One of the study’s limitations is that it did not take into account how driving forces would affect changes in land use at various spatial scales. The ideal scale for spatial land use prediction can be discussed further in further research. This study’s calculation of Shanghai’s carbon stock relies heavily on the land use data and the carbon density data of each land use type obtained from other scholars’ studies, and the accuracy of these data varies a little in different study areas. The findings of this study only reflect some carbon dynamics in the study area, especially in some specific land–water transition areas. Future research should focus on better characterizing LUCC patterns, obtaining accurate data on terrestrial carbon sinks, and quantifying the gradient of carbon stock changes in terrestrial ecosystems.
Author Contributions
D.X. and W.L. guided the article. C.Y. wrote the paper. J.Y. and W.Z. contributed the figures. All authors have read and agreed to the published version of the manuscript.
Funding
This study was supported by the National Natural Science Foundation of China (42171344) and the Shanghai Natural Science Foundation (23ZR1446700).
Data Availability Statement
The original contributions presented in the study are included in the article, further inquiries can be directed to the corresponding authors.
Conflicts of Interest
The authors declare no conflicts of interest.
References
- Houghton, R.; Hackler, J. Emissions of carbon from forestry and land-use change in tropical Asia. Glob. Chang. Biol. 1999, 5, 481–492. [Google Scholar] [CrossRef]
- Houghton, R.A. Revised estimates of the annual net flux of carbon to the atmosphere from changes in land use and land management 1850–2000. Tellus B Chem. Phys. Meteorol. 2003, 55, 378–390. [Google Scholar]
- Zalles, V.; Hansen, M.C.; Potapov, P.V.; Parker, D.; Stehman, S.V.; Pickens, A.H.; Parente, L.L.; Ferreira, L.G.; Song, X.-P.; Hernandez-Serna, A.; et al. Rapid expansion of human impact on natural land in South America since 1985. Sci. Adv. 2021, 7, eabg1620. [Google Scholar] [CrossRef] [PubMed]
- Mansori, M.; Badehian, Z.; Ghobadi, M.; Maleknia, R. Assessing the environmental destruction in forest ecosystems using landscape metrics and spatial analysis. Sci. Rep. 2023, 13, 15165. [Google Scholar] [CrossRef] [PubMed]
- Zhang, W.; Schurgers, G.; Peñuelas, J.; Fensholt, R.; Yang, H.; Tang, J.; Tong, X.; Ciais, P.; Brandt, M. Recent decrease of the impact of tropical temperature on the carbon cycle linked to increased precipitation. Nat. Commun. 2023, 14, 965. [Google Scholar] [CrossRef] [PubMed]
- Georgiou, K.; Jackson, R.B.; Vindušková, O.; Abramoff, R.Z.; Ahlström, A.; Feng, W.; Harden, J.W.; Pellegrini, A.F.A.; Polley, H.W.; Soong, J.L.; et al. Global stocks and capacity of mineral-associated soil organic carbon. Nat. Commun. 2022, 13, 3797. [Google Scholar] [CrossRef]
- Meersmans, J.; Arrouays, D.; Van Rompaey, A.J.; Pagé, C.; De Baets, S.; Quine, T.A. Future C loss in mid-latitude mineral soils: Climate change exceeds land use mitigation potential in France. Sci. Rep. 2016, 6, 35798. [Google Scholar] [CrossRef]
- Brown, D.G.; Verburg, P.H.; Pontius, R.G., Jr.; Lange, M.D. Opportunities to improve impact, integration, and evaluation of land change models. Curr. Opin. Environ. Sustain. 2013, 5, 452–457. [Google Scholar] [CrossRef]
- Lin, Y.-P.; Chu, H.-J.; Wu, C.-F.; Verburg, P.H. Predictive ability of logistic regression, auto-logistic regression and neural network models in empirical land-use change modeling–a case study. Int. J. Geogr. Inf. Sci. 2011, 25, 65–87. [Google Scholar] [CrossRef]
- Pijanowski, B.C.; Brown, D.G.; Shellito, B.A.; Manik, G.A. Using neural networks and GIS to forecast land use changes: A land transformation model. Comput. Environ. Urban Syst. 2002, 26, 553–575. [Google Scholar] [CrossRef]
- Zhou, L.; Dang, X.; Sun, Q.; Wang, S. Multi-scenario simulation of urban land change in Shanghai by random forest and CA-Markov model. Sustain. Cities Soc. 2020, 55, 102045. [Google Scholar] [CrossRef]
- Chaoyue, W.; Xianhua, G.; Li, G.; Lifang, B.; Lilin, X.; Chunbo, W.; Tingzhen, L. Land Use Change and Its Impact on Carbon Storage in Northwest China Based on FLUS-Invest: A Case Study of Hu-Bao-Er-Yu Urban Agglomeration. Ecol. Environ. 2022, 31, 1667. [Google Scholar]
- Liao, Z.; Zhang, L. Spatio-temporal evolution and future simulation of urban agglomeration expansion in the Guangdong–Hongkong–Macau Greater Bay Area. Humanit. Soc. Sci. Commun. 2023, 10, 468. [Google Scholar] [CrossRef]
- Ma, Y.; Zheng, X.; Liu, M.; Liu, D.; Ai, G.; Chen, X. Spatio-temporal evolution characteristics analysis and optimization prediction of urban green infrastructure: A case study of Beijing, China. Sci. Rep. 2022, 12, 10702. [Google Scholar] [CrossRef] [PubMed]
- Aburas, M.M.; Ho, Y.M.; Ramli, M.F.; Ash’aari, Z.H. Improving the capability of an integrated CA-Markov model to simulate spatio-temporal urban growth trends using an Analytical Hierarchy Process and Frequency Ratio. Int. J. Appl. Earth Obs. Geoinf. 2017, 59, 65–78. [Google Scholar] [CrossRef]
- Etemadi, H.; Smoak, J.M.; Karami, J. Land use change assessment in coastal mangrove forests of Iran utilizing satellite imagery and CA–Markov algorithms to monitor and predict future change. Environ. Earth Sci. 2018, 77, 208. [Google Scholar] [CrossRef]
- Zhou, D.; Lin, Z.; Liu, L. Regional land salinization assessment and simulation through cellular automaton-Markov modeling and spatial pattern analysis. Sci. Total Environ. 2012, 439, 260–274. [Google Scholar] [CrossRef] [PubMed]
- Xiang, M.; Wang, C.; Tan, Y.; Yang, J.; Duan, L.; Fang, Y.; Li, W.; Shu, Y.; Liu, M. Spatio-temporal evolution and driving factors of carbon storage in the Western Sichuan Plateau. Sci. Rep. 2022, 12, 8114. [Google Scholar] [CrossRef] [PubMed]
- Zhao, M.; He, Z.; Du, J.; Chen, L.; Lin, P.; Fang, S. Assessing the effects of ecological engineering on carbon storage by linking the CA-Markov and InVEST models. Ecol. Indic. 2019, 98, 29–38. [Google Scholar] [CrossRef]
- He, X.; Tian, J.; Zhang, Y.; Zhao, Z.; Cai, Z.; Wang, Y. Attribution and driving force of nitrogen losses from the Taihu Lake Basin by the InVEST and GeoDetector models. Sci. Rep. 2023, 13, 7440. [Google Scholar] [CrossRef]
- Nelson, E.; Sander, H.; Hawthorne, P.; Conte, M.; Ennaanay, D.; Wolny, S.; Manson, S.; Polasky, S. Projecting global land-use change and its effect on ecosystem service provision and biodiversity with simple models. PLoS ONE 2010, 5, e14327. [Google Scholar] [CrossRef]
- Liu, J.; Sleeter, B.M.; Zhu, Z.; Loveland, T.R.; Sohl, T.; Howard, S.M.; Key, C.H.; Hawbaker, T.; Liu, S.; Reed, B.; et al. Critical land change information enhances the understanding of carbon balance in the United States. Glob. Chang. Biol. 2020, 26, 3920–3929. [Google Scholar] [CrossRef]
- Eigenbrod, F.; Bell, V.; Davies, H.; Heinemeyer, A.; Armsworth, P.R.; Gaston, K.J. The impact of projected increases in urbanization on ecosystem services. Proc. R. Soc. B Biol. Sci. 2011, 278, 3201–3208. [Google Scholar] [CrossRef]
- He, C.; Zhang, D.; Huang, Q.; Zhao, Y. Assessing the potential impacts of urban expansion on regional carbon storage by linking the LUSD-urban and InVEST models. Environ. Model. Softw. 2016, 75, 44–58. [Google Scholar] [CrossRef]
- Zhang, F.; Xu, N.; Wang, C.; Wu, F.; Chu, X. Effects of land use and land cover change on carbon sequestration and adaptive management in Shanghai, China. Phys. Chem. Earth Parts A/B/C 2020, 120, 102948. [Google Scholar] [CrossRef]
- Zhang, Z.; Liu, J.; Gu, X. Reduction of industrial land beyond Urban Development Boundary in Shanghai: Differences in policy responses and impact on towns and villages. Land Use Policy 2019, 82, 620–630. [Google Scholar] [CrossRef]
- Jokar Arsanjani, J.; Helbich, M.; Kainz, W.; Boloorani, A.D. Integration of logistic regression, Markov chain and cellular automata models to simulate urban expansion. Int. J. Appl. Earth Obs. Geoinf. 2013, 21, 265–275. [Google Scholar] [CrossRef]
- Liu, Y.; Zhu, Y. Research of Carbon Storage Changes in Terrestrial Ecosystems Based on InVEST Model in the Yangtze River Delta Region. J. Nanjing Xiaozhuang Univ. 2020, 36, 82–90. [Google Scholar]
- Yang, Y.; Dai, E.; Fu, H. The Assessment Framework of Ecosystem Service Value Based on InVEST Model. J. Cap. Norm. Univ. 2012, 33, 41–47. [Google Scholar]
- Sun, F.; Fang, F.; Hong, W.; Luo, H.; Yu, J.; Fang, L.; Miao, Y. Evolution Analysis and Prediction of Carbon Storage in Anhui Province Based on PLUS and InVEST Model. J. Soil Water Conserv. 2023, 37, 151–158. [Google Scholar]
- Sun, X.; Xue, J.; Dong, L. Spatiotemporal Change and Prediction of Carbon Storage in Nanjing Ecosystem Based on PLUS Model and InVEST Model. J. Ecol. Rural Environ. 2023, 39, 41–51. [Google Scholar]
- Zhang, M.; Wang, M.; Zhang, X.; Yang, Y. Evaluation of Ecosystem Services in Hangzhou Based on InVEST Model. J. Spatio-Temporal Inf. 2021, 28, 57–64. [Google Scholar]
- Wang, D. Soil organic carbon storage based on land use change in Shanghai. Shanghai Land Resour. 2021, 42, 1–6. [Google Scholar]
- Li, H.; Lei, Y.; Zeng, W. Forest Carbon Storage in China Estimated Using Forestry Inventory Data. Sci. Silvae Sin. 2011, 47, 7–12. [Google Scholar]
- Sharp, R.; Tallis, H.; Ricketts, T.; Tallis, H.T.; Ricketts, T.; Guerry, A.D.; Wood, S.A.; Chaplin-Kramer, R.; Nelson, E.; Ennaanay, D.; et al. InVEST User’s Guide; The Natural Capital Project: Stanford, CA, USA, 2014; p. 306. [Google Scholar]
- Pontius, R.G., Jr.; Schneider, L.C. Land-cover change model validation by an ROC method for the Ipswich watershed, Massachusetts, USA. Agric. Ecosyst. Environ. 2001, 85, 239–248. [Google Scholar] [CrossRef]
- Fu, F.; Deng, S.; Wu, D.; Liu, W.; Bai, Z. Research on the spatiotemporal evolution of land use landscape pattern in a county area based on CA-Markov model. Sustain. Cities Soc. 2022, 80, 103760. [Google Scholar] [CrossRef]
- Fu, X.; Wang, X.; Yang, Y.J. Deriving suitability factors for CA-Markov land use simulation model based on local historical data. J. Environ. Manag. 2018, 206, 10–19. [Google Scholar] [CrossRef] [PubMed]
- Guan, D.; Zhao, Z.; Tan, J. Dynamic simulation of land use change based on logistic-CA-Markov and WLC-CA-Markov models: A case study in three gorges reservoir area of Chongqing, China. Environ. Sci. Pollut. Res. 2019, 26, 20669–20688. [Google Scholar] [CrossRef]
- Han, H.; Yang, C.; Song, J. Scenario simulation and the prediction of land use and land cover change in Beijing, China. Sustainability 2015, 7, 4260–4279. [Google Scholar] [CrossRef]
- Zhao, D.; Xiao, M.; Huang, C.; Liang, Y.; Yang, Z. Land use scenario simulation and ecosystem service management for different regional development models of the Beibu Gulf Area, China. Remote Sens. 2021, 13, 3161. [Google Scholar] [CrossRef]
- Department, T.E. Prospect of Experts: The Interpretation of Shanghai Master Plan 2017–2035. Shanghai Urban Plan. Rev. 2018, 2, 52–56. [Google Scholar]
- Ghafoor, G.Z.; Sharif, F.; Shahid, M.G.; Shahzad, L.; Rasheed, R.; Khan, A.U.H. Assessing the impact of land use land cover change on regulatory ecosystem services of subtropical scrub forest, Soan Valley Pakistan. Sci. Rep. 2022, 12, 10052. [Google Scholar] [CrossRef] [PubMed]
- Babbar, D.; Areendran, G.; Sahana, M.; Sarma, K.; Raj, K.; Sivadas, A. Assessment and prediction of carbon sequestration using Markov chain and InVEST model in Sariska Tiger Reserve, India. J. Clean. Prod. 2021, 278, 123333. [Google Scholar] [CrossRef]
- Guo, J.; Wang, H. Study on carbon emission reduction effect of institutional openness in China. Sci. Rep. 2023, 13, 254. [Google Scholar] [CrossRef] [PubMed]
- Nahlik, A.M.; Fennessy, M.S. Carbon storage in US wetlands. Nat. Commun. 2016, 7, 13835. [Google Scholar] [CrossRef]


Disclaimer/Publisher’s Note: The statements, opinions and data contained in all publications are solely those of the individual author(s) and contributor(s) and not of MDPI and/or the editor(s). MDPI and/or the editor(s) disclaim responsibility for any injury to people or property resulting from any ideas, methods, instructions or products referred to in the content. |
© 2024 by the authors. Licensee MDPI, Basel, Switzerland. This article is an open access article distributed under the terms and conditions of the Creative Commons Attribution (CC BY) license (https://creativecommons.org/licenses/by/4.0/).