Article

Plant Diversity Response to Environmental Factors in Yellow River Delta, China

1
Key Laboratory of Ecosystem Network Observation and Modelling, Institute of Geographic Sciences and Natural Resources Research, Chinese Academy of Sciences, Beijing 100101, China
2
College of Resources and Environment, University of Chinese Academy of Sciences, Beijing 100049, China
3
Yantai Coastal Zone Geological Survey Center, China Geological Survey, Yantai 264011, China
4
Observation and Research Station of Land-Sea Interaction Field in the Yellow River Estuary, Yantai 264004, China
5
School of Architecture and Urban Planning, Qingdao University of Technology, Qingdao 266033, China
*
Author to whom correspondence should be addressed.
Land 2024, 13(3), 264; https://doi.org/10.3390/land13030264
Submission received: 11 January 2024 / Revised: 6 February 2024 / Accepted: 17 February 2024 / Published: 20 February 2024

Abstract

:
Plant diversity plays a crucial role in maintaining the functionality of a community and providing essential ecosystem services. Studying the plant diversity and its response to environmental factors in the Yellow River Delta, China, as a newly formed coastal land, is beneficial for protecting plant diversity in coastal areas and maintaining ecosystem stability. In this study, 56 sites were sampled to investigate the diversity of shrubs and herbaceous plant community and its response to environmental factors. The results indicate that the plants growing in the Yellow River Delta are predominantly from the Poaceae and Asteraceae families, with dominant communities consisting of species such as Suaeda salsa, Phragmites australis, Setaria viridis, Imperata cylindrica, and Tamarix chinensis. The Shannon–Wiener index, Simpson diversity index, and Pielou’s evenness index exhibit average values of 0.34, 0.21, and 0.25, respectively, within the Yellow River Delta. These values collectively indicate a low diversity in the vegetation community, reflecting a relatively uncomplicated ecological structure in this area. Additionally, there were no significant differences in biodiversity indices under different soil formation times, but under different land cover types, the biodiversity index of cropland was significantly higher than that of impervious land. Soil salinity index exhibited a significant negative correlation with plant diversity (R2 = 0.279, p < 0.001) in the Yellow River Delta. Moreover, elevation (R2 = 0.247, p < 0.001) and temperature (R2 = 0.219, p < 0.001) showed significant positive effects on plant diversity. Regarding the ecological stoichiometry of plant elements, soil organic carbon exhibited a negative effect on the biodiversity index, while litter carbon showed a positive effect. This may be attributed to the unique topographical conditions and soil salinization in the Yellow River Delta. Our findings provide important references for the sustainable management of wetlands in the Yellow River Delta under conditions of soil salinization.

1. Introduction

Plant diversity, as an integral part of biodiversity, plays a crucial role in maintaining the functional dynamics of community ecosystem functions and providing ecosystem services [1,2]. It is essential for the assessment of current species performance and the prediction of future community composition and also necessary for understanding ecosystem dynamics through in-depth study [3]. Environmental factors, especially climate and soil characteristics, have a profound impact on the species distribution of plants, consequently impacting on the plant species diversity [4]. The plant’s own element ecological stoichiometric factors, such as carbon, nitrogen, and other elements, as nutritional and structural elements, play a very important role in the cycling and balance of matter and energy within the ecosystem [5,6]. However, there are relatively few studies on the element stoichiometric factors of plants themselves, which makes our understanding of the energy balance of biological systems and its impact on biodiversity still need further exploration. Numerous studies identified a pronounced positive impact of plant diversity on augmenting ecosystem functions and services [7,8,9]. This positive relationship between biodiversity and ecosystem function is particularly important in ecological processes, including but not limited to soil organic carbon, nutrient cycling and storage, and soil fertility [9]. Importantly, soil fertility establishes a reciprocal relationship with ecosystem productivity, contributing to a mutually reinforcing cycle [10]. Most current research focuses on the topsoil, because the content of soil organic carbon in the topsoil is significantly higher than that in the deep soil, thus promoting the growth of vegetation [8,11,12].
On the flip side, climate assumes a pivotal role in shaping the spatial variation of large-scale plant diversity [1,13,14]. In regions with abundant rainfall, heat emerges as the main factor influencing plant diversity, whereas in drought-stressed areas, water and heat jointly contribute to shaping plant diversity [15]. Furthermore, climate factors show regularity with the changes of latitude, longitude, and altitude, so many researchers choose to consider latitude, longitude, and altitude as the factors influencing the spatial variation of species diversity on a large scale [16,17,18]. In contrast, soil contains the nutrients required for plant growth, so the influence of soil properties on plant community and distribution pattern has always been an important focus of research [19]. In newly developed coastal areas, plant diversity experiences pronounced influences from climate, soil, water, and other environmental factors [20]. As the material basis of plant growth, soil plays a key role in shaping plant distribution pattern and species diversity. Among many soil factors, soil salinity emerges as one of the most significant elements affecting plant diversity [21]. In recent years, with the continuous intensification of global warming and irrational use of water and soil resources, the accumulation process of soil surface salt has accelerated, resulting in a significant decline in ecosystem functions and a decrease in biodiversity [22]. Furthermore, the age of soil also has an impact on ecosystem succession, thus affecting the change of plant diversity [20,23,24]. Additionally, varying land covers introduce distinct properties to the underlying surface, consequently exerting some degree of influence on plant biodiversity [25,26,27].
Therefore, soil nutrient content, soil formation duration, and land cover have a profound impact on plant growth, development, and distribution. Among them, soil salinity, as an important soil characteristic, exerts a profound impact on the physiological process and ecological adaptability of plants in new coastal areas [28]. In conditions of high salinity, plants may be subjected to physiological stress, which affects their growth rate and survival ability and ultimately leads to a decrease in the diversity of plant communities within the ecosystem [5,22]. The Yellow River Delta stands out as the most complete, broadest, and youngest newly preserved coastal land in China’s warm temperate zone [29]. As a typical coastal land, it experiences significant influences from both fresh water from the Yellow River and tidal seawater [30]. In the hundred-year scale, the continuous expansion and evolution of land from coast to inland also have introduced certain gradient changes in salinity and water level, resulting in different characteristics and laws of wetland vegetation types, soil physical and chemical properties, and nutrient elements [31]. However, with the rapid development of China’s economy and society, the Yellow River Delta wetland, like most coastal wetlands in the world, is also facing serious degradation [32]. Due to late land-forming time, unique geographical location, serious soil salinization, shallow groundwater depth and high salinity, and continuous seawater intrusion, the ecological environment of the Yellow River Delta is relatively sensitive and fragile [33]. Man-made disturbances such as reclamation, oil exploitation, and coastal engineering construction have eroded the original land area, making the vegetation types in the Yellow River Delta tend to be single, reducing species diversity and resulting in a decline in productivity [20,34]. Predecessors have long paid attention to the possible impact of soil age on the succession stage of ecosystems in estuarine deltas [20]. Since the Yellow River diverted the Daqing River into the Bohai Sea in 1855, the tail of the Yellow River has changed course many times, forming a number of subdelta deposits with imbricated compound structure [35]. Vegetation succession and soil succession occur alternately in the coastal ecosystem, and both are affected by soil formation time and other factors [36]. The difference in soil formation time brings about the difference in the age of ecosystems [20], which further affects the vegetation succession process and thus changes the biodiversity. At present, the research on the Yellow River Delta mainly focuses on the study of geomorphic evolution [37,38,39], vegetation change [40,41], and the impact of soil salinization on agriculture [31,42], but there are few studies on the vegetation biodiversity of the Yellow River Delta and its relationship with environmental variables.
This study aims to focus on the Yellow River Delta as the research area, examining the local vegetation diversity. We will calculate key metrics such as the species richness, Shannon–Wiener index, Simpson diversity index, and Pielou’s evenness index of vegetation in the Yellow River Delta, then analyze the characteristics of plant diversity, and determine the impact of various environmental indicators on plant diversity. The primary objective is to deepen the understanding of the characteristics of plant diversity in this region, providing a theoretical foundation for the restoration, management, and protection of plant diversity in the Yellow River Delta region, and to provide a theoretical reference for effectively harnessing the potential of coastal land in safeguarding plant diversity.

2. Materials and Methods

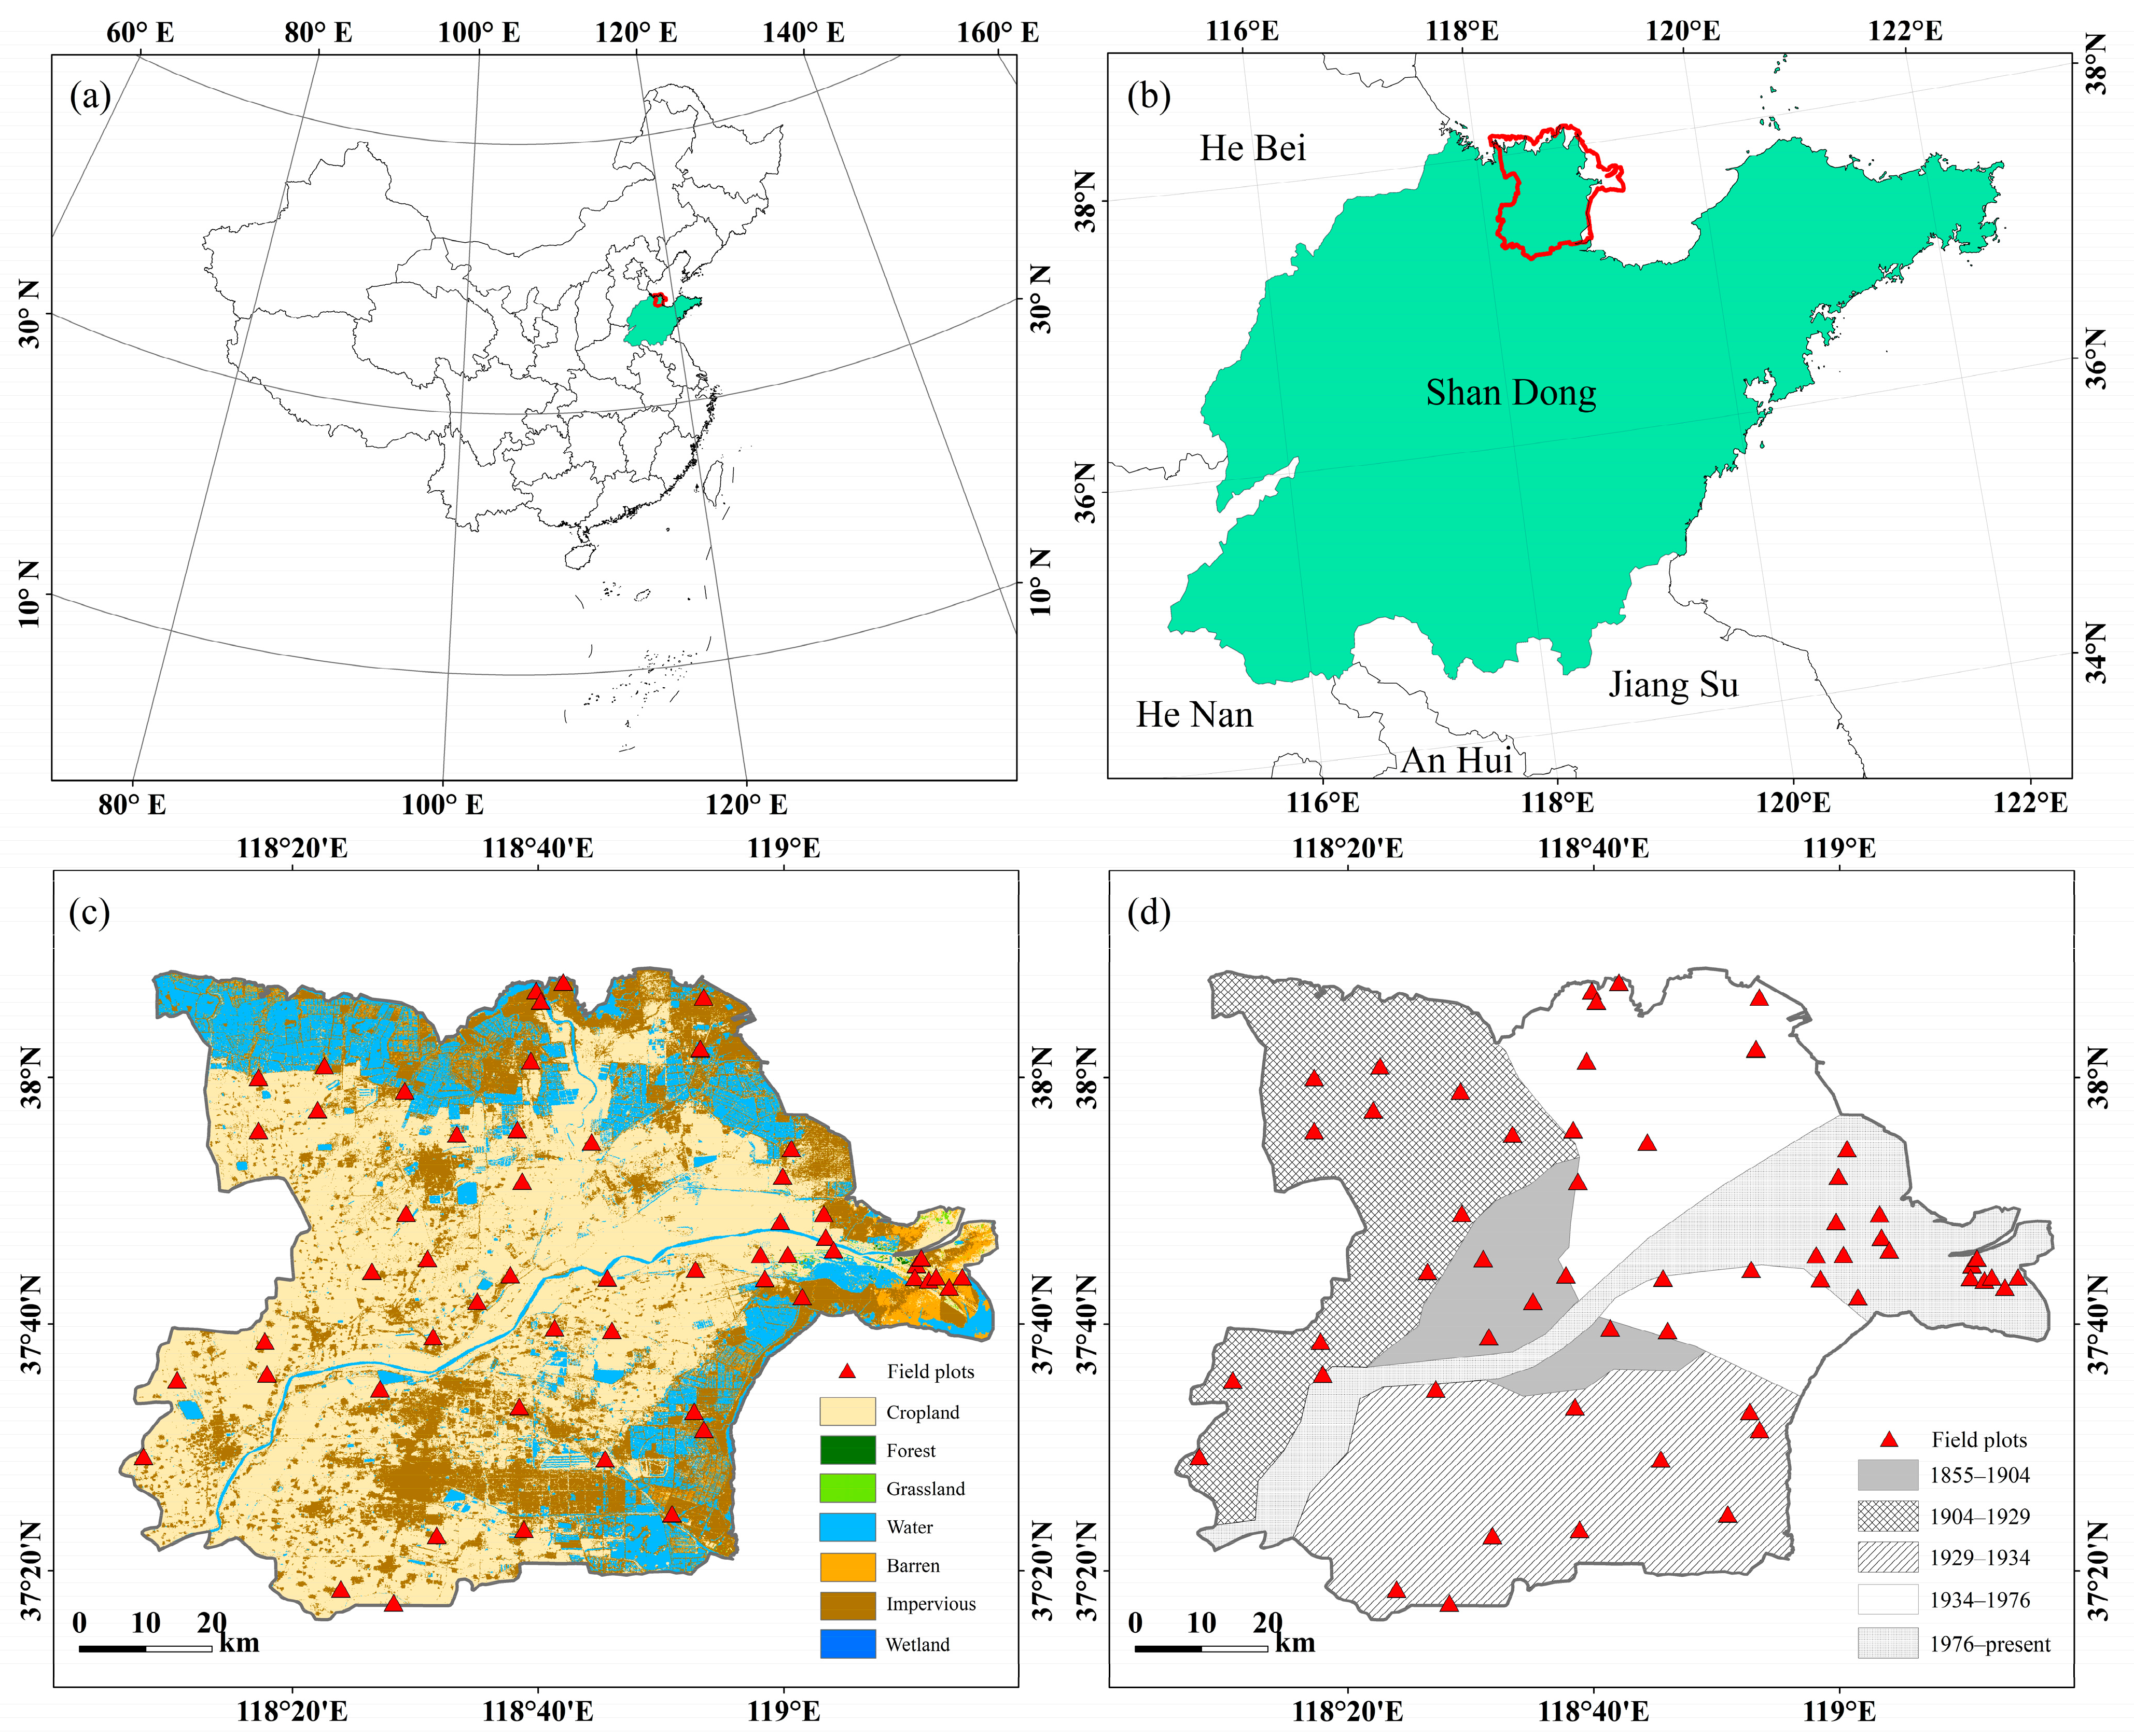
2.1. Study Area and Soil Formation Age Division

Our research scrutinizes the evolution of the modern Yellow River Delta, which has been emerging along the shores of Bohai Bay and Laizhou Bay in Shandong Province, China, since 1855 (Figure 1). The landscape of the Yellow River Delta, characterized as the most youthful, extensive, and biodiverse fan-shaped land pattern in China’s warm temperate zone [38], has been shaped by a confluence of influences, including the oscillations of the ocean and the Yellow River channel, as well as lateral infiltration of runoff [43]. Meteorological data from the National Meteorological Information Center of China (http://data.cma.cn/ (accessed on 31 December 2021)) indicate an average annual temperature of 13.5 °C and a long-term average annual precipitation of 724.0 mm in the region from 2000 to 2020.
The predominant natural vegetation consists of halophytes, leading to a landscape characterized by limited vegetation types, simple structures, and uncomplicated compositions [44]. The prevalent soil types are salinized soil and coastal tidal soil, with the former containing substantial soluble salts that exert a pronounced inhibitory or toxic effect on the growth of plant life. The tidal soil primarily originates from sediment deposited by the Yellow River or impact materials from the Zi River, resulting in an overall low nutrient content in the soil. Based on the CLCD land use and land cover (LULC) data [45], the main land cover types in the modern Yellow River Delta are cropland (55.59%), impervious land (26.06%), water (15.80%), and a small amount of barren land (2.39%). Therefore, the sampling points in this study are mainly located in cropland, impervious land, and barren land. And because there is little woodland, where there are trees, they are mostly planted. Therefore, our research also focuses on the investigation of naturally growing shrubs and herbaceous vegetation.
Employing Xue’s [46] delineation of lobes within the modern Yellow River Delta as the foundational framework, this study conducts an in-depth analysis of the developmental trajectory of different Yellow River Delta lobes across various historical periods, considering the historical alterations in the course of the Yellow River. Accordingly, the surface soil development of the Yellow River Delta is categorized into five distinct subperiods: 1855–1904, 1904–1929, 1929–1934, 1934–1976, and 1976 to the present (Figure 1d). The study consequently explores the nuanced patterns of vegetation diversity across these delineated subperiods.

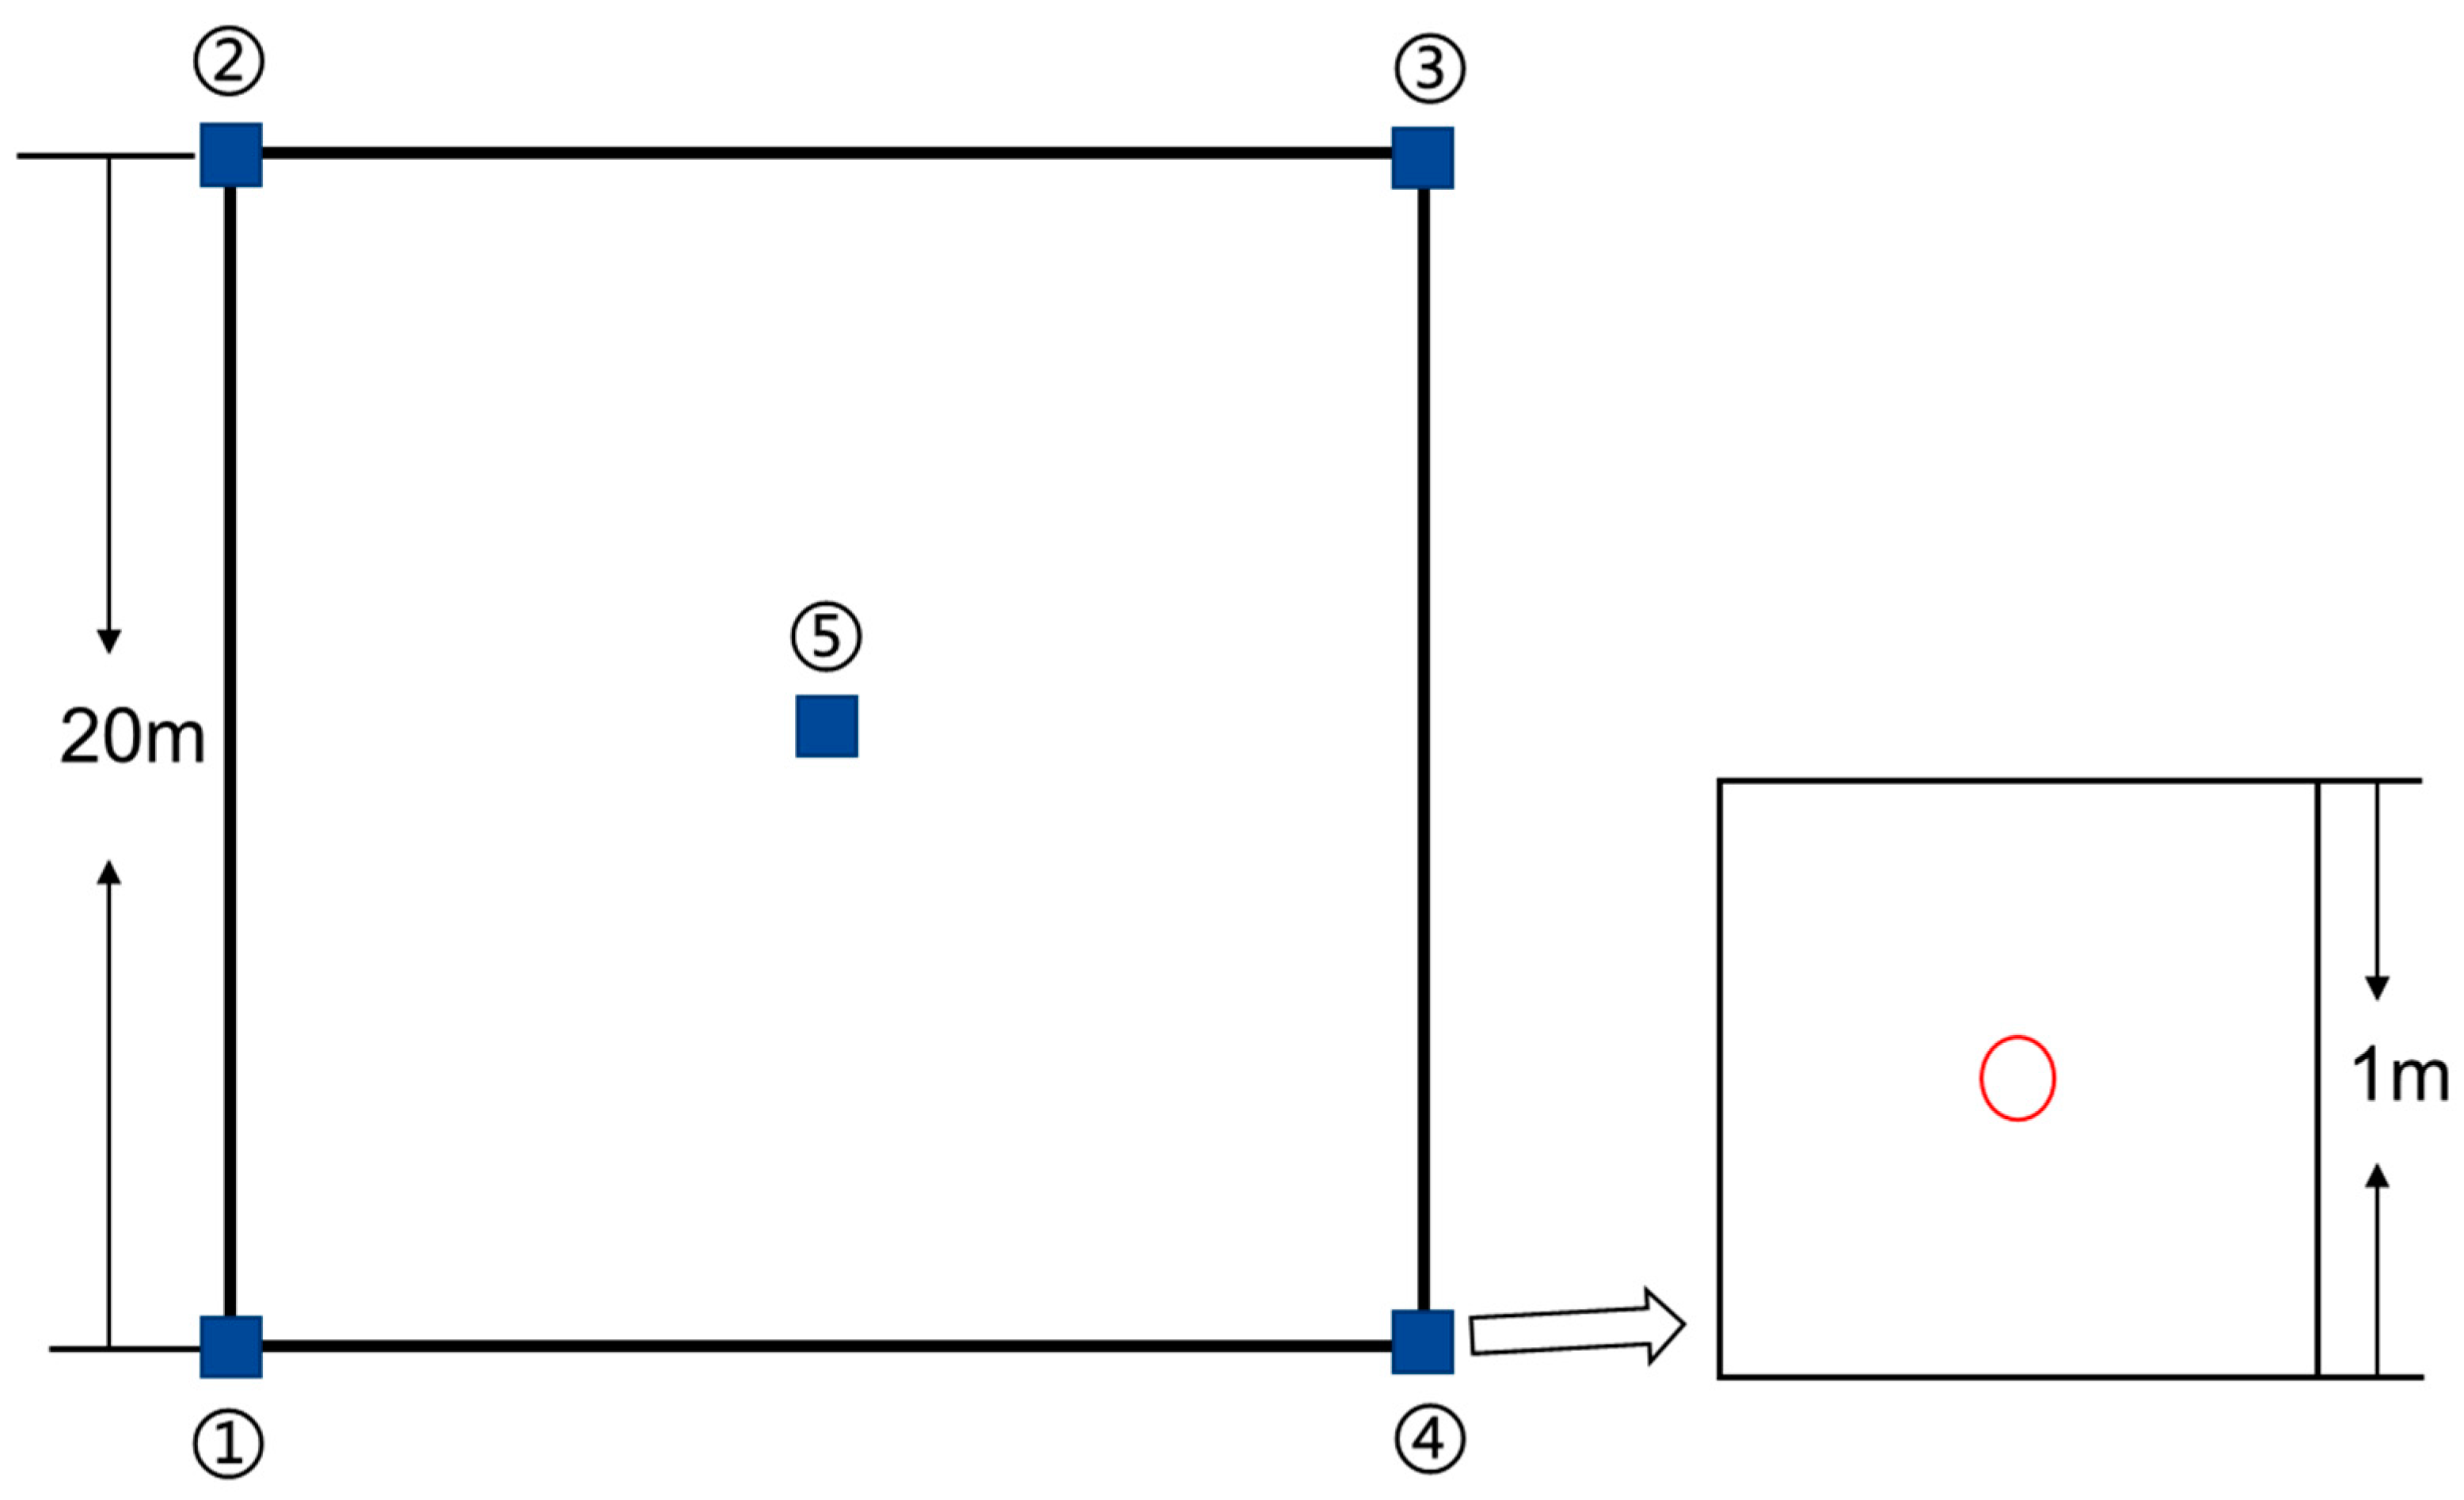
2.2. Sampling Design and Field Survey

To ensure the representative nature of the plots, a total of 56 plots, each measuring 20 m × 20 m, were established across the entire study area. In the whole delta area, a uniform distribution of plots was set up before sampling. However, due to the limitations of roads and built-up areas, such a uniform distribution of sample plots was not practical. Therefore, we set up more dense sample sites in the coastal areas and distributed roughly even sample plots in other places. Within each of these plots, five additional plots measuring 1 m × 1 m were designated for plant and soil sampling, as well as vegetation surveys, with detailed recordings of the main vegetation species and their coverage in each plot. We used the species identification software “Xingse3.15” to identify the species in each quadrat. Three investigators were asked to evaluate the coverage of each species in the quadrat, and the average results of each investigator were obtained to obtain the coverage of each species in the quadrat. The quadrat is set in a systematic way, mainly at the four corners and the center point of the plot (Figure 2). Among these, 34 plots were sampled in cropland, 20 in impervious, and 2 in barren land sections. Following the sampling process, the vario MACRO element analyzer was utilized to analyze the total carbon and total nitrogen content present in the plant samples.
In each plot, all herbs within five quadrats were harvested. The water content was determined by measuring the fresh and dry weights, and the biomass carbon/nitrogen stocks (measured in trillion grams of carbon per hectare) were calculated by multiplying the vegetation biomass with the carbon/nitrogen concentration ratio [47]. Subsequently, the carbon/nitrogen storage values were aggregated from the quadrat scale to the plot scale to determine the carbon/nitrogen storage of the entire plot.

2.3. Biodiversity Index

2.3.1. Shannon–Wiener Index

The survey parameters for assessing the biodiversity of the vegetation quadrat encompassed the determination of herbaceous species richness (S) [48], the composition analysis of dominant herbaceous species, and the calculation of the average coverage pertaining to these dominant herbaceous species. Subsequent to the collection of the aforementioned data, a comprehensive biodiversity index was computed. In this study, the biodiversity assessment relied on the utilization of the Shannon–Wiener index(H) [49]. The formula used for the calculation is as follows:
H = P i l n ( P i )
Here, Pi denotes the occurrence frequency of the i-th species, and it is also applied to the following calculation of the biodiversity index.

2.3.2. Simpson Diversity Index

Simpson diversity index is also used to measure the diversity of species in an ecosystem [50]. The calculation formula is as follows:
D = 1 ( P i ) 2

2.3.3. Pielou’s Evenness Index

The evenness index is used to measure whether the relative abundance of different species in an ecosystem is evenly distributed. One common evenness index is Pielou’s evenness index (E) [51], which is calculated as follows:
E = H ln ( S )
Here, H is Shannon–Wiener index and S is the number of species.

2.4. Variable Data Source and Analysis Method

Based on previous studies and field investigations, we selected 13 factors to assess their effects on vegetation diversity in the Yellow River Delta [1,52]. These factors fall into three main categories: ecological stoichiometry of plant elements, soil properties, and environmental variables (Table 1). The ecological stoichiometry of plant elements mainly included above-ground biomass carbon (AGC), litter carbon (LitterC), underground biomass carbon (BGC), plant root carbon, and total plant nitrogen (TN) collected from 56 plots. Soil properties mainly include soil formation time, 0–5 cm soil organic carbon density (OCD), and soil salinity index (SI) [53,54]. The soil formation time (SFT) is primarily based on Xue’s research in 1994 [46], aligned in the ArcGIS 10.5 platform. Soil organic carbon density data are sourced from global gridded soil information (Soilgrids) at a 250 m resolution (https://soilgrids.org/ (accessed on 19 October 2023)). Soil salinity index (SI) is computed on Google Earth Engine (GEE) by dividing the red band by the near-infrared band and then multiplying the result by 100 ( S I = R N I R × 100 ) [53]. The environmental variables mainly include latitude and longitude, land cover type (CLCD), temperature (T), precipitation (Pre), and elevation (DEM). Among them, the latitude (lat) and longitude (lon) were recorded in the field sample by handheld GPS. The land cover data come from the annual land cover dataset of China’s provinces, and the latest land cover data of 2020 are selected as the research data [45]. The daily datasets of temperature and precipitation from 2000 to 2020 were collected from 248 meteorological stations in Shandong Province. The annual mean values of each station for 21 years were calculated, and then the raster datasets of temperature and precipitation were obtained by Kriging interpolation on the ArcGIS 10.5 platform. The elevation is based on the Copernicus DEM GLO-30 dataset on the GEE platform.
We conducted a differential analysis of plant species diversity indices in the Yellow River Delta region under different soil formation periods and land cover conditions using one-way analysis of variance (ANOVA) in SPSS 25.0. In the R 4.2.2 environment, we employed Spearman analysis to explore the correlation between the aforementioned influencing factors and biodiversity indices, identifying factors that exhibited significant correlations [1]. Finally, using redundancy analysis (RDA), we selected the minimal variable set with the maximum explanatory power to more accurately depict the interactive relationships between biodiversity indices and influencing factors.

3. Results

3.1. Field Survey Results

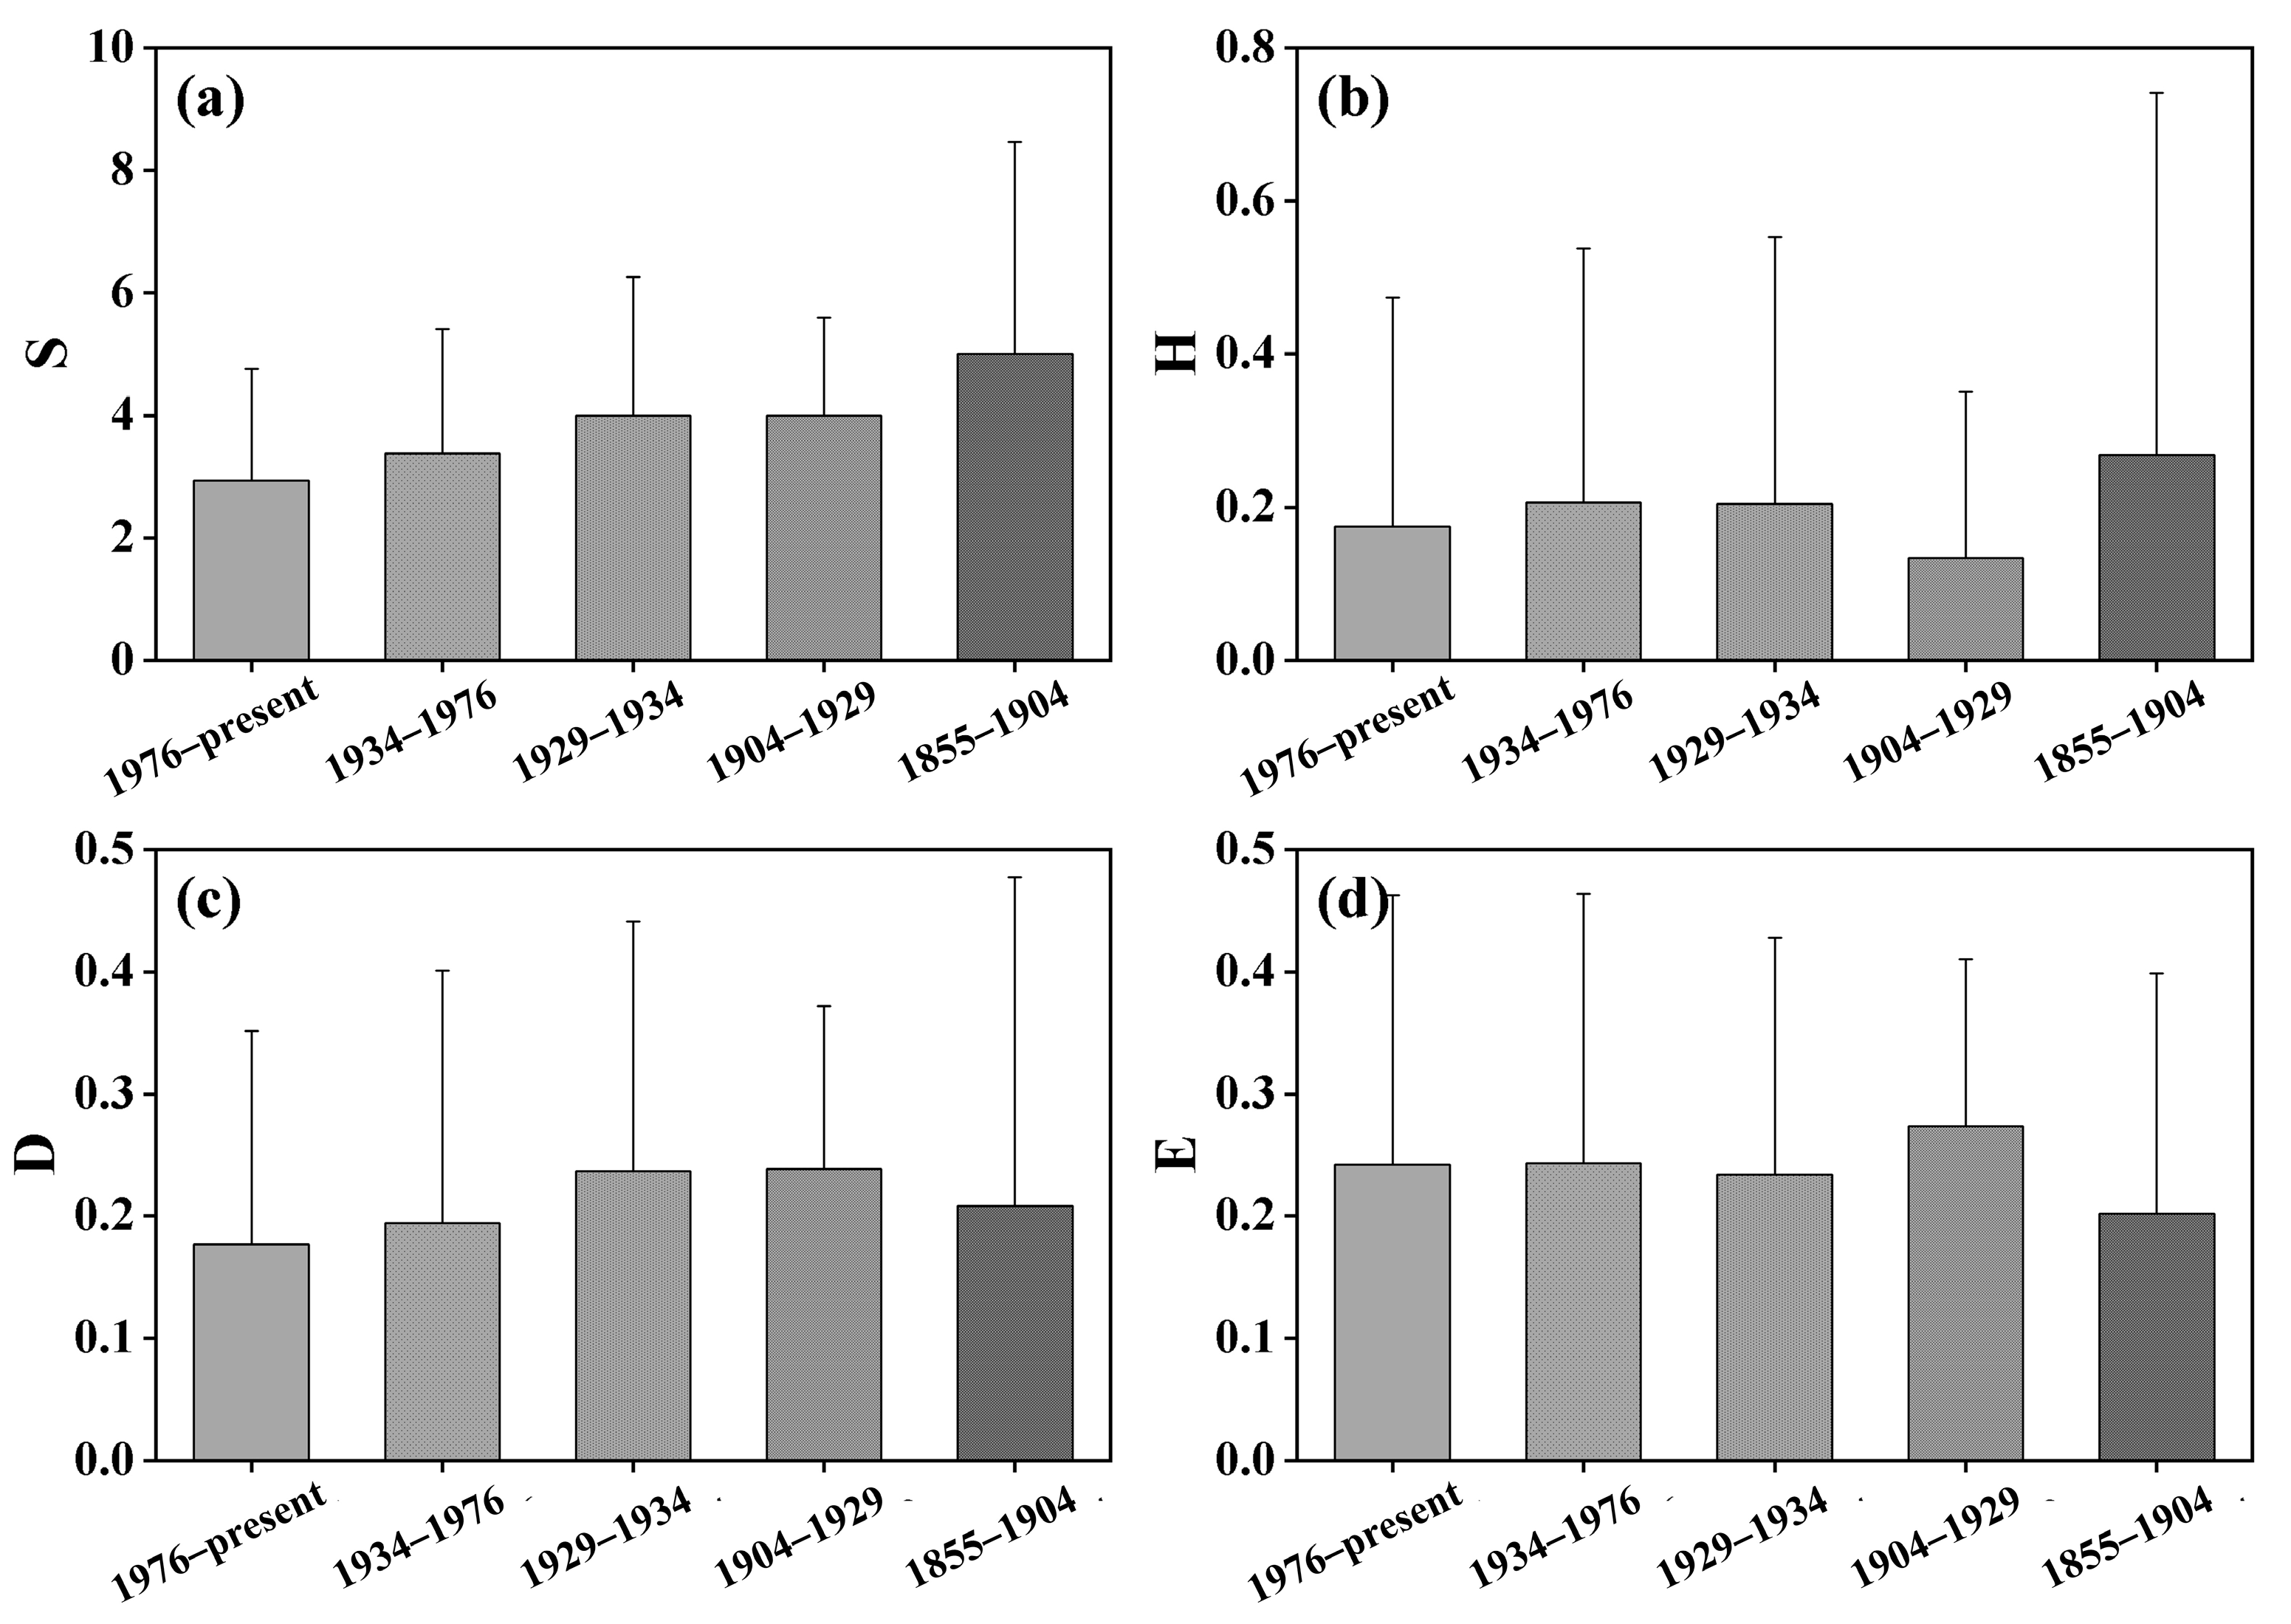
3.1.1. Vegetation Diversity under Different Soil-Forming Ages

A total of 30 dominant plants in the Yellow River Delta were recorded in our survey, among which the most frequent plants were Suaeda salsa, Phragmites australis, Setaria viridis, Imperata cylindrica, and Tamarix chinensis. The average species richness of vegetation in the study area was 3.60, accompanied by a mean Shannon–Wiener index of 0.34, Simpson index averaging 0.21, and Pielou’s evenness index averaging 0.25. Suaeda salsa, Phragmites australis, and other halophytic communities are mainly distributed in the new soil near the sea. The Yellow River Delta is mainly coastal tidal soil, and the different ages of formation will lead to some differences in soil properties. In the context of soil formation periods, the era spanning from 1855 to 1904 exhibited the highest plant diversity, displaying an average species richness of 5. Conversely, the period from 1976 to the present showed the lowest plant species diversity, averaging 2.94 (Figure 3a). Regarding the Shannon–Wiener index, the highest value occurred during the period 1929–1934, with an average of 0.40, while the lowest Shannon–Wiener index since 1976 averaged 0.30 (Figure 3b). For the Simpson index, the period of 1904-1929 during soil formation exhibited the highest values with an average of 0.24, while the period from 1976 to the present had the lowest Simpson index, averaging 0.18 (Figure 3c). Concerning evenness index, the highest value was observed from 1904–1929, averaging 0.27, while the period from 1976 to the present had the lowest evenness index, averaging 0.20 (Figure 3d). Overall, the biodiversity in the Yellow River Delta region appears to be at a relatively low level. According to the outcomes of one-way analysis of variance, there were no significant differences (p > 0.05) in various biodiversity indices among different periods.

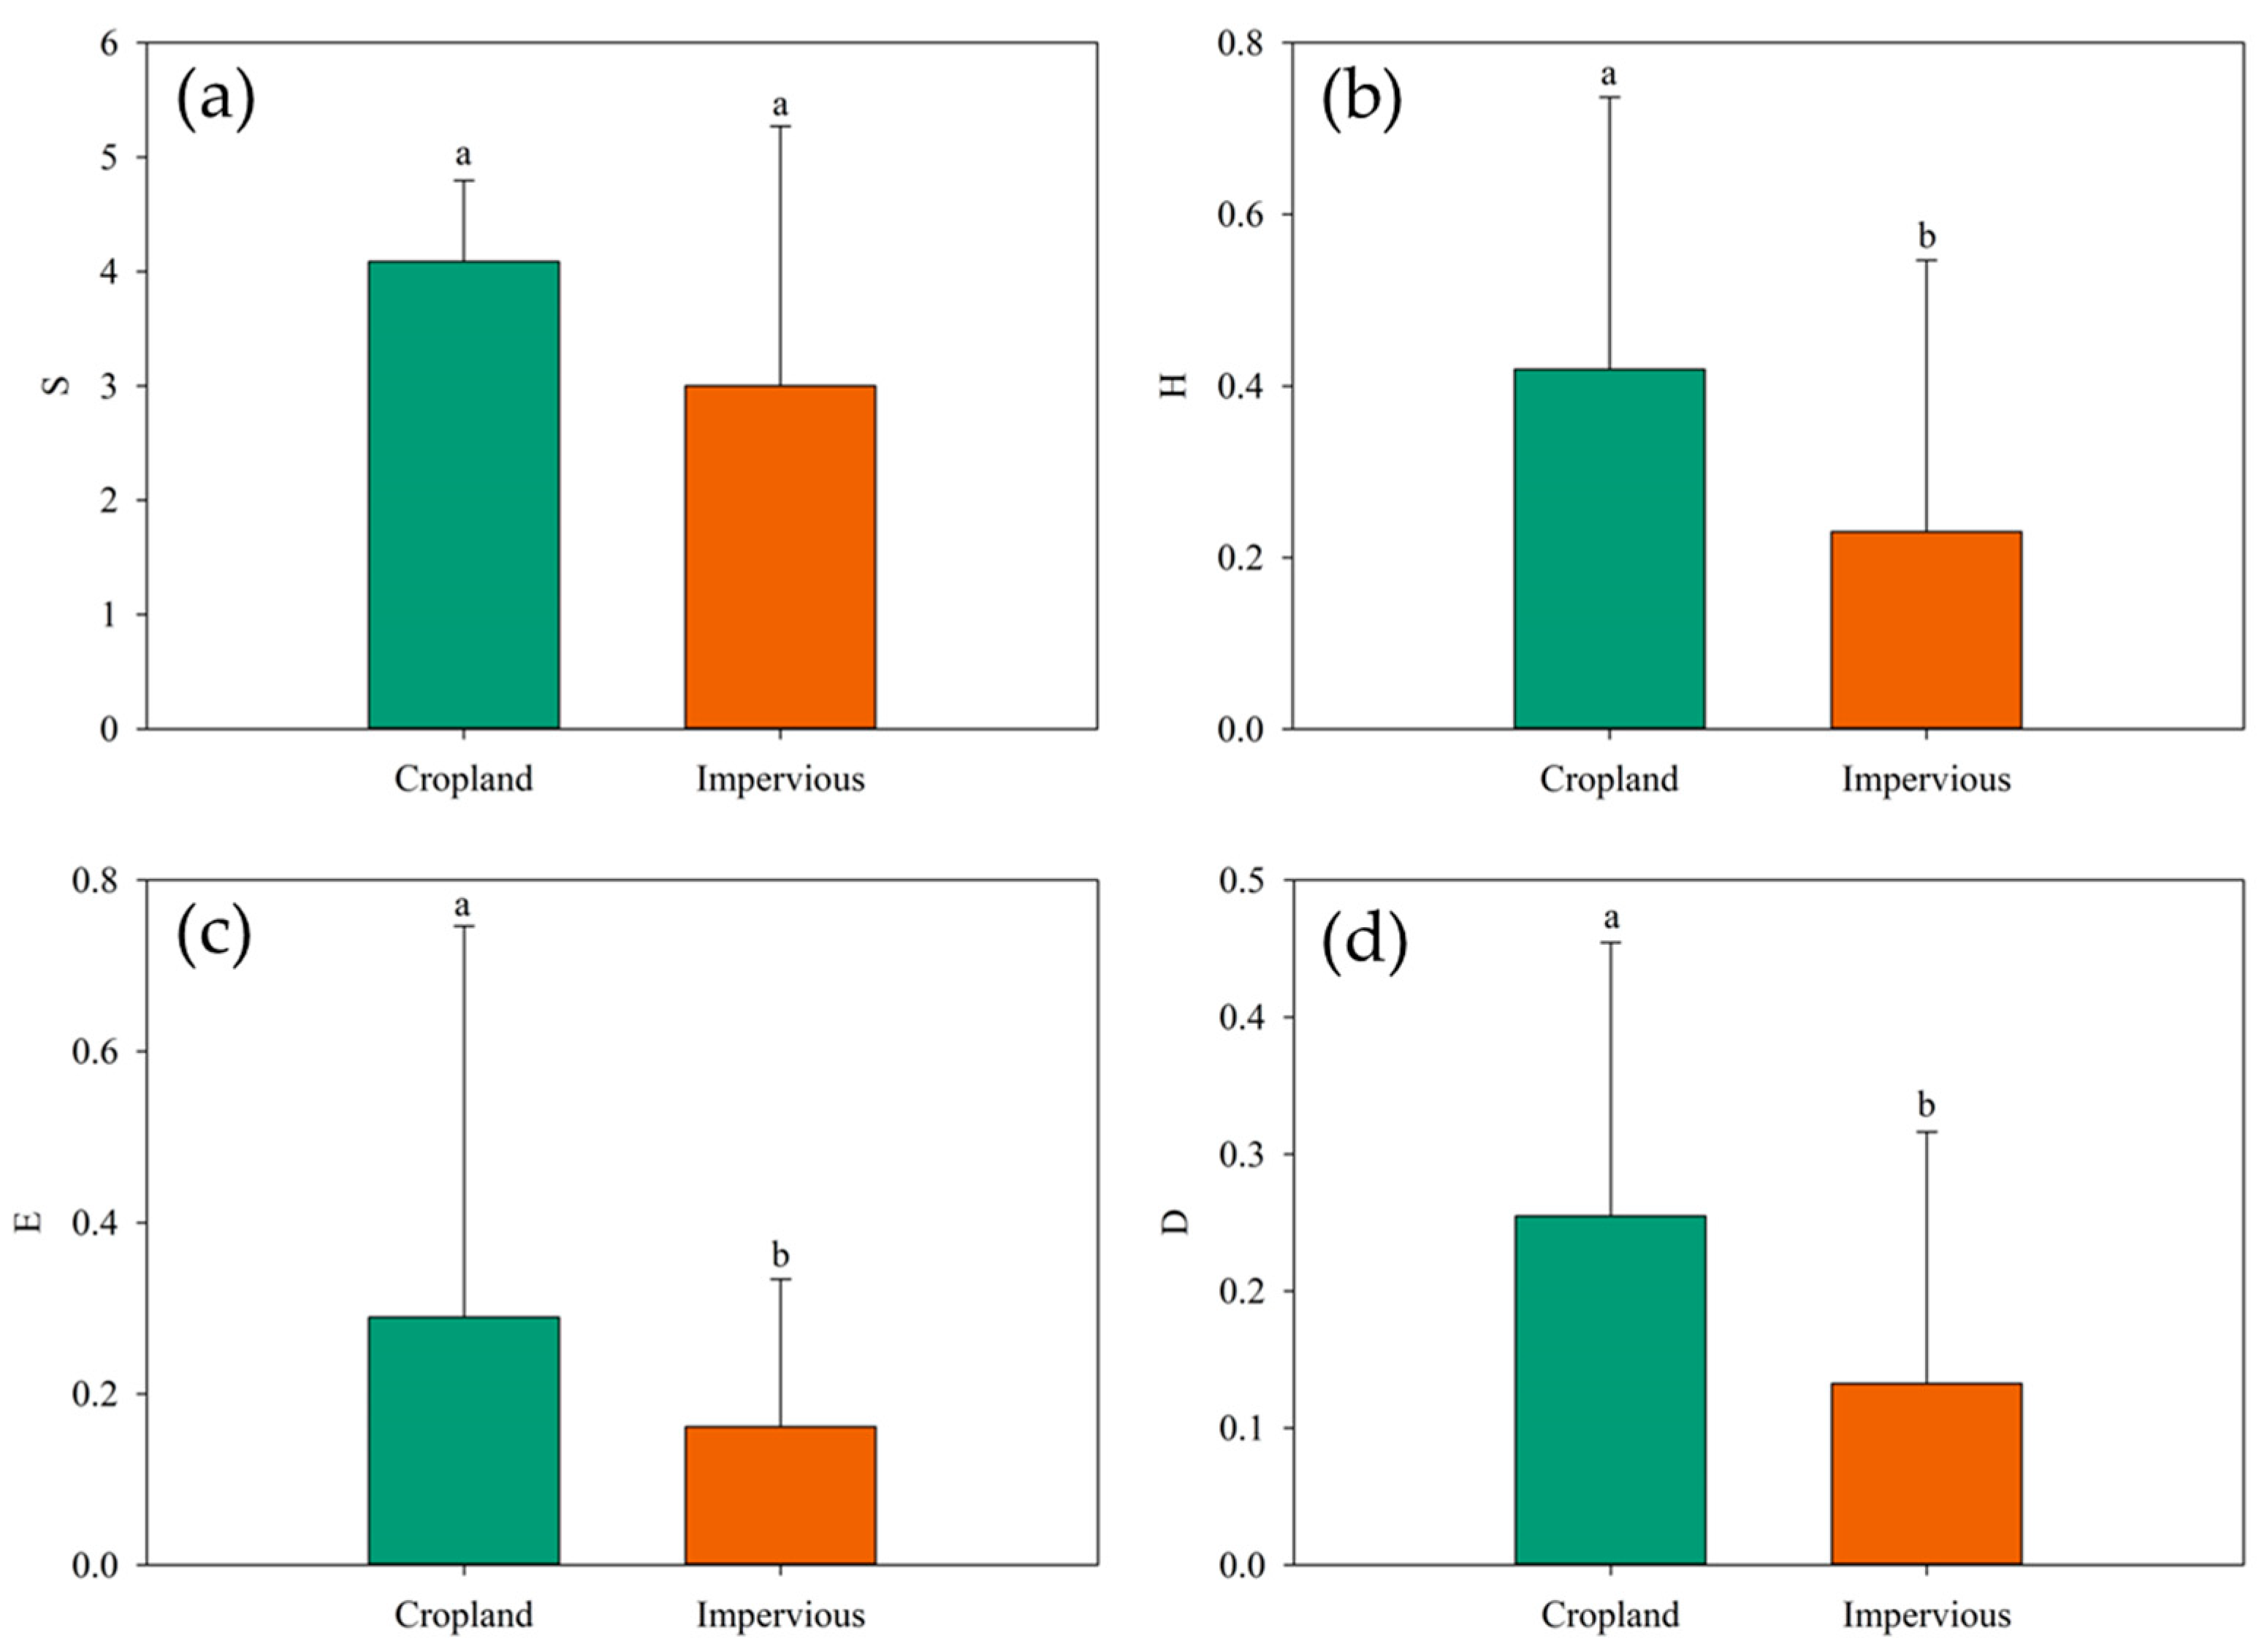
3.1.2. Vegetation Diversity under Different Land Cover Types

Vegetation diversity across various land cover types in the Yellow River Delta exhibits distinct variations. This field mainly contains Phragmites australis, Imperata cylindrica, and other halophytic and semi-halophytic mixed communities. The impervious water surface mainly consists of a single community such as alkali pongee and reed. Regarding species richness, no significant differences were observed among the land cover types (p > 0.05). Cropland demonstrated a high species richness, averaging 4.09 (Figure 4a). For the Shannon–Wiener index, Simpson index, and evenness index, farmland consistently displayed significantly (p < 0.05) higher biodiversity indices compared to impervious surfaces (Figure 4). Specifically, cropland recorded a high Shannon–Wiener index, averaging 0.42 (Figure 4b). In terms of the Simpson index, cropland also exhibited higher values, averaging 0.25, while impervious surfaces had lower values, averaging 0.13 (Figure 4c). Lastly, cropland demonstrated a higher Pielou’s evenness index than impervious surfaces (Figure 4d). To sum up, these findings underscore the notable disparities in vegetation diversity across different land cover types in the Yellow River Delta.

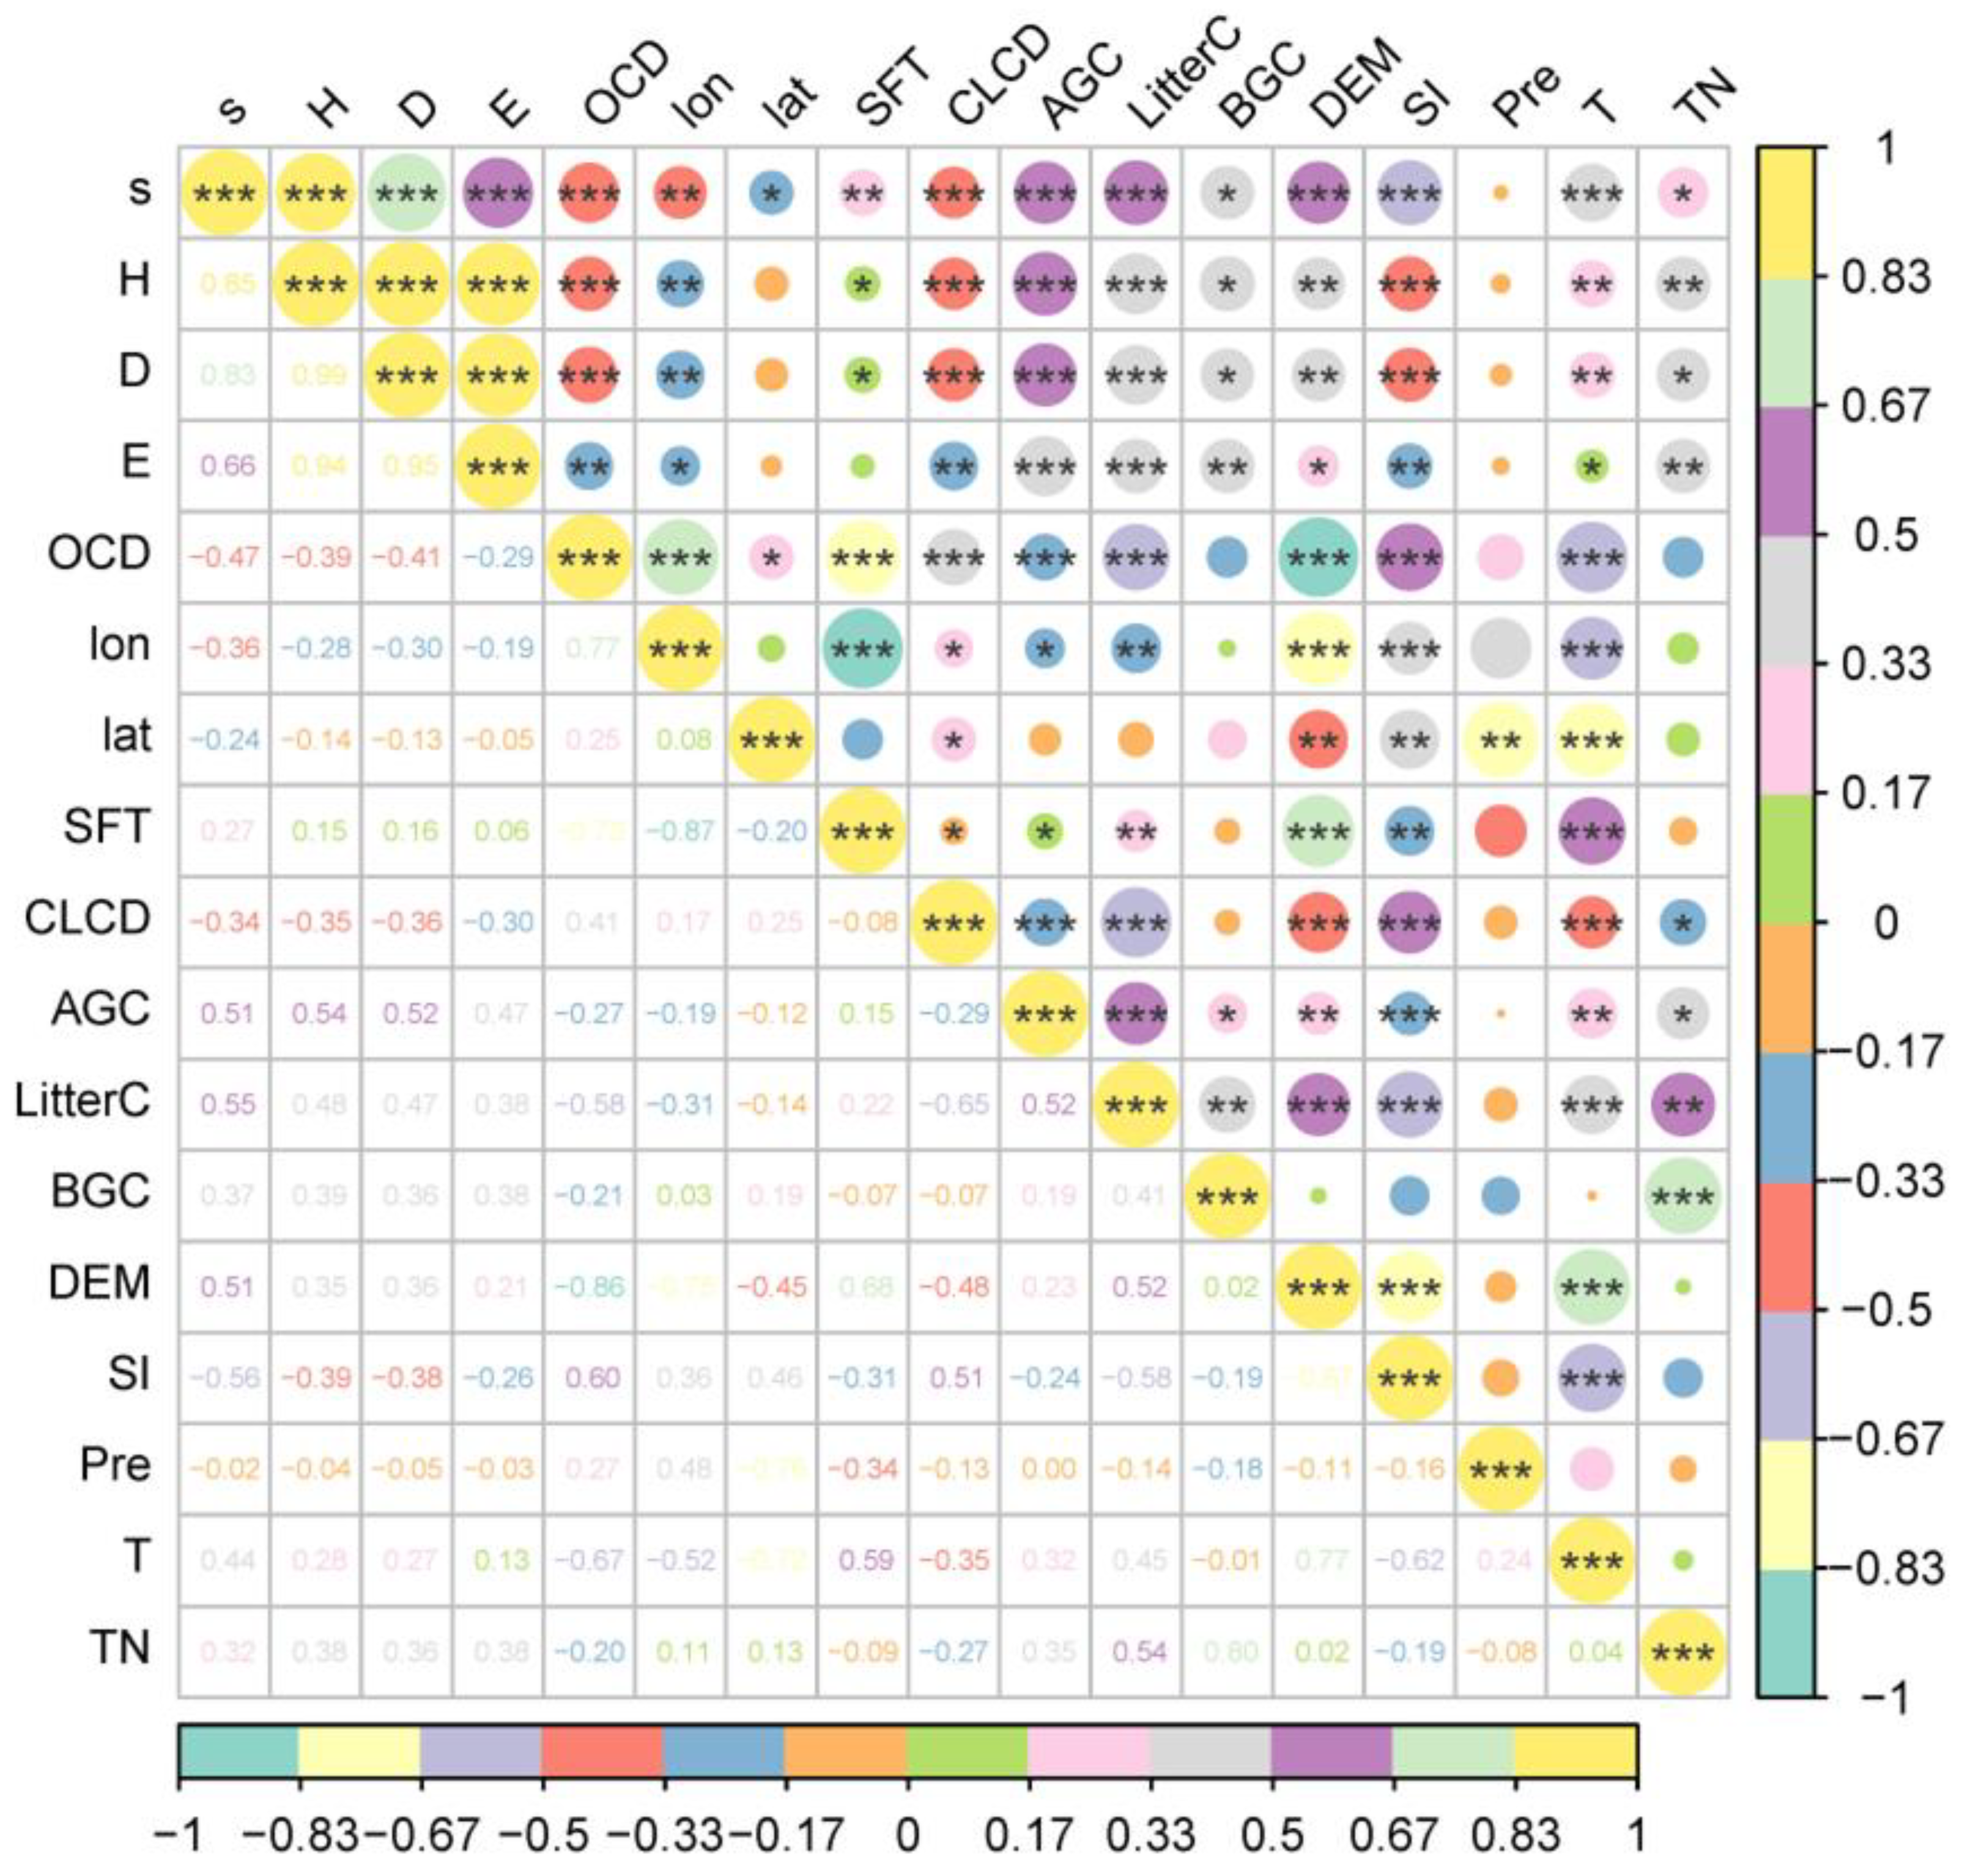
3.2. The Relationships between Impact Factors and Plant Diversity

According to the results of Spearman correlation analysis, our investigation revealed that the key factors significantly associated with the plant biodiversity index in the Yellow River Delta include ecological stoichiometric elements of plant composition (AGC, LitterC, BGC, TN), soil property factors (SFT, OCD, SI), and environmental variables (lon, lat, CLCD, T, DEM) (Figure 5).
Species richness, Shannon–Wiener index, and Simpson index consistently exhibited correlation trends with these factors. Species richness was only unrelated to precipitation but significantly correlated with other selected variables. Shannon–Wiener index, Simpson index, and evenness index show no significant correlation with latitude and precipitation. However, it is noteworthy that evenness index is unrelated to the soil formation period. The remaining variables demonstrate a significant correlation with these diversity indices.
Above-ground carbon and litter carbon exhibit a highly significant positive correlation with species richness, Shannon–Wiener index, and Simpson index. Conversely, soil organic carbon density, salinity index, and land cover are highly significantly negatively correlated with these three biodiversity indices. Notably, as indicated by the gradual increase in codes for farmland, bare land, and impervious surfaces, farmland exhibits the highest biodiversity index in comparison to impervious surfaces. Moreover, latitude, soil formation period, below-ground carbon, elevation, temperature, and total plant nitrogen demonstrate significant positive correlation with species richness. Similarly, soil formation period, below-ground carbon, elevation, temperature, and total carbon exhibit a significant positive correlation with Shannon–Wiener index and Simpson index. Conversely, latitude shows a significant negative correlation with Shannon–Wiener index and Simpson index.
Lastly, above-ground carbon, litter carbon, and evenness index exhibit a highly significant positive correlation. Below-ground carbon, elevation, temperature, and total carbon show a significant positive correlation with Pielou’s evenness index. In contrast, soil organic carbon, latitude, land cover, and SI show a significant negative correlation. Overall, these factors exert a substantial influence on biodiversity indices.

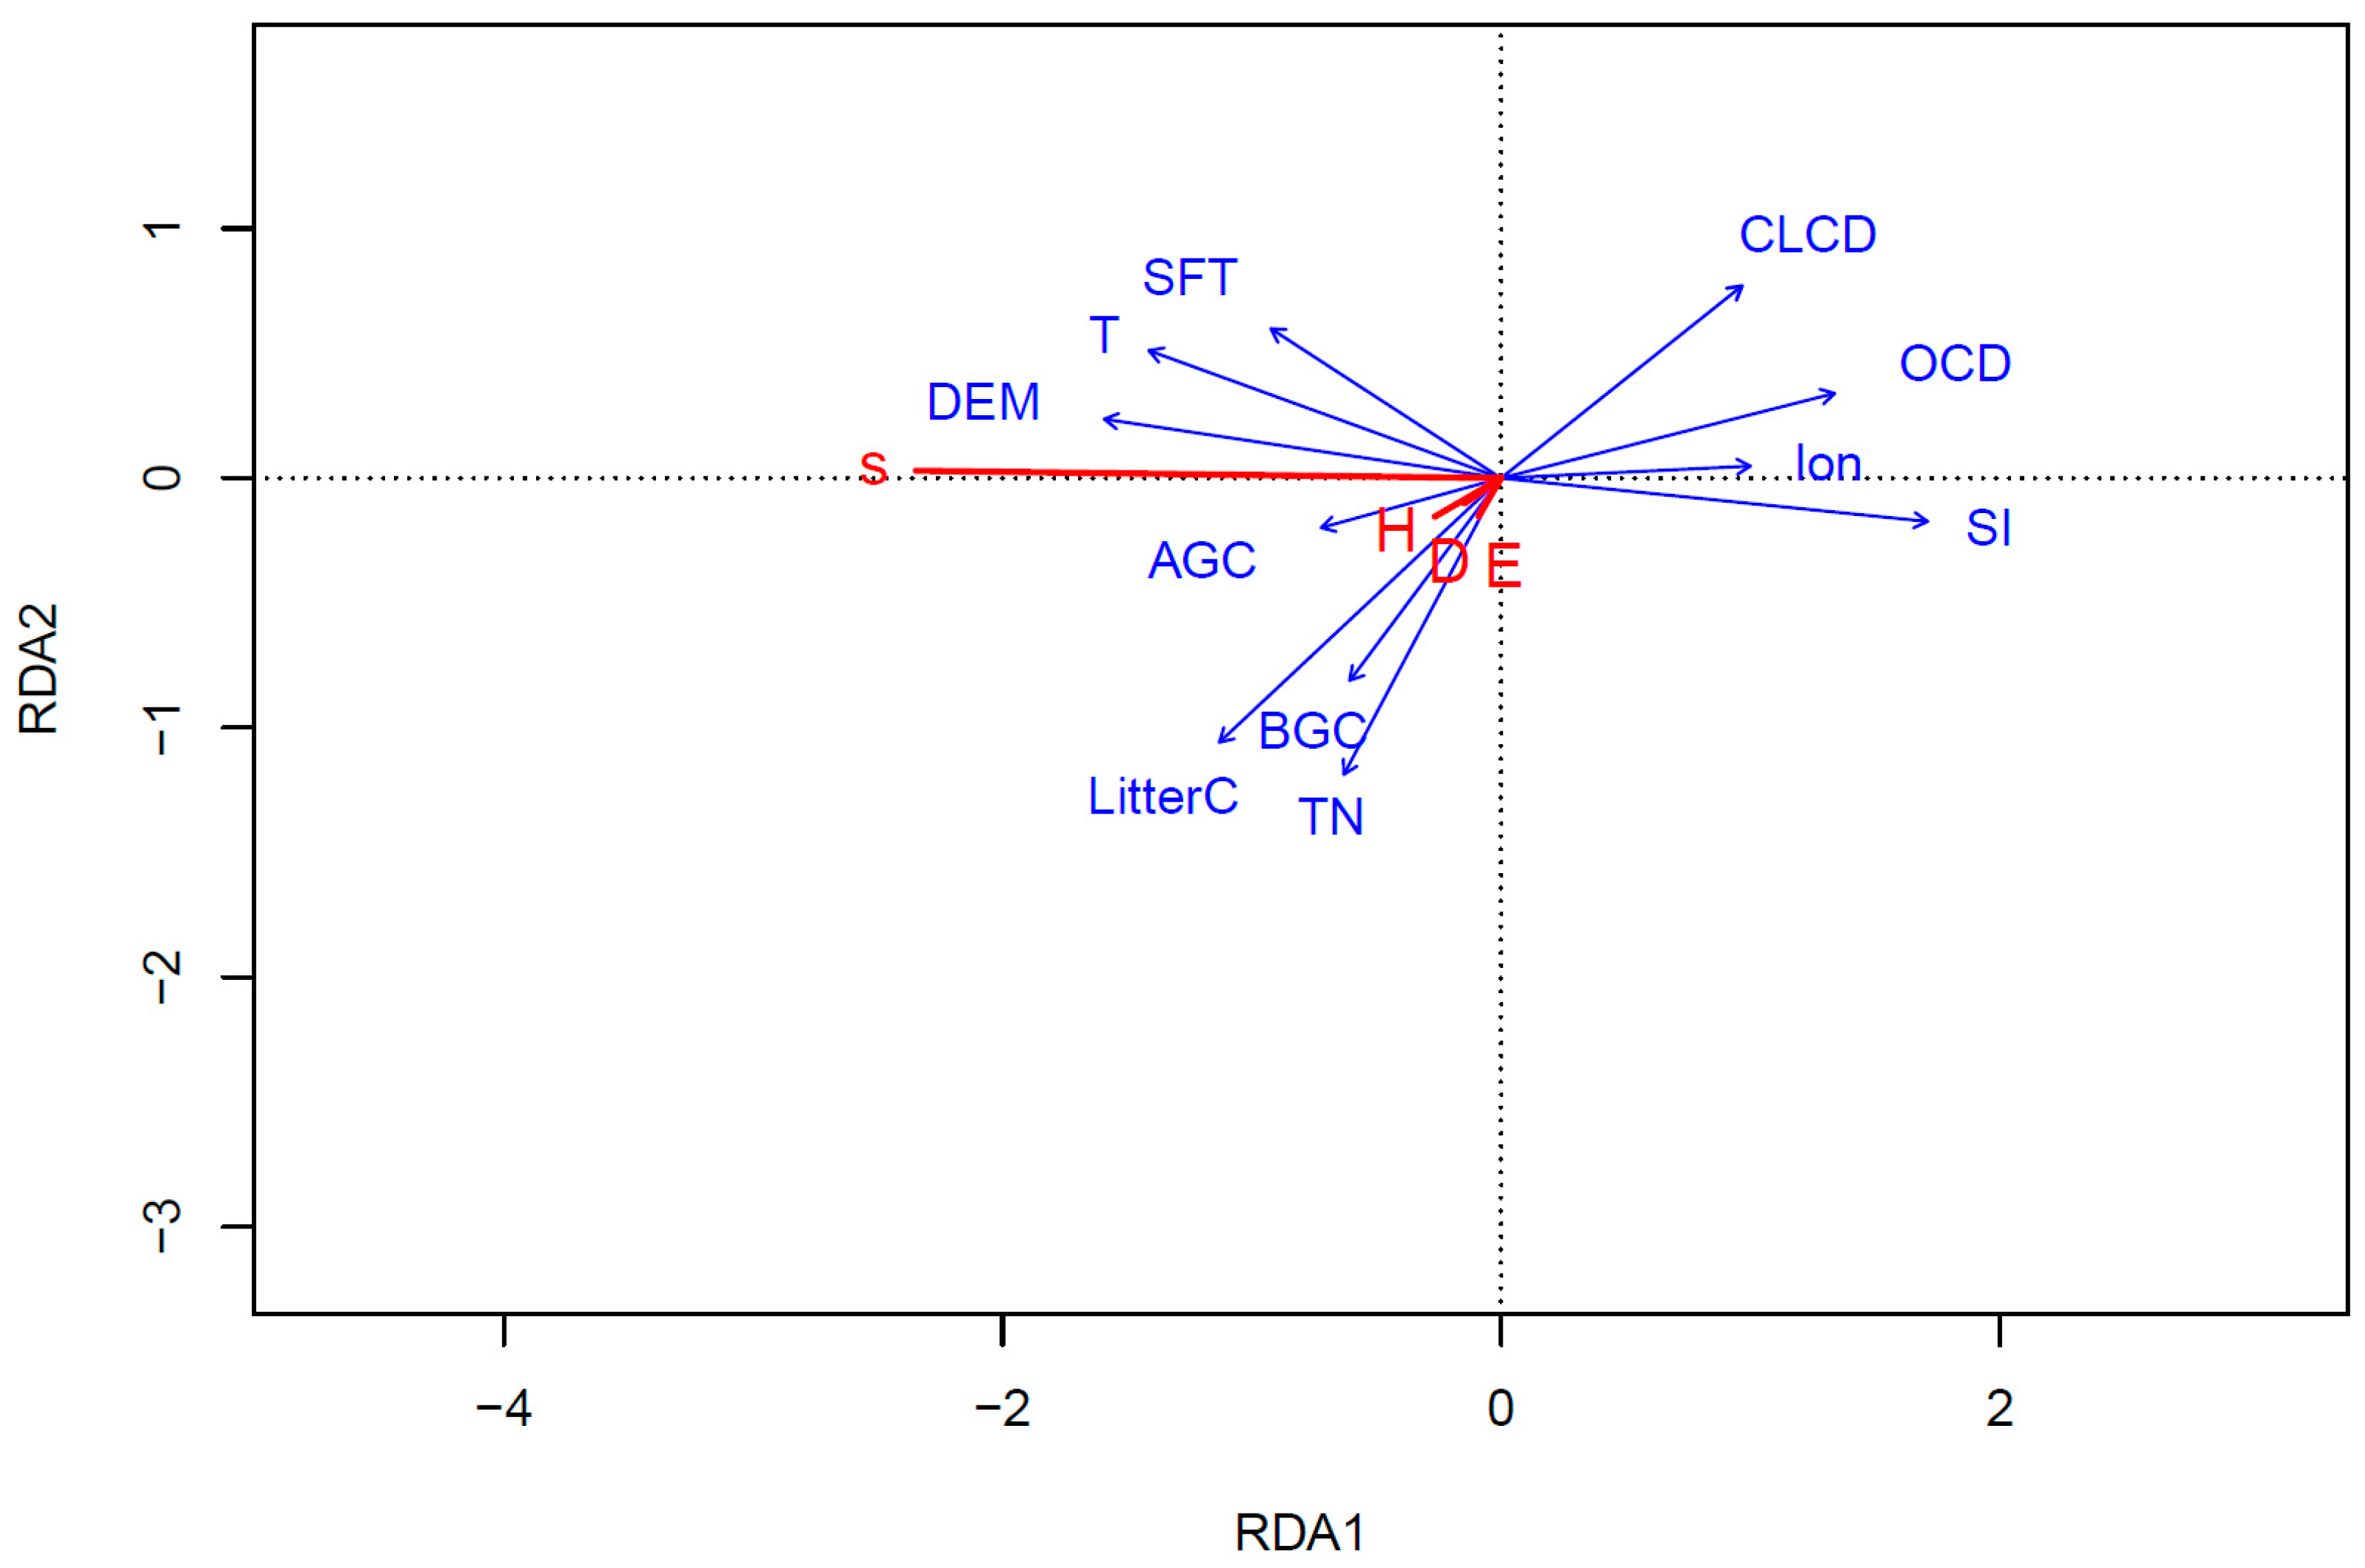
3.3. Redundancy Analysis of Impact Factors and Plant Diversity

Based on Spearman analysis, we conducted an in-depth exploration employing RDA to examine the relationship between plant diversity and significant environmental factors in the Yellow River Delta. Prior to this analysis, a collinearity analysis of the factors was performed using the VIF analysis method (Table 2), and we identified high collinearity existing between longitude and latitude, as well as between temperature and precipitation (VIF > 10). Despite the lack of correlation between longitude and precipitation and the biodiversity index under Spearman correlation analysis, we opted to conduct RDA after excluding longitude and precipitation. The subsequent analysis revealed no collinearity between the remaining factors (Table 3).
The RDA revealed that the variance explainable by the constrained axis was 36.56%, with the first axis alone accounting for 98.94% of the total variance. The cumulative explanatory rate of the first two axes reached 99.97% of the total variance (Figure 6), effectively capturing the impact of factors on the biodiversity index. The salinity index had the most substantial influence on the biodiversity index (Table 4), with an explanatory rate of 27.9% (p < 0.001), followed by elevation (R2 = 0.247, p < 0.001) and temperature (R2 = 0.219, p < 0.001). Soil organic carbon and litter carbon also exerted significant effects on the biodiversity index, with interpretation rates of 16.0% (p = 0.006) and 15.8% (p = 0.010), respectively. Soil formation age, land cover, and plant total nitrogen similarly showed significant effects on the biodiversity index (p < 0.05), while other factors did not reach significance (p > 0.05).
The RDA chart visually illustrates the correlation between different indicators. An angle >90° between arrows signifies a negative correlation between two factors, whereas an angle <90° indicates a positive correlation. Specifically, the salinity index (SI) and organic carbon density (OCD) exhibited a strong negative correlation with the biodiversity index, while digital elevation model (DEM) and temperature showed a robust positive correlation with the biodiversity index.

4. Discussion

4.1. Plant Diversity in the Yellow River Delta

It has been observed that the biodiversity index effectively captures the formation, distribution, and status of biota in specific regions [55]. In this study, the overall biodiversity index of the Yellow River Delta was found to be low, indicating a relatively limited and uneven distribution of plant species. This observation aligns with the results obtained from the assessment of plant diversity in various parts of the Yellow River Delta [55,56,57].
In contrast to some inland river wetlands in northwest China, such as the Heihe River wetland [58], the newly formed coastal lands in the Yellow River Delta exhibit notably higher species richness in the subhumid areas. Furthermore, in comparison to the Yangtze River Delta in China [59], the Yellow River Delta demonstrates significantly lower plant species diversity. This discrepancy is primarily attributed to the Yangtze River basin’s relatively warm and humid climate, underscoring how changes in climate factors can lead to variations in the distribution of plant species diversity on a large scale.
Moreover, Suaeda salsa and Phragmites australis are extensively distributed in these regions, underscoring their heightened adaptability to the environment [55,58]. For instance, species like salt-tolerant plants exhibit strong resistance to soil salinity, enabling them to thrive in the high-salt soil environment of nascent coastal lands [60].

4.2. The Effect of Salinity on Vegetation Biodiversity in the Yellow River Delta

The decreasing trend of species diversity index in the Yellow River Delta corresponds with an increasing salinity index, indicating that a high salinity gradient imposes significant stress on plants [5]. This stress fosters homogeneity in the plant community structure, thereby diminishing both the plant community diversity and the overall level of ecosystem function [21]. Areas with elevated soil salinity predominantly feature Suaeda salsa and Tamarix chinensis communities, resulting in low vegetation diversity, limited plant species, and a simplified community structure. The RDA highlights salinity as a crucial limiting factor for vegetation diversity in this habitat (Figure 6), making high-salt regions conducive to halophytic vegetation like Suaeda salsa and Tamarix chinensis, contributing to a relatively impoverished species composition. Conversely, regions with low soil salinity showcase reed and white grass communities, coexisting with other salt-tolerant vegetation [55]. These areas exhibit relatively high vegetation diversity and a greater number of plant species. Consequently, soil salinity emerges as the primary factor influencing vegetation distribution in the Yellow River Delta, aligning with findings from previous studies by researchers such as Wenxin Zhang in the Yellow River Delta [55] and Min Zhao in the middle reaches of the Heihe River [58].
In terms of the evenness index, which reflects the similarity in species richness, a significant negative correlation with the salinity index is observed in the Yellow River Delta region. This finding aligns with the research results of Crain et al., indicating a higher evenness index in areas with lower salt gradients [61]. However, the relationship between the evenness index and soil salinity has not yielded a consistent conclusion in previous studies [58,62]. In general, the trend of diversity and richness indices in the Yellow River Delta remains consistent, suggesting that species diversity is primarily influenced by species richness, with the evenness index playing a less prominent role [55]. This phenomenon may be attributed to the salinized environment of newly developed coastal land, leading to small distribution differences among individual species within the community.

4.3. The Impact of Vegetation Biomass Carbon on Biodiversity in the Yellow River Delta

In our study, we explored the influence of plant litter biomass carbon on vegetation diversity, revealing a noteworthy positive relationship. Plant litter biomass carbon is derived from the conversion of atmospheric carbon dioxide into organic matter by plants through photosynthesis. As these litters decompose in the humus, they not only release essential nutrients such as nitrogen and phosphorus, thereby enhancing soil fertility [63], but also play a pivotal role in promoting the positive growth and development of vegetation [64].
A noteworthy aspect is that the decomposition and accumulation of litter have a substantial impact on vegetation structure. Elevated levels of litter biomass carbon might lead to the formation of vegetation layers, fostering increased habitat diversity for plants [65]. This diversity, in turn, fosters the coexistence of various plant species, forming more intricate and diverse vegetation communities. Consequently, this contributes significantly to the stability and sustainability of the entire ecosystem. However, concerning subsurface processes, we observed a significant negative correlation between surface soil organic carbon and vegetation diversity in the Yellow River Delta. Through correlation analysis, a noteworthy negative correlation between soil organic carbon and vegetation biomass carbon was identified in the Yellow River Delta. This observation could be attributed to a complex interplay of factors in the Yellow River Delta [66], including poor soil retention, prolonged exposure to flowing water, and human disturbance [20,31]. These factors collectively influence soil organism activity and the decomposition rate of litter, resulting in decreased stability and accumulation of litter carbon in the soil [67].
To further explore the negative correlation between soil organic carbon and vegetation diversity, additional studies on soil ecosystem dynamics in the Yellow River Delta region are essential to unveil the underlying mechanisms. Potential research directions include investigating changes in soil microbial community structure, implementing strategies to enhance soil water retention, understanding vegetation adaptability, and exploring ecosystem restoration measures. By thoroughly examining the interactions among these factors, we can comprehensively grasp the relationship between soil organic carbon and vegetation diversity, providing a scientific foundation for ecosystem management and conservation.

5. Conclusions

This research conducted a field survey to assess vegetation biodiversity in the Yellow River Delta. The main factors influencing plant diversity were explored using Spearman correlation analysis and RDA. Our findings revealed the presence of 30 dominant plant species in the Yellow River Delta, with the majority belonging to the Gramineae and Compositae families. The primary dominant communities identified included Suaeda salsa, Phragmites australis, Setaria viridis, Imperata cylindrica, and Tamarix chinensis.
In the Yellow River Delta region, the average of Shannon–Wiener index, Simpson diversity index, and Pielou’s evenness index were measured at 0.34, 0.21, and 0.25, respectively, indicating characteristics of a low vegetation community type with a relatively simple structure. Notably, there was no significant difference in the biodiversity index under different soil formation ages. However, when considering various land cover types, the biodiversity index in cropland-covered areas was significantly higher than that under impervious layer cover.
Through correlation analysis, we identified significant effects of ecological chemical elements, soil properties, and environmental factors on biodiversity. After conducting collinearity analysis and excluding insignificant and irrelevant factors, RDA revealed that the soil salinity index derived from remote sensing played a dominant role in influencing plant diversity in the Yellow River Delta, displaying a significant negative correlation. This is attributed to the fact that in salinized soil, only specific vegetation types such as Suaeda salsa and Tamarix chinensis can adapt and survive. Additionally, elevation and temperature showed significant positive effects on plant diversity.
On the contrary, we observed opposing effects of soil organic carbon and litter carbon on vegetation diversity. This discrepancy is primarily due to the impact of factors like flowing water, human interference, and poor water retention in the Yellow River Delta region, resulting in increased soil nutrient loss after litter decomposition. Furthermore, the significant positive correlation between soil organic carbon and the soil salinity index contributed to relatively low soil organic carbon but rich plant diversity in low-salt environments.
Consequently, the vegetation structure of the new land in the Yellow River Delta is significantly influenced by soil salinity, potentially leading to a decline in ecosystem function. Therefore, implementing proper soil salt management is of paramount importance for the protection and restoration of the new land in the Yellow River Delta.

Author Contributions

Conceptualization, Z.X. and W.D.; methodology, R.L.; validation, Z.X., S.Y. and P.W.; formal analysis, Z.X.; investigation, H.W.; resources, W.D.; data curation, Z.X.; writing—original draft preparation, Z.X., J.D. and J.W.; writing—review and editing, R.L.; visualization, L.N. and P.W.; supervision, H.W.; project administration, R.L. and W.D.; funding acquisition, R.L. and W.D. All authors have read and agreed to the published version of the manuscript.

Funding

This research was funded by National Key Research and Development Project (No. 2023YFF0805903), the National Natural Science Foundation of China (No. 42371055), and Comprehensive survey, monitoring and evaluation of natural resources in Yellow River Delta (No. DD20220886).

Data Availability Statement

The data presented in this study are available on request from the corresponding author. The data are not publicly available due to the authors do not have permission to share data.

Acknowledgments

Thanks to Guangyue Su, Jiazhou Lin, Tianjiang Xu, Bing Wang, Jie Chen, and Chunfu Liu from China Geological Survey for their help in collecting plant samples. Thanks to Kai Zhu, Baibing Ma, Hao Wang, and Yue Xi, Ph.D. students of the Institute of Geographic Sciences and Natural Resources, Chinese Academy of Sciences, for their help and comments on the article.

Conflicts of Interest

The authors declare no conflicts of interest.

References

  1. Li, S.; Wang, X.; Liu, H.; Sun, M.; Lei, Y. Diversity of Desert Plants in Hexi Corridor and Its Response to Environmental Factors. Ecol. Environ. Sci. 2023, 32, 429–438. [Google Scholar]
  2. Zhang, J.; Diao, H.; Zhang, T.; Diao, X. Dynamics of species diversity of communities in restoration processes in horqin sandy land. Acta Phytoecol. Sin. 2004, 28, 86–92. [Google Scholar]
  3. Lukacs, B.A.; Sramko, G.; Molnar, A.V. Plant diversity and conservation value of continental temporary pools. Biol. Conserv. 2013, 158, 393–400. [Google Scholar] [CrossRef]
  4. Weigel, R.; Gilles, J.; Klisz, M.; Manthey, M.; Kreyling, J. Forest understory vegetation is more related to soil than to climate towards the cold distribution margin of European beech. J. Veg. Sci. 2019, 30, 746–755. [Google Scholar] [CrossRef]
  5. Yao, M.; Guo, C.; He, F.; Zhang, Q.; Ren, G. Soil Stoichiometric Characteristics and its Relationship with Plant Diversity in Saline-Alkali Grassland of Northern Shanxi. Acta Agrestia Sin. 2021, 29, 2800–2807. [Google Scholar]
  6. Elser, J.J.; Sterner, R.W.; Gorokhova, E.; Fagan, W.F.; Markow, T.A.; Cotner, J.B.; Harrison, J.F.; Hobbie, S.E.; Odell, G.M.; Weider, L.J. Biological stoichiometry from genes to ecosystems. Ecol. Lett. 2000, 3, 540–550. [Google Scholar] [CrossRef]
  7. Cardinale, B.J.; Duffy, J.E.; Gonzalez, A.; Hooper, D.U.; Perrings, C.; Venail, P.; Narwani, A.; Mace, G.M.; Tilman, D.; Wardle, D.A.; et al. Biodiversity loss and its impact on humanity. Nature 2012, 486, 59–67. [Google Scholar] [CrossRef]
  8. Furey, G.N.; Tilman, D. Plant biodiversity and the regeneration of soil fertility. Proc. Natl. Acad. Sci. USA 2021, 118, e2111321118. [Google Scholar] [CrossRef] [PubMed]
  9. Hooper, D.U.; Adair, E.C.; Cardinale, B.J.; Byrnes, J.E.K.; Hungate, B.A.; Matulich, K.L.; Gonzalez, A.; Duffy, J.E.; Gamfeldt, L.; O’Connor, M.I. A global synthesis reveals biodiversity loss as a major driver of ecosystem change. Nature 2012, 486, 105–108. [Google Scholar] [CrossRef] [PubMed]
  10. Wardle, D.A.; Walker, L.R.; Bardgett, R.D. Response to comment on “Ecosystem properties and forest decline in contrasting long-term chronosequences”. Science 2005, 308, 633. [Google Scholar] [CrossRef]
  11. Lange, M.; Eisenhauer, N.; Chen, H.; Gleixner, G. Increased soil carbon storage through plant diversity strengthens with time and extends into the subsoil. Glob. Chang. Biol. 2023, 29, 2627–2639. [Google Scholar] [CrossRef]
  12. Lange, M.; Koller-France, E.; Hildebrandt, A.; Oelmann, Y.; Wilcke, W.; Gleixner, G. How plant diversity impacts the coupled water, nutrient and carbon cycles. In Mechanisms Underlying the Relationship between Biodiversity and Ecosystem Function; Eisenhauer, N., Bohan, D.A., Dumbrell, A.J., Eds.; Academic Press Inc., Elsevier Science: San Diego, CA, USA, 2019; Volume 61, pp. 185–219. [Google Scholar]
  13. Siles, G.; Voirin, Y.; Benie, G.B. Open-source based geo-platform to support management of wetlands and biodiversity in Quebec. Ecol. Inform. 2018, 43, 84–95. [Google Scholar] [CrossRef]
  14. Erdos, L.; Torok, P.; Veldman, J.W.; Batori, Z.; Bede-Fazekas, A.; Magnes, M.; Kroel-Dulay, G.; Tolgyesi, C. How climate, topography, soils, herbivores, and fire control forest-grassland coexistence in the Eurasian forest-steppe. Biol. Rev. 2022, 97, 2195–2208. [Google Scholar] [CrossRef] [PubMed]
  15. Deguines, N.; Brashares, J.S.; Prugh, L.R. Precipitation alters interactions in a grassland ecological community. J. Anim. Ecol. 2017, 86, 262–272. [Google Scholar] [CrossRef] [PubMed]
  16. Rita, A.; Borghetti, M. Linkage of forest productivity to tree diversity under two different bioclimatic regimes in Italy. Sci. Total Environ. 2019, 687, 1065–1072. [Google Scholar] [CrossRef] [PubMed]
  17. Kumar, B.M. Do carbon stocks and floristic diversity of tropical homegardens vary along an elevational gradient and based on holding size in central Kerala, India? Agrofor. Syst. 2023, 97, 751–783. [Google Scholar] [CrossRef] [PubMed]
  18. Yotkham, S.; Suttiprapan, P.; Likhitrakarn, N.; Sulin, C.; Srisuka, W. Biodiversity and Spatiotemporal Variation of Longhorn Beetles (Coleoptera: Cerambycidae) in Tropical Forest of Thailand. Insects 2021, 12, 45. [Google Scholar] [CrossRef] [PubMed]
  19. Dou, P.; He, S.; Gao, C.; Li, K.; Liu, F. Effects of different restoration communities on understory species diversity and soil physical and chemical properties in dry-hot valley. J. Zhejiang Af Univ. 2022, 39, 616–624. [Google Scholar]
  20. Hou, G.; Lai, J.; Li, J.; Liu, Z.; Gong, H.; Wang, B.; Sun, Z.; Ouyang, Z.; Hou, R. Driving force of soil age on vegetation and microbial succession in the Yellow River Delta. Acta Ecol. Sin. 2022, 42, 8839–8859. [Google Scholar]
  21. Bui, E.N. Soil salinity: A neglected factor in plant. ecology and biogeography. J. Arid. Environ. 2013, 92, 14–25. [Google Scholar] [CrossRef]
  22. Zhang, X.; Lv, G.; Yang, X.; Gong, L.; Qin, L.; He, X.; Liu, H. Responses of desert plant diversity, community and interspecific association to soil salinity gradient. Acta Ecol. Sin. 2013, 33, 5714–5722. [Google Scholar] [CrossRef]
  23. Wang, M.; Lu, N.; An, N.; Fu, B. Plant Functional and Phylogenetic Diversity Regulate Ecosystem Multifunctionality in Semi-Arid Grassland During Succession. Front. Environ. Sci. 2022, 9, 791801. [Google Scholar] [CrossRef]
  24. Zhou, G.; Lucas-Borja, M.E.; Liu, S.; Hu, H.-W.; He, J.-Z.; Wang, X.; Jiang, Z.; Zhou, X.; Delgado-Baquerizo, M. Plant and soil biodiversity is essential for supporting highly multifunctional forests during Mediterranean rewilding. Funct. Ecol. 2023, 37, 420–431. [Google Scholar] [CrossRef]
  25. Ali, M.; Yar, P.; Khan, S.; Muhammad, S.; Hussain, W.; Hussain, K.; Hussain, G.; Aneva, I.Y.; Tng, D.Y.P.; Bussmann, R.W. Land use and land cover modification and its impact on biodiversity and the ecosystem services in District Kurram, Pakistan. Bol. Latinoam. Y Caribe Plantas Med. Y Aromat. 2022, 21, 365–388. [Google Scholar]
  26. Martin, C.A.; Proulx, R.; Vellend, M.; Fahrig, L. How the relationship between vegetation cover and land-cover variance constrains biodiversity in a human dominated world. Landsc. Ecol. 2021, 36, 3097–3104. [Google Scholar] [CrossRef]
  27. Nemec, R.; Vymazalova, M.; Skokanova, H. The Impact of Fine-Scale Present and Historical Land Cover on Plant Diversity in Central European National Parks with Heterogeneous Landscapes. Land 2022, 11, 814. [Google Scholar] [CrossRef]
  28. Janousek, C.N.; Folger, C.L. Variation in tidal wetland plant diversity and composition within and among coastal estuaries: Assessing the relative importance of environmental gradients. J. Veg. Sci. 2014, 25, 534–545. [Google Scholar] [CrossRef]
  29. Qu, Z.; Li, Y.; Yu, J.; Yang, J.; Ma, Y.; Zhang, J.; Zhou, D.; Wang, X. Simulation of soil water and salt transportation of typical plant community in estuarine wetland of the Yellow River Delta. Chin. J. Ecol. 2022, 41, 903–911. [Google Scholar]
  30. Liping, G.; Erda, L. Carbon sink in cropland soils and the emission of greenhouse gases from paddy soils: A review of work in China. Chemosphere-Glob. Chang. Sci. 2001, 3, 413–418. [Google Scholar] [CrossRef]
  31. Hou, G.; Gao, M.; Ye, S.; Zhao, G. Source of salt and the salinization process of shallow groundwater in the Yellow River Delta. Earth Sci. Front. 2022, 29, 145–154. [Google Scholar]
  32. Guo, H.; Fan, Y.; Guan, Q.; Fan, B.; Wang, Y. Ecological risk assessment of the Yellow River Delta based on ecosystem services. Mar. Sci. 2023, 47, 15–26. [Google Scholar]
  33. Qu, Y.; Wang, S.; Li, Y.; Zhu, W.; Wang, S. Characteristics of potential conflicts of territorial space and optimization pattern in the Yellow River Delta based on multi-functional suitability. Sci. Geogr. Sin. 2023, 43, 301–312. [Google Scholar]
  34. Ma, D.; Huang, Q.; Liu, B.; Zhang, Q. Analysis and Dynamic Evaluation of Eco-Environmental Quality in the Yellow River Delta from 2000 to 2020. Sustainability 2023, 15, 7835. [Google Scholar] [CrossRef]
  35. Xu, Q.; Yang, J.; Yuan, G.; Chu, Z.; Zhang, Z. Stratigraphic sequence and episodes of the ancient Huanghe Delta along the southwestern Bohai Bay since the LGM. Mar. Geol. 2015, 367, 69–82. [Google Scholar] [CrossRef]
  36. Wang, J.; Wang, J.; Zhang, Z.; Li, Z.; Zhang, Z.; Zhao, D.; Wang, L.; Lu, F.; Li, Y.-Z. Shifts in the bacterial population and ecosystem functions in response to vegetation in the yellow river delta wetlands. Msystems 2020, 5, 1–14. [Google Scholar] [CrossRef]
  37. Fan, Y.; Wang, J.; Fan, B.; Xu, Z. Dynamic monitoring of wetlands in the Yellow River delta based on multi-source remote sensing. Bull. Surv. Mapp. 2023, 27–35. [Google Scholar]
  38. Wang, K.; Fan, Y.; Du, X.; Yu, S. Study on the classification of geomorphic unit in the Yellow River Delta. J. Sediment Res. 2021, 46, 51–57, 64. [Google Scholar]
  39. Zhang, Q.; Zhao, Z.; Jia, L.; Wang, W.; Jia, W. Analysis of land subsidence status and influencing factors in Yellow River Delta. Sci. Surv. Mapp. 2022, 47, 165–173. [Google Scholar]
  40. Zhang, X.; Cao, Q.; Ji, S.; Chen, H.; Zhang, T.; Liu, J. Quantifying the contributions of climate change and human activities to vegetation dynamic changes in the Yellow River Delta. Acta Sci. Circumstantiae 2022, 42, 56–69. [Google Scholar]
  41. Yue, X.Y.; Yue, W. The spatiotemporal characteristics of vegetation coverage and its driving factors in the Yellow River Delta. Appl. Ecol. Environ. Res. 2023, 21, 4165–4176. [Google Scholar] [CrossRef]
  42. Sun, Y.; Chen, X.; Luo, Y.; Cao, D.; Feng, H.; Zhang, X.; Yao, R. Agricultural Water Quality Assessment and Application in the Yellow River Delta. Agronomy 2023, 13, 1495. [Google Scholar] [CrossRef]
  43. Zhang, H.; Sun, Y.; Zhang, W.; Song, Z.; Ding, Z.; Zhang, X. Comprehensive evaluation of the eco-environmental vulnerability in the Yellow River Delta wetland. Ecol. Indic. 2021, 125, 107514. [Google Scholar] [CrossRef]
  44. Duan, D.; Gao, C.; Wu, T. Analysis of the Composition of Wild Forage Plant Resources in Yellow River Delta. Chin. Wild Plant Resour. 2022, 41, 80–82, 89. [Google Scholar]
  45. Yang, J.; Huang, X. The 30 m annual land cover dataset and its dynamics in China from 1990 to 2019. Earth Syst. Sci. Data 2021, 13, 3907–3925. [Google Scholar] [CrossRef]
  46. Xue, C. Classification and identification of lobes in modern Yellow River Delta. Geogr. Res. 1994, 13, 59–66. [Google Scholar]
  47. Bai, J.; Meng, Y.; Gou, R.; Lyu, J.; Dai, Z.; Diao, X.; Zhang, H.; Luo, Y.; Zhu, X.; Lin, G. Mangrove diversity enhances plant biomass production and carbon storage in Hainan island, China. Funct. Ecol. 2021, 35, 774–786. [Google Scholar] [CrossRef]
  48. Margalef, R. Information Theory in Ecology; Real Academia de Ciencias y Artes de Barcelona: Barcelona, Spain, 1973. [Google Scholar]
  49. Shannon, C.E. A mathematical theory of communication. Bell Syst. Tech. J. 1948, 27, 379–423. [Google Scholar] [CrossRef]
  50. Simpson, E.H. Measurement of diversity. Nature 1949, 163, 688. [Google Scholar] [CrossRef]
  51. Liu, G.; Bai, Z.; Cui, G.; He, W.; Kongling, Z.; Ji, G.; Gong, H.; Li, D. Effects of Land Use on the Soil Microbial Community in the Songnen Grassland of Northeast China. Front. Microbiol. 2022, 13, 865184. [Google Scholar] [CrossRef]
  52. Howard, J.H.; Baldwin, R.F.; Brown, B.L. Exploratory analysis for complex-life-cycle amphibians: Revealing complex forest-reproductive effort relationships using redundancy analysis. For. Ecol. Manag. 2012, 270, 175–182. [Google Scholar] [CrossRef]
  53. Gerardo, R.; de Lima, I.P. Sentinel-2 Satellite Imagery-Based Assessment of Soil Salinity in Irrigated Rice Fields in Portugal. Agriculture 2022, 12, 1490. [Google Scholar] [CrossRef]
  54. Wu, X.; Wang, Z.; Fan, L.; Li, L. An applicability analysis of salinization evaluation index based on multispectral remote sensing to soil salinity prediction in Yinbei irrigation area of Ningxia. Remote Sens. Land Resour. 2021, 33, 124–133. [Google Scholar]
  55. Zhang, W.; Yi, S.; Fan, X.; Zhang, X.; Liu, X.; Fang, Y.; Ma, H.; Liu, F.; Liang, Y. Relationship between Ecosystem Multifunctionality and Plant Diversity in Different Dimensions in the Yellow River Delta. Wetl. Sci. 2023, 21, 1–8. [Google Scholar]
  56. Zhang, Q.; Han, G.; Lu, F.; Zhou, Y.; Wang, X.; Li, P.; Chu, X.; He, W.; Yu, D.; Song, W.; et al. Effects of different restoration ages on plant diversity and community stability of wetlands in the Yellow River Delta. Chin. J. Ecol. 2022, 41, 1249–1257. [Google Scholar]
  57. Wang, S.; Pang, Y.; Song, A.; Cao, B.; Zhu, Z.; Li, Y. Soil physiochemical properties and diversity of herbaceous plants dynamic on the different ages mixed forests of Populus * Euramercana Neva’ and Robinia pseucdoacacia in coastal saline-alkali area. Acta Ecol. Sin. 2018, 38, 6539–6548. [Google Scholar]
  58. Zhao, M.Z. Ruifeng; Zhang, Lihua; Zhao, Haili; Zhou, Yuangang, Plant diversity and its relationship with soil factors in the middle reaches of the Heihe River based on the soil salinity gradient. Acta Ecol. Sin. 2019, 39, 4116–4126. [Google Scholar]
  59. Zhang, Y.; Zhang, G.; Li, Y.; Li, L.; Yu, L. Diversity of Aquatic Vascular Plants in the Yangtze Delta. Plant Sci. J. 2012, 30, 238–249. [Google Scholar] [CrossRef]
  60. Zu, J.; Xia, J.; Zeng, Z.; Liu, X.; Cai, W.; Li, J.; Wang, Q.; Wang, Y.; Dou, C. Distribution Pattern and Structure of Vascular Plant Communities in Riparian Areas and Their Response to Soil Factors: A Case Study of Baoan Lake, Hubei Province, China. Sustainability 2022, 14, 15769. [Google Scholar] [CrossRef]
  61. Crain, C.M.; Silliman, B.R.; Bertness, S.L.; Bertness, M.D. Physical and biotic drivers of plant distribution across estuarine salinity gradients. Ecology 2004, 85, 2539–2549. [Google Scholar] [CrossRef]
  62. Scrosati, R.; Heaven, C. Spatial trends in community richness, diversity, and evenness across rocky intertidal environmental stress gradients in eastern Canada. Mar. Ecol. Prog. Ser. 2007, 342, 1–14. [Google Scholar] [CrossRef]
  63. You, Y.; Ma, Z.; Gu, Y.; Ren, J.; Wang, Y.; Li, Y.; Kamran, M.; Zhou, Q.; Hou, F. Litter leachates transform soil bacterial composition enhancing nitrogen fixation in alpine meadow. Appl. Soil Ecol. 2023, 189, 104979. [Google Scholar] [CrossRef]
  64. Zhu, S.; Wang, Q.; Yang, J.; Li, H.; Wen, X.; Wang, N.; Jiang, Y. Analysis of Plant Diversity and Biomass under Young Forest in Desert Area of Shawan County, Xinjiang. Chin. Wild Plant Resour. 2021, 40, 65–70. [Google Scholar]
  65. Liu, S.; Plaza, C.; Ochoa-Hueso, R.; Trivedi, C.; Wang, J.; Trivedi, P.; Zhou, G.; Pineiro, J.; Martins, C.S.C.; Singh, B.K.K.; et al. Litter and soil biodiversity jointly drive ecosystem functions. Glob. Chang. Biol. 2023, 29, 6276–6285. [Google Scholar] [CrossRef] [PubMed]
  66. Heredia-Acuna, C.; Semchenko, M.; De Vries, F.T. Root litter decomposition is suppressed in species mixtures and in the presence of living roots. J. Ecol. 2023, 111, 2519–2531. [Google Scholar] [CrossRef]
  67. Kim, S.; Kang, H.; Megonigal, J.P.; McCormick, M. Microbial Activity and Diversity Vary with Plant Diversity and Biomass in Wetland Ecosystems. Estuaries Coasts 2022, 45, 1434–1444. [Google Scholar] [CrossRef]
Figure 1. Location and field plots distribution of the study area. (a) Map of China; (b) Location map of the Yellow River Delta in Shandong; (c) Land cover map of the Yellow River Delta; (d) Soil formation time map of Yellow River Delta.
Land 13 00264 g001
Figure 2. Distribution of five 1 m × 1 m quadrats in a 20 m × 20 m plot. (After setting the plot, the first quadrat was set from the southwest corner of the plot, the second to fourth quadrat records were set in a clockwise direction, and the fifth quadrat was set at the center point of the plot. The red circles represent the center of each quadrat.)
Land 13 00264 g002
Figure 3. Plant diversity at different soil-forming ages in the Yellow River Delta. (a) Species richness; (b) Shannon–Wiener index; (c) Simpson diversity index; (d) Pielou’s evenness index.
Land 13 00264 g003
Figure 4. Plant diversity at different land cover types in the Yellow River Delta. (a) Species richness; (b) Shannon–Wiener index; (c) Simpson diversity index; (d) Pielou’s evenness index.(In statistical expression, the same letter represented no significant difference in biodiversity index between two land species (p > 0.05), while different letters represented significant difference in biodiversity index between two land species (p < 0.05).)
Land 13 00264 g004
Figure 5. Spearman analysis of plant diversity index and influencing variables in the Yellow River Delta. (s—species richness; H—Shannon–Wiener index; D—Simpson index; E—Pielou’s evenness index; OCD—0–5 cm soil organic carbon density; lon—longitude; lat—latitude; SFT—soil formation time; CLCD—Annual China Land Cover; AGC—above-ground carbon; BGC—below-ground carbon; DEM—digital elevation model; SI—salinity index; Pre—precipitation; T—temperature; TN—total nitrogen content; * indicates p < 0.05; ** indicates p < 0.01; *** indicates p < 0.001).
Land 13 00264 g005
Figure 6. RDA of plant diversity index and significant factors in Yellow River Delta.
Land 13 00264 g006
Table 1. Information for environmental factors.
FactorsFeaturesUnitAbbrResolutionsResources
Ecological stoichiometry of plant elementsAbove-ground biomass carbonMg/haAGC-Field collection and laboratory testing
Litter carbon contentMg/haLitterC-
Below-ground biomass carbonMg/haBGC-
Total nitrogen contentMg/haTN-
Soil propertiesSoil formation timeYear rangeSFT-Xue [46]
0–5 cm soil organic carbon densitydg/kgOCD250 mSoilGrids250m 2.0
Salinity index-SI10 mSentinel-2 remote sensing image data inversion
Environment variablesLongitudeDegreelon-Field GPS recording
LatitudeDegreelat-
Annual China Land Cover Dataset-CLCD30 mYang and Huang [45]
Temperature°CT0.0035°Meteorological station data inversion
PrecipitationmmPre
Digital elevation modelmDEM30 mCopernicus DEM GLO-30
Table 2. Collinearity analysis before collinearity factors were removed.
FactorsOCDlonlatSFTCLCDAGCLitterC
VIF6.17 14.26 29.48 7.41 2.38 1.27 3.74
FactorsBGCDEMSIPreTTN
VIF2.66 6.42 2.64 21.08 13.29 2.03
Table 3. Collinearity analysis with collinearity factors excluded.
FactorsOCDlonSFTCLCDAGCLitterCBGCDEMSITTN
VIF5.67 6.41 5.42 2.32 1.26 3.65 2.66 6.38 2.56 3.63 1.96
Table 4. RDA results of plant diversity index and significant factors in Yellow River Delta.
FactorsRDA1RDA2R2p
OCD0.999 0.037 0.160 0.006 **
lon0.994 −0.109 0.091 0.077
SFT−0.877 0.480 0.116 0.034 *
CLCD0.905 0.425 0.105 0.047 *
AGC−0.999 −0.053 0.047 0.279
LitterC−0.860 −0.511 0.158 0.010 **
BGC−0.713 −0.701 0.062 0.152
DEM−0.972 0.235 0.247 0.001 ***
SI0.979 −0.206 0.279 0.001 ***
T−0.936 0.353 0.219 0.001 ***
TN−0.527 −0.850 0.108 0.045 *
* indicates p < 0.05; ** indicates p < 0.01; *** indicates p < 0.001.
Disclaimer/Publisher’s Note: The statements, opinions and data contained in all publications are solely those of the individual author(s) and contributor(s) and not of MDPI and/or the editor(s). MDPI and/or the editor(s) disclaim responsibility for any injury to people or property resulting from any ideas, methods, instructions or products referred to in the content.

