


The Interconnectivity and Spatio-Temporal Evolution of Rail Transit Network Based on Multi-Element Flows: A Case Study of Beijing-Tianjin-Hebei Urban Agglomeration, China


Abstract
1. Introduction
2. Literature Review
2.1. Rail Transit and Urban Spatial Networking
2.2. The Evaluation of Rail Transit Interconnectivity
3. Materials and Methods
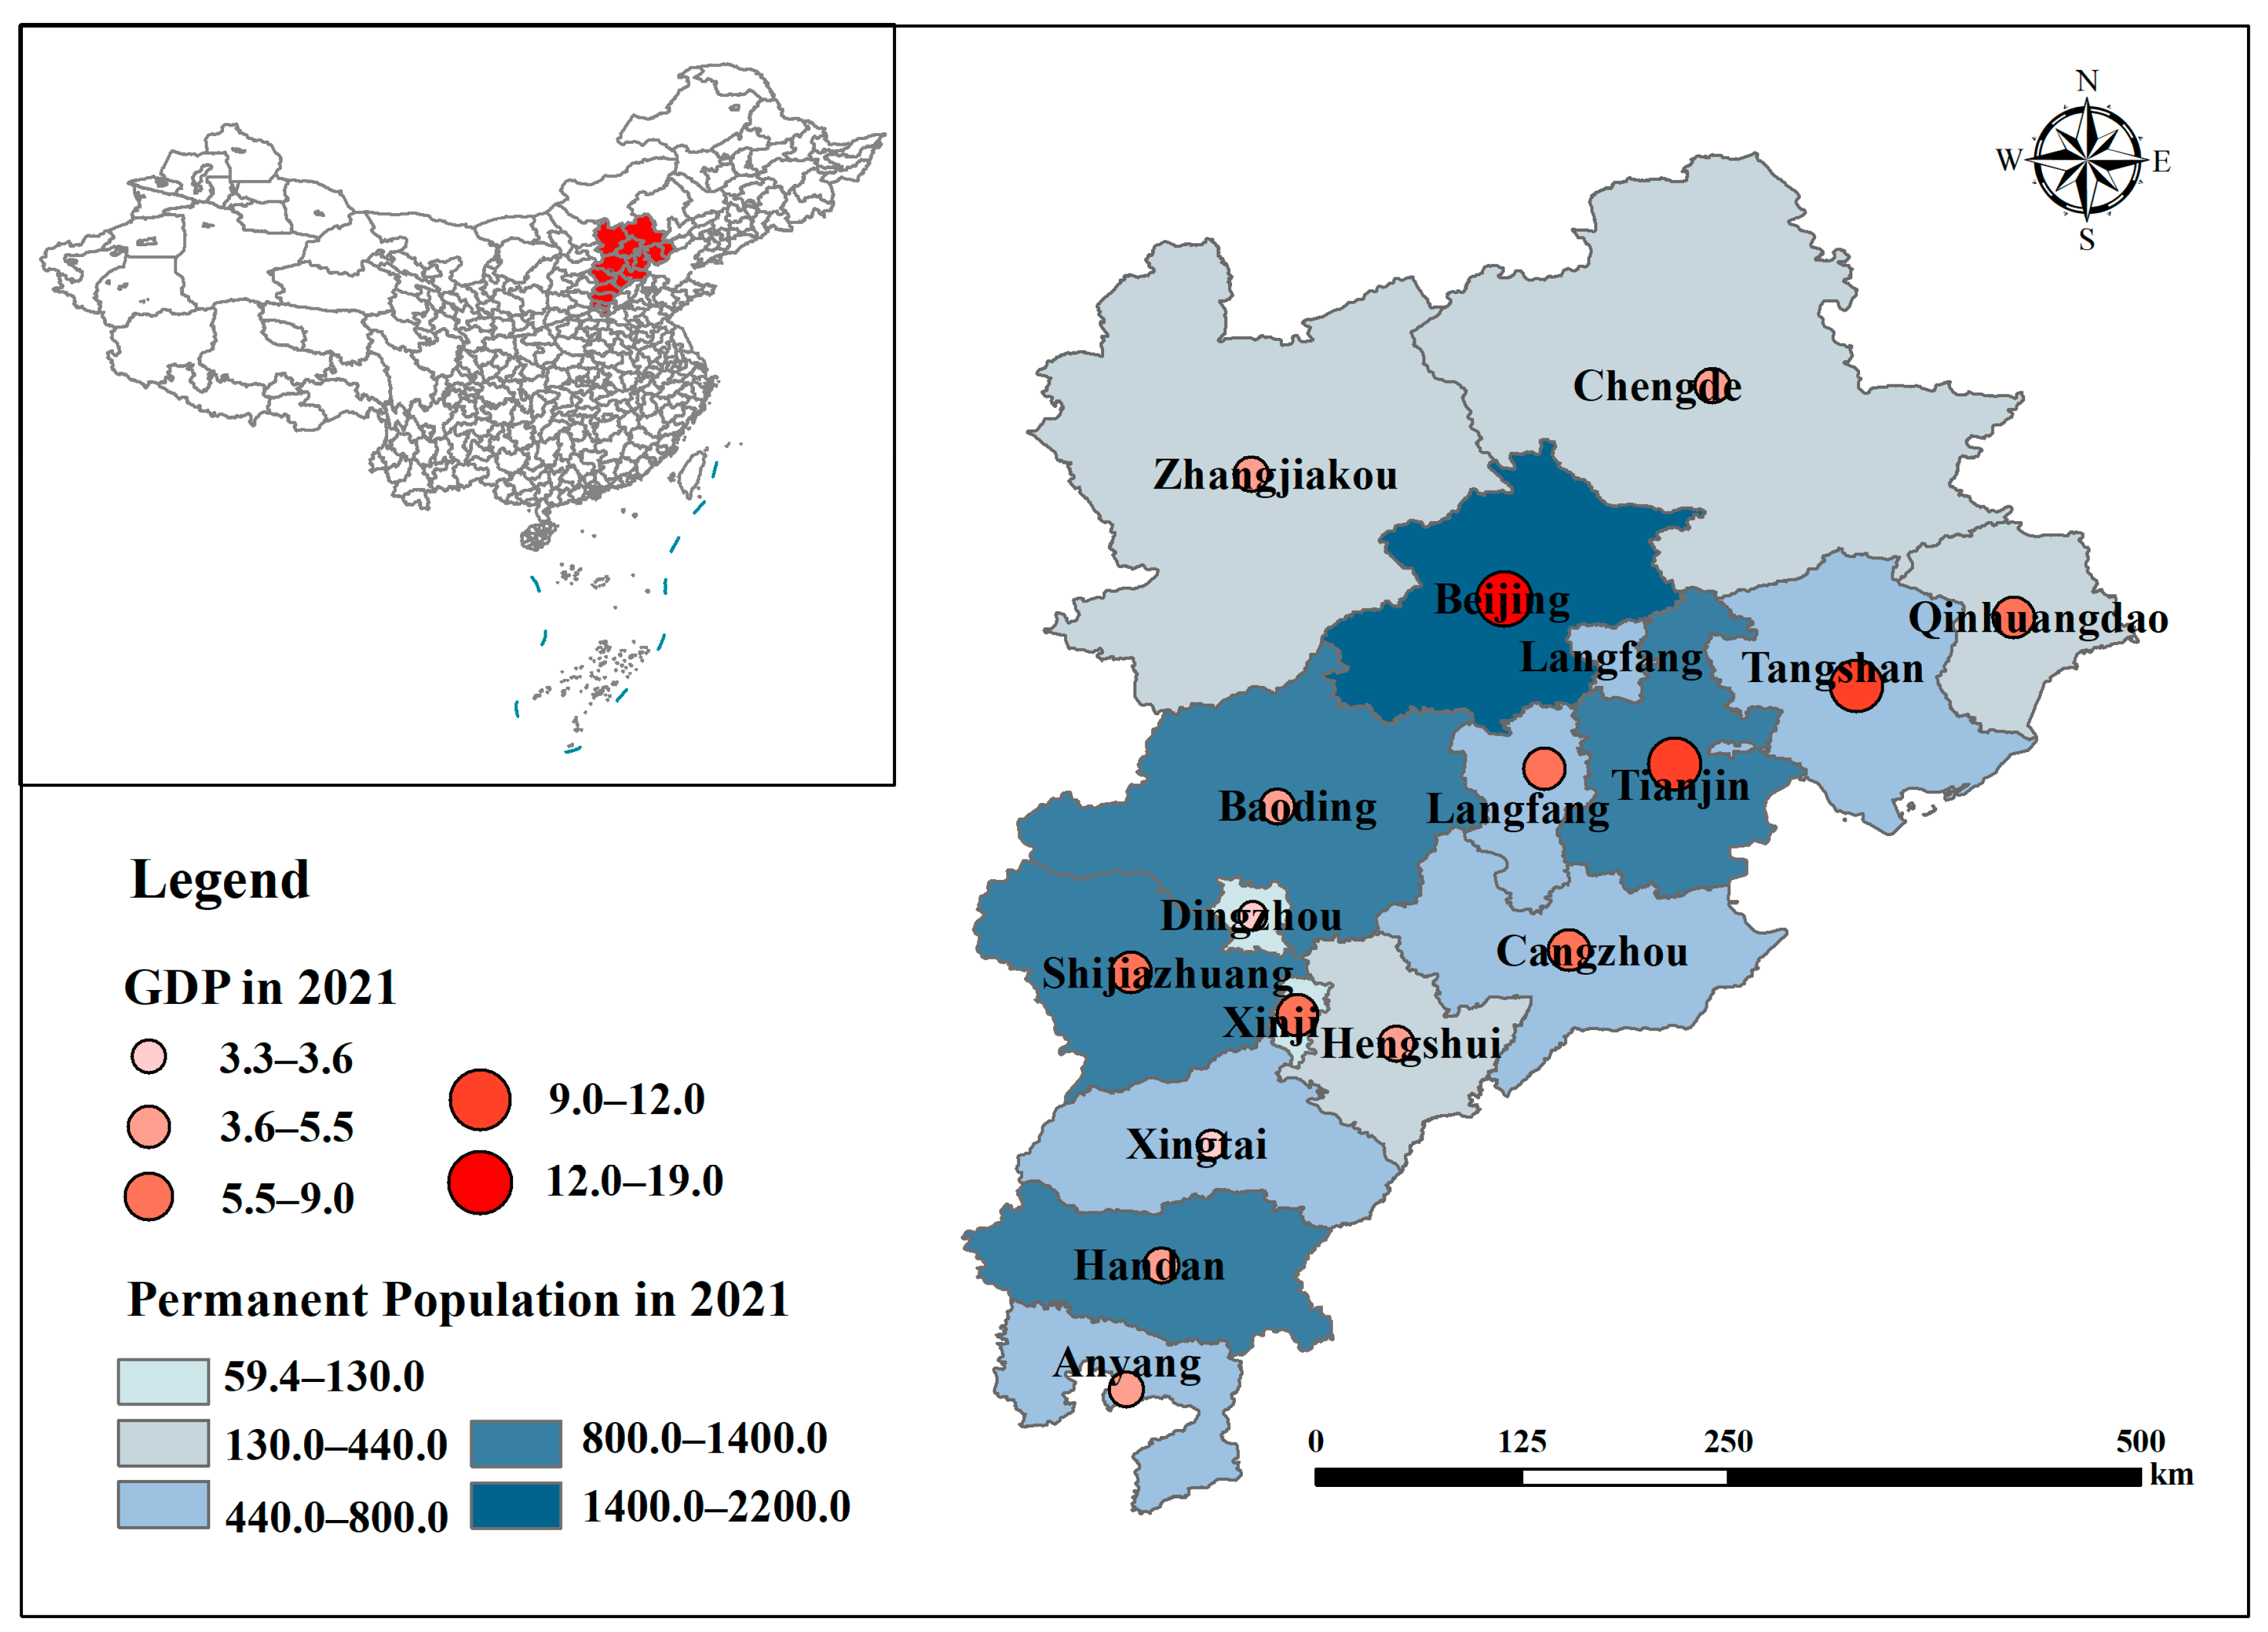
3.1. Study Area
3.2. Data Source
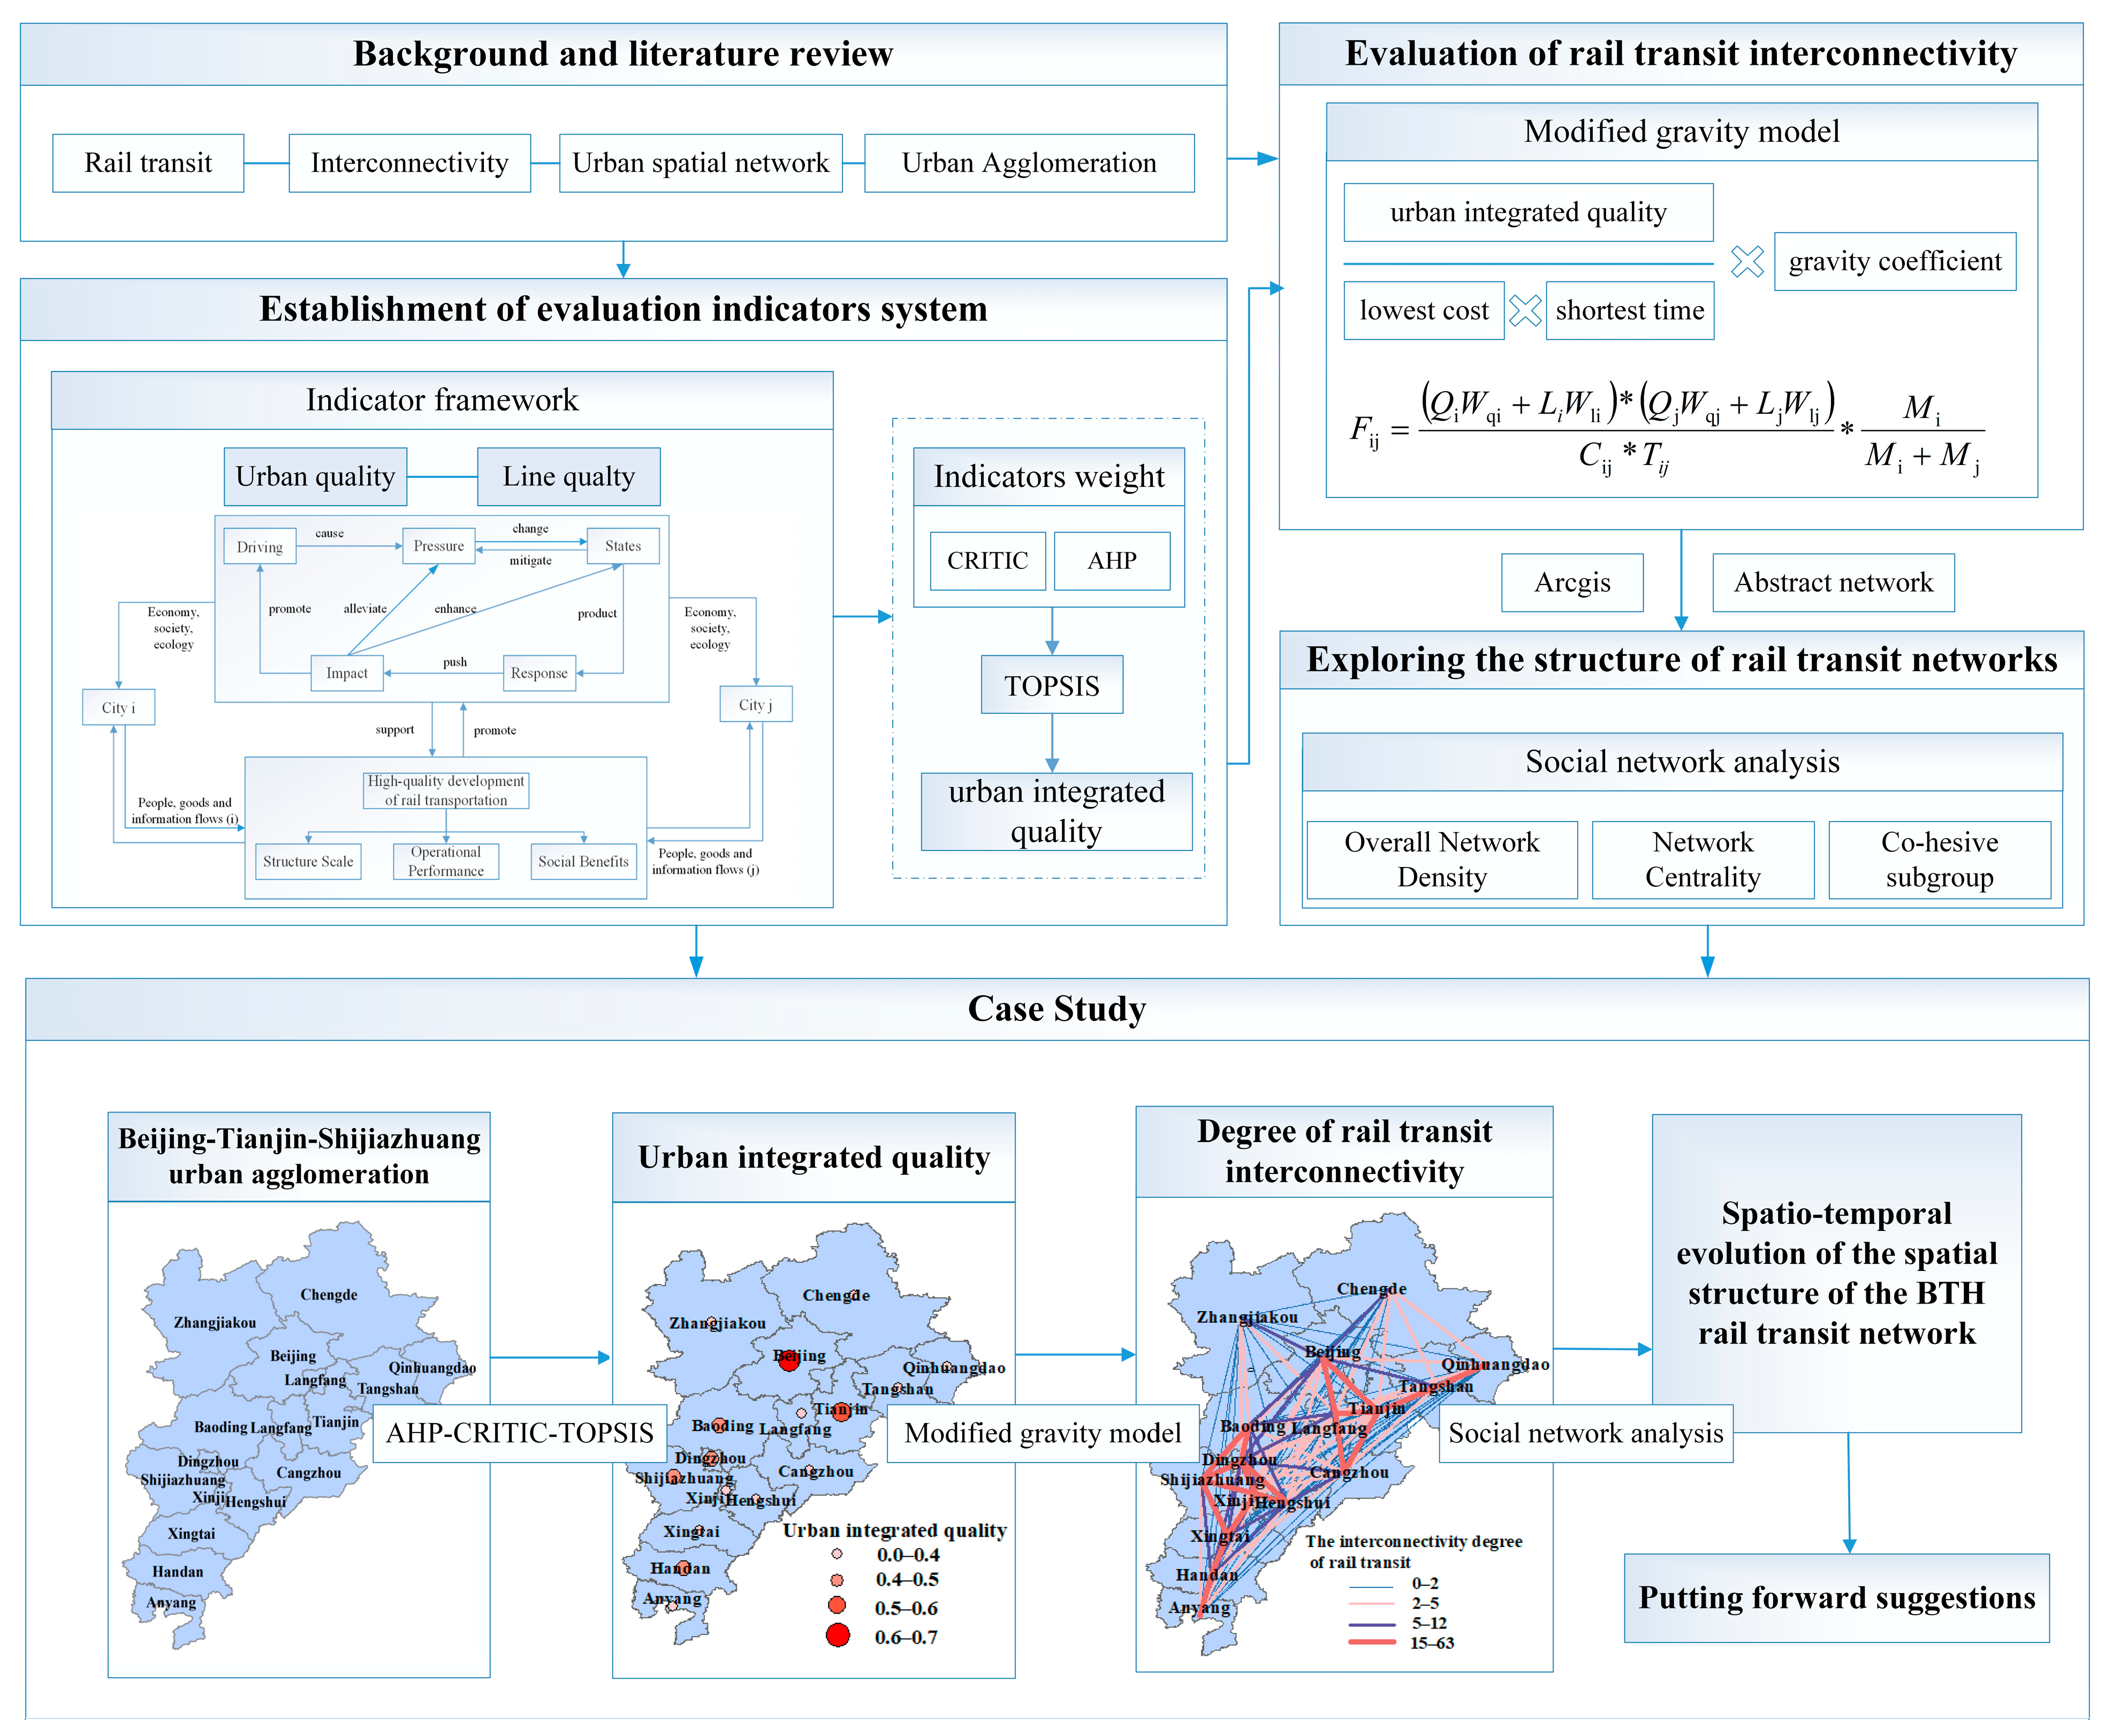
3.3. Research Framework
3.4. Establishment of Evaluation Indicator System
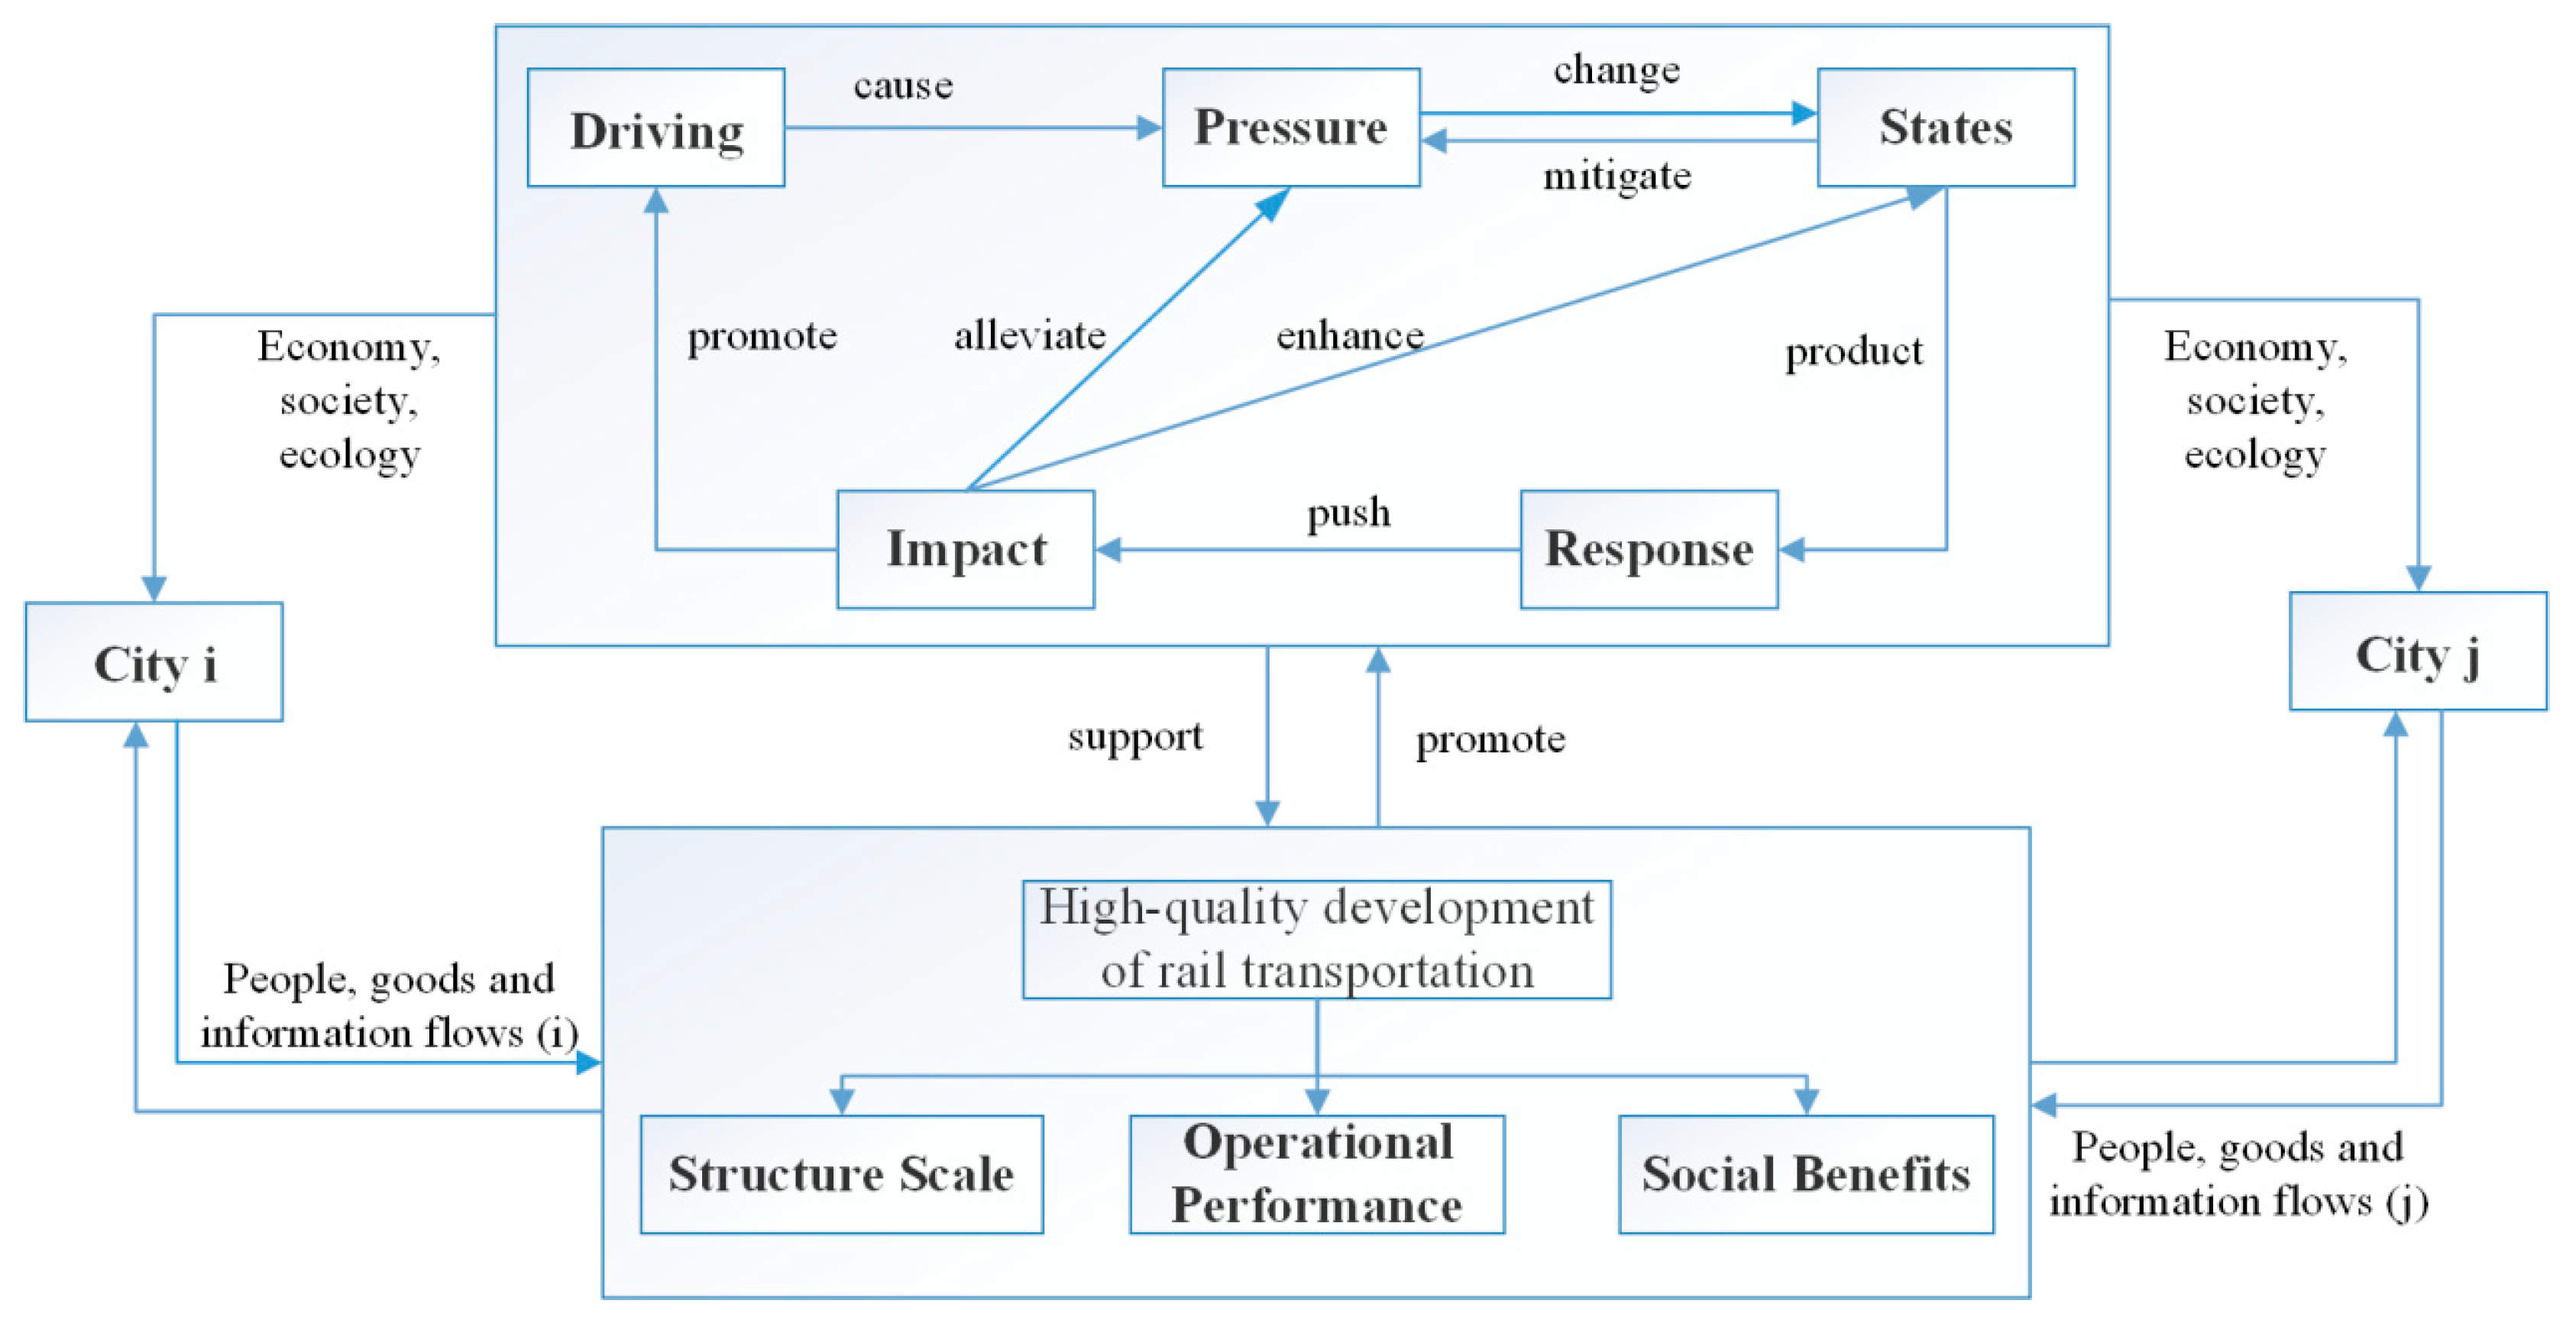
3.4.1. Indicator System Framework
3.4.2. Evaluation Indicator System Construction
- (1)
- The selection of urban quality indicators
- (2)
- The selection of line quality indicators

| Aspect | Dimension | Indicators | Supporting References | AHP Weights | CRITIC Weights | Indicator Weights |
|---|---|---|---|---|---|---|
| Driving | Economic Driving | GDP per capita | Wang et al. (2022) [20] | 9.01 | 4.79 | 6.90 |
| Social Driving | Urbanization rate | Mu et al. (2022) [41] | 13.28 | 6.60 | 9.94 | |
| Ecology Driving | Energy saving and environmental protection budget expenditure | Chen et al. (2021) [42] | 3.55 | 4.09 | 3.82 | |
| Pressure | Economic Pressure | GDP growth year-on-year | Liu et al. (2020) [43] | 3.51 | 8.73 | 6.12 |
| Social Pressure | Population Density | Zhao et al. (2021) [36] | 4.32 | 7.72 | 6.02 | |
| Ecology Pressure | Energy consumption per unit of GDP growth rate | Li et al. (2020) [44] | 7.32 | 5.42 | 6.37 | |
| States | Economic States | Disposable income per capita | Chen and Whalley (2012) [3] | 3.25 | 4.56 | 3.91 |
| Social States | Road area per capita | Sun et al. (2016) [45] | 2.60 | 9.37 | 5.99 | |
| Ecology States | Carbon emissions per capita | Lugaric and Krajcar(2016) [46] | 11.00 | 7.12 | 9.06 | |
| Impact | Economic Impact | Share of tertiary industry | Chan et al. (2002) [47] | 5.89 | 5.56 | 5.73 |
| Social Impact | Average noise value of transportation arteries | Peng et al. (2021) [48] | 3.08 | 8.50 | 5.79 | |
| Ecology Impact | Average annual concentration of PM2.5 | Qiu et al. (2020) [49] | 4.74 | 7.21 | 5.98 | |
| Response | Economic Response | Share of science and technology expenditure | Handy and Susan (2005) [50] | 8.97 | 6.02 | 7.50 |
| Social Response | Number of employed persons in the transportation industry | Zhang et al. (2019) [51] | 9.43 | 6.50 | 7.97 | |
| Ecology Response | Urban greening coverage rate | Tirachini et al. (2013) [52] | 10.05 | 7.82 | 8.94 |
| Aspect | Dimension | Indicators | Supporting References | AHP Weights | CRITIC Weights | Combined Weights |
|---|---|---|---|---|---|---|
| High-quality development of rail transit | Structure Scale | Number of lines | Chen et al. (2014) [53] | 15.18 | 11.43 | 13.31 |
| Line density | Sekar et al. (2016) [54] | 19.23 | 11.64 | 15.44 | ||
| Number of connected cities | Experts’ suggestion | 15.02 | 11.43 | 13.23 | ||
| Operational Performance | Total passenger transportation | Pan et al. (2017) [21] | 9.29 | 9.40 | 9.34 | |
| Cargo turnover | Gao et al. (2020) [55] | 8.26 | 11.17 | 9.72 | ||
| Operating mileage | Hu et al. (2017) [56] | 10.13 | 10.16 | 10.14 | ||
| Social Benefits | Rate of growth in passenger numbers | Chalumuri et al. (2017) [57] | 7.40 | 18.86 | 13.13 | |
| Smart payment system utilization rate | Experts’ suggestion | 15.49 | 15.91 | 15.70 |
3.4.3. Indicators Weight
3.4.4. Calculation of the Values of Urban Quality and Line Quality
3.5. Evaluation of the Interconnectivity Degree of Rail Transits
3.6. Exploration of the Spatial Structure of the Rail Transit Network
3.6.1. Overall Network Density
3.6.2. Network Centrality
3.6.3. Cohesive Subgroup
4. Results and Analysis
4.1. Node Cities Characteristics within BTHRTN
4.2. Interconnectivity Degree of BTHRTN
- (1)
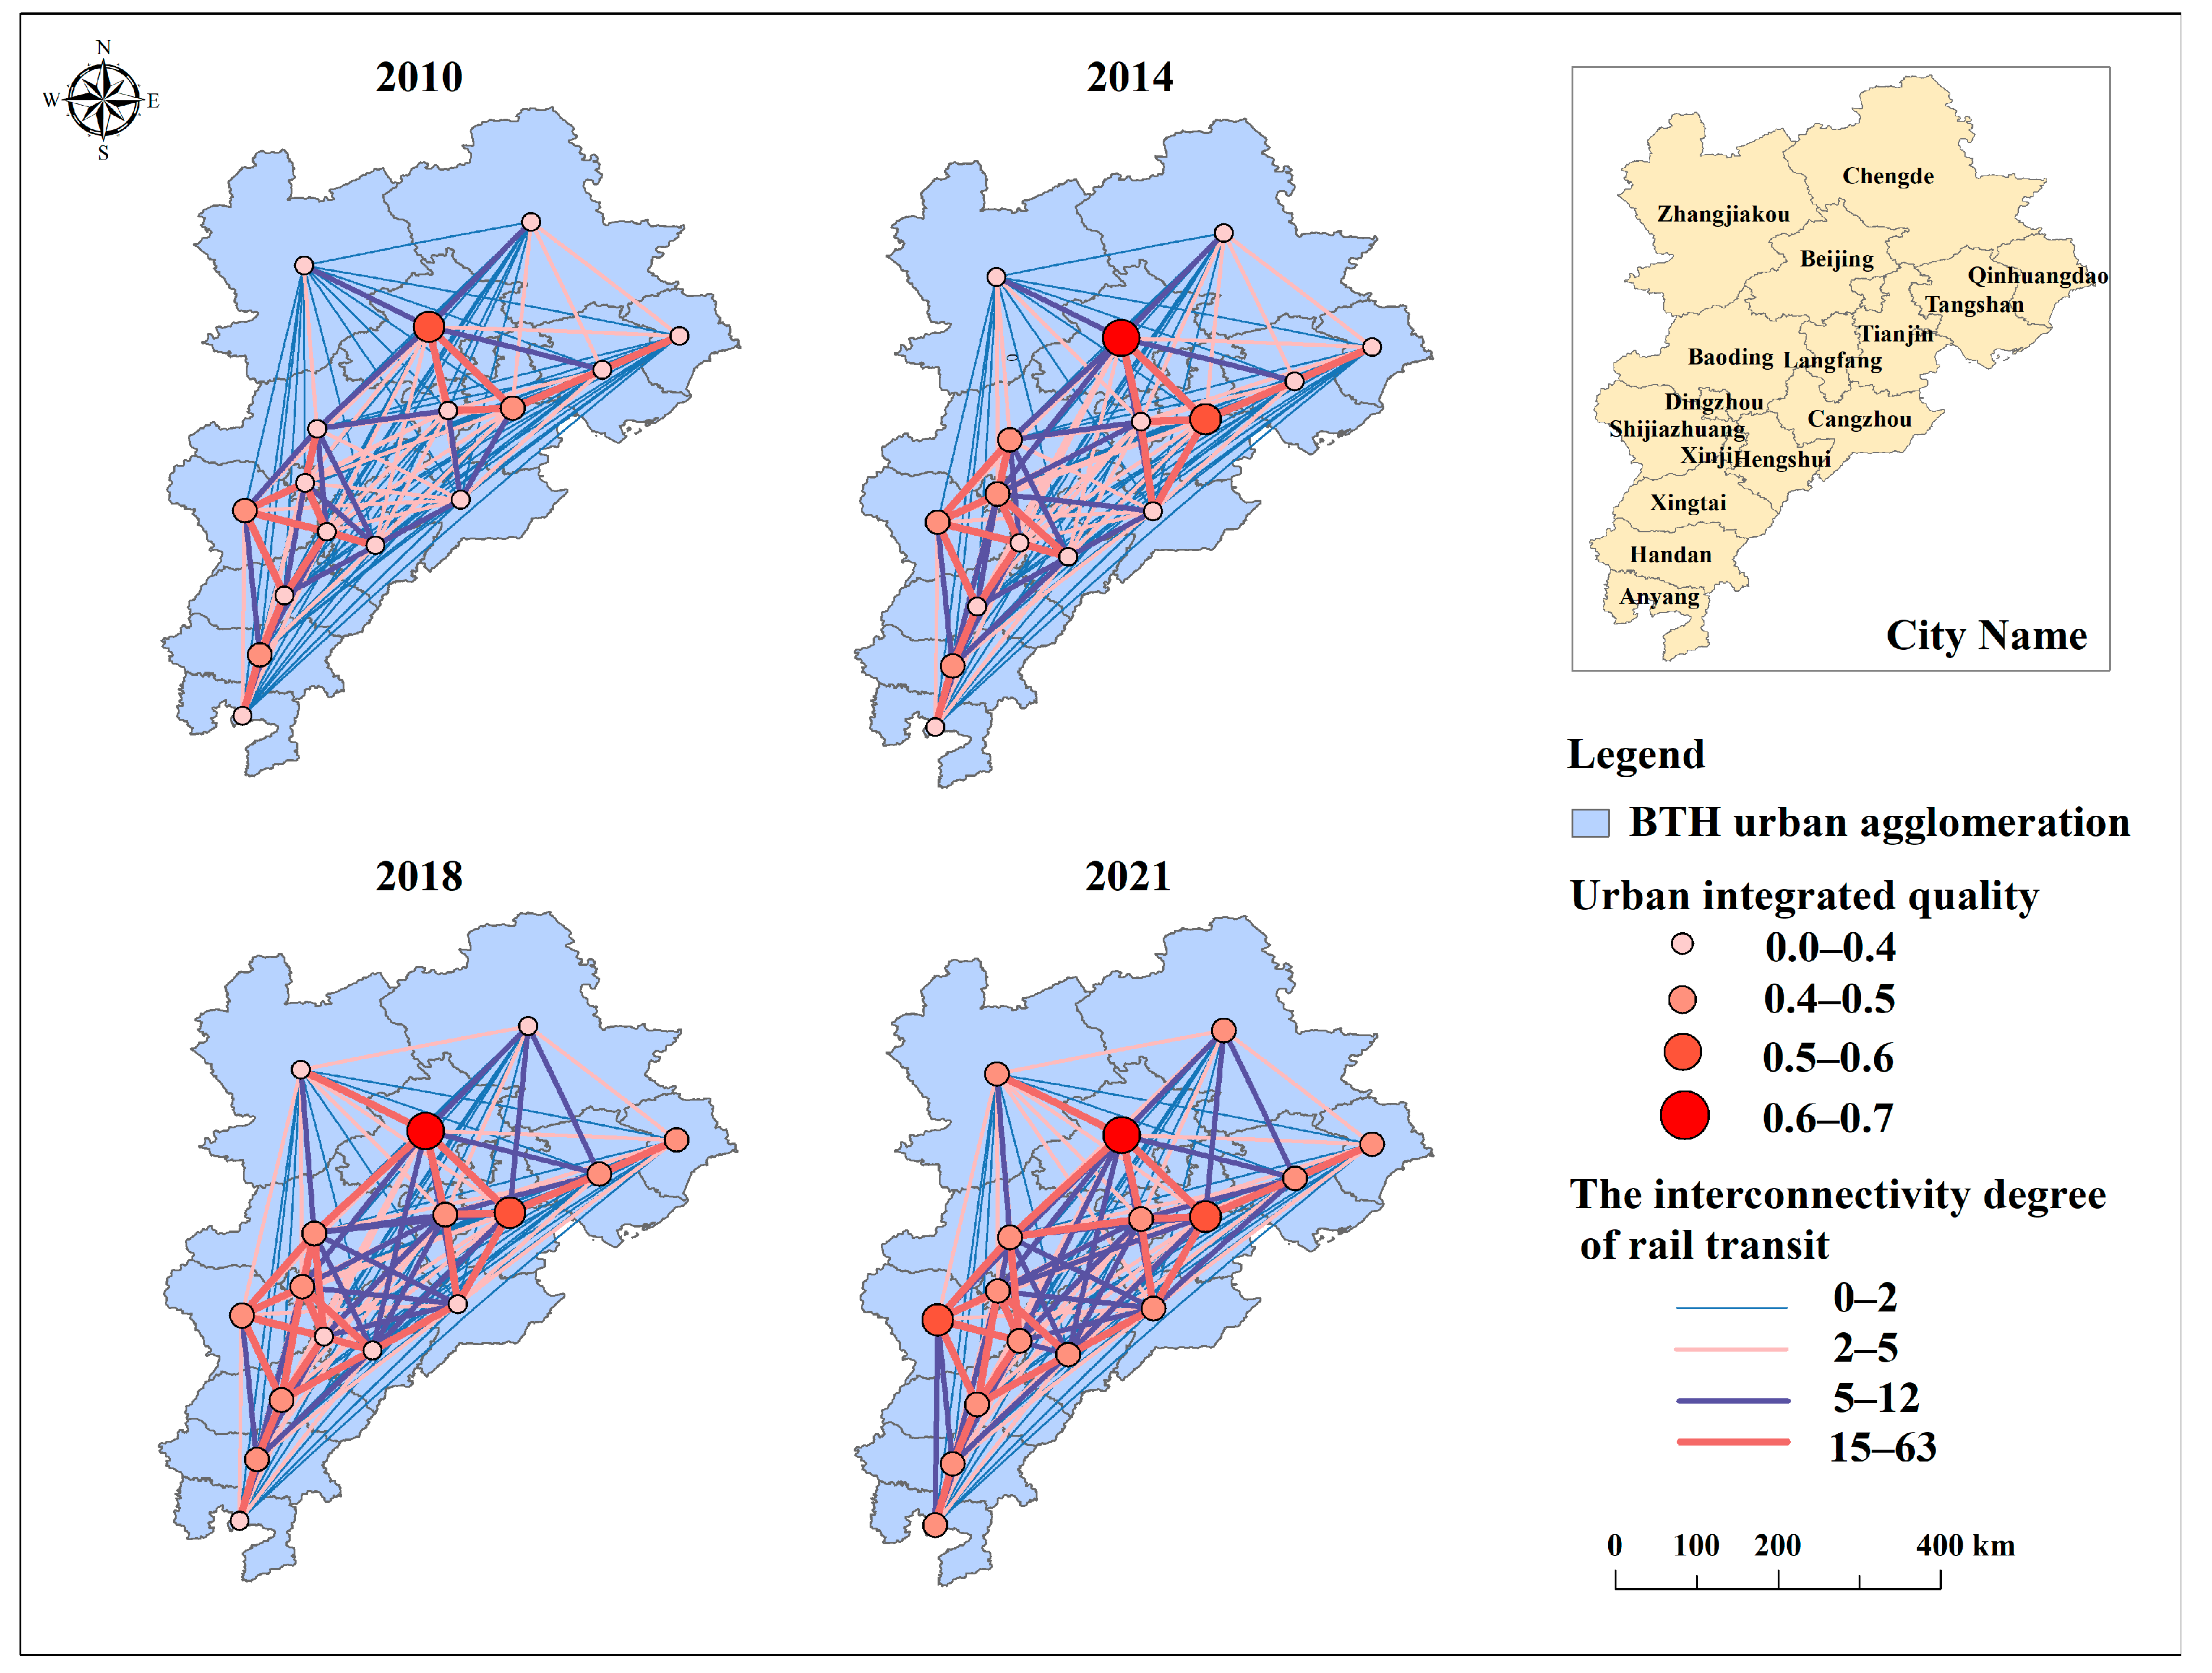
- Between 2010 and 2021, the interconnectivity degree of the BTHRTN displays an uneven pattern characterized by spatial polarization. Figure 4 depicts significant regional discrepancies in the interconnectivity degree within the BTHRTN. Development imbalance continues among Beijing, Tianjin, Shijiazhuang, and other non-core cities, indicating a spatial pattern of “three cores and weak overall” in the BTH urban agglomeration. Using 2021 as an example and referring to Table 4, Beijing occupies an absolute core position in the BTH urban agglomeration. Its mean interconnectivity degree is twice the overall average degree of the BTH agglomeration and 19 times higher than Zhangjiakou, the city with the lowest degree. It is apparent from Figure 5 that the high interconnectivity degrees exist between cities with high urban integrated quality and their neighboring cities. Cities with lower urban integrated quality, such as Zhangjiakou, Chengde, Qinhuangdao, and Hengshui, fail to make strong connections with cities beyond the core cities. Consequently, in the evolution of interconnectivity within the BTHRTN, a small number of node cities bear the majority of the transmission pressure.
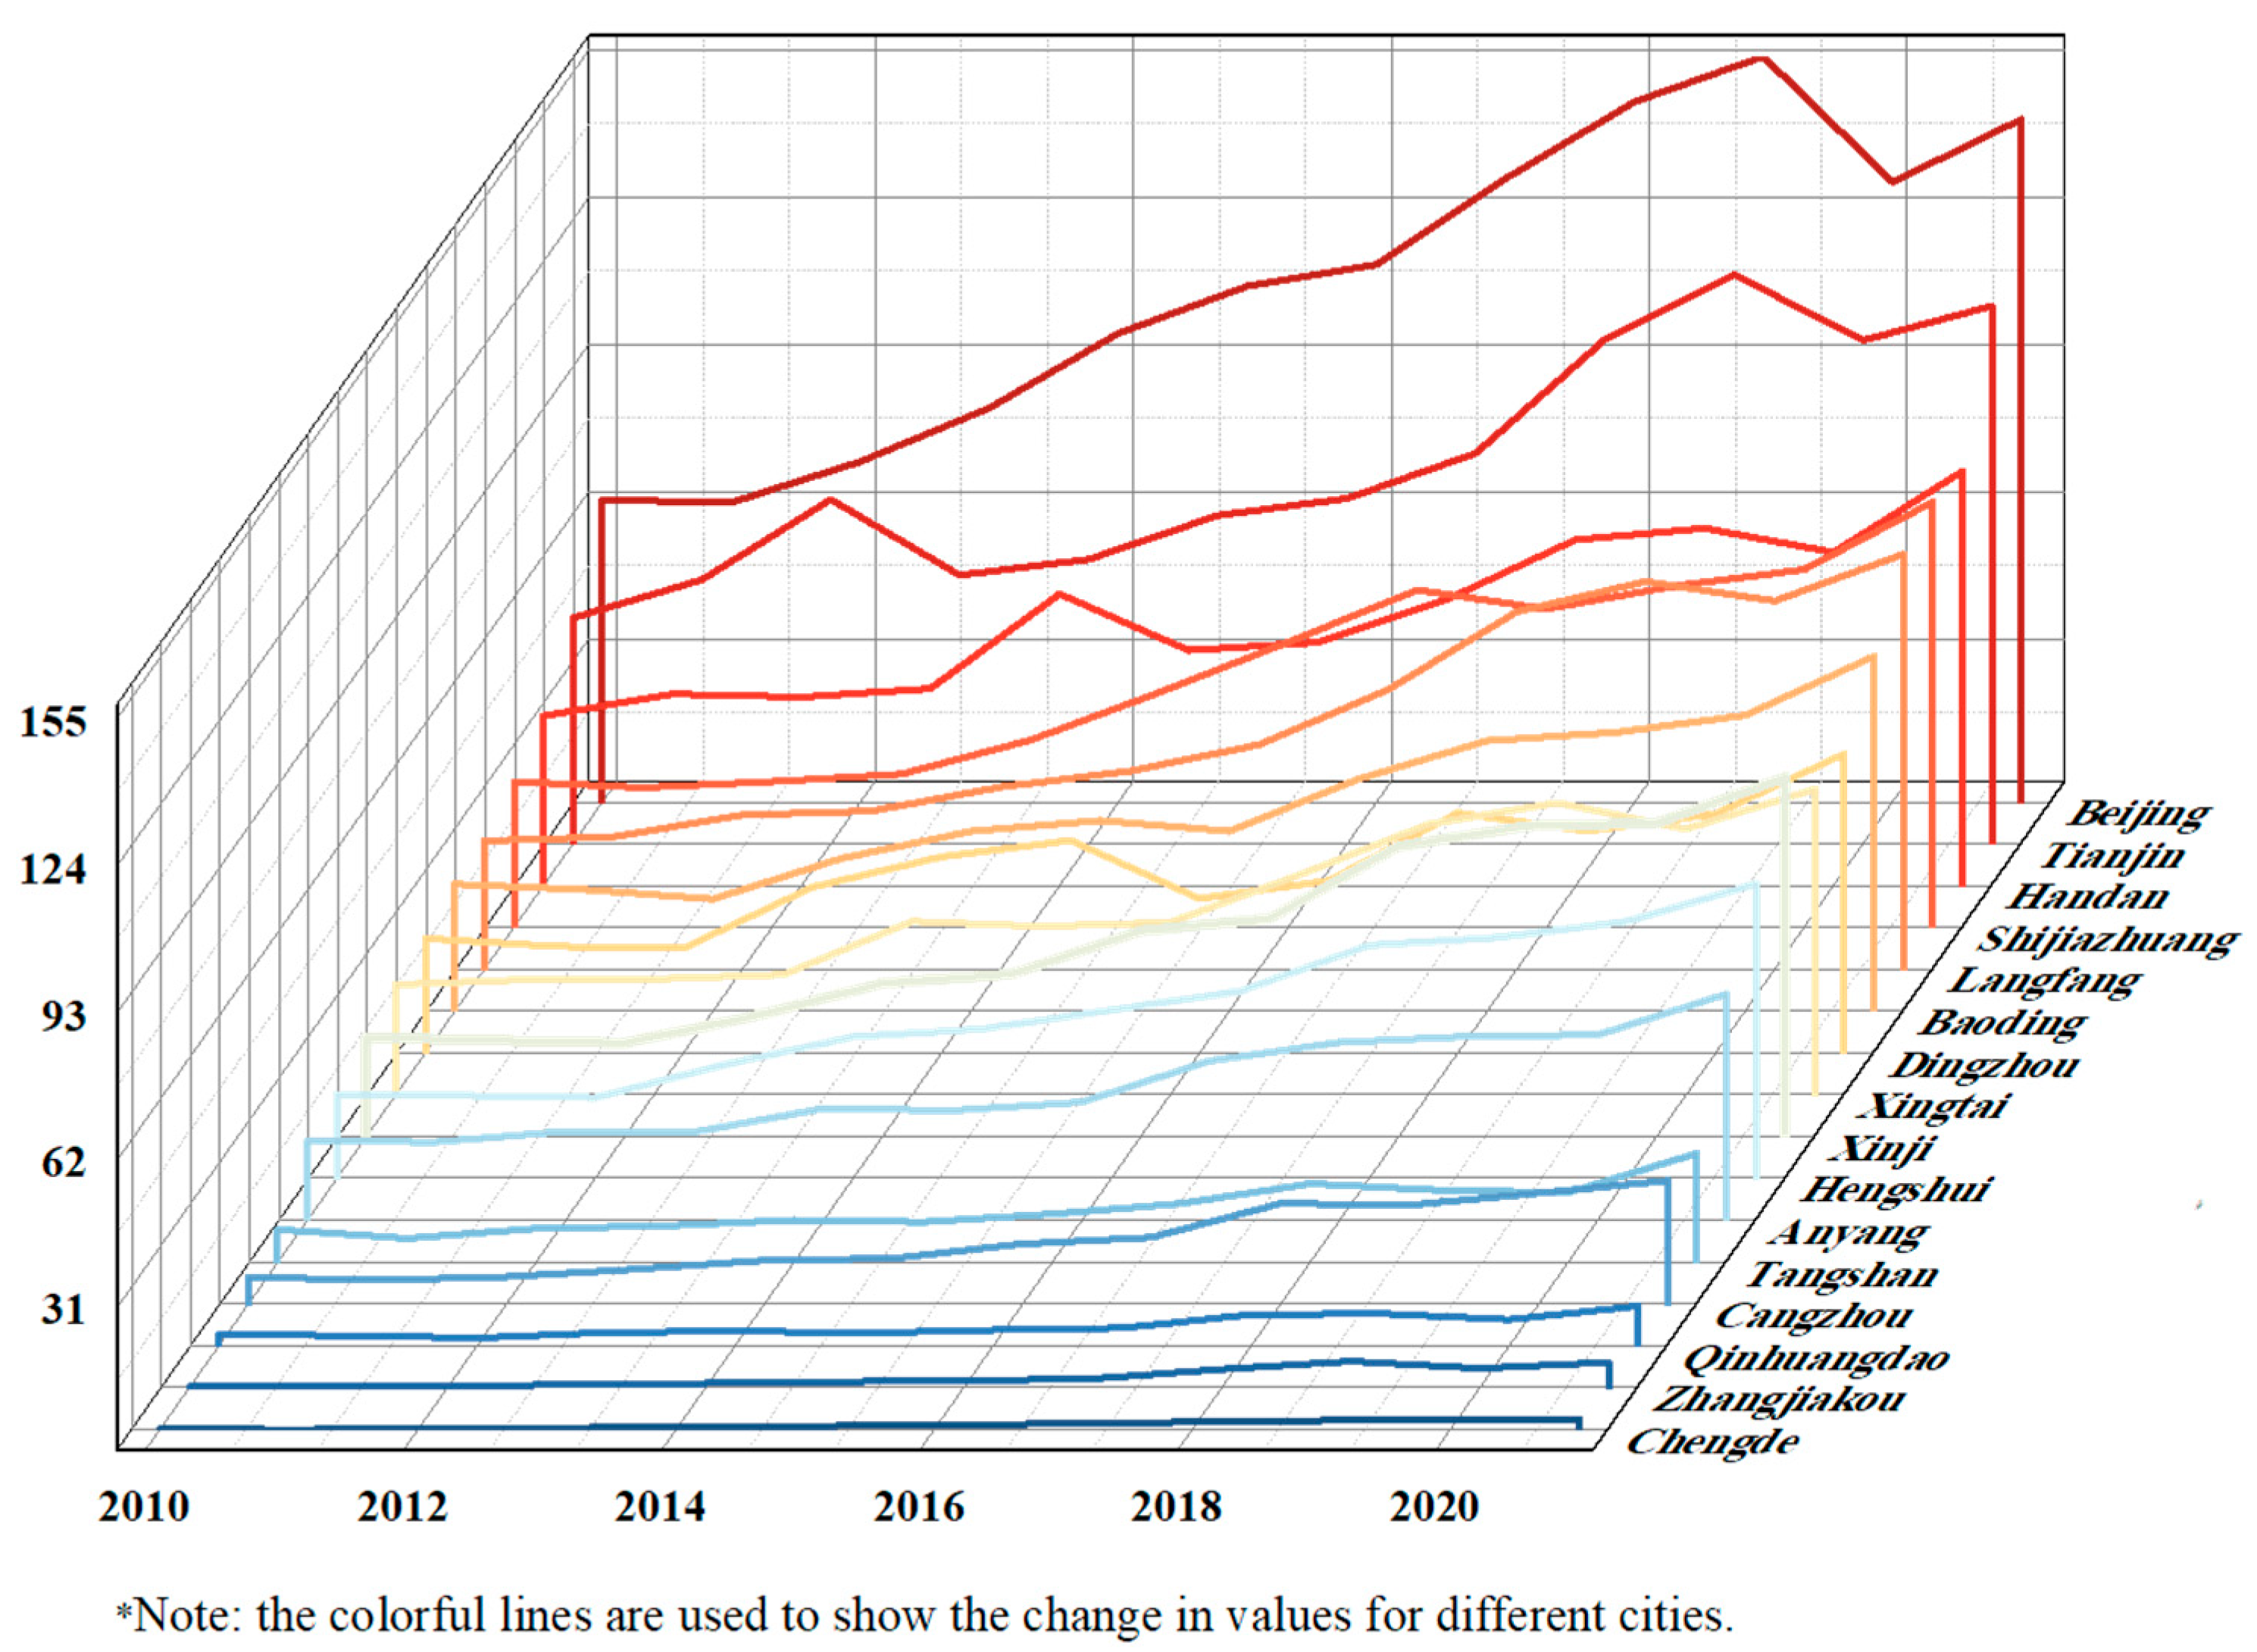
- (2)
- Since 2010, the overall interconnectivity degree of the BTHRTN has been increasing, and the growth rates of individual cities are coordinated. Figure 4 provides detailed data on the total values of interconnectivity degree within the BTHRTN over the study period. In the temporal perspective, the overall degree in 2010 is 1.7 times higher than that in 2021, which demonstrates that the interconnectivity degree of the BTHRTN has significantly improved. The five years 2014, 2017, 2018, and 2021 are the fastest growing years with a high growth of 15%. This phenomenon is similar to the evolution of urban integrated quality, which indicates the coordinated development between rail transit and cities. In the spatial perspective, 12 cities have a year-on-year growth rate higher than the average degree of the BTH urban agglomeration. This indicates that the improvement in interconnectivity degree among most cities in the BTH urban agglomeration is a result of collaborative efforts. Beyond that, as shown in Figure 4, all 16 cities experienced varying degrees of fluctuations from 2010 to 2021. Langfang and Chengde are the two cities with the least fluctuations and low interconnectivity degree.
- (3)
- As of 2021, the foundational spatial structure of the “BTH on the track” has consolidated, with Beijing, Tianjin, and Shijiazhuang functioning as the three core hubs. Figure 5 illustrates the establishment of a rail transit interconnectivity network around these core cities throughout the study period. The changes in node size and line thickness in Figure 5 depict the central role of Beijing, Tianjin, and Shijiazhuang, radiating outward and fostering the interconnectivity of neighboring cities. The interconnectivity degree of Beijing, Zhangjiakou, Chengde, and Tangshan has significantly improved. Likewise, the southern region, centered around Shijiazhuang, has consistently improved in interconnectivity, a change more pronounced than in the region with Beijing and Tianjin at its cores. This change emphasizes the marginal influence of rail transit conduction. The most intriguing aspect in Figure 5 is the relationship between the advancement of rail transit interconnectivity and the integrated quality of urban areas. When examined in conjunction with the results in Section 4.1, it becomes clear that the advancement in urban integrated quality and the augmentation of rail transit interconnectivity mutually reinforce each other. Essentially, the BTH urban agglomeration exemplifies a pattern of integrated development. This phenomenon emphasizes the importance of researching the coordinated development between transportation and cities, suggesting a fertile area for further exploration.
4.3. Spatial Structure Evolution of BTHRTN
4.3.1. Centrality Analysis
4.3.2. Centrality Analysis
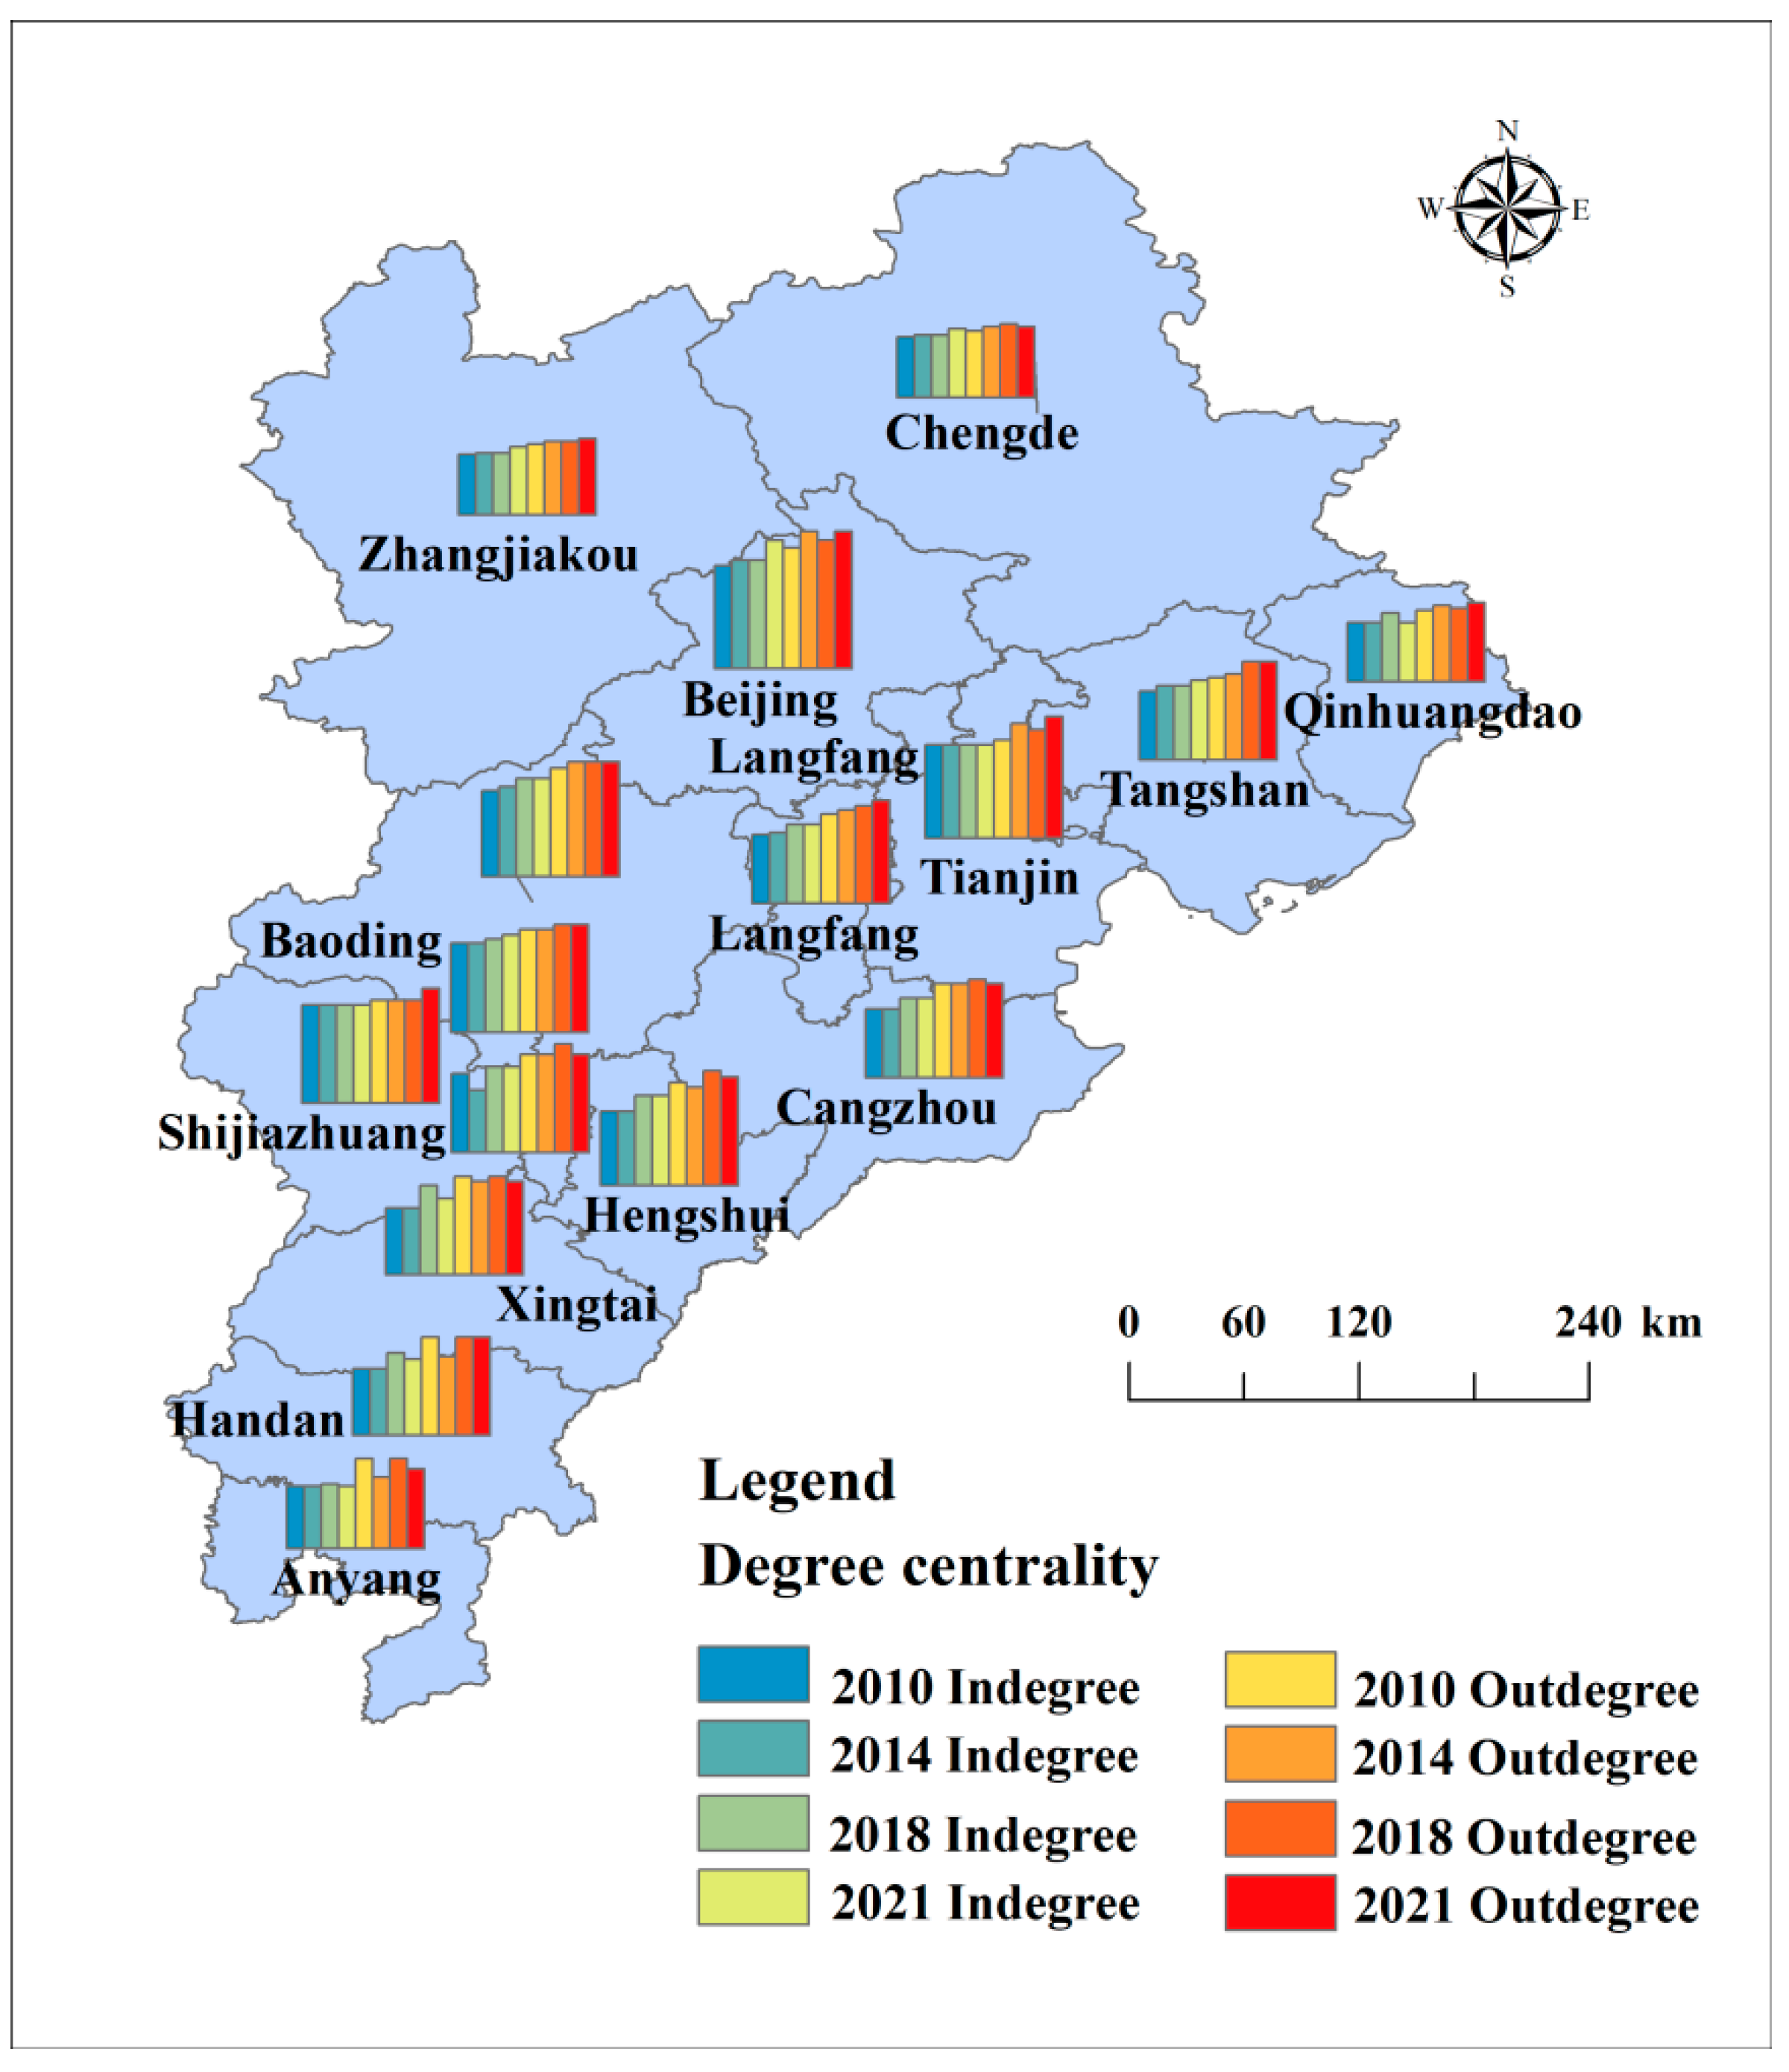
- (1)
- Degree centrality
- (2)
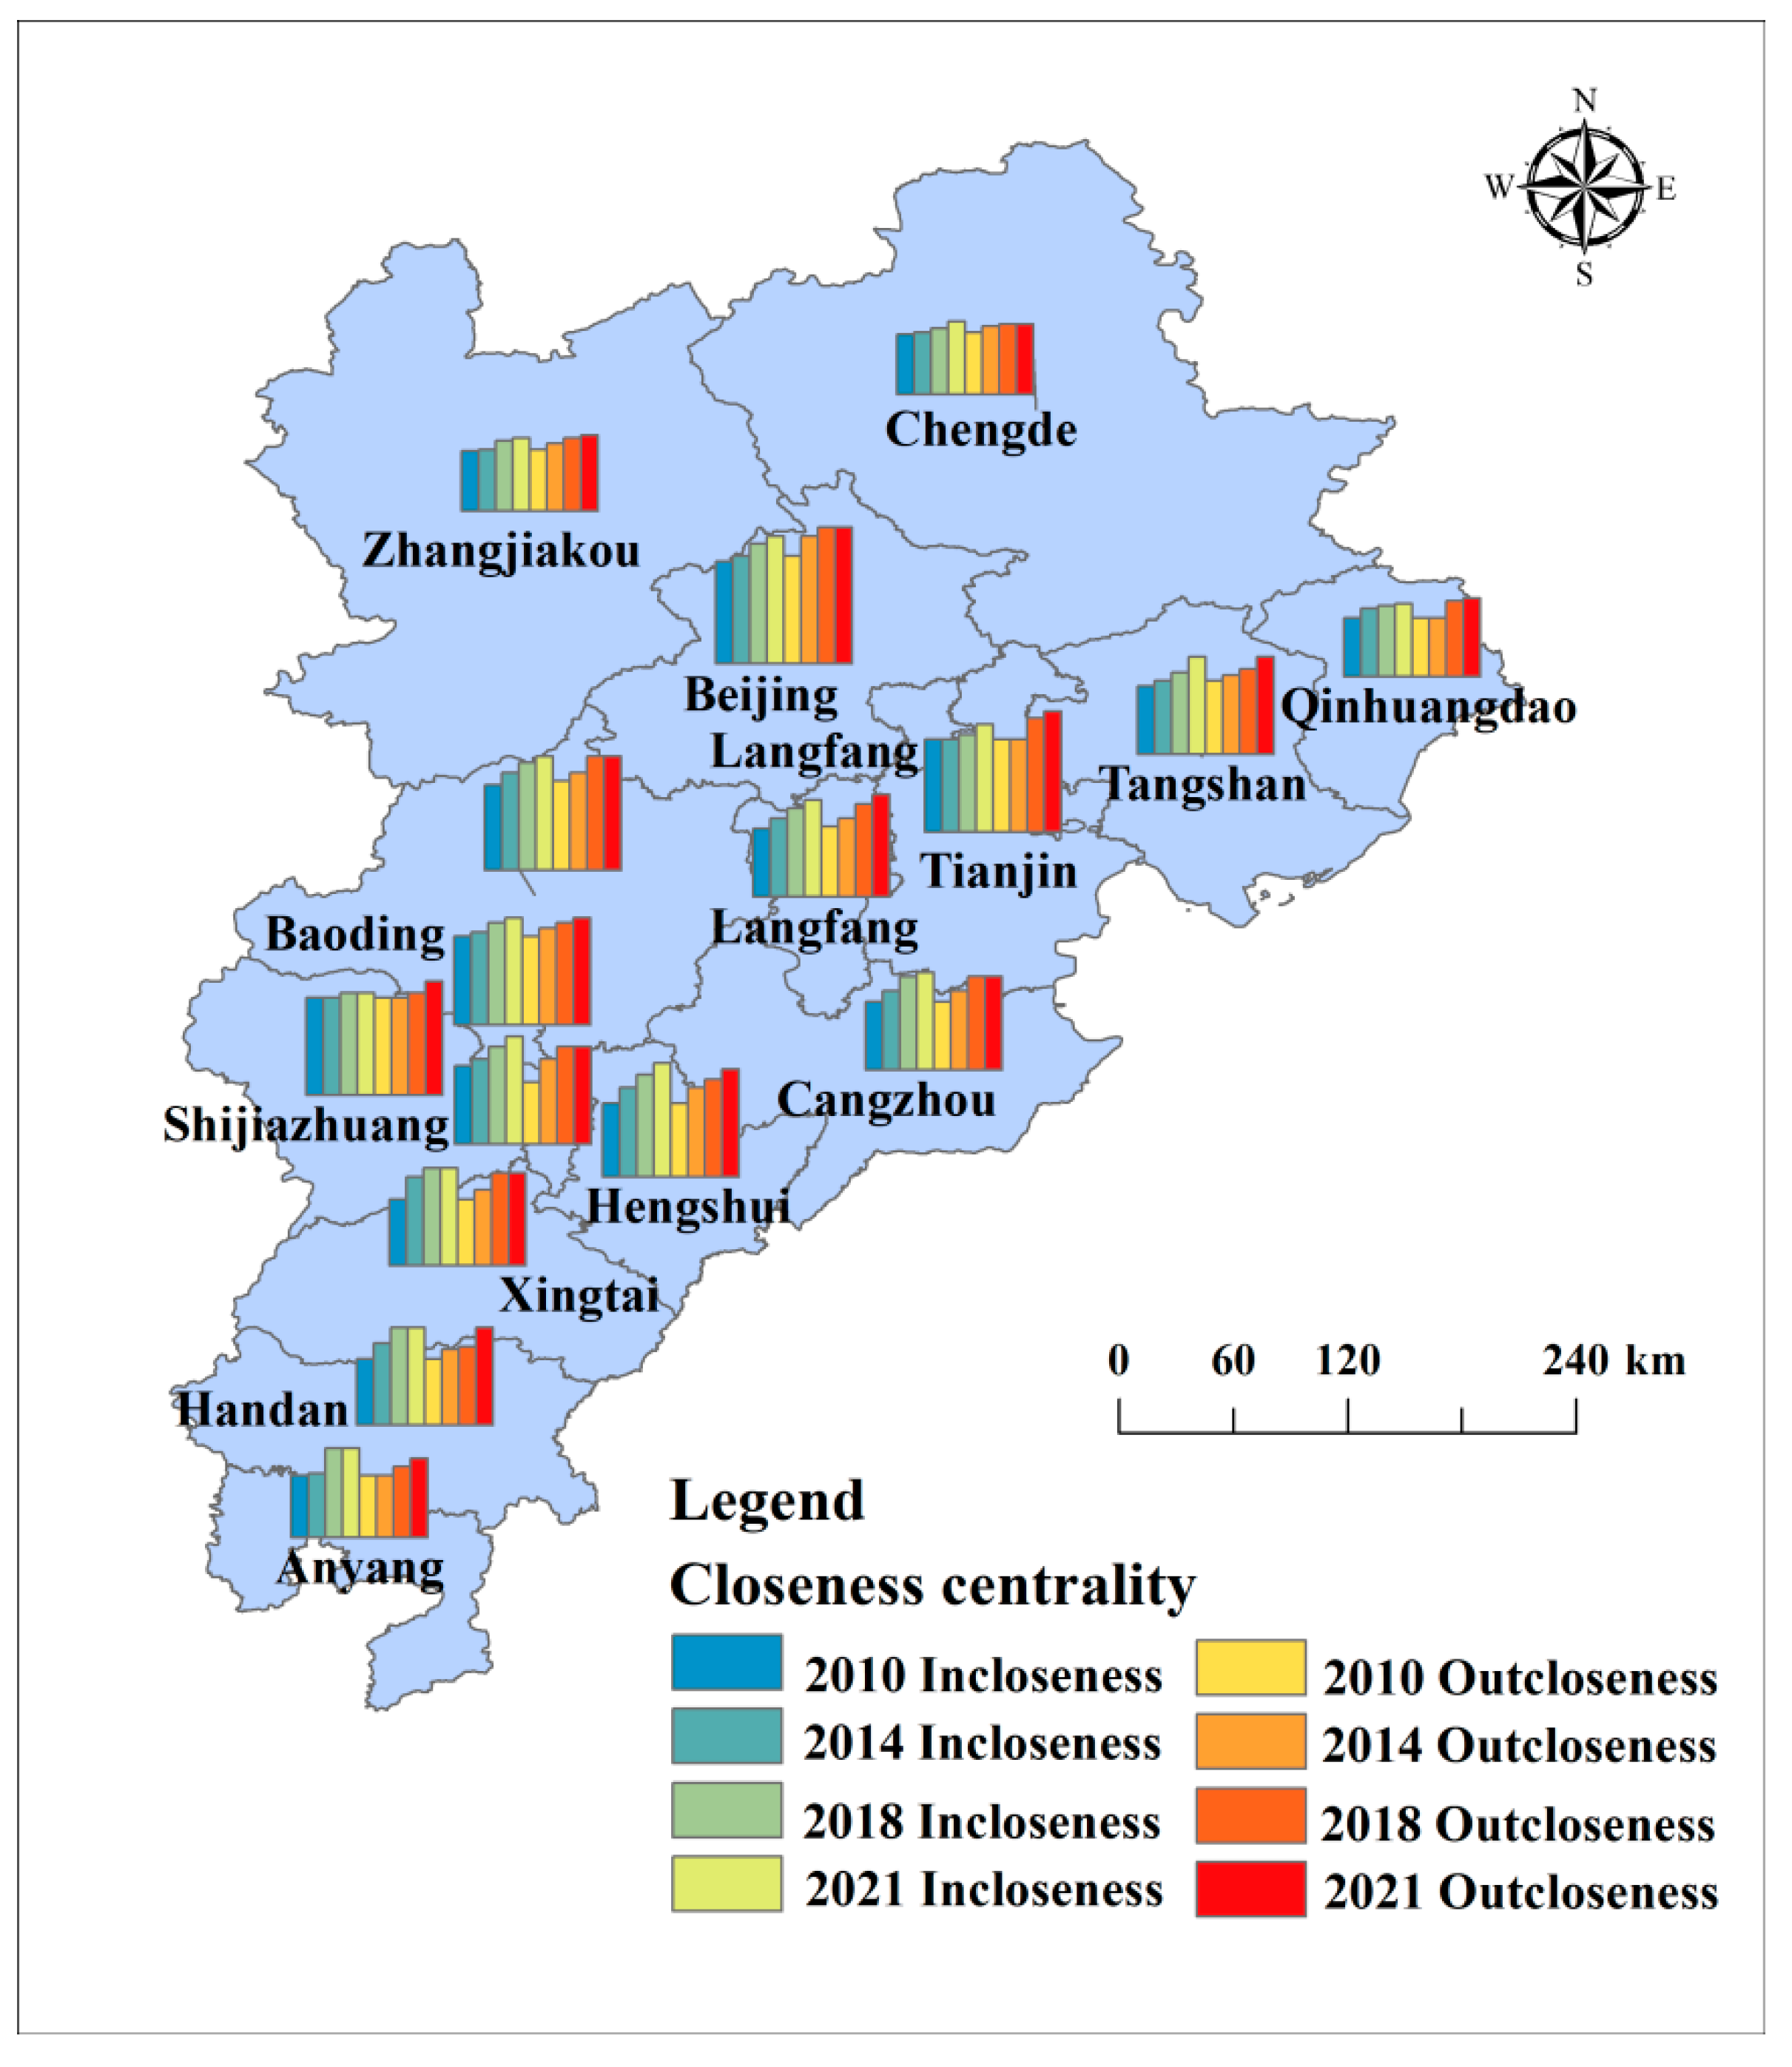
- Closeness centrality
- (3)
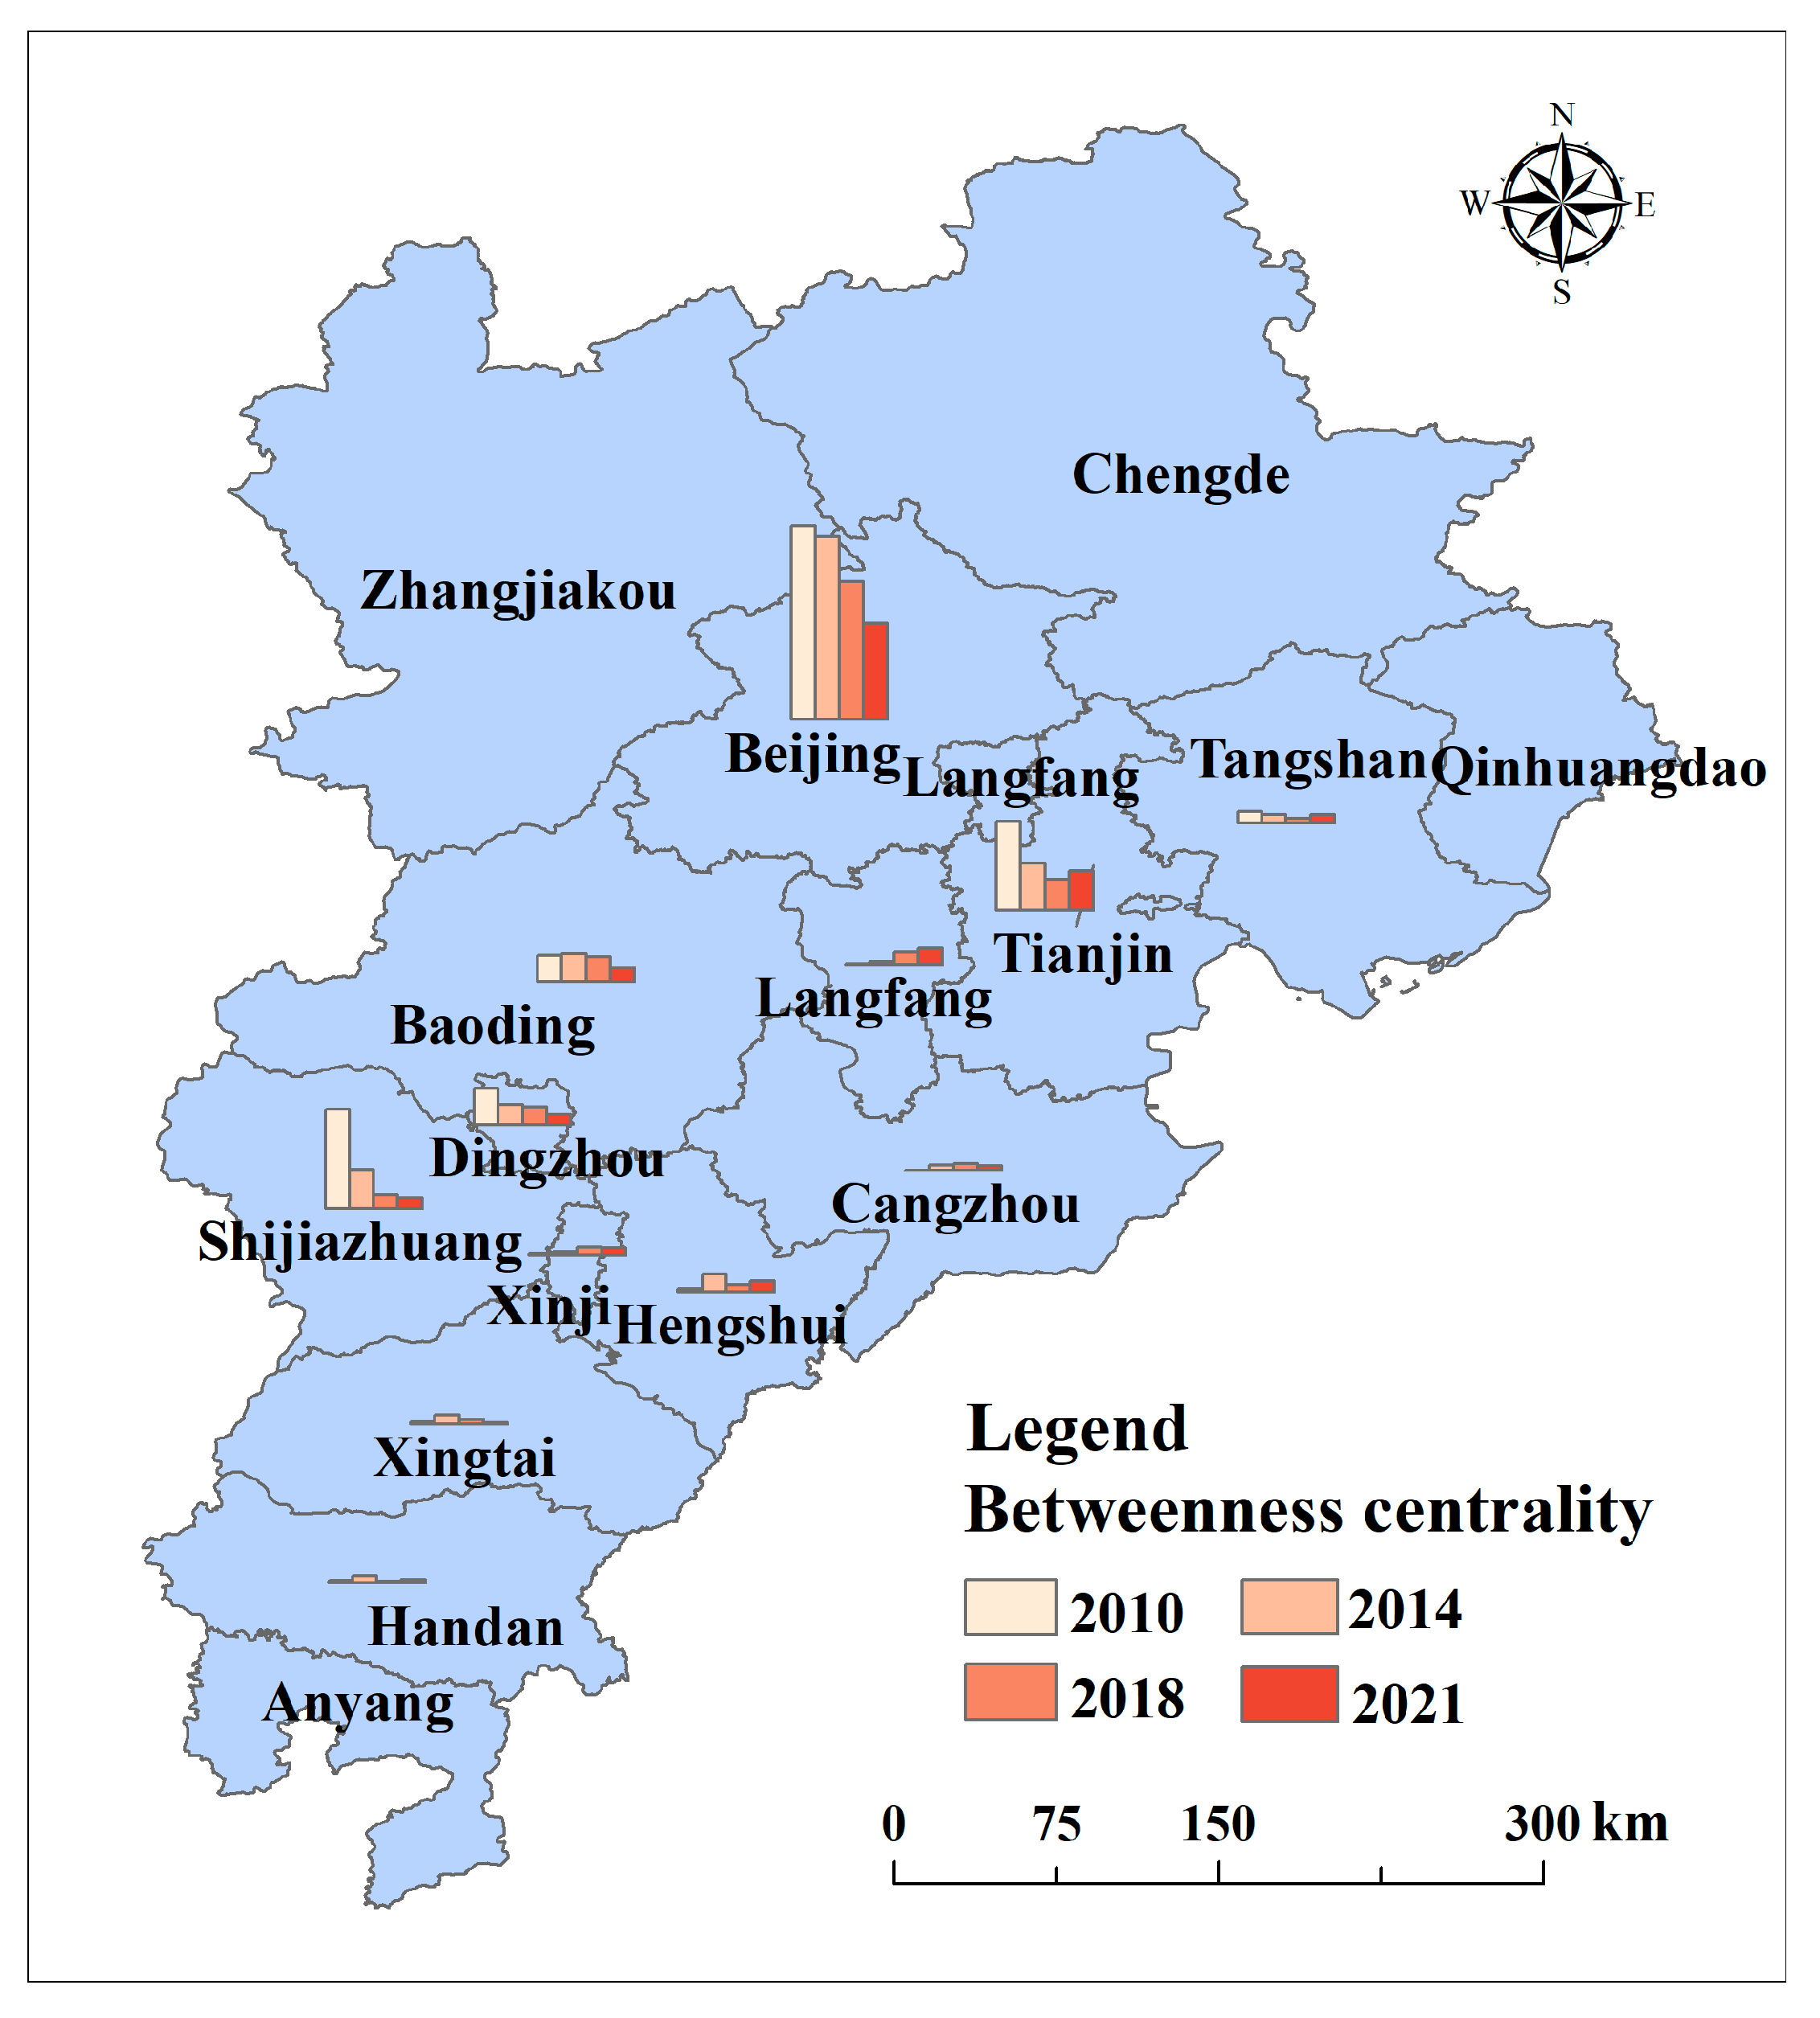
- Betweenness centrality
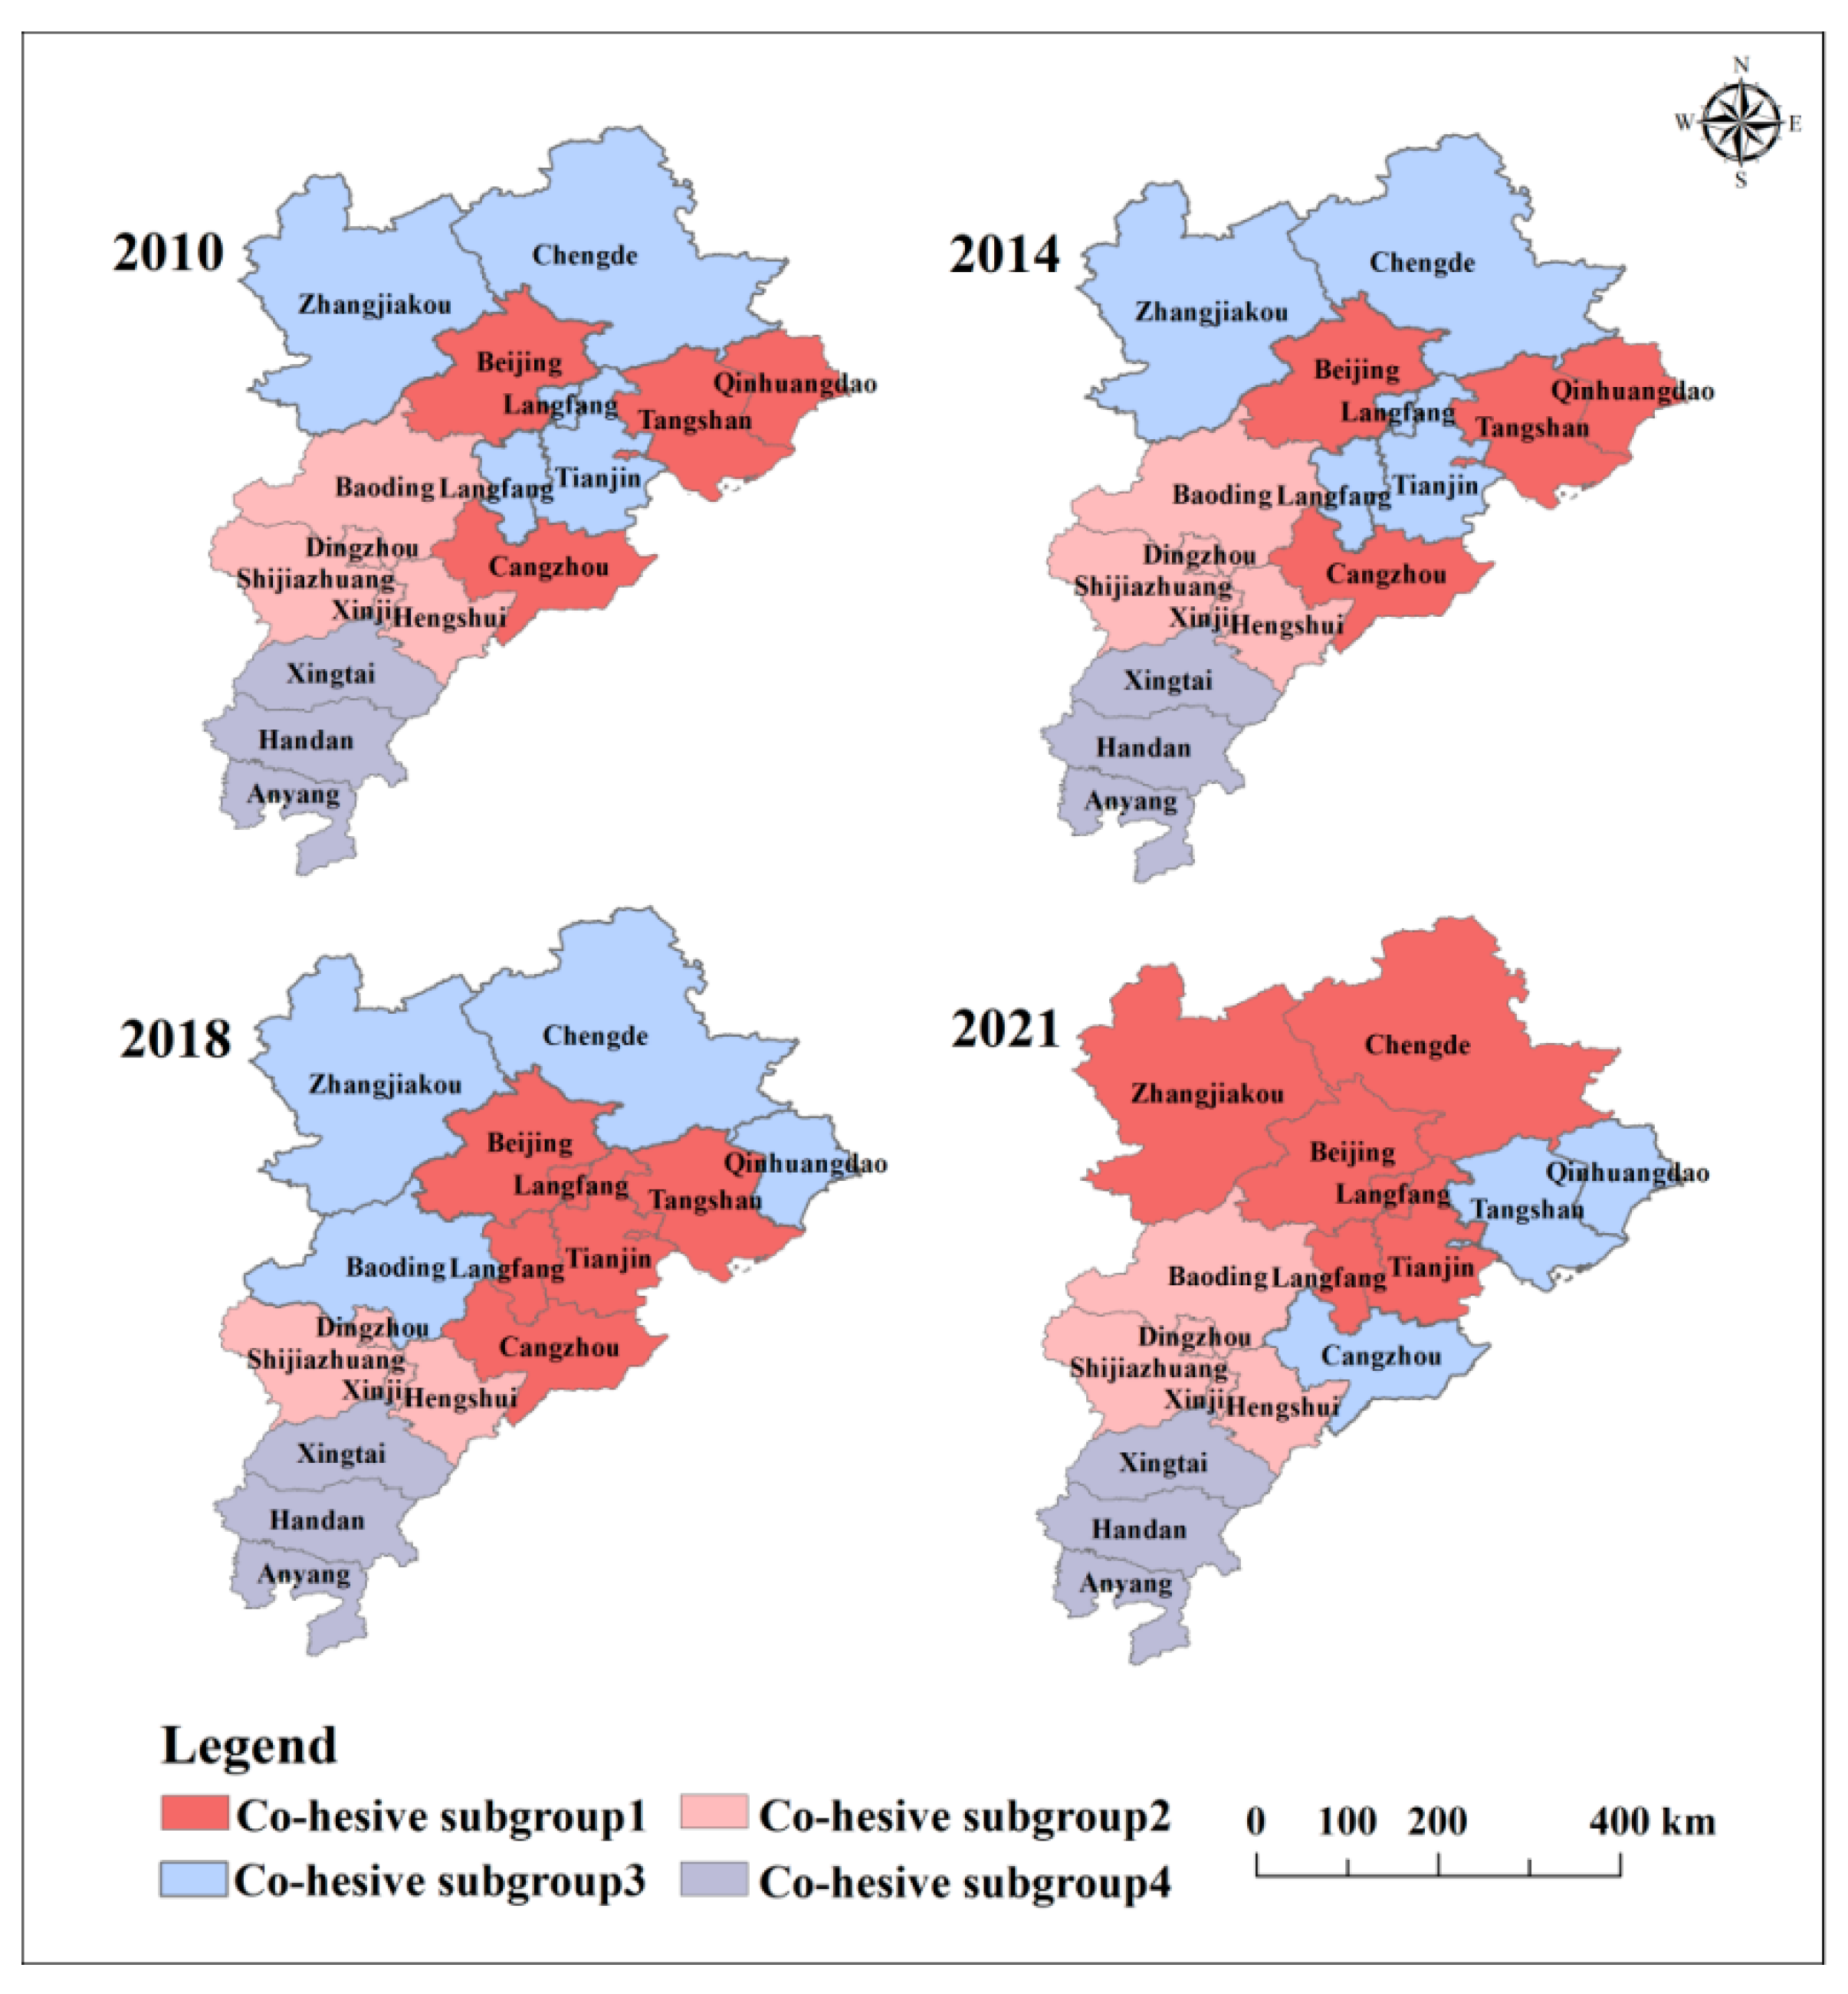
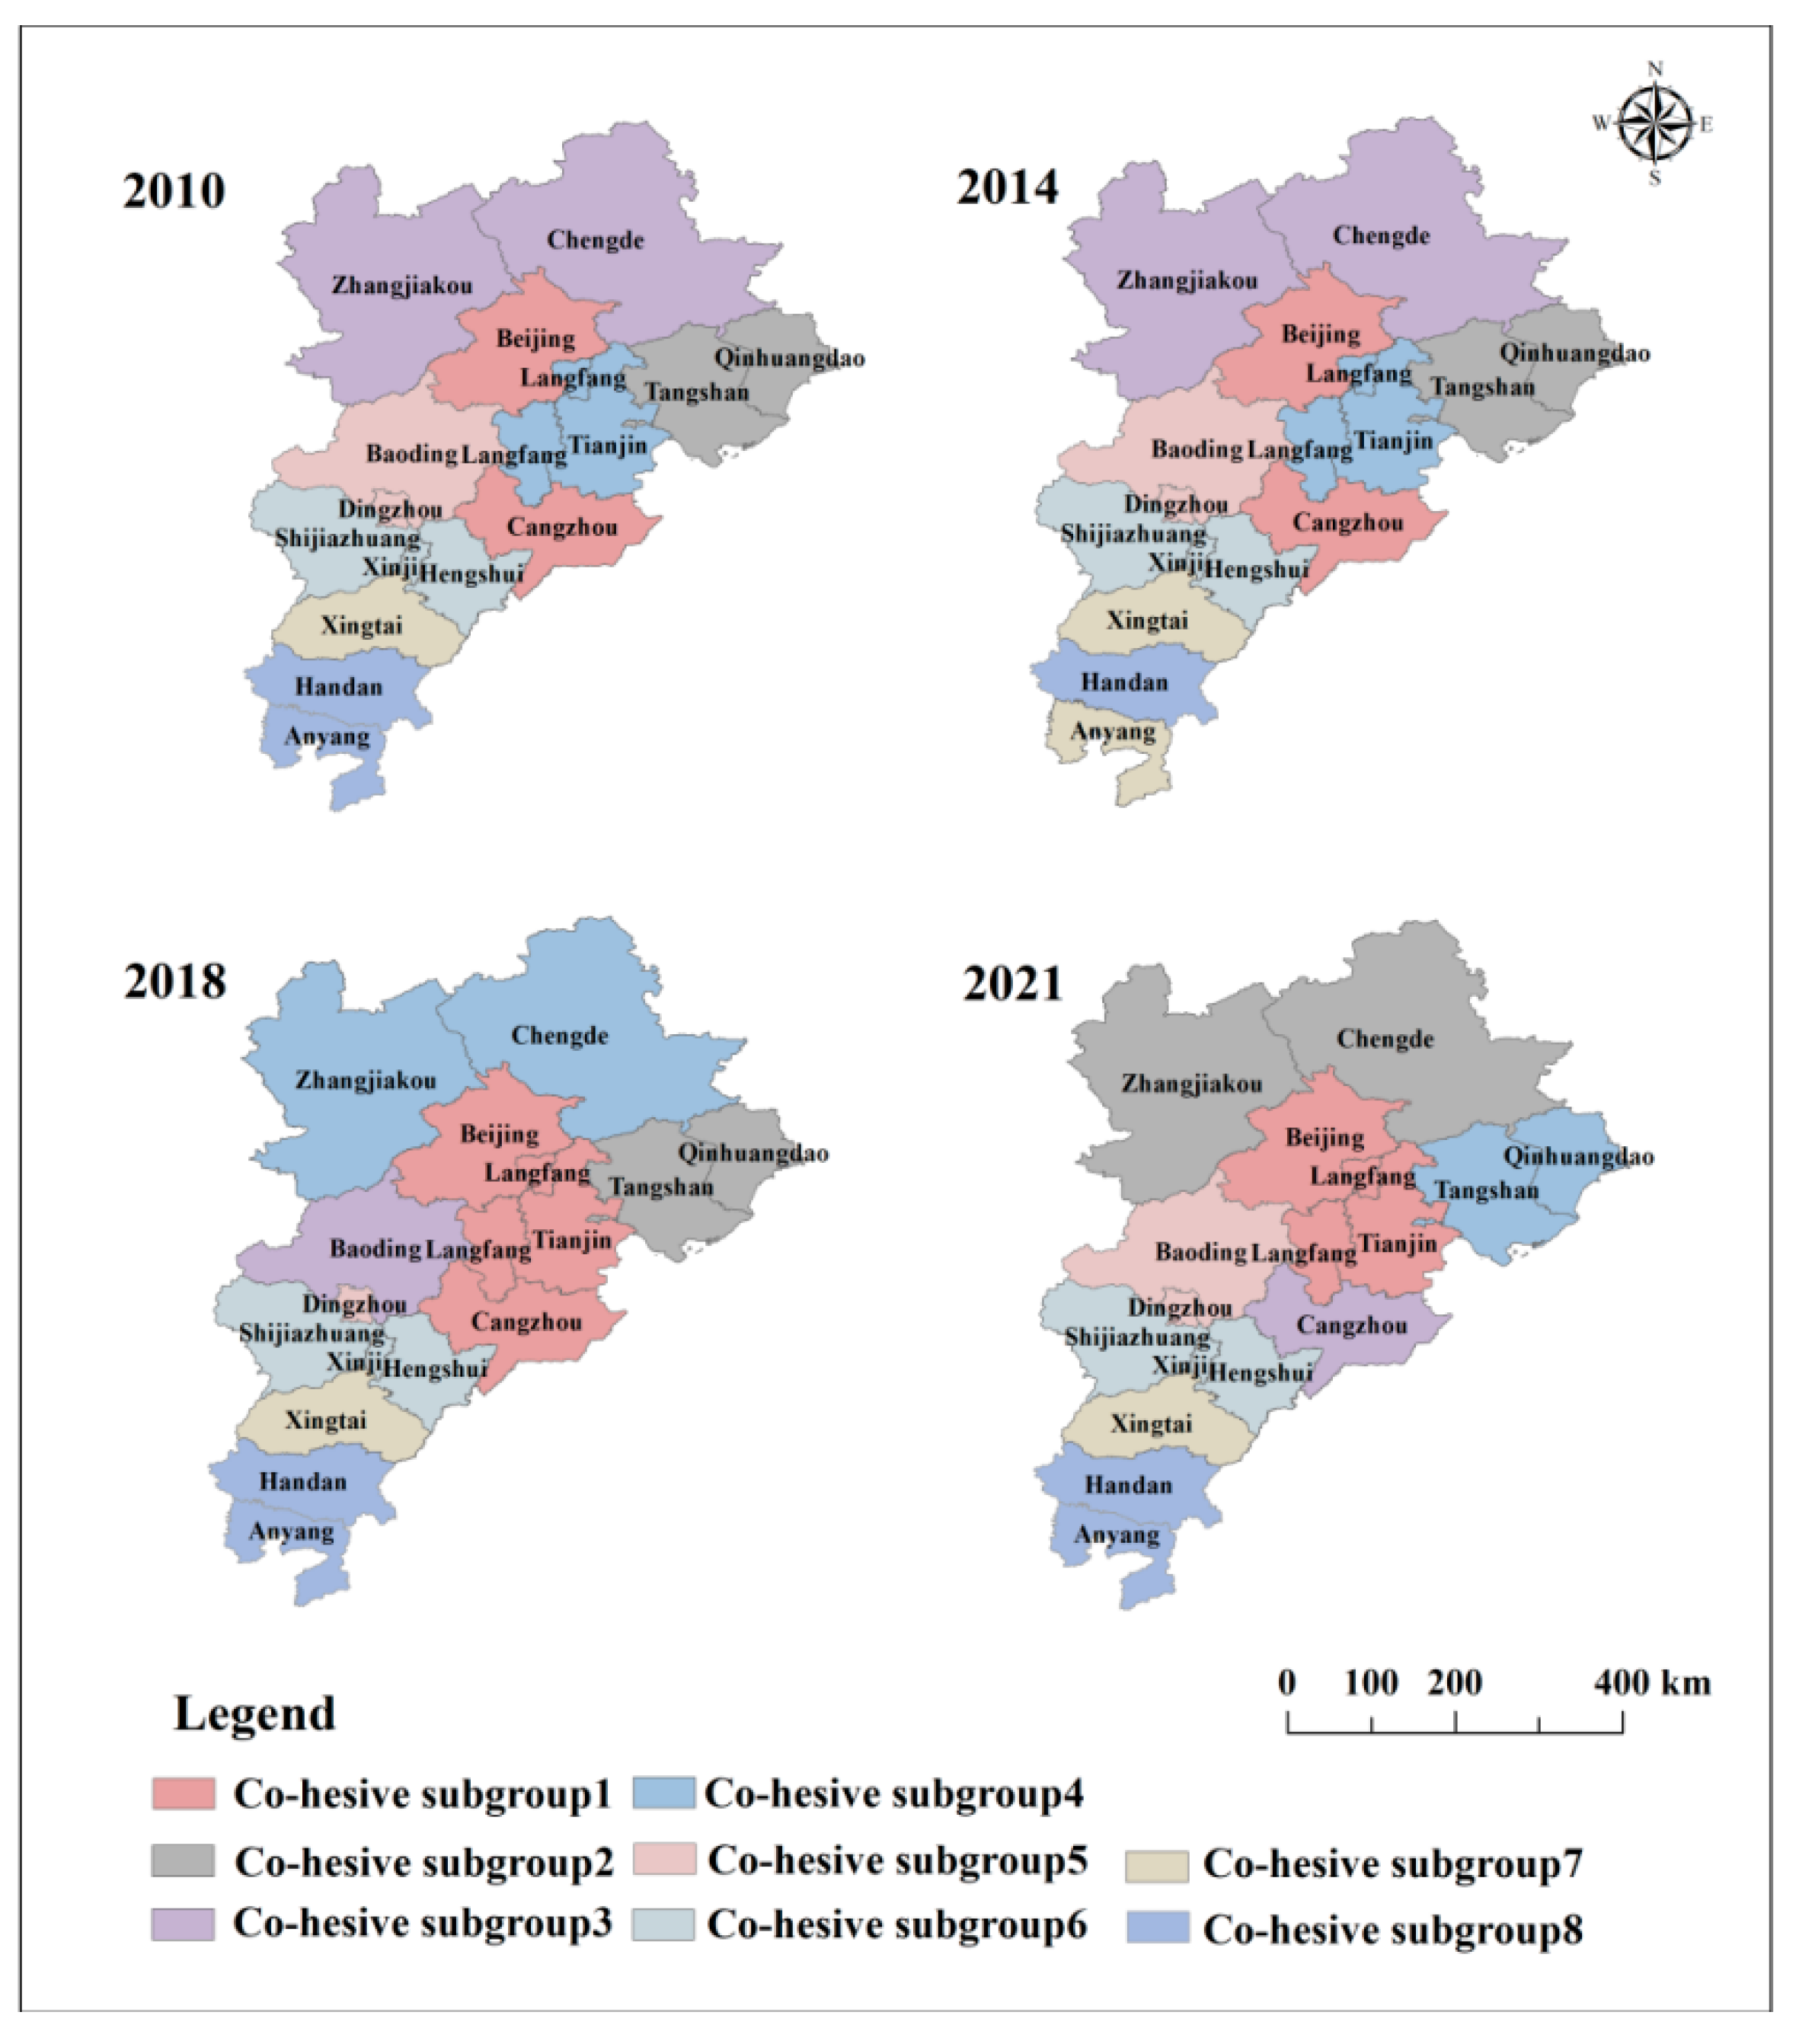
4.3.3. Cohesive subgroup analysis
5. Discussion
5.1. Discussion
- (1)
- The uneven pattern and spatial disparities in the interconnectivity degree of rail transits. One significant importance of urban agglomeration development is to promote regional integration, address the issue of imbalanced regional development, and leverage the development of core cities to better drive the development of peripheral cities. However, in this study, we uncovered significant inequalities in rail transit interconnectivity across the BTHRTN. Core cities such as Beijing, Tianjin, and Shijiazhuang play central roles, while non-core cities demonstrate lower rail transit interconnectivity. Imbalances and asymmetries persisted throughout the study period within the BTHRTN. The spatial configuration, characterized by “three hubs and numerous weak links,” indicates that rail transit burdens are concentrated in a few core cities. This emphasizes the urgent need to optimize resource allocation to address these disparities. This finding is consistent with existing research, as most studies suggest that the current urban agglomeration is in a three-core stage, although some argue that it may still be in a two-core stage [15]. Nevertheless, regardless of the stage, the status of Shijiazhuang within the urban agglomeration needs further enhancement. Initiatives aimed at enhancing the interconnectivity of non-core cities should be informed by this critical insight. Strategically allocating resources and investments can effectively foster the development of a more balanced and integrated rail transit network within the BTHRTN.
- (2)
- The evolution of the relationship between rail transit interconnectivity and urban development. Data analysis uncovers a correlation between cities with high interconnectivity degrees and superior urban integrated quality. Cities with lower urban integrated qualities, such as Zhangjiakou, Chengde, Qinhuangdao, and Hengshui, show relatively weaker interconnectivity with non-core cities. This connection emphasizes the importance of simultaneously considering both transportation and urban development in urban planning and rail transit construction. These findings mirror those of Fang et al. [2], who also observed a positive correlation between network spatial connectivity and the hierarchy of cities in the urban agglomeration. In the future, delving deeper into the mechanisms of this mutual relationship and exploring ways to better integrate them will be essential.
- (3)
- The role of rail transit interconnectivity in shaping the spatial structure of urban agglomerations. Despite the uneven development and significant disparities in rail transit interconnectivity, interestingly, exploration of the BTHRTN structure evolution guided by the space of flows theory suggests that rail transit construction enhances the interconnectivity, integration, and stability of the spatial structure in the urban agglomeration. Additionally, this study highlights a specific challenge: limited improvement in polycentricity, indicating a potential area for further exploration and targeted interventions. This finding aligns with other studies linking rail transit with urban spatial structure [63]. This could be attributed to various factors, including the incomplete nature of the railway network, insufficient investments, and competition from other modes of transportation. Nevertheless, rail transit interconnectivity is considered a potential mechanism driving the polycentric development of urban agglomerations. Therefore, future research should focus on enhancing rail transit interconnectivity to foster a more balanced and sustainable polycentric development within urban agglomerations.
5.2. Suggestion
- (1)
- Focusing on spatial disparities in the interconnectivity degree of rail transits at the urban agglomeration scale. This disparity arises from varying urban capacities to attract and radiate the exchange of element flows with other cities. The key to alleviating this situation lies in addressing the disequilibrium in the urban integrated quality. It is necessary to implement national-level policies that foster a balanced allocation of traffic resources. Moreover, it is necessary to promote coordination between northern and southern BTH regions, leverage the advantages of the north, especially Beijing’s capital and policies, and recognize its leadership role. Additionally, it is recommended to concentrate on increasing the network density of rail transits and expanding the length of rail transit lines as well as the overall network scale.
- (2)
- Enhancing polycentric development in the rail transit network to elevate the status of non-core cities. The existing BTHRTN comprises three core cities: Beijing, Tianjin, and Shijiazhuang. Although these three cities exert a growing influence on nearby cities through their radiation effects, the overall interconnectivity degree remains relatively weak. Therefore, the urban planning sector must promote the trend toward a polycentric development pattern and enhance the interconnectivity of non-core cities. To achieve this goal, it is necessary to elevate the status and transportation hubs of Tianjin and Shijiazhuang. The construction of a “1 h functional circle” in Hebei Province can enhance the interconnectivity degree of non-core cities. Moreover, the BTH urban agglomeration should draw valuable insights and best practices from both domestic and international urban agglomerations, particularly in areas related to legal protection, urban planning and construction, and route coordination [64].
- (3)
- Developing tailored policies for rail transit interconnectivity based on different city statuses. Cities occupy various geographic locations in rail transit networks and perform distinct functions. Therefore, it is imperative to implement more accurate and differentiated policies that suit local circumstances. Cities acting as communication hubs and less susceptible to the influence of nearby cities must fully leverage their intermediary roles. This entails strengthening the bidirectional spillover effects across regions and enhancing urban interconnectivity frequencies. Furthermore, policymakers should prioritize enhancing intelligent services and resilience in key nodal cities to improve the overall robustness of rail transit networks within urban agglomerations, thus promoting sustainability.
6. Conclusions
- (1)
- The interconnectivity degree of rail transit in the BTH urban agglomeration exhibits an uneven pattern known as “three cores and numerous weak links,” characterized by spatial polarization. Over the study period, the figures for the interconnectivity degree of rail transits reveal persistent regional disparities between core and non-core cities. Beijing, Tianjin, and Shijiazhuang firmly occupy the core positions in the BTHRTN, while non-core cities like Zhangjiakou, Chengde, and Qinhuangdao have limited connections with cities beyond the cores. Analysis of BTHRTN characteristics indicates a decreasing trend in centralization, emphasizing imbalances and asymmetries in rail transit interconnectivity within the BTH urban agglomeration.
- (2)
- From 2010 to 2021, the interconnectivity degree of rail transit in the BTH urban agglomeration experiences significant growth and shows a coordinated development trend. The total interconnectivity degree of the BTH urban agglomeration has risen by 82% from 2010 to 2021. The network density of the BTHRTN has consistently grown over the study period. Figures for incloseness and outcloseness are on the rise, while their disparity is decreasing. These findings suggest an overall increase in the interconnectivity degree of the BTHRTN, accompanied by a narrowing disparity between cities. The central region, led by Beijing, and the southern region, with Shijiazhuang as the focal point, are actively fostering synergy in the BTH urban agglomeration through two high-degree interconnectivity corridors: “Beijing-Tianjin-Longfang” and “Beijing-Baoding-Shijiazhuang”. These corridors will strengthen overall interconnectivity and promote coordinated development between the two regions. The emerging pattern of BTH-coordinated development is starting to manifest tangible results.
- (3)
- The BTH urban agglomeration exhibits a polycentric development trend driven by core cities, yet the influence of rail transit interconnectivity on this polycentric pattern is comparatively feeble. The foundational framework of “BTH on the track” has solidified and clarified, designating Beijing, Tianjin, and Shijiazhuang as the three core cities. While the three core cities radiate and guide the development of the BTHRTN, they remain somewhat isolated. Additionally, Shijiazhuang, the capital of Hebei province, holds the third-highest interconnectivity degree. However, it is noteworthy that its rankings in betweenness centrality and closeness centrality are gradually decreasing, indicating a weakening hub position. Simultaneously, the positions of Baoding and Langfang within the BTHRTN are rising. As a result, the full emergence of the third pole in the world-class urban agglomeration centered on Shijiazhuang is yet to be realized. Moving forward, emphasis should be placed on enhancing the impact of rail transit interconnectivity on the polycentric development pattern.
- (4)
- Rail transit interconnectivity generates multi-element flows that impact the spatial structure networking in urban agglomerations. The SNA method unveils the crucial role of rail transit in enhancing interconnectivity and integration among cities through the analysis of the spatial evolution of the BTHRTN. Both the network density and the degree of centrality show an increasing trend. Furthermore, applying the CONCOR method to evaluate city correlations within the BTHRTN indicates an integrating spatial pattern, while the interaction relationships among cities remain stable. Going forward, emphasis must be placed on fostering coordinated development among cities within the urban agglomerations.
Supplementary Materials
Author Contributions
Funding
Data Availability Statement
Acknowledgments
Conflicts of Interest
References
- Tan, F.; Kong, Q. Uncovering the driving mechanism of regional synergistic development based on Haken model: Case of the Bohai Rim region. Environ. Dev. Sustain. 2020, 22, 3291–3308. [Google Scholar] [CrossRef]
- Fang, C.; Yu, D. Urban agglomeration: An evolving concept of an emerging phenomenon. Landsc. Urban Plan. 2017, 162, 126–136. [Google Scholar] [CrossRef]
- Knowles, R.D.; Ferbrache, F.; Nikitas, A. Transport’s historical, contemporary and future role in shaping urban development: Re-evaluating transit oriented development. Cities 2020, 99, 102607. [Google Scholar] [CrossRef]
- González-Gil, A.; Palacin, R.; Batty, P.; Powell, J.P. A systems approach to reduce urban rail energy consumption. Energy Convers. Manag. 2014, 80, 509–524. [Google Scholar] [CrossRef]
- Chen, Y.; Whalley, A. Green infrastructure: The effects of urban rail transit on air quality. Am. Econ. J. Econ. Policy 2012, 4, 58–97. [Google Scholar] [CrossRef]
- Zhou, L.; Liu, Y.J.; Yu, L.; Liu, Y. Research on the Spatial-System-Based Rail Transit Systems of the World Cities. Procedia Eng. 2016, 137, 699–708. [Google Scholar] [CrossRef]
- Loo, B.P.Y.; Chen, C.; Chan, E.T.H. Rail-based transit-oriented development: Lessons from New York City and Hong Kong. Landsc. Urban Plan. 2010, 97, 202–212. [Google Scholar] [CrossRef]
- Qiu, J.; Liu, Y.; Chen, H.; Gao, F. Urban Network Structure of Guangdong-Hong Kong-Macao Greater Bay Area with the View of Space of Flows: A Comparison between Information Flow and Transportation Flow. Econ. Geogr. 2019, 39, 7–15. (In Chinese) [Google Scholar]
- Zhang, P.; Zhao, Y.; Zhu, X.; Cai, Z.; Xu, J.; Shi, S. Spatial structure of urban agglomeration under the impact of high-speed railway construction: Based on the social network analysis. Sustain. Cities Soc. 2020, 62, 102404. [Google Scholar] [CrossRef]
- Zhou, J.; Yang, L.; Li, L. The implications of high-speed rail for Chinese cities: Connectivity and accessibility. Transp. Res. Part A Policy Pract. 2018, 116, 308–326. [Google Scholar]
- Xiong, Y.; Zeng, G.; Dong, L.; Jiao, S.; Chen, G. Quantitative evaluation of the uncertainties in the coordinated development of urban human settlement environment and economy: Taking Changsha City as an example. Acta Geogr. Sin.-Chin. Ed. 2007, 62, 397. [Google Scholar]
- Ford, A.C.; Barr, S.L.; Dawson, R.J.; James, P. Transport accessibility analysis using GIS: Assessing sustainable transport in London. ISPRS Int. J. Geo-Inf. 2015, 4, 124–149. [Google Scholar] [CrossRef]
- Batty, M. The New Science of Cities; MIT Press: Cambridge, MA, USA, 2013. [Google Scholar]
- Zhen, F.; Qin, X.; Ye, X.; Sun, H.; Luosang, Z. Analyzing urban development patterns based on the flow analysis method. Cities 2019, 86, 178–197. [Google Scholar] [CrossRef]
- He, D.; Chen, Z.; Pei, T.; Zhou, J. Analysis of structural evolution and its influencing factors of the high-speed railway network in China’s three urban agglomerations. Cities 2023, 132, 104063. [Google Scholar] [CrossRef]
- Liu, X.; Zhou, J. Spatial pattern of land use and its implications for mode-based accessibility: Case study of Nanjing, China. J. Urban Plan. Dev. 2015, 141, 05014012. [Google Scholar] [CrossRef]
- Li, M.; Guo, W.; Guo, R.; He, B.; Li, Z.; Li, X.; Liu, W.; Fan, Y. Urban network spatial connection and structure in China based on railway passenger flow big data. Land 2022, 11, 225. [Google Scholar] [CrossRef]
- Xu, J.; Zhang, M.; Zhang, X.; Wang, D.; Zhang, Y. How does City-agglomerations high-speed rail facilitate regional integration? Evidence from the Shanghai-Nanjing corridor. Cities 2019, 85, 83–97. [Google Scholar] [CrossRef]
- Zhu, Z.L. Study on the Relationship between the Development of Rail Transit and the Evolution of Urban Spatial Structure: Taking Guangzhou as an Example. Appl. Mech. Mater. 2014, 641, 736–740. [Google Scholar] [CrossRef]
- Wang, D.; Wang, P.; Chen, G.; Liu, Y. Ecological–social–economic system health diagnosis and sustainable design of high-density cities: An urban agglomeration perspective. Sustain. Cities Soc. 2022, 87, 104177. [Google Scholar] [CrossRef]
- Pan, H.; Li, J.; Shen, Q.; Shi, C. What determines rail transit passenger volume? Implications for transit oriented development planning. Transp. Study Part D Transp. Environ. 2017, 57, 52–63. [Google Scholar] [CrossRef]
- Veneri, P. The identification of sub-centres in two Italian metropolitan areas: A functional approach. Cities 2013, 31, 177–185. [Google Scholar] [CrossRef]
- Isard, W. Gravity and spatial interaction models. In Methods of Interregional and Regional Analysis; Routledge: London, UK, 2017; pp. 243–280. [Google Scholar]
- Elliott, M. The role of the DPSIR approach and conceptual models in marine environmental management: An example for offshore wind power. Mar. Pollut. Bull. 2002, 44, iii–vii. [Google Scholar] [CrossRef] [PubMed]
- Manitiu, D.N.; Pedrini, G. Urban smartness and sustainability in Europe. An ex ante assessment of environmental, social and cultural domains. Eur. Plan. Stud. 2016, 24, 1766–1787. [Google Scholar] [CrossRef]
- Cao, W.; Feng, X.; Zhang, H. The structural and spatial properties of the high-speed railway network in China: A complex network perspective—ScienceDirect. J. Rail Transp. Plan. Manag. 2019, 9, 46–56. [Google Scholar] [CrossRef]
- Almahmoud, E.; Doloi, H.K. Assessment of social sustainability in construction projects using social network analysis. Facilities 2015, 33, 152–176. [Google Scholar] [CrossRef]
- Hou, H.; Liu, Y.; Liu, Y.; Wei, X.; He, Q.; He, Q. Using inter-town network analysis in city system planning: A case study of Hubei Province in China. Habitat Int. 2015, 49, 454–465. [Google Scholar] [CrossRef]
- Lin, P.; Weng, J.; Fu, Y.; Alivanistos, D.; Yin, B. Study on the topology and dynamics of the rail transit network based on automatic fare collection data. Phys. A. Stat. Mech. Its Appl. 2020, 54, 123538. [Google Scholar] [CrossRef]
- Erkul, M.; Yitmen, I.; Çelik, T. Stakeholder engagement in mega transport infrastructure projects. Procedia Eng. 2016, 161, 704–710. [Google Scholar] [CrossRef]
- Errampalli, M.; Patil, K.S.; Prasad, C.S.R.K. Evaluation of integration between public transportation modes by developing sustainability index for Indian cities. Case Stud. Transp. Policy 2020, 8, 180–187. [Google Scholar] [CrossRef]
- Liu, X.; Xia, H. Networking and sustainable development of urban spatial planning: Influence of rail transit. Sustain. Cities Soc. 2023, 99, 104865. [Google Scholar] [CrossRef]
- Hong, I.; Jung, W.-S. Application of gravity model on the Korean urban bus network. Phys. A Stat. Mech. Its Appl. 2016, 462, 48–55. [Google Scholar] [CrossRef]
- Chen, Y.; Jin, F.; Lu, Y.; Chen, Z.; Yang, Y. Development history and accessibility evolution of land transportation network in Beijing-Tianjin-Hebei region over the past century. J. Geogr. Sci. 2018, 28, 1500–1518. [Google Scholar] [CrossRef]
- Ness, B.; Anderberg, S.; Olsson, L. Structuring problems in sustainability science: The multi-level DPSIR framework. Geoforum 2010, 41, 479–488. [Google Scholar] [CrossRef]
- Zhao, R.; Fang, C.; Liu, H.; Liu, X. Evaluating urban ecosystem resilience using the DPSIR framework and the ENA model: A case study of 35 cities in China. Sustain. Cities Soc. 2021, 72, 102997. [Google Scholar] [CrossRef]
- Castells-Quintana, D. Malthus living in a slum: Urban concentration, infrastructure and economic growth. J. Urban Econ. 2017, 98, 158–173. [Google Scholar] [CrossRef]
- Fu, H.; Wang, Y.; Mao, L.; Hong, N.; Wang, Z.; Zhao, S.; Liao, C. The spatial pattern and governance of Zhongyuan Urban-Rural System in its development trajectory. J. Geogr. Sci. 2022, 32, 1261–1280. [Google Scholar] [CrossRef]
- Chen, H.; Xu, J.; Zhang, K.; Guo, S.; Lv, X.; Mu, X.; Yang, L.; Song, Y.; Hu, X.; Ma, Y.; et al. New insights into the DPSIR model: Revealing the dynamic feedback mechanism and efficiency of ecological civilization construction in China. J. Clean. Prod. 2022, 348, 131377. [Google Scholar] [CrossRef]
- Sasaki, K.; Ohashi, T.; Ando, A. High-speed rail transit impact on regional systems: Does the Shinkansen contribute to dispersion? Ann. Reg. Sci. 1997, 31, 77–98. [Google Scholar] [CrossRef]
- Mu, X.; Fang, C.; Yang, Z. Spatio-temporal evolution and dynamic simulation of the urban resilience of Beijing-Tianjin-Hebei urban agglomeration. J. Geogr. Sci. 2022, 32, 1766–1790. [Google Scholar] [CrossRef]
- Chen, Y.; Peng, L.; Cao, W. Health evaluation and coordinated development characteristics of urban agglomeration: Case study of Fujian Delta in China. Ecol. Indic. 2021, 121, 107149. [Google Scholar] [CrossRef]
- Liu, S.; Ding, P.; Xue, B.; Zhu, H.; Gao, J. Urban sustainability evaluation based on the DPSIR dynamic model: A case study in Shaanxi province, China. Sustainability 2020, 12, 7460. [Google Scholar] [CrossRef]
- Li, W.; Yi, P.; Zhang, D.; Zhou, Y. Assessment of coordinated development between social economy and ecological environment: Case study of resource-based cities in Northeastern China. Sustain. Cities Soc. 2020, 59, 102208. [Google Scholar] [CrossRef]
- Sun, D.; Chen, S.; Zhang, C.; Shen, S. A bus route evaluation model based on GIS and super-efficient data envelopment analysis. Transp. Plan. Technol. 2016, 39, 407–423. [Google Scholar] [CrossRef]
- Lugaric, L.; Krajcar, S. Transforming cities towards sustainable low-carbon energy systems using emergy synthesis for support in decision making. Energy Policy 2016, 98, 471–482. [Google Scholar] [CrossRef]
- Chan, L.Y.; Lau, W.L.; Lee, S.C.; Chan, C.Y. Commuter exposure to particulate matter in public transportation modes in Hong Kong. Atmos. Environ. 2002, 36, 3363–3373. [Google Scholar] [CrossRef]
- Peng, C.; Li, B.; Nan, B. An analysis framework for the ecological security of urban agglomeration: A case study of the Beijing-Tianjin-Hebei urban agglomeration. J. Clean. Prod. 2021, 315, 128111. [Google Scholar] [CrossRef]
- Qiu, Z.; Song, J.; Xu, X.; Luo, Y.; Zhao, R.; Zhou, W.; Xiang, B.; Hao, Y. Commuter exposure to particulate matter for different transportation modes in Xi’an, China. Atmos. Pollut. Res. 2017, 8, 940–948. [Google Scholar] [CrossRef]
- Handy, S. Smart growth and the transportation-land use connection: What does the research tell us? Int. Reg. Sci. Rev. 2005, 28, 146–167. [Google Scholar] [CrossRef]
- Zhang, M.D.; Feng, X.Q. A comparative study of urban resilience and economic development level of cities in Yangtze River Delta urban agglomeration. Urban Dev. Stud. 2019, 26, 82–91. [Google Scholar]
- Tirachini, A.; Hensher, D.A.; Rose, J.M. Crowding in public transport systems: Effects on users, operation and implications for the estimation of demand. Transp. Res. Part A Policy Pract. 2013, 53, 36–52. [Google Scholar] [CrossRef]
- Chen, S.; Claramunt, C.; Ray, C. A spatio-temporal modelling approach for the study of the connectivity and accessibility of the Guangzhou metropolitan network. J. Transp. Geogr. 2014, 36, 12–23. [Google Scholar] [CrossRef]
- Sekar, S.P.; Gangopadhyay, D. Impact of Rail Transit on Land Use and Development: Case Study of Suburban Rail in Chennai. J. Urban Plan. Dev. 2017, 2, 04016038. [Google Scholar] [CrossRef]
- Gao, H.; Liu, S.; Cao, G.; Zhao, P.; Zhang, J.; Zhang, P. Big Data Analysis of Beijing Urban Rail Transit Fares Based on Passenger Flow. IEEE Access 2020, 8, 80049–80062. [Google Scholar] [CrossRef]
- Hu, W.; Dong, J.; Hwang, B.G.; Ren, R.; Chen, Y.; Chen, Z. Using system dynamics to analyze the development of urban freight transportation system based on rail transit: A case study of Beijing. Sustain. Cities Soc. 2020, 53, 101923. [Google Scholar] [CrossRef]
- Chalumuri, R.S.; Nath, R.; Errampalli, M. Development and evaluation of an integrated transportation system: A case study of delhi. Transport 2017, 171, 1–10. [Google Scholar] [CrossRef]
- Ma, J.; Fan, Z.-P.; Huang, L.-H. A subjective and objective integrated approach to determine attribute weights. Eur. J. Oper. Res. 1999, 112, 397–404. [Google Scholar] [CrossRef]
- Li, Y.; Wei, M.; Liu, L.; Yu, B.; Dong, Z.; Xue, Q. Evaluation of the effectiveness of VOC-contaminated soil preparation based on AHP-CRITIC-TOPSIS model. Chemosphere 2021, 271, 129571. [Google Scholar] [CrossRef] [PubMed]
- Diakoulaki, D.; Mavrotas, G.; Papayannakis, L. Determining objective weights in multiple criteria problems: The critic method. Comput. Oper. Res. 1995, 22, 763–770. [Google Scholar] [CrossRef]
- Hwang, C.-L.; Lai, Y.-J.; Liu, T.-Y. A new approach for multiple objective decision making. Comput. Oper. Res. 1993, 20, 889–899. [Google Scholar] [CrossRef]
- Abdel-Basset, M.; Saleh, M.; Gamal, A.; Smarandache, F. An approach of TOPSIS technique for developing supplier selection with group decision making under type-2 neutrosophic number. Appl. Soft Comput. 2019, 77, 438–452. [Google Scholar] [CrossRef]
- Song, J.; Abuduwayiti, A.; Gou, Z. The role of subway network in urban spatial structure optimization–Wuhan city as an example. Tunn. Undergr. Space Technol. 2023, 131, 104842. [Google Scholar] [CrossRef]
- Albalate, D.; Bel, G. High-speed rail: Lessons for policy makers from experiences abroad. Public Adm. Rev. 2012, 72, 336–349. [Google Scholar] [CrossRef]


| Region | 2010 | 2011 | 2012 | 2013 | 2014 | 2015 | 2016 | 2017 | 2018 | 2019 | 2020 | 2021 | Mean |
|---|---|---|---|---|---|---|---|---|---|---|---|---|---|
| Beijing | 0.59 | 0.58 | 0.61 | 0.64 | 0.69 | 0.71 | 0.71 | 0.74 | 0.76 | 0.77 | 0.71 | 0.73 | 0.687 |
| Tianjin | 0.47 | 0.49 | 0.50 | 0.50 | 0.50 | 0.53 | 0.53 | 0.55 | 0.60 | 0.63 | 0.60 | 0.60 | 0.542 |
| Shijiazhuang | 0.41 | 0.43 | 0.41 | 0.41 | 0.44 | 0.49 | 0.53 | 0.56 | 0.52 | 0.54 | 0.55 | 0.58 | 0.489 |
| Zhangjiakou | 0.26 | 0.26 | 0.27 | 0.28 | 0.30 | 0.32 | 0.33 | 0.35 | 0.41 | 0.44 | 0.43 | 0.44 | 0.341 |
| Chengde | 0.28 | 0.28 | 0.29 | 0.29 | 0.32 | 0.32 | 0.34 | 0.36 | 0.39 | 0.41 | 0.42 | 0.43 | 0.345 |
| Qinhuangdao | 0.37 | 0.36 | 0.32 | 0.39 | 0.40 | 0.38 | 0.40 | 0.41 | 0.46 | 0.46 | 0.44 | 0.48 | 0.406 |
| Tangshan | 0.37 | 0.35 | 0.37 | 0.37 | 0.39 | 0.38 | 0.41 | 0.42 | 0.47 | 0.46 | 0.44 | 0.50 | 0.412 |
| Cangzhou | 0.31 | 0.29 | 0.31 | 0.32 | 0.34 | 0.34 | 0.35 | 0.37 | 0.42 | 0.43 | 0.44 | 0.45 | 0.364 |
| Hengshui | 0.32 | 0.32 | 0.32 | 0.35 | 0.37 | 0.38 | 0.39 | 0.40 | 0.42 | 0.42 | 0.44 | 0.46 | 0.381 |
| Langfang | 0.35 | 0.35 | 0.37 | 0.37 | 0.38 | 0.39 | 0.42 | 0.45 | 0.49 | 0.50 | 0.50 | 0.52 | 0.424 |
| Baoding | 0.40 | 0.39 | 0.38 | 0.40 | 0.42 | 0.43 | 0.43 | 0.47 | 0.48 | 0.49 | 0.51 | 0.54 | 0.445 |
| Xingtai | 0.35 | 0.35 | 0.35 | 0.35 | 0.39 | 0.39 | 0.39 | 0.43 | 0.47 | 0.47 | 0.46 | 0.48 | 0.407 |
| Handan | 0.41 | 0.43 | 0.43 | 0.43 | 0.50 | 0.45 | 0.45 | 0.46 | 0.50 | 0.50 | 0.49 | 0.52 | 0.463 |
| Dingzhou | 0.38 | 0.37 | 0.37 | 0.44 | 0.46 | 0.47 | 0.40 | 0.41 | 0.47 | 0.46 | 0.46 | 0.50 | 0.432 |
| Xinji | 0.30 | 0.29 | 0.29 | 0.31 | 0.33 | 0.33 | 0.36 | 0.37 | 0.41 | 0.43 | 0.42 | 0.46 | 0.360 |
| Anyang | 0.34 | 0.33 | 0.36 | 0.36 | 0.37 | 0.38 | 0.39 | 0.43 | 0.44 | 0.44 | 0.45 | 0.47 | 0.397 |
| Mean | 0.369 | 0.369 | 0.372 | 0.388 | 0.412 | 0.417 | 0.427 | 0.450 | 0.481 | 0.490 | 0.485 | 0.511 |
| 2010 | 2014 | 2018 | 2021 | |
| Study area | 0.322 | 0.408 | 0.523 | 0.617 |
| City | 2010 | 2014 | 2018 | 2021 | ||||
|---|---|---|---|---|---|---|---|---|
| Indegree | Outdegree | Indegree | Outdegree | Indegree | Outdegree | Indegree | Outdegree | |
| Beijing | 41.57 | 64.65 | 58.95 | 99.81 | 96.93 | 148.46 | 104.63 | 144.78 |
| Tianjin | 43.73 | 48.60 | 59.07 | 60.98 | 97.69 | 107.27 | 105.80 | 114.33 |
| Shijiazhuang | 27.57 | 31.73 | 37.78 | 40.50 | 59.91 | 68.14 | 76.27 | 90.65 |
| Zhangjiakou | 2.87 | 1.27 | 4.56 | 2.01 | 9.45 | 4.87 | 9.74 | 6.37 |
| Chengde | 2.27 | 1.01 | 3.46 | 1.60 | 5.16 | 2.63 | 7.20 | 3.18 |
| Qinhuangdao | 3.71 | 3.30 | 5.65 | 4.12 | 9.06 | 5.68 | 10.11 | 9.45 |
| Tangshan | 8.76 | 7.88 | 12.21 | 9.90 | 21.08 | 17.54 | 26.65 | 24.00 |
| Cangzhou | 10.52 | 6.66 | 14.62 | 10.26 | 29.13 | 20.63 | 34.49 | 26.99 |
| Hengshui | 19.38 | 18.70 | 32.44 | 30.89 | 55.38 | 48.50 | 66.90 | 63.12 |
| Langfang | 41.33 | 28.11 | 58.26 | 39.45 | 99.12 | 76.27 | 105.85 | 88.45 |
| Baoding | 28.74 | 27.84 | 44.37 | 38.86 | 61.57 | 58.00 | 75.86 | 75.81 |
| Xingtai | 27.43 | 24.28 | 45.08 | 37.51 | 61.85 | 56.17 | 72.32 | 65.41 |
| Handan | 32.07 | 36.80 | 48.31 | 62.47 | 70.56 | 73.92 | 82.78 | 88.40 |
| Dingzhou | 27.31 | 25.17 | 40.36 | 42.33 | 56.12 | 51.58 | 70.49 | 64.03 |
| Xinji | 28.15 | 21.99 | 41.36 | 33.34 | 69.58 | 62.18 | 88.19 | 76.80 |
| Anyang | 20.35 | 17.71 | 32.17 | 24.55 | 44.78 | 38.56 | 53.15 | 48.65 |
| Mean | 22.86 | 22.86 | 33.67 | 33.66 | 52.53 | 52.53 | 61.90 | 61.90 |
| Network Centralization (Indegree) | 7.07 | 5.67 | 6.65 | 6.46 | ||||
| Network Centralization (Outdegree) | 14.15 | 14.77 | 13.75 | 12.183 | ||||
| City | 2010 | 2014 | 2018 | 2021 | ||||
|---|---|---|---|---|---|---|---|---|
| Incloseness | Outcloseness | Incloseness | Outcloseness | Incloseness | Outcloseness | Incloseness | Outcloseness | |
| Beijing | 75.00 | 78.95 | 78.95 | 93.75 | 88.24 | 100.00 | 93.75 | 100.00 |
| Tianjin | 68.18 | 68.18 | 68.18 | 68.18 | 71.43 | 83.33 | 78.95 | 88.24 |
| Shijiazhuang | 71.43 | 71.43 | 71.43 | 71.43 | 75.00 | 75.00 | 75.00 | 83.33 |
| Zhangjiakou | 44.12 | 45.46 | 45.46 | 50.00 | 51.72 | 53.57 | 53.57 | 55.56 |
| Chengde | 44.12 | 45.46 | 45.46 | 50.00 | 48.39 | 51.72 | 53.57 | 51.72 |
| Qinhuangdao | 42.86 | 42.86 | 50.00 | 42.86 | 51.72 | 55.56 | 53.57 | 57.69 |
| Tangshan | 50.00 | 53.57 | 53.57 | 57.69 | 60.00 | 62.50 | 71.43 | 71.43 |
| Cangzhou | 50.00 | 50.00 | 57.69 | 57.69 | 68.18 | 68.18 | 71.43 | 68.18 |
| Hengshui | 53.57 | 53.57 | 65.22 | 65.22 | 75.00 | 71.43 | 83.33 | 78.95 |
| Langfang | 50.00 | 51.72 | 57.69 | 57.69 | 65.22 | 68.18 | 71.43 | 75.00 |
| Baoding | 62.50 | 65.22 | 71.43 | 71.43 | 78.95 | 83.33 | 83.33 | 83.33 |
| Xingtai | 48.39 | 48.39 | 65.22 | 55.56 | 71.43 | 68.18 | 71.43 | 68.18 |
| Handan | 48.39 | 48.39 | 60.00 | 55.56 | 71.43 | 57.69 | 71.43 | 71.43 |
| Dingzhou | 65.22 | 65.22 | 68.18 | 71.43 | 75.00 | 75.00 | 78.95 | 78.95 |
| Xinji | 57.69 | 45.46 | 62.50 | 62.50 | 71.43 | 71.43 | 78.95 | 71.43 |
| Anyang | 45.46 | 45.46 | 46.88 | 45.46 | 65.22 | 51.72 | 65.23 | 57.69 |
| Mean | 54.81 | 54.96 | 60.49 | 61.03 | 68.02 | 68.55 | 72.21 | 72.57 |
| Network in-Centralization | 44.62 | 40.78 | 44.66 | 47.60 | ||||
| Network out-Centralization | 53.01 | 72.30 | 69.48 | 60.61 | ||||
| City | 2010 | 2014 | 2018 | 2021 |
|---|---|---|---|---|
| Beijing | 87.62 | 82.61 | 62.14 | 43.50 |
| Tianjin | 40.16 | 21.12 | 14.00 | 17.89 |
| Shijiazhuang | 44.98 | 17.47 | 5.86 | 4.64 |
| Zhangjiakou | 0.00 | 0.00 | 0.00 | 0.00 |
| Chengde | 0.00 | 0.00 | 0.00 | 0.00 |
| Qinhuangdao | 0.00 | 0.00 | 0.00 | 0.00 |
| Tangshan | 5.37 | 4.05 | 2.09 | 4.02 |
| Cangzhou | 0.00 | 2.55 | 3.07 | 2.28 |
| Hengshui | 1.60 | 8.12 | 3.26 | 5.03 |
| Langfang | 0.33 | 1.37 | 5.70 | 7.35 |
| Baoding | 11.78 | 12.51 | 10.95 | 6.09 |
| Xingtai | 1.33 | 4.39 | 2.29 | 0.74 |
| Handan | 1.33 | 3.21 | 0.91 | 1.43 |
| Dingzhou | 16.48 | 8.94 | 7.85 | 4.64 |
| Xinji | 1.00 | 1.65 | 3.89 | 3.38 |
| Anyang | 0.00 | 0.00 | 0.00 | 0.00 |
Disclaimer/Publisher’s Note: The statements, opinions and data contained in all publications are solely those of the individual author(s) and contributor(s) and not of MDPI and/or the editor(s). MDPI and/or the editor(s) disclaim responsibility for any injury to people or property resulting from any ideas, methods, instructions or products referred to in the content. |
© 2024 by the authors. Licensee MDPI, Basel, Switzerland. This article is an open access article distributed under the terms and conditions of the Creative Commons Attribution (CC BY) license (https://creativecommons.org/licenses/by/4.0/).
Share and Cite
Luan, X.; Xiang, P.; Jia, F. The Interconnectivity and Spatio-Temporal Evolution of Rail Transit Network Based on Multi-Element Flows: A Case Study of Beijing-Tianjin-Hebei Urban Agglomeration, China. Land 2024, 13, 249. https://doi.org/10.3390/land13020249
Luan X, Xiang P, Jia F. The Interconnectivity and Spatio-Temporal Evolution of Rail Transit Network Based on Multi-Element Flows: A Case Study of Beijing-Tianjin-Hebei Urban Agglomeration, China. Land. 2024; 13(2):249. https://doi.org/10.3390/land13020249
Chicago/Turabian StyleLuan, Xinyu, Pengcheng Xiang, and Fuyuan Jia. 2024. "The Interconnectivity and Spatio-Temporal Evolution of Rail Transit Network Based on Multi-Element Flows: A Case Study of Beijing-Tianjin-Hebei Urban Agglomeration, China" Land 13, no. 2: 249. https://doi.org/10.3390/land13020249
APA StyleLuan, X., Xiang, P., & Jia, F. (2024). The Interconnectivity and Spatio-Temporal Evolution of Rail Transit Network Based on Multi-Element Flows: A Case Study of Beijing-Tianjin-Hebei Urban Agglomeration, China. Land, 13(2), 249. https://doi.org/10.3390/land13020249