Abstract
The COVID-19 pandemic put forward a new test for an economic resilience study. Its long-term and diffusive spatiotemporal characteristics suggest that we need to pay attention to the resilience and spatial heterogeneity of cities over a longer period. This paper applied SARIMA and the performance curve to measure the economic resilience of each city under the pandemic, and explored its influencing factors and spatial heterogeneity using a geodetector and geographically weighted regression model. The results show that: (1) From 2020 to 2022, the economic resilience in the Yangtze River Delta presented a downward to upward to slightly downward trend. High-resilience cities were concentrated in southern Jiangsu, while vulnerable cities were primarily located in western Anhui. The performance of regional core cities was not as strong as in previous research focusing on long-term economic resilience. (2) Fixed-asset investment, related variety, labor supply level, foreign trade dependence, and innovation level were the main influencing factors, on average. The effects of these factors had spatial heterogeneity related to the regional endowment and development quality. The findings suggest that the specificity of public health risks and the lack of coping experience may lead to a general failure of economic resilience. Identifying key factors and current weaknesses in each region can make resilience improvement strategies more targeted and effective.
1. Introduction
Resilience refers to a system’s ability to return to an equilibrium or stable state after a disturbance or shock [1]. In recent years, the frequent occurrence of extreme weather, natural disasters, and epidemics has brought challenges to urban development. As complex giant systems, cities are becoming more vulnerable and sensitive to various risks in the context of accelerated urbanization and deepening globalization. The concept of “resilience” has thus attracted much attention from multidisciplinary scholars. “Resilient city” has also been incorporated into urban development planning and policy objectives. The Sustainable Development Goals (SDG) of the United Nations proposed to “Make cities and human settlements inclusive, safe, resilient and sustainable”. Building urban resilience is a critical pathway to achieve sustainable development as a way to deal with uncertainties [2].
At present, resilience has penetrated many urban subsystems, such as economic, social, infrastructural, and institutional systems [3], and economic resilience has become a crucial dimension of a “resilient city”. Whether the urban economic system has the ability for resistance, adaptation, and recovery determines its performance under various uncertainties and whether it can achieve sustainable development and high-quality growth. Especially, as the concept of resilience has evolved from “engineering resilience” and “ecological resilience” to “evolutionary resilience”, the dynamic adaptability and the ability to create a smarter and more sustainable development path after disturbance, emphasized by evolutionary resilience, depends more on the economic resilience of the city [4,5].
Reggiani first introduced resilience into the study of spatial economics [6]. With the introduction of the adaptive cycles theory into the economic field, the concept of economic resilience is no longer limited to static equilibrium but develops in the direction of evolution, and more emphasis is placed on the forward evolution of economic systems. Simmie et al. believe that the process of adaptation and change is the basis of regional economic resilience, and adaptive capacity is the most essential attribute of economic resilience [4]. Boschma extends the concept of economic resilience from the ability to respond to shocks to the long-term ability of regions to develop new growth paths [5]. Considering the ambiguous concept of regional economic resilience, Martin and Sunley proposed a comprehensive definition as the capability of the regional economy system to withstand and recover from market or environmental shocks, and to restore its original development path or transit into a new sustainable path through the adaptive changes in economic structure [7]. In subsequent studies, they further interpreted it as four dimensions: risk, resistance, reorientation, and recoverability [8]. Their perspective integrates equilibrium and evolutionary theory, gaining considerable acceptance within the academic community and finding extensive application in empirical research.
Currently, empirical research on economic resilience primarily emphasizes two aspects: the measurement and evaluation, and the analysis of its influencing factors. The commonly used methods employed for measurement are the index system method and the proxy variable method. In the index system method, the goal tier is disassembled into multi-dimensional criterion tiers. For example, Briguglio proposed an evaluation system containing macroeconomic stability, microeconomic market efficiency, good governance, and social development to measure the effect of shock absorption or counteraction policies across countries [9]. Man et al. evaluated economic resilience from five socioeconomic aspects, including diversity, revenue and expenditure, innovation environment, development trend, and openness [10]. Li’s system included vulnerability-resistance and adaptability-transformation, considering the evolutionary process of regional economic resilience [11]. As these studies have shown, this approach is more suitable for scenarios under “slow burn” disturbances. In the proxy variable method, economic resilience is characterized by the variation of a specific economic indicator (e.g., unemployment, GDP) before and after a shock. This method was designed by Martin. By constructing a counterfactual function, the expected decline (rise) of the proxy variable is used to characterize the resistance (recovery) level [12]. This approach is more suitable for resilience research under sudden risks, and it was used and expanded by many scholars [13,14].
In terms of the study of influencing factors, the analysis framework is composed of four subsystems: structural and business, labor market, financial, and governance, which provide the basis for the subsequent studies [7]. Economic structure [15,16,17], industrial diversity [5,18,19,20,21], and technological innovation are often considered key factors in regional economic resilience [22,23,24,25]. Some scholars have also discussed financial factors [26,27], economic openness [28,29], government policies, and others [30,31]. There is some consensus that diversified industrial structure and higher innovation ability often have positive effects on economic resilience [5,18]. However, under different disturbances, regions, or economic cycles, the mechanism of influencing factors always varies. Focusing on the post-financial crisis period, Xiao and Grabner have demonstrated that industry-related diversity significantly affects economic resilience in European and American cities [20,32]. However, He and Fritsch’s studies on China and West Germany, respectively show that regions with high related variety are more susceptible [21], and the promotion effect of unrelated diversity tends to be more pronounced [33].
Overall, before the COVID-19 pandemic, most existing studies focused on financial crises or natural disasters as the risk background, and relatively less attention was paid to public health emergencies. In contrast to the financial crisis that directly impacted the economic system, or natural disasters that directly cause material losses, COVID-19 spread from the public health field to the socio-economic area, triggering a series of cascading effects such as economic activities restriction, production shutdown, fiscal deficits increment, and global value chains disruptions [34,35], and brought unprecedented, widespread, and lasting impacts. While the SDGs have made progress in reducing disaster losses as a proportion of global GDP [36], the COVID-19 pandemic has reminded us that we still need to be vigilant about the potential impact of various uncertainties on the economy. How to keep economically resilient and quickly recover from this hundred-year public health emergency has become an important issue in economic resilience research.
Some scholars have so far measured economic resilience under COVID-19, mostly based on Martin and Doran’s framework [12,37]. For example, Hu, Li, and Meng et al. took GDP as the proxy variable and measured the performance of their study area in 2020, assuming that the change range of a specific city during the recession will shrink according to the national rate [38,39,40]. They all found that large cities or developed provinces were more vulnerable to the pandemic at its early stage. There are also some scholars who used contemporary data comparing the crisis year with the previous year. Kim et al. found that the differences in economic resilience between different US states in the early stage of the pandemic were greater than before. With the deepening of the pandemic, the gap narrowed [17]. Jiang et al. found that China’s economy was heavily affected by the pandemic in the first half of 2020, and the resilience index began to reverse in the third quarter [41]. Some scholars have adjusted the proxy variables. For example, Angelopoulos et al. utilized the location quotient method based on the number of JobKeeper applications—a Federal Government initiative from Australia—as a proxy for economic resilience [42]. Tuysuz et al. measured the economic impact of the pandemic on Turkey using more extensive data on employment, exports, energy, consumption, and business closures. They found that Turkey’s innovative and open regions were more vulnerable in the first three months of the crisis, and regions with strong GDP recovered more slowly [43]. However, all these approaches need to define the contraction or expansion period first and are more suitable for the short-term process around 2020. But when we extend the resistance and recovery period, the calculation results are prone to large distortion. The characteristics of the COVID-19 pandemic, such as multiple waves, long-term existence, and phase changes in control policies, remind us to pay attention to cities’ resilience level over a longer period. It also has implications for the sustainability of cities. Further exploration is needed to identify a more suitable measurement method for the extended period following the pandemic.
Moreover, as mentioned above, a factor may have different degrees or opposite effects in different regions, even under the same shock. This feature is also reflected in the empirical study of influencing factors under public health risks. For example, Kim et al. used the ordinal logistic regression model to test the role of industrial structure. They found that key industries with low interpersonal interaction, such as non-store retailers and professional services, were significantly correlated with the economic resilience of U.S. regions [17]. Conversely, using the geodetector model, Hu found that the tertiary industry had a negative effect on the resistance of Northeast China contrarily, and the impact of industrial diversity and economic openness was also negative [38]. Li’s study on resource-based cities in China reached the same conclusion [40]. Considering that the pandemic did not occur simultaneously in different cities and spread from city to city, it also highlighted that, when we look into economic resilience under the pandemic, spatial non-stationarity and dependence issues may exist in economic resilience under the impact of such risks. Therefore, it is of theoretical and practical significance to study the mechanism of influencing factors from the perspective of spatial heterogeneity.
Taking the COVID-19 pandemic as an external shock, the study aims to make up for the research gaps mentioned above. We selected 27 central cities in the Yangtze River Delta, China, as the case study area. The research duration was extended for the first time, spanning from the first quarter of 2020 to the fourth quarter of 2022 (hereinafter referred to as 2020Q1–2022Q4), which corresponded to the initial large-scale outbreak of the pandemic to the adjustment of the “10 new measures” pandemic prevention policies. We applied the SARIMA time series model to predict the assumed GDP growth curve. On this basis, the performance curve model was used to measure economic resilience dynamically. We used geographically weighted regression to explore the core influencing factors and the spatial heterogeneity of their effects. This paper aims to enrich the study of economic resilience under different risks, and provides strategies for urban economic resilience improvement and sustainable development in the post-pandemic period. Several questions are raised as follows: (1) What are the temporal and spatial characteristics of the economic resilience among cities in the Yangtze River Delta under COVID-19? (2) Are the performance and influencing factors of economic resilience under the pandemic consistent with those under other risk contexts, and is there spatial heterogeneity in the effects of the same factors in different regions?
The remainder of this paper is as follows: Section 2 introduces the study area, research methodology, index selection, and data sources. Section 3 presents the results of the empirical analysis, including the performance and determinants of economic resilience. Section 4 discusses the theoretical and practical significance of this study, and proposes suggestions for economic resilience improvement policies. Section 5 concludes the main research results, and proposes the limitations and future research prospects.
2. Materials and Methods
2.1. Study Area
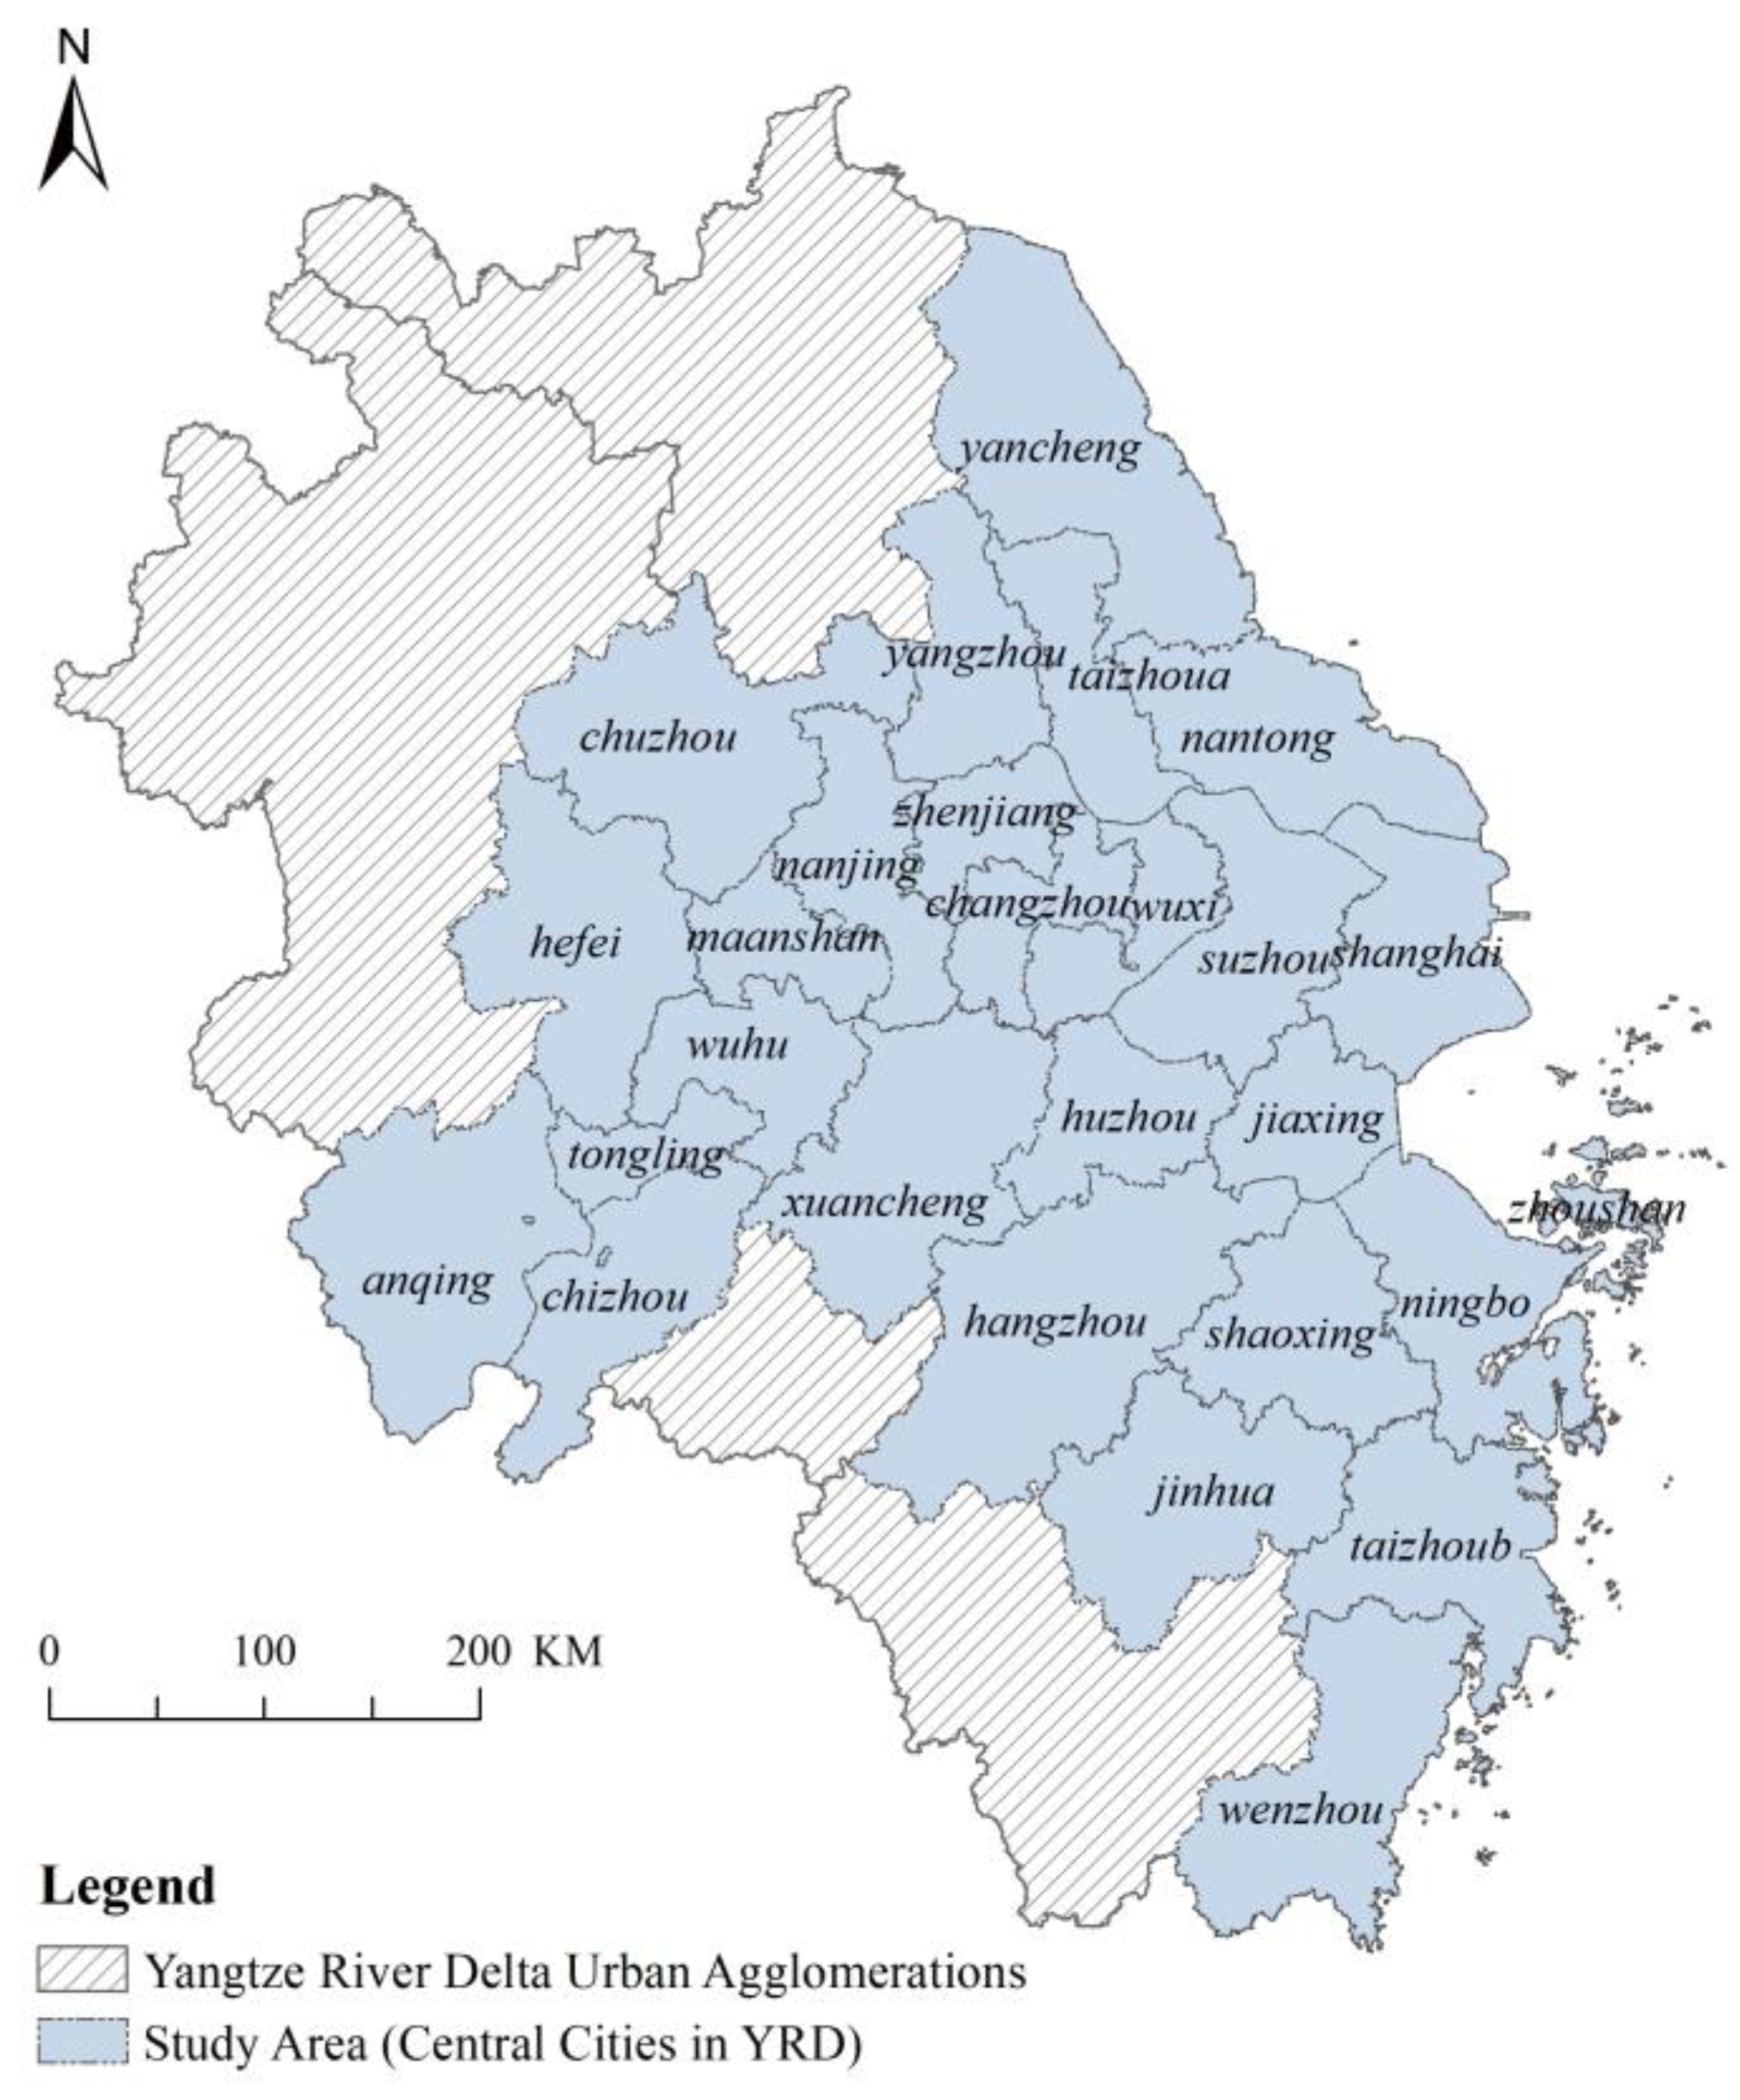
The Yangtze River Delta (hereinafter referred to as the YRD) region is one of the most economically active, open, and innovative regions in China. It has one-sixth of China’s population and one-quarter of its GDP, according to statistics from 2022. We selected cities in the YRD as the study area because the YRD has always been the representative research object in economic resilience research for its high economic vulnerability and high resistance and adaptability [29,44,45,46]. Compared with other regions in China, the YRD has high economic density, frequent population mobility, and fast factor flow. The external-oriented development pattern also makes it more vulnerable to external shocks while deeply rooted in the global value chain. It means a significant risk can cause a high probability of loss and damage. But in turn, the economic dynamism, optimized industrial structure, and advanced governance also make it more adaptable to risks. Current studies focusing on long-term risks or targeting sustainable development have formed a consensus that the YRD has high resilience [47,48]. However, in the context of COVID-19, the risks are further intensified. For example, frequent population mobility brings more potential risks to cities, while the cost of controlling the spread is high. Whether cities can maintain high resilience is not clear yet. Studying the YRD can give us a deeper understanding of economic resilience, maintenance, and improvement.
According to the Outline of the Integrated Regional Development of the Yangtze River Delta (hereinafter referred to as Outline) issued in 2019, the central area of the YRD region includes Shanghai, Nanjing, Wuxi, Changzhou, Suzhou, Nantong, Yancheng, Yangzhou, Zhenjiang, Taizhou in Jiangsu Province, Hangzhou, Ningbo, Wenzhou, Huzhou, Jiaxing, Shaoxing, Jinhua, Zhoushan, Taizhou in Zhejiang Province, Hefei, Wuhu, Ma’anshan, Tongling, Anqing, Chuzhou, Chizhou, and Xuancheng in Anhui Province. This study takes the 27 central cities above as the basic research unit (See Figure 1).
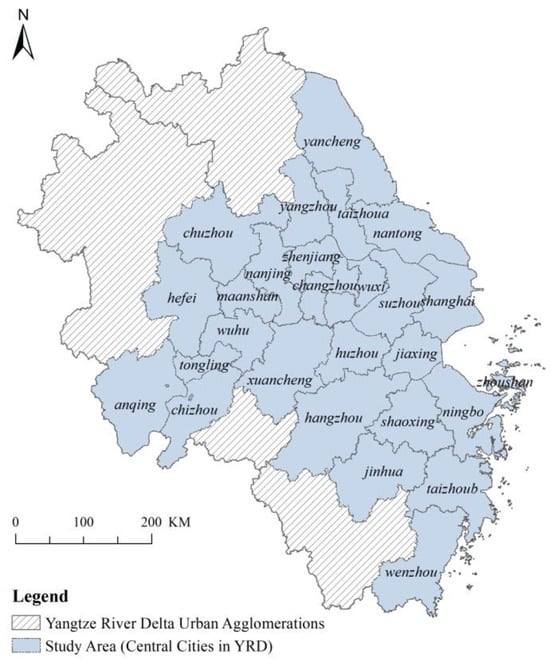
Figure 1.
Study area.
2.2. Research Methodology
2.2.1. Regional Economic Resilience Measurements
- Seasonal ARIMA model
Box and Jenkins first introduced the autoregressive integrated moving average (ARIMA) model in 1976 to model time series data and forecasts [49]. It requires data stationarity. If the time series includes trend and seasonality, it is ideal to add seasonal components into the ARIMA model, that is, the seasonal ARIMA (SARIMA) model. The model is written as follows:
where the parameters are the non-stationary order, which represents the order of autoregression (AR), difference, and moving average (MA), respectively. The parameters refer to the seasonal part, which represents the order of seasonal autoregression, period-by-period difference, and moving average, respectively. is the number of periods in a season.
In this paper, we select quarterly GDP as the proxy variable for resilience measurement. Since quarterly GDP exhibits both temporal trends and seasonal cyclical fluctuations, the SARIMA model is more appropriate than other time series models. Applying this model to predict the assumed growth curve can also overcome the shortcomings of the “simultaneous ratio” method in previous studies.
- 2.
- Performance curve model
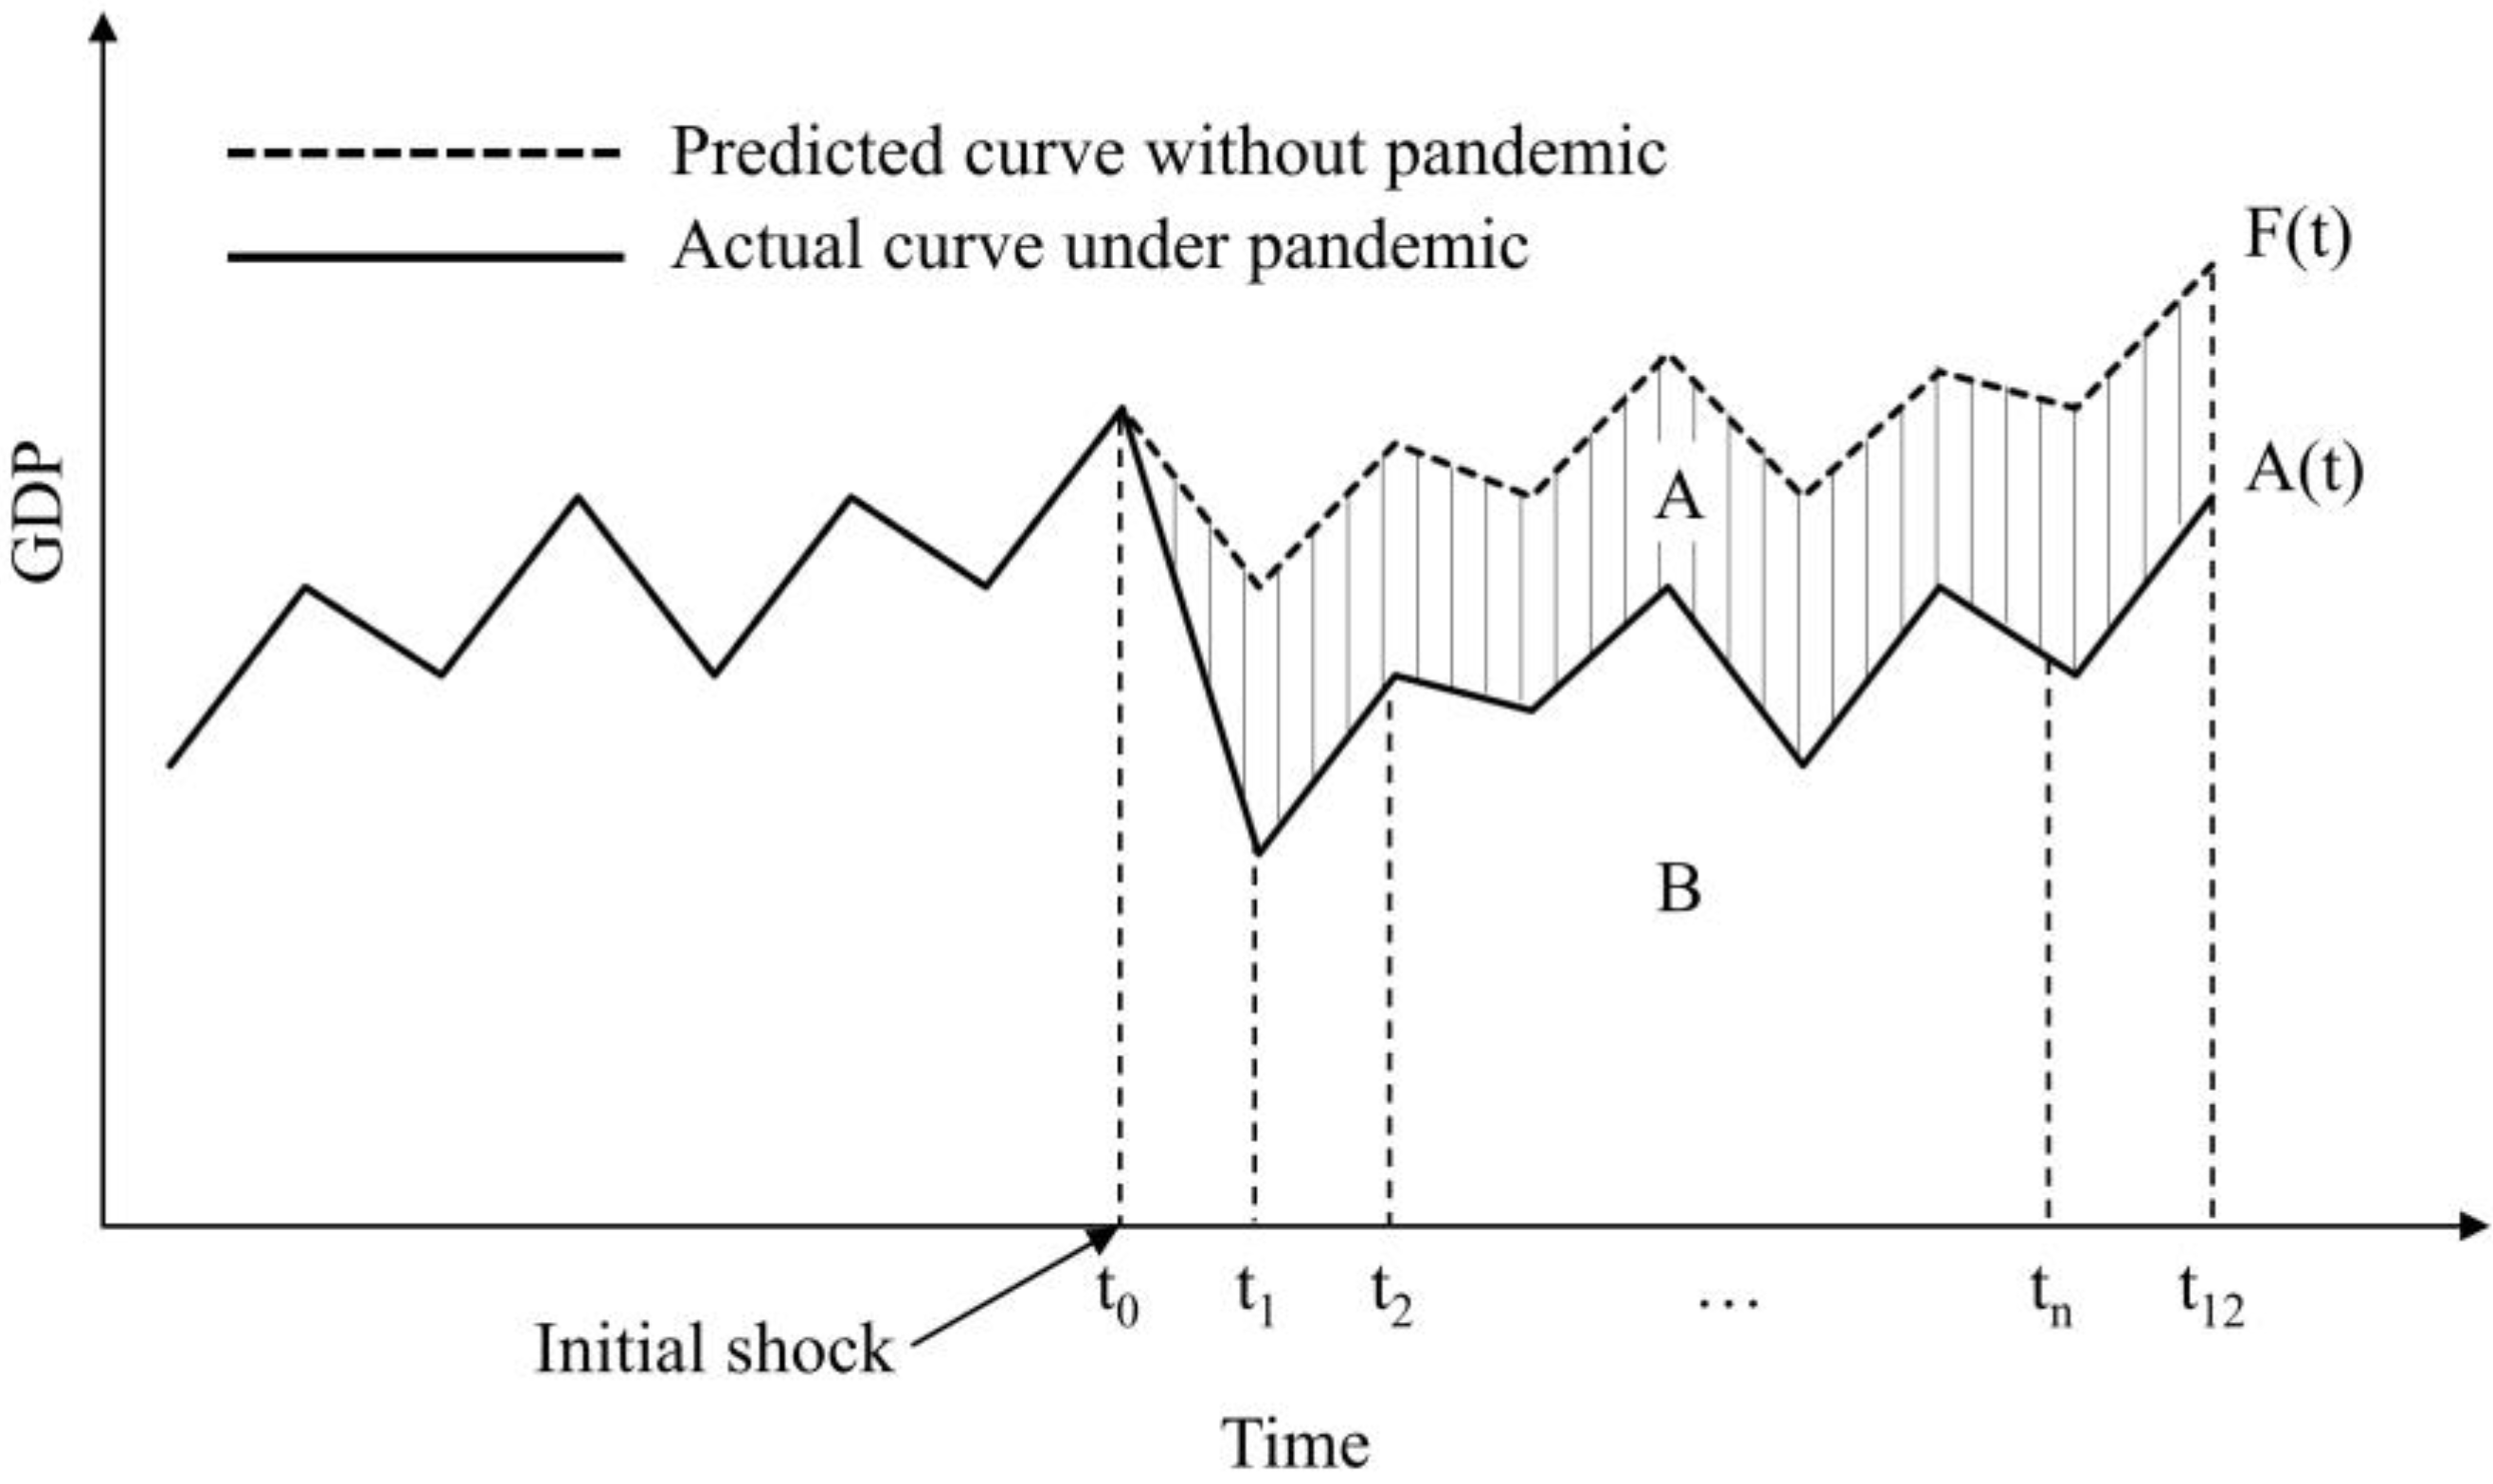
Since the impact brought by this public health emergency has a long recovery time, and the process was several big hits including many small impacts, we used the performance curve model to reflect the dynamic performance evolution of the system better. This approach is common in the study of infrastructure resilience, focusing on the performance loss and recovery time of infrastructure systems after disasters. Bruneau and Reinhorn proposed a function curve for the recovery of performance level to its original state after an earthquake [50]. Cimellaro et al. added the case of over-recovery or failure [51]. Both described the resilience of the area enclosed by the performance curve and the horizontal and vertical coordinates. They neglected the fact that the original performance level of each system and the impact degree are different. Ouyang improved on this model, emphasizing that resilience should be characterized by the ratio of the area enclosed by the disturbed performance curve and the time axis to the enclosed area under normal operation [52]. Zhou et al. applied this method to the economic resilience assessment in post-earthquake disaster areas, using GDP as the performance index of the economic system [53]. In this paper, we construct an economic resilience curve model based on the economic system, using the ratio of the time integral of the actual and forecast quarterly GDP curve. The formula is as follows:
where is a point in time, (i.e., 2019Q4, 2020Q1, 2020Q2, …2022Q4), represents the growth curve without the pandemic forecast from SARIMA, and represents the actual quarterly GDP curve after the pandemic (See Figure 2). The value indicates the extent to which the local economy has recovered from the shock. The larger the value, the higher the level of economic resilience. indicates that the city has overcome the pandemic impacts and returned or transcended to its original growth rate, while indicates that it has not fully recovered from the shock and the pandemic has affected its long-term growth.
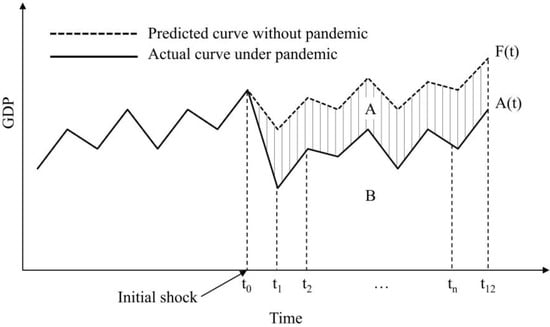
Figure 2.
Economic resilience measurement based on the economic system performance curve.
2.2.2. Analysis of Influencing Factors
- Geodetector model
Geodetector is a statistical tool developed by Wang et al. to detect spatial differentiation of geographical phenomena and reveal the driving force behind it [54]. Compared with other statistical methods, such as linear regression, geodetector has fewer assumptions and can detect a variety of different forms of data. It has been widely used in natural ecology and social economy research. The latest study from Zhang et al. established an explicit connection between the q-statistic in geodetector and the R-squared in the linear regression model [55]. In this paper, we use the factor detector of the geographic detector model to identify the main explanatory factors affecting regional economic resilience. The calculation model is as follows:
where is the explanatory power of the factor X, . The larger the value, the stronger the explanatory power of the factor for the spatial differentiation of economic resilience. is the code of each variable; is the category divided by factors; and are the sample size and the number of each unit; and are the variances within the class and globally; and and are the sum of the variances within each category and the total variances in the whole domain, respectively.
- 2.
- Geographically weighted regression model
For the resilience index with significant spatial clustering, spatial non-stationarity should be considered. The geographically weighted regression model (GWR) is selected. GWR is an extension of the OLS model. The spatial weight matrix is added to the model to perform a local parameter estimation for each location observation point within a nearby range, and the regression coefficient of the independent variable changes with the geographical location [56]. Due to the possible spatial agglomeration of economic resilience, this paper uses the GWR model to identify the local spatial heterogeneity of different influencing factors. The formula is as follows:
where represents the geographic coordinates of the sample , represents the regression coefficient of the independent variable in space , and is the intercept. The spatial weight is calculated according to the spatial kernel function. This paper chooses the Gaussian kernel function, which performs better when dealing with continuous variables. Bandwidth is the coverage of the kernel function. It controls the smoothness of the model and significantly impacts the parameter estimation. The bandwidth in this paper is determined according to the Akaike information criterion (AIC) value.
2.3. Index Selection and Data Sources
Referring to Martin’s analytical framework and the characteristics of the pandemic, we selected the influencing factors from five dimensions: economic structure, labor environment, financial support, government management, and pandemic factors. Then, we further selected the variables considering the relevant literature research and data availability (Table 1). The regional economic structure can directly reflect the economic operation, and affect the degree of impact and the ability to recover and adapt. We selected the contribution rate of tertiary industries, related variety, foreign trade dependence, and the innovation level to reflect it. The labor environment is about social stability in the context of shocks for its impact on employment: wage losses, the failure of job maintenance, and an inadequate labor force to put into production [57]. To reflect this dimension, we selected the labor supply level represented by the unemployment rate. Financial support can help enterprises withstand shocks through loans to maintain supply chain stability and help consumers share risks through savings and stimulate consumption [58,59,60]. In terms of financial support, financial efficiency represented by the loan-to-deposit ratio of financial institutions is selected. Government management was strongly related to economic resilience, especially in the context of COVID-19, whether it was the control policy in the early stage or the work resumption and economic boost measures in the later stage [30,61]. The share of public health expenditure and the fixed-asset investment were selected. In terms of pandemic factors, the number of days with more than ten new cases was selected to represent the pandemic severity. The growth rate of industrial electricity consumption was selected to represent the tempo of work resumption. The variance inflation factor (VIF) was used to detect the multicollinearity in the regression analysis. The VIF values of the above ten variables are lower than 7.5, passing the multicollinearity test.

Table 1.
The index system of influencing factors of economic resilience.
The regional quarterly GDP data from 2010 to 2022 used for forecasting were derived from the progress data version of the China City Statistics Database and the quarterly reports of the municipal statistical bureaus. In terms of data processing, the cumulative accounting of quarterly GDP was separated, and longitudinal comparability was maintained to eliminate the impact of prices. In this practice, we took the real GDP of 2000 as the base period and converted the nominal GDP of each city into constant prices GDP, using its province’s GDP deflator.
The socio-economic data involved in the influencing factors are from the 2020–2021 China City Statistical Yearbook and the statistical yearbooks and bulletins of each city. The pandemic data come from Sina News and the Municipal Health Commission (statistical time: 2 January 2020–15 December 2022)
3. Results
3.1. SARIMA Model Construction
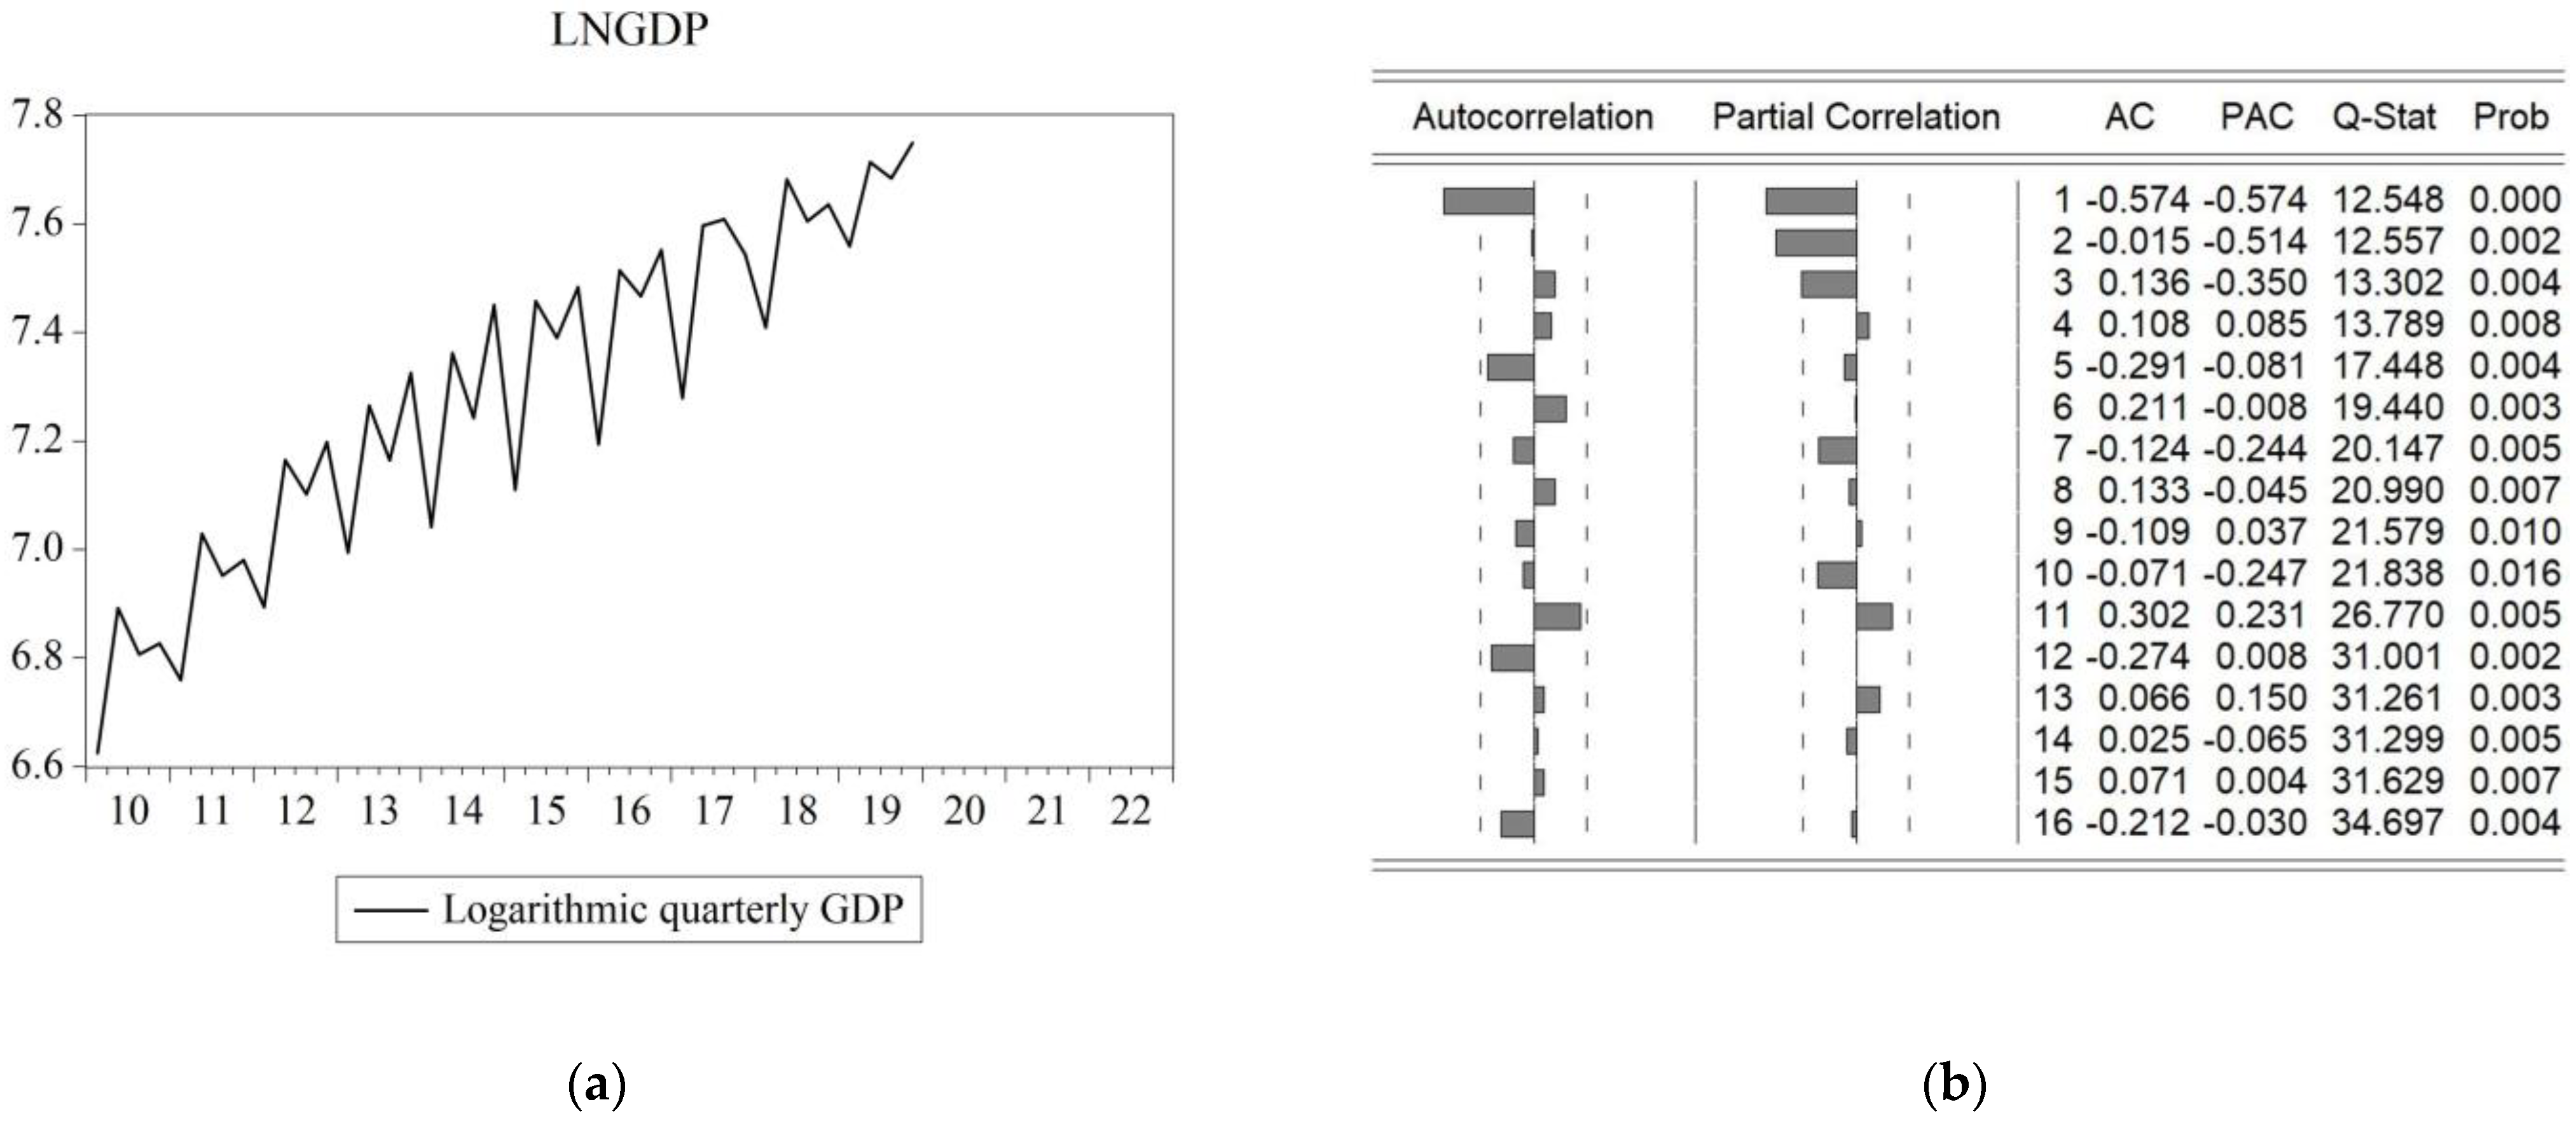
Take Nanjing as an example. First, we obtained Nanjing’s quarterly GDP from 2010Q1 to 2019Q4, took a logarithm, and established a time series. As Figure 3a shows, it has obvious seasonality and trends. Therefore, a new nonstationary sequence was obtained by first-order period-by-period difference and first-order seasonal difference. It passed the unit root test, so we received parameters d = 1 and D = 1. Observing the characteristics of the autocorrelation (AC) and partial autocorrelation (PAC) graphs (Figure 3b), we compared the most likely model to decide the possible value of parameters p, q, and P, Q, and finally picked the model according to the AIC and adjusted R2 values. The AIC was −3.13 and the adjusted R2 was 0.53. The model was used to make static predictions of the 2012Q3–2019Q4 values. The prediction results were well-fitted with the true values, and the mean absolute percentage error (MAPE) was 3.77. After testing, most cities fit the model well, and some parameters were adjusted for Tongling and Chuzhou with unsatisfactory effects to reduce the error rate. The error rates for all cities are shown in Table 2. Finally, the GDP of 2020Q1–2022Q4 was predicted dynamically by this model (Figure 3c).
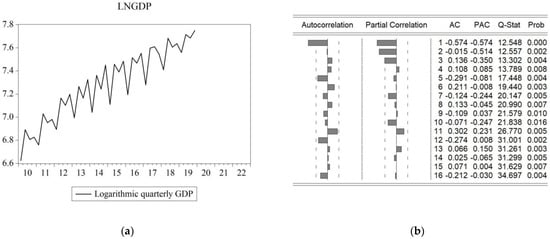
Figure 3.
Sample: SARIMA prediction modeling of Nanjing: (a) the time series of logarithmic quarterly GDP from 2010Q1 to 2019Q4; (b) the autocorrelation and partial autocorrelation graphs; (c) the fitting of the predicted value to the observed value.
Table 2.
SARIMA model fitting evaluation for each city.
3.2. Spatiotemporal Distribution Characteristics of Economic Resilience
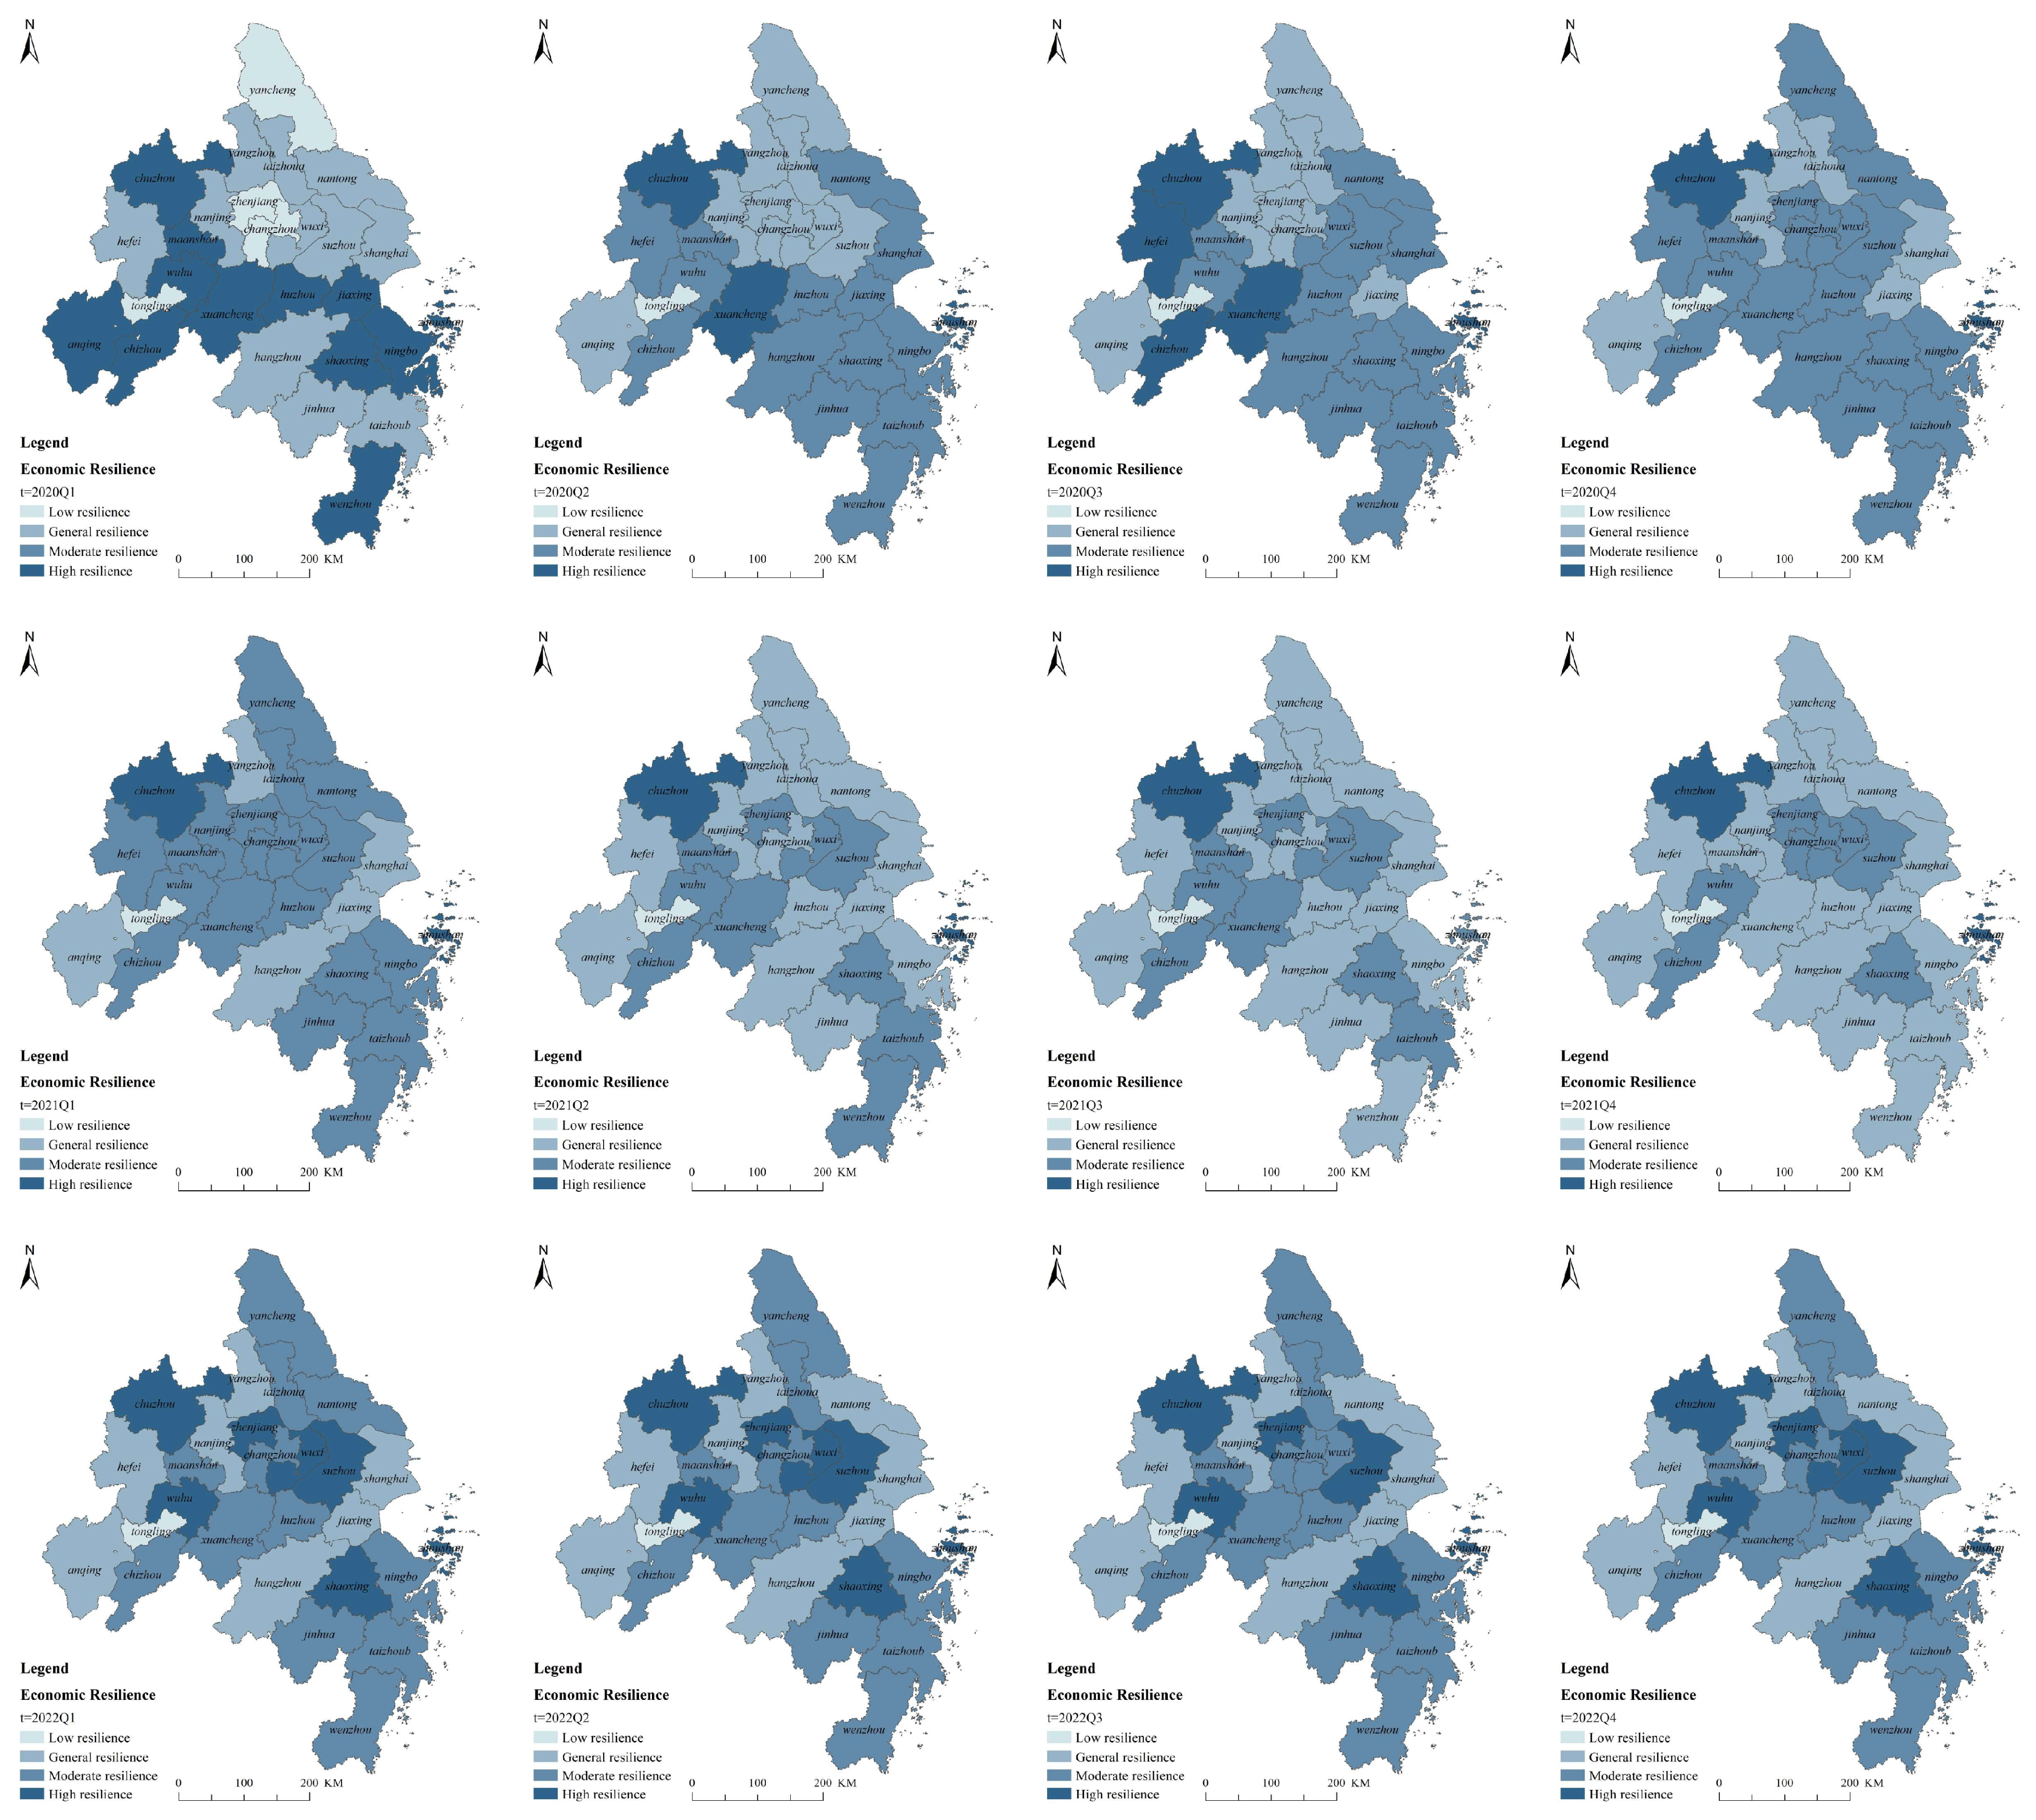
According to Formula (2), we calculated the changes in economic resilience of 27 cities on a period-by-period basis and visualized the results with ArcGIS 10.2 (Figure 4). Table 3 presents the results by province. From the global level, most of the cities were still in a sustained state of damage in 2020Q2, gradually recovered from 2020Q3, and reached the peak of the overall recovery in 2021Q3. The resilience level gradually increased since 2020Q3, reaching the peak of overall recovery in 2021Q3. Afterward, affected by a new wave of shock, some cities’ resilience levels declined again, while the high-resilience cities remained stable, indicating their sustained momentum. As shown in Table 4, by 2022Q4, only 8 cities got a resilience score over 1. They were: Zhoushan, Chuzhou, Suzhou, Zhenjiang, Wuhu, Shaoxing, Wuxi, and Changzhou. It means only these cities have made up for their losses and achieved new growth after the pandemic, while other cities are still in the process of stop-loss recovery.
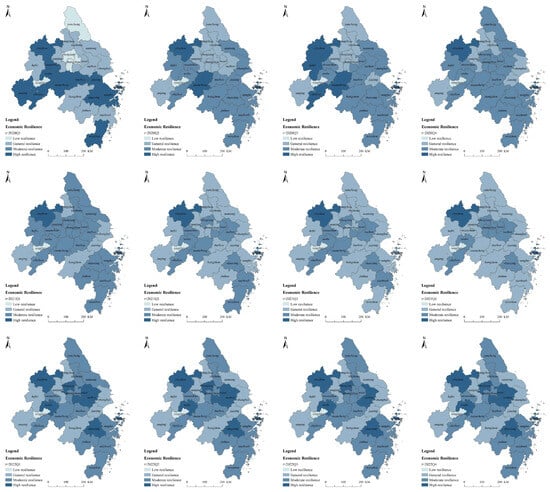
Figure 4.
Spatial-temporal distribution of economic resilience.
Table 3.
Results of economic resilience measurement by province.
Table 4.
Results of economic resilience measurement (t = 2022Q4).
From the perspective of spatial correlation, the global Moran’s I = 0.209 (z = 2.173) in 2022Q4. There is a significant spatial positive correlation, and the cities with high economic resilience are concentrated in southern Jiangsu Province, including Zhenjiang, Suzhou, Changzhou, Wuxi, Taizhou, etc., and form “sunken areas” in Yangzhou and Nantong. Low-resilience cities are located in central and western Anhui Province, such as Tongling and Anqing, forming “hump areas” in the neighboring Wuhu and Chizhou. The spatial distribution is consistent with the results obtained by Cheng and Liu using the index system method [45]. It is worth noting that the core cities of the region, such as Shanghai, Nanjing, Hangzhou, and Hefei, showed poor performance, which is generally different from the conclusions of previous studies focusing on the long-term economic resilience of the YRD [29,46]. It indicates that the special nature of the COVID-19 pandemic and the lack of response experience may lead to failures in urban economic resilience in general, even though they have high innovation levels or advanced industrial structures. In a diffusible crisis, the core cities are more likely to suffer high economic losses due to their close external connection, frequent population mobility, and factor exchange. The severity of the pandemic, in turn, brought more restrictive measures in the subsequent control phase, thus affecting the economic recovery process.
The evolution trend of economic resilience varies from province to province (Table 3). At the beginning of the pandemic, cities in Anhui Province showed a higher resilience level, while cities in Jiangsu and Shanghai were less resilient, mainly related to the extent to which they were directly affected by the pandemic (e.g., the number of cases). However, as the course of time drags on, the downward trend in Anhui becomes more obvious, which confirms that the economic impact of the pandemic is not isolated and short-run, but transitive and long-term [35]. Since most of the leading industries in Anhui cities are downstream of the industrial chain, the economic impact of the upstream cities will have a lagging but profound impact on them. The relatively primary industrial structure and poor innovation capability result in the lack of redundancy in the economic system. This also leads to the lack of source power to revive, restructure, and seek new development opportunities, constraining sustainable development [62]. On the contrary, Jiangsu experienced a long and severe period of damage, but quickly improved to keep pace with Zhejiang in 2021Q2. It ultimately caught up with Zhejiang after 2021Q4, showing that Jiangsu promoted the work and production resumption and actively sought a development path adjustment. The resilience variation trend of Zhejiang is relatively stable, reflecting its robustness and adaptability to respond to diversification risks and maintain long-term growth. As a whole, compared with the steady improvement in the previous period, the change in economic resilience value flattened and showed a slight downward trend after 2022. Although the current measures to boost the economy have produced positive effects, we should be aware that they have also shown some marginal effects. Therefore, further exploration of influencing factors will be carried out to provide a reference for the strategies of economic recovery and resilience improvement in the post-pandemic era.
3.3. Spatial Heterogeneity Analysis of Influencing Factors
3.3.1. Selection of Main Explanatory Factors Based on Geodetector
Since the geodetector was more suitable for analyzing type variables, the quantile classification method was used to divide every continuous independent variable into four categories, and the economic resilience of each city was used as the dependent variable to calculate the explanatory power of each factor.
The q-values of each factor are shown in Table 5. The top five factors are: fixed-asset investment (X8, government management dimension, 0.460) > related variety (X2, economic structure dimension, 0.223) > labor supply level (X5, labor environment dimension, 0187) > foreign trade dependence (X3, economic structure dimension, 0.179) > innovation level (X4, economic structure dimension, 0.124). It shows that the government management factor is the most critical to economic resilience under the public health emergency risk, much more than other factors. Economic structure factors play a role in many aspects, including diversification, innovation, and openness. Economic resilience also relies on a stable labor environment. However, the attributes of the pandemic itself are not obvious when considering a longer duration. The endowments of the region are more important instead.
Table 5.
Factor detection results of geodetector.
3.3.2. Spatial Difference Analysis of Influencing Factors Based on GWR
Taking the above five factors as independent variables, the GWR model was constructed to explore its effect and spatial heterogeneity from a local perspective. The goodness of fit of the model is 0.670. The standard residuals are all in the range of . Based on the standard residuals of each city, the spatial autocorrelation test is carried out and gets Moran’s I = 0.07 (p = 0.714), which means the residuals were distributed randomly. The above examinations show that the model is effective and that the results of the geodetector are reliable.
In Table 6, quantile statistics on the coefficients of each explanatory variable show that the effects of each variable vary significantly in different urban units. In terms of median and average values, foreign trade dependence, innovation level, and labor supply level (a negative indicator) are positively correlated with economic resilience, while the dominant effects of related variety and fixed-asset investment are negative.
Table 6.
Coefficients quantile statistics of GWR model estimation.
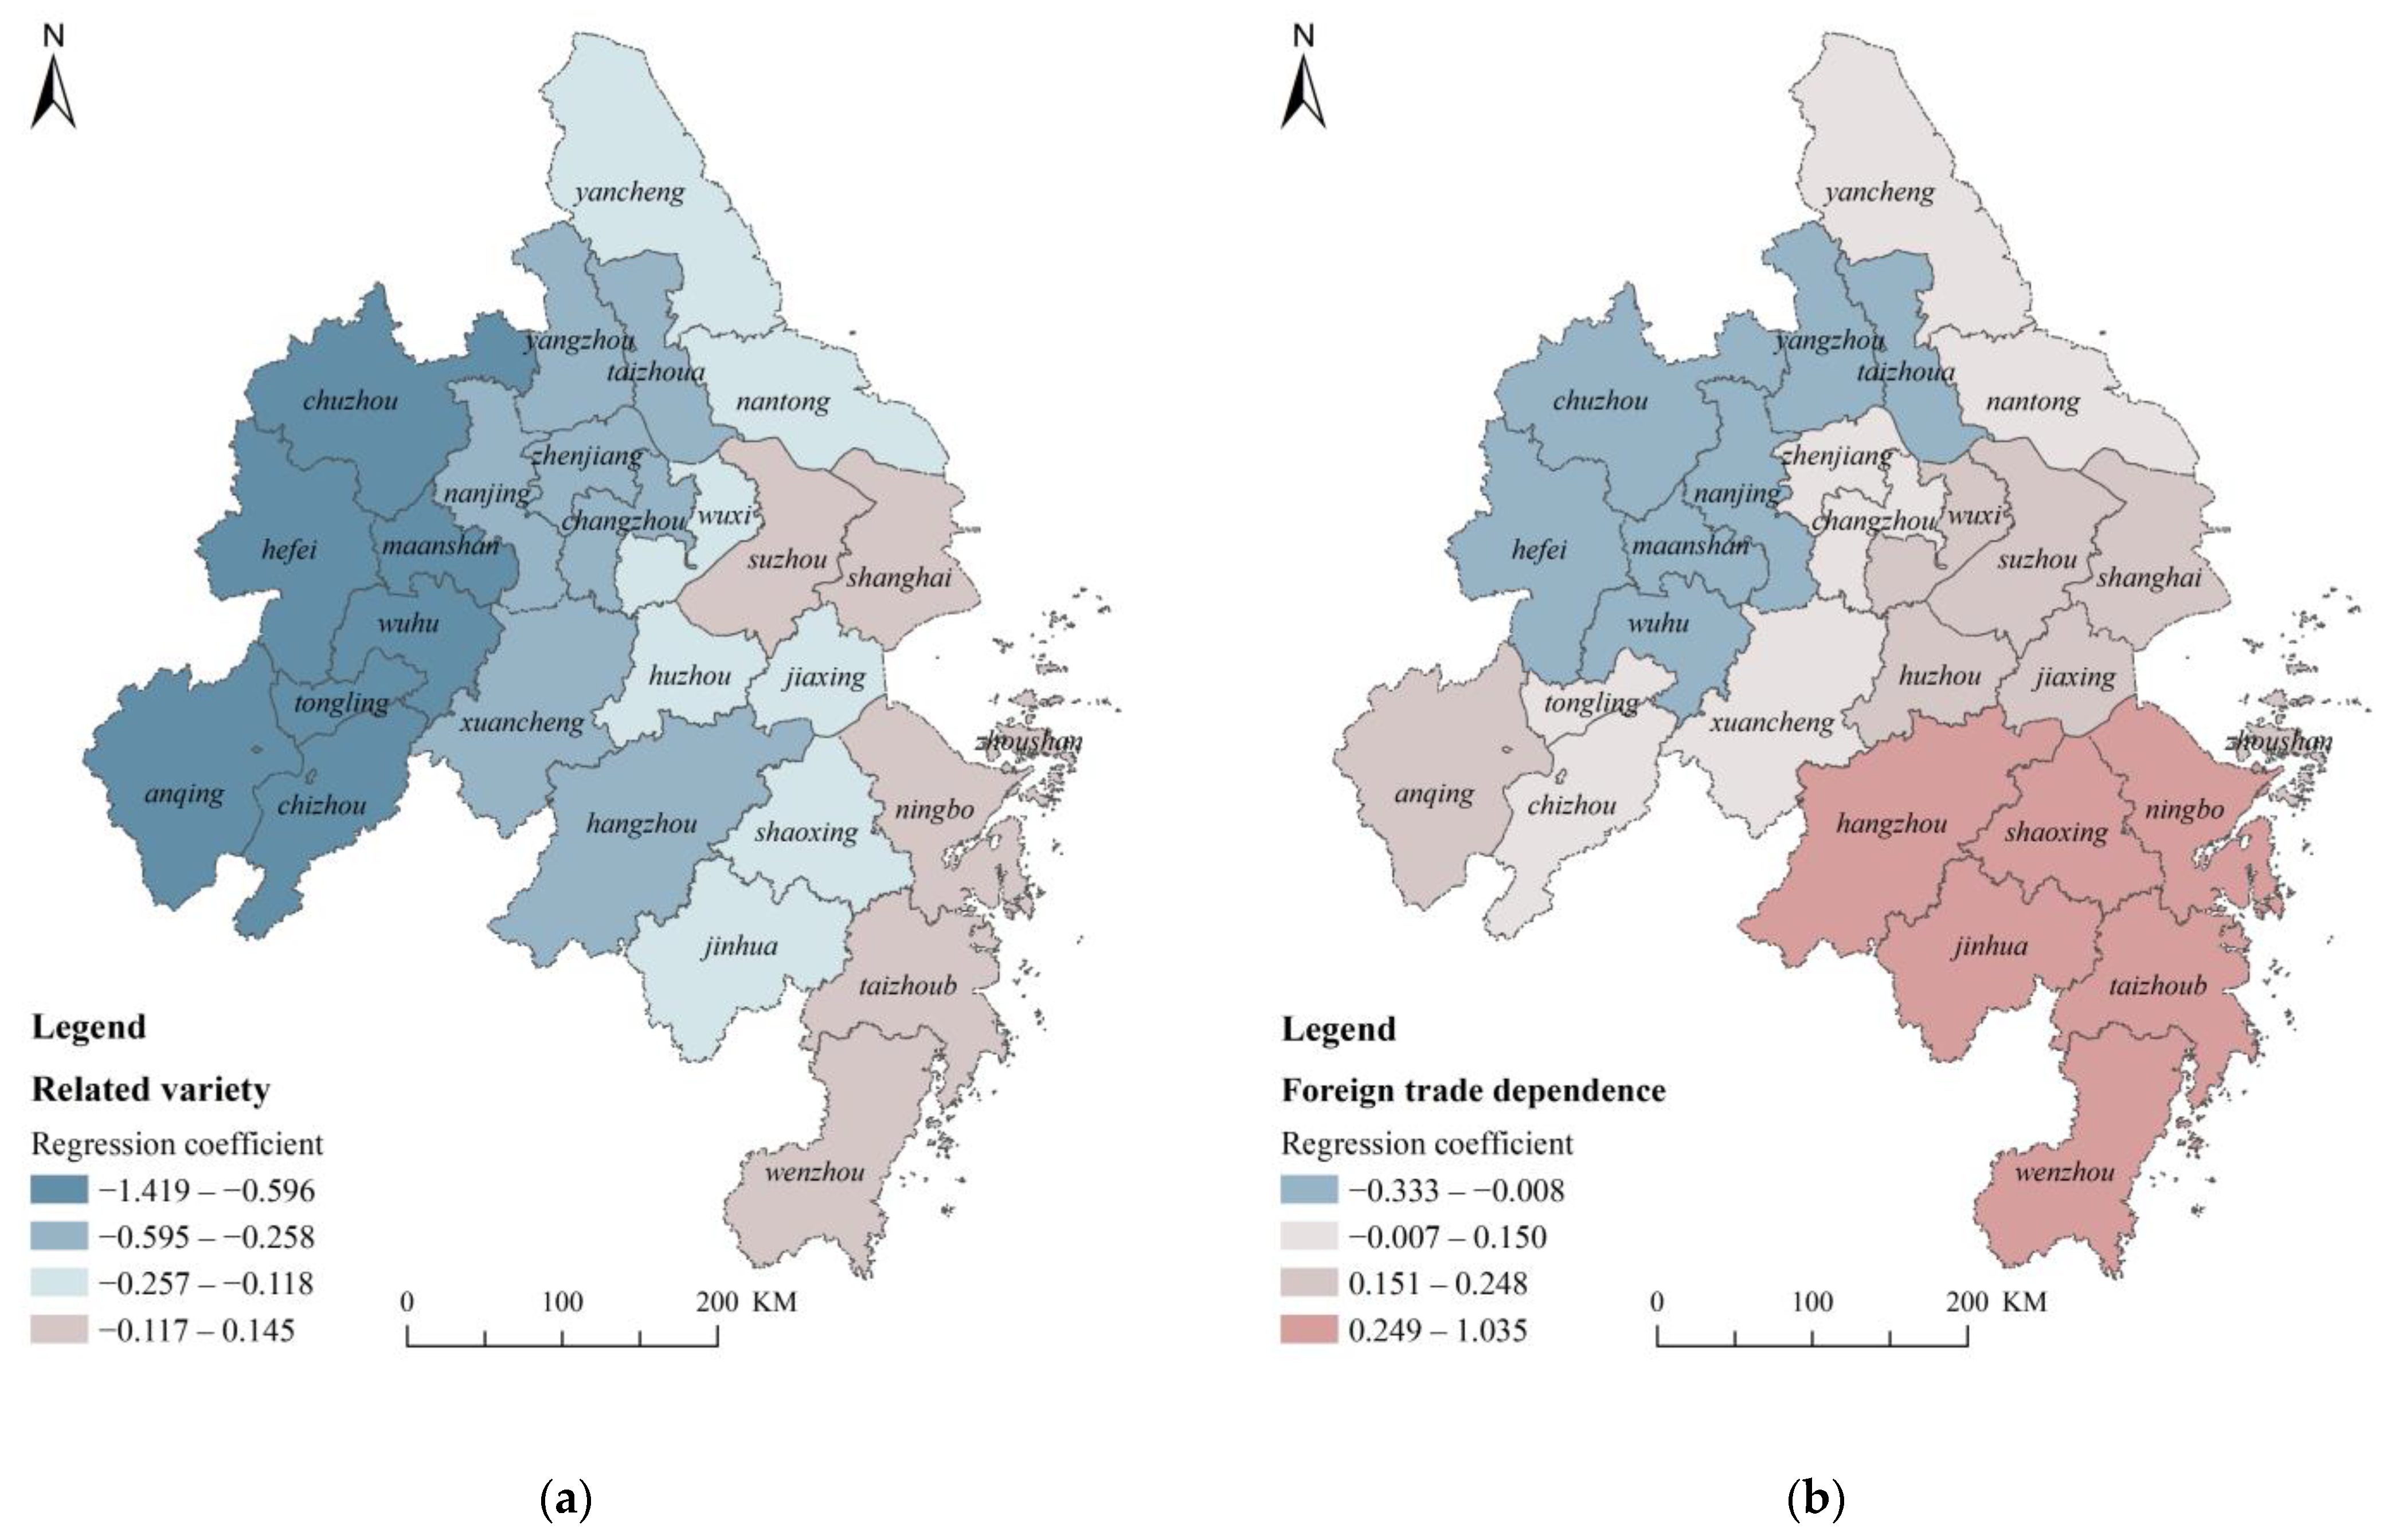
Figure 5 visualizes the spatial distribution of the regression coefficients of these factors.

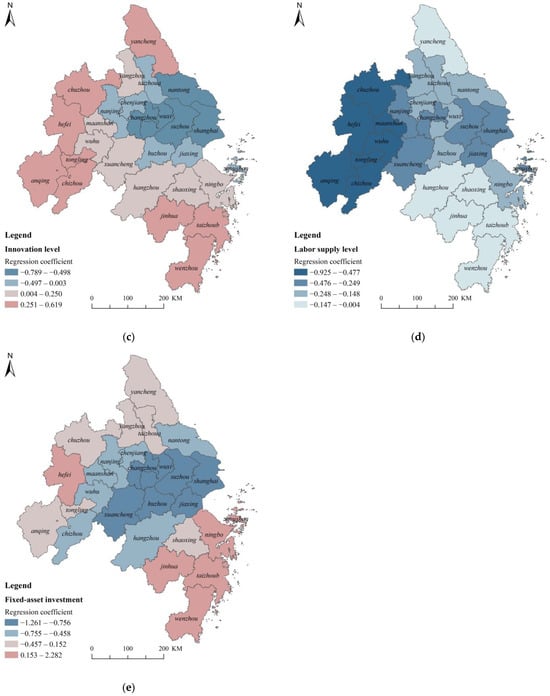
Figure 5.
Spatial distribution of regression coefficients of influencing factors in GWR model. (a) Related variety; (b) foreign trade dependence; (c) innovation level; (d) labor supply level; (e) fixed-asset investment.
- Related variety
Related variety has negative effects on the economic resilience of most cities in the YRD; that is, improving related variety does not always contribute to the promotion of resilience. This is contrary to the common view of previous studies that related variety can balance the high economic efficiency of specialization with the ability to spread economic risks of diversification, thus forming strong economic resilience [5,18].
Combining the spatial distribution of regression coefficients (Figure 5a) can help understand this finding. The regression coefficient of each city increases from the west to the east. It has positive effects on coastal cities such as Shanghai, Suzhou, and Ningbo, but negative effects on most cities in the Anhui Province. The reason lies in the difference of leading industries in various regions. Most of the leading industries in Anhui are low-value and labor-intensive. Thus, the high related variety easily leads to industrial isomorphism, path dependence, and lock-in. Therefore, such cities need more unrelated industries, especially knowledge-intensive and emerging industries, to promote the adaptation and renewal of the region under risk. As a comparison, the leading industries in the eastern cities are capital- and technology-intensive, and the risk transmission of related industrial chains after disturbance can be alleviated to some extent. So, enhancing their related variety can make it easier to leap into a new development path through knowledge complementarity and cooperative innovation. In addition, Guo et al. found that with the improvement of regional innovation level, the effect of related variety on regional economic resilience turns from negative to positive [63]. Our findings echo this. The knowledge, technology, and labor quality of Anhui cities are lower than those in the eastern region. It is difficult to support the transformation and upgrading of industrial structure and the transfer of labor force between industries, which inhibits the positive effects of related variety.
- 2.
- Foreign trade dependence
Foreign trade dependence has a positive effect on the economic resilience of most cities. Figure 5b shows that the regression coefficient increases from northwest to southeast, and the negative effects mainly occur in Anhui and adjacent cities in Jiangsu, centered on Chuzhou and Ma’anshan. The common characteristics of the foreign economy of these cities are the higher proportion of processing trade in the trade structure, and that most of them are embedded low-end into the global value chain, so they are more sensitive to external risks. Although the eastern coastal cities have a higher foreign trade dependence, their more rational trade structure, more diversified trading partners, and a broader and stronger domestic market provide redundant opportunities for resistance and recovery under risks. These advantages also explain why the results of this paper are contrary to the conclusions of Eraydin’s study on Turkey and Hu’s study on northeast China [28,38]. For example, in Zhejiang Province, where the positive effect is most obvious, the import and export trade structure is dominated by general trade rather than the processing trade, which has been hit hard by the pandemic. It helps cities to mitigate the risk. Meanwhile, cross-border e-commerce transactions also account for a considerable proportion of the total imports and exports in cities like Hangzhou and Ningbo. In the third quarter of 2020, the growth of national import and export trade volume turned negative to positive; cities with high economic openness promoted the positive effect against the trend by mobilizing the “double cycle” of domestic and foreign markets, mainly manifested as the export of pandemic prevention supplies, work and production resumption to make up the supply gap, and the accelerated development of cross-border e-commerce.
- 3.
- Innovation level
Figure 5c shows that the positive and negative effects of innovation level on the economic resilience of YRD cities are equally distributed. With Shanghai and Suzhou as the low-value centers, the coefficient increases outward in a circular way. Innovation level has a positive effect on the economic resilience of Anhui and Zhejiang cities. Interestingly, the low-value area city overlaps highly with the Shanghai Metropolitan Area city. A possible explanation is that, as a global science and technology innovation center, Shanghai’s innovation-driving role in surrounding regions has matured, and the spillover effect of innovation improvement on economic resilience is somehow limited. For the regional peripheral cities, such as Hangshaoyong, Hewuma, and other surrounding small metropolitan areas, the marginal benefits of improving innovation on economic resilience will be more significant.
- 4.
- Labor supply level
The regression coefficient of the labor supply level is negative in the whole region (Figure 5d). As the urban registered unemployment rate is a negative indicator, it shows that sufficient labor supply and a favorable labor environment will promote regional economic resilience. In the context of the pandemic, stabilizing employment should be an important task for the whole region. Keeping employment stable should be an important task for the whole region to make a concerted effort during the pandemic. The regression coefficient increases from the central part to the north and south. The low-value areas are mainly distributed in Anhui, while Zhejiang is not sensitive to changes in labor supply level. Compared with other provinces, the high urban unemployment rate in Anhui is an important explanatory factor for the low economic resilience. On the one hand, the pandemic aggravated the unemployment risk. On the other hand, the continuous population outflow also indicates the need to improve the labor environment. Therefore, it is necessary to adopt a series of measures to assist enterprises, stabilize the employment situation, and accelerate recovery from the crisis.
- 5.
- Fixed-asset investment
Fixed-asset investment is the indicator with the greatest regional heterogeneity (Figure 5e). It corresponds with the highest explanatory strength that the geodetector shows, emphasizing that government management plays an important role in the resistance and recovery from the pandemic. This is consistent with the study of Gong et al., that is, the government has adopted a series of fiscal policies to stabilize the market and boost the economy [61]. Investment in fixed assets is a key factor driving regional economic growth. Honig’s empirical evidence in the context of the financial crisis also suggested that improvements in government quality could reduce the frequency of sudden stops in capital inflows and operations [64].
The positive effect area includes eastern Zhejiang and the cities surrounding Hefei, whose fixed-asset investment growth rates are all around 4% to 5%. The values of cities in the negative effect area, such as Xuancheng and Huzhou, are generally high, above 6%. It indicates that the high growth rate of fixed-asset investment does not always mean that economic resilience is elevating simultaneously. Ezcurra pointed out that the higher the government quality, the more resilient the region will be during the Great Recession, and the positive effect is also related to the expenditure structure [30]. The same is true during the pandemic. For example, the high fixed-asset investment growth rate in Xuancheng is mainly driven by real estate and infrastructure investment, which are not necessary for resilient development and do not contribute to the SDGs. To enrich the medical resources to cope with the peak of the pandemic, Shanghai sharply increased public health investment. It is necessary and understandable, but limited investment in industrial sectors directly affects economic growth. It is necessary to balance investment structures in time when the pandemic is under control. This puts forward more precise and flexible requirements for government governance quality.
4. Discussion
The all-round impact of the public health emergency on the local economy reminds us that, in addition to natural disasters and financial crises, more risks are bringing about hidden worries to the regional economic system. The empirical analysis in this paper has theoretical and practical value for the study of economic resilience. Firstly, while many scholars have expressed concern about economic resilience in the face of COVID-19, their research primarily focused on the short-term process around 2020. This paper draws on the performance curve method from the infrastructure field to explore a dynamic economic resilience measurement method that covers the whole process of the pandemic, which extends the span of the current research and can also reflect the economic fluctuations affected by the multi-wave pandemic. It can be extended to the study of other risk sources with strong burstiness and long duration.
Secondly, current studies have found that under different shock backgrounds, regions, or economic cycles, the mechanism of influencing factors will change. Moreover, even under the same shock, the effect of the same factor varies in different regions. Considering the spatial characteristics of the pandemic, for instance, it may not occur in different cities simultaneously, and it will transmit and spread among cities. To analyze the spatial heterogeneity and dependence of economic resilience during the pandemic, this paper combines the geodetector and GWR model to analyze the spatial distribution of the effect of the core explanatory variables, which provides a new perspective for the study of regional economic resilience, and inspires us to conduct more refined comparative studies. It also points out that it is necessary to identify the core influencing factors and the current shortcomings. The combination of both will help to make the policy-making more targeted and effective.
Based on the principles above, we make several policy implications aimed at improving economic resilience, as shown in Table 7. Concerning the division of metropolitan areas in the Outline and the spatial distribution pattern of GWR results, we divide the study area into six subregions: Shanghai and its surrounding areas, Nanjing and its surrounding areas, northern central Jiangsu, Hangzhou and eastern Zhejiang, Hefei and its surrounding areas, and southwest Anhui. Then, we summarize the regression coefficient value of the influencing factors in each region calculated using GWR, and divide their effects into four levels: positive, strongly positive, negative, and strongly negative. Combining the original data of each factor, representing the region’s current situation, we identify the core influencing factors that are more critical to local resilience or have more promotion space. Finally, we put forward the following policy implications to consolidate or improve economic resilience based on regional development. On the other hand, we also encourage collaboration across regions and cities, such as joint prevention and control during the pandemic, coordinated decision-making on policies, and the sharing of information and experience in resilience promotion, etc.
Table 7.
Policy implications for subregions.
5. Conclusions
Taking the COVID-19 pandemic as a risk source, this paper measures the economic resilience of cities in the Yangtze River Delta from a complete shock cycle and explores the spatial heterogeneity of its influencing factors. The main conclusions are as follows:
- In terms of temporal evolution, from 2020Q1 to 2022Q4, the variation trend of the overall economic resilience in the YRD was from downward to upward to slightly downward ultimately. The performance of different provinces varied. Anhui had a higher resilience level in the early stages, while the resilience of Jiangsu increased rapidly in the middle and late stages, and Zhejiang presented a stable variation trend, reflecting the differences in vulnerability and adaptability among cities. In terms of spatial distribution, the high-resilience cities were concentrated in the southern part of Jiangsu, and the low-resilience cities were mostly located in the central and western parts of Anhui. The poor performance of regional core cities is inconsistent with former studies that focus on long-term economic resilience, suggesting that the specificity of public health risks and the lack of a coping experience can lead to the failure of economic resilience in the general sense.
- In the study of influencing factors, fixed-asset investment, related variety, labor supply level, foreign trade dependence, and innovation level were the leading factors for the economic resilience of cities in the YRD. In contrast, the pandemic factor itself was less important than we thought when considering a longer risk cycle. Further geographically weighted regression results show that there was spatial heterogeneity in the effect of each factor. On the whole, related variety had a negative effect, especially for regions with a high proportion of primary industries in the industrial structure, while in regions with a higher innovation capacity, related variety promoted their resilience. Cities with higher foreign trade dependence were more resilient, but cities at the lower end of the global value chain needed to protect against external risks. Most of the positive areas of innovation level were regional peripheral cities. The cultivation of innovation capability will be a breakthrough for them to enhance economic resilience. The labor supply level played a positive role in the whole region. The stability of employment and adequate social security were the cornerstones of economic resilience. Fixed-asset investment had the highest explanation and regional differences. The positive or negative effect depended on the quality of government governance.
Overall, this paper enriches the study of economic resilience during the pandemic from measurement and influencing factors analysis, and provides strategies for urban economic resilience improvement in the post-pandemic period. But we note certain limitations. Further improvement could be conducted: (1) This study uses GDP as the proxy variable of economic resilience, which has been adopted widely by existing studies. However, GDP does not necessarily give the full picture of economic resilience. Follow-up studies can enrich their measurement dimensions by replacing or increasing core variables such as unemployment rate, export, consumption, night light data, etc. [65,66,67]. (2) This study found that the mechanism of some consensus-influencing factors under other risks changed when it came to public health emergencies, which was related to the particularity of the pandemic. It is worthy of further discussion through the causality test. (3) The measurement of economic resilience in this study is inevitably prone to “bounce back”, from the perspective of equilibrium theory [8]. The results show that most cities have not been fully compensated for the economic losses at the end of 2022, but this does not rule out the possibility of a “bounce forward” to a new path.
Although the COVID-19 pandemic caused economic stagnation, it has also created new opportunities for structural changes in the economy. For example, the smart economy has become a vital acceleration engine for economic recovery and growth in the post-pandemic era. A smart economy can be an innovation and knowledge economy, a digital economy, or a green economy [68], all in line with a high-quality, sustainable development path. With 5G, artificial intelligence, cloud computing, ICT infrastructure, and other tools, the smart economy can help cities resist shocks or adapt quickly to external challenges [69]. Sertyesilisik proposed that a smart, circular, and competitive manufacturing industry is a vital pathway for enhancing the resilience of the global economy [70]. Further studies on regional economic resilience can draw on the adaptive cycle model and co-evolution theory, and pay attention to the adjustment and transformation of the economic development path after shocks through case studies.
Author Contributions
Conceptualization, M.Y.; methodology, M.Y. and G.Z.; software, M.Y.; validation, M.Y.; formal analysis, M.Y.; investigation, M.Y.; resources, M.Y.; data curation, M.Y.; writing—original draft preparation, M.Y.; writing—review and editing, M.Y.; visualization, M.Y.; supervision, G.Z.; project administration, G.Z. All authors have read and agreed to the published version of the manuscript.
Funding
This research received no external funding.
Data Availability Statement
The data presented in this study are available on request from the corresponding author. The data are not publicly available due to privacy.
Conflicts of Interest
The authors declare no conflicts of interest.
References
- Holling, C.S. Resilience and Stability of Ecological Systems. Annu. Rev. Ecol. Syst. 1973, 4, 1–23. [Google Scholar] [CrossRef]
- Xu, L.; Marinova, D.; Guo, X. Resilience thinking: A renewed system approach for sustainability science. Sustain. Sci. 2014, 10, 123–138. [Google Scholar] [CrossRef]
- Jha, A.K.; Miner, T.W.; Stanton-Geddes, Z. Building Urban Resilience: Principles, Tools, and Practice; The World Bank: Washington, DC, USA, 2013; pp. 9–46. [Google Scholar] [CrossRef]
- Simmie, J.; Martin, R. The Economic Resilience of Regions: Towards an Evolutionary Approach. Camb. J. Regions Econ. Soc. 2010, 3, 27–43. [Google Scholar] [CrossRef]
- Boschma, R. Towards an Evolutionary Perspective on Regional Resilience. Reg. Stud. 2014, 49, 733–751. [Google Scholar] [CrossRef]
- Reggiani, A.; de Graaff, T.; Nijkamp, P. Resilience: An Evolutionary Approach to Spatial Economic Systems. Netw. Spat. Econ. 2002, 2, 211–229. [Google Scholar] [CrossRef]
- Martin, R.; Sunley, P. On the Notion of Regional Economic Resilience: Conceptualization and Explanation. J. Econ. Geogr. 2014, 15, 1–42. [Google Scholar] [CrossRef]
- Martin, R.; Sunley, P. Regional Economic Resilience: Evolution and Evaluation. In Handbook on Regional Economic Resilience; Bristow, G., Healy, A., Eds.; Edward Elgar Publishing: Cheltenham, UK, 2020; pp. 10–35. [Google Scholar] [CrossRef]
- Briguglio, L.; Cordina, G.; Farrugia, N.; Vella, S. Economic Vulnerability and Resilience: Concepts and Measurements. Oxf. Dev. Stud. 2009, 37, 229–247. [Google Scholar] [CrossRef]
- Man, S.; Wu, X.; Yang, Y.; Meng, Q. An Assessment Approach to Urban Economic Resilience of the Rust Belt in China. Complexity 2021, 2021, 1935557. [Google Scholar] [CrossRef]
- Li, L.; Zhang, P.; Lo, K.; Liu, W.; Li, J. The Evolution of Regional Economic Resilience in the Old Industrial Bases in China: A Case Study of Liaoning Province, China. Chin. Geogr. Sci. 2020, 30, 340–351. [Google Scholar] [CrossRef]
- Martin, R. Regional Economic Resilience, Hysteresis and Recessionary Shocks. J. Econ. Geogr. 2011, 12, 1–32. [Google Scholar] [CrossRef]
- Faggian, A.; Gemmiti, R.; Jaquet, T.; Santini, I. Regional Economic Resilience: The Experience of the Italian Local Labor Systems. Ann. Reg. Sci. 2017, 60, 393–410. [Google Scholar] [CrossRef]
- Giannakis, E.; Bruggeman, A. Regional Disparities in Economic Resilience in the European Union across the Urban–Rural Divide. Reg. Stud. 2019, 54, 1200–1213. [Google Scholar] [CrossRef]
- Navarro-Espigares, J.L.; Martín-Segura, J.A.; Hernández-Torres, E. The Role of the Service Sector in Regional Economic Resilience. Serv. Ind. J. 2012, 32, 571–590. [Google Scholar] [CrossRef]
- Martin, R.; Sunley, P.; Gardiner, B.; Tyler, P. How Regions React to Recessions: Resilience and the Role of Economic Structure. Reg. Stud. 2016, 50, 561–585. [Google Scholar] [CrossRef]
- Kim, A.; Lim, J.; Colletta, A. How Regional Economic Structure Matters in the Era of COVID-19: Resilience Capacity of U.S. States. Ann. Reg. Sci. 2022, 70, 159–185. [Google Scholar] [CrossRef]
- Frenken, K.; Van Oort, F.; Verburg, T. Related Variety, Unrelated Variety and Regional Economic Growth. Reg. Stud. 2007, 41, 685–697. [Google Scholar] [CrossRef]
- Cainelli, G.; Ganau, R.; Modica, M. Does Related Variety Affect Regional Resilience? New Evidence from Italy. Ann. Reg. Sci. 2019, 62, 657–680. [Google Scholar] [CrossRef]
- Grabner, S.M.; Modica, M. Industrial Resilience, Regional Diversification and Related Variety during Times of Crisis in the US Urban–Rural Context. Reg. Stud. 2021, 56, 1605–1617. [Google Scholar] [CrossRef]
- He, C.; Chen, T.; Zhu, S. Do Not Put Eggs in One Basket: Related Variety and Export Resilience in the Post-Crisis Era. Ind. Corp. Chang. 2021, 30, 1655–1676. [Google Scholar] [CrossRef]
- Clark, J.; Huang, H.-I.; Walsh, J.P. A Typology of “Innovation Districts”: What It Means for Regional Resilience. Camb. J. Regions Econ. Soc. 2010, 3, 121–137. [Google Scholar] [CrossRef]
- Bristow, G.; Healy, A. Innovation and Regional Economic Resilience: An Exploratory Analysis. Ann. Reg. Sci. 2017, 60, 265–284. [Google Scholar] [CrossRef]
- Filippetti, A.; Gkotsis, P.; Vezzani, A.; Zinilli, A. Are Innovative Regions More Resilient? Evidence from Europe in 2008–2016. Econ. Polit. 2020, 37, 807–832. [Google Scholar] [CrossRef]
- Tóth, G.; Elekes, Z.; Whittle, A.; Lee, C.; Kogler, D.F. Technology Network Structure Conditions the Economic Resilience of Regions. Econ. Geogr. 2022, 98, 355–378. [Google Scholar] [CrossRef]
- Khaerah, N.; Nur, S.A. Financial Governance in Strengthening Post-Disaster Community Economic Resilience in Majene, Indonesia. J. Contemp. Gov. Public Policy 2022, 3, 47–58. [Google Scholar] [CrossRef]
- Oprisan, O.; Pirciog, S.; Ionascu, A.E.; Lincaru, C.; Grigorescu, A. Economic Resilience and Sustainable Finance Path to Development and Convergence in Romanian Counties. Sustainability 2023, 15, 14221. [Google Scholar] [CrossRef]
- Eraydin, A. Attributes and Characteristics of Regional Resilience: Defining and Measuring the Resilience of Turkish Regions. Reg. Stud. 2015, 50, 600–614. [Google Scholar] [CrossRef]
- Zhang, T.; Liang, Z.; Wang, B. The Impact of Foreign Direct Investment (FDI) on Urban Economic Resilience: An Empirical Study Based on the Yangtze River Delta Urban Agglomerations. Highlights Bus. Econ. Manag. 2023, 8, 61–68. [Google Scholar] [CrossRef]
- Ezcurra, R.; Rios, V. Quality of Government and Regional Resilience in the European Union. Evidence from the Great Recession. Pap. Reg. Sci. 2019, 98, 1267–1290. [Google Scholar] [CrossRef]
- Tan, J.; Lo, K.; Qiu, F.; Liu, W.; Li, J.; Zhang, P. Regional Economic Resilience: Resistance and Recoverability of Resource-Based Cities during Economic Crises in Northeast China. Sustainability 2017, 9, 2136. [Google Scholar] [CrossRef]
- Xiao, J.; Boschma, R.; Andersson, M. Resilience in the European Union: The Effect of the 2008 Crisis on the Ability of Regions in Europe to Develop New Industrial Specializations. Ind. Corp. Chang. 2017, 27, 15–47. [Google Scholar] [CrossRef]
- Fritsch, M.; Kublina, S. Related Variety, Unrelated Variety and Regional Growth: The Role of Absorptive Capacity and Entrepreneurship. Reg. Stud. 2017, 52, 1360–1371. [Google Scholar] [CrossRef]
- Asongu, S.A.; Diop, S.; Nnanna, J. Health Vulnerability versus Economic Resilience to the COVID-19 Pandemic. World Aff. 2021, 184, 472–500. [Google Scholar] [CrossRef]
- Morgan, A.K.; Awafo, B.A.; Quartey, T. The Effects of COVID-19 on Global Economic Output and Sustainability: Evidence from around the World and Lessons for Redress. Sustain. Sci. Pract. Policy 2021, 17, 76–80. [Google Scholar] [CrossRef]
- Pielke, R. Tracking progress on the economic costs of disasters under the indicators of the sustainable development goals. Environ. Hazards 2018, 18, 1–6. [Google Scholar] [CrossRef]
- Doran, J.; Fingleton, B. Employment Resilience in Europe and the 2008 Economic Crisis: Insights from Micro-Level Data. Reg. Stud. 2015, 50, 644–656. [Google Scholar] [CrossRef]
- Hu, X.; Li, L.; Dong, K. What Matters for Regional Economic Resilience amid COVID-19? Evidence from Cities in Northeast China. Cities 2022, 120, 103440. [Google Scholar] [CrossRef] [PubMed]
- Meng, T.; Tian, C.; Zhang, H.; Koo, C.K. What Effects of COVID-19 on Regional Economic Resilience? Evidence from 31 Provinces in China. Front. Public Health 2022, 10, 973107. [Google Scholar] [CrossRef] [PubMed]
- Li, L.; Liu, S.; Li, C.; Zhang, P.; Lo, K. What Matters for Regional Economic Resilience Amid Multi Shock Situations: Structural or Agency? Evidence from Resource-Based Cities in China. Sustainability 2022, 14, 5701. [Google Scholar] [CrossRef]
- Jiang, D.; Wang, X.; Zhao, R. Analysis on the Economic Recovery in the Post-COVID-19 Era: Evidence from China. Front. Public Health 2022, 9, 787190. [Google Scholar] [CrossRef] [PubMed]
- Angelopoulos, S.; de Silva, A.; Navon, Y.; Sinclair, S.; Yanotti, M. Economic Resilience in a Pandemic: Did COVID-19 Policy Effects Override Industry Diversity Impacts in Australia? Econ. Pap. 2023, 42, 153–171. [Google Scholar] [CrossRef]
- Tuysuz, S.; Baycan, T.; Altuğ, F. Economic impact of the COVID-19 outbreak in Turkey: Analysis of vulnerability and resilience of regions and diversely affected economic sectors. Asia-Pac. J. Reg. Sci. 2022, 6, 1133–1158. [Google Scholar] [CrossRef]
- Wu, P.; Duan, Q.; Zhou, L.; Wu, Q.; Deveci, M. Spatial-temporal evaluation of urban resilience in the Yangtze River Delta from the perspective of the coupling coordination degree. Environ. Dev. Sustain. 2023, 1–23. [Google Scholar] [CrossRef]
- Cheng, Y.; Liu, J. Evaluation of Urban Resilience in the Post-COVID-19 Period: A Case Study of the Yangtze Delta City Group in China. Int. J. Disaster Risk Reduct. 2023, 97, 104028. [Google Scholar] [CrossRef]
- Du, W.; Shi, Y.; Xu, L.; Zhai, G.; Chen, W.; Lu, Z. Multidimensional Measurements and Analysis of Urban Economic Resilience under the Disturbance of Economic Risks: A Case Study of the Yangtze River Delta, China. Prog. Geogr. 2022, 41, 956–971. [Google Scholar] [CrossRef]
- Shi, T.; Qiao, Y.; Zhou, Q. Spatiotemporal evolution and spatial relevance of urban resilience: Evidence from cities of China. Growth Chang. 2021, 52, 2364–2390. [Google Scholar] [CrossRef]
- Feng, Y.; Lee, C.-C.; Peng, D. Does regional integration improve economic resilience? Evidence from urban agglomerations in China. Sust. Cities Soc. 2023, 88, 104273. [Google Scholar] [CrossRef]
- Anderson, O.D.; Box, G.E.P.; Jenkins, G.M. Time Series Analysis: Forecasting and Control. J. R. Stat. Soc. Ser. D-Stat. 1978, 27, 265. [Google Scholar] [CrossRef]
- Bruneau, M.; Reinhorn, A. Exploring the Concept of Seismic Resilience for Acute Care Facilities. Earthq. Spectra 2007, 23, 41–62. [Google Scholar] [CrossRef]
- Cimellaro, G.P.; Reinhorn, A.M.; Bruneau, M. Framework for Analytical Quantification of Disaster Resilience. Eng. Struct. 2010, 32, 3639–3649. [Google Scholar] [CrossRef]
- Ouyang, M.; Dueñas-Osorio, L.; Min, X. A Three-Stage Resilience Analysis Framework for Urban Infrastructure Systems. Struct. Saf. 2012, 36–37, 23–31. [Google Scholar] [CrossRef]
- Zhou, K.; Liu, B.; Fan, J. Economic Resilience and Recovery Efficiency in the Severely Affected Area of Ms 8.0 Wenchuan Earthquake. Acta Geogr. Sin. 2019, 74, 2078–2091. [Google Scholar] [CrossRef]
- Wang, J.; Xu, C. Geodetector: Principle and Prospective. Acta Geogr. Sin. 2017, 72, 116–134. [Google Scholar] [CrossRef]
- Zhang, H.; Dong, G.; Wang, J.; Zhang, T.; Meng, X.; Yang, D.; Liu, Y.; Lu, B. Understanding and extending the geographical detector model under a linear regression framework. Int. J. Geogr. Inf. Sci. 2023, 37, 2437–2453. [Google Scholar] [CrossRef]
- Brunsdon, C.; Fotheringham, A.S.; Charlton, M.E. Geographically Weighted Regression: A Method for Exploring Spatial Nonstationarity. Geogr. Anal. 1996, 28, 281–298. [Google Scholar] [CrossRef]
- Palomino, J.C.; Rodríguez, J.G.; Sebastian, R. The COVID-19 Shock on the Labour Market: Poverty and Inequality Effects across Spanish Regions. Reg. Stud. 2022, 57, 814–828. [Google Scholar] [CrossRef]
- Tori, D.; Onaran, Ö. The Effects of Financialization on Investment: Evidence from Firm-Level Data for the UK. Cambr. J. Econ. 2018, 42, 1393–1416. [Google Scholar] [CrossRef]
- Lai, J.T.; Yan, I.K.M.; Yi, X.; Zhang, H. Digital Financial Inclusion and Consumption Smoothing in China. China World Econ. 2020, 28, 64–93. [Google Scholar] [CrossRef]
- Du, Y.; Wang, Q.; Zhou, J. How Does Digital Inclusive Finance Affect Economic Resilience: Evidence from 285 Cities in China. Int. Rev. Financ. Anal. 2023, 88, 102709. [Google Scholar] [CrossRef]
- Gong, H.; Hassink, R.; Tan, J.; Huang, D. Regional Resilience in Times of a Pandemic Crisis: The Case of COVID-19 in China. Tijdschr. Econ. Soc. Geogr. 2020, 111, 497–512. [Google Scholar] [CrossRef]
- Cai, X.; Wang, W.; Rao, A.; Rahim, S.; Zhao, X. Regional Sustainable Development and Spatial Effects from the Perspective of Renewable Energy. Front. Environ. Sci. 2022, 10, 859523. [Google Scholar] [CrossRef]
- Guo, J.; Xu, Z. Research on The Influence of Industrial Related Variety on Regional Economic Resilience—Analysis of Threshold Effect Based on Regional Innovation Level. Sci. Technol. Prog. Policy 2019, 36, 39–47. [Google Scholar] [CrossRef]
- Honig, A. Do Improvements in Government Quality Necessarily Reduce the Incidence of Costly Sudden Stops? J. Bank. Financ. 2008, 32, 360–373. [Google Scholar] [CrossRef]
- Straka, W.; Kondragunta, S.; Wei, Z.; Zhang, H.; Miller, S.D.; Watts, A. Examining the Economic and Environmental Impacts of COVID-19 Using Earth Observation Data. Remote Sens. 2020, 13, 5. [Google Scholar] [CrossRef]
- Elvidge, C.D.; Ghosh, T.; Hsu, F.-C.; Zhizhin, M.; Bazilian, M. The Dimming of Lights in China during the COVID-19 Pandemic. Remote Sens. 2020, 12, 2851. [Google Scholar] [CrossRef]
- Liu, Y.; Ji, J.; Zhang, Y.; Yang, Y. Economic Resilience and Spatial Divergence in the Guangdong- Hong Kong-Macao Greater Bay Area in China. Geogr. Res. 2020, 39, 2029–2043. [Google Scholar] [CrossRef]
- Kalenyuk, I.; Tsymbal, L.; Uninets, I. Intelligent Drivers of Smart Economy in The Global Ecosystem. Balt. J. Econ. Stud. 2021, 7, 91–100. [Google Scholar] [CrossRef]
- Youssef, A.; Hajek, P. The Role of Smart Economy in Developing Smart Cities. In Proceeding of the 2021 International Symposium on Computer Science and Intelligent Controls (ISCSIC), Rome, Italy, 12–14 November 2021. [Google Scholar] [CrossRef]
- Sertyesilisik, E.; Sertyesilisik, B. Smart, Circular, and Competitive Manufacturing Industry as a Key for Enhancing Resilience of the Global Economy. In Productivity Growth in the Manufacturing Sector; Pal, M., Ed.; Emerald Publishing Limited: Leeds, UK, 2021; pp. 71–82. [Google Scholar] [CrossRef]


Disclaimer/Publisher’s Note: The statements, opinions and data contained in all publications are solely those of the individual author(s) and contributor(s) and not of MDPI and/or the editor(s). MDPI and/or the editor(s) disclaim responsibility for any injury to people or property resulting from any ideas, methods, instructions or products referred to in the content. |
© 2024 by the authors. Licensee MDPI, Basel, Switzerland. This article is an open access article distributed under the terms and conditions of the Creative Commons Attribution (CC BY) license (https://creativecommons.org/licenses/by/4.0/).