Article

Airborne LiDAR Applications at the Medieval Site of Castel Fenuculus in the Lower Valley of the Calore River (Benevento, Southern Italy)

Department of Civil, Building and Environmental Engineering, Sapienza University of Rome, via Eudossiana 18, 00184 Rome, Italy
Land 2024, 13(12), 2255; https://doi.org/10.3390/land13122255
Submission received: 3 November 2024 / Revised: 13 December 2024 / Accepted: 17 December 2024 / Published: 23 December 2024
(This article belongs to the Section Landscape Archaeology)

Abstract

:
This paper explores the application of Airborne Laser Scanning (ALS) technology in the investigation of the medieval Norman site of Castel Fenuculus, in the lower Calore Valley, Southern Italy. This research aims to assess the actual potential of the ALS dataset provided by the Italian Ministry of the Environment (MATTM) for the detection and visibility of archaeological features in a difficult environment characterised by dense vegetation and morphologically complex terrain. The study focuses on improving the detection and interpretation of archaeological features through a systematic approach that includes the acquisition of ALS point clouds, the implementation of classification algorithms, and the removal of vegetation layers to reveal the underlying terrain and ruined structures. Furthermore, the aim was to test different classification and filtering techniques to identify the best one to use in complex contexts, with the intention of providing a comprehensive and replicable methodological framework. Finally, the Digital Elevation Model (DTM), and various LiDAR-derived models (LDMs), were generated to visualise and highlight topographical features potentially related to archaeological remains. The results obtained demonstrate the significant potential of LiDAR in identifying and documenting archaeological features in densely vegetated and wooded landscapes.

1. Introduction

Airborne Laser Scanning (ALS) is a remote sensing system based on LiDAR (Light Detection and Ranging) mounted on an aircraft. The sensor records the time it takes for the emitted laser beam, characterised by multiple pulses, to hit objects (tree canopies, buildings, etc.) and return to the emitter. The measured time is used to calculate the distance to the various objects hit by the sensor, which is then converted into an altitude measurement [1,2,3,4]. Each time the laser beam encounters an obstacle, it returns to the sensor, and its height is recorded. Consequently, the density of points that can be classified as ground is only a fraction of the initial energy emitted [5]. One of the limitations of ALS is related to the type and density of vegetation cover, which can hinder the laser beam from reaching the ground, resulting in a low density of classified ground points [6,7,8,9]. Nevertheless, LiDAR is an active remote sensing technique that operates independently of atmospheric or lighting conditions. This property offers several advantages over traditional surveying methods, such as aerial photography or optical satellite imagery, which rely on passive remote sensing techniques. LiDAR provides highly accurate and precise data, even in complex environments, different terrain types, and challenging environmental conditions, or in areas of difficult access. The large footprint typical of ALS allows for a rapid large-scale mapping of extensive areas, reducing both time and costs in data collection. Furthermore, the output data, a point cloud, can be interpolated into a Digital Surface Model (DSM) or Digital Terrain Model (DTM), making it a versatile tool. For this reason, it is widely used in geology, precision agriculture, engineering, bathymetry, forest analysis, the automotive industry, and urban and land-use planning.
For several decades now, LiDAR has become increasingly utilised in archaeology, as it is the only tool proven effective for documenting the presence of partially buried structures and identifying archaeological proxy indicators [10,11,12]. These indicators are often micro topographic variations in the terrain of vegetated upland sites, which are challenging to detect using traditional survey methods based on optical imagery or surface reconnaissance.
In Italy, research concerning archaeological prospection using LiDAR sensors mounted on both UAV [13,14,15,16,17,18] and aircraft (ALS) [1,2,3,4,19,20,21,22,23] has been spreading. However, while the former studies are mainly based on high-resolution datasets focused on small-scale specific sites, the latter are based on large-scale LiDAR acquisitions, often produced by governmental agencies, and frequently at a specific resolution (often 1 or 2 metres), with a low density of ground-classifiable points after vegetation filtering (in some cases, less than 1 point/m2) [12,21]. In Italy, these datasets are produced by the MATTM (Italian Ministry of the Environment and Protection of Land and Sea), and Giacomo Fontana’s studies were among the first to test and explore their usefulness in archaeology, highlighting their potential for detecting features that are hard to identify with traditional archaeological survey and aerial remote sensing methods [21,23]. Moreover, these and other studies reveal a significant limitation of LiDAR use in Mediterranean regions, which are characterised by dense undergrowth, thick vegetation, and a dense canopy [24,25,26,27]. For these reasons, small structures and shallow remains may not be adequately detected. In such cases, special attention must be given to the parameters used in various point-cloud-filtering algorithms and subsequent classification to extract the ground class from the vegetation [8,28,29,30,31,32].
Additionally, a guide, published several years ago (2017), provides an overview of numerous visualisation techniques for Digital Elevation Models (DEMs) derived from LiDAR, considered essential for enhancing microrelief traces [33]. The most common of these techniques include Hillshade (HS); Multi-Hillshade (Multi-HS); Principal Component Analysis (PCA); Slope Gradient (Slope); Simple Local Relief Model (SLRM); Local Relief Model (LRM); Sky View Factor (SVF); Anisotropic Sky View Factor (ASVF); Openness Positive (OP) and Openness Negative (ON); Sky Illumination Model (SIM); and Local Dominance (LD) The use of different visualisation techniques is considered to be a good practice for extracting the most information and improving the interpretation of the archaeological sites [34,35,36,37,38,39].
In addition to LiDAR-derived models (LDMs) based on terrain visualisation techniques, a new visualisation methodology has recently been introduced to facilitate the identification of archaeological remains. It is the Visualisation for Archaeological Topography (VAT), based on the fusion of four informative layers (Hillshade or Multi-Hillshade, Slope, Openness Positive, and Sky View Factor), which is useful for identifying features of various scales and orientations and can be applied to different terrain types from flat to steep [40,41].
The primary goal of this study is to demonstrate the effectiveness of a specific set of ALS data (provided by the MATTM) for detecting semi-buried archaeological features located in vegetated hilly areas. Such contexts, typical of the Mediterranean landscape, present a challenge for traditional aerial photo interpretation techniques, which are often ineffective due to the presence of dense undergrowth and thick vegetation. In this scenario, LiDAR data prove to be a valid alternative and a valuable tool for studying and identifying micro-topographic features associated with archaeological structures.
The site selected for this study is Castel Fenuculus, a Norman castle located in the lower Calore valley (Benevento). Despite its historical and strategic importance over the years, both for controlling road networks and for its proximity to a crossing over the Calore River, the site remains unpublished, possibly due to its location and the dense vegetation that hinders access and study. These factors make Castel Fenuculus an ideal case study for testing the actual usefulness of ALS data and the various filtering, classification, and visualisation techniques.
Therefore, the aim of this research is to experiment with different point cloud classification and filtering algorithms to identify the most suitable method for separating vegetation points from those representing the ground. Only through accurate classification is it possible to obtain a significant number of ground points with which to create a high-quality DTM that adequately represents the reality of the site. Additionally, this study aims to identify a methodology that can be successfully replicated in similar geographical and archaeological contexts.
Subsequently, the interpolated DTM will be used as a base and input data for applying visualisation techniques that highlight microreliefs and topographical anomalies that may reveal the presence of archaeological features. Lastly, the archaeological features thus identified will be verified in the field through reconnaissance and autoptic surveys.

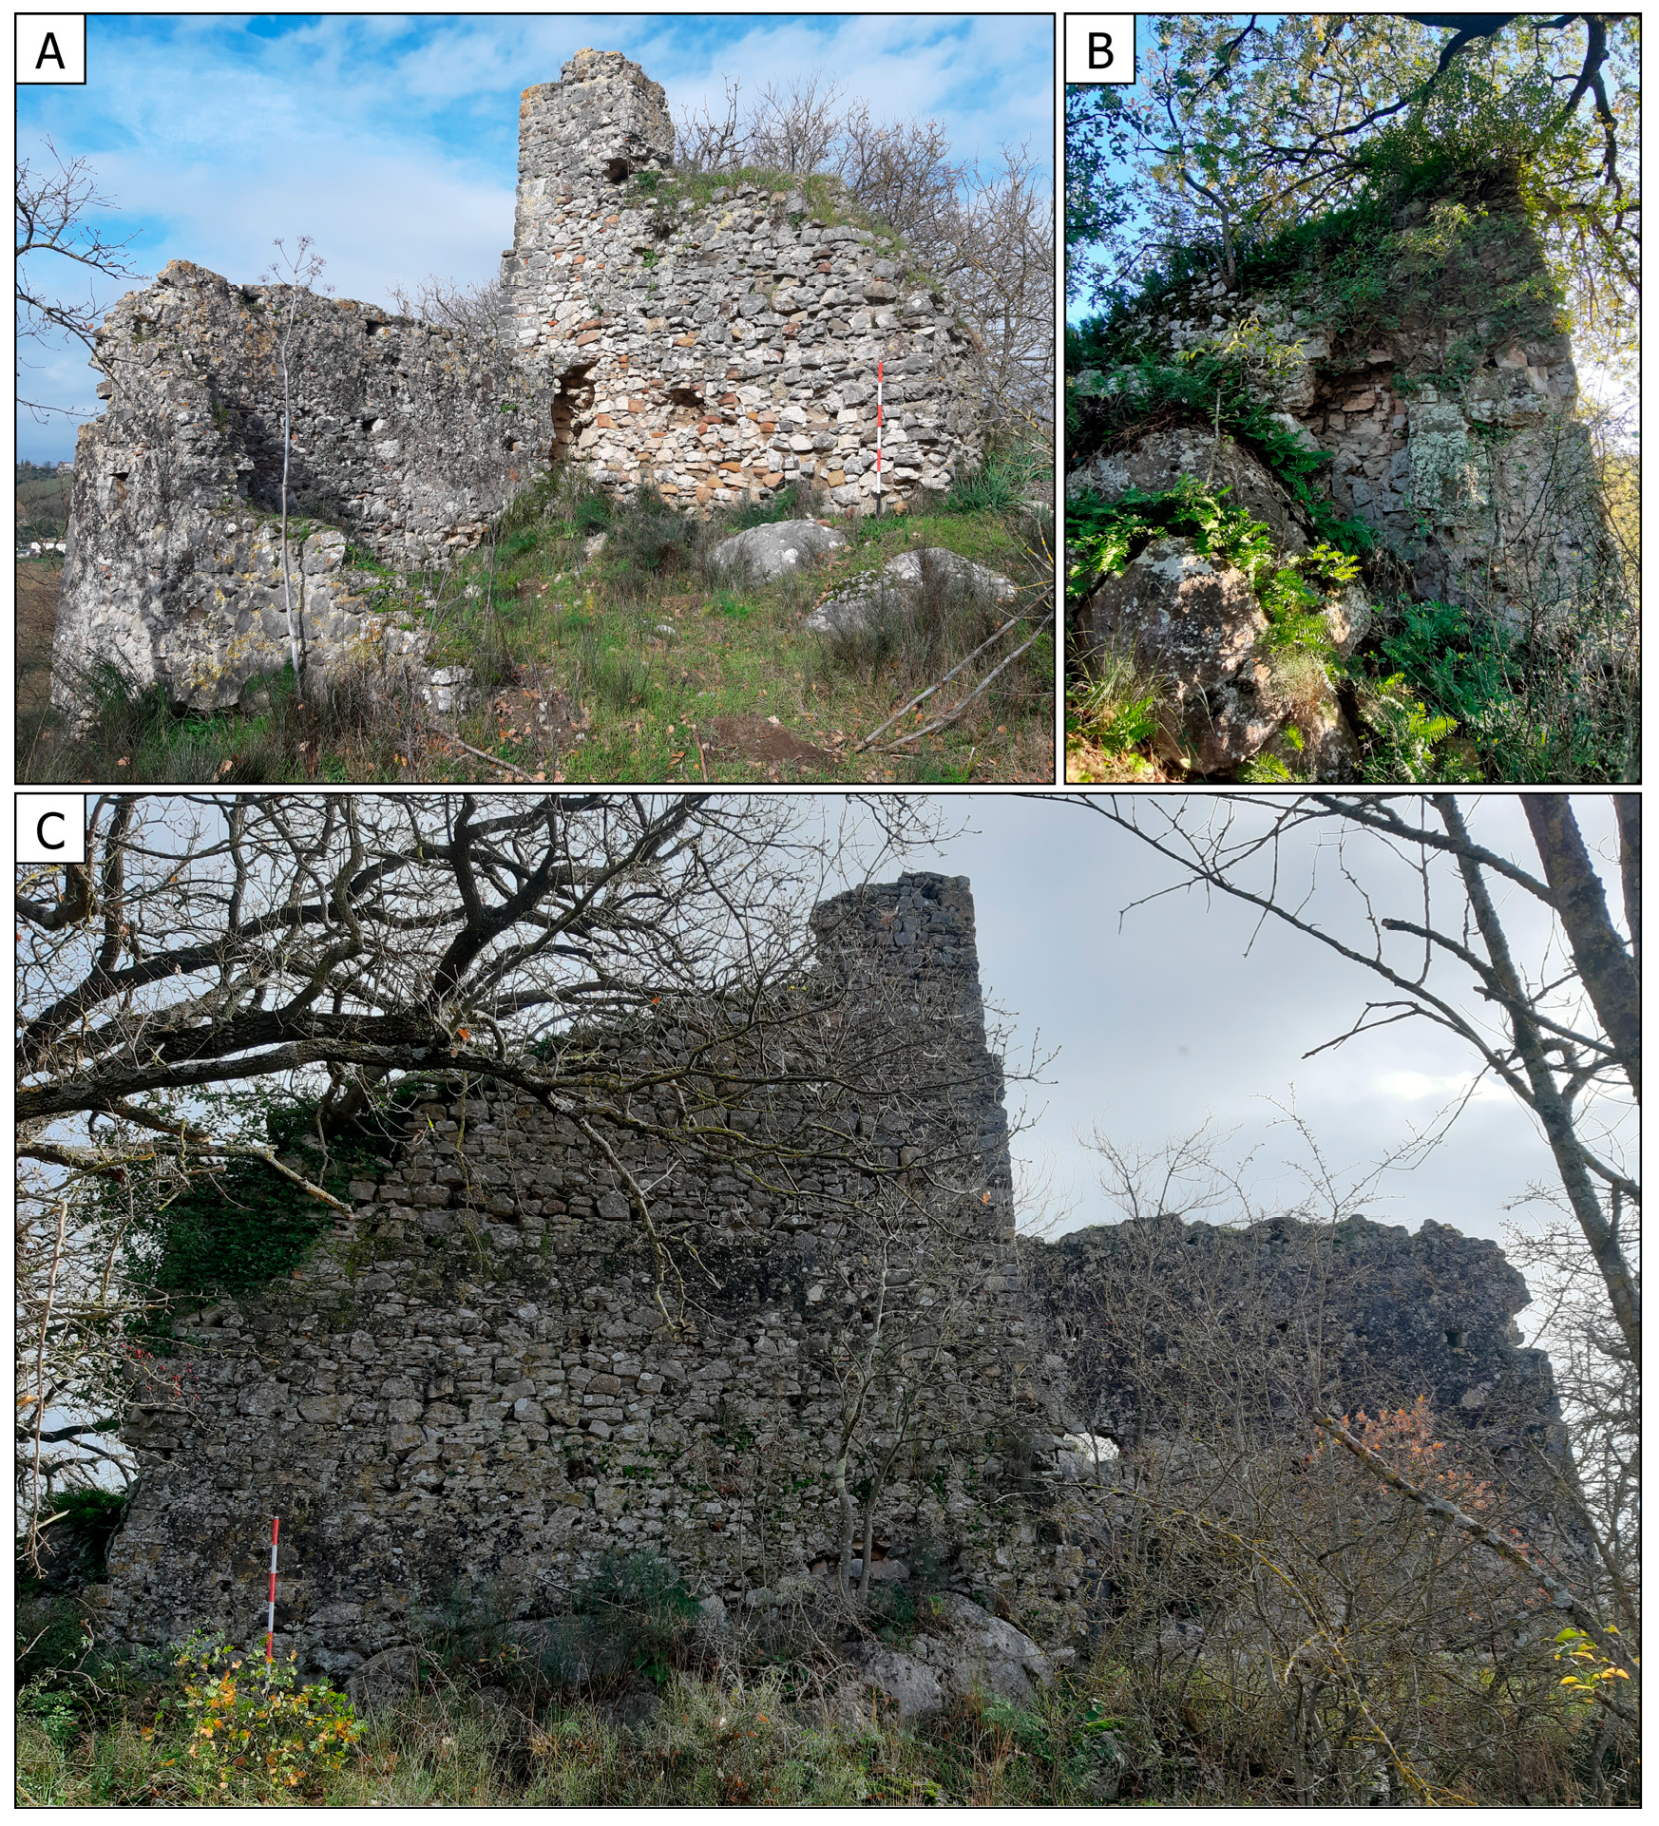
2. Archaeological and Historical Context

In the municipality of Torrecuso (BN), at Ponte Fenuculus, on a limestone outcrop about 139 m above the sea level and at the south of a small bend on the left bank of the Calore River, lies the ancient Castel Fenuculus (Figure 1A,B).
The site extends mostly longitudinally, from north to south, exploiting primarily the southern part of the hill. The western slope, which faces the municipality of Torrecuso, is gentler though still steep; in contrast, the eastern side, which is steeper and possibly eroded by the Calore over time, is bordered by the river, now flowing about 50 metres further east. Considering the strategic importance of the area, it is plausible that the hill, now home to the remains of the Norman castle, may have been occupied in earlier centuries; hence, the pre-existence of structures from earlier periods cannot be ruled out. A similar situation has been verified on another hill overlooking the Calore River a few kilometres away, known as “Toppo” Limata, where sources attest to a 9th-century farmhouse [42,43,44] and the subsequent foundation of a Norman castle [45,46,47,48].
However, for the case under study, there are no sources confirming a previous occupation of the site. Moreover, unlike Toppo Limata, the hill on which Castel Fenuculus was founded is much longer and narrower, making it unlikely to have hosted a productive settlement like a farmhouse. Similarly, other instances of fortifications during the Lombard period are documented in 10th-century sources, such as in the case of Ponte, an important centre also located a few kilometres away. Therefore, based on documentary sources, the hypothesis of a prior occupation of the studied area seems unlikely, but this can only be verified through stratigraphic excavations.
The available written sources on Castel Fenuculus do not provide an exact date of foundation (a common case for all the castles in the Calore Valley and, in general, from the early Norman period). However, from a donation deed, we know that the castle existed before 1112 and was administered by Ugo Infante II (lord of Castelpoto, Castel Finocchio, Torre Palazzo, and Torrecuso), a vassal of Rainulfo II [49]. His father, Ugo Infante I, was also a loyal supporter of the Drengot family, as he appears in a document from Roberto I in 1094, declaring himself as originating from Castelpoto (a municipality in the province of Benevento, in the lower Calore Valley) [50]. It can be concluded that he was a vassal in the Comitatus Telesinus [51,52]; we also know that he died before 1106 [53,54], leaving his possessions in the valley to his son, who bore the same name. Based on these documentary sources, we can attribute the foundation of Castel Fenuculus by the Normans to a date between the late 11th and early 12th centuries [55,56,57,58].

3. Materials and Method
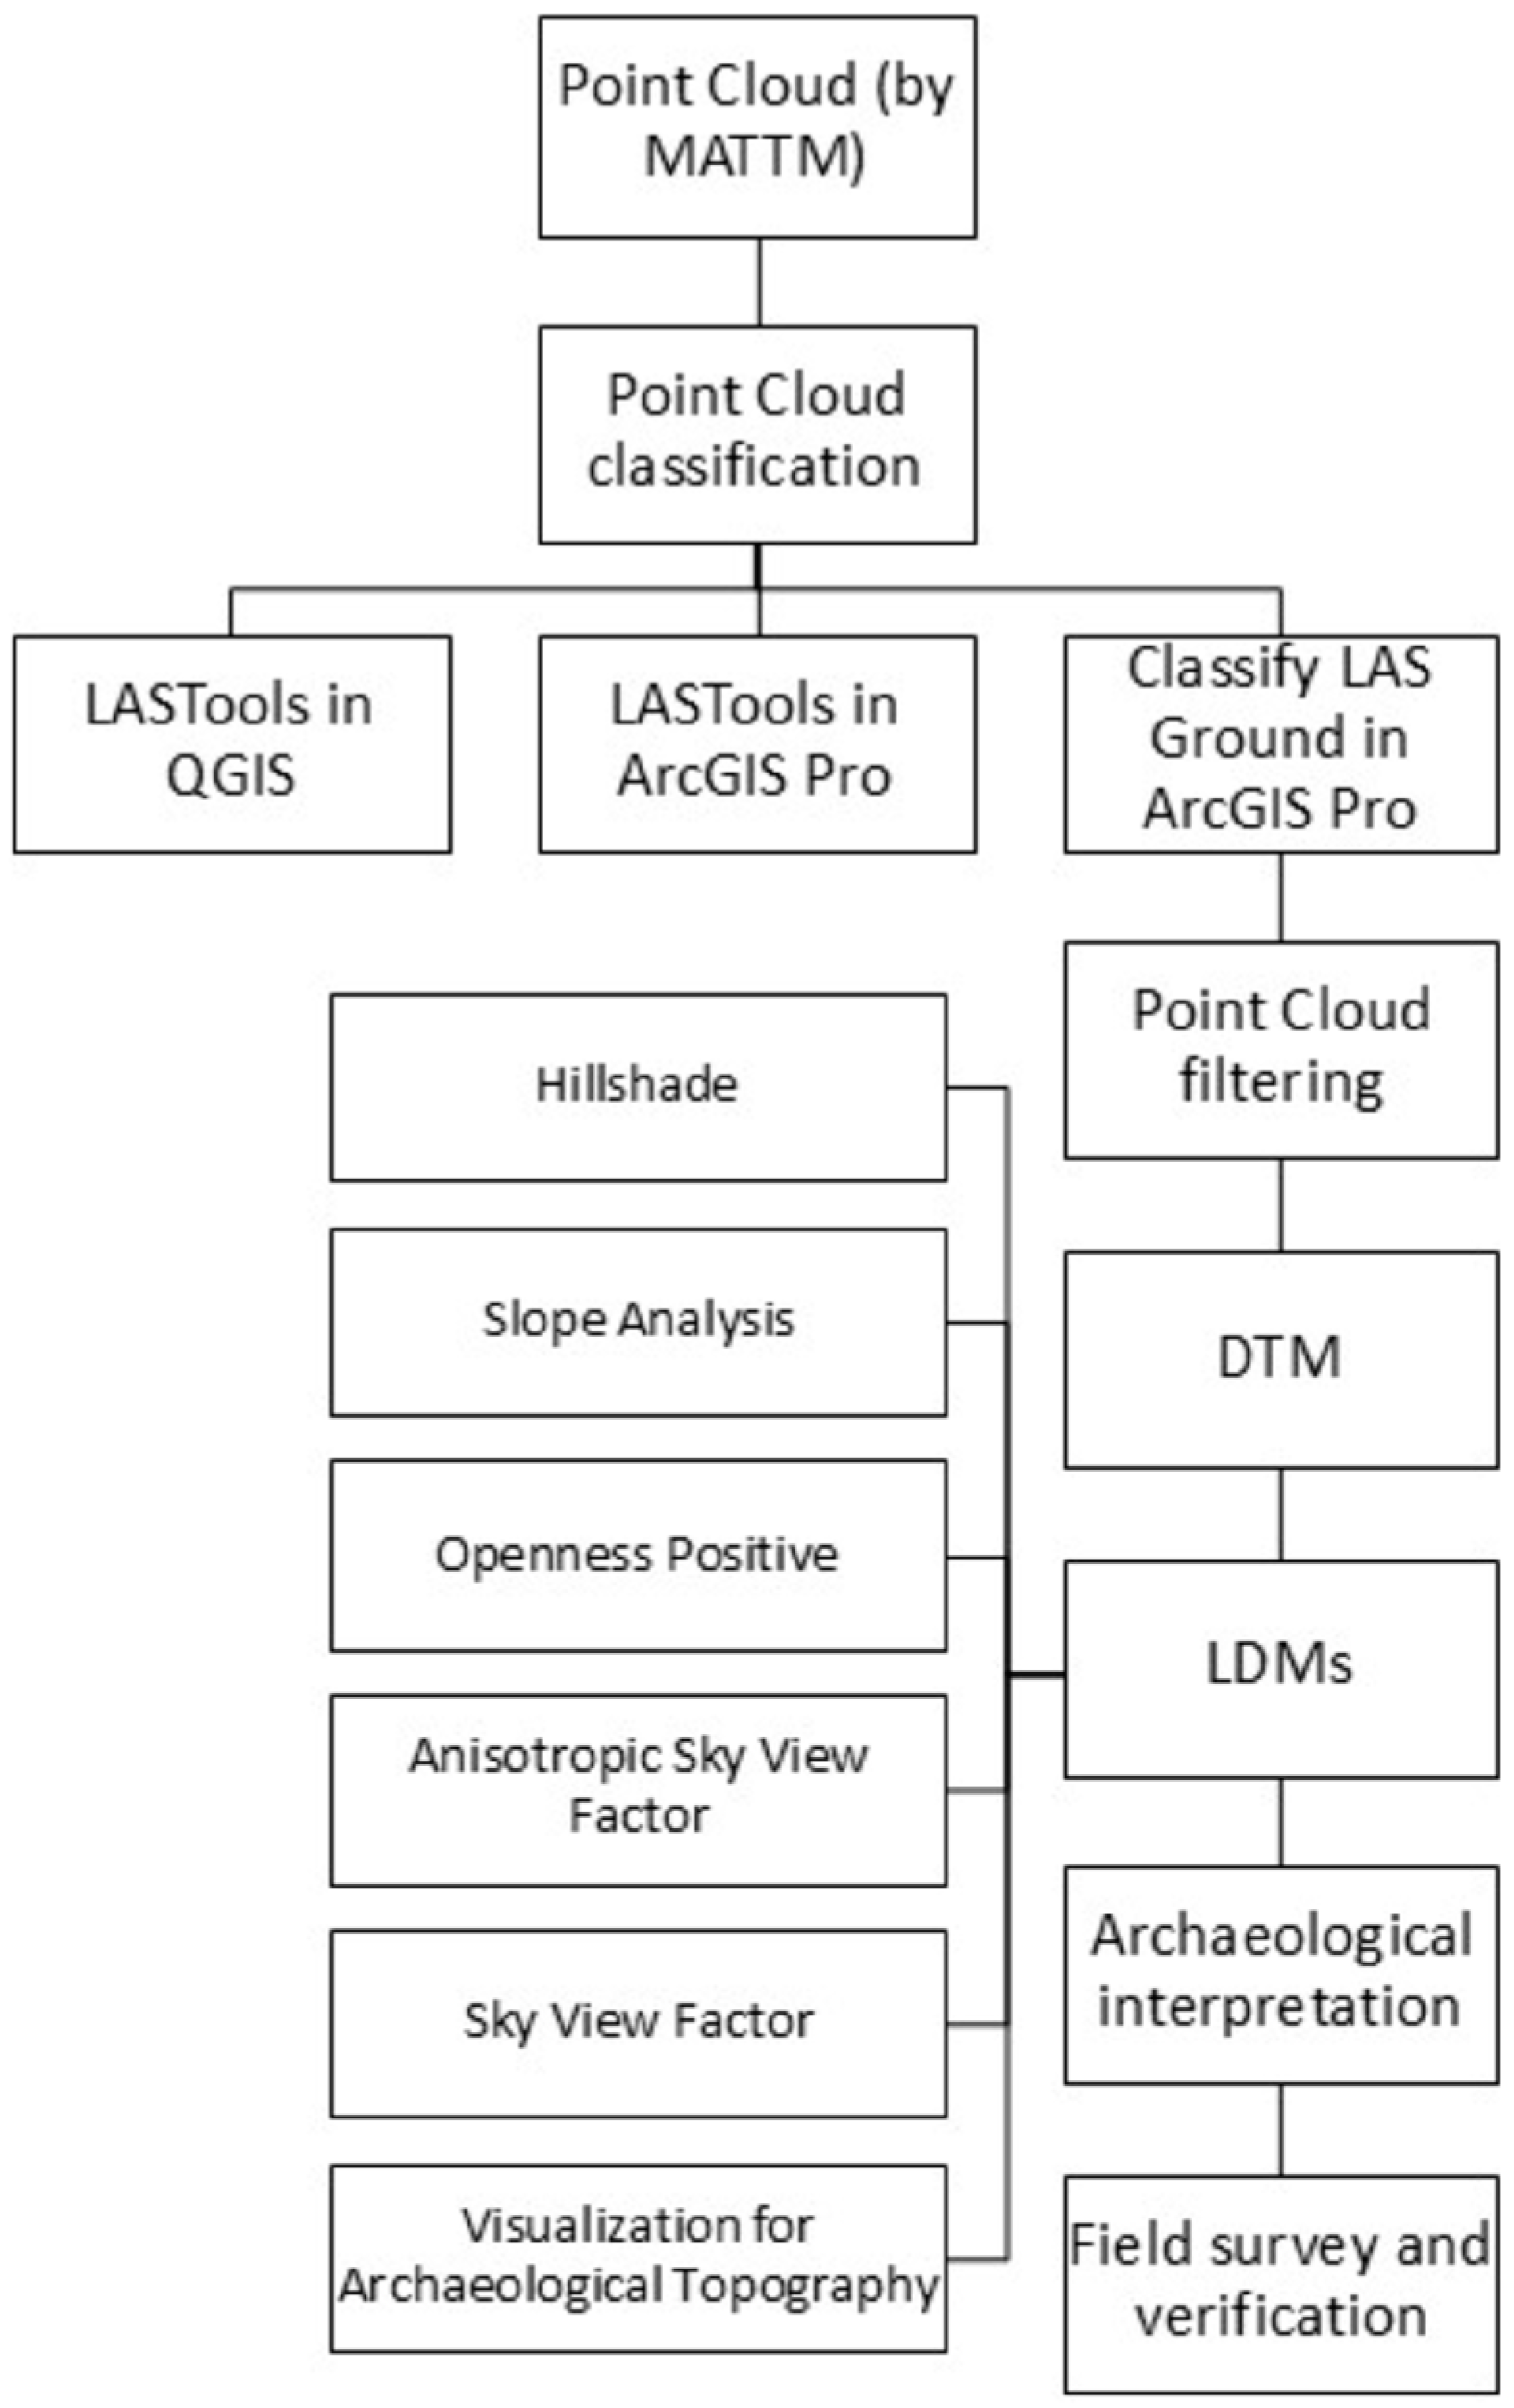
3.1. Method

The study on Castel Fenuculus follows a methodological approach based on (I) the retrieval of the point cloud created by the MATTM; (II) its processing through the application of specific classification algorithms; (III) filtering of vegetation-related components in favour of ground and ruined buildings; (IV) creation of the DEM and (V) various LDMs to enhance the visualisation of archaeological features; (VI) data interpretation; and (VII) field verification (Figure 2).

3.2. Airborne LiDAR Data Acquisition

The Airborne LiDAR data used for this study were part of a remote sensing programme carried out between 2010 and 2011 by the Italian Ministry of the Environment and Protection of Land and Sea (MATTM), which involved several planned flights whose aim was to map specific areas of Italy and key river courses. This project, called the Extraordinary Environmental Remote Sensing Plan, was intended for monitoring areas at high hydrogeological risk [59]. The survey was carried out using Optech ALTM Gemini, ALTM 3100EA, and Pegasus sensors, and the resulting data include point clouds, Digital Terrain Models (DTMs), Digital Surface Models (DSMs first and last return) with a resolution of 1 or 2 metres, and altimetric accuracy corresponding to ±1 sigma (root mean square error) with a vertical error of less than ± 15 cm and a horizontal accuracy of (~2 sigma) within ±30 cm [60]. The dataset can be requested from MATTM and includes the point cloud (.xyz), the DSM first return (.asc), the DSM last return (.asc), and the DTM (.asc). However, the latter product presents several issues due to the algorithms chosen for interpolating the points classified as ground, which, in some cases, are inadequate in faithfully representing the terrain’s surface (likely due to the filtering techniques used). Furthermore, it shows visual distortions, especially in steep areas, caused by incorrect resampling techniques (the “nearest neighbour” method was probably used instead of the “bilinear” one) and by the continuous reprojection of the data for the creation of various models. As a result, the pre-processed DTM, by MATTM, is not suitable for archaeological prospecting, and for these reasons, it has been decided to work directly from the raw point cloud.

3.3. Airborne LiDAR Data Processing from Filtering to Classification

The ALS point cloud (198,844 points) covers an area of approximately 90,888 m2, with an average density of 2.19 points per m2 and an average spacing of 0.69 m. The point cloud was imported into ArcGIS Pro 3.0.1 and processed with different algorithms to empirically test which one was most suitable for classification and which could therefore return a quality and density of points adequate for the best representation of the studied area. The area is characterised by vegetation typical of hilly regions in temperate climates, with oak trees and Crataegus monogyna covering almost the entire area, along with an undergrowth consisting of Ruscus aculeatus, Osyris alba, Cortaderia selloana, and Rubus ulmifolius. The complex vegetative situation, as well as the presence of wall remains that can be attributed to the central keep and a barrel-vaulted structure, made the point cloud classification and filtering phase particularly challenging. The initial idea was to use the LASTools toolbox implemented in ArcGIS Pro 3.0.1, which requires a license for commercial or institutional use but can still be used freely for personal or educational purposes without profit. However, there is a point limit for free use (with point clouds up to 3 million points), after which the output of the elaboration will show some distortions. Consequently, the point cloud had to be clipped to focus exclusively on the study area.
The above-mentioned toolbox allows for the adjustment of a limited number of parameters. For instance, the lasground function (a tool for extracting ground points and classifying them into ground points, class = 2, and non-ground or, more precisely, unassigned points, class = 1) requires the selection of the terrain type (“Wilderness” or “Forest or Hills” are the most appropriate for the case of Castel Fenuculus) and the granularity (“default”, “fine”, and “extra fine” are suitable for very steep and rugged terrains). A total of 129,548/198,844 points were classified as ground, with an average density of 1.42 points per m2, by using “Wilderness” and “fine” as parameters. In contrast, 132,665/198,844 points were classified as ground, with an average density of 1.46 points per m2, by including “Forest or Hills” and “fine”, but none of the tested combinations proved adequate for DTM processing, as too few points were classified as ground, particularly in an area lacking vegetation and therefore surely identifiable as class 2 (Figure 3A,B).
The LASTools plug-in installed in QGIS 3.22.16 offers, in addition to the lasground function, a new lasground option with the possibility of configuring different variables. In the first tool, it is possible to choose “archaeology” as a terrain type, which is not available in ArcGIS Pro 3.0.1, although the results were not significantly different from those previously obtained (142,007/198,844 points classified as ground, with an average density of 1.56 points per m2) (Figure 3C). The second tool is a completely redesigned version of lasground that handles challenging settings much better, where steep mountains are close to urban areas with many buildings. Moreover, as already mentioned, there are several parameters to adjust, so, in the choice of terrain type, “custom” and “default” should be selected as the processing option. The methodology used was the same as proposed in previous studies and consisted of a primary filtering process with a conservative approach to preserve points that might be relevant to archaeological elements while removing vegetation coverage (it classified 130,094/198,844 points as ground, with an average density of 1.43 points per m2) [21] (Figure 3D). However, this process required a second, complementary one, as it mistakenly classified some points as ground rather than low vegetation. The secondary filtering was more aggressive, aimed at obtaining only ground surface points at the expense of potential archaeological features (in fact, it classified 109,728/198,844 points as ground, with an average density of 1.21 points per m2) (Figure 3E). Nevertheless, the resulting data were insufficient to produce a DTM adequately representative of the study area, consistently highlighting the same gaps in the same zone, making it necessary to use other classification algorithms (Figure 3F).
Therefore, Classify LAS Ground (3D Analyst), the native classification and filtering algorithm in ArcGIS Pro 3.0.1, was tested. This algorithm assigns points to class 2 ground or class 1 unassigned through three classification methods: standard, conservative, and aggressive. The first method detects even small slope variations that would be overlooked by the conservative method, but it does not identify sharp relief features, unlike the aggressive option (it classified 138,339/198,844 points as ground, with an average density of 1.52 points per m2) (Figure 3G). Conservative classification is more suitable for flat or gently sloping terrains, and due to the specific topography of the Castel Fenuculus area, it gave a limited number of ground points (only 81,334/198,844 points as ground, with an average density of 0.90 points per m2). On the other hand, the aggressive classification option, which detects sharp terrain features such as ridges or hilltops, generated a point cloud that accurately reflected the real conformation of the study area (in fact, it classified 145,180/198,844 points as ground, with an average density of 1.60 points per m2) (Figure 3H). For more precision, a second analysis was carried out by selecting the “reuse existing ground” option. In this way, previously classified ground points were reused and contributed to the classification of unassigned points. Finally, if the terrain features relatively flat areas alongside steeply sloping ones, correct point classification may require first using the standard method and then the aggressive method with the “reuse existing ground” parameter, employing a polygon to limit the processing to specific areas.
The point cloud, partially categorised as ground, was then used as a reference to classify other points. These additional points represent the remnants of the buildings detected by the ALS, but they could not be assigned to the specific corresponding class (building, class = 6) as they consisted of residual portions of walls, characterised by shapes that are not typical of modern buildings and therefore not recognised as such by classification algorithms. As a result, the assignment of these points was carried out manually by selecting those with a specific linear orientation and located mid-air in relation to the neighbouring ground points (as a result, of the remaining 53,664 points, 115 were assigned to Class 6 buildings and the rest were classified as low, medium, and high vegetation and then removed). This process of identifying existing structures was aided by prior knowledge of the site thanks to previous surveys and autoptic investigations. However, the main criterion for point selection was orientation and direction: anthropogenic structures tend to follow straight lines or regular patterns, unlike vegetation, which grows in a more random and disorderly manner. This contrast between the order of anthropogenic structures and the disorder of vegetation was evident in the point cloud, and it facilitated manual classification (Figure 3B).
The comparison of the different classification methods tested made it possible to identify the most suitable solution for the complex context of Castel Fenuculus. The lasground algorithm in LASTools, using the “Wilderness” and “Forest Hills” terrain types, produced a relatively good point density. However, both approaches failed to accurately classify the ground points around the donjon, which represents a critical area for the study and analysis of the construction typology of Castel Fenuculus.
In contrast, the lasground algorithm, configured with “Archaeology” as terrain type, effectively resolved the limitations of “Wilderness” and “Forest Hills”. In fact, this method was able to classify more points as ground, particularly near the donjon, and would appear to be more suitable for identifying subtle anthropogenic features. This high performance is probably attributable to its calibration for archaeological contexts, where challenging vegetative conditions and complex topographies are common and similar to those at Castel Fenuculus.
The lasground_new algorithm, the updated version of lasground in LASTools, introduces advanced functionalities that significantly enhance the adaptability of classification and filtering methods. By selecting “custom” as the terrain type, it is possible to set several parameters (like Step, Sub, Spike, Bulge, Stddev, and Offset), allowing the algorithm to refine the classification process, making it suitable for handling more or less dense vegetation cover and irregular topographies. The methodology, which combines a primary more conservative filtering phase with a complementary more aggressive filtering phase, has proven highly effective and shows considerable potential. However, this approach requires empirical testing and a deep understanding of the techniques and parameter adjustments necessary to achieve optimal results.
In contrast, the native Classify LAS Ground tool in ArcGIS Pro 3.0.1 provided a simpler and more efficient solution for classifying and filtering the Castel Fenuculus point cloud, making it accessible to users with different levels of expertise. Despite the fact that ArcGIS Pro is not a software traditionally associated with point cloud management, the algorithm, with “Aggressive” as the classification method, delivered excellent results. With this approach, it was possible to classify more points as terrain, achieving the highest density compared to the other methods tested. This solution proved to be very effective for an accurate and precise representation of the topography of the studied site.

4. Results and Discussion
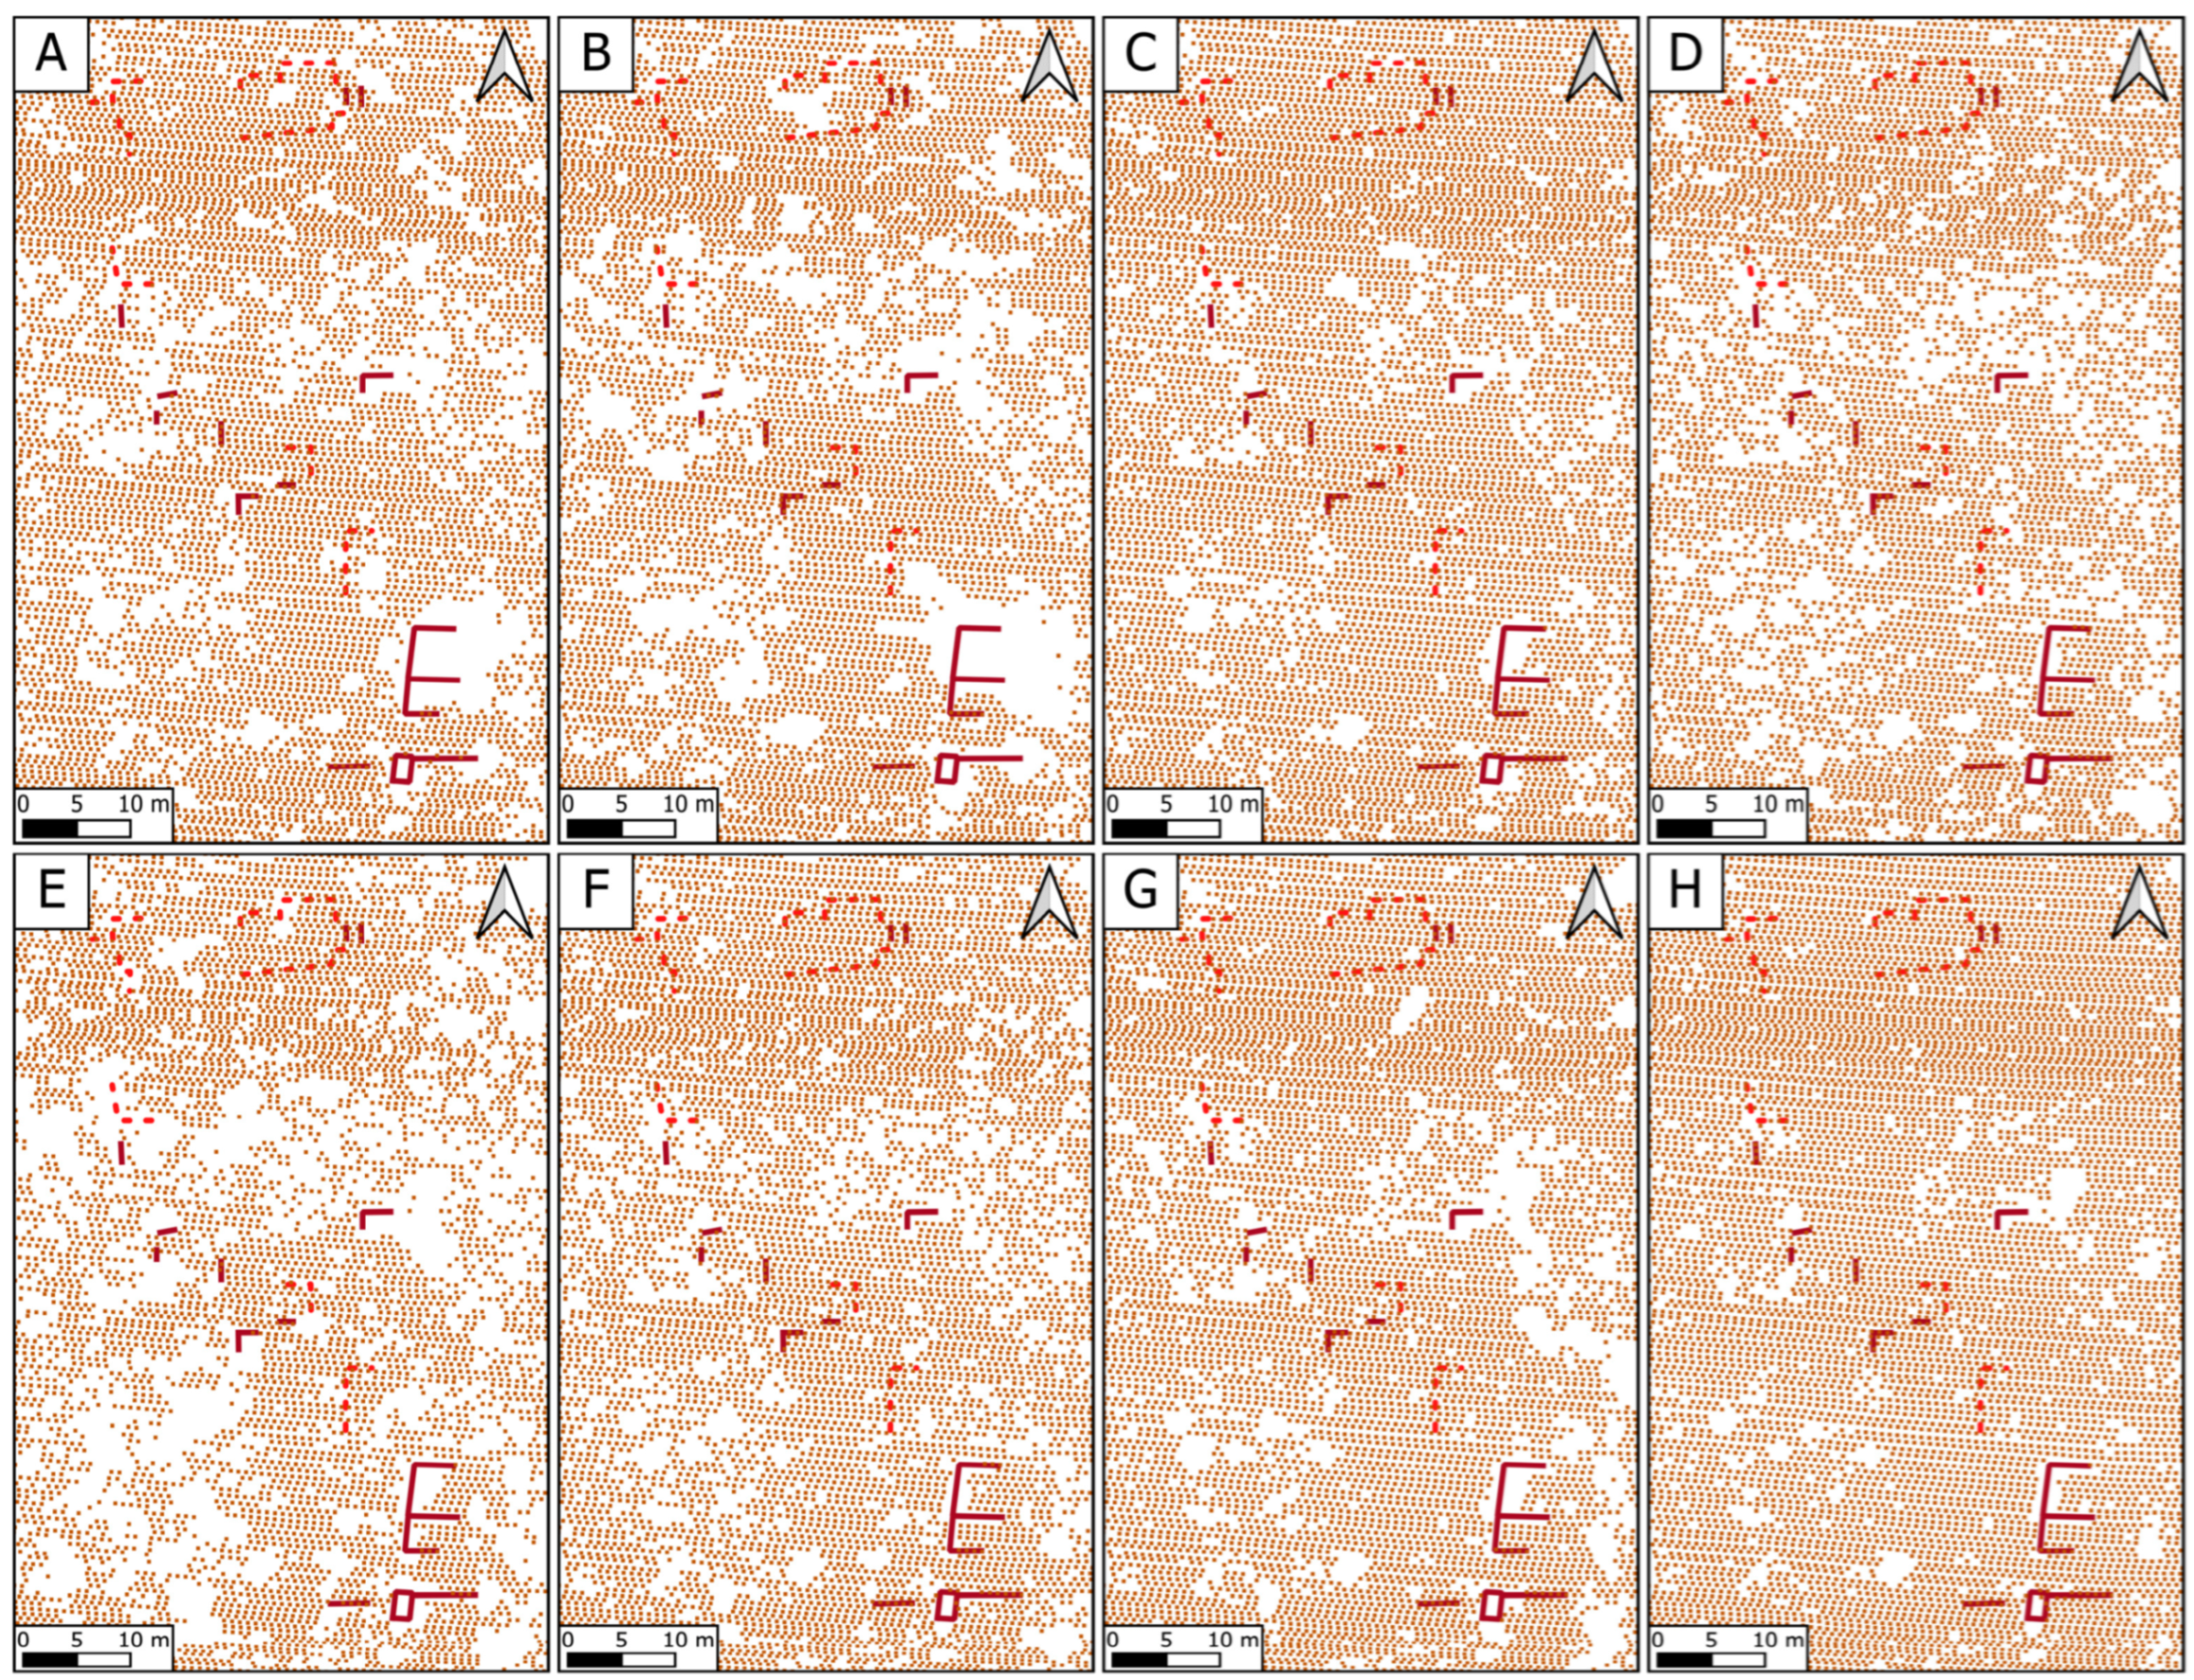
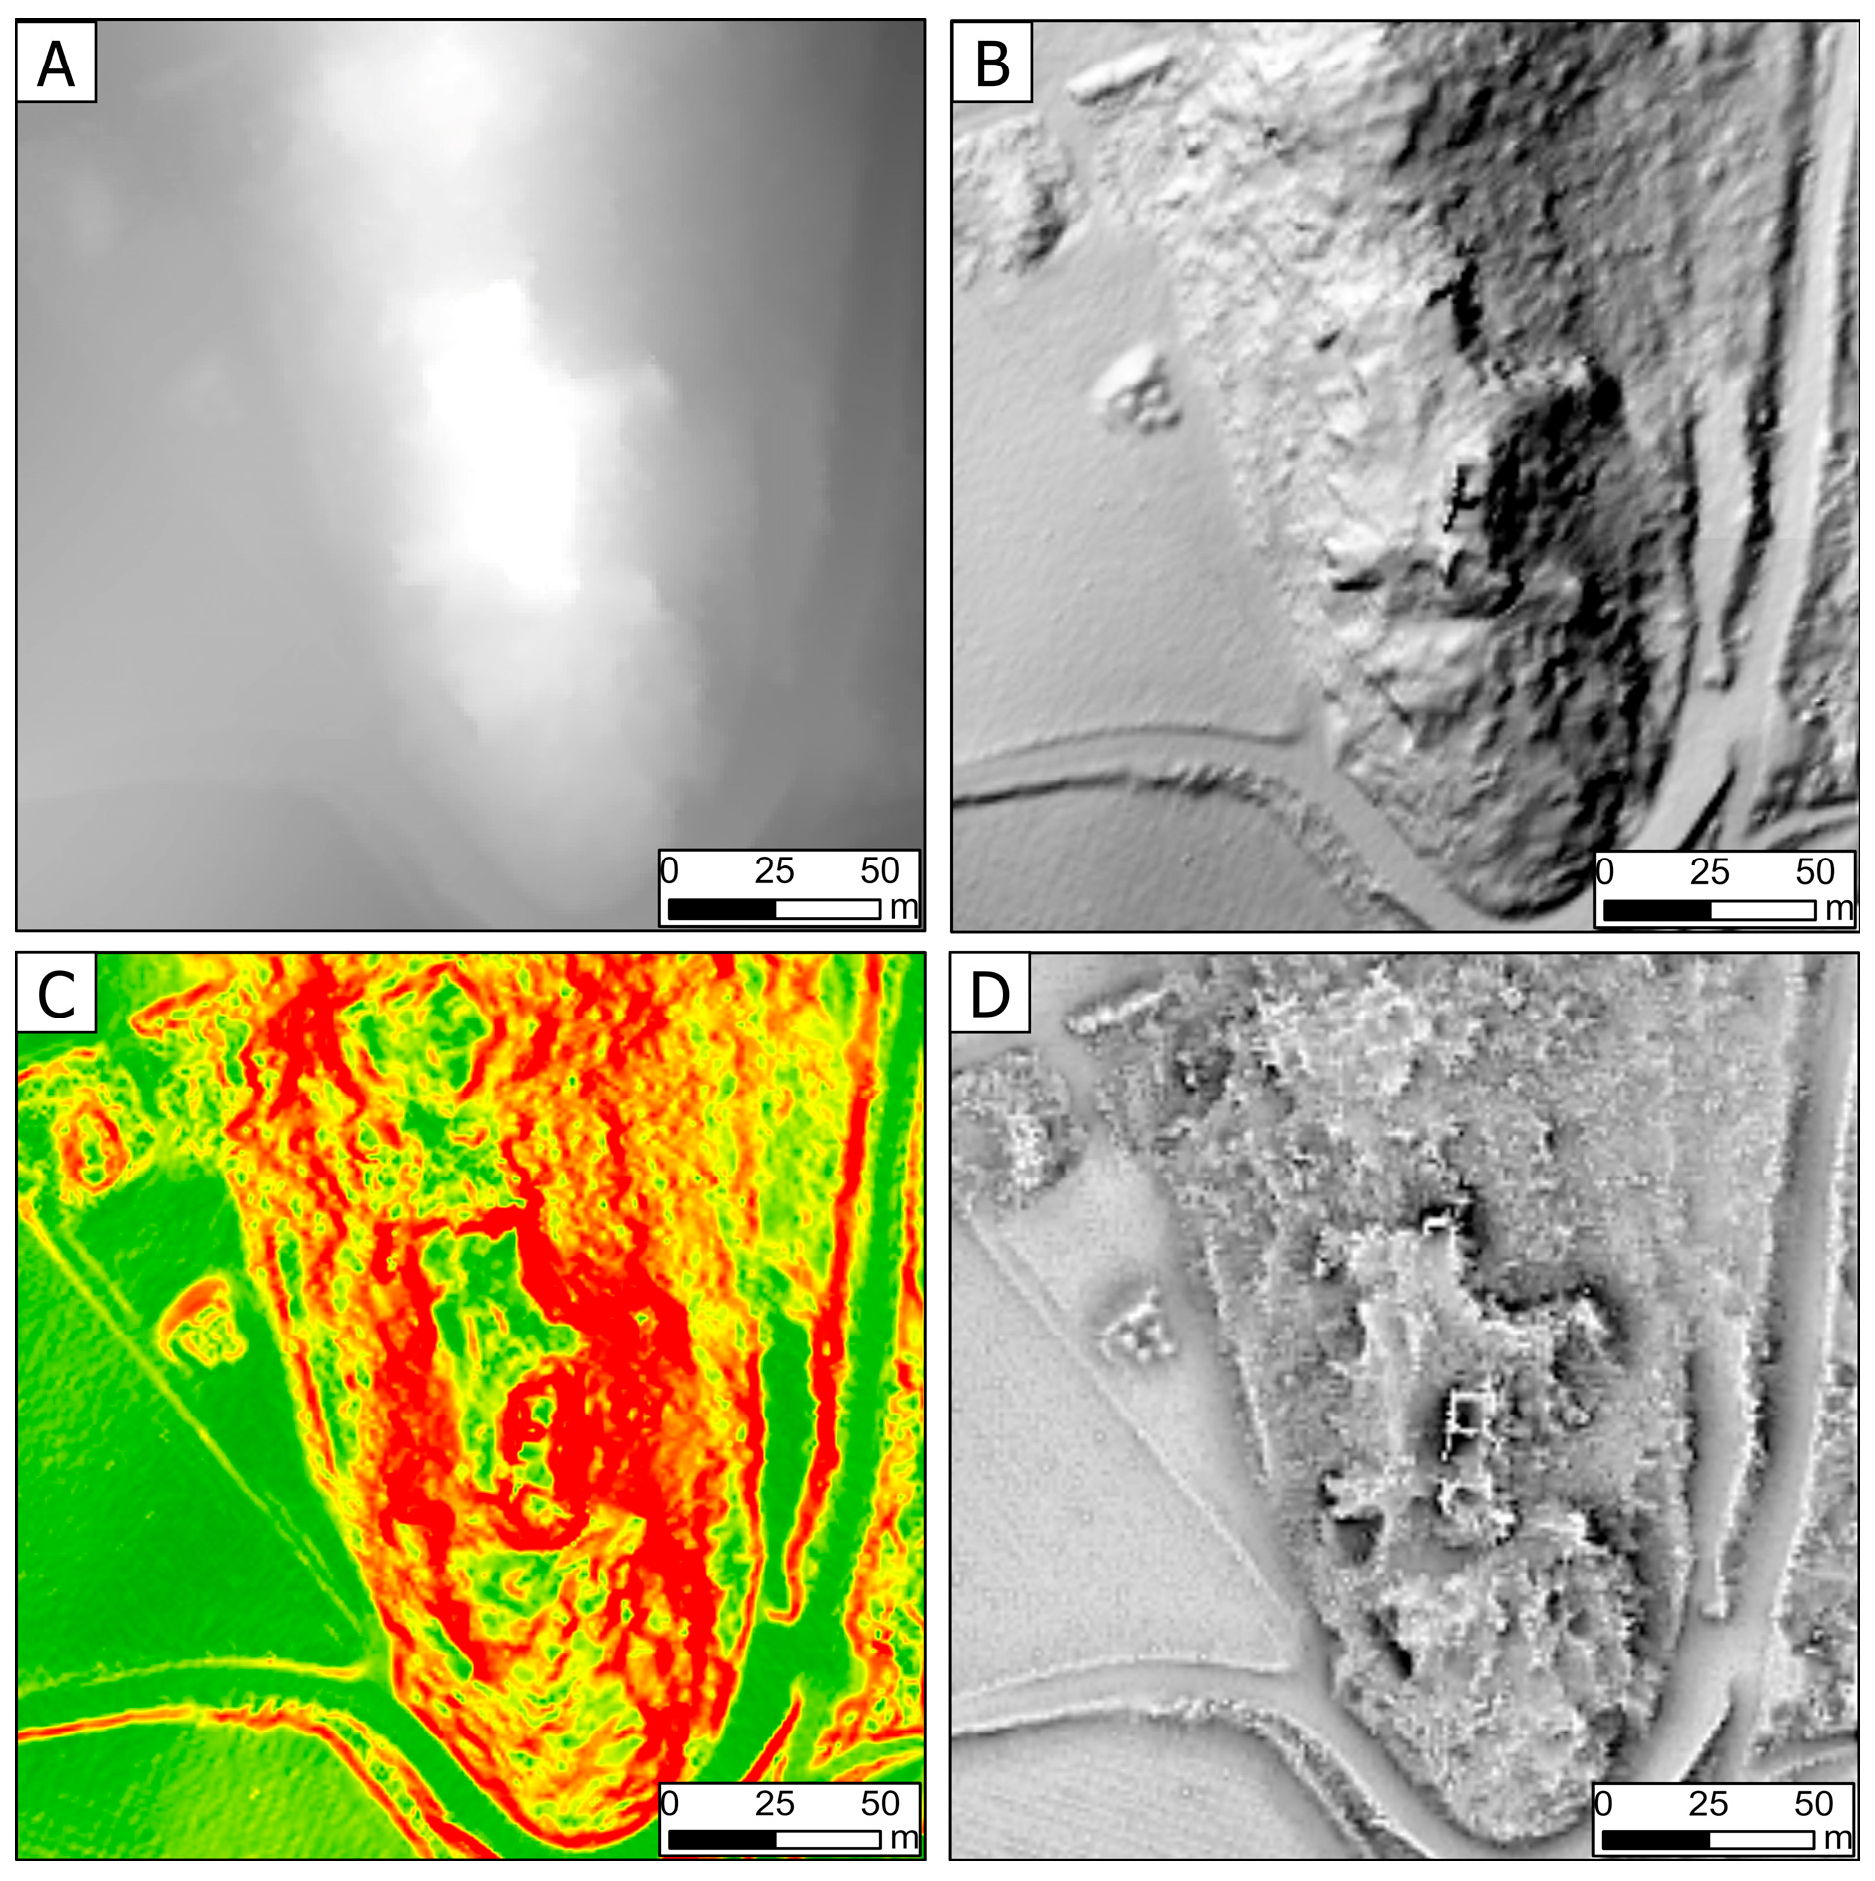
4.1. DEM and LDMs

The selection of the correct classification algorithm for point clouds is a critical step for all subsequent processing of Airborne LiDAR data. Once the vegetation-free point cloud was obtained, the DEM was generated using the las2dem algorithm from LASTools, selecting terrain points (class 2) and building points (class 6) [61]. The final phase involved the creation of LDMs based on the application of several visualisation techniques; this methodology aims to effectively and comprehensively represent the three-dimensional information obtained from LiDAR surveys through an improved visual representation of the DEM. These techniques are used to identify and detect topographical and morphological features, but they are also crucial for mapping and analysing potential archaeological elements on the terrain. The LDMs were processed using RVT 2.2.1 (Relief Visualisation Toolbox) [62] and included Hillshade (HS), Slope Analysis (Slope) [63,64,65], Openness Positive (OP), Anisotropic Sky View Factor (ASVF), Sky View Factor (SVF), and Visualization for Archaeological Topography (VAT) (Figure 4 and Figure 5).
Visualisation techniques are essential for improving the definition and enabling the interpretation of archaeological features. However, no single visualisation technique is effective in all contexts; each method has its strengths and limitations, making it necessary to choose techniques based on the specific goals. For instance, some techniques are more useful for highlighting large-scale archaeological features such as terraces or paleochannels, whereas others are better suited to emphasising microreliefs.
A wide range of visualisation methods is based on illumination, such as HS, which uses a precise light source defined by azimuth and elevation angle. However, the major limitation of HS is that features aligned parallel to the light source are not adequately highlighted, and it may produce false reliefs, compromising topographic perception [33,66,67,68]. ASVF, on the other hand, considers a non-uniformly bright sky, where brightness depends on azimuth and the solar distance from an imaginary light source, reintroducing some of the “plasticity” observed in HS, which depends on light direction. This characteristic makes ASVF similar to directional methods such as HS but retaining its ability to visualise complex features on flat terrain [69].
To overcome these directional issues, it is possible to produce different illumination angles (Multi-Hillshade or Principal Component Analysis) [19,33,70,71] or to use techniques based on diffuse lighting, such as SVF [69,72,73] or Openness (Positive or Negative) [33,74,75]. Especially these last two techniques, while less effective for providing a general understanding of the topographic context, offer better visualisation of small-scale elements, highlighting small convexities such as edges and ridges, regardless of their orientation or shape. In particular, OP, independent of light direction, proved especially useful for identifying microtopography and subtle terrain variations at Castel Fenuculus.
However, the LDMs present some limitations, particularly in the accurate representation of the surviving walls of the dungeon, which appear unclear due to the altitude difference. The related distortions, especially evident in the eastern section, are attributable to the construction type of the keep; the sloped masonry at the base was captured by the ALS pulses in several phases: first the top of the structure, then the middle part, and finally the base. This process caused some distortions in the visualisation techniques (especially ASVF and SVF), which were also amplified by the considerable height of the donjon.
In archaeology, combining various visualisation techniques, integrated in a combined representation, provides significant advantages for surveying and identifying buried or semi-buried remains. One notable application is VAT, which involves the fusion of different techniques (SVF, OP, Slope, HS, or Multi-HS) to maximise visible details without sacrificing the overall context, allowing features relevant to specific objectives to be emphasised [21,40,41]. Indeed, the fusion of different visualisation techniques overcomes the inherent limitations of specific techniques, such as azimuthal height or beam direction. VAT proved particularly effective for the identification and interpretation of the archaeological features of Castel Fenuculus and allowed for the simultaneous visualisation of distinct topographical features in a single image, thus improving the legibility of the archaeological traces on the ground.

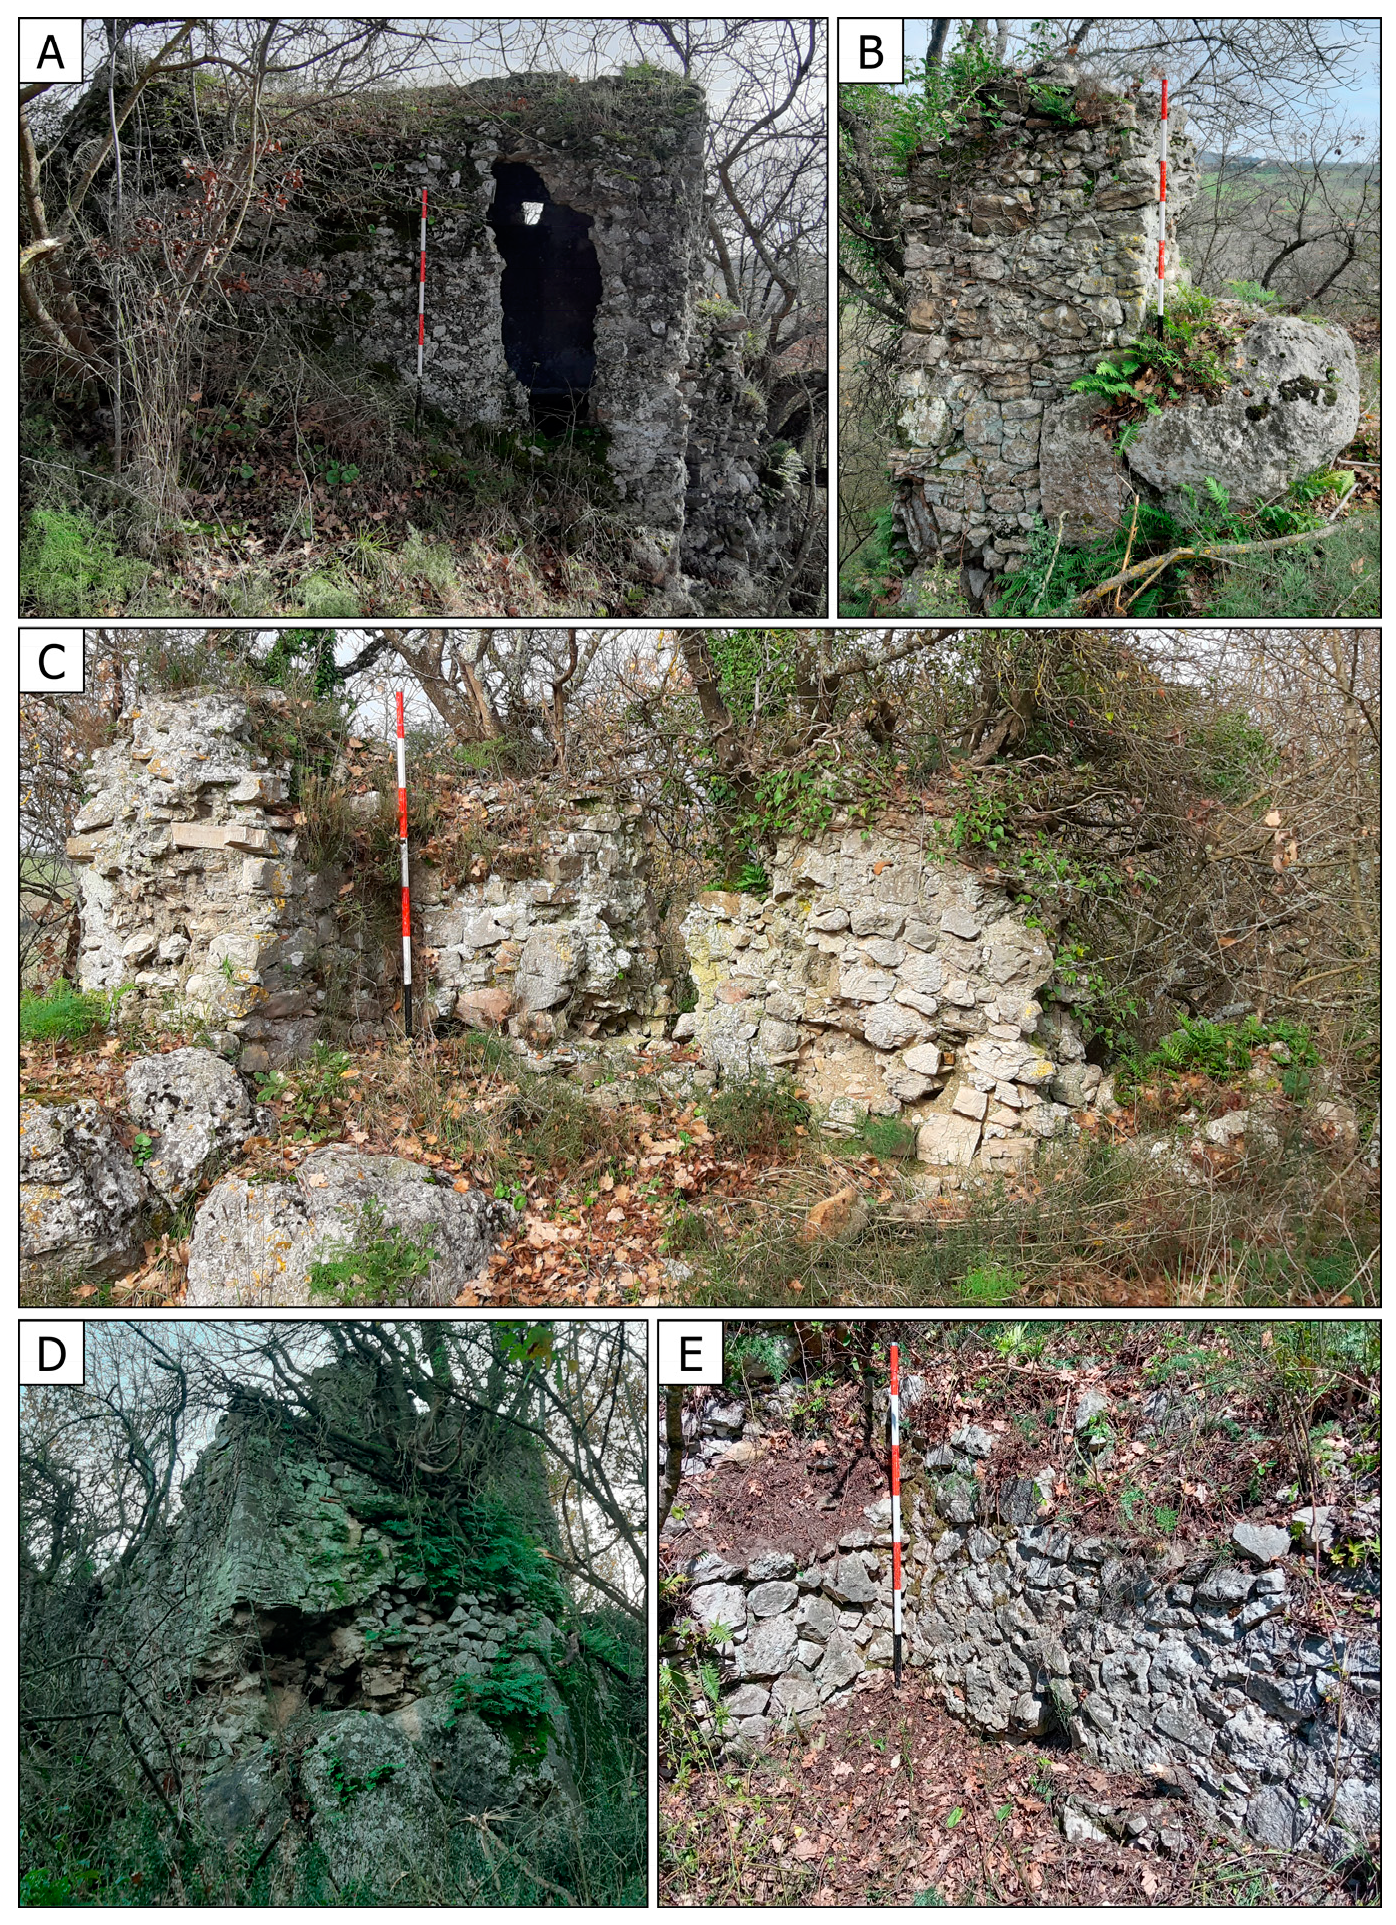
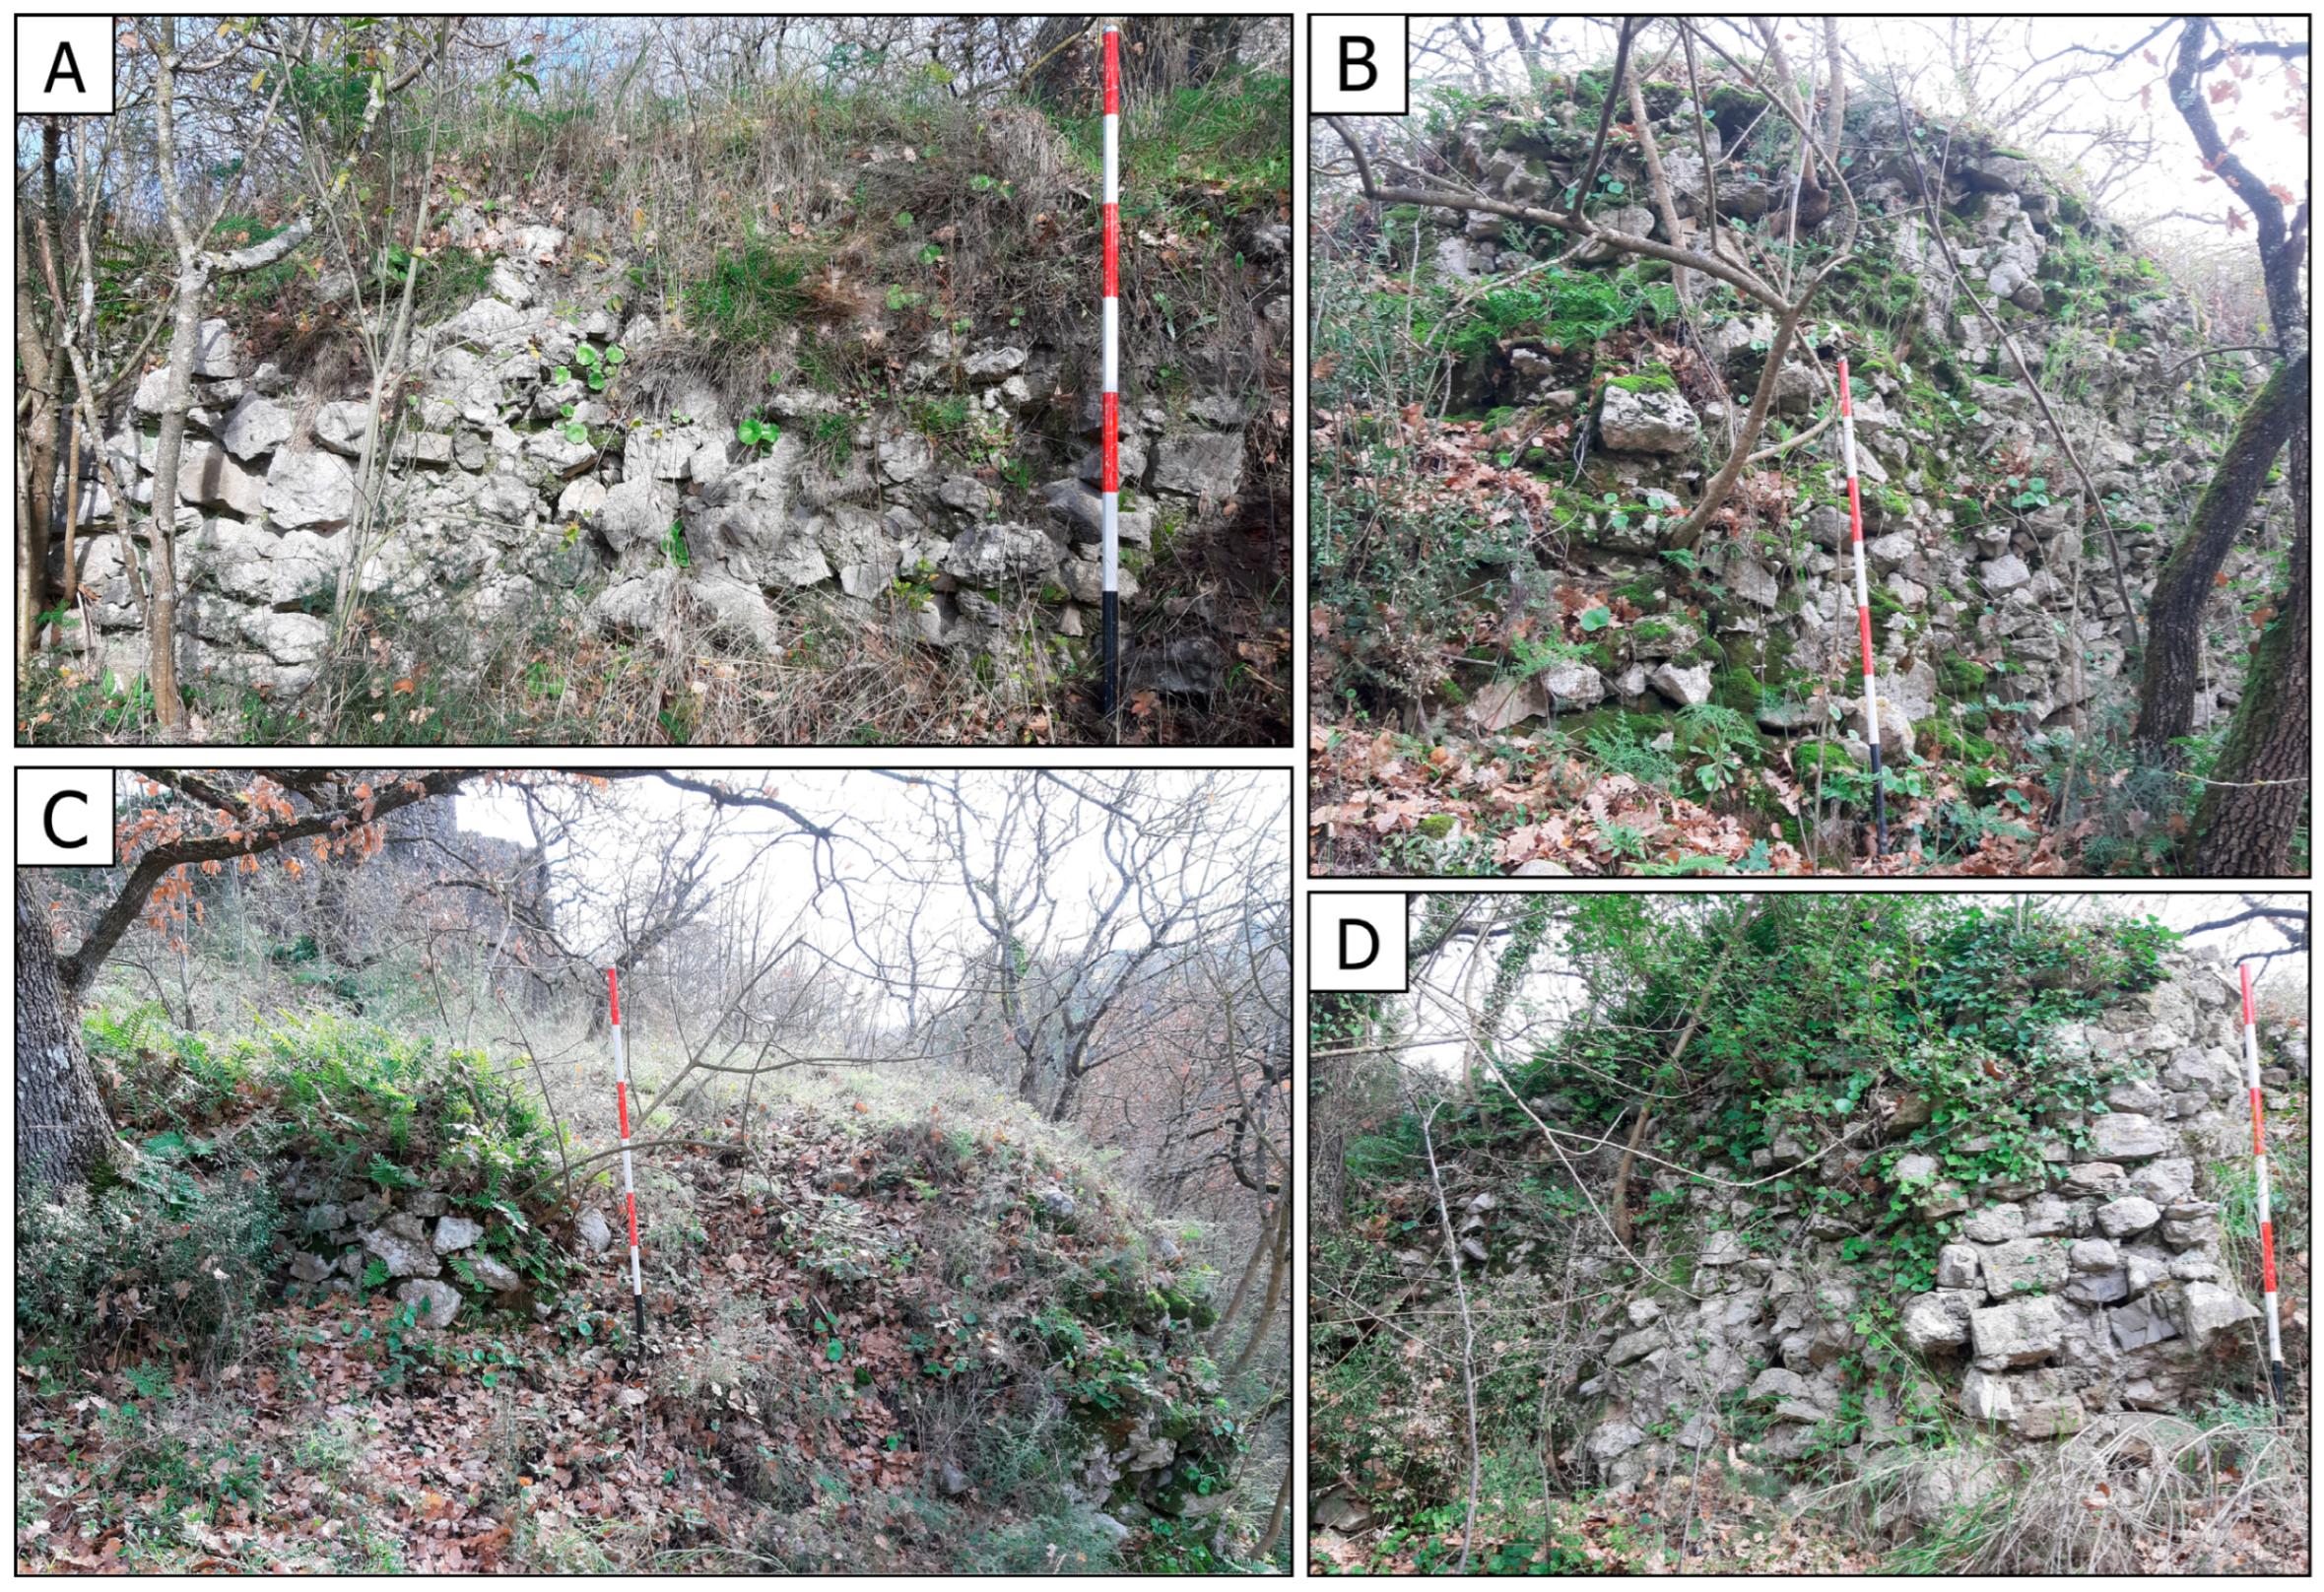
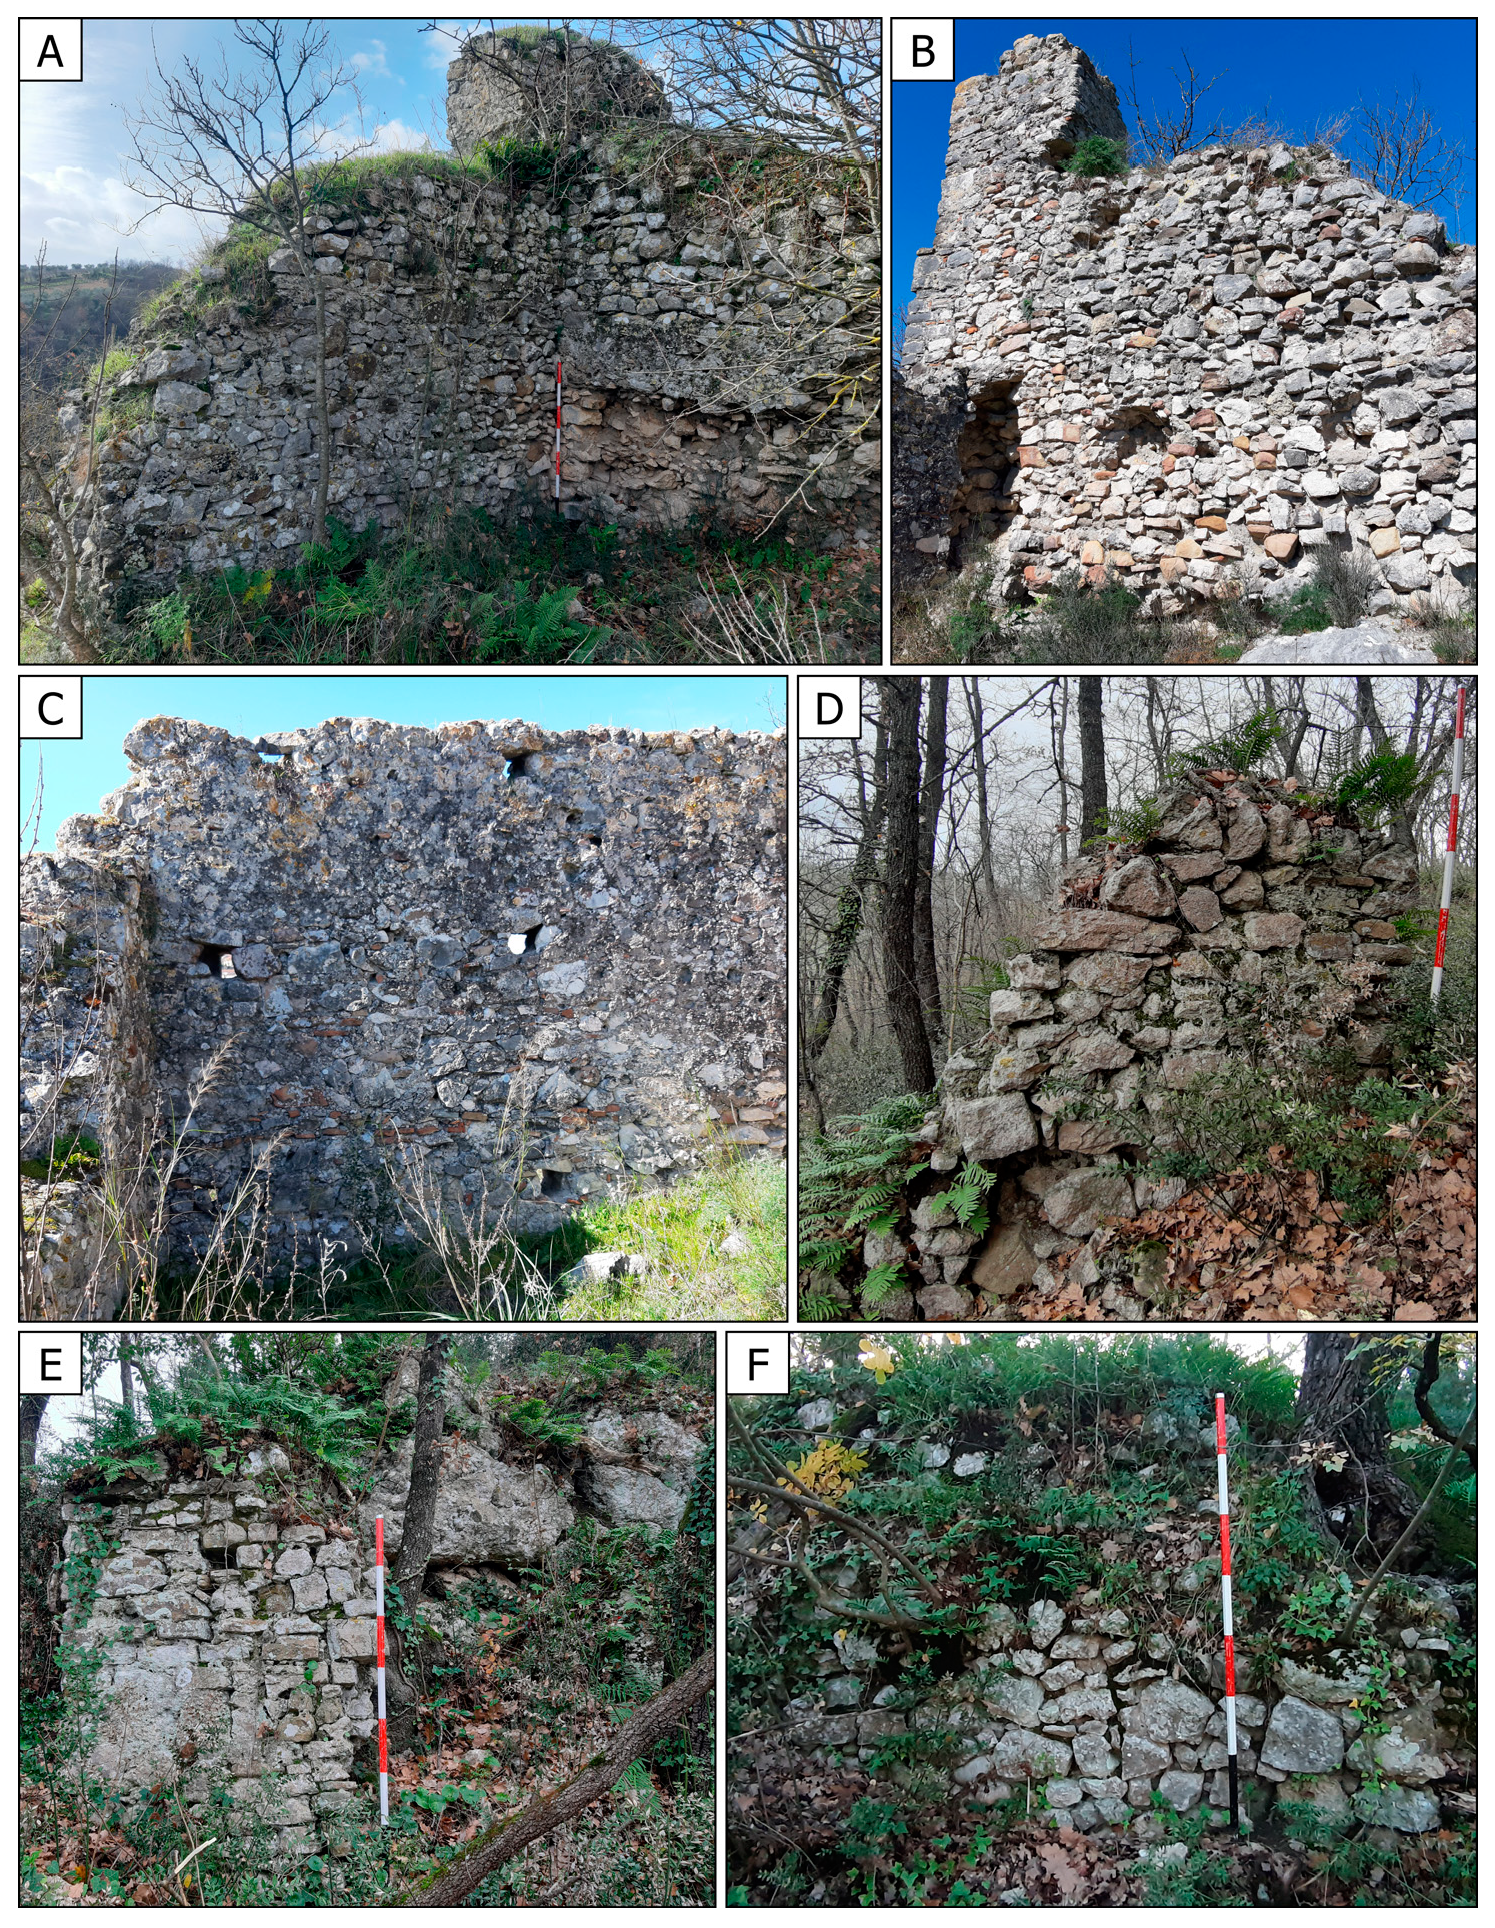
4.2. Analysis of the Identified Archaeological Features

The outputs derived from the application of the different visualisation techniques were imported into the GIS, allowing for accurate representation and spatial placement of the identified archaeological elements. This process allowed for the precise mapping and categorisation of wall structures, which were marked in red: solid red lines indicate confirmed structures, while dashed red lines represent hypothesised structures (these correspond to microrelief traces that could not be confirmed through an autoptic inspection because these are probably buried structures hidden by dense undergrowth) (Figure 6A,B).
This step proved essential for the phase of interpretation of urban architecture. The information obtained provided greater clarity on the structural components of the castle layout, which, although it does not appear highly complex, could be delineated with greater precision compared to what would have been possible through direct observation alone. Subsequent to this analysis, targeted areas, selected on the basis of the previously identified microrelief traces, underwent in situ visual inspections. Thanks to these field surveys, it was possible to identify and photographically document the masonry structures highlighted in the LDMs.
The survey activities and in-situ reconnaissance served a dual purpose. On the one hand, they were necessary to verify and document as archaeological evidence those traces already identified and hypothesised through the interpretative analysis conducted on the LDMs. On the other hand, the fieldwork allowed for the assessment of LiDAR’s actual potential and capacity in detecting the archaeological record.
The various processed LDMs suggest that the decision to fortify the southern part of the hill by building a castle was likely dictated by the geological conformation of the hill itself. The northern section, in fact, is characterised by significant rocky outcrops that create a complex altimetry, with a discontinuous and irregular profile due to the alternation of ridges and depressions. The area was clearly considered unsuitable for construction, both due to its ruggedness, which would have required excessive effort and levelling work, and because of the difficulty in transporting building materials.
Only a few ruins of the castle remain; consequently, the complete plan is only conjectural, as the relationship between the surface remains (still largely covered by dense vegetation) and the actual underlying archaeological situation is of difficult interpretation. However, the data highlighted by the visualisation of the LDMs, later integrated by further autoptic investigations, suggest that the layout is similar to other Norman castles (Figure 6B). It is possible to identify a quadrangular structure of considerable size located at the highest point of the southern section of the ridge, close to the eastern slope. This building, now lacking the eastern wall, partially uses the rock as a foundation and has a sloped base; it will probably be identified as the donjon (Figure 7B, no. 2; C, no. 3).
The central keep is supported by thinner walls belonging to another chamber, probably from a later phase; this architectural feature is well documented in other Norman constructions in southern Italy, in Terra di Lavoro [76,77,78]. These new masonry elements reveal a complex architectural and planimetric organisation, the result of successive building phases over the centuries, which may suggest changes in the settlement’s functional characteristics from an originally military outpost to a predominantly residential function. This transformation reflects not only practical and strategic adaptations but also socio-economic and cultural changes that influenced the use of space over time (Figure 7A, no. 1).
Adjoining the southern walls is a rectangular chamber, oriented north-south, with semicircular short sides and a barrel-vaulted roof, possibly interpreted as a cistern, as the inner walls are coated with plaster, likely composed of hydraulic mortar (Figure 8A, no. 4).
In the northeastern corner, the remains of a partially collapsed quadrangular tower are embedded in the walls, resting directly on the rock bed (Figure 8B, no. 5; C, no. 6; D, no. 7). Thanks to the visualisation techniques applied to the DEM, it was possible to identify a drop in elevation located directly to the right of the probable cistern, thus guiding the survey in that specific area. Here, after removing vegetation, it was possible to identify and document a masonry wall (Figure 8E, no. 8). Several other masonry elements were traced, one along the southern slopes to the left of the probable cistern (Figure 9A, no. 9); another, oriented east-west, to the northwest (Figure 9C, no. 10); and two others, also to the northwest (Figure 9B, no. 11; D, no. 12).
The construction technique used for these masonry walls, especially visible in the remains of the northeast tower and the eastern walls, consists of irregular stonework (opus incertum) with a particularly compact inner core, featuring abundant cementitious mortar and rough stone blocks. The facing is made using heterogeneous rubble, including both limestone blocks and medium-sized riverine materials, roughly hewn and laid in irregular courses [77,78].
The donjon itself features an internal masonry composed of rough limestone blocks and small to medium-sized river stones, while the external masonry is made of poorly worked parallelepipedal blocks, slightly larger in size, with the notable use of large cornerstones, particularly in the better-preserved left-hand corner section. In this part, the construction takes advantage of the rock base, which serves as a foundation for the superstructure. The unevenly laid courses, with chippings and small stones used for wedging, seem to characterise this structure (Figure 9A–C).
Some quarrying marks found on the northern and southern slopes suggest that materials for construction were likely sourced directly from the hill. This practice was also common in other similar and chronologically close medieval contexts. It is also plausible that the material came from other possible quarries located nearby (to the south and on the left of the Fornace valley or on the northern slope of a neighbouring hill). The analysis of the masonry technique reveals that the heterogeneity of the stone materials used was due to extraction from different sources, particularly near the river below. The poor workmanship of the building materials indicates that there was no clear distinction between specialised labourers, while the irregularly laid courses and the use of abundant mortar suggest rapid execution, reflecting a quick military reorganisation. These characteristics bear similarities to contemporary nearby settlements, such as Torre Palazzo castle and Ferrarisi tower, indicating a common building strategy and territorial setup within the studied context [79].
Finally, the interpretation of the LDMs revealed some microrelief traces on the plateau, which may indicate buried structures (Figure 6B nos. 13–14) The absence of additional masonry remains could also suggest the former presence of buildings made from perishable materials, such as wood [76,80]. LiDAR was crucial in guiding field investigations, particularly in identifying and spatially locating several masonry walls along the northwest slope of the hill. Three walls were confirmed through field surveys, while another was hypothesised based on microrelief traces highlighted by the visualisation techniques used (Figure 10D,E; Figure 6B no. 15 and no. 16). North of the plateau, ASVF and especially VAT with MH helped pinpoint a masonry wall, documented through field surveys (Figure 10F; Figure 6B no. 17), and identified further traces that could correspond to buried archaeological structures (Figure 6B, no. 18). The function of these architectural elements remains uncertain and difficult to interpret, but it is possible they were residential buildings that developed along the hill slope, in an area with a gentler gradient, suggesting a possible settlement pattern aligned with the natural topography. These findings underline the effectiveness of airborne LiDAR data and visualisation techniques in detecting archaeological details that are difficult to identify using traditional methods.

5. Conclusions

This study is based on the analysis of data obtained through an aerial LiDAR survey carried out from the MATTM, whose potential had already been assessed in similar archaeological surveys, although with different filtering and classification methodologies than the ones proposed here. In fact, this research includes the application of various point cloud classification algorithms to identify the most suitable one and proposes a useful and replicable solution for similar hilly environments where archaeological remains are covered by vegetation, significantly hindering their identification and interpretation. Therefore, the case of Castel Fenuculus demonstrates that, in certain contexts, it is not always possible to apply a standardised filtering process, and specific adjustments must be made according to the type of location to maximise the potential; nonetheless, the benefits of a systematic and standardised approach, applicable to wide areas, far outweigh the disadvantages.
The generation of the DEM, derived from the classification and filtering of the point cloud, proved essential for the investigation conducted on the Norman site in question. It allowed for overcoming the challenges posed by the tree cover and provided a detailed representation of the microtopography, which was crucial for analysing the archaeological features. Moreover, the visualisation techniques (HS, Slope, ASVF, SVF, OP, VAT), cross-referenced and integrated with in situ surveys to ensure the highest reliability of information, facilitated the identification and interpretation phases, contributing to a clearer understanding of the ancient topography of the area and the structure of Castel Fenuculus.
The investigation carried out on the mediaeval site of Castel Fenuculus highlights the capability of LiDAR to detect archaeological traces in a hilly context characterised by dense vegetation thanks to its ability to provide a precise representation of the ground’s microtopography. LiDAR also proved to be crucial in guiding field research, enabling the identification and specific spatial location of some wall remains. One was completely covered by vegetation and located in the southeastern area, near the cistern (Figure 6B, no. 8). Others were on the northwestern (Figure 6B, nos. 15–16) and northern slope of the hill (Figure 6B, nos. 17). Additionally, the identification of microrelief traces through various visualisation techniques suggested the possible existence of buried, currently invisible structures. These may be located both on the plateau (Figure 6B, nos. 13–14) directly north of the donjon and in the central part of the hill (Figure 6B, nos. 16, 18). The in situ surveys, which enabled the verification and documentation of the wall sections identified through the interpretation of traces highlighted by the LiDAR data, could serve as a starting point for developing a gradual approach to the reconstruction and restoration of the castle. In this context, it would be advisable to include Castel Fenuculus in a more in-depth study, based on comparisons with other typologically similar and contemporaneous structures, with the aim of formulating effective and targeted restoration interventions.
One of the main limitations of the ALS data provided by MATTM is the poor territorial coverage, which prevents an adequate representation of the Italian landscape and strongly restricts large-scale archaeological prospection studies. The great versatility of LiDAR technology, applied in various scientific fields, highlights the need for a remote sensing plan aimed at acquiring data with wider spatial coverage, better data quality, and higher point density. This initiative, which could be achieved with funding from the Italian government, would strengthen not only archaeological prospecting but also environmental monitoring, urban planning, and natural disaster risk management.
Another limitation is the quality and the low resolution of the data, which, while adequate for the preliminary identification of sites, often does not allow for detailed mapping and analysis of all archaeological features, especially in areas with dense vegetation cover. This constraint underscores the importance of integrating additional LiDAR technologies, such as Terrestrial Laser Scanning (TLS), Mobile Laser Scanning (MLS), and UAV Laser Scanning, in future archaeological investigations. Indeed, the case study of Castel Fenuculus could benefit enormously from the integration of these other types of LiDAR data. Research conducted with these technologies would certainly enable the recognition and interpretation of small-scale details, even in complex topographies, and provide a deeper understanding of the archaeological record. Thanks to these methods and a multi-perspective approach, it is possible to obtain a point cloud acquired from different viewpoints with a high resolution. Not only would this significantly improve the accuracy of the DTM, but it would also favour the opportunity to make new discoveries. In conclusion, this study shows the potential of ALS technology and highlights the significant utility of this specific data type, especially in complex natural contexts, while acknowledging its current limitations in resolution. Furthermore, together with the most recent research, it contributes to the broader dissemination of LiDAR for the detection and preservation of cultural heritage in Italy but with transfer value to similar areas, and it lays the groundwork for future archaeological survey applications.

Funding

This research received no external funding.

Data Availability Statement

Data are contained within the article.

Acknowledgments

Airborne LiDAR investigations on Castel Fenuculus are part of the research carried out by Antonio Corbo, entitled Remote Sensing for Cultural Heritage, of the National PhD Course on Earth Observation (DNEO) by Sapienza University of Rome.

Conflicts of Interest

The author declare no conflicts of interest.

References

  1. Lasaponara, R.; Masini, N. Full-waveform Airborne Laser Scanning for the detection of medieval archaeological microtopographic relief. J. Cult. Herit. 2009, 10, e78–e82. [Google Scholar] [CrossRef]
  2. Lasaponara, R.; Coluzzi, R.; Gizzi, F.T.; Masini, N. On the LiDAR contribution for the archaeological and geomorphological study of a deserted medieval village in Southern Italy. J. Geophys. Eng. 2010, 7, 155–163. [Google Scholar] [CrossRef]
  3. Masini, N.; Coluzzi, R.; Lasaponar, R. On the Airborne Lidar Contribution in Archaeology: From Site Identification to Landscape Investigation. In Laser Scanning, Theory and Applications; Wang, C.-C., Ed.; InTech: London, UK, 2011; ISBN 978-953-307-205-0. [Google Scholar]
  4. Masini, N.; Lasaponara, R. Airborne Lidar in Archaeology: Overview and a Case Study. In Computational Science and Its Applications–ICCSA 2013; Murgante, B., Misra, S., Carlini, M., Torre, C.M., Nguyen, H.-Q., Taniar, D., Apduhan, B.O., Gervasi, O., Eds.; Springer: Berlin/Heidelberg, Germany, 2013; Volume 7972, pp. 663–676. ISBN 978-3-642-39642-7. [Google Scholar]
  5. Crutchley, S.P. The Light Fantastic: Using Airborne Lidar in Archaeological Survey; Archaeology Data Service: York, UK, 2018; p. 1. [Google Scholar]
  6. Doneus, M.; Briese, C. Digital Terrain Modelling for Archaeological Interpretation within Forested Areas using Full-Waveform Laserscanning. In Proceedings of the VAST: International Symposium on Virtual Reality, Nicosia, Cyprus, 29 November–2 December 2006; The Eurographics Association: Geneva, Switzerland, 2006; pp. 155–162. [Google Scholar] [CrossRef]
  7. Crow, P.; Benham, S.; Devereux, B.; Amable, G. Woodland vegetation and its implications for archaeological survey using LiDAR. Forestry 2007, 80, 241–252. [Google Scholar] [CrossRef]
  8. Doneus, M.; Höfle, B.; Kempf, D.; Daskalakis, G.; Shinoto, M. Human-in-the-loop development of spatially adaptive ground point filtering pipelines—An archaeological case study. Archaeol. Prospect. 2022, 29, 503–524. [Google Scholar] [CrossRef]
  9. Doneus, M.; Briese, C. Airborne Laser Scanning in forested areas–potential and limitations of an archaeological prospection technique. In Remote Sensing for Archaeological Heritage Management: Proceedings of the 11th EAC Heritage Management Symposium, Reykjavík, Iceland, 25–27 March 2010; EAC: Brussels, Belgium, 2011; pp. 59–76. ISBN 978-963-9911-20-8. [Google Scholar]
  10. Devereux, B.J.; Amable, G.S.; Crow, P.; Cliff, A.D. The potential of airborne lidar for detection of archaeological features under woodland canopies. Antiquity 2005, 79, 648–660. [Google Scholar] [CrossRef]
  11. Doneus, M.; Briese, C.; Fera, M.; Janner, M. Archaeological prospection of forested areas using full-waveform airborne laser scanning. J. Archaeol. Sci. 2008, 35, 882–893. [Google Scholar] [CrossRef]
  12. Vinci, G.; Vanzani, F.; Fontana, A.; Campana, S. LiDAR Applications in Archaeology: A Systematic Review. Archaeol. Prospect. 2024, arp.1931. [Google Scholar] [CrossRef]
  13. Masini, N.; Gizzi, F.T.; Biscione, M.; Fundone, V.; Sedile, M.; Sileo, M.; Pecci, A.; Lacovara, B.; Lasaponara, R. Medieval Archaeology Under the Canopy with LiDAR. The (Re)Discovery of a Medieval Fortified Settlement in Southern Italy. Remote Sens. 2018, 10, 1598. [Google Scholar] [CrossRef]
  14. Ronchi, D.; Limongiello, M.; Barba, S. Correlation among Earthwork and Cropmark Anomalies within Archaeological Landscape Investigation by Using LiDAR and Multispectral Technologies from UAV. Drones 2020, 4, 72. [Google Scholar] [CrossRef]
  15. Danese, M.; Gioia, D.; Vitale, V.; Abate, N.; Amodio, A.M.; Lasaponara, R.; Masini, N. Pattern Recognition Approach and LiDAR for the Analysis and Mapping of Archaeological Looting: Application to an Etruscan Site. Remote Sens. 2022, 14, 1587. [Google Scholar] [CrossRef]
  16. Masini, N.; Abate, N.; Gizzi, F.; Vitale, V.; Minervino Amodio, A.; Sileo, M.; Biscione, M.; Lasaponara, R.; Bentivenga, M.; Cavalcante, F. UAV LiDAR Based Approach for the Detection and Interpretation of Archaeological Micro Topography under Canopy—The Rediscovery of Perticara (Basilicata, Italy). Remote Sens. 2022, 14, 6074. [Google Scholar] [CrossRef]
  17. Di Maio, R.; Emolo, A.; Frisetti, A.; Abate, N.; La Manna, M.; Pierri, I.; Salone, R.; Tarantino, S. Reconstruction of archaeological contexts through the integrated use of airborne LiDAR and geophysical survey: The case study of San Pietro Infine (Caserta, southern Italy). J. Archaeol. Sci. Rep. 2023, 49, 104013. [Google Scholar] [CrossRef]
  18. Silva-Fragoso, A.; Norini, G.; Nappi, R.; Groppelli, G.; Michetti, A.M. Improving the Accuracy of Digital Terrain Models Using Drone-Based LiDAR for the Morpho-Structural Analysis of Active Calderas: The Case of Ischia Island, Italy. Remote Sens. 2024, 16, 1899. [Google Scholar] [CrossRef]
  19. Forlin, P. Airborne LiDAR data analysis within the Alpine landscapes of Trentino: A methodological approach. Post-Class. Archaeol. 2012, 2, 247–268. [Google Scholar]
  20. Colecchia, A.; Forlin, P. Visibilità e interpretazione del record archeologico in aree d’altura; Le potenzialità dell’analisi del LiDAR DTM. In APSAT 2: Paesaggi d’altura del Trentino: Evoluzione Naturale e Aspetti Culturali; Angelucci, D.E., Ed.; SAP: Mantova, Italy, 2013; pp. 41–60. [Google Scholar]
  21. Fontana, G. Italy’s Hidden Hillforts: A Large-Scale Lidar-Based Mapping of Samnium. J. Field Archaeol. 2022, 47, 245–261. [Google Scholar] [CrossRef]
  22. Bernardini, F. Rediscovering the Lost Roman Landscape in the Southern Trieste Karst (North-Eastern Italy): Road Network, Land Divisions, Rural Buildings and New Hints on the Avesica Road Station. Remote Sens. 2023, 15, 1506. [Google Scholar] [CrossRef]
  23. Fontana, G. Issues of Sampling and Representativeness in Large-Scale LiDAR-Derived Archaeological Surveys in Mediterranean Contexts. Archaeol. Prospect. 2024, arp.1951. [Google Scholar] [CrossRef]
  24. Hutson, S.R. Adapting LiDAR data for regional variation in the tropics: A case study from the Northern Maya Lowlands. J. Archaeol. Sci. Rep. 2015, 4, 252–263. [Google Scholar] [CrossRef]
  25. Verhoeven, G.; Vermeulen, F. Engaging with the Canopy—Multi-Dimensional Vegetation Mark Visualisation Using Archived Aerial Images. Remote Sens. 2016, 8, 752. [Google Scholar] [CrossRef]
  26. Doneus, M.; Mandlburger, G.; Doneus, N. Archaeological Ground Point Filtering of Airborne Laser Scan Derived Point-Clouds in a Difficult Mediterranean Environment. J. Comput. Appl. Archaeol. 2020, 3, 92–108. [Google Scholar] [CrossRef]
  27. Doneus, M.; Banaszek, Ł.; Verhoeven, G.J. The Impact of Vegetation on the Visibility of Archaeological Features in Airborne Laser Scanning Datasets from Different Acquisition Dates. Remote Sens. 2022, 14, 858. [Google Scholar] [CrossRef]
  28. Sithole, G.; Vosselman, G. Filtering of airborne laser scanner data based on segmented point clouds. In Proceedings of the ISPRS Workshop Laser Scanning 2005, Enschede, The Netherlands, 12–14 September 2005. [Google Scholar]
  29. Meng, X.; Currit, N.; Zhao, K. Ground Filtering Algorithms for Airborne LiDAR Data: A Review of Critical Issues. Remote Sens. 2010, 2, 833–860. [Google Scholar] [CrossRef]
  30. Prufer, K.M.; Thompson, A.E.; Kennett, D.J. Evaluating airborne LiDAR for detecting settlements and modified landscapes in disturbed tropical environments at Uxbenká, Belize. J. Archaeol. Sci. 2015, 57, 1–13. [Google Scholar] [CrossRef]
  31. Suleymanoglu, B.; Soycan, M. Comparison of filtering algorithms used for DTM production from airborne lidar data: A case study in Bergama, Turkey. Geod. Vestn. 2019, 63, 395–414. [Google Scholar] [CrossRef]
  32. Buján, S.; Cordero, M.; Miranda, D. Hybrid Overlap Filter for LiDAR Point Clouds Using Free Software. Remote Sens. 2020, 12, 1051. [Google Scholar] [CrossRef]
  33. Kokalj, Ž.; Hesse, R. Airborne Laser Scanning Raster Data Visualization: A Guide to Good Practice; Založba ZRC: Ljubljana, Slovenia, 2017; Volume 14. [Google Scholar]
  34. Devereux, B.J.; Amable, G.S.; Crow, P. Visualisation of LiDAR terrain models for archaeological feature detection. Antiquity 2008, 82, 470–479. [Google Scholar] [CrossRef]
  35. Kokalj, Ž.; Oštir, K.; Veljanovski, T.; Kobler, A. Support of advanced lidar data visualisations for past cultural features recovery in vegetated areas: Past water streams, bronze age hill forts, past settlements, WW1 trenches and shell craters. In Proceedings of the 2010 AARG Aerial Archaeology, Remote Sensing and the Archaeological Process, Budapest, Hungary, 13–15 September 2012. [Google Scholar] [CrossRef]
  36. Challis, K.; Forlin, P.; Kincey, M. A Generic Toolkit for the Visualization of Archaeological Features on Airborne LiDAR Elevation Data. Archaeol. Prospect. 2011, 18, 279–289. [Google Scholar] [CrossRef]
  37. Bennett, R.; Welham, K.; Hill, R.A.; Ford, A. A Comparison of Visualization Techniques for Models Created from Airborne Laser Scanned Data. Archaeol. Prospect. 2012, 19, 41–48. [Google Scholar] [CrossRef]
  38. Štular, B.; Kokalj, Ž.; Oštir, K.; Nuninger, L. Visualization of lidar-derived relief models for detection of archaeological features. J. Archaeol. Sci. 2012, 39, 3354–3360. [Google Scholar] [CrossRef]
  39. Kokalj, Ž.; Zakšek, K.; Oštir, K. Visualizations of lidar derived relief models. In Interpreting Archaeological Topography; 3D Data, Visualisation and Observation; Opitz, R.S., Cowley, D.C., Eds.; Oxbow Books: Oxford, UK, 2013; pp. 100–114. ISBN 978-1-84217-516-3. [Google Scholar]
  40. Kokalj, Ž.; Somrak, M. Why Not a Single Image? Combining Visualizations to Facilitate Fieldwork and On-Screen Mapping. Remote Sens. 2019, 11, 747–773. [Google Scholar] [CrossRef]
  41. Verbovšek, T.; Popit, T.; Kokalj, Ž. VAT Method for Visualization of Mass Movement Features: An Alternative to Hillshaded DEM. Remote Sens. 2019, 11, 2946–2960. [Google Scholar] [CrossRef]
  42. Federici, V. (Ed.) Chronicon Vulturnense del Monaco Giovanni; Fonti per la Storia d’Italia (Medio Evo 58-60); Tipografia del Senato: Rome, Italy, 1925; pp. 58–60. [Google Scholar]
  43. Cuozzo, E.; Martin, J.-M. Documents inédits ou peu connus des archives du Mont- Cassin (VIIIe-Xe siècle). Mélanges Ecole Fr. Rome Moyen Âge 1991, 103, 115–210. [Google Scholar] [CrossRef]
  44. Martin, J.M.; Chastang, P.; Cuozzo, E.; Feller, L.; Orofino, G.; Thomas, A.; Villani, M. (Eds.) Registrum Petri Diaconi: Montecassino, Archivio dell’abbazia, reg. 3; Sources et documents 4; Fonti per la storia dell’Italia medievale; Antiquitates 45; ECOLE: Rome, Italy, 2015. [Google Scholar]
  45. Hoffmann, H. (Ed.) Die Chronik von Montecassino = Chronica Monasterii Casinensis; Monumenta Germaniae Historica; Scriptores 34; Hahnsche Buchhandlung: Hannover, Germany, 1980. [Google Scholar]
  46. De Nava, L. (Ed.) Alexandri Telesini Abbatis Ystoria Rogerii Regis Sicilie Calabrie Atque Apulie; con Commento a cura di Clementi D.; Fonti per la Storia d’Italia 112; Nella sede dell’IstitutoL: Rome, Italy, 1991. [Google Scholar]
  47. Jamison, E.M. (Ed.) Catalogus Baronum; Istituto Storico Italiano per il Medio Evo: Rome, Italy, 1972. [Google Scholar]
  48. Cuozzo, E. (Ed.) Catalogus Baronum. Commentario; Istituto Storico Italiano per il Medio Evo: Rome, Italy, 1984. [Google Scholar]
  49. Martin, J.-M. (Ed.) Chronicon Sanctae Sophiae: (cod. Vat. Lat. 4939); Fonti per la storia dell’Italia medieval; Rerum Italicarum scriptores 3; Istituto Storico Italiano per il Medio Evo: Rome, Italy, 2000. [Google Scholar]
  50. Maio, L. Storia di Castelpoto, Dalle Origini al sec. XVII; Editrice Benvento: Benevento, Italy, 2012. [Google Scholar]
  51. Tescione, G. Roberto conte normanno di Alife, Caiazzo e S. Agata dei Goti. Arch. Stor. Terra Lav. 1975, 9–52. [Google Scholar]
  52. Cielo, L.R. L’abbaziale Normanna di S. Salvatore de Telesia; Edizioni Scientifiche Italiane: Napoli, Italy, 1995. [Google Scholar]
  53. Tropeano, P.M. Codice Diplomatico Verginiano; Libreria del Senato: Montevergine, Italy, 1978; Volume 2. [Google Scholar]
  54. Mongelli, G. (Ed.) Regesto delle pergamene, I (secc. X-XII); Istituto Poligrafico dello Stato: Rome, Italy, 1956. [Google Scholar]
  55. Jahn, W. (Ed.) Untersuchungen zur Normannischen Herrschaft in Süditalien (1040–1100); Lang: Frankfurt am Main, Germany; Bern, Germany; New York, NY, USA; Paris, France, 1989; ISBN 978-3-631-41799-7. [Google Scholar]
  56. Loud, G.A. (Ed.) A Lombard abbey in a Norman world: St Sophia, Benevento, 1050–1200. In Montecassino and Benevento in the Middle Ages; Routledge: Aldershot, UK, 2000; pp. 273–306. [Google Scholar]
  57. Canosa, R. Le conseguenze della conquista normanna in Italia: Il titolo comitale negli antichi principati longobardi. Bull. Dell Istituto Stor. Ital. Il Medio Evo. 2015, 67–101. Available online: https://www.academia.edu/12452271/Le_conseguenze_della_conquista_normanna_in_Italia_il_titolo_comitale_negli_antichi_principati_longobardi_in_Bullettino_dellIstituto_Storico_Italiano_per_il_Medioevo_117_2015_p_67_101 (accessed on 13 December 2024).
  58. Cuozzo, E.; Esposito, L.; Martin, J.M. Le Pergamene del Monastero di Santa Sofia di Benevento (762-1067); Sources et Documents 12; Medievalia 11; École Française de Rome: Rome, Italy, 2021. [Google Scholar]
  59. Costabile, S.; Cocco, S.; Petriglia, L. Il nuovo Piano Straordinario di Telerilevamento Ambientale: Esempio di sinergia tra amministrazione centrale e amministrazione locale. In Proceedings of the Atti 17a Conferenza Nazionale ASITA, Riva del Garda, Italy, 5–7 November 2013; pp. 491–494. [Google Scholar]
  60. Conte, A.; Bonofiglio, M.P.; Petriglia, L. Il Geoportale Nazionale: Un’infrastruttura a supporto delle emergenze. GEOmedia 2016, 20, 58–61. [Google Scholar]
  61. Guth, P.L.; Van Niekerk, A.; Grohmann, C.H.; Muller, J.-P.; Hawker, L.; Florinsky, I.V.; Gesch, D.; Reuter, H.I.; Herrera-Cruz, V.; Riazanoff, S.; et al. Digital Elevation Models: Terminology and Definitions. Remote Sens. 2021, 13, 3581–3600. [Google Scholar] [CrossRef]
  62. Kokalj, Ž.; Zakšek, K.; Oštir, K.; Pehani, P.; Čotar, K.; Somrak, M. Relief Visualization Toolbox, ver. 2.2.1 Manual. Remote Sens. 2016, 3, 398–415. [Google Scholar]
  63. Smith, M.J.; Clark, C.D. Methods for the visualization of digital elevation models for landform mapping. Earth Surf. Process. Landf. 2005, 30, 885–900. [Google Scholar] [CrossRef]
  64. Podobnikar, T. Detecting Mountain Peaks and Delineating Their Shapes Using Digital Elevation Models, Remote Sensing and Geographic Information Systems Using Autometric Methodological Procedures. Remote Sens. 2012, 4, 784–809. [Google Scholar] [CrossRef]
  65. Larsen, B.P.; Holdaway, S.J.; Fanning, P.C.; Mackrell, T.; Shiner, J.I. Shape as an outcome of formation history: Terrestrial Laser Scanning of shell mounds from far north Queensland, Australia. Quat. Int. 2017, 427, 5–12. [Google Scholar] [CrossRef]
  66. Blinn, J.F. Models of light reflection for computer synthesized pictures. In Proceedings of the 4th Annual Conference on Computer Graphics and Interactive Techniques, San Jose, CA, USA, 20–22 July 1977; Volume 11, pp. 192–198. [Google Scholar]
  67. Batson, R.M.; Edwards, K.; Eliason, E.M. Computer-generated shaded-relief images. J. Res. US Geol. Surv. 1975, 3, 401–408. [Google Scholar]
  68. Yoëli, P. Analytische Schattierung. Ein Kartographischer Entwurf. Anal Schattierung Ein Kartographischer Entwurf. 1965, 141–148. [Google Scholar]
  69. Zakšek, K.; Oštir, K.; Kokalj, Ž. Sky-View Factor as a Relief Visualization Technique. Remote Sens. 2011, 3, 398–415. [Google Scholar] [CrossRef]
  70. Zavyalov, V.; Bingham, G.; Wojcik, M.; Johnson, H.; Struthers, M. Application of principal component analysis to lidar data filtering and analysis. In Proceedings of the SPIE 7479, Lidar Technologies, Techniques, and Measurements for Atmospheric Remote Sensing V, 747907, Berlin, Germany, 9 October 2009. [Google Scholar] [CrossRef]
  71. Mather, P.M.; Koch, M. Computer Processing of Remotely-Sensed Images; John Wiley & Sons: Hoboken, NJ, USA, 2022. [Google Scholar] [CrossRef]
  72. Kokalj, Ž.; Zakšek, K.; Oštir, K. Application of sky-view factor for the visualisation of historic landscape features in lidar-derived relief models. Antiquity 2011, 85, 263–273. [Google Scholar] [CrossRef]
  73. Kidd, C.; Chapman, L. Derivation of sky-view factors from lidar data. Int. J. Remote Sens. 2012, 33, 3640–3652. [Google Scholar] [CrossRef]
  74. Yokoyama, R. Visualizing Topography by Openness: A New Application of Image Processing to Digital Elevation Models. Photogramm Eng. 2002, 68, 257–265. [Google Scholar]
  75. Doneus, M. Openness as Visualization Technique for Interpretative Mapping of Airborne Lidar Derived Digital Terrain Models. Remote Sens. 2013, 5, 6427–6442. [Google Scholar] [CrossRef]
  76. Coppola, G. L’architettura dell’Italia Meridionale in Età Normanna (secoli XI-XII); Mezzogiorno e Mediterraneo: Napoli, Italy, 2005. [Google Scholar]
  77. Crova, C. Insediamenti e Tecniche Costruttive Medievali: Il “Latium adiectum” e la “Terra Laboris”; Archivio storico del Lazio meridionale; Monografie; Pubblicazioni Cassinesi: Montecassino, Italy, 2005; ISBN 978-88-8256-401-8. [Google Scholar]
  78. Frisetti, A. La Valle del Volturno nel Medioevo: Paesaggio, Insediamenti e Cantieri; Studi vulturnensi 19; Cerro al Volturno, Editrice Benvento: Benvento, Italy, 2020. [Google Scholar]
  79. Lonardo, L.; Di Cecio, M.T. Ricerche a Cerreto Sannita (2012-15) e Archeologia dei Paesaggi dal Titerno alla Bassa Valle del Calore; EPUGLIA: Bari, Italy, 2020. [Google Scholar]
  80. Coppola, G. L’edilizia nel Medioevo; Manuali: Rome, Italy, 2015. [Google Scholar]
Figure 1. (A) Topographic overview of the study area; (B) orthophoto with the investigated area delimited in red.
Land 13 02255 g001
Figure 2. Flowchart of the methodological approach.
Land 13 02255 g002
Figure 3. (A) Ground points classified with lasground “Wilderness”; (B) ground points classified with lasground “Forest or Hills”; (C) ground points classified with lasground “Archaeology”; (D) ground points classified with lasground_new “Custom” conservative method; (E) ground points classified with lasground_new “Custom” aggressive method; (F) merging of ground points classified with lasground_new “Custom” conservative and aggressive methods; (G) ground points classified with Classify LAS Ground “Strandard”; (H) ground points classified with Classify LAS Ground “Aggressive”.
Land 13 02255 g003
Figure 4. (A) DTM interpolate with LAStools; (B) Hillshade; (C) Slope Analysis; (D) Oppenness Positive.
Land 13 02255 g004
Figure 5. (A) Anisotropic Sky View Factor; (B) Sky View Factor; (C) Visualisation for Archaeological Topography (Hillshade); (D) Visualisation for Archaeological Topography (Multi-Hillshade).
Land 13 02255 g005
Figure 6. (A) Visualisation for Archaeological Topography (VAT) with solid lines in red are certain walls, and dashed lines are hypothesised archaeological structures; (B) topographical map of the site, derived from DTM, with numerical indications of the plots where field inspections were carried out and mapping of the archaeological elements based on the indications obtained from all the derived models created (nos. 1–3 = Figure 7; nos. 4–8 = Figure 8; nos. 9–12 = Figure 9; nos. 15, 17 = Figure 10).
Land 13 02255 g006
Figure 7. Donjon (A) pictured from the south; (B) pictured from the north; (C) pictured from the west.
Land 13 02255 g007
Figure 8. (A) Cistern; (B) tower masonry pictured from the west; (C) tower masonry pictured from the south; (D) tower masonry pictured from the north; (E) southern wall remains.
Land 13 02255 g008
Figure 9. (A) Southern wall remains; (BD) northwest wall remains.
Land 13 02255 g009
Figure 10. (AC) Donjon, with detailed photos about construction techniques; (DF) partially preserved remains of collapsed structures found on the northwestern slopes of the hill.
Land 13 02255 g010
Disclaimer/Publisher’s Note: The statements, opinions and data contained in all publications are solely those of the individual author(s) and contributor(s) and not of MDPI and/or the editor(s). MDPI and/or the editor(s) disclaim responsibility for any injury to people or property resulting from any ideas, methods, instructions or products referred to in the content.

