Article

Breaking Spatial Constraints: A Dimensional Perspective-Based Analysis of the Eco-Efficiency of Cultivated Land Use and Its Spatial Association Network

by
Xingjia Wang
and
Dongyan Wang
*
College of Earth Sciences, Jilin University, Changchun 130061, China
*
Author to whom correspondence should be addressed.
Land 2024, 13(12), 2221; https://doi.org/10.3390/land13122221
Submission received: 28 October 2024 / Revised: 3 December 2024 / Accepted: 17 December 2024 / Published: 18 December 2024

Abstract

:
Global urbanization has caused enormous challenges that seriously threaten ecological security and the food system. Thus, there is a need for finding an optimal solution for the eco-efficiency of cultivated land use (ECLU) that can promote the development of new-type urbanization, while ensuring the sustainable utilization of limited cultivated-land resources. The quantitative system of multi-scale ECLU used in existing studies is inadequate; it is necessary to establish a measurement system from the perspective of geographical spatial relationship that uses evaluation as a key basis for management. In this study, we considered the Changchun Metropolitan Area and a representative urban–rural transition area as the target regions and customized new ECLU evaluation systems for different scales. The super slack-based measure and gravity and social network analyses methods were applied to evaluate the ECLU and explore the structural characteristics of its spatial association network. The average ECLU value for the Changchun Metropolitan Area was 0.974; the results indicated that most of the study area was eco-efficient. The value of ECLU for the urban–rural transition area varied from 0.022 to 1.323; thus, the highly efficient cultivated land was mainly distributed around the urban built-up area. The spatial association network of ECLU revealed that the overall spatial correlations were relatively weak, with a significant “bipolar” division of ECLU; furthermore, the network hierarchy and stability needed improvement. Moreover, we noted distant attraction capacity and siphoning effects outside regional boundaries. In the Changchun Metropolitan Area, it manifested as a monocentric radiation, with Changchun City as the center. In the urban–rural transition area, the cultivated land in proximity to the newly built urban area was more likely to experience spatial spillover. These findings have important implications for strengthening land-use management and advancing sustainable agricultural development for new-type urbanization. Our study can be used by policymakers and stakeholders to design sustainable urban cities, while improving land-use management and optimizing resource use.

1. Introduction

Cultivated land is the basic resource carrier for humans and provides material security for our survival and development; it plays a strategic role in enhancing food security globally [1]. Although several countries and regions follow a series of policies and legislations for the comprehensive utilization and protection of cultivated land, the development and security of cultivated land remains a pressing global issue; the infinity of human needs/wants and finiteness of resources are the source of this contradiction [2,3]. In contrast to the variability of growing human needs, territorial spaces are limited and rigid, and their resources and environmental carrying capacity for human activities are limited, thereby imposing constraints on human development. The Global Report on Food Crises revealed that nearly an additional 40 million people will be affected by global food insecurity in 2021, compared to the number of people affected in 2020, highlighting the vulnerability of the global food system [4]. Maximizing the utilization of cultivated land and achieving high yields have always been regarded as the top priorities for ensuring food security. However, with respect to grain increase and agricultural value-added, the potential of land productivity has been gradually exhausted, resulting in a “counter-ecological” effect, due to years of high carbonization and extensive use of cultivated land, which severely restricts the sustainable use of cultivated land [5,6]. Considering the common requirements of economic development, food security, and the “double carbon” policy, it is important to integrate and balance the stable and high yield of cultivated land, while ensuring low carbon emissions and optimal ecological utilization, for managing cultivated land utilization. The key prerequisite for solving this problem lies in developing a rational evaluation system that supports the efficiency and sustainability of cultivated land.
In this context, the measurable concept of eco-efficiency, which describes the sensible use of resources to produce goods and services while minimizing environmental impacts, has emerged as a useful instrument and management response for sustainability analyses [7,8]; this approach has also been suggested by the World Business Council for Sustainable Development [9]. Novel studies on this emerging concept present new perspectives for the evaluation of urban, agricultural, industrial, tourism, and regional development [10,11,12]. Regarding the cultivated land ecosystem, the eco-efficiency of cultivated land use (ECLU) is considered to be a comprehensive index, with the highest positive socioeconomic externalities and lowest negative environmental pollution externalities being achieved by the input of production factors. It is an important basis for weighing the level of comprehensive input and output performance of cultivated land use. Ultimately, it highlights the three-dimensional coordination and unity between the resources, socioeconomic status, and ecological environment of cultivated land [13]. Over the last decade, increasing attention has been devoted to exploring the indicator systems, evaluation methods, spatiotemporal characteristics, and influential factors of the ECLU [6,14,15,16]. With respect to study design, the existing studies gradually developed a dynamic logic of multiple “input + output”, and the current debate primarily focuses on the selection of appropriate indicators and methods for measuring the undesired outputs [8]. With the intensification of climate change, the dominant role of cultivated land in agricultural carbon sequestration and emissions is becoming increasingly prominent. Regarding the development of indicator systems, several scholars considered all material inputs, socioeconomic outputs, and undesired pollution outputs of cultivated land use, but ignored the ecological externalities of the double carbon effect of cultivated land; therefore, the real level of ECLU could not be analyzed [5,11]. Data envelopment analysis (DEA) has been widely used as an evaluation method because it is a comprehensive non-parametric technique used for evaluating the relative effectiveness of decision-making units (DMUs). It is suitable for studying multiple inputs and outputs without imposing any prior functional form on the analysis [5,6,17]. However, DEA cannot consider slacks and undesired outputs, nor can it rank and separate effective DMUs because the maximum efficiency values are of 1. Hence, a super slack-based measure (super-SBM) model was proposed to overcome these limitations in a way that comprehensively considers inputs, desired outputs, and undesired outputs, while removing the efficient DMUs from the reference set so that the efficiency values could be over 1 [6,11,18].
As for the study scale, most current studies on ECLU focus on a certain region, e.g., a nation [2], province [5], or an urban agglomeration area [11], while only a few focus on a micro scale. A few previous studies considered the regional differences and spatial association of ECLU, leading to a “distortion effect” [19,20]. The comprehensive development of ECLU depends on various internal and external factors, which are characterized by spatial association and redistribution between socioeconomic costs and ecological benefits from the perspective of internal conflict and external coordination. Under the promotion of the regional coordinated development strategy and the flow of market elements, the shaping of the spatial behavior of the ECLU by the inter-regional radiation agglomeration function and effects of territorial factors is a growing concern; the formation of the spatial association networks is an effective means of manifesting this phenomenon [21,22].
With rapid economic and social development and the acceleration of urbanization, inter-city connectivity and functional links are becoming increasingly close, and the spatial boundaries that restrict regional development are being gradually broken. However, the conflicts between resources, society, and the environment still exist. The metropolitan and urban–rural transition areas are considered ideal for new-type urbanization and are the hotspots for resource protection for cultivated land. The key to the sustainable development of these regions is to coordinate the high-quality development of urban and agricultural areas, ecological utilization of cultivated land, and improvements in agricultural quality and efficiency; it is important to form a strategic plan for regional high-quality development while considering the effect of the point driving surface. Therefore, we selected the Changchun Metropolitan Area and a representative urban–rural transition area located in the black-soil region of northeast China as the study areas. Our aim was to (1) develop comprehensive ECLU evaluation frameworks for different regional scales, while ensuring that the administrative scale considered carbon sequestration and carbon emission, and that the non-administrative scale was quantified using geospatial and geochemical data; (2) apply the super-SBM method with undesired outputs to measure the ECLU and analyze its spatial characteristics; (3) investigate the spatial association network structure of the ECLU and identify the role of each city/point in the spatial relationship, using the gravity and social network analyses methods; and (4) propose strategies for sustainable agricultural development that are oriented toward quality and efficiency, spatial integration, and collaborative optimization.

2. Materials and Methods
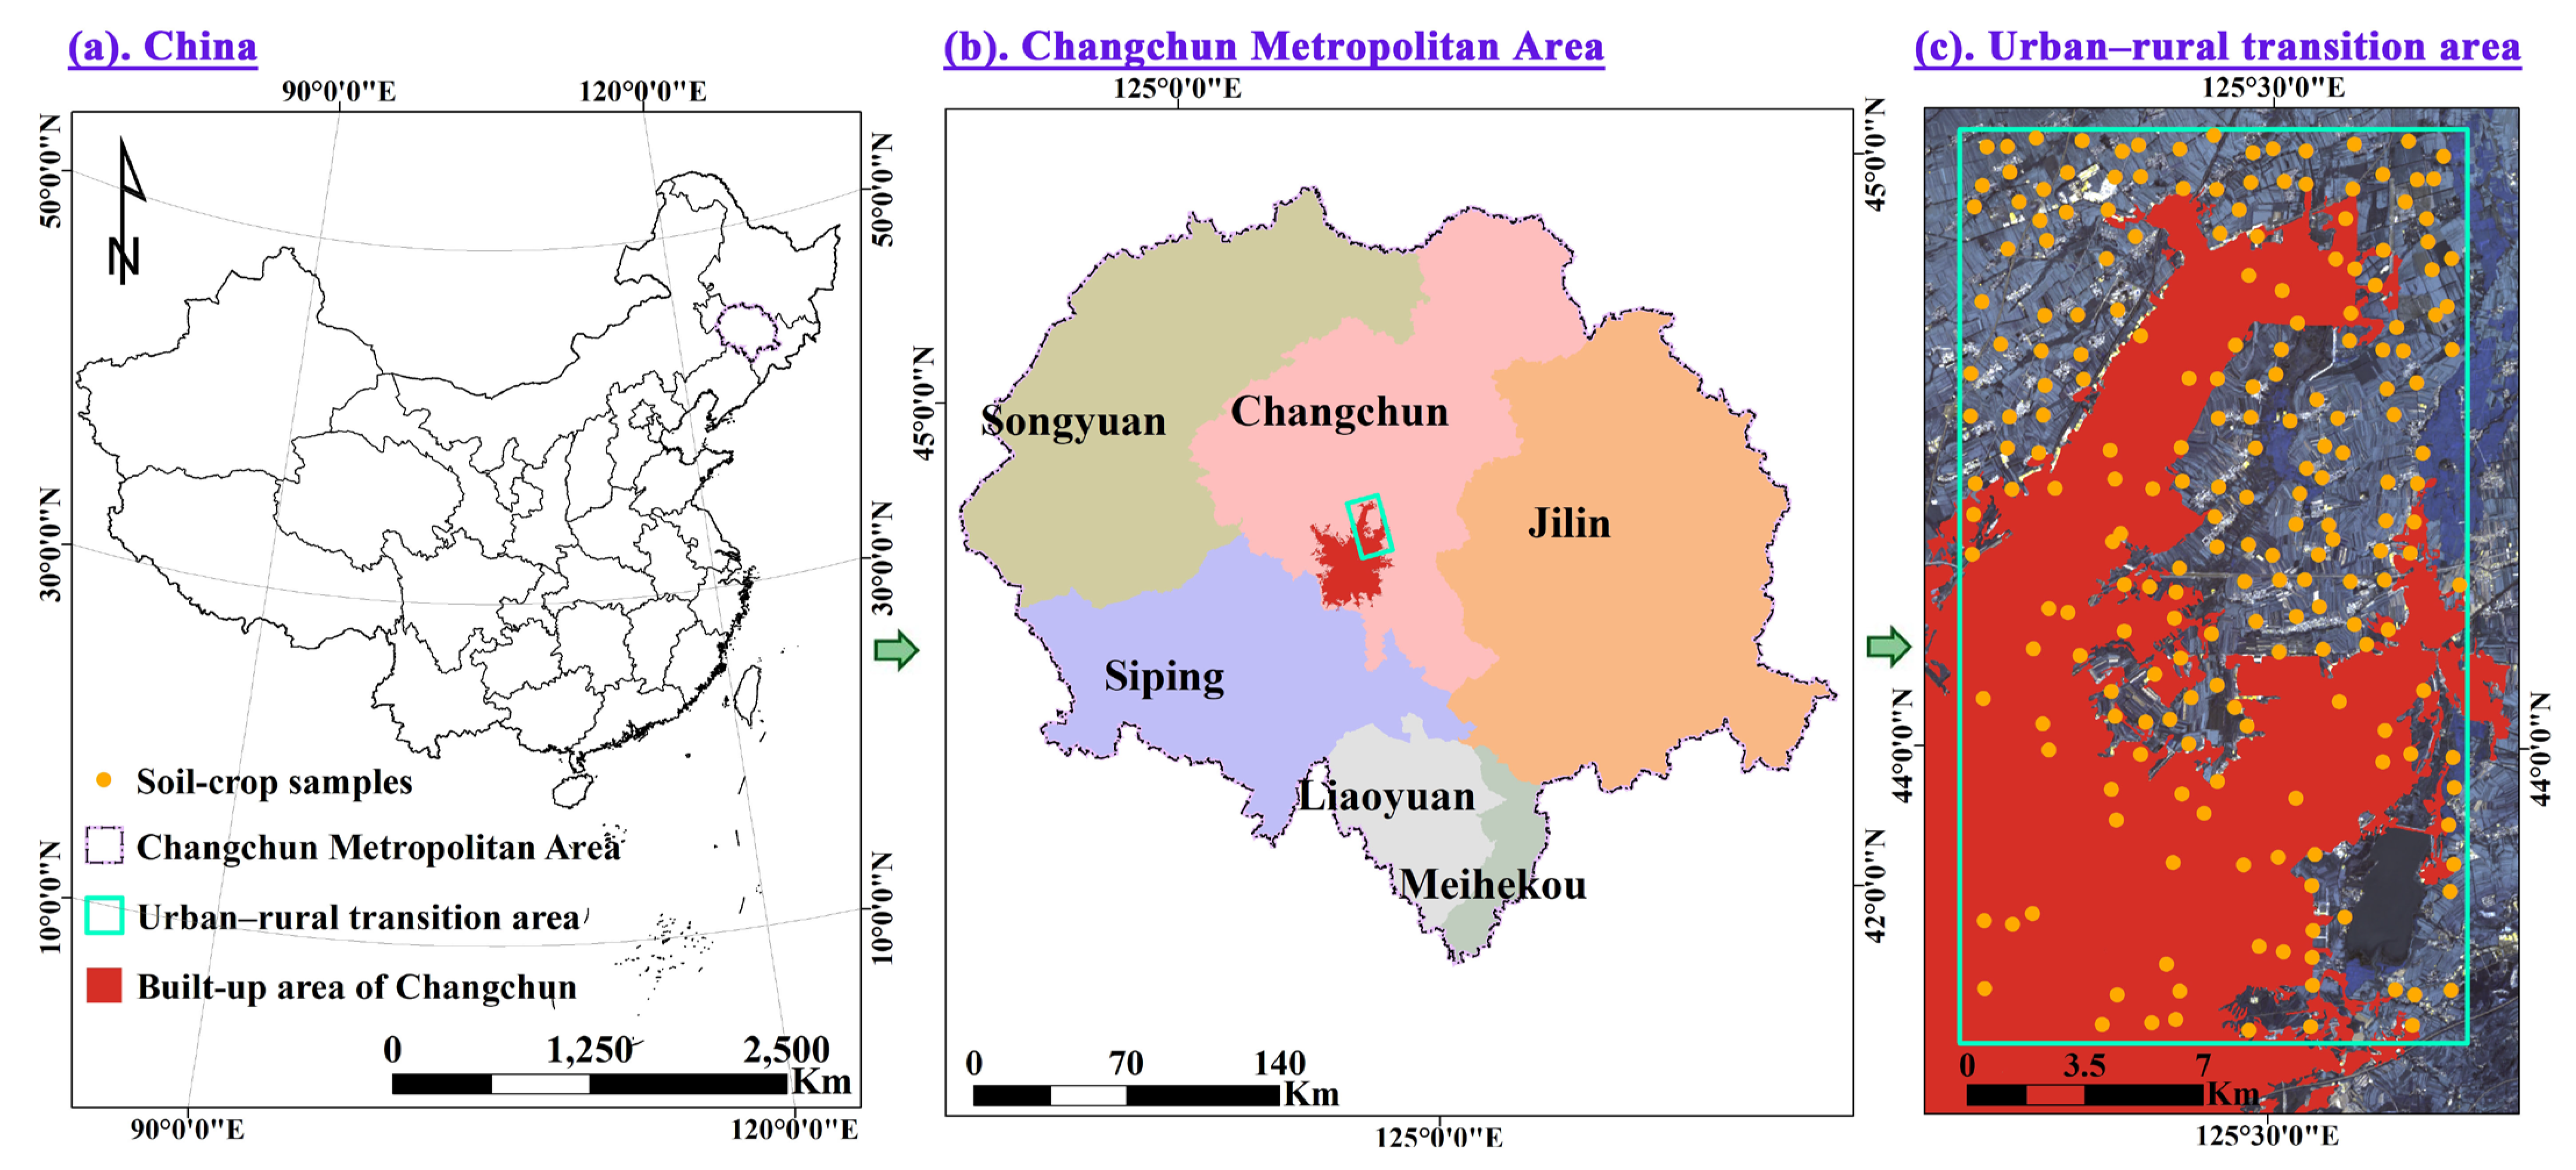
2.1. Study Area

In this study, the Changchun Metropolitan Area (Figure 1a,b) and a representative urban–rural transition area (Figure 1c) in the black-soil region in northeast China were selected as the study areas. The evaluation system of ECLU was constructed from the dual perspectives of scale effect and regional differentiation.

2.1.1. Changchun Metropolitan Area

The Changchun Metropolitan Area is located in the hinterland of the vast and fertile Songliao Plain and encompasses the cities of Changchun, Jilin, Siping, Liaoyuan, Songyuan, and Meihekou, along with one central city, one sub-central city, three prefecture-level cities, and one provincial (directly controlled) county-level city. With an area of approximately 91,176 km2, occupying approximately 48.700% of the Jinlin Province, it is an important national commodity grain production base and serves as a planning area for the province to promote leapfrog development and achieve co-city construction, while being the main area for new-type urbanization and agricultural modernization.

2.1.2. Urban–Rural Transition Area

A rectangular area (15 × 27 km) with mixed urban and rural land use in the northeast of the built-up area of Changchun City was selected as the urban–rural transition area, wherein land-use conflicts are frequent and land-use eco-efficiency needs urgent improvement. Wang et al. [23] indicated that the northeastern region is the principal orientation for the recent urban–rural fringe evolution in Changchun City and that this area is experiencing rapid urban expansion.
The common denominator of these two scales of the study area is that the contradiction between urban development and cultivated land protection has become prominent recently and that the demand for coordinated development is strong; thus, these regions are ideal as representative areas for exploring the ECLU.

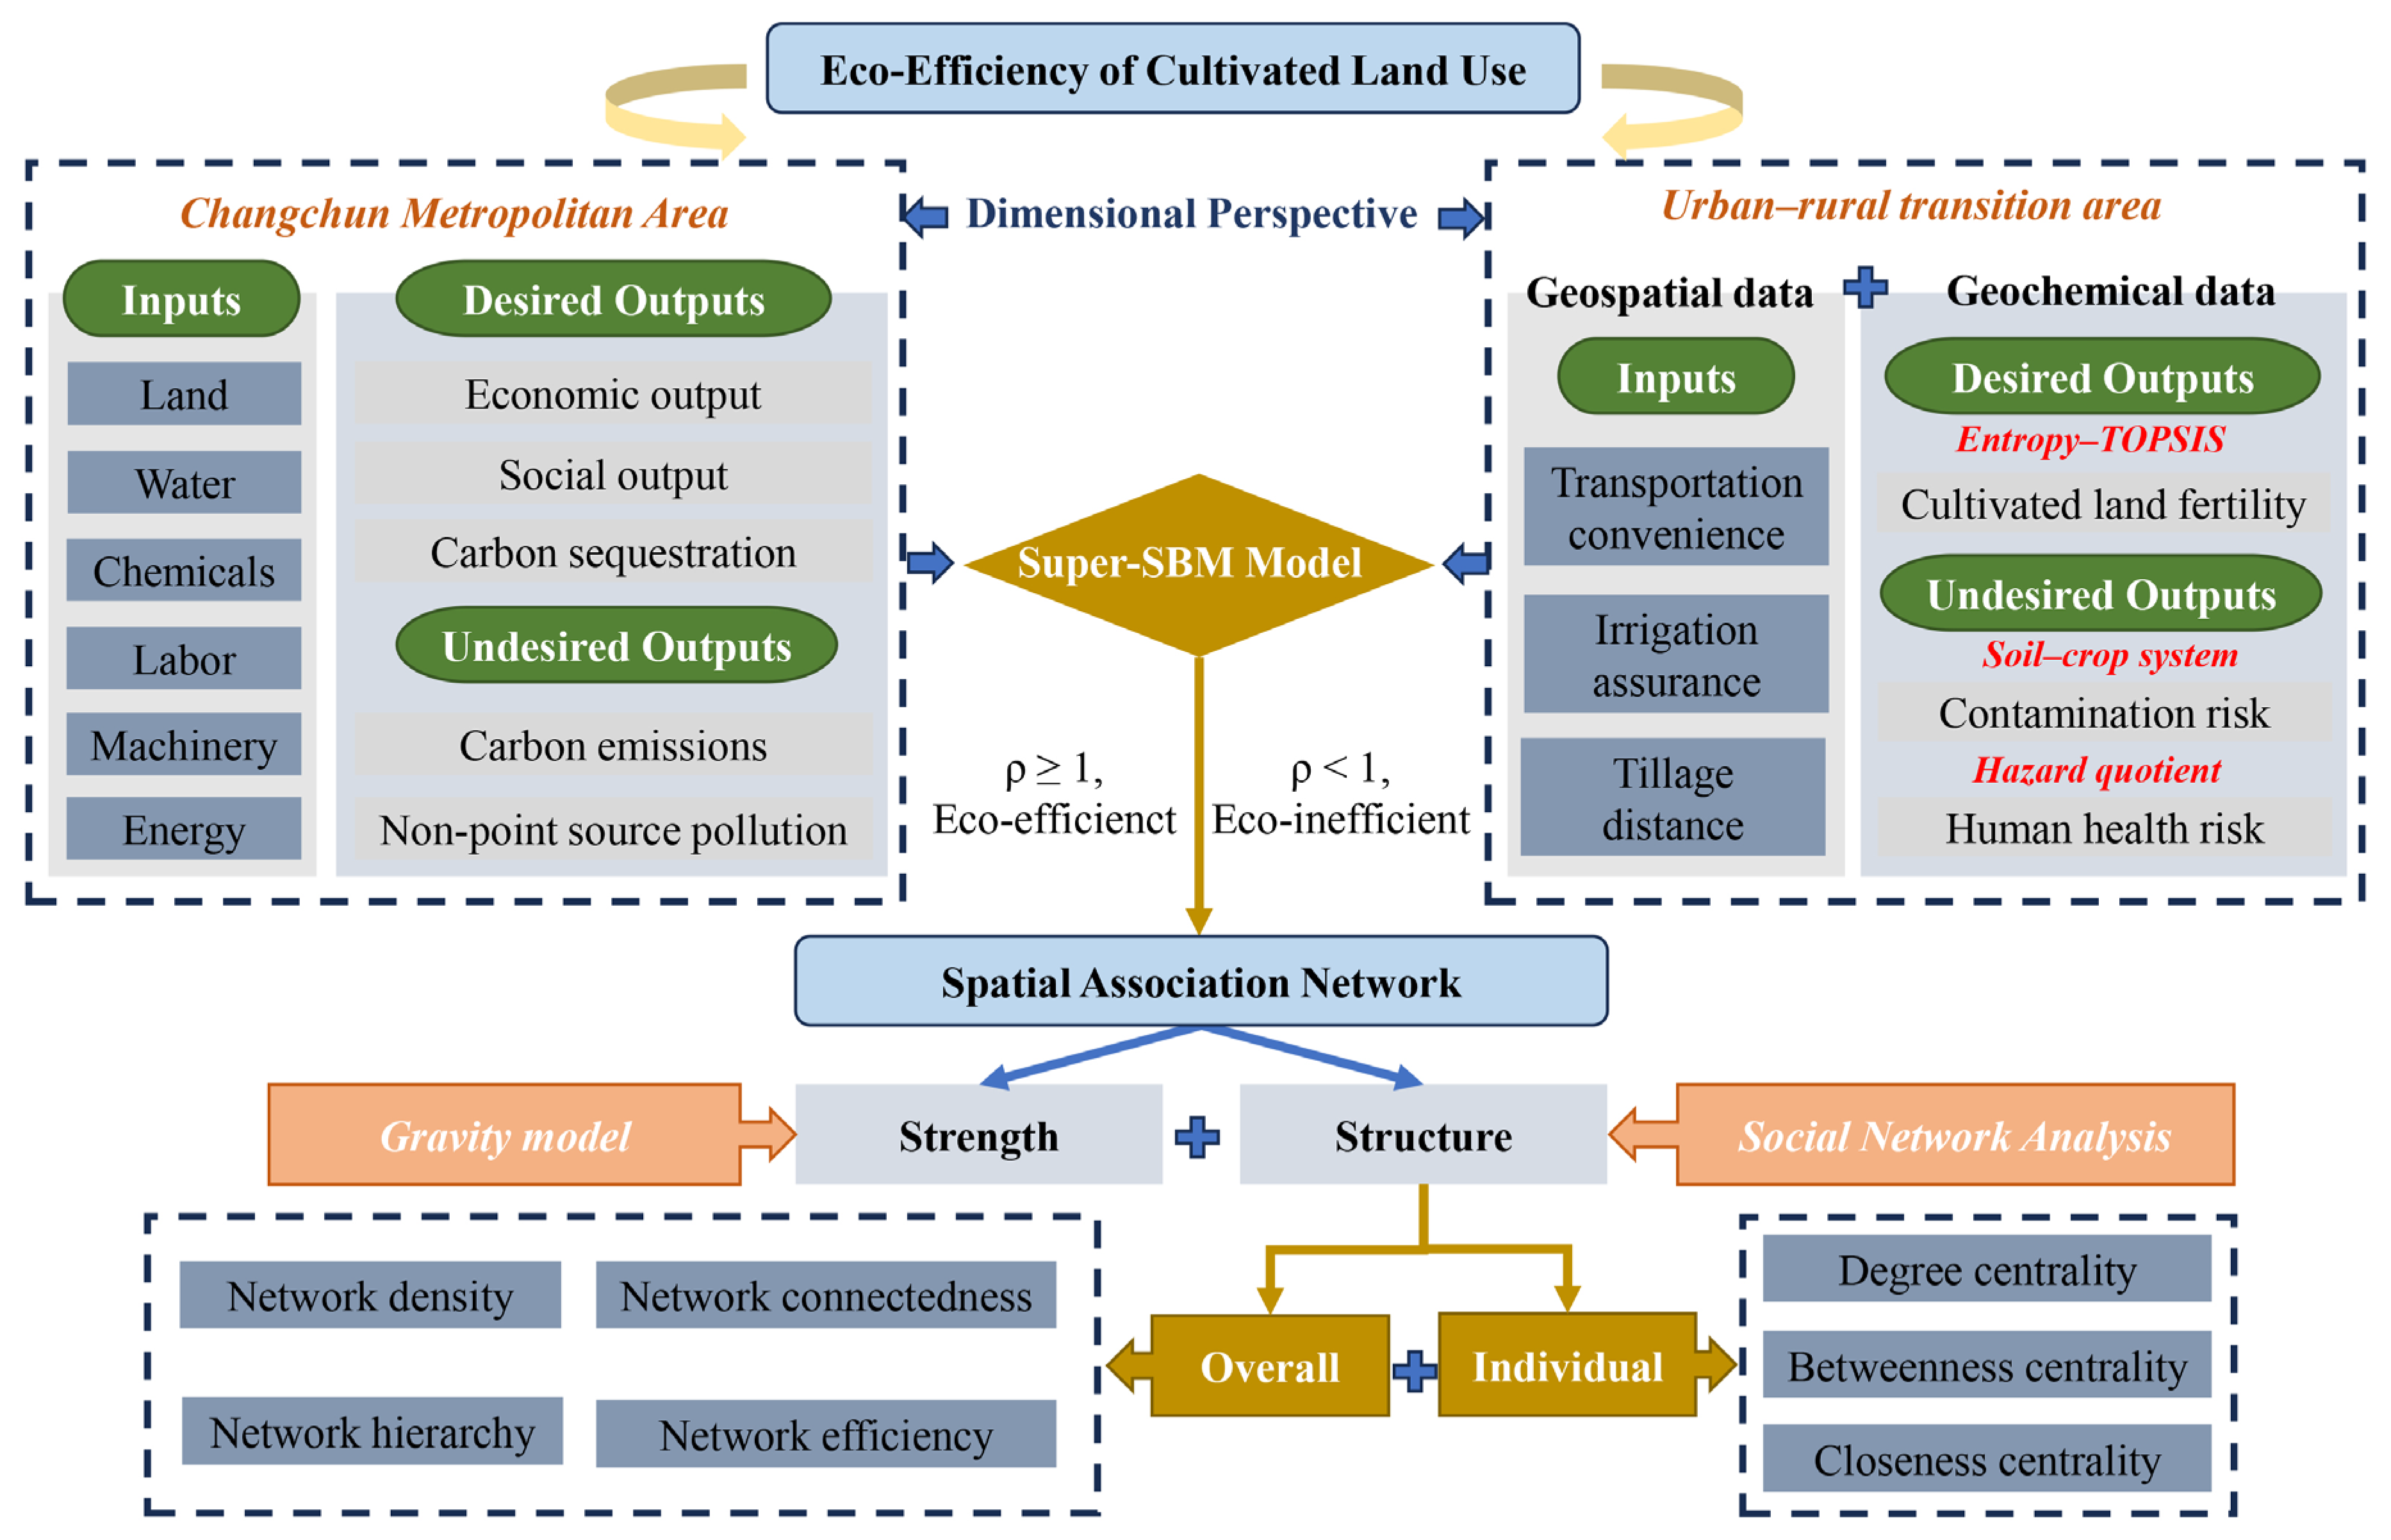
2.2. Research Framework

This study was mainly conducted from the following three aspects (Figure 2). Firstly, the evaluation systems of ECLU in the Changchun Metropolitan Area and urban–rural transition area were established. Secondly, the Super-SBM model was used to evaluate the ECLU in the Changchun Metropolitan Area and urban–rural transition area, and the spatial variation characteristics of ECLU at the dual regional scales were explored. Finally, based on the gravity model and social network analysis, the spatial association network strength and structure of ECLU were analyzed.

2.3. Variable Selection

2.3.1. Variables Used to Measure the ECLU for the Changchun Metropolitan Area

As one of the most basic input factors in agricultural production activities, the utilization of cultivated land is expected to yield the maximum target benefit output with the least input of production factors and minimum ecological-environment loss. The core of this approach is to realize the coordinated development of the three aspects (e.g., resource, economic, and environment) in the composite system of cultivated land utilization. Herein, we selected 11 variables from the literature to establish an ECLU measurement system for the Changchun Metropolitan Area [1,11,13,15], as shown in Table 1. At this scale, the ECLU reflects the comprehensive mapping between the input resource factors (such as land, water, chemicals, labor, machinery, and energy), desired outputs (such as economic, social, and ecological benefits), and undesired outputs (e.g., the negative effects of the ecological environment in the land-use system for certain production technology conditions). Agricultural practices involve a series of carbon-based inputs and outputs [11]. Therefore, in the ECLU measurement system, carbon sequestration and emissions were selected as important variables to accurately reflect ECLU environmental outputs. Carbon sequestration of cultivated land use refers to the capacity of crops to remove carbon dioxide from the atmosphere; it was calculated based on the carbon absorption rate, yield, water coefficient, and economic coefficient of the main food crops (maize, rice, wheat, soybean, and potato) of the study area. The coefficients were derived from Cao et al. [5]. The carbon sequestration of cultivated land was calculated using Equation (1). The carbon emissions from cultivated land use refers to the carbon emissions caused by crop production activities; fertilizers, pesticides, agricultural films, agricultural machinery, irrigation, and tillage were considered as carbon sources. Their emission coefficients were 0.8956 (kg/kg), 4.9341 (kg/kg), 5.18 (kg/kg), 0.18 (kg/kW), 266.48 (kg/hm2), and 312.60 (kg/km2), respectively [15,24]. The total agricultural carbon emissions were calculated from the cumulative multiplication of carbon sources and carbon emission coefficients. To ensure the consistency and comparability of the statistical and field survey data, we only obtained the statistical data for the abovementioned variables for the year 2021, from the regional statistical yearbook, statistical bulletin of national economic and social development, and government websites.
C S = i = 1 m C S i = i = 1 m C i × Y i × ( 1 W i ) / H i
where CS represents the carbon sequestration of cultivated land use; CSi denotes the carbon absorption of the ith crop; m is the type of crop planted; and Ci, Yi, Wi, and Hi denote the carbon absorption rate, yield, water coefficient, and economic coefficient of the ith crop, respectively.

2.3.2. Variables Used to Measure the ECLU of the Urban–Rural Transition Area

Considering that it is difficult to quantify the ECLU at the local scale because of the limitations imposed by data availability, we used geospatial and geochemical data to construct an ECLU measurement system for the urban–rural transition area. The input variables were transportation convenience, irrigation assurance, and tillage distance, represented by the proximity of the sampling points to transportation land, water, and settlements. The desired output primarily focused on cultivated land fertility, which was evaluated using the main chemical properties of soil, e.g., the pH, soil organic matter (SOM), N, P, and K contents. The undesired outputs included two aspects: the contamination risk of the soil–crop system and risk to human health, which were evaluated with respect to the concentrations of heavy metal elements (As, Hg, Pb, Cd, Cr, Ni, Cu, and Zn) in the soil and crops. The sampling, geochemical analyses, and geochemical-based evaluation processes used in this study are explained below.
(1)
Soil and crops
In September 2021, we collected topsoil (0–20 cm) samples and the associated crop-seed samples (maize and rice) from the cultivated lands in the study area at 210 locations (Figure 1c). Because the urban–rural transition area is a spatial entity that can reflect the progressive change trend of urban and rural areas, the cultivated land utilization environment is more diversified than that of traditional agricultural areas. The soil–crop sample locations were randomly generated on the cultivated lands by laying 1 × 1 km grids in the study area. During the sampling process, each sample was composited by mixing 3–5 subsamples collected within a 1-m2 area. The composite samples were air-dried, ground, and tested in the laboratory.
(2)
Geochemical analysis
The soil pH was determined using the electrode method. The SOM content was measured based on the soil organic carbon (SOC) concentration and van Bemmelen conversion factor; the SOC concentration was determined using the potassium dichromate method. The soil N concentration was determined using the Kjeldahl distillation-volumetric method. The soil P, K, and Cr contents were determined using inductively coupled plasma atomic emission spectrometry (ICP-AES). The soil As and Hg contents were determined using atomic fluorescence spectrometry (AFS), and other heavy metal elements in the soil samples were determined using ICP mass spectrometry (ICP-MS). With respect to the crop samples, the heavy metal elements (except for Hg) in the crop samples were determined by ICP-MS; the Hg content was determined by AFS. The geochemical test results for all the samples passed the Pauta criterion and were normally distributed.
(3)
Assessing cultivated land fertility
The entropy–TOPSIS method was used to evaluate the fertility of the cultivated land in the study area. Before evaluation, each selected soil geochemical index (i.e., pH, SOM, N, P, and K) was normalized. Then, we calculated the cultivated land fertility based on the entropy weights of each evaluation index and the Euclidean distance between the target and ideal values [25], using the equations in Table 2.
(4)
Comprehensive evaluation of the contamination risk to the soil–crop system
The impact index of comprehensive quality was used to conduct an integrated evaluation of the soil environmental quality and agricultural product safety [26], using the equations in Table 2.
(5)
Evaluating the risks to human health
Human health risk assessment is an effective method for exploring the negative impacts of cultivated land use on the human body [27]. Herein, we used the hazard quotient to characterize the health risks (in adults) associated with certain heavy metal elements from consuming agricultural products, as shown in Table 2.
Table 2. Calculation formulas and explanations of the desired and undesired output variables of the eco-efficiency of cultivated land use for the urban–rural transition area.
IndexEquationExplanation
Cultivated land fertility H j = 1 ln n i = 1 n a i j i = 1 n a i j ln a i j i = 1 n a i j Hj is the information entropy; aij is the jth standardized index for the ith sampling location; n is the number of sampling locations.
W j = 1 H j j = 1 m ( 1 H j ) Wj is the entropy weight; m is the number of evaluation index.
D i + = j = 1 m W j ( a i j + a i j ) 2 D i + represents the Euclidean distances between the target (aij) and positive ( a i j + ) ideal values.
D i = j = 1 m W j ( a i j a i j ) 2 D i represents the Euclidean distances between the target (aij) and negative ( a i j ) ideal values.
C L F i = D i D i + + D i CLFi represents the cultivated land fertility.
Contamination risk I I C Q = I I C Q S + I I C Q C IICQ represents the contamination risk of the soil–crop system; IICQS and IICQC denote the impact indices for soil and agricultural products, respectively.
I I C Q S = X · 1 + R I E + Y · D D D B D D S B RIE is the soil relative impact equivalent; DDDB is the degree of deviation in the concentration determined from the background value; DDSB is the degree of deviation in the soil standard value from the background value; X and Y are the quantities of the detected concentrations that exceeded the soil threshold and soil background, respectively.
R I E = [ i = 1 n P i 1 m ] / n Pi is the single pollution index, calculated as the ratio of the detected concentration (Si) of heavy metal i to the threshold value of the soil environmental quality (CSi). n is the number of heavy metal elements, and m is the stable oxidation number of heavy metal i (i.e., As = 5; Hg = 2; Pb = 2; Cd = 2; Cr = 3; Ni = 2; Cu = 2; and Zn = 2).
P i = S i / C S i
D D S B = i = 1 n C S i / C B i 1 m The value of CSi is referred to as the standard in the “Soil Environmental Quality Risk Control Standard for Soil Contamination of Agricultural Land (GB 15618-2018) [28]”. CBi is the background value.
D D D B = [ i = 1 n C F i 1 m ] / n CFi is the degree of detected concentration (Si) beyond the background value (CBi) for heavy metal i.
C F i = S i / C B i
I I C Q C = Z · 1 + Q I A P k + Q I A P / k · D D S B QIAP is the quality index of agricultural products, representing the degree of the detected concentration (Ci) beyond the threshold limit value (Cci) of agricultural products for heavy metal I; Z is the quantities of the detected concentrations that exceeded the limit standard values of agricultural products; k is the background correction parameter, for which the value was set to 5 [26].
Q I A P = [ i = 1 n C i / C C i 1 m ] / n
Human health risk T H Q = i = 1 n H Q i THQ denotes the risk to human health; HQi denotes the hazard quotient for metal i.
H Q i = A D I i R f D i ADIi denotes the average daily intake; RfDi is the reference oral dose of heavy metal i (the reference doses for As, Hg, Pb, Cd, Cr, Ni, Cu, and Zn were considered to be 0.0003, 0.0003, 0.0035, 0.001, 0.003, 0.02, 0.04, and 0.3 mg/kg·day).
A D I i = C i × I R × E F × E D B W × A T × 365 Ci is the heavy metal concentration in crop grain; IR is the ingestion rate; EF and ED represent the exposure frequency and exposure duration, respectively; BW denotes body weight; and AT denotes the life expectancy of humans.

2.4. Calculating the ECLU Based on the Super-SBM Model

The non-oriented super-SBM model with the undesired output was employed to measure the ECLU; this enabled us to distinguish the effective DMUs, to avoid information loss [5,22,29]. The specific computation formula used in this study is described below.
min ρ = 1 + 1 m i = 1 m s i x i k 1 1 q 1 + q 2 r = 1 q 1 s r + a r k + t = 1 q 2 s t b t k
s . t . j = 1 , j k n x i j λ j s i x i k ,   i = 1 ,   2 , , m j = 1 , j k n a r j λ j + s r + a r k , r = 1 ,   2 ,   ,   q 1 j = 1 , j k n b t j λ j s t b t k , t = 1 ,   2 ,   ,   q 2 1 1 q 1 + q 2 r = 1 q 1 s r + a r k + t = 1 q 2 s t b t k > 0 λ ,   s ,   s + 0
where ρ is the target efficiency value for the DMU; k is the number of DMUs; m is the number of input factors; q1 is the number of desired outputs; and q2 is the number of undesired outputs. Furthermore, x, a, and b represent the inputs, desired, and undesired outputs, respectively, with x ϵ R m , a ϵ R q 1 , b ϵ R q 2 . s i ,   s r + , and s t denoting the slack variables for excessive inputs, insufficient expected outputs, and redundant undesirable outputs, respectively; λ is the weight vector. A ρ value ≥1 indicated that the ECLU was in an optimal state, with no loss of eco-efficiency.

2.5. Analysis of the Spatial Association Network Characteristics

2.5.1. Determining the Spatial Association of the ECLU

The spatial association network of ECLU considered each city or sampling point as a “node” and visualized the spatial connections between the nodes through “lines”. The gravity model is a classical model used to determine the spatial network relationships of each evaluation unit by effectively incorporating geographic factors [21]. Due to the differences in regional development modes, regional relations show asymmetric and bidirectional features. The gravity coefficient K was used to consider the directivity of the gravitational relationship. In addition, for administrative regions, the mere consideration of geographical distance will likely lead to bias in the estimates. Therefore, economic and geographical distance should be considered comprehensively when calculating the ECLU on an administrative scale. The gravity model can be expressed as follows.
F i j = K i j · M i · M j D i j 2
K i j = M i M i + M j
where Fij denotes the spatial association strength of the ECLU between evaluation units i and j; Kij denotes the gravity coefficient; Mi and Mj denote the ECLU values of evaluation units i and j, respectively; and Dij is the distance between units i and j. As the spatial association of the ECLU between administrative regions is affected by geographical and economic distances, we replaced Dij with D i j / ( g i g j ) when evaluating the gravity model for the Changchun Metropolitan Area, where Dij denotes the geographical distance and gi and gj denote the per capita gross domestic product of cities i and j, respectively.

2.5.2. Social Network Analysis

Social network analysis can analyze the interaction between “relational data” nodes. We employed social network analysis to analyze the structural characteristics of the spatial association network of the ECLU, while considering the overall network characteristics and individual network attributes. The overall network characteristics included network density, network connectedness, network hierarchy, and network efficiency. The network density mainly represented the closeness and complexity of the ECLU-related networks. The network connectedness was used to measure the accessibility of each node and indicated the robustness and vulnerability of the network structure. The network hierarchy revealed the asymmetric accessibility and dominant position of the spatial association network. Network efficiency was primarily applied to measure the redundant connections in the ECLU networks; the lower the network efficiency value, the larger the channel space, and the more stable the ECLU network [19]. For individual network attributes, we selected three indices (degree centrality, betweenness centrality, and closeness centrality) to reveal the position and role of each city/sampling point in the network [22]. Degree centrality refers to the number of edges associated with a certain node where actors with high centrality are more likely to obtain information and influence the other’s decisions. Betweenness centrality measures the number of other vertices whose shortest path must be passed through a particular node, and actors with high betweenness centrality act as hub points for information flow in the network. Closeness centrality describes the degree to which a node is not dominated by other nodes.

3. Results

3.1. Evaluation and Comparison Results of the ECLU from the Dimensional Perspective

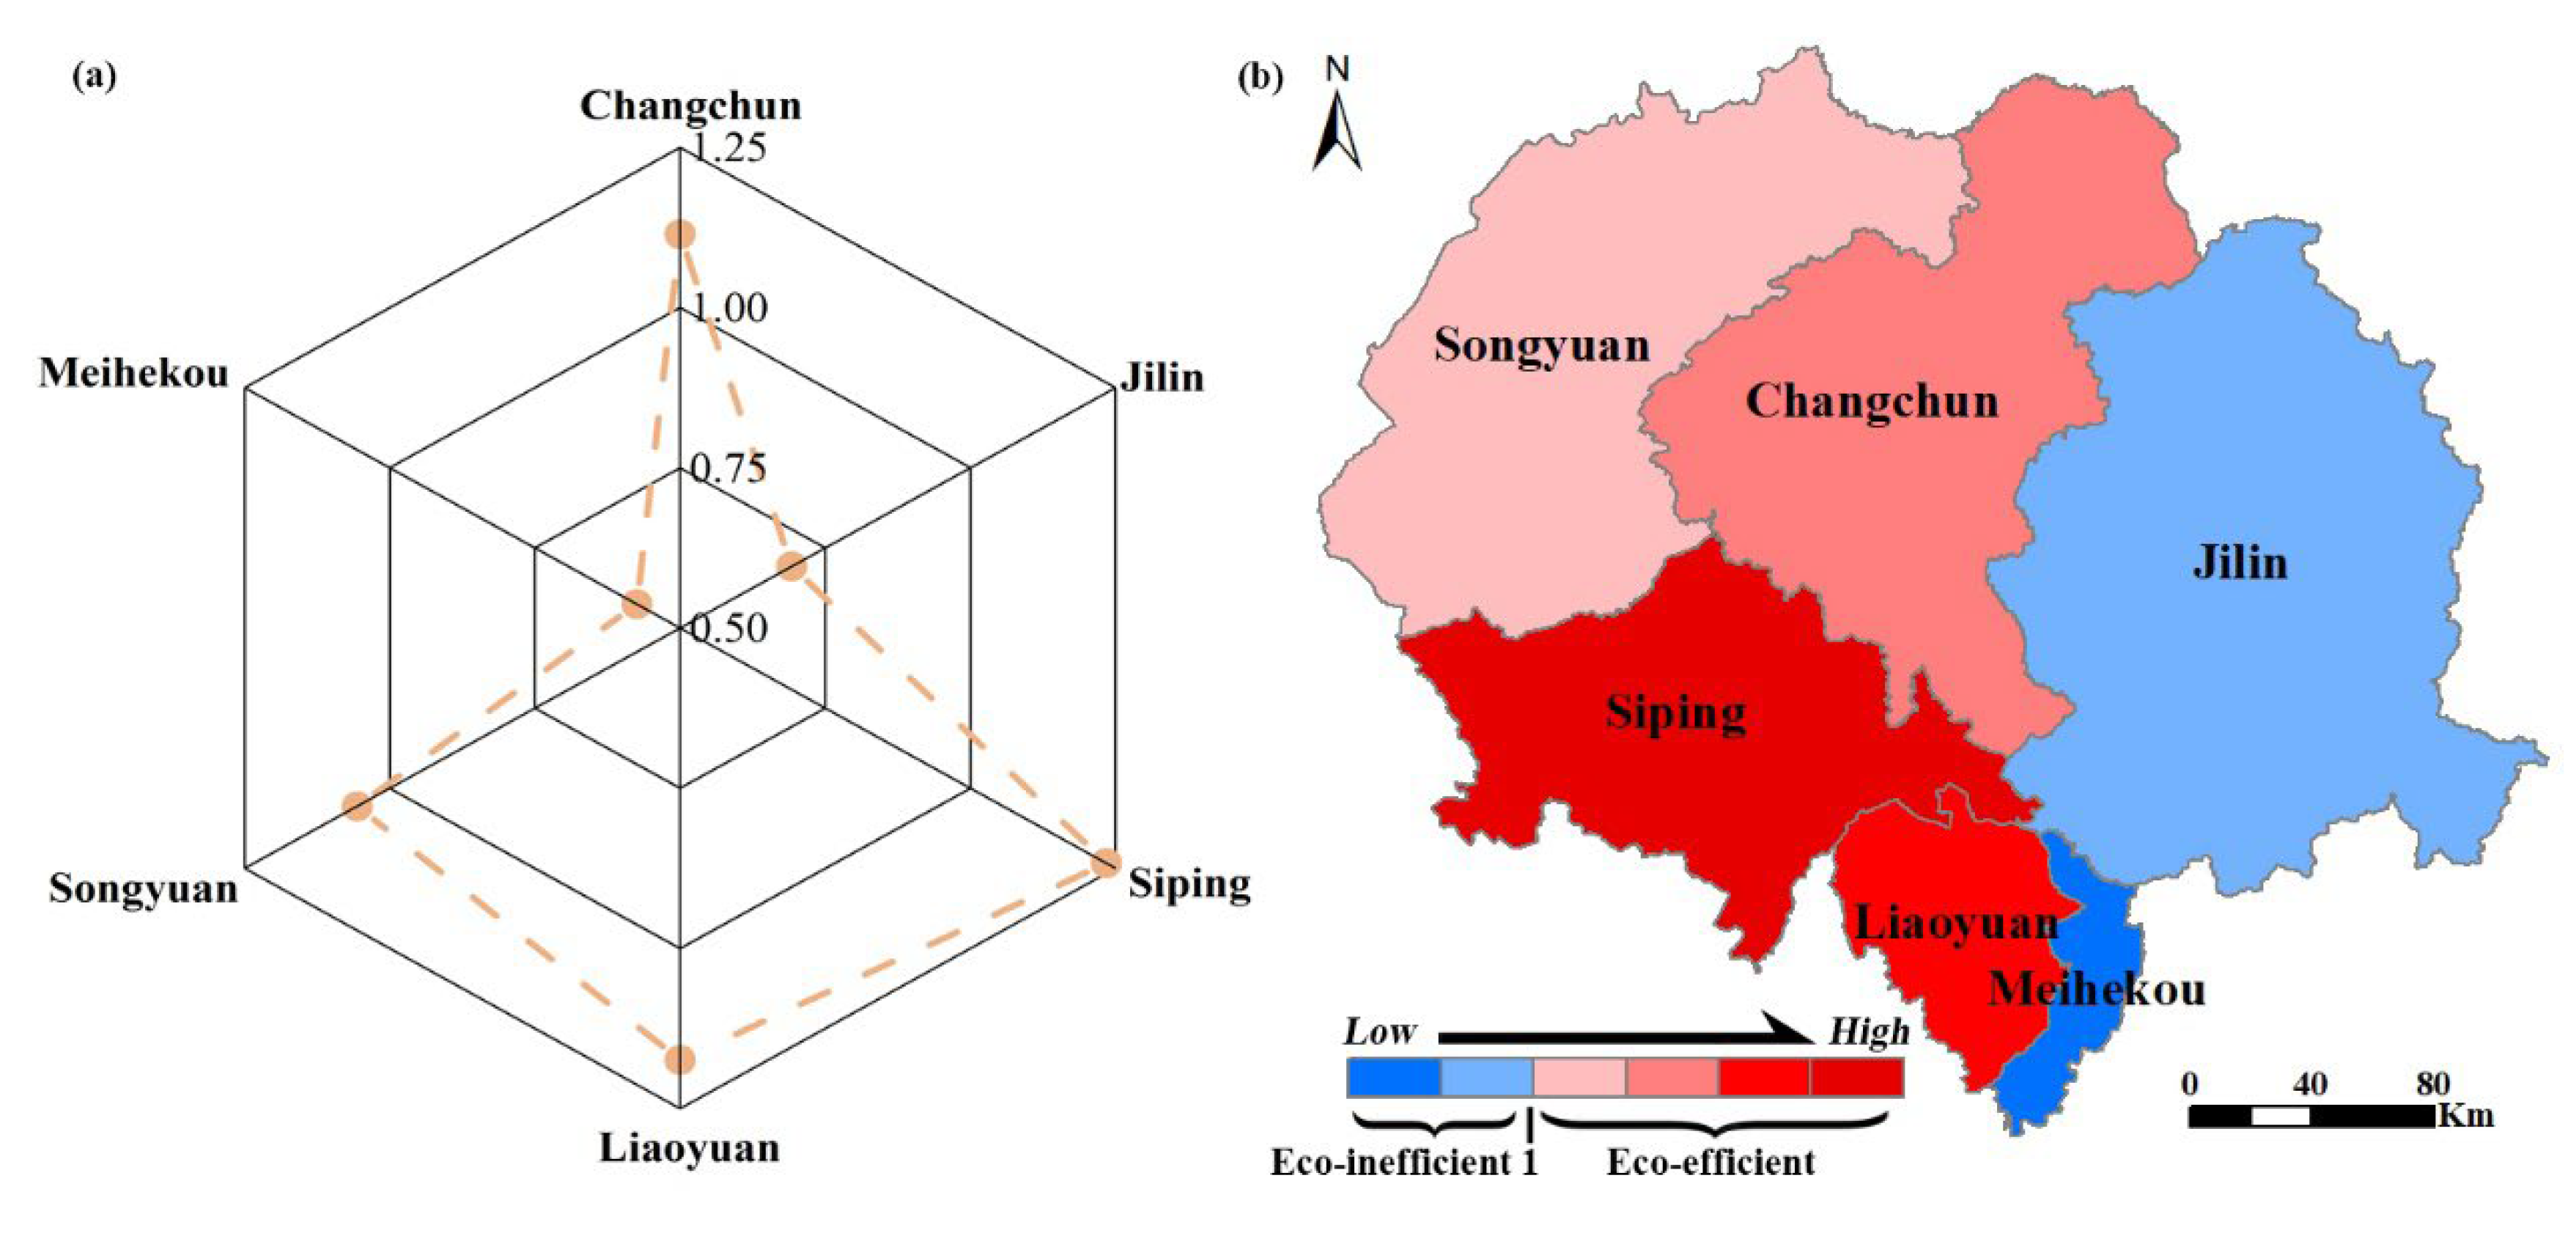
3.1.1. Spatial Characteristics of the ECLU for the Changchun Metropolitan Area

According to the evaluation results of the ECLU for the Changchun Metropolitan Area, the average ECLU value in 2021 was 0.974, portraying significant differences among the independent regions within the area. As shown in Figure 3, Siping City exhibited the highest land eco-efficiency, and the relatively efficient use of cultivated land decreased from the southern to northern regions. We noted two cities with ECLU values < 1, namely Meihekou and Jilin, located in the eastern part of the Changchun Metropolitan Area, indicating that cultivated land utilization in these cities was eco-inefficient regarding input and output.

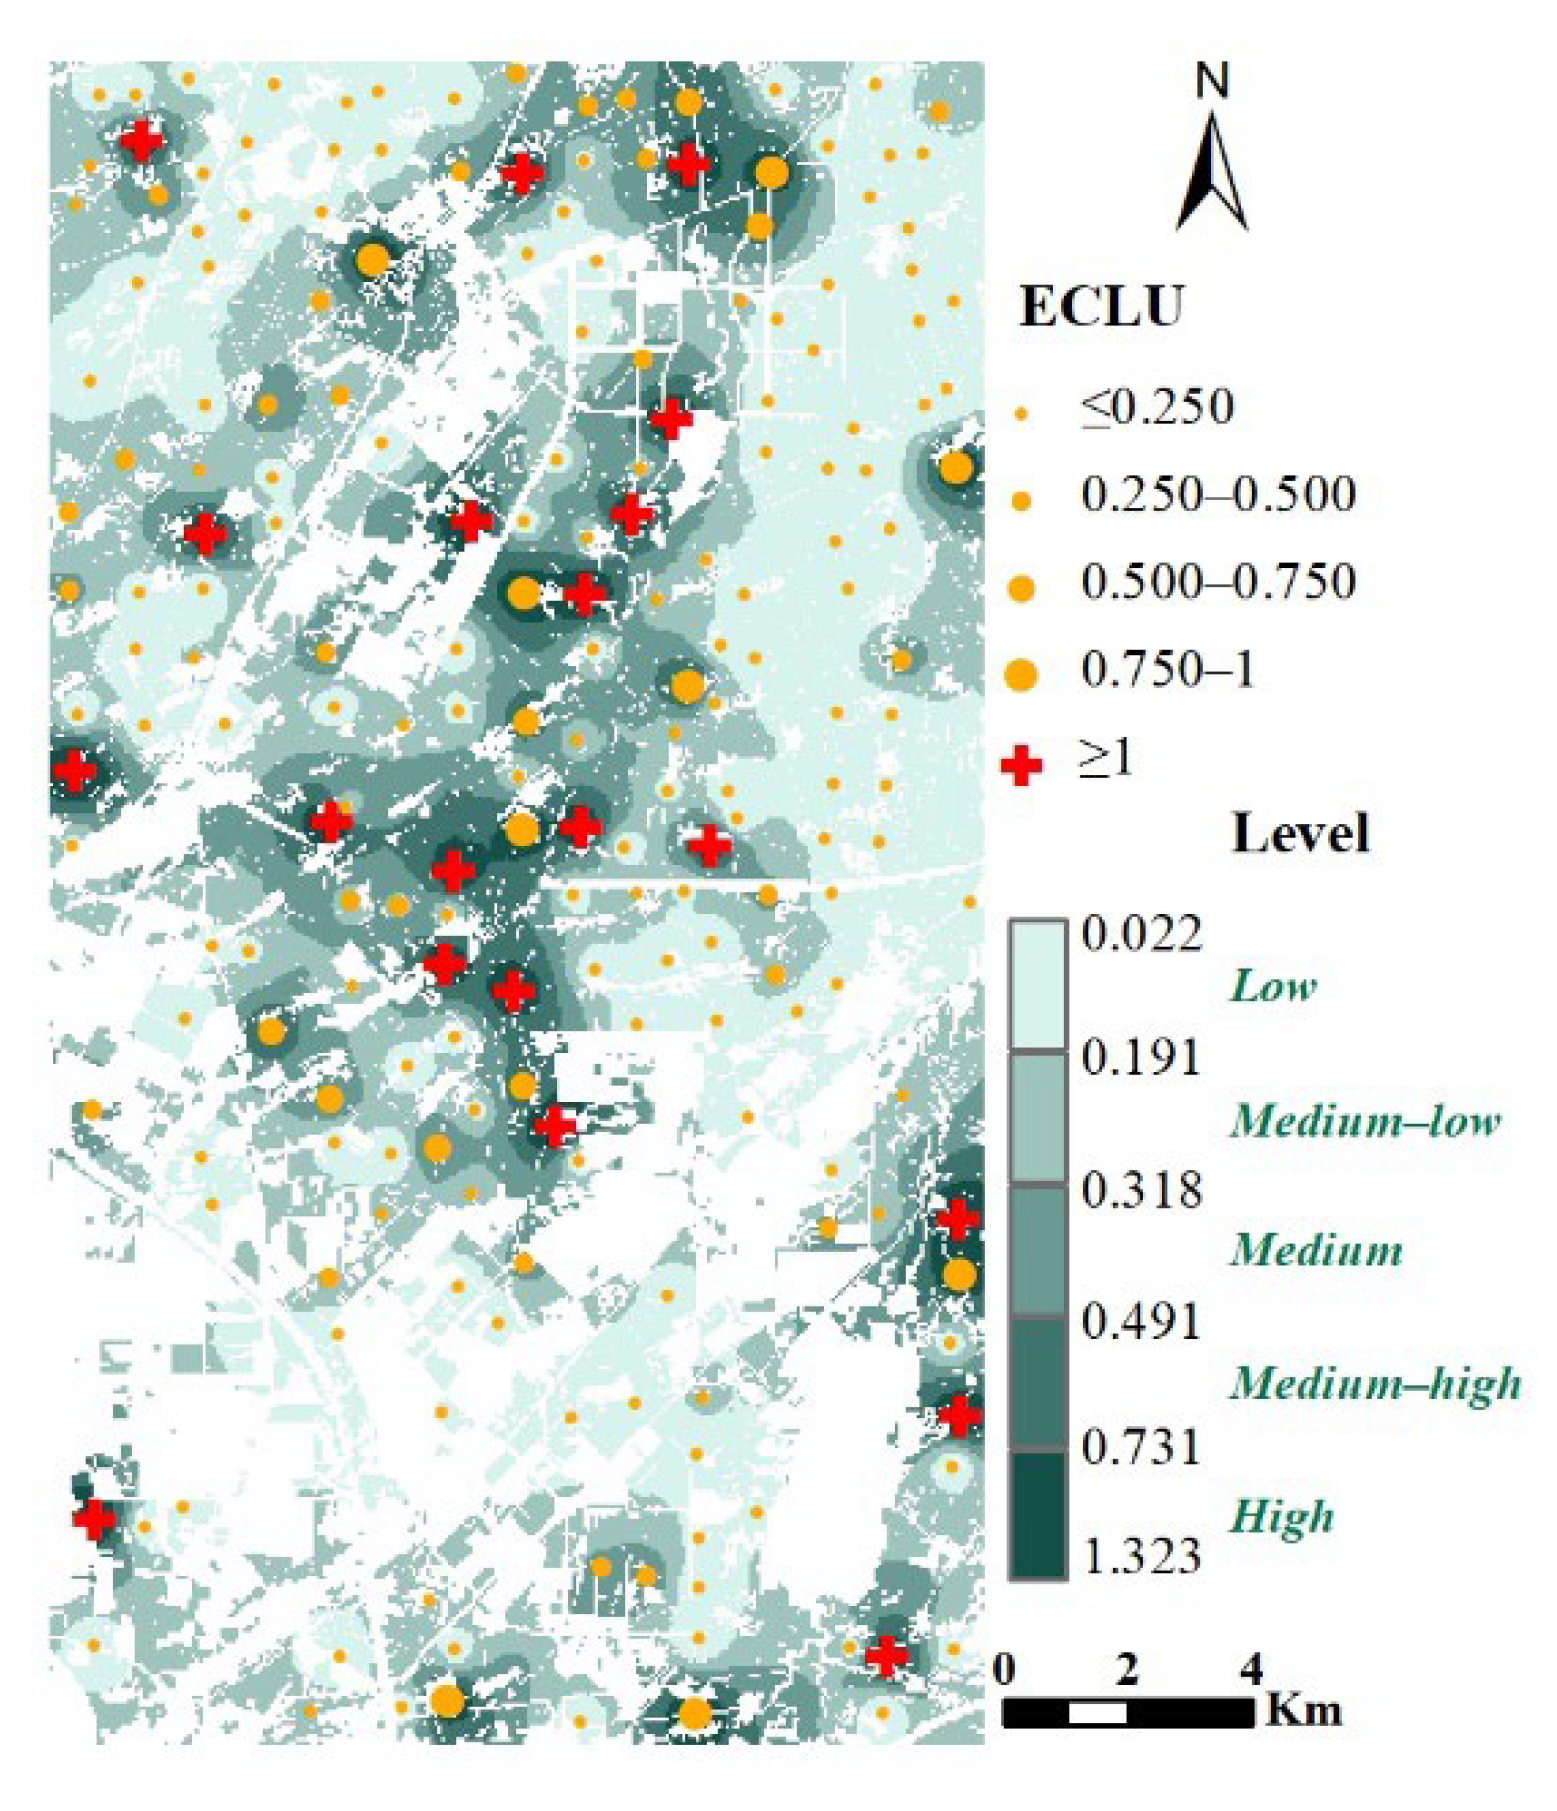
3.1.2. Spatial Characteristics of the ECLU for the Urban–Rural Transition Area

Regarding the spatial behavior of the ECLU in the urban–rural transition area, we noted disparities in the sampling points and cultivated land patches. As shown in Figure 4, the ECLU value varied from 0.022 to 1.323; in total, 28 sampling points portrayed an effective ECLU value. To compare the eco-efficiency at different points, we divided the ECLU values into five categories, from low to high, using the natural break classification. Therefore, most cultivated land in the urban–rural transition area portrayed low and medium–low eco-efficiency levels, with these areas accounting for 69.618% of total cultivated land area, whereas cultivated land with a high eco-efficiency level accounted for 4.187% of total cultivated land area. The sampling points and cultivated land patches with high ECLU values were mainly distributed around the urban built-up areas, with the northeast direction being the main direction for eco-efficient use of cultivated land. The ECLU value in the southern built-up areas was relatively low.

3.2. Analysis of the Spatial Association Network Characteristics of the ECLU

3.2.1. Network Structure Effect Analysis of the ECLU of the Changchun Metropolitan Area

The spatial association relationship matrix of the ECLU between cities was determined using a modified gravity model. According to the “mean principle”, if the spatial association strength F was greater than the mean value, it was denoted as 1, indicating an association between the two cities; if F was not greater than the mean value, it was denoted as 0, indicating no association between the two cities [30]. Thus, a spatial binary matrix was developed, which served as the basic data for the network structure analysis.
Figure 5 depicts the spatial association relationship with respect to the ECLU values for the Changchun Metropolitan Area. The ECLU presented an obvious network structure among the cities, and we noted differences in the spatial association strength between different cities. Except for Meihekou, other cities portrayed a certain spatial association with Changchun; in particular, the relationships between Songyuan and Changchun as well as Siping and Changchun were relatively strong. In addition, the gravity between the cities was directional, indicating that the gravity of Changchun in Jilin was stronger than that of Jilin in Changchun.
The complexity and relevance of the ECLU’s entire spatial association network for the Changchun Metropolitan Area were measured based on the network density, connectedness, hierarchy, and efficiency. The network density value of the ECLU in the Changchun Metropolitan Area was 0.267, which was far below the medium level of 0.500, indicating that the spatial correlation of the ECLUs between the cities was low. The network connectedness was 0.667, indicating the presence of “island” cities in the spatial association network. Several lines in the network were connected to a certain city, namely Changchun City; thus, we could conclude that accessibility between the network nodes needs to be further improved. For network hierarchy and efficiency, the values were calculated as 0.000 and 1.000, respectively, demonstrating that the hierarchical structure was not evident, subordination relationship was poor, and network stability was low. Therefore, we recommend strengthening the spatial correlation between the cities in the study area.

3.2.2. Network Structure Effect Analysis of the ECLU for the Urban–Rural Transition Area

Figure 6a depicts the gravitational relationship of hotspot-to-hotspot and hotspot-to-coldspot, with respect to the ECLU in the urban–rural transition area, while assuming that the node association was directional. Most locations in the region portrayed a certain spatial association relationship. The spatial association strength between the hotspots and coldspots was low; medium and high spatial-association strengths existed inside the hotspots, especially in the direction of urban development (toward northeast). Figure 6b–e portray the quantification of the power of each node in the network, i.e., the centralities for each node. The degree centrality was divided into in- and out-degree, where in-degree represents the agglomeration effect and out-degree represents the diffusion effect. The spatial variations in the in-degree values in the urban–rural transition area was large; only 20.952% of sampling points portrayed in-degree values greater than the out-degree values, suggesting that the siphoning effect of the ECLU at most points was greater than the attraction capacity. Furthermore, the betweenness centrality reflected the intermediary position of the nodes in this network; the higher the betweenness centrality among the sampling points, the higher the degree of control of the sampling point over the eco-efficiency linkages to other sampling points. The average value of betweenness centrality was 287.248, and the nodes with high values were mostly scattered around the fringe of the urban built-up area. This indicated that these nodes played a key intermediary role in the spatial association network of the ECLU and could strongly control and dominate the entire association network in the urban–rural transition area. The average closeness centrality was 50.238, and 43.810% of sampling points exceeded this average, indicating that these sampling points belonged to the relatively core participants and achieved fast associations with other sampling points in the network. This hierarchical and centralized characteristic of the spatial network was particularly obvious in the middle of the urban–rural transition area.
Regarding the overall structural characteristics of the spatially linked network of the ECLU in the urban–rural transition area, the value of network density was 0.117, demonstrating the low tightness of the spatial association of the ECLU; there was room for synergistic improvement in the ECLU of the urban–rural transition area. The network connectedness was 1.000, indicating that network connectedness had considerable accessibility. And there were direct or indirect connection paths between the nodes, indicating that the regional ECLU had obvious spatial correlation and spillover effects. The network hierarchy was only 0.091, indicating that the ECLU’s overall network structure did not have significant hierarchical characteristics, and its efficiency was 0.843, suggesting that the connectivity and stability of the network between the sampling points were weak; thus, the ECLU network connection in the urban–rural transition area must be improved.

4. Discussion

4.1. Spatial Correlation Effect of the ECLU Hidden Between Regional Boundaries

This study focuses on the Changchun Metropolitan Area and an urban–rural transition area in China, which were characterized by breaking regional boundaries for regional integration. Regarding the differences at the regional scale, the Changchun Metropolitan Area mainly considered how to effectively integrate land carbon into the evaluation system of the ECLU, emphasizing the dual constraints of resource conservation and environmental protection in the context of new-type urbanization and agricultural modernization. As an area with prominent human–land contradictions, the urban–rural transition area was mainly subject to the allocation of land space, resource elements, and high-quality human needs, and its ECLU was often ignored because of the difficulty of quantitative assessment. Herein, geospatial and geochemical data were used in exploratory attempts. The abovementioned evaluation systems facilitated clarifying the conceptual connotations and spatial distribution characteristics of multifactor and multilevel ECLUs.
Thus, some evaluation units (cities/sampling points) in the Changchun Metropolitan Area and urban–rural transition area achieved the effectiveness of the ECLU’s evaluation system, indicating that the inputs and outputs in these locations were relatively reasonable. This is consistent with the findings of Kuang et al. [1], who demonstrated that the Jilin Province had the highest median ECLU value (1.000), and that this region performed relatively well regarding carbon emission abatement and sustainable utilization of cultivated land. Despite all of our attempts, the ECLU remains only adequate [21]. There is a growing consensus that the agricultural sector should transform its production mode from extensive operation to a focus on quality improvement [3].
The comprehensive development of green agriculture is a complex phenomenon that depends on various internal and external factors in several regions [19,31]. According to the push and pull theory, the agglomeration effect of urbanization affects the structure and quantity of inputs of various production factors [32]. Therefore, based on the sustainable development goals (SDGs), it is important to determine whether the hidden spatial correlation of ECLU between regions is a “driver” or “barrier” to the quality and efficient development of cultivated land. Previous studies have revealed that there are obvious differences in ECLU among regions, and the spatial distribution pattern of the high eco-efficiency is “block” clustering [33,34,35].
Considering the differences in regional resource endowments, agricultural productivity, and industrial policies, the ECLU presents spatial non-equilibrium [36]. Currently, although a spatial correlation behavior among regions centered around Changchun was established for the Changchun Metropolitan Area, wherein Changchun exuded a strong attraction capacity, the impact of spatial agglomeration remained minimal. Promoting an agglomerated economy and scale benefits in the regional space was the mainstream development orientation in the Jinlin Province. Our findings indicated that the network structure of the Changchun Metropolitan Area needs to be optimized, to enable the shift from monocentric radiation to a multicentric network and promote the overall improvement of the ECLU through the spatial spillover effect between the regional cities. The attraction between the cities was bidirectional. The geographical proximity between the regions not only breaks the barriers of resource flow, but also leads to the interconnection of advantageous production factors, thereby increasing the potential of efficient regions. However, this approach may increase the regional differences. Under the siphoning effect, the positive influence of an efficient city on an inefficient one is easily neutralized or reversed.
Compared with traditional agricultural areas, the cultivated land in urban–rural transition areas is subject to multiple land-use conflicts, which makes the cultivated utilization environment more complicated and faces more multi-source utilization risks and opportunities. Long-term urbanization and industrialization also make the cultivated land in these areas closed and fragmented, and the change in soil structure destroys the production capacity of cultivated land. Meanwhile, pollutants such as heavy metals produced by urban metabolism continuously accumulate in cultivated land, which hurts the quality of cultivated land. On the other hand, the construction of urban infrastructure provides convenient conditions for the utilization of cultivated land, which is conducive to agricultural modernization. In this study, the ECLU in the urban–rural transition area portrayed a spatial distribution behavior that was characterized by higher concentrations along the northeast direction, which has been the main development direction of urban construction recently in Changchun City [23]. However, the ECLU in the southern urban built-up area of the study area was relatively low owing to the new-type urban development providing opportunities for cultivated land utilization, for which the promotion of agricultural modernization effectively improves the convenience of the utilization and production function of cultivated land. Continuous urban construction destroys the original structure of cultivated land, and to realize the intensive and efficient utilization of limited cultivated land resources, chemical products are being used extensively; fertilizers and pesticides have increased the ecological burden on cultivated land. Furthermore, energy consumption has increased the pressure on carbon emissions, counteracting their positive effects on eco-efficiency [8]. It is necessary to realize the sustainable development of agricultural modernization in the transitional region through policy restrictions and technology upgrading. Moreover, high values of degree, betweenness, and closeness centralities were primarily distributed around the newly developed urban built-up area, which is the focal region of the spatial spillover effect of the ECLU, demonstrating that it is easier to induce a siphoning effect in other areas. As the region is in a critical period of urban and rural transformation, there remains room for collaborative improvement in the ECLU in the urban–rural transition area. Improving the connectivity and stability of spatial association networks via direct and indirect connections between cultivated lands is an effective approach for improving development law related to new-type urbanization.

4.2. Policy Implications

Exploring ECLU is meaningful and essential because it provides valuable information for decision-makers to formulate policies and plans to achieve sustainable development [6]. Currently, China’s economic development has shifted from a stage of high-growth to high-quality development, requiring the exploitation and utilization of land to shift from scale-driven to quality-driven approaches. Thus, the country can no longer rely on large-scale incremental land exploitation to promote development and must seek benefits from limited stock space to promote high-quality social and economic development with sustainable utilization. As green and low-carbon development has become the consensus of all countries in the world, breaking regional boundaries and promoting ECLU improvement through collaborative networks has become an important means to reduce the negative externalities of urbanization, industrialization, and agricultural modernization. Furthermore, this approach leads to a breakthrough in achieving “double carbon” goals and promoting sustainable and circular development. Therefore, through multiscale and network analysis of the ECLU, this study provides novel suggestions for improving the ECLU at a regional scale and tapping into the regional linkage potential for new-type urbanization. The major policy implications of this study are explained below.
(1) Fully understanding the connotations and spatial correlation laws of the ECLU. The ECLU for the Changchun Metropolitan Area depicted obvious regional differences, with Siping City portraying the highest ECLU value, whereas the Jilin and Meihekou cities portrayed low ECLU value. Regarding the spatial network of the Changchun Metropolitan Area, we noted spatial correlation only between individual cities and Changchun. Although Siping, Liaoyuan, and Songyuan exhibited good ECLU levels, there were no circular linkages among them. Regarding the background of the country’s plan, “the Party Central Committee of China regards urban agglomeration as the main body of national new-type urbanization, emphasizing improving the comprehensive carrying capacity of urban agglomeration and optimal allocation of resources, and planning to form a strategy for high-quality regional development driven by urban agglomeration”, the cultivated land utilization in the Changchun Metropolitan Area should be optimized for high-quality development and ecological civilization construction at the macro level [31]. Furthermore, economic structural adjustment and supply side reform must be ensured to improve regional ECLU, while increasing agricultural asset inputs. Moreover, it is important to establish a horizontal cooperation linkage mechanism to strengthen the economic and social exchanges along with interactions regionally, while realizing the importance of high-value ECLU areas in the Changchun Metropolitan Area to the neighboring regions.
(2) Restraining the phenomenon of “bipolar” division of ECLU and promoting the network for collaborative transformation. The Changchun Metropolitan Area is located in China’s main grain-producing region; the “two-type” agricultural development in the area (i.e., resource-saving and environment-friendly) is regarded as the core goal of the Jilin Province’s “One Main and Six Pairs” high-quality development strategy, the Changchun Metropolitan Area Territorial Space Planning for 2021–2035, and other regional plans. However, the overall level is, relatively, lagging behind. The comprehensive regional carrying capacity of a region and optimal allocation of resources are key to regional integration and development. According to the strategic intention of the national 14th Five-Year Plan, as the network center, Changchun City should portray its core position and intermediary role. Specifically, the government should fulfill its decisive role in resource allocation through macro-scale control and break down the administrative barriers between different regions. Through the efficient agglomeration of resources, technology, and infrastructure construction, various government departments further promote the development of agricultural modernization, smoothen the spatial flow channels of the total elements of cultivated land among the urban regional systems in the area, and tap into the region’s potential for eco-efficiency spillover and reception. Based on the formation of a favorable atmosphere for the coordinated transformation of cultivated land production to improve quality and efficiency, a regional development behavior with complementary advantages should be established.
(3) Strengthening linkage between urban and rural areas. The linkage between urban and rural areas is crucial for realizing new-type urbanization, which provides new opportunities for cultivated land utilization. Urban construction is a double-edged sword for improving the ECLU in the urban–rural transition area considered in this study. Many studies focused on narrowing the allocation efficiency of production factors [1,37], and it is an important prerequisite for the study regions to meet the opportunities presented by new-type urbanization. By connecting the countryside to the city, we strengthen the production of cultivated land, realize infrastructure connectivity, reduce dependence on agricultural production input factors, and improve the feedback ability of cultivated land production. However, rapid urbanization may lead to a sharp decline in the amount of land cultivated. As a result of improving the expected socioeconomic output of cultivated land using extreme measures, continuous high-intensity and high-carbonization of cultivated land utilization may lead to a negative impact on the environment. Therefore, it is necessary to coordinate urban development, agricultural production, and environmental protection in the urban–rural transition area and pursue maximum expected outputs.
First, while using the advantages of specific locations, the Chinese government should establish a reasonable urban–rural two-way restraint mechanism and improve the supervision systems for urban development, agricultural protection, and ecological utilization. Through the establishment of an inter-regional benefit compensation mechanism and financial transfer payment system, the country should enable the transformation of urban and rural development. Second, the country should promote novel green ecological technologies for cultivated land, build a dynamic management system for ensuring the efficient production of cultivated land, and strictly control the use of pollution-causing factors. Third, the country should promote direct linkages between cultivated land protection and government subsidies to support agriculture and stimulate the regional financial support for agriculture to address the needs of farmers.

4.3. Limitations and Future Work

We attempted to address the gaps in the multi-scale, multi-factor, and boundary-breaking evaluations of the ECLU for two regions in China, while providing a reference for improving our understanding of the spatial association network characteristics of the ECLU, highlighting the close relation of the network to the strategic needs and difficulties of cultivated lands’ sustainable utilization and protection.
This study has several limitations. The development of a spatial association network is important for regional linkages and collaborative development. Due to the limitations of space and data availability, we only analyzed the structural characteristics of the spatial association network for the correlated efficiency values of the two regions from a holistic and static perspective. Furthermore, the driving factors of the spatial association network, such as economic scale and industrial structure, etc., as well as the dynamic change trends of the ECLU at different scales were not investigated. The spatial pattern of the ECLU is the result of multiple factors and concentrated embodiment of the law of economic and social development. In the future, we plan to explore the influencing and spatial conduction mechanisms of the ECLU to provide a foundation for developing more refined and differentiated coordinated development strategies for new-type urbanization and ecological utilization practices for cultivated land.

5. Conclusions

We used the Changchun Metropolitan Area and a representative urban–rural transition area for conducting empirical studies regarding the ECLU evaluation frameworks and analyzed the spatial association network structure of the ECLU using super-SBM, gravity, and social network analyses. The average ECLU value for the Changchun Metropolitan Area was 0.974, with most cities portraying eco-efficiency (except for Meihekou and Jilin). The ECLU in the urban–rural transition area was generally low and medium–low; a high-ECLU region was in proximity to the urban built-up area. Regarding the analysis of the structural characteristics of the spatial association network of the ECLU, the network densities in the Changchun Metropolitan Area and urban–rural transition area were 0.267 and 0.117, respectively, indicating that the spatial correlations were relatively weak and that the network hierarchy and stability could be improved. In addition, we noted high attraction capacity and siphoning effects outside the regional boundaries, which manifested as spatial radiation characteristics, with Changchun City being the center of the Changchun Metropolitan Area. In the urban–rural transition area, the ECLU around the newly built urban area was more likely to generate spatial spillover.
Herein, we customized new conceptual index systems for the ECLU at different regional scales to provide a better understanding of the network structure effect of the ECLU by breaking the constraints of spatial boundaries. Our study serves as a reference for stakeholders and decision-makers for formulating differentiated land-use management programs and valid regional development strategies. We suggest using novel methods for ECLU evaluation, while highlighting the dominant positions of core nodes and strengthening the interconnection and interaction between peripheral areas and areas with high eco-efficiency, to promote improvement in the regional ECLU. Restraining the “polarization” phenomenon of ECLU provides the direction for promoting the transformation of high-quality agricultural development.
This study analyzed the scale effects and regional differences in ECLU from a holistic and static perspective. Future research can investigate the dynamic evolution and spatio-temporal driving mechanisms of the spatial network structure of ECLU to elucidate the policy implications behind its transformation.

Author Contributions

Conceptualization, methodology, software, visualization, writing—original draft, X.W.; supervision, D.W.; writing—review and editing, validation, funding acquisition, X.W. and D.W. All authors have read and agreed to the published version of the manuscript.

Funding

This research work was supported by the Postdoctoral Fellowship Program of CPSF (grant number GZB20230251) and the National Natural Science Foundation of China (grant number 42071255).

Data Availability Statement

The raw data supporting the conclusions of this article will be made available by the authors on request.

Conflicts of Interest

The authors declare no conflicts of interest.

References

  1. Kuang, B.; Lu, X.; Zhou, M.; Chen, D. Provincial cultivated land use efficiency in China: Empirical analysis based on the SBM-DEA model with carbon emissions considered. Technol. Forecast. Soc. Change 2020, 151, 119874. [Google Scholar] [CrossRef]
  2. Han, H.; Zhang, X. Exploring environmental efficiency and total factor productivity of cultivated land use in China. Sci. Total Environ. 2020, 726, 138434. [Google Scholar] [CrossRef] [PubMed]
  3. Yang, B.; Wang, Z.; Zou, L.; Zou, L.; Zhang, H. Exploring the eco-efficiency of cultivated land utilization and its influencing factors in China’s Yangtze River Economic Belt, 2001–2018. J. Environ. Manag. 2021, 294, 112939. [Google Scholar] [CrossRef] [PubMed]
  4. Guo, B.; He, D.; Jin, G. Agricultural production efficiency estimation and spatiotemporal convergence characteristic analysis in the Yangtze River Economic Belt: A semi-parametric metafrontier approach. Land Degrad. Dev. 2023, 34, 4635–4648. [Google Scholar] [CrossRef]
  5. Cao, W.; Zhou, W.; Wu, T.; Wang, X.; Xu, J. Spatial-temporal characteristics of cultivated land use eco-efficiency under carbon constraints and its relationship with landscape pattern dynamics. Ecol. Indic. 2022, 141, 109140. [Google Scholar] [CrossRef]
  6. Wang, J.; Su, D.; Wu, Q.; Li, G.; Cao, Y. Study on eco-efficiency of cultivated land utilization based on the improvement of ecosystem services and emergy analysis. Sci. Total Environ. 2023, 882, 163489. [Google Scholar] [CrossRef]
  7. Caiado, R.G.G.; de Freitas Dias, R.; Mattos, L.V.; Quelhas, O.L.G.; Leal Filho, W. Towards sustainable development through the perspective of eco-efficiency—A systematic literature review. J. Clean. Prod. 2017, 165, 890–904. [Google Scholar] [CrossRef]
  8. Shen, L.; Sun, R.; Liu, W. Examining the drivers of grain production efficiency for achieving energy transition in China. Environ. Impact Assess. Rev. 2024, 105, 107431. [Google Scholar] [CrossRef]
  9. World Business Council for Sustainable Development (WBCSD). Eco-Efficiency Learning Module. 1992. Available online: www.wbcsd.org (accessed on 18 April 2024).
  10. Chen, Q.; Zheng, L.; Wang, Y.; Wu, D.; Li, J. A comparative study on urban land use eco-efficiency of Yangtze and Yellow rivers in China: From the perspective of spatiotemporal heterogeneity, spatial transition and driving factors. Ecol. Indic. 2023, 151, 110331. [Google Scholar] [CrossRef]
  11. Yang, B.; Zhang, Z.; Wu, H. Detection and attribution of changes in agricultural eco-efficiency within rapid urbanized areas: A case study in the Urban agglomeration in the middle Reaches of Yangtze River, China. Ecol. Indic. 2022, 144, 109533. [Google Scholar] [CrossRef]
  12. Zhu, X.; Chen, Q.; Chen, X.; Cheng, X.; Wang, Y. How industry integration improves the eco-efficiency of the textile industry: The case of Qun-yi village in China. J. Clean. Prod. 2024, 438, 140490. [Google Scholar] [CrossRef]
  13. Zhang, J.; Zhang, P.; Liu, Y.; Lu, S.; Wu, G. An analysis of the spatiotemporal evolution and driving force of cultivated land green utilization in karst region of southwest China. J. Clean. Prod. 2024, 434, 140002. [Google Scholar] [CrossRef]
  14. Coluccia, B.; Valente, D.; Fusco, G.; De Leo, F.; Porrini, D. Assessing agricultural eco-efficiency in Italian Regions. Ecol. Indic. 2020, 116, 106483. [Google Scholar] [CrossRef]
  15. Guo, Y.; Tong, L.; Mei, L. Spatiotemporal characteristics and influencing factors of agricultural eco-efficiency in Jilin agricultural production zone from a low carbon perspective. Environ. Sci. Pollut. Res. 2022, 29, 29854–29869. [Google Scholar] [CrossRef] [PubMed]
  16. Zhang, Z.; Shi, K.; Tang, L.; Su, K.; Zhu, Z.; Yang, Q. Exploring the spatiotemporal evolution and coordination of agricultural green efficiency and food security in China using ESTDA and CCD models. J. Clean. Prod. 2022, 374, 133967. [Google Scholar] [CrossRef]
  17. Picazo-Tadeo, A.J.; Gómez-Limón, J.A.; Reig-Martínez, E. Assessing farming ecoefficiency: A data envelopment analysis approach. J. Environ. Manag. 2011, 92, 1154–1164. [Google Scholar] [CrossRef]
  18. Tone, K. A slacks-based measure of efficiency in data envelopment analysis. Eur. J. Oper. Res. 2001, 130, 498–509. [Google Scholar] [CrossRef]
  19. Chen, Z.; Sarkar, A.; Rahman, A.; Li, X.; Xia, X. Exploring the drivers of green agricultural development (GAD) in China: A spatial association network structure approaches. Land Use Policy 2022, 112, 105827. [Google Scholar] [CrossRef]
  20. Yin, Y.; Hou, X.; Liu, J.; Zhou, X.; Zhang, D. Detection and attribution of changes in cultivated land use ecological efficiency: A case study on Yangtze River Economic Belt, China. Ecol. Indic. 2022, 137, 108753. [Google Scholar] [CrossRef]
  21. Luo, G.; Wang, X. Spatial association network structure of eco-efficiency and its influencing factors: Evidence from the Beijing-Tianjin-Hebei region in China. Ecol. Model. 2023, 475, 110218. [Google Scholar] [CrossRef]
  22. Zeng, X.; Ma, Y.; Ren, J.; He, B. Assessing the network characteristics and structural effects of eco-efficiency: A case study in the urban agglomerations in the middle reaches of Yangtze River, China. Ecol. Indic. 2023, 150, 110169. [Google Scholar] [CrossRef]
  23. Wang, X.; Wang, D.; Lu, J.; Gao, W.; Jin, X. Identifying and tracking the urban-rural fringe evolution in the urban-rural transformation period: Evidence from a rapidly urbanized rust belt city in China. Ecol. Indic. 2023, 146, 109856. [Google Scholar] [CrossRef]
  24. Ke, X.; Zhang, Y.; Zhou, T. Spatio-temporal characteristics and typical patterns of eco-efficiency of cultivated land use in the Yangtze River Economic Belt, China. J. Geogr. Sci. 2023, 33, 357–372. [Google Scholar] [CrossRef]
  25. Wang, X.; Wang, D.; Wu, S.; Yan, Z.; Han, J. Cultivated land multifunctionality in undeveloped peri-urban agriculture areas in China: Implications for sustainable land management. J. Environ. Manag. 2023, 325, 116500. [Google Scholar] [CrossRef]
  26. Wan, M.; Hu, W.; Wang, H.; Tian, K.; Huang, B. Comprehensive assessment of heavy metal risk in soil-crop systems along the Yangtze River in Nanjing, Southeast China. Sci. Total Environ. 2021, 780, 146567. [Google Scholar] [CrossRef]
  27. Mao, C.; Song, Y.; Chen, L.; Ji, J.; Li, J.; Yuan, X.; Yang, Z.; Ayoko, G.A.; Frost, R.L.; Theiss, F. Human health risks of heavy metals in paddy rice based on transfer characteristics of heavy metals from soil to rice. Catena 2019, 175, 339–348. [Google Scholar] [CrossRef]
  28. GB15618-2018; Soil Environmental Quality: Risk Control Standard for Soil Contamination of Agricultural Land. Ministry of Environmental Protection of China: Beijing, China, 2018.
  29. Tone, K.; Tsutsui, M. An epsilon-based measure of efficiency in DEA—A third pole of technical efficiency. Eur. J. Oper. Res. 2010, 207, 1554–1563. [Google Scholar] [CrossRef]
  30. Sun, Z.; Cheng, X.; Zhuang, Y.; Sun, Y. Spatial correlation network structure characteristics of carbon emission efficiency and its influencing factors at city level in China. Environ. Dev. Sustain. 2023, 26, 5335–5366. [Google Scholar] [CrossRef]
  31. Shen, Y.; Sun, X.; Fu, Y. The spatial network and its driving factors for sustainable total-factor ecology efficiency: The case of China. Environ. Sci. Pollut. Res. 2021, 28, 68930–68945. [Google Scholar] [CrossRef]
  32. Hou, X.; Liu, J.; Zhang, D.; Zhao, M.; Xia, C. Impact of urbanization on the eco-efficiency of cultivated land utilization: A case study on the Yangtze River Economic Belt, China. J. Clean. Prod. 2019, 238, 117916. [Google Scholar] [CrossRef]
  33. Fan, Y.; Ning, W.; Liang, X.; Wang, L.; Lv, L.; Li, Y.; Wang, J. Spatial–Temporal Characteristics and Influencing Factors of Eco-Efficiency of Cultivated Land Use in the Yangtze River Delta Region. Land 2024, 13, 219. [Google Scholar] [CrossRef]
  34. Ke, N.; Zhang, X.; Lu, X.; Kuang, B.; Jiang, B. Regional Disparities and Influencing Factors of Eco-Efficiency of Arable Land Utilization in China. Land 2022, 11, 257. [Google Scholar] [CrossRef]
  35. Zhou, X.; Wu, D.; Li, J.; Liang, J.; Zhang, D.; Chen, W. Cultivated land use efficiency and its driving factors in the Yellow River Basin, China. Ecol. Indic. 2022, 144, 109411. [Google Scholar] [CrossRef]
  36. Qu, H.; Yin, Y.; Li, J.; Xing, W.; Wang, W.; Zhou, C.; Hang, Y. Spatio-temporal Evolution of the Agricultural Eco-efficiency Network and Its Multidimensional Proximity Analysis in China. Chin. Geogr. Sci. 2022, 32, 724–744. [Google Scholar] [CrossRef]
  37. Ito, J. Inter-regional difference of agricultural productivity in China: Distinction between biochemical and machinery technology. China Econ. Rev. 2010, 21, 394–410. [Google Scholar] [CrossRef]
Figure 1. Location of the study area.
Land 13 02221 g001
Figure 2. Research framework.
Land 13 02221 g002
Figure 3. Results of the eco-efficiency of cultivated land use for the Changchun Metropolitan Area ((a). quantitative characteristics and (b). spatial distribution characteristics).
Land 13 02221 g003
Figure 4. Spatial distribution of the eco-efficiency of cultivated land use in the urban–rural transition area.
Land 13 02221 g004
Figure 5. Spatial association network of the eco-efficiency of cultivated land use for the Changchun Metropolitan Area.
Land 13 02221 g005
Figure 6. Spatial association network of the eco-efficiency of cultivated land use for the urban–rural transition area ((a). the gravitational relationship; (b). in-degree centrality; (c). out-degree centrality; (d). betweenness centrality; and (e). closeness centrality).
Land 13 02221 g006
Table 1. Input and output variables used for measuring the eco-efficiency of cultivated land use for the Changchun Metropolitan Area.
CategoryFactorVariableExplanationUnits
InputsResource inputsLandSown area of grain cropsThousand hectares
WaterEffective irrigation areaThousand hectares
ChemicalsConsumption of pesticidesTon
Consumption of chemical fertilizersTon
Consumption of plastic film for farm useTon
LaborAgriculture practitionersTen thousand people
Mechanical powerTotal power of agricultural machineryTen thousand kilowatts
Energy consumptionTotal agricultural diesel useTon
Desired outputsSocioeconomic outputsEconomic outputTotal agricultural output value100 million yuan
Social outputTotal grain outputTon
Environmental outputsCarbon sequestrationCarbon sequestration by food cropsTon
Undesired outputsPollutant and carbon outputsCarbon emissionsTotal carbon emissions from fertilizers, pesticides, agricultural film, agricultural machinery, irrigation, and tillageTon
Non-point source pollutionNitrogen and phosphorus loss from fertilizers, loss of pesticides, and residue of agricultural filmsTon
Disclaimer/Publisher’s Note: The statements, opinions and data contained in all publications are solely those of the individual author(s) and contributor(s) and not of MDPI and/or the editor(s). MDPI and/or the editor(s) disclaim responsibility for any injury to people or property resulting from any ideas, methods, instructions or products referred to in the content.

