Article

Climate and Permafrost Shifts in Yakutia’s Arctic and Subarctic from 1965 to 2023

by
Alexander N. Fedorov
1,2,*,
Pavel Y. Konstantinov
1,3,
Nikolay F. Vasilyev
1,3,
Stepan P. Varlamov
1,
Yuri B. Skachkov
1,
Alexey N. Gorokhov
4,
Svetlana V. Kalinicheva
1,
Rosaliya N. Ivanova
1,
Alexandra N. Petrova
1,
Varvara V. Andreeva
1,
Varvara A. Novopriezzhaya
1,2,
Maxim A. Sivtsev
1,2 and
Mikhail N. Zheleznyak
1
1
Melnikov Permafrost Institute SB RAS, Merzlotnaya, 36, 677010 Yakutsk, Russia
2
Institute of Geography RAS, Staromonetnyy Pereulok, 29, 119017 Moskva, Russia
3
Laboratory for Integrated Research of the Arctic Land-Shelf System, Tomsk State University, 634050 Tomsk, Russia
4
Institute for Biological Problems of Cryolithozone SB RAS, Lenina, 41, 677890 Yakutsk, Russia
*
Author to whom correspondence should be addressed.
Land 2024, 13(12), 2150; https://doi.org/10.3390/land13122150
Submission received: 23 October 2024 / Revised: 5 December 2024 / Accepted: 9 December 2024 / Published: 10 December 2024
(This article belongs to the Special Issue Impact of Climate Change on Land and Water Systems)

Abstract

:
By analyzing the last 50–60 years of climate changes in Arctic and Subarctic Yakutia, we have identified three distinct periods of climate development. The cold (1965–1987), pre-warming (1988–2004), and modern warming (2005–2023) periods are clearly identifiable. Yakutia’s Arctic and Subarctic regions have experienced mean annual air temperature increases of 2.5 °C and 2.2 °C, respectively, compared to the cold period. The thawing index rose by an average of 171–214 °C-days, while the freezing index dropped by an average of 564–702 °C-days. During the pre-warming period, all three characteristics show a minor increase in warmth. Global warming intensified between 2005 and 2023, resulting in elevated permafrost temperatures and a deeper active layer. Monitoring data from the Tiksi site show that warming has been increasing at different depths since the mid-2000s. As a result, the permafrost temperature increased by 1.7 °C at a depth of 10 m and by 1.1 °C at a depth of 30 m. Soil temperature measurements at meteorological stations and observations at CALM sites both confirm the warming of the permafrost. A permafrost–climatic zoning study was conducted in Arctic and Subarctic Yakutia. Analysis identified seven regions characterized by similar responses to modern global warming. These study results form the foundation for future research on global warming’s effects on permafrost and on how northern Yakutia’s environment and economy adapt to the changing climate.

1. Introduction

Modern climate warming has led to a near-universal increase in permafrost temperatures in the cryolithozone [1,2,3,4,5,6,7]. The activation of cryogenic processes can be observed in nearly all areas due to climate warming [8,9,10,11,12]. Global warming’s impact on permafrost degradation can cause infrastructure risks [13,14,15,16,17].
Arctic and Subarctic landscapes comprise approximately 40% of Yakutia’s territory, encompassing tundra, sparse woodlands, plains, and mountains. The climate and permafrost are matched by diverse landscapes. Tundra landscapes are associated with the Arctic zone, while sparse larch forests of the northern taiga are found in the Subarctic zone.
The climate and permafrost variability of Arctic and Subarctic Yakutia were previously not examined independently. Research in Russia by Pavlov and Malkova [2] showed a steady increase in the mean annual air temperature, ranging from 0.03 to 0.05 °C per year, in the Arctic and Subarctic regions of Yakutia. This area had the smallest increase in temperature compared to other regions in Yakutia.
Skachkov [18] investigated the spatial variations in the mean annual air temperature in Yakutia from 1965 to 2009. They observed a noticeable rise in the mean annual air temperature in the Arctic zone of Yakutia, increasing from west to east—from 0.7 °C in Saskylakh, 1.2 °C in Tiksi, and 1.8 °C in Chokurdakh to up to 2.2 °C in Chersky. No specific patterns were observed in the Subarctic zone. On average, the mean air temperature increased by 1.4–1.8 °C during the time examined. During the same period, the Arctic zone experienced a decline in annual precipitation ranging from 34 mm in Tiksi to 86 mm in Chokurdakh. In Subarctic Yakutia, the western part (Olenek–Shelagontsy) saw a decrease in annual precipitation, while others (Zhigansk, Zyryanka) observed an increase.
Gorokhov and Fedorov [19] found that in Yakutia from 1966 to 2016, the Arctic and Subarctic regions experienced annual temperature trends between 0.03 and 0.05 °C per year. The New Siberian Islands and the region between the Kolyma and Indigirka rivers were found to have the most significant trends of 0.5–0.6 °C per year. The eastern territories along the Kolyma River have the lowest trend of less than 0.4 °C in January during winter, and the western regions along the Anabar and Olenek rivers have the largest trends of 0.8–1 °C. In July, the western territories of Yakutia’s Arctic and Subarctic have the lowest trends, while the eastern territories have the highest ones. The Arctic area of Yakutia saw a significant decrease in annual precipitation, while Subarctic Yakutia saw a shift from negative to positive trends, as revealed by research.
The study of permafrost conditions is focused on specific regions and territories. Over the past two to three decades, permafrost dynamics have been monitored in the Lena River delta [20] and Arctic Ocean coast [21,22], as well as in the Batagai depression [23,24,25] and other sites. Russian institutes (VSEGINGEO and PNIIIS, Moscow State University, and the Melnikov Permafrost Institute SB RAS) have been responsible for conducting a substantial amount of permafrost research in the Arctic and Subarctic areas over the years.
The research conducted by Pavlov and Malkova [2] in 1966–2005 focused on the dynamics of Russia’s cryolithozone in response to modern climate changes. The zone of trends with values ranging from 0.01 to 0.02 °C was found to encompass the majority of Arctic and Subarctic Yakutia. In Central Yakutia, the trend reached 0.03 °C per year under these conditions. Therefore, Pavlov and Malkova [2] assigned the majority of Arctic and Subarctic Yakutia to the low activation zone of cryogenic processes during the warm season. Romanovsky et al. [3] found that the permafrost temperature in Yakutia’s Kolyma Lowland has risen by 1.5 °C at 15 m depth in the past 20 years. Permafrost–climatic zoning of the Arctic and Subarctic of Yakutia was performed with the help of the results of these studies and their impact on permafrost temperature changes under modern global warming.
The objective of this study is to analyze the regional aspects of climate and permafrost changes in Yakutia’s Arctic and Subarctic regions over the past 50–60 years. The focus was on delimiting the extent of present-day warming in certain regions and identifying the most vulnerable territories to cryogenic processes that have a detrimental impact on permafrost landscapes and infrastructure. The results of this research have practical implications for predicting the evolution of permafrost landscapes in the Russian Federation, critical for geocryological monitoring efforts.

2. Materials and Methods

The Russian database VNIIGMI-WCD, available at www.meteo.ru/climate/sp_clim.php (accessed on 15 November 2024), provided air temperature and precipitation information. Data from 1965 to 2023, the most complete available, were used to make the selection. We analyzed data on mean annual air temperatures, thawing and freezing patterns between 1965 and 2023, and precipitation from 1966 to 2023. Data from meteorological stations not included in the VNIIGMI-WCD database (Sannikov Strait, Kigilyakh, Ust-Olenek, Eyik, Ekyuchyu, Iema, and Kolymskaya), but displaying a high correlation, were added to our spatial analysis. Missing monthly data points were filled in by estimating values using linear interpolation between nearby data. A total of 24 meteorological stations were chosen for our study (Table 1). Most of the stations are found in plains and plateaus, with their landscapes characterized by tundra, pre-tundra, and northern taiga open woodlands.
Russian Academy of Sciences personnel use automated temperature sensors in boreholes up to 30 m deep at monitoring sites to measure permafrost temperatures. They usually use data from 10 to 30 m deep boreholes, collected at various depths (0, 1, 2, 3, 5, 10, 20, and 30 m). In this paper, we focus on the data at 3, 10, and 30 m to understand how permafrost temperature changes over the years at different depths. Temperature sensors can include thermistors or platinum resistance thermometers. Data loggers of Russian and foreign manufacture were used to record temperature values. Subarctic weather stations measure temperature at depths reaching 1.6 m, so our analysis used average annual temperatures at this depth. This paper utilizes data on the depth of seasonal thawing from the international CALM project.
Meteorological station selection in permafrost–climatic regions considered correlations links between station data. Data without strong correlation coefficients, especially for annual precipitation, were removed. The weather station at Sannikov Strait was omitted from the assessment of precipitation in the New Siberian Islands because its data did not show sufficient correlation coefficients with other stations.
The thawing index, calculated by adding positive daily air temperatures, indicates the extent to which permafrost thaws during the summer. The freezing index, which is the total of negative daily air temperatures in °C, determines the winter freezing conditions of the active layer and the accumulation of cold reserves. The freezing–thawing index in this paper is based on monthly air temperatures at a specific site.
To understand permafrost climate zones, we examined climate variations by dividing climate records into distinct intervals. To detect changes in climate time series graphs, step-change models were used, incorporating quasi-stationary development periods and climatic shifts [26,27,28,29]. The mean annual air temperature showed a clear change in variability around 1987–1988 and again around 2004–2005, indicating important developmental climate shifts. Our analysis revealed three distinct phases in the climate evolution of Yakutia’s Arctic and Subarctic regions: a cold period (1965–1987), a pre-warming phase (1988–2004), and a modern warming period (2005–2023). Climate and permafrost zoning in the Republic of Sakha (Yakutia) relied on the Permafrost Landscape Map. The 54 provinces shown on this map are distinct due to their similar permafrost characteristics, including temperature, ice content, active layer thickness, and cryogenic processes. The unifying factor of these regional complexes was a shared climate—consistent air temperatures and precipitation. A total of seven distinct regions have been identified within the Arctic and Subarctic zones of Yakutia.

3. Results

Geological and geomorphological histories, as well as the elevation, are the primary factors influencing the natural and landscape features of regions. Permafrost–climatic zoning is a combination of two independent processes—permafrost zoning, the main criteria of which are the temperature regime and the ice content of permafrost, and climatic zoning, where the criteria are the air temperature regime and the distribution of precipitation. Theoretically, one climate can be characterized by multiple permafrost regions, or one permafrost region can be characterized by different climate conditions. Homogeneous climatic conditions can be found in the same permafrost landscape provinces. Hence, we grouped them based on climate characteristics in permafrost regions. From a taxonomic perspective, these permafrost–climatic regions have a higher ranking than permafrost landscape provinces. We identified three permafrost–climatic regions in the Arctic Yakutia—the New Siberian Islands, Lena–Anabar, and Yana–Kolyma. In Subarctic Yakutia, the following regions were identified: Lena–Olenyok, Yana, Kolyma–Indigirka, and Verkhoyansk–Chersky (Figure 1). Climate changes in the Verkhoyansk–Chersky region remain unknown due to the absence of long-term weather stations.

3.1. Climate Variability in the Arctic Region of Yakutia over the Past 50–60 Years

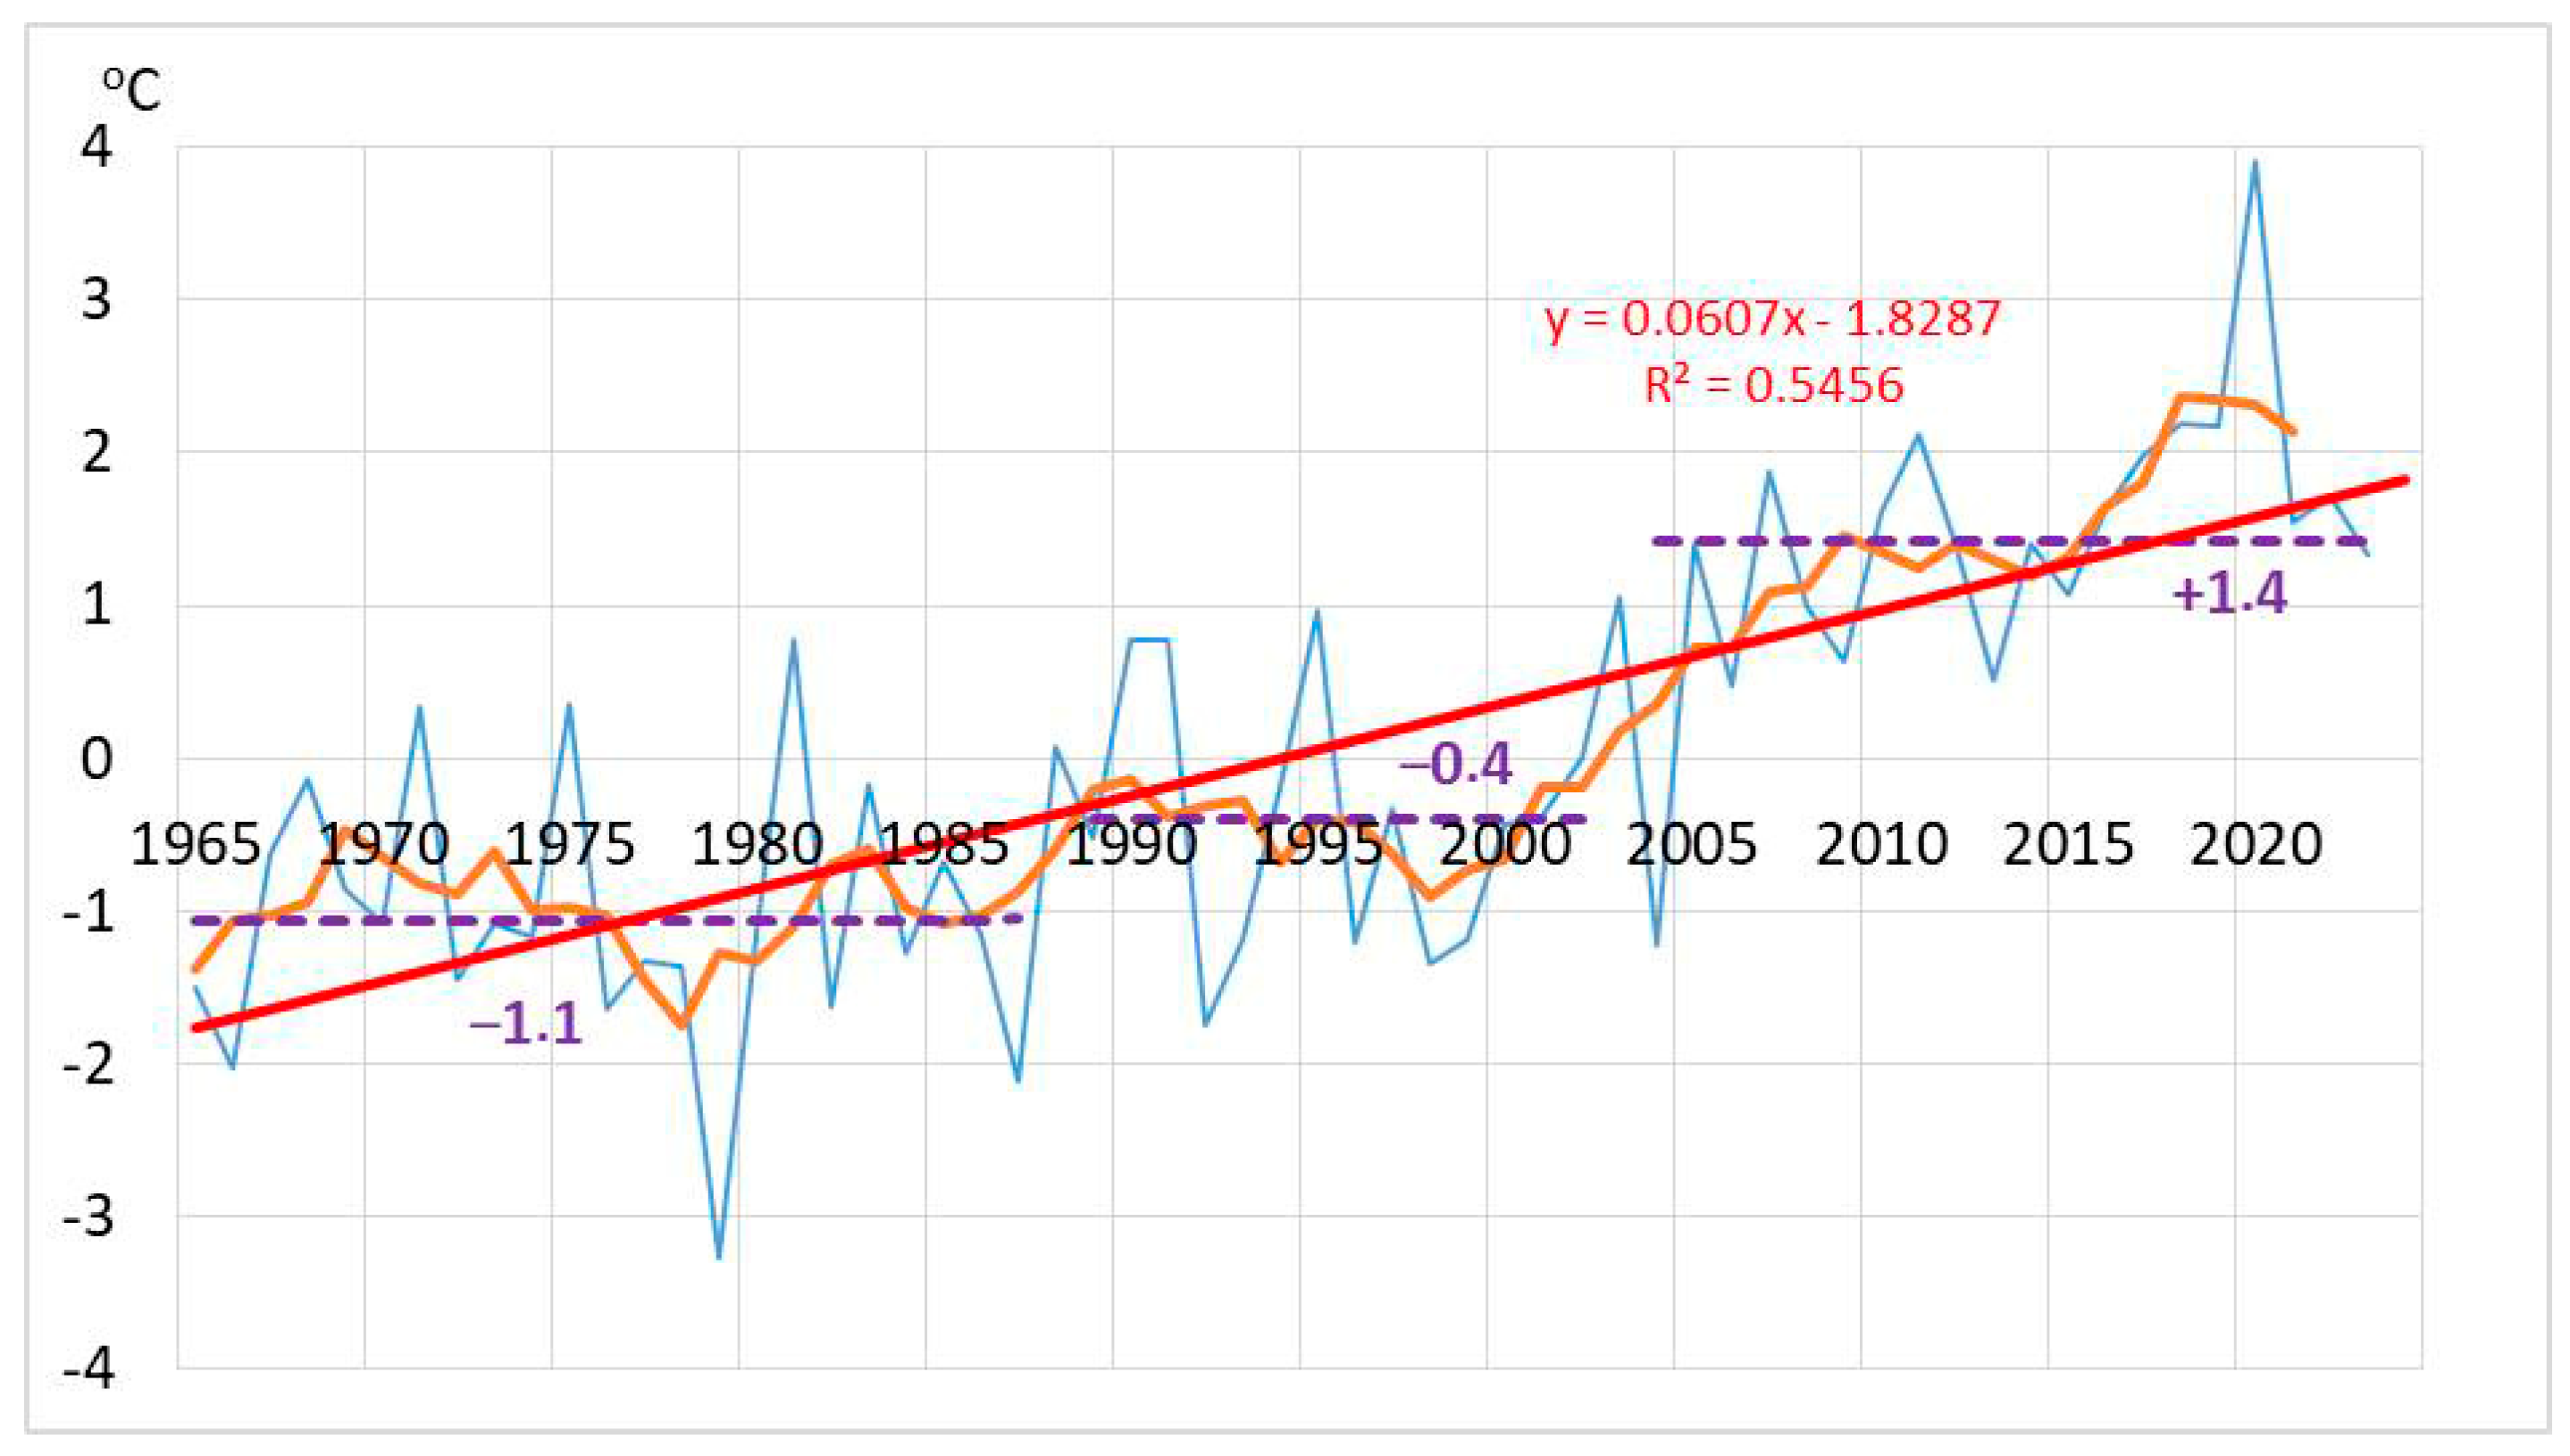
The mean annual air temperature in the Arctic zone of the Republic of Sakha (Yakutia) ranged from −11.8 °C (Ambarchik) to −14.4 °C (Sannikov Strait) between 1965 and 2023 (Table 2). Three periods were identified, 1965–1987, 1988–2002, and 2003–2023, each with different development characteristics (Figure 2). The mean annual air temperature in the tundra zone of Yakutia increased at a rate of 0.06 °C per year from 1965 to 2023.
The correlation coefficient of the mean annual air temperatures varies among the three permafrost–climatic regions. In the New Siberian Islands (Kotelny Island, Sannikov Strait, and Kigilyakh weather stations), it is 0.97–0.99; in the Anabar–Lena region (Saskylakh, Ust-Olenyok, and Tiksi weather stations), it is 0.88–0.91; and in the Yana–Kolyma region (Yubileinaya, Chokurdakh and Ambarchik weather stations), it is 0.50–0.89 (p ≈ 0.05 and n = 55). The Ambarchik weather station at the lower part of the Kolyma River basin has slightly different data than the other stations. In 1965–1987, the mean deviation of the mean annual temperature for all weather stations was −1.1 °C from the norm for the entire period of 1965–2023, −0.4 °C in 1988–2004, and +1.4 °C in 2005–2023 (see Figure 2). The Arctic zone of Yakutia experienced significant warming starting in 2005.
While the three tundra regions show similar development trends in the mean annual air temperature, there are some differences between them (Figure 3). The Novosibirsk Islands experienced a more intense cold from 1965 to 1987 than the Lena–Anabar and Yana regions. During the pre-warming period (1988–2004), the Yana–Kolyma region experienced a more substantial temperature increase. Temperature increases during the warming period (2005–2023) were most noticeable on the Novosibirsk Islands and, more recently, in the Anabar–Lena region. In general, in these regions, the difference in deviations on average reached 0.5 °C.
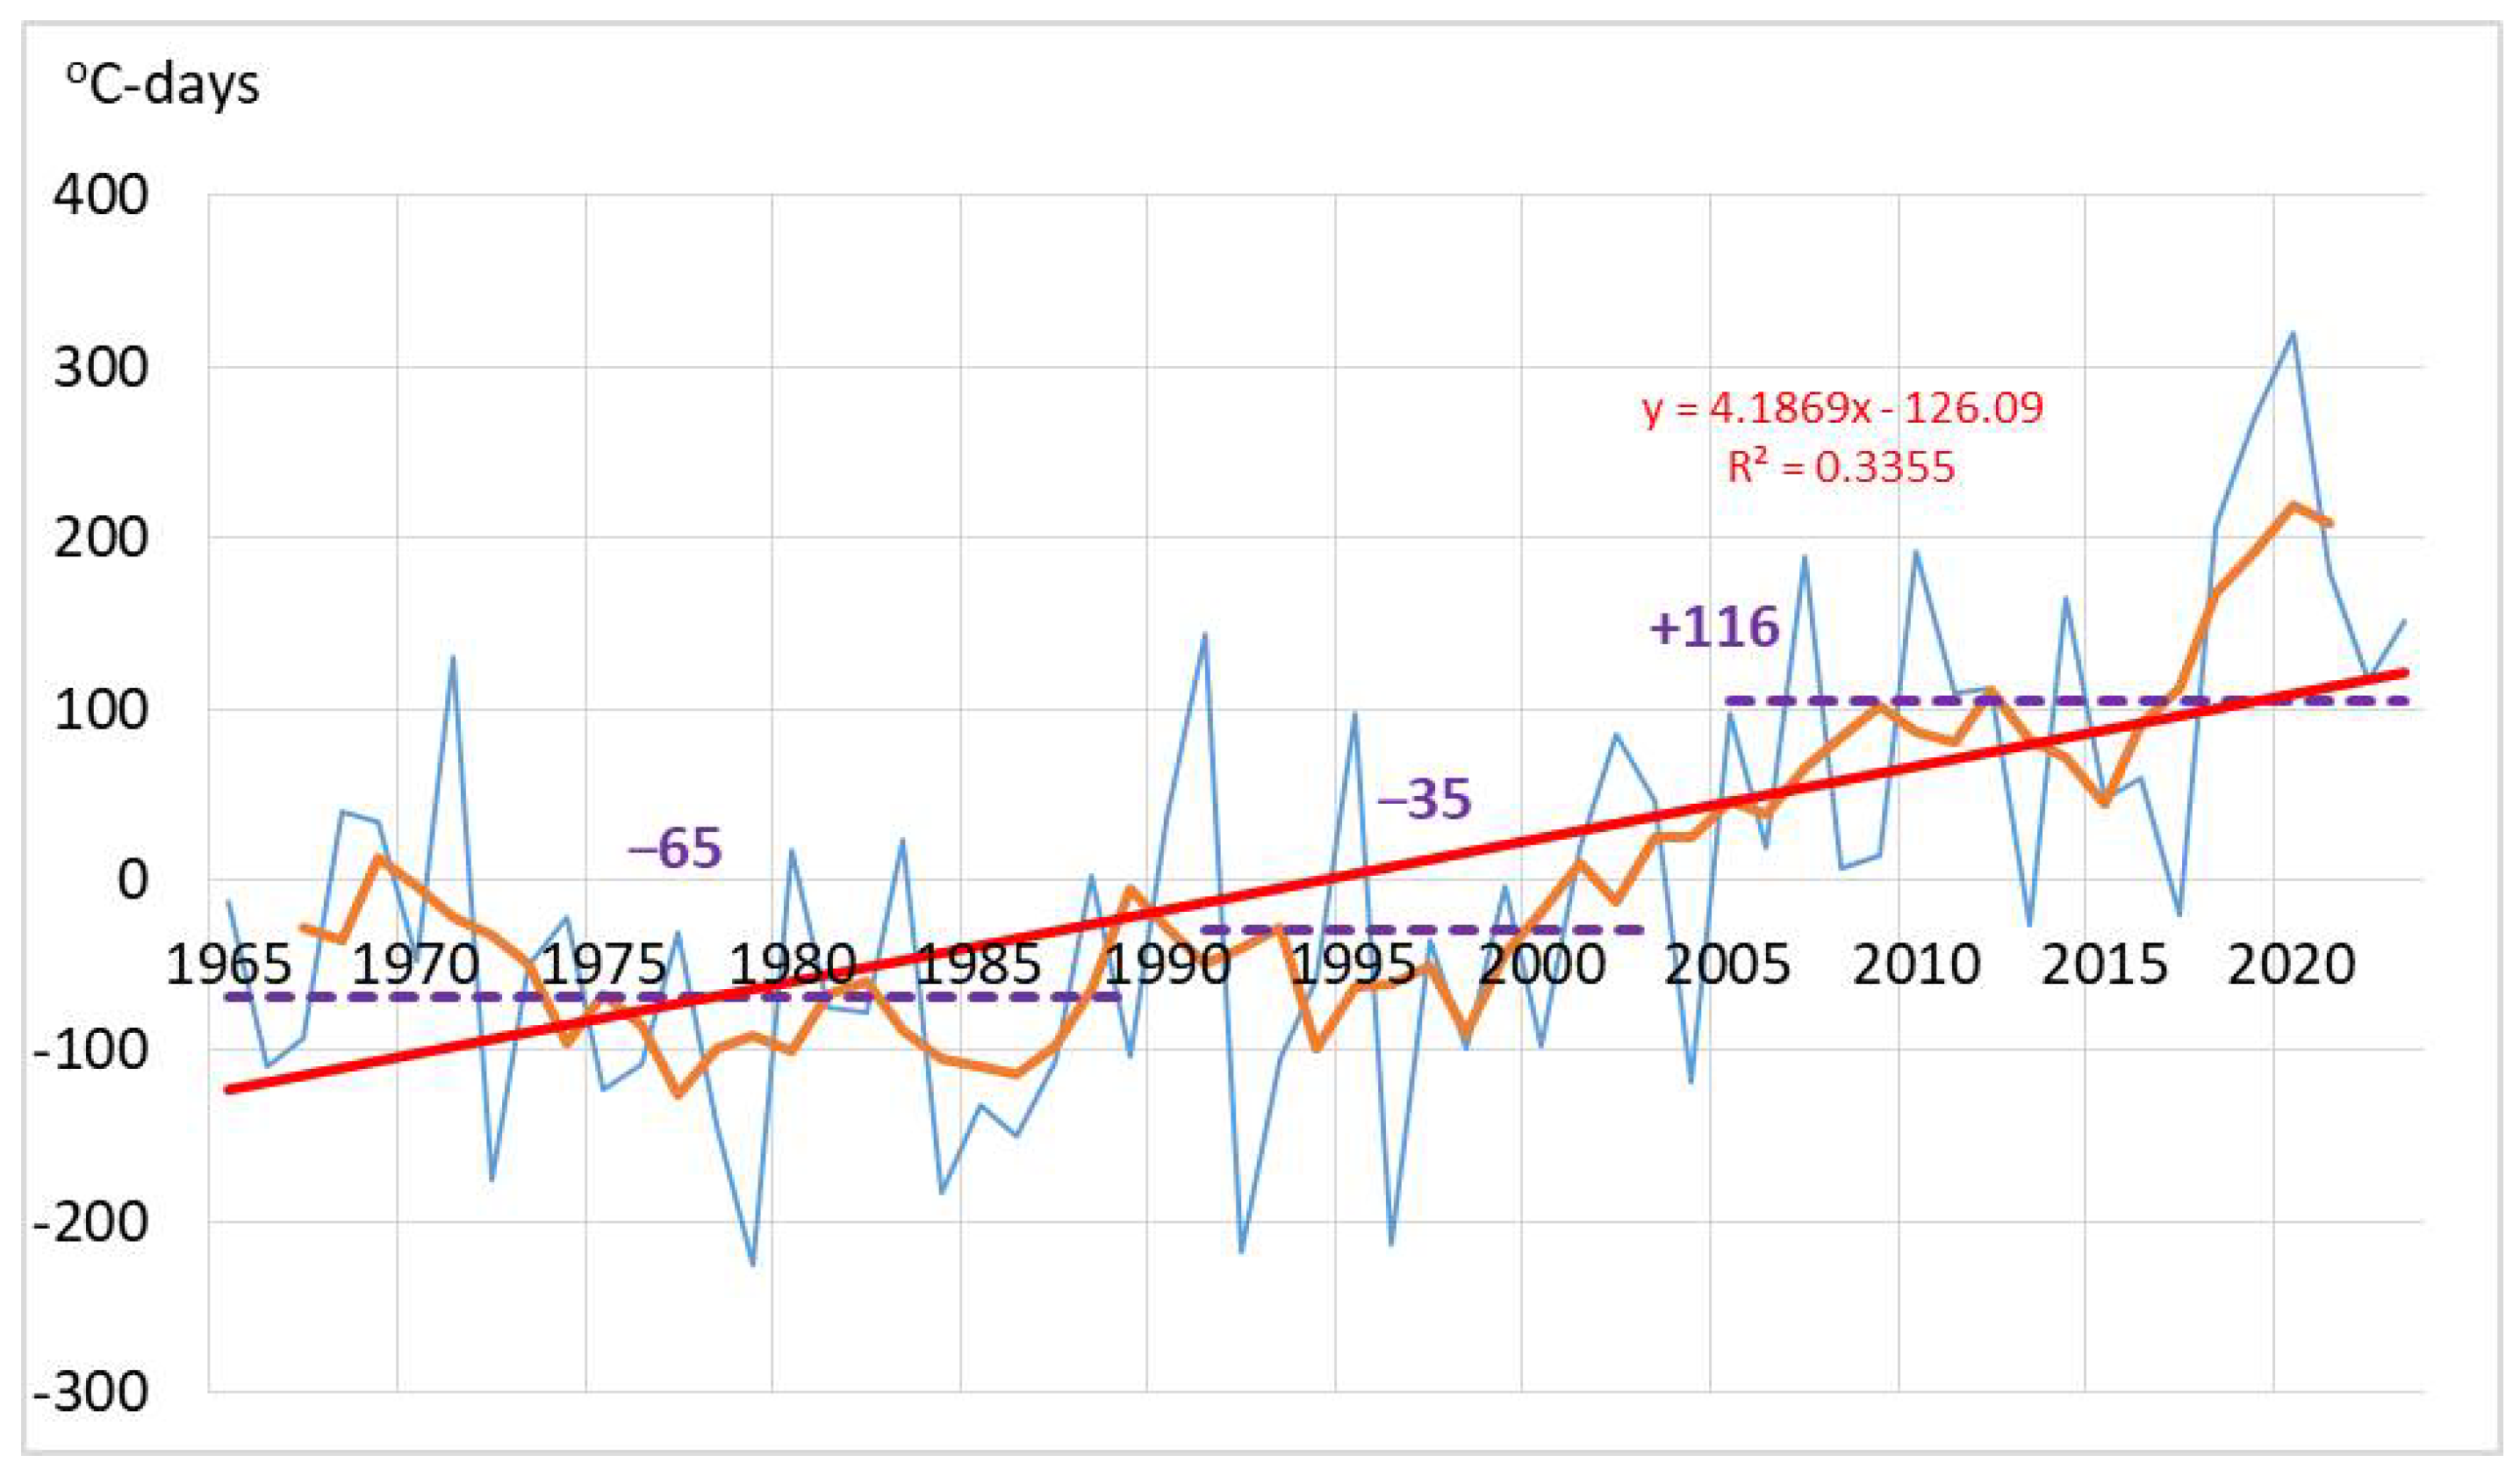
The thawing index in the Arctic zone of the Republic of Sakha (Yakutia) ranged from 198 (Kotelny) to 929 °C days (Yubileinaya) in 1965–2023 (Table 3). The differentiation of tundra landscapes into arctic, typical, and shrubby areas leads to a significant variation in data. Here, three distinct periods are identified—1965–1987, 1988–2004, and 2005–2023 (Figure 4). During the warmest period from 2005 to 2023, the thawing index in the tundra was 37% higher than in the cold period from 1965 to 1989.
In the New Siberian Islands (Kotelny Island and Kigilyakh) and the Anabar–Lena (Saskylakh, Ust-Olenek, and Tiksi) region, the thawing index at weather stations has a correlation coefficient of 0.74–0.89 (p ˂ 0.05 and n = 59), and in the Yana–Kolyma region (Yubileinaya, Chokurdakh, and Ambarchik), it is 0.45–0.89 (p ˂ 0.05 and n = 55). The data collected at the Ambarchik weather station on the lower Kolyma River differ significantly from other stations.
The mean deviation in the thawing index for all weather stations was −65 °C days from the norm during 1965–1987, −35 °C days during 1988–2004, and +116 °C days during 2005–2023 (see Figure 4). The Arctic zone experienced increasingly noticeable warming during summer from 2005. The variability of the thawing index shows a relatively uniform trend across the three tundra regions, with some differences observed (Figure 5). Between 1965 and 1987, the Yana–Kolyma region had a lower summer temperature rise. The Anabar–Lena region experienced a more noticeable temperature increase during the summer periods from 2005 to 2023.
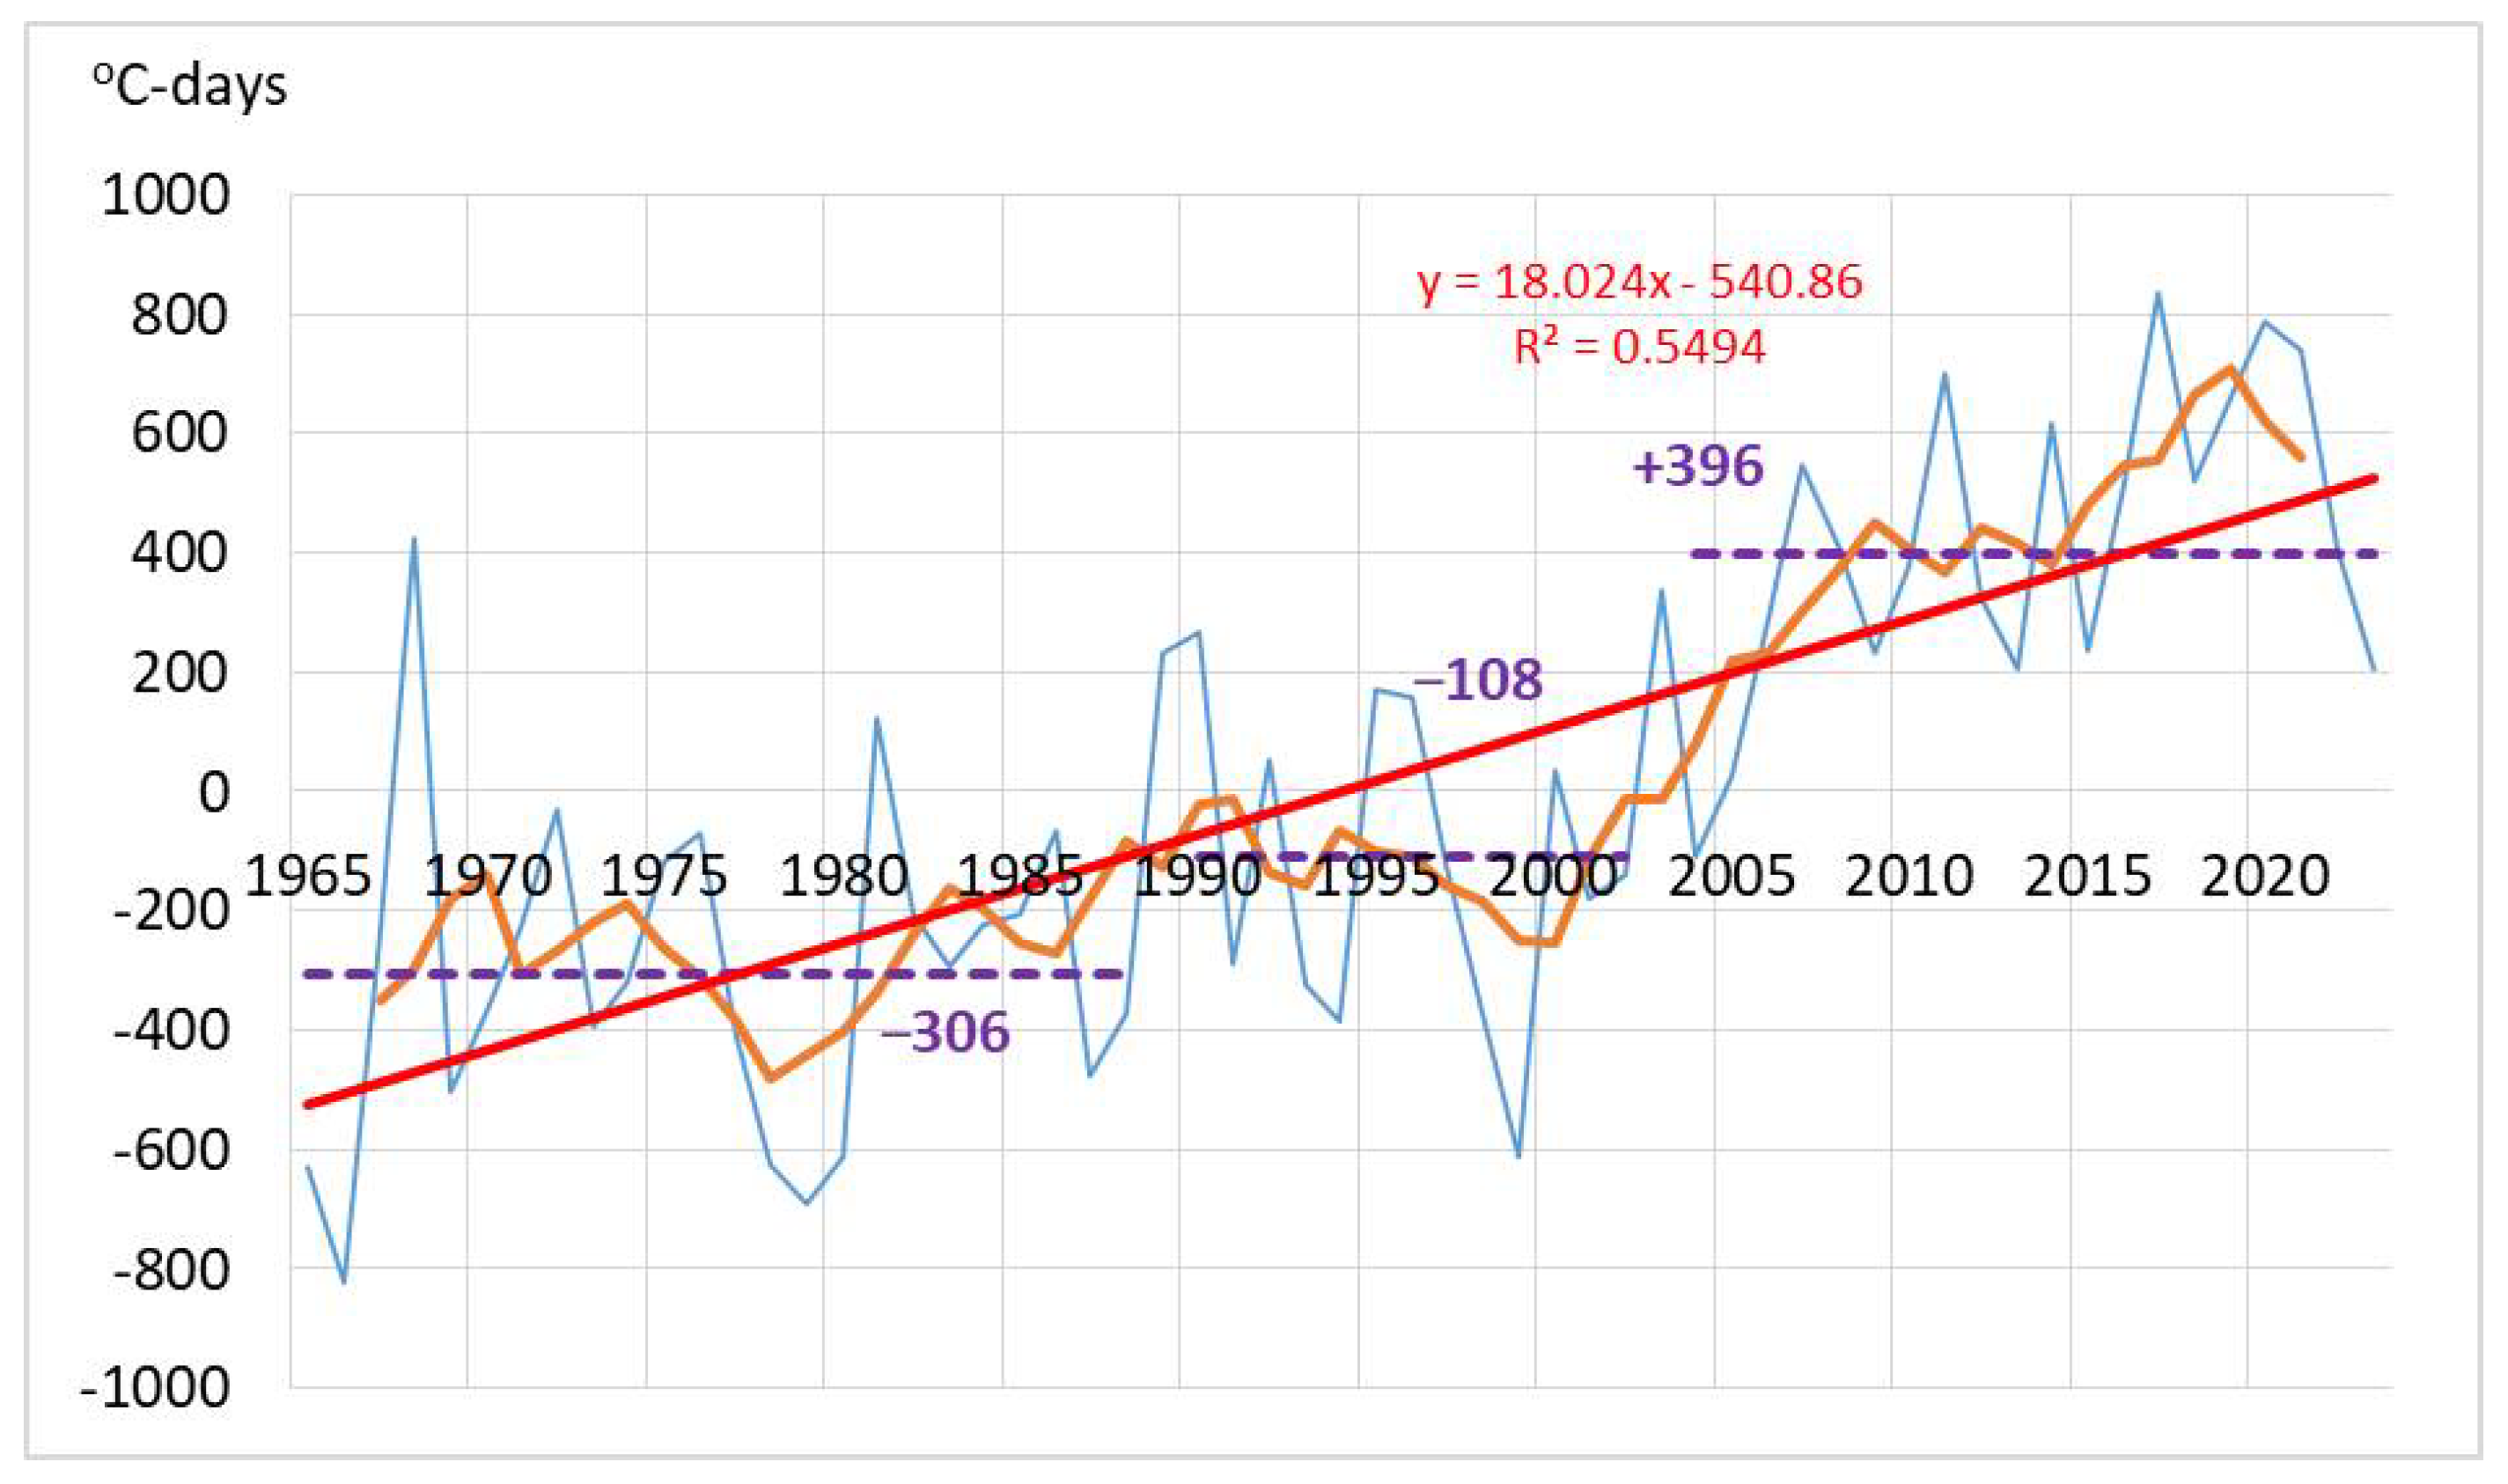
The freezing index in 1965–2023 in the tundra zone of the Republic of Sakha (Yakutia) varied from −4936 (Ambarchik) to −5935 °C days (Saskylakh) (Table 4). Three different periods were distinguished—1965–1988, 1989–2004, and 2005–2023 (Figure 6). The freezing index in the tundra in the warmest period of 2005–2023 was, on average, 13% lower compared to the colder period of 1965–1987.
On the New Siberian Islands (Kotelny Island, Sannikov Strait, and Kigilyakh weather stations) and in the Lena–Anabar region (Saskylakh, Ust-Olenek, and Tiksi weather stations), the correlation coefficient of mean annual air temperatures at weather stations is 0.83–0.98 at p ˂ 0.05 and n = 55, and in Yana–Kolyma (Yubileynaya, Chokurdakh and Ambarchik weather stations), it is 0.67–0.91 (p ˂ 0.05 and n = 56). In 1965–1987, the mean value of deviations of the freezing index for all weather stations was −306 °C days from the norm for the entire period of 1965–2023, −108 °C–days for 1988–2004, and +396 °C–days for 2005–2023 (see Figure 6).
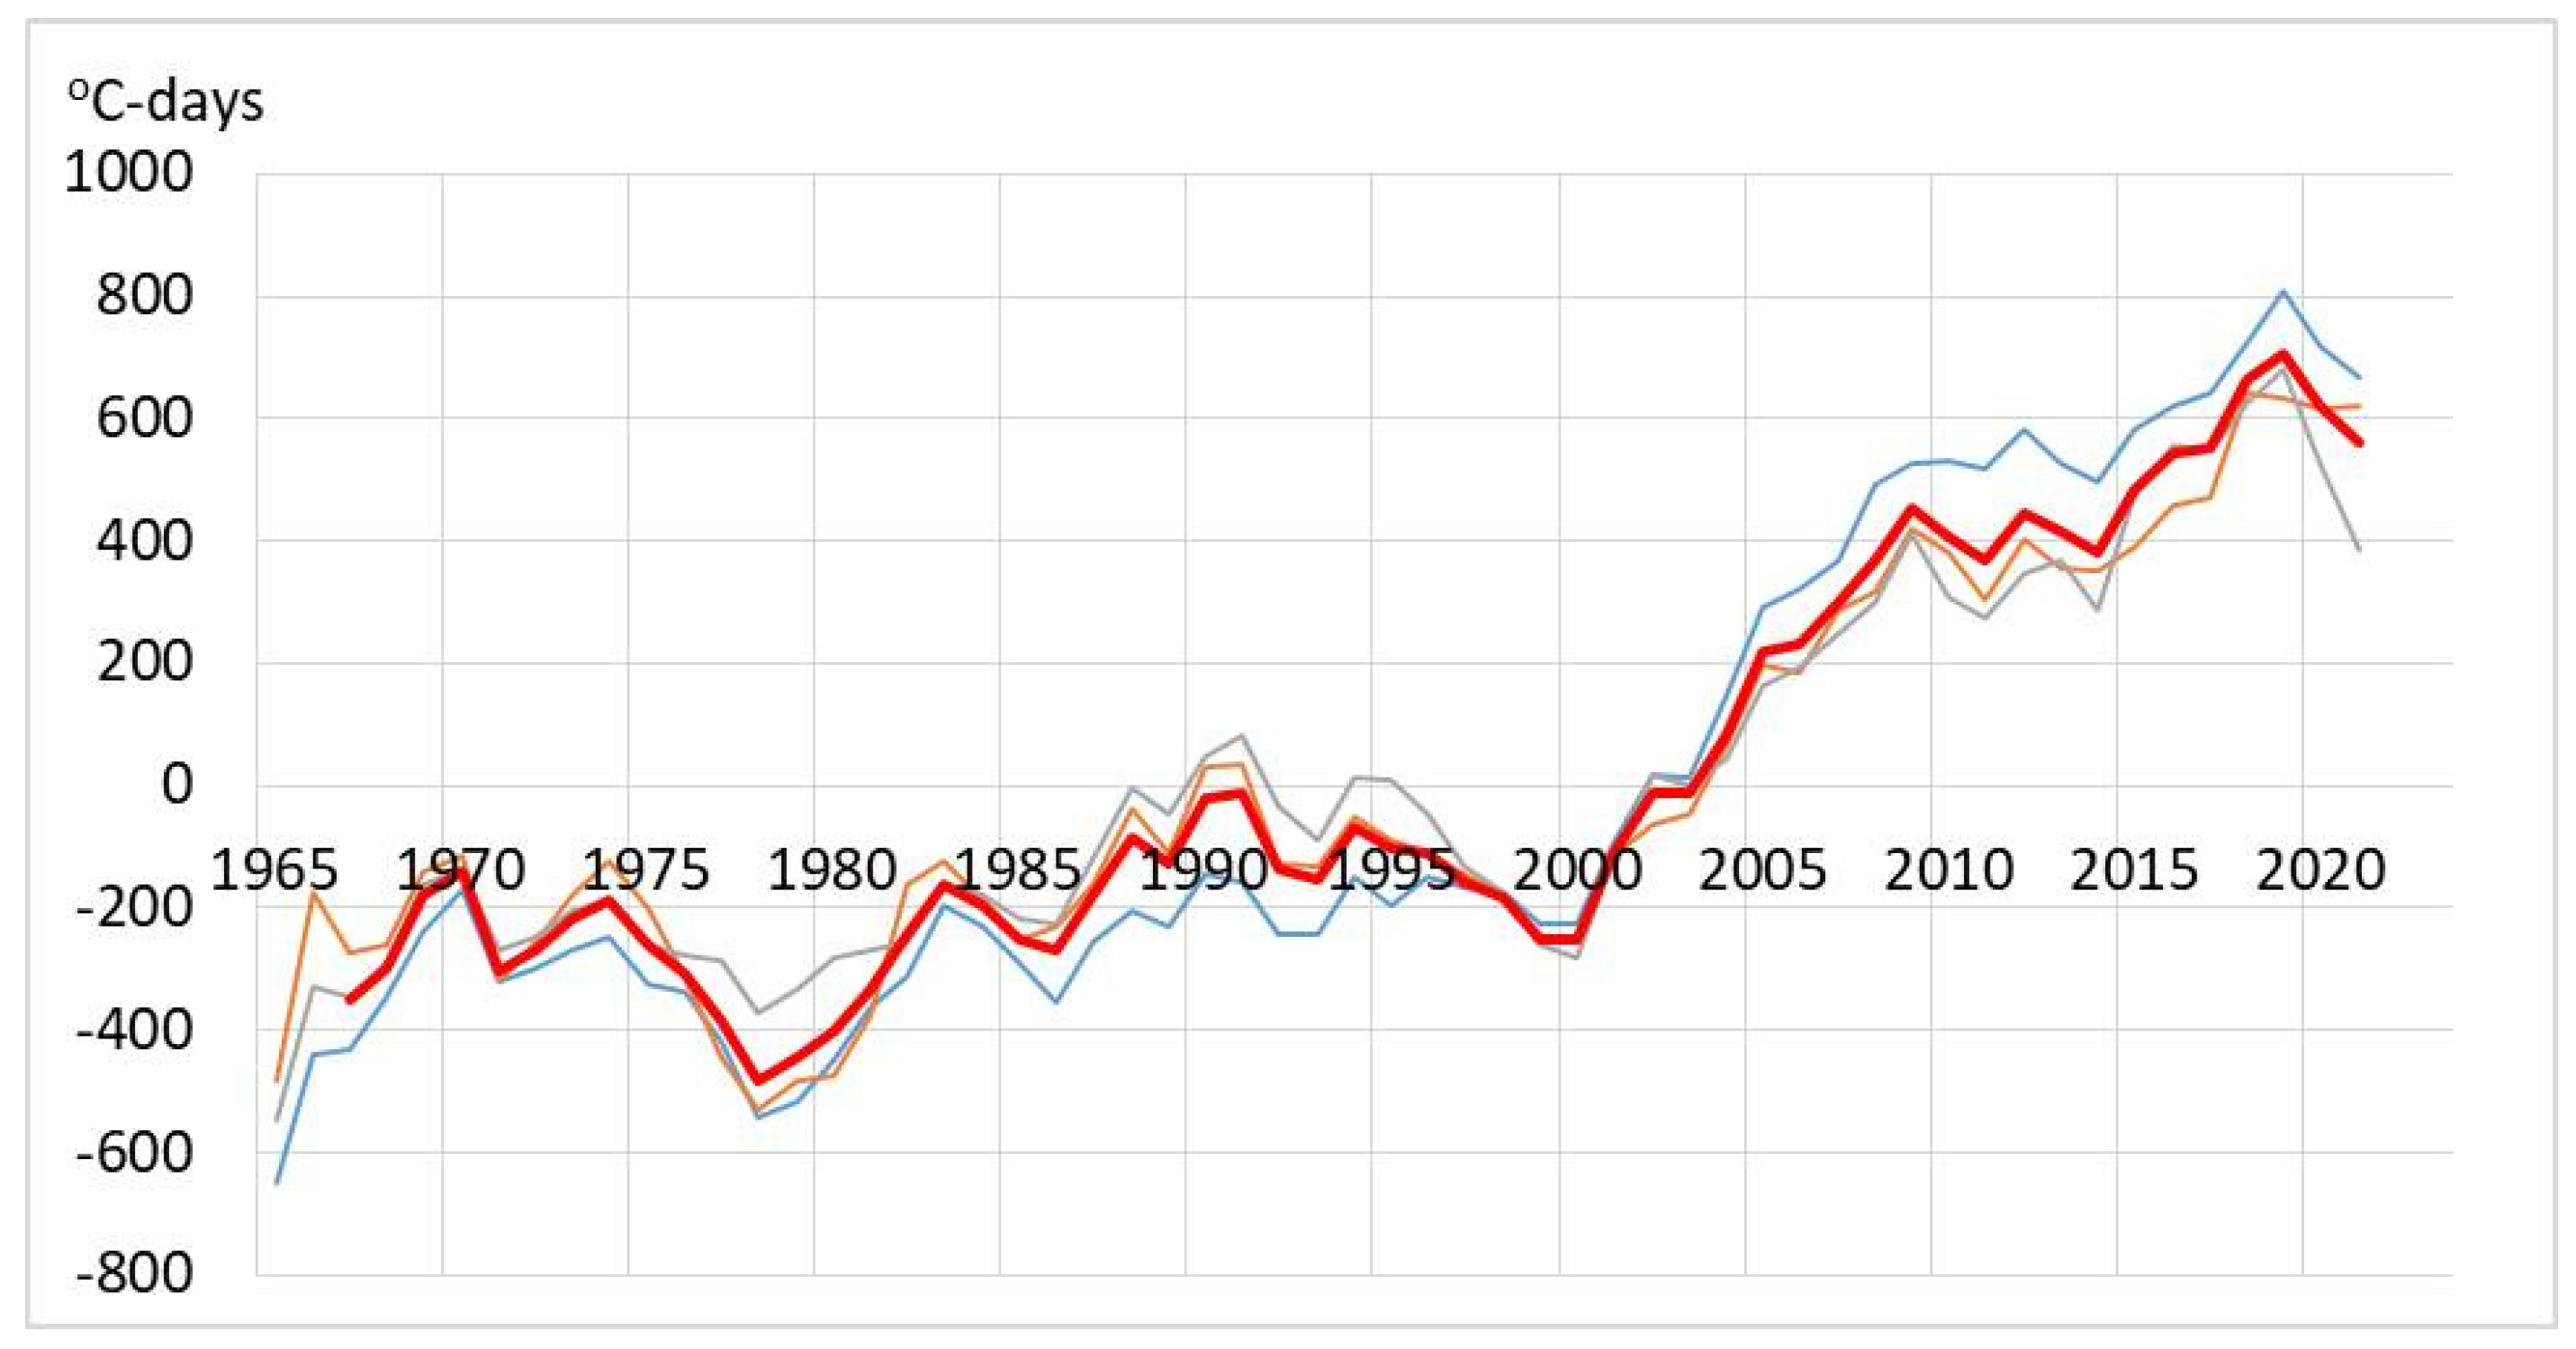
The trends in the freezing index variability by years and periods in the three Arctic regions are relatively uniform, but there are some differences (Figure 7). In 1965–1988, the most severe winter conditions were typical for the New Siberian Islands, which, in 2005–2023, experienced the highest rates of winter warming.
Weather stations in the Arctic zone of Yakutia, the New Siberian Islands, and the Anabar–Lena region have numerous gaps in precipitation measurements. As examples for these two regions, data from the Kotelny Island and Saskylakh weather stations, which have continuous data since 1966, were used. The Tiksi weather station data were excluded from the Anabar–Olenek region due to the lack of significant correlation coefficients with the Saskylakh weather station data. The data in the Yana–Kolyma region exhibit significant correlation coefficients (0.30 to 0.52 at p ˂ 0.05) with n = 47, except for one insignificant correlation coefficient between the Yubileinaya and Chokurdakh weather stations. The data from the Tiksi meteorological station show a correlation coefficient with the data from all three weather stations in the Yana–Kolyma tundra, ranging from 0.45 to 0.50.
Table 5 shows that the annual precipitation in the tundra zone of the Sakha Republic (Yakutia) ranged from 150.1 mm (Ambarchik) to 214.7 mm (Tiksi) between 1966 and 2023. The Anabar–Lena region (Saskylakh) and the New Siberian Islands (Kotelny Island) are characterized by alternating wet and dry periods with a small amplitude of annual precipitation. The Lena–Anabar region experiences significant alternation with amplitudes averaging up to 100 mm in both positive and negative precipitation phases. The Yano-Kolyma region has experienced a notable decrease in precipitation; the mean variation between 2003–2023 and 1966–1989 was roughly 40 mm. The variability in annual precipitation patterns helps us confirm the division of Yakutia’s tundra zone into distinct regions.

3.2. Climate Variability in the Subarctic Region of Yakutia over the Past 50–60 Years

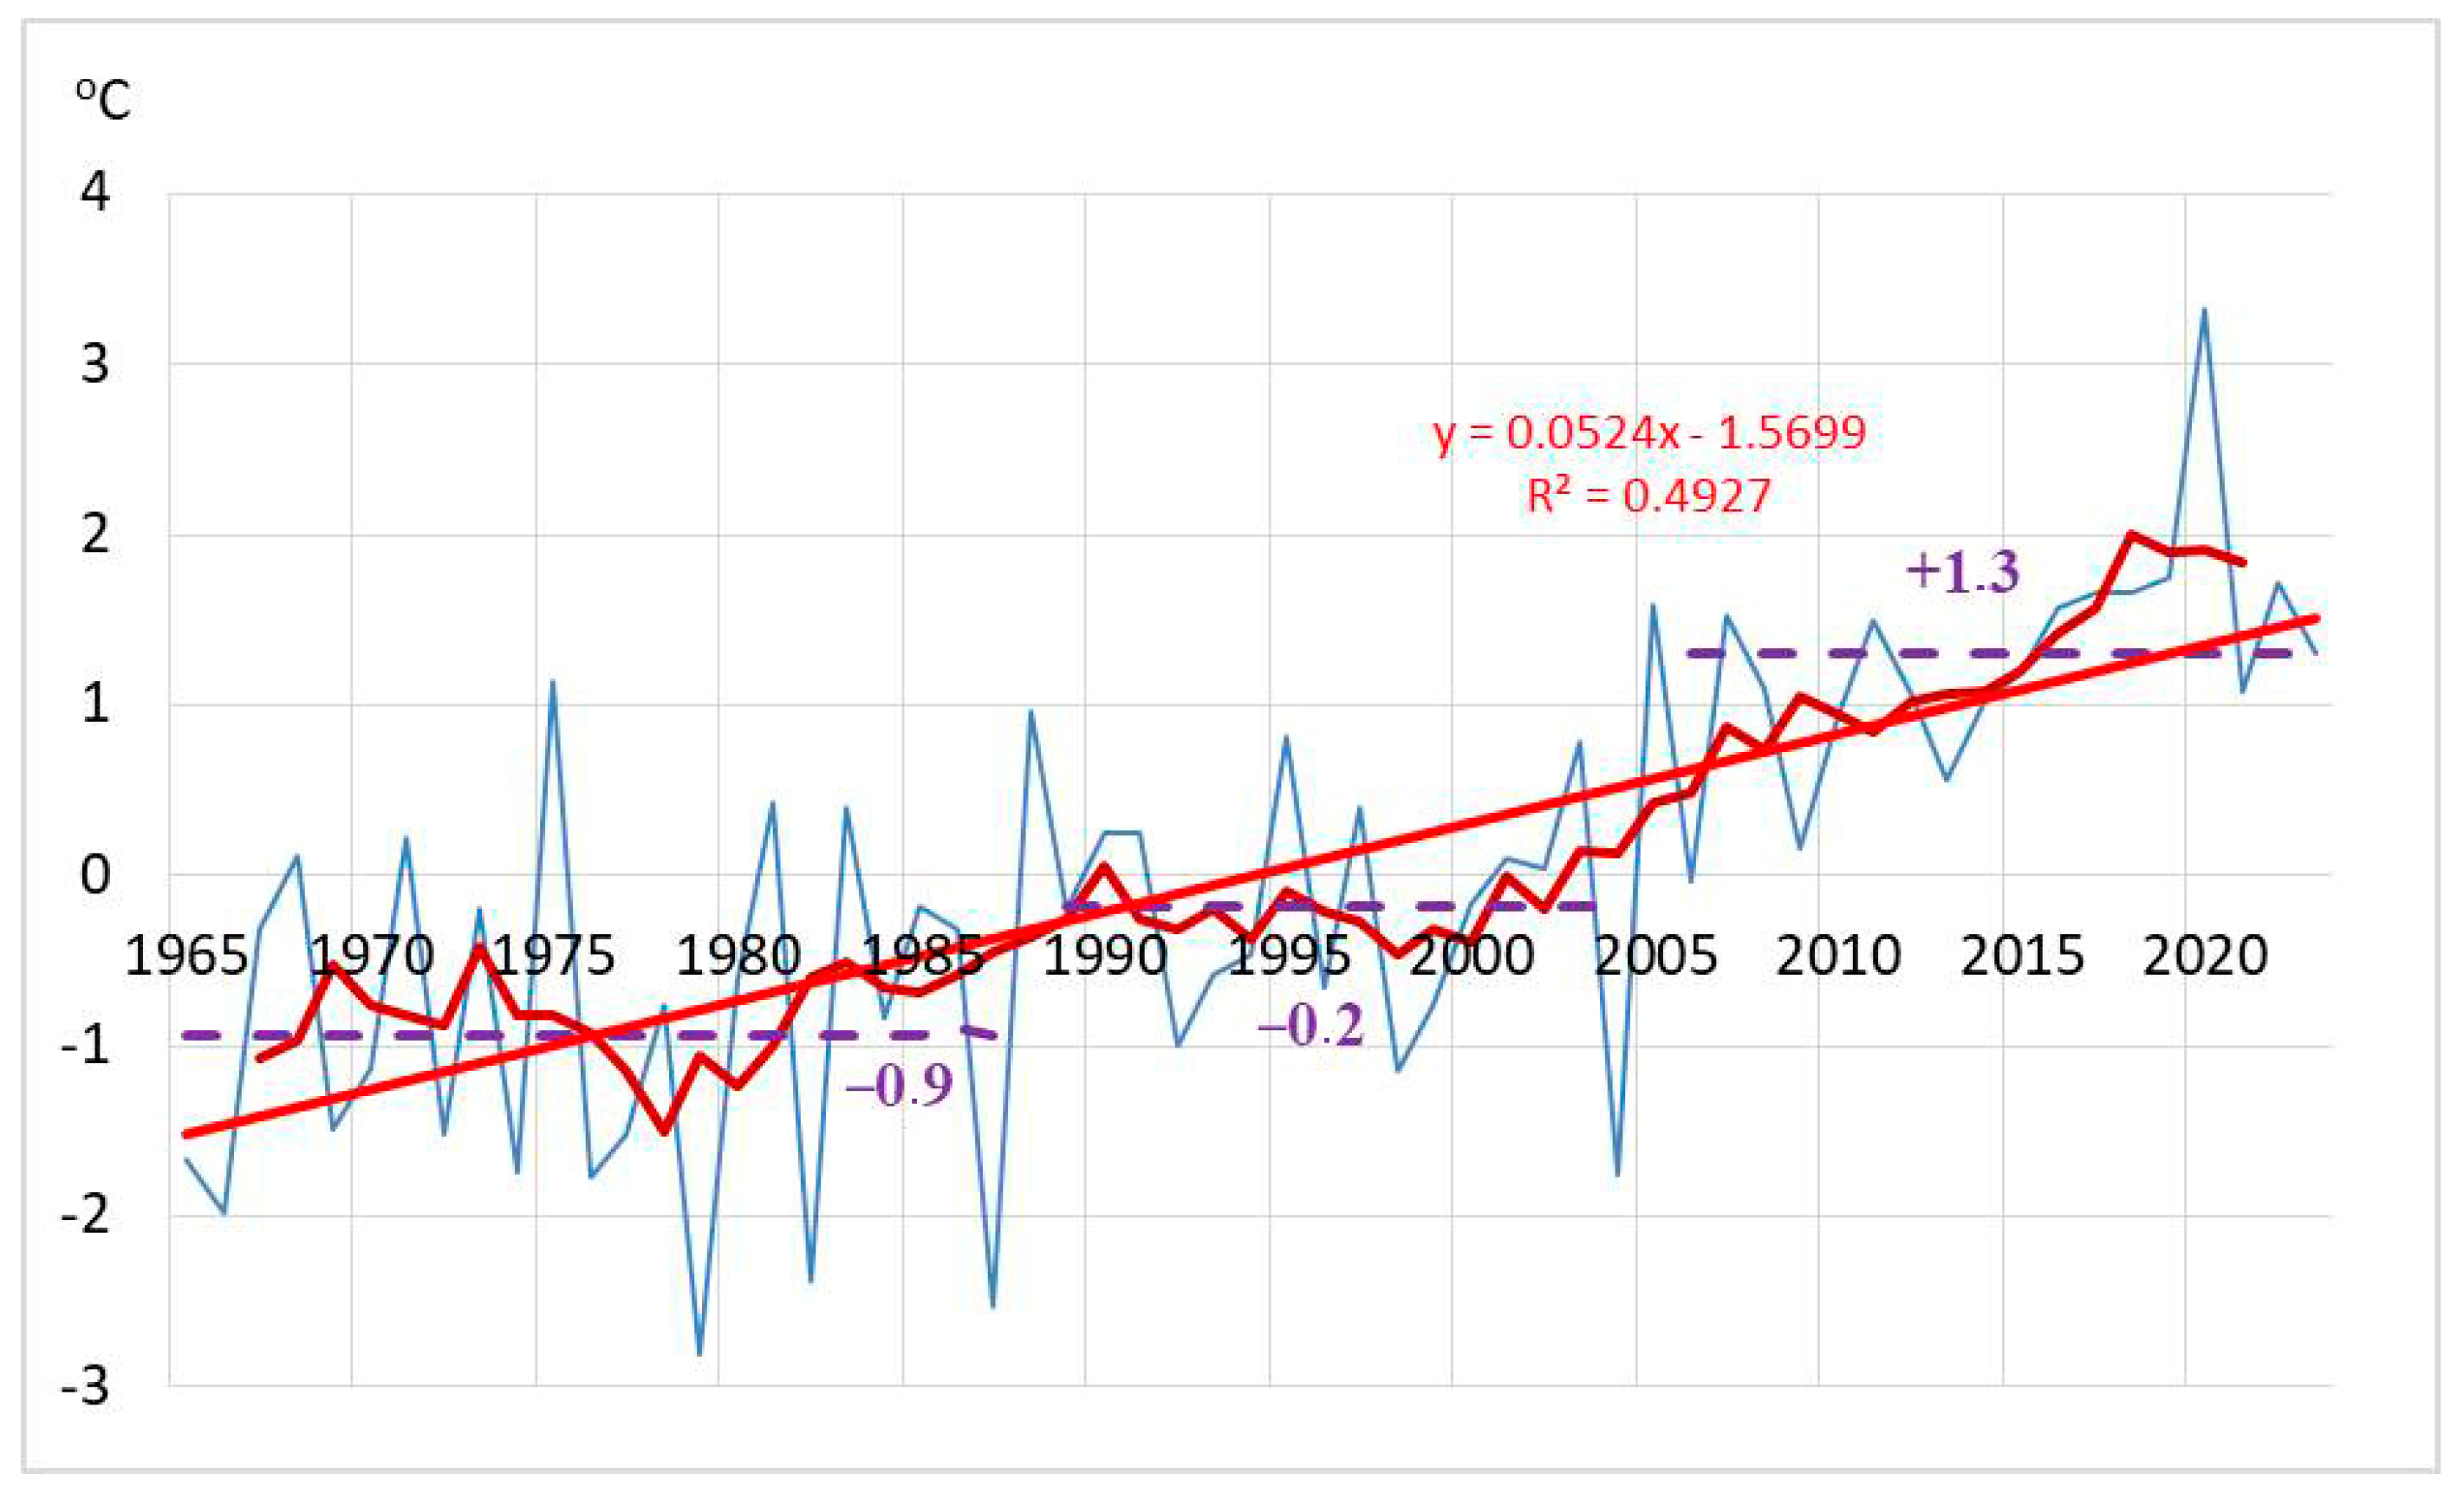
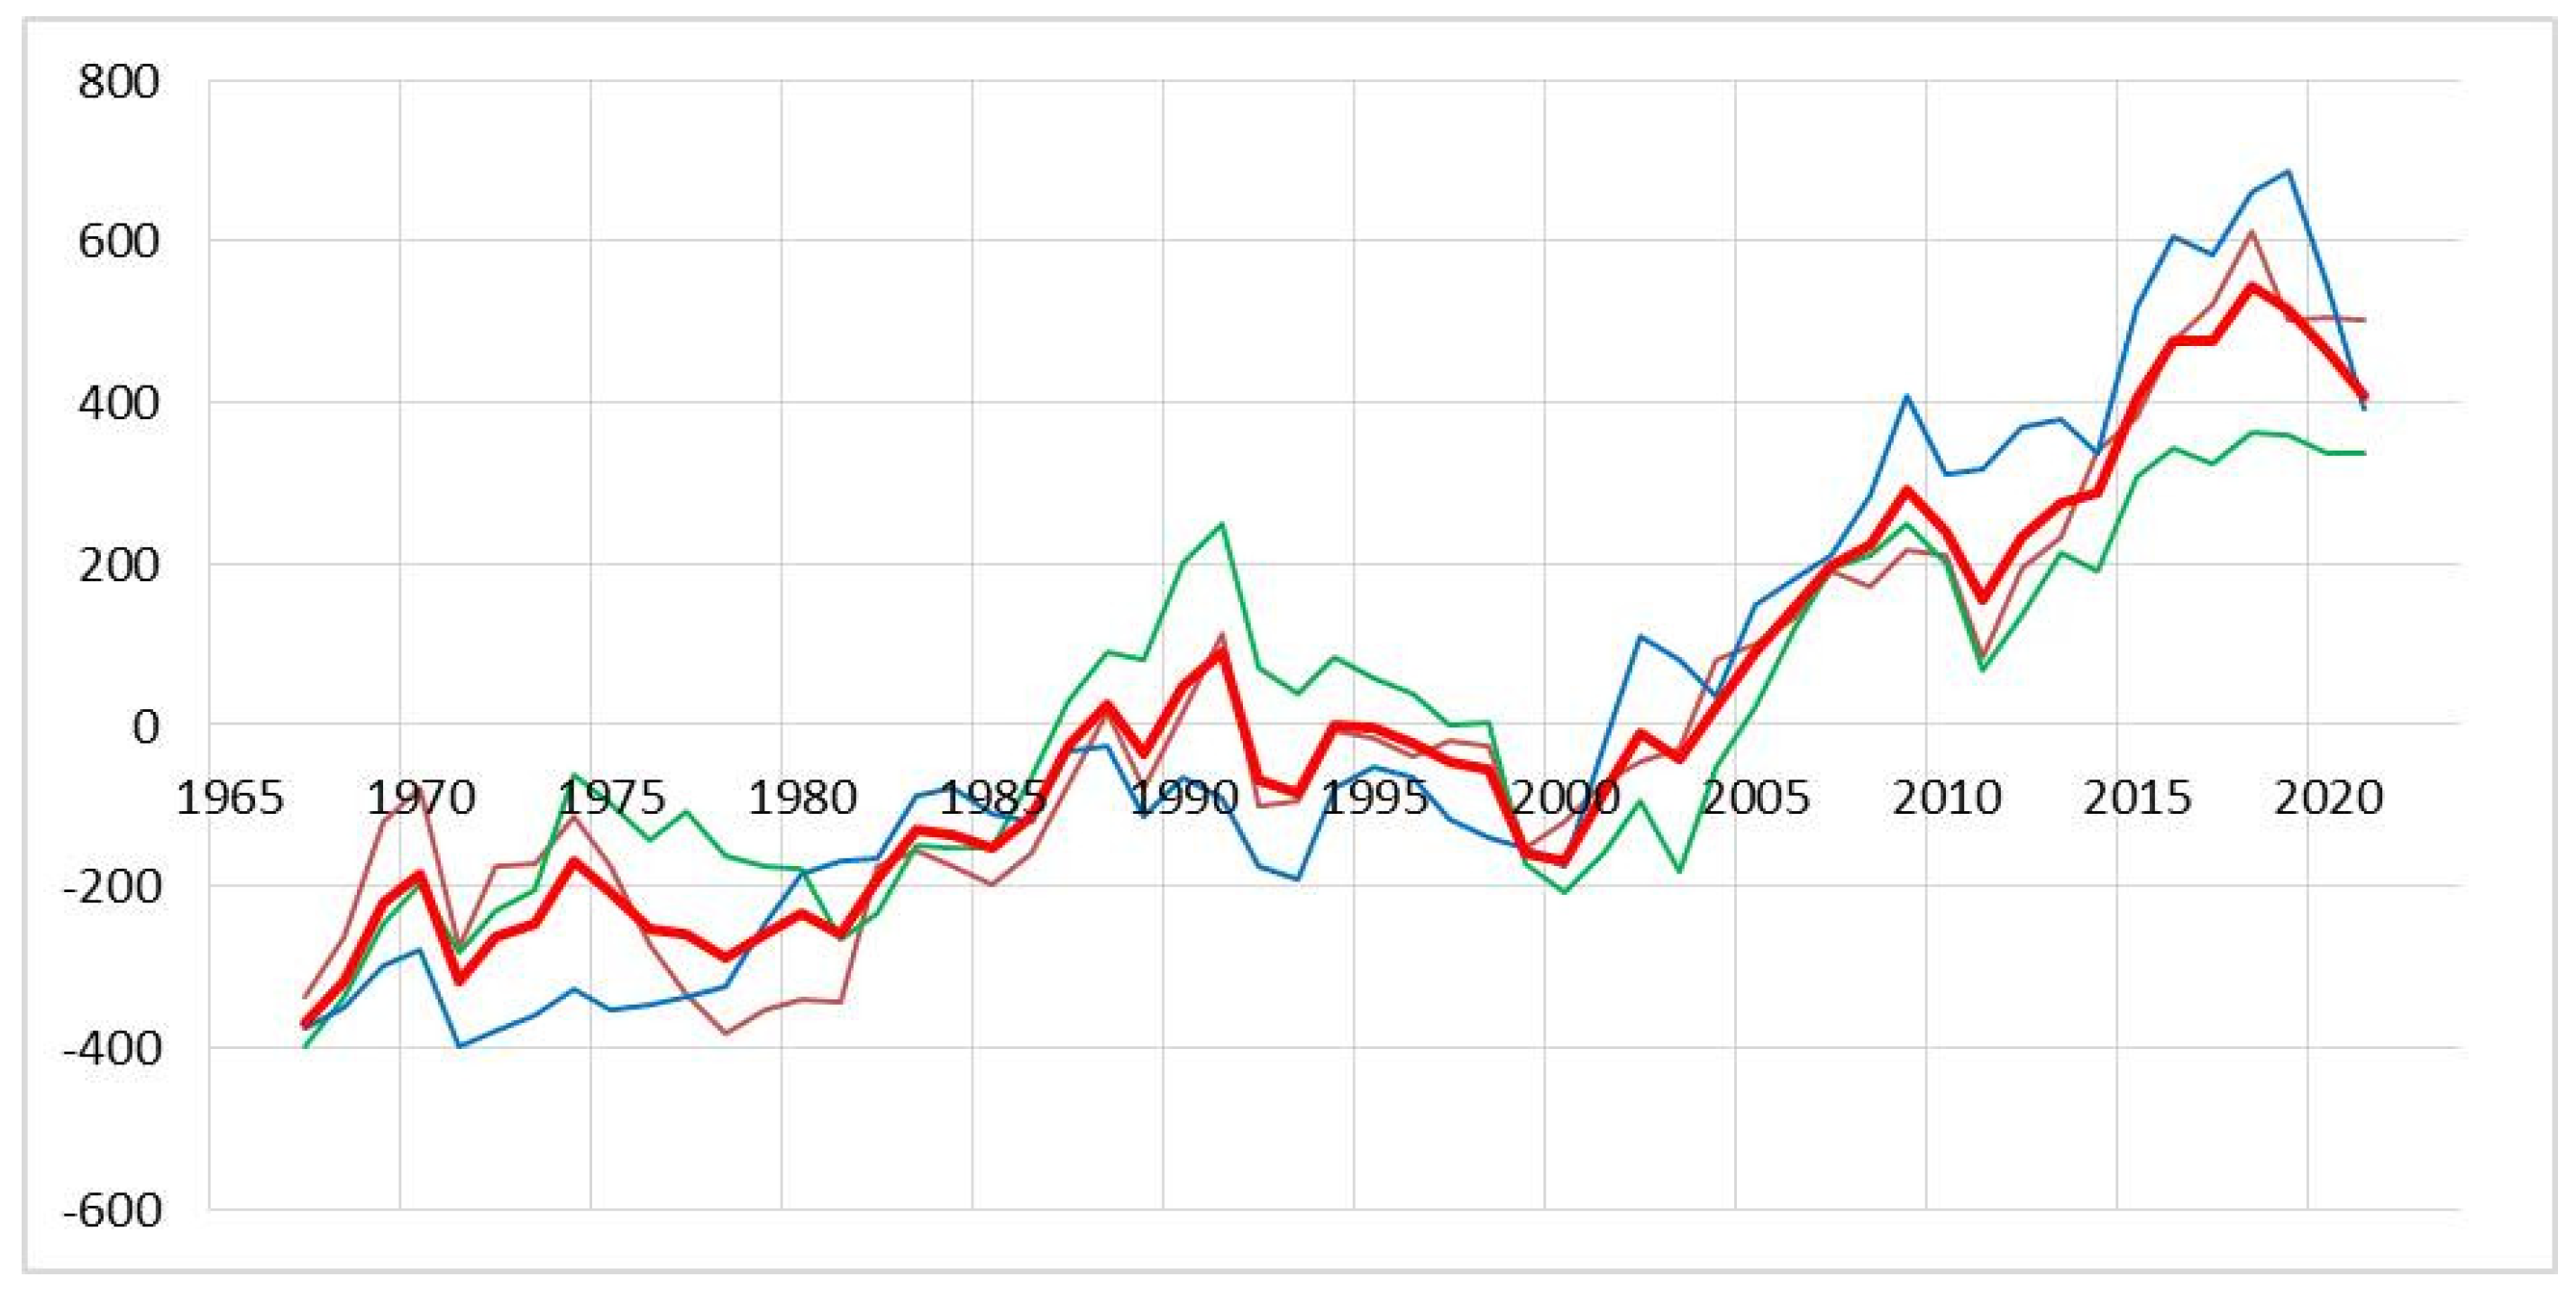
Between 1965 and 2023, the Subarctic zone of the Republic of Sakha (Yakutia) experienced mean annual air temperatures ranging from −10.5 (Zyryanka) to −15.3 °C (Iema) (Table 6). The climatic boundaries observed in the Arctic regions are also present in this area (Figure 8). In the Subarctic of Yakutia, the mean annual air temperature increased at a rate of 0.05 °C/year from 1965 to 2023.
The correlation coefficient of mean annual air temperatures in the Lena–Olenek region is 0.83–0.97; in the Yana region, it is 0.88–0.95, and in the Kolyma–Indigirka region, it is 0.90–0.97 at p ˂ 0.05 and n = 55. Between 1965 and 1987, the mean annual temperature at all weather stations deviated from the normal by an average of −0.9 °C. In the period of 1988–2004, it was −0.2 °C, and from 2005 to 2023, it was +1.3 °C (see Figure 8).
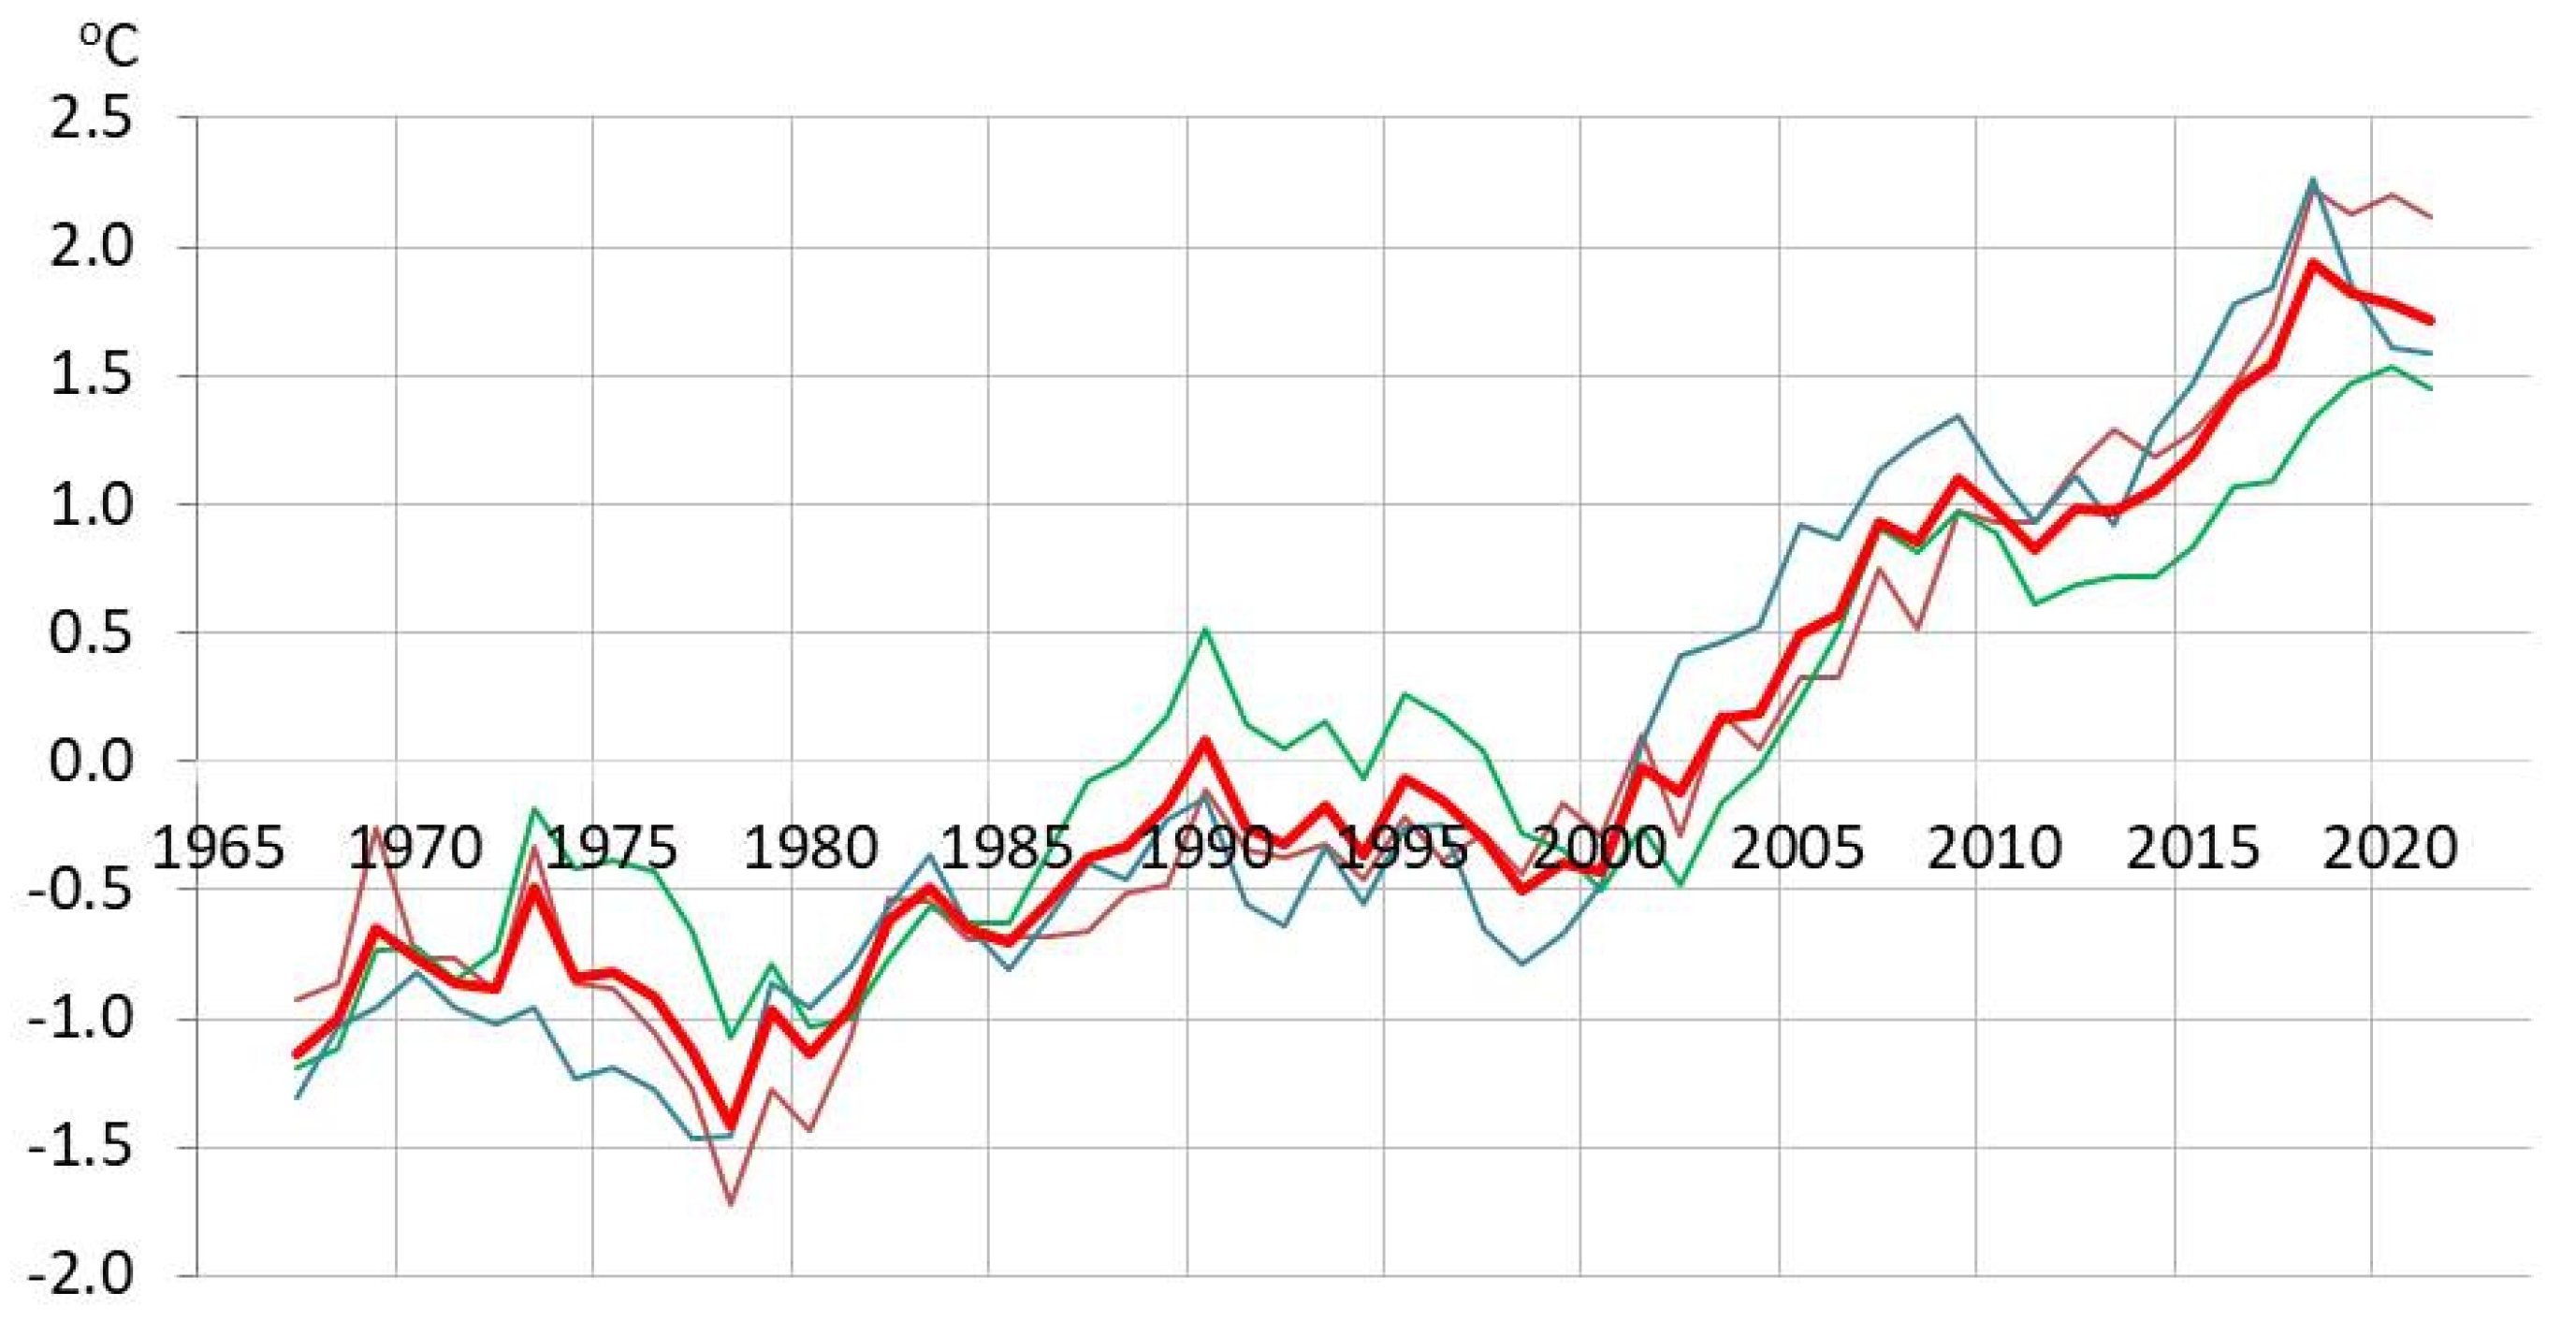
The interannual variability of mean annual air temperature differs among the three regions (Figure 9). The Kolyma–Indigirka and Lena–Olenek regions experienced harsher conditions from 1965 to 1987. The Yana region experienced a more significant increase in air temperature during the pre-warming period (1988–2004). The air temperature showed a stronger increase in the Kolyma–Indigirka and Lena–Olenek regions during the warming period (2005–2023).
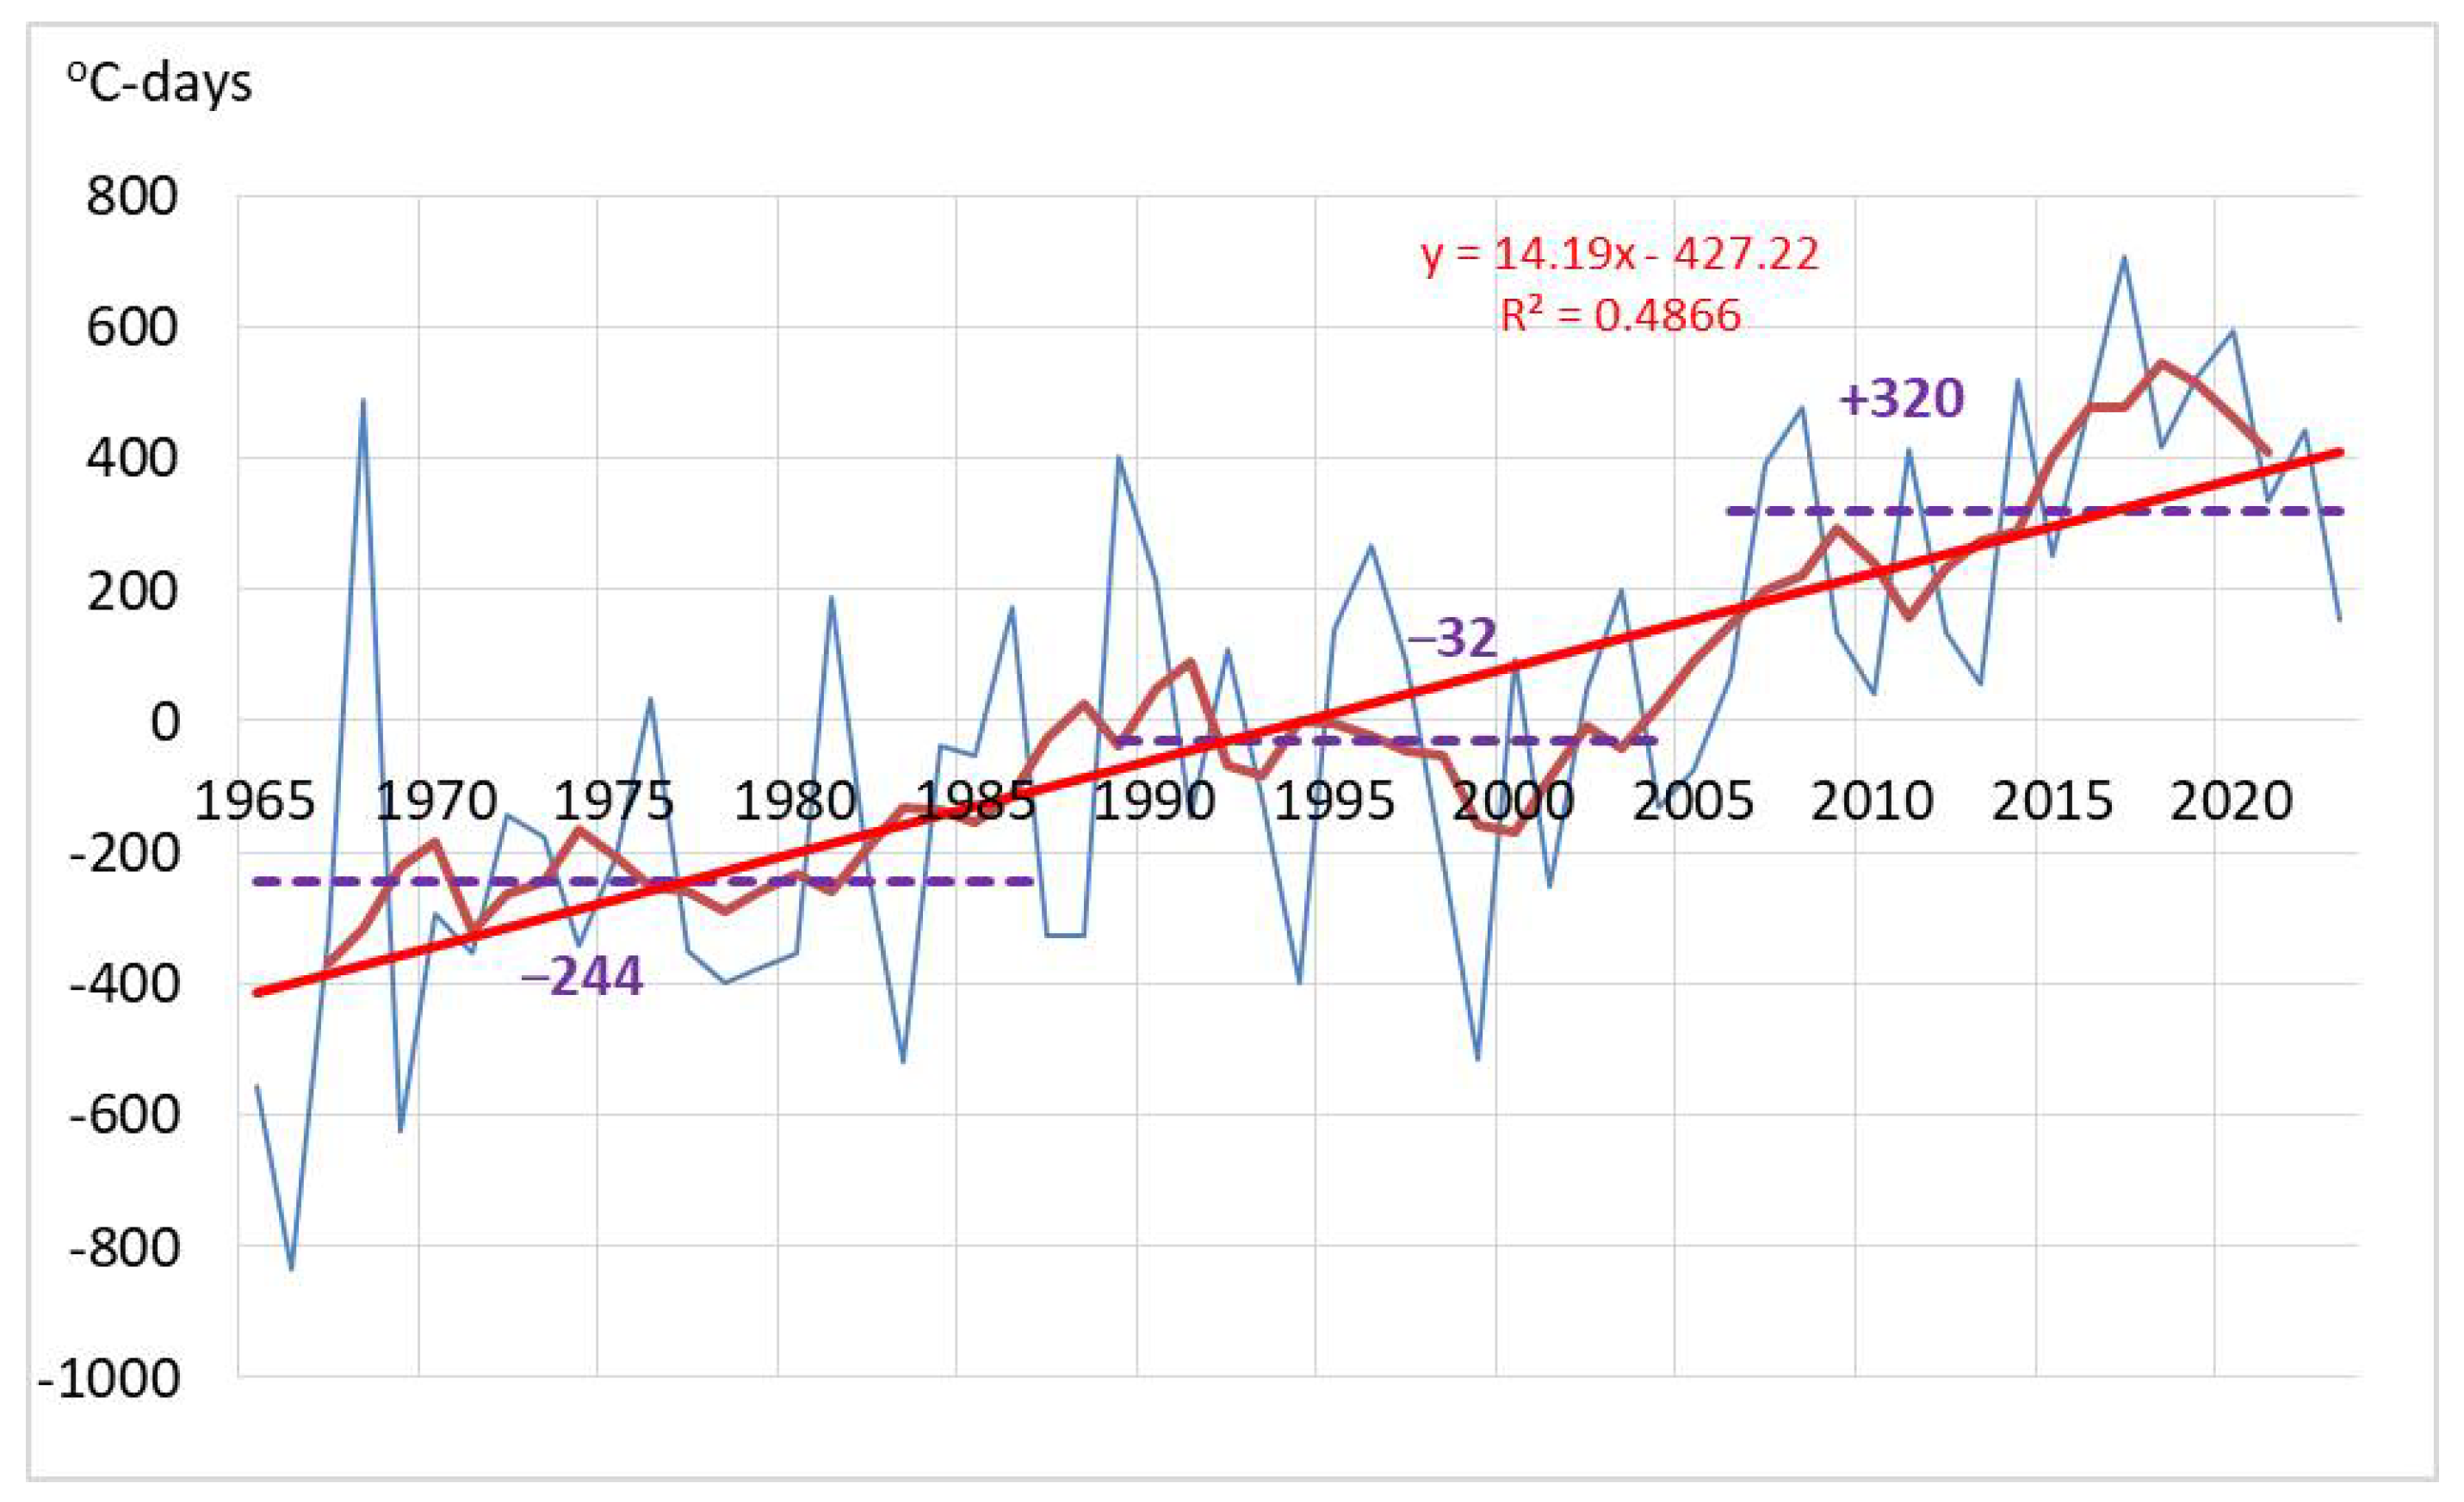
In the Subarctic zone of Yakutia, the thawing index ranged from 940 (Kolymskaya) to 1530 °C days (Zyryanka) between 1965 and 2023 (Table 7). Here, we can observe three distinct time periods—1965–1987, 1988–2004, and 2005–2023 (Figure 10). The mean thawing index in the warmest period of 2005–2023 was 18% higher in the Subarctic zone compared to the colder period of 1965–1987.
The correlation coefficient of the thawing index at meteorological stations in the Lena–Olenek region ranges from 0.72 to 0.98; in the Yana region, this range is 0.86–0.94, and in the Kolyma–Indigirka region, it is 0.81–0.97 at p ˂ 0.05 and n = 57.
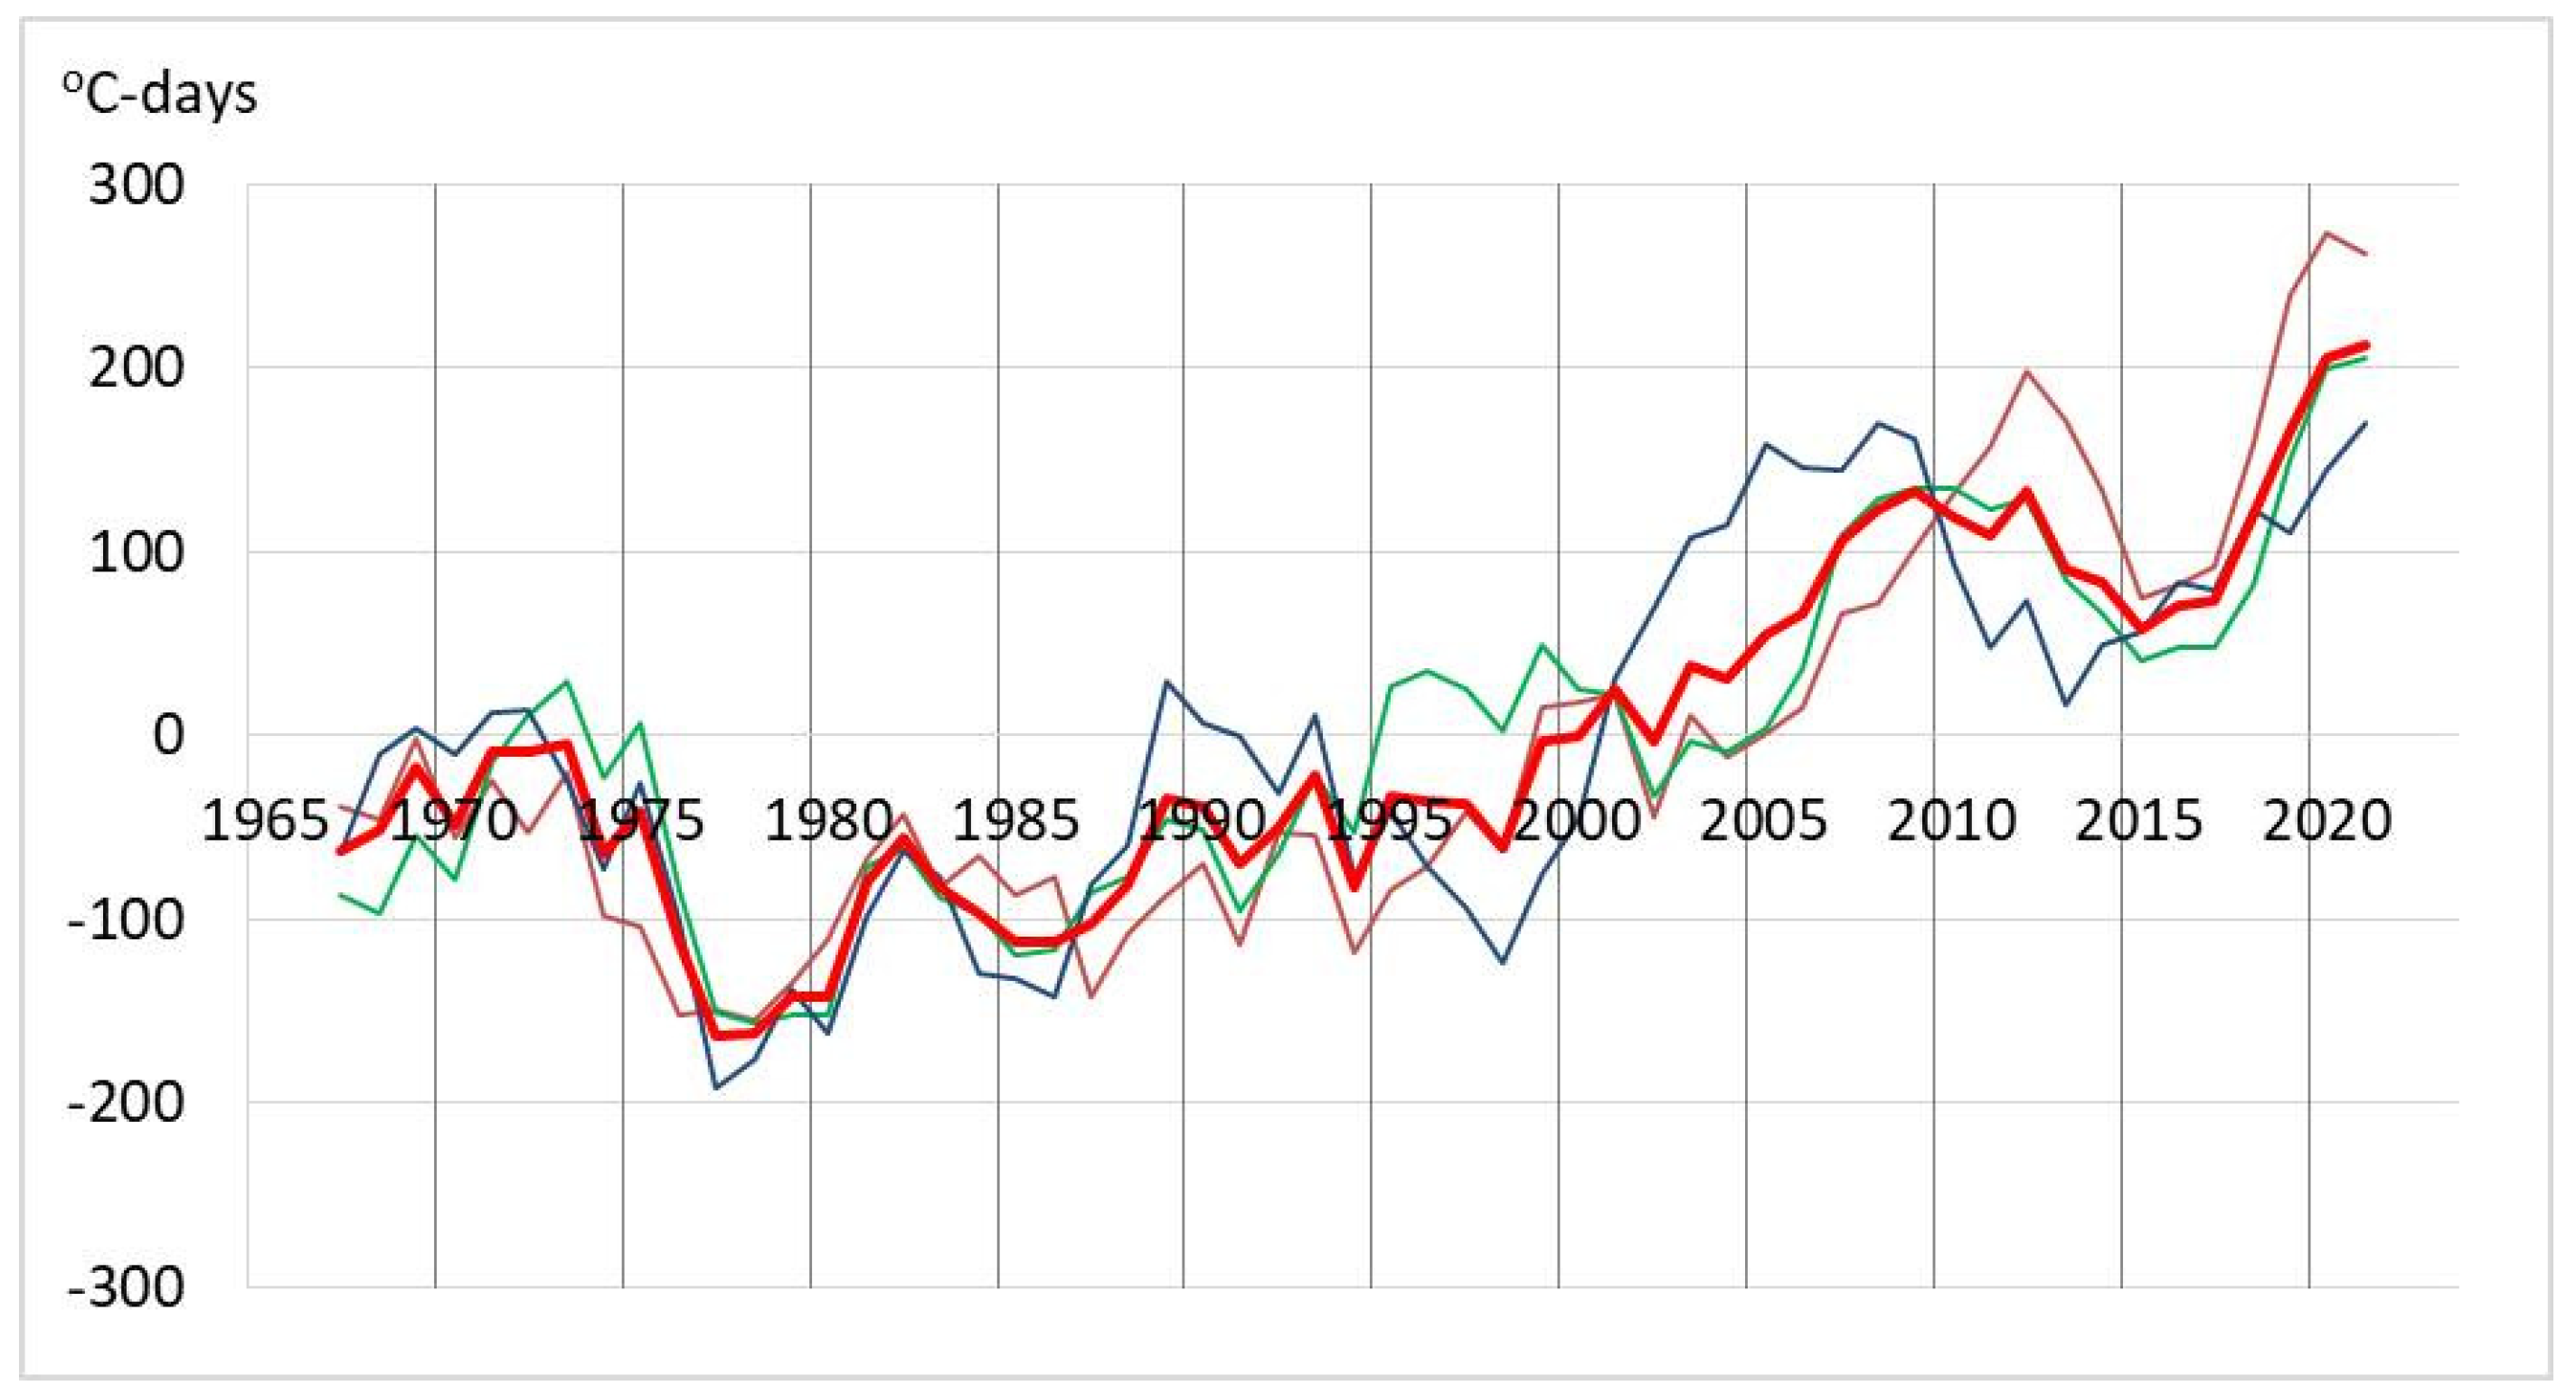
In 1965–1987, the mean deviation of the thawing index was −85 °C days from the norm for the entire period of 1965–2023, −28 °C days in 1988–2004, and +129 °C days in 2005–2023 (see Figure 10). The development of thawing index variability is consistent across the three regions, but there are slight differences (Figure 11). If there was a consistent change in 1965–1987, then there was a pattern of alternating values in 1988–2004. The Kolyma–Indigirka region had warmer weather initially and toward the end, with the Yana region experiencing higher temperatures in between. From 2005 to 2023, summer temperatures showed a stronger rise in the Lena–Olenek region.
In Yakutia’s Subarctic zone, the freezing index ranged from −5347 °C (Eyik) to −6786 °C (Iema) for 1965–2023 (Table 8). Three distinct periods can be identified: 1965–1988, 1989–2004, and 2005–2023 (Figure 12). The freezing index was, on average, 10% lower in the warmest period of 2005–2023 compared to the colder period of 1965–1987.
The correlation coefficient of the freezing index at the weather stations of the Lena–Olenek region is in the range of 0.77 to 0.98; in the Yana region, it is 0.83–0.95; and in the Kolyma–Indigirka region, it is 0.87–0.96 at p ˂ 0.05 and n = 56. The correlation coefficient of the freezing index at the weather stations of the Lena–Olenek region ranges from 0.77 to 0.98; in the Yana region, it is 0.83–0.95; and in the Kolyma–Indigirka region, it is 0.87–0.96 at p ˂ 0.05 and n = 56.
The freezing index variability in the three tundra regions shows uniform trends across years and periods, with slight differences (Figure 13). The Yana region experienced milder winter temperatures during 1965–1987 and 1988–2004, whereas the Kolyma–Indigirka and Lena–Olenek regions had harsher conditions. During 2005–2023, the Kolyma–Indigirka region experienced the highest rates of winter warming among the three regions, whereas the Yana region had the lowest rates.
In terms of precipitation, we collected data from nine meteorological stations in three regions of Yakutia’s Subarctic zone with the longest observations and notable correlations (Table 8). The selected weather stations have maintained continuous data since 1966. Significant correlations between 0.32 and 0.67 exist in the data from the Lena–Anabar region. The correlation coefficient between Verkhoyansk and Ust-Charky in the Yana region is 0.38, while in the Kolyma–Indigirka region, it is 0.78 for Srednekolymsk and Zyryanka, with a significance level of p < 0.05 and a sample size of n = 58. The precipitation data for the Yana–Indigirka and Kolyma–Indigirka regions show a strong correlation of 0.36–0.49.
Annual precipitation in the Subarctic zone from 1966 to 2023 ranged from 193.5 mm (Verkhoyansk) to 328.5 mm (Zhigansk) (Table 9). The Yana region has seen minimal shifts in annual precipitation levels over time. Precipitation in the Kolyma–Indigirka region significantly increased from the late 1990s to 2020. The Srednekolymsk and Zyryanka meteorological stations recorded an average increase of 50–70 mm in precipitation during the warming period of 2005–2023. In the 2020s, there was a significant decrease in precipitation. The Lena–Olenek region, in its western part, maintains an even distribution of precipitation during climatic periods (Dzhalinda, Olenek). The warming from 2005 to 2023 in Sukhana and Dzhardzhan resulted in a 20 mm increase in precipitation from the norm of 1965–2023. Zhigansk was the sole location experiencing a significant 50 mm rise in precipitation from 2005 to 2023.

3.3. The Impact of Global Warming on the State of Permafrost

The warming of Arctic landscapes between 2005 and 2023 greatly exceeded Arctic warming in the 1930–1940s in all aspects. The mean annual air temperature at that time was 1.4 °C higher than the mean during 1965–2023, while in 1930–1940, it was only 0.5–1 °C higher than in 1930–2009 [30]. Permafrost warming has been observed in the Russian Arctic, including Yakutia, since the early 2000s, leading to changes in permafrost conditions. Many studies [5,31,32,33,34,35] have documented their transition toward warming.
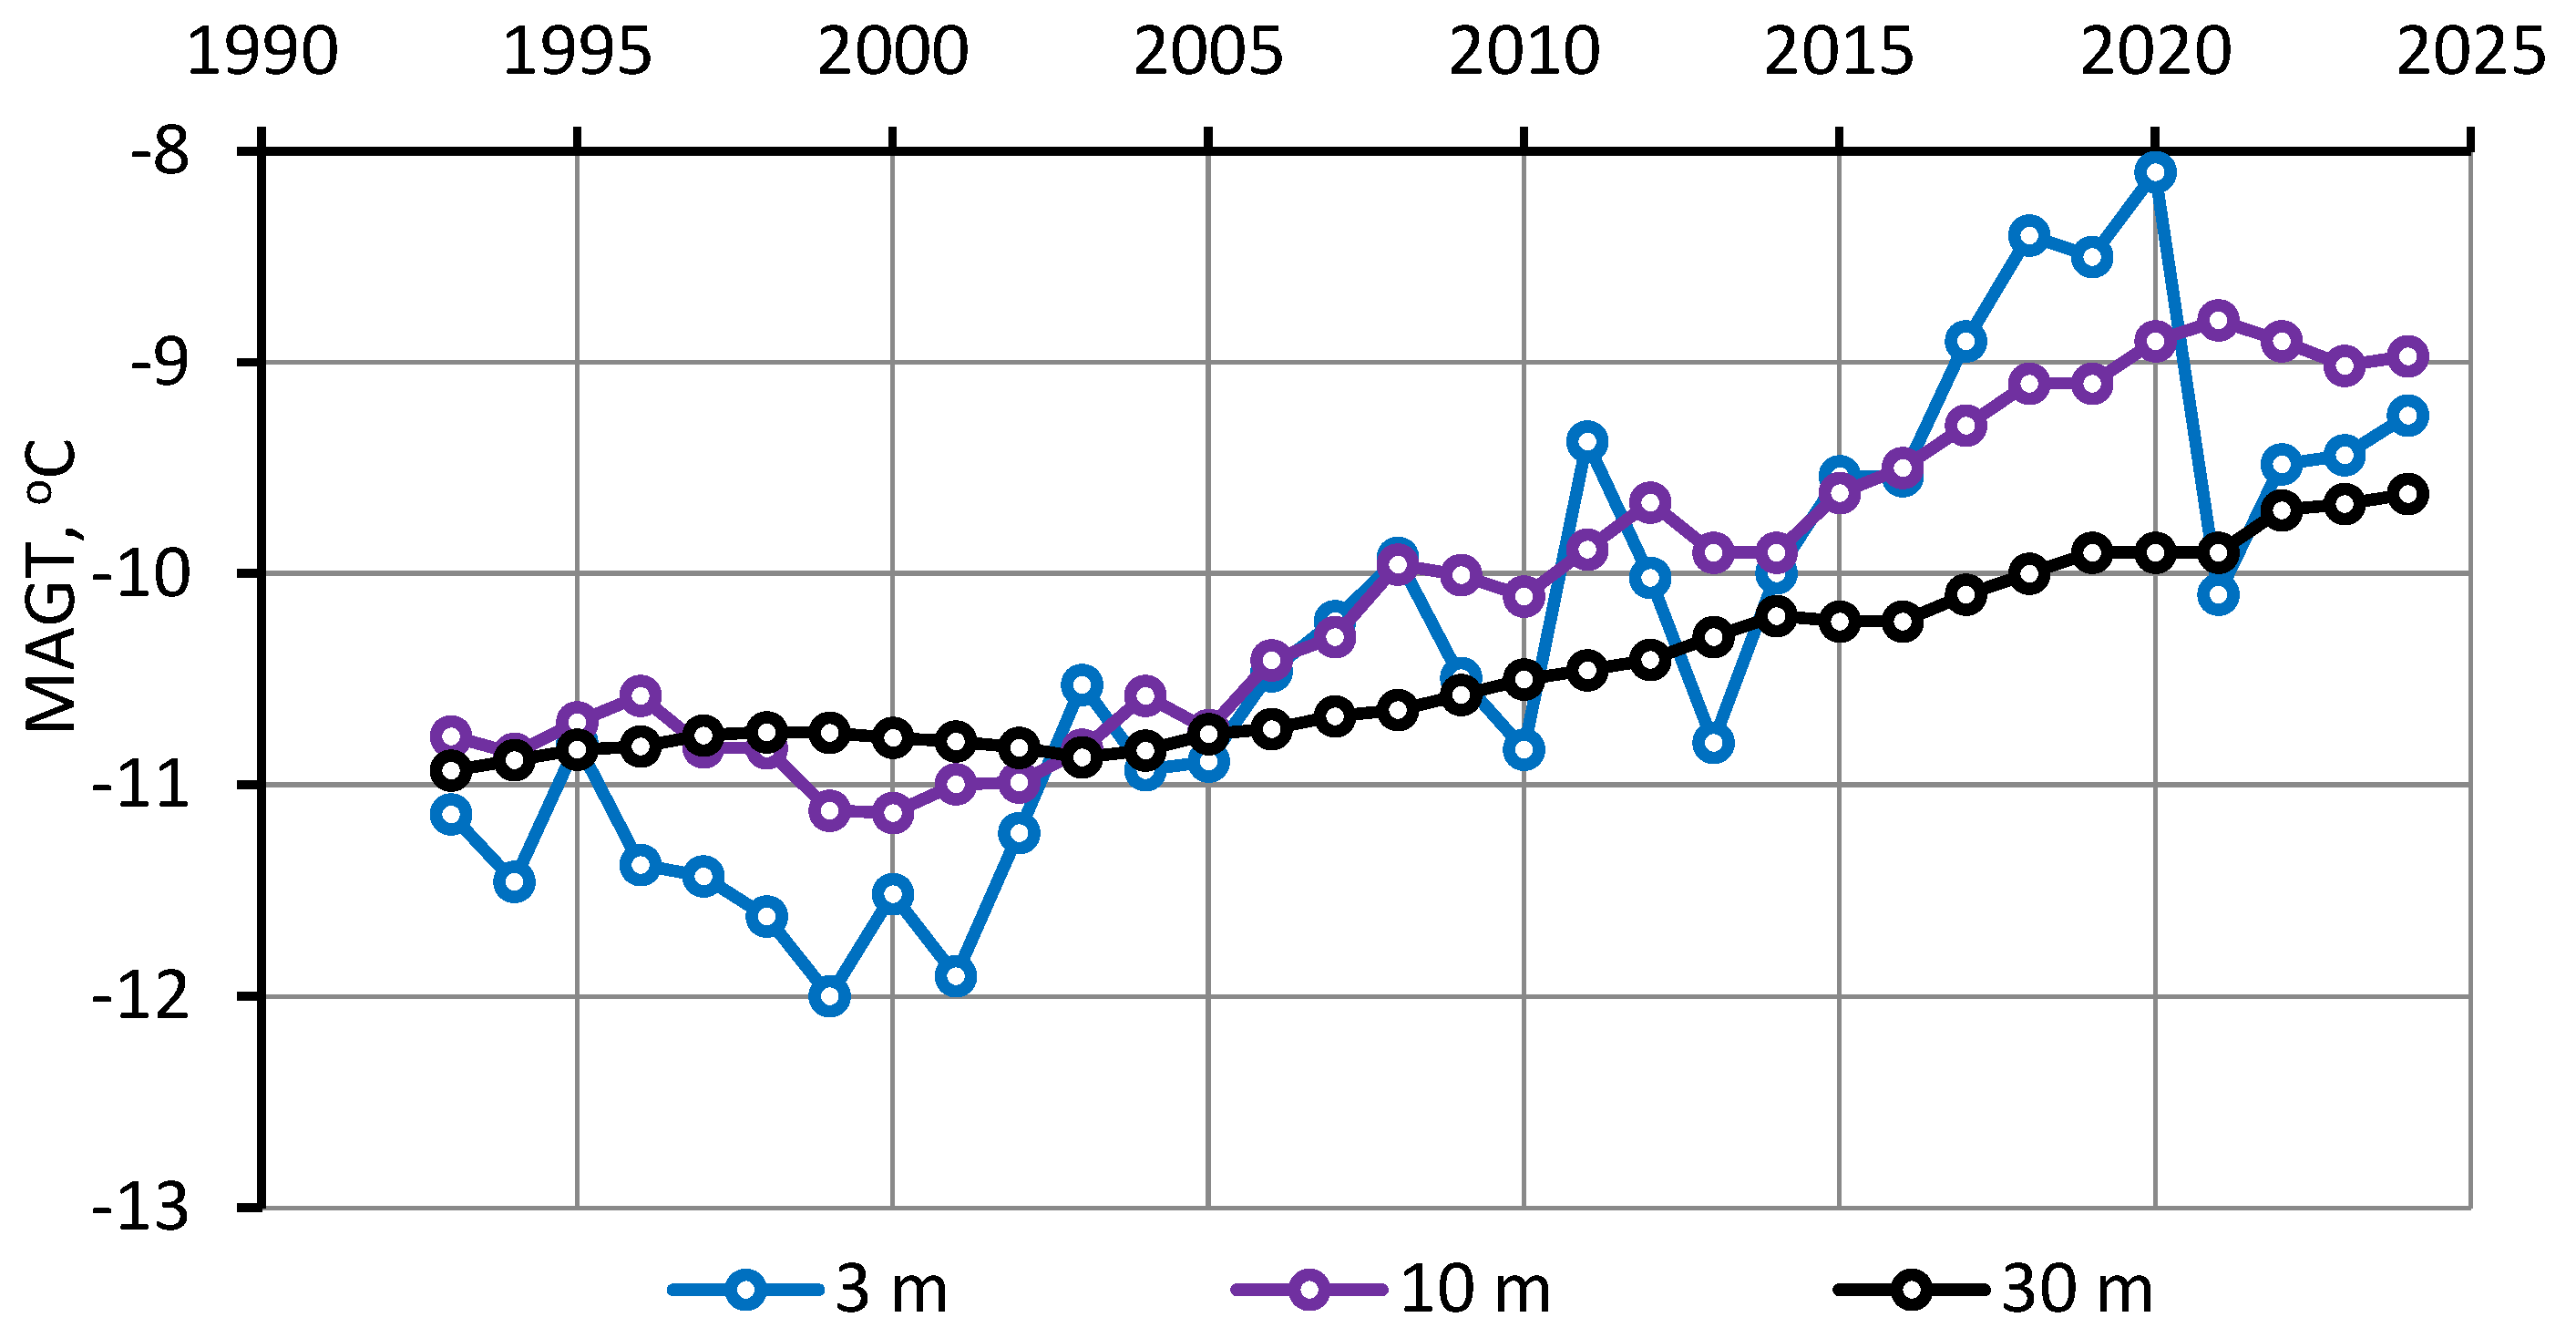
The monitoring site of the Melnikov Permafrost Institute in the Lena–Anabar Arctic region of Yakutia offers the longest series of continuous experimental observations of permafrost temperature. The study area is located in the foothills of the eastern slope of the Primorsky Ridge near Tiksi town. The temperature borehole with a depth of 30 m is situated on a low stone ridge, a.s.l. of 49 m. The permafrost temperature showed a long-term increase from 1993 to 2023 (Figure 14). Moreover, the depth of its change was uneven over time, as shown in Table 10. Around the mid-2000s, there was a faster increase in permafrost temperature [36].
Starting in 2006, the Russian–German Arctic expedition has been monitoring permafrost temperature on Samoylovsky Island in the Lena River Delta. According to Boike et al. [20], the mean annual permafrost temperature increased by 0.9 °C from 2008 to 2016 at a depth of 20 m in a borehole on Samoylovsky Island. Meanwhile, in a borehole near Tiksi town, the temperature rose by a modest 0.6 °C at a depth of 20 m. A global analysis of permafrost’s thermal state post-International Polar Year (2007–2009) revealed the mean temperature increase at zero annual amplitude depth for all Arctic regions in the Northern Hemisphere. According to Biskaborn et al. [5], the temperature change from 2007 to 2016 was 0.39 ± 0.15 °C. In the reviewed period, the Tiksi and Lena River delta experienced a higher permafrost temperature increase compared to the Arctic zone in total.
The Institute of Physicochemical and Biological Problems of Soil Science RAS monitors permafrost temperatures in the Yana–Kolyma Arctic region near the lower Kolyma River [18,37,38]. According to these studies, the region’s permafrost temperatures remained stable until the early 2000s. The permafrost temperature started increasing in the late 1990s due to global warming. Meanwhile, permafrost temperatures in the Kolyma Lowland have increased by 1.5–2 °C since 1980, showing the most significant changes.
Since 2007, permafrost temperatures in the lower part of the seasonal temperature fluctuation layer have generally shown a stable positive trend, according to most monitoring points. The most significant changes occur in the tundra landscapes near the Arctic Ocean. According to Kholodov et al. [18] (2012), the mean annual permafrost temperature at depths of 15 and 25 m is increasing by up to 0.2 °C per year. According to Andreeva et al. [39], the most significant rise in permafrost temperature was observed in fire-affected woodland landscapes in the lower Kolyma River region.
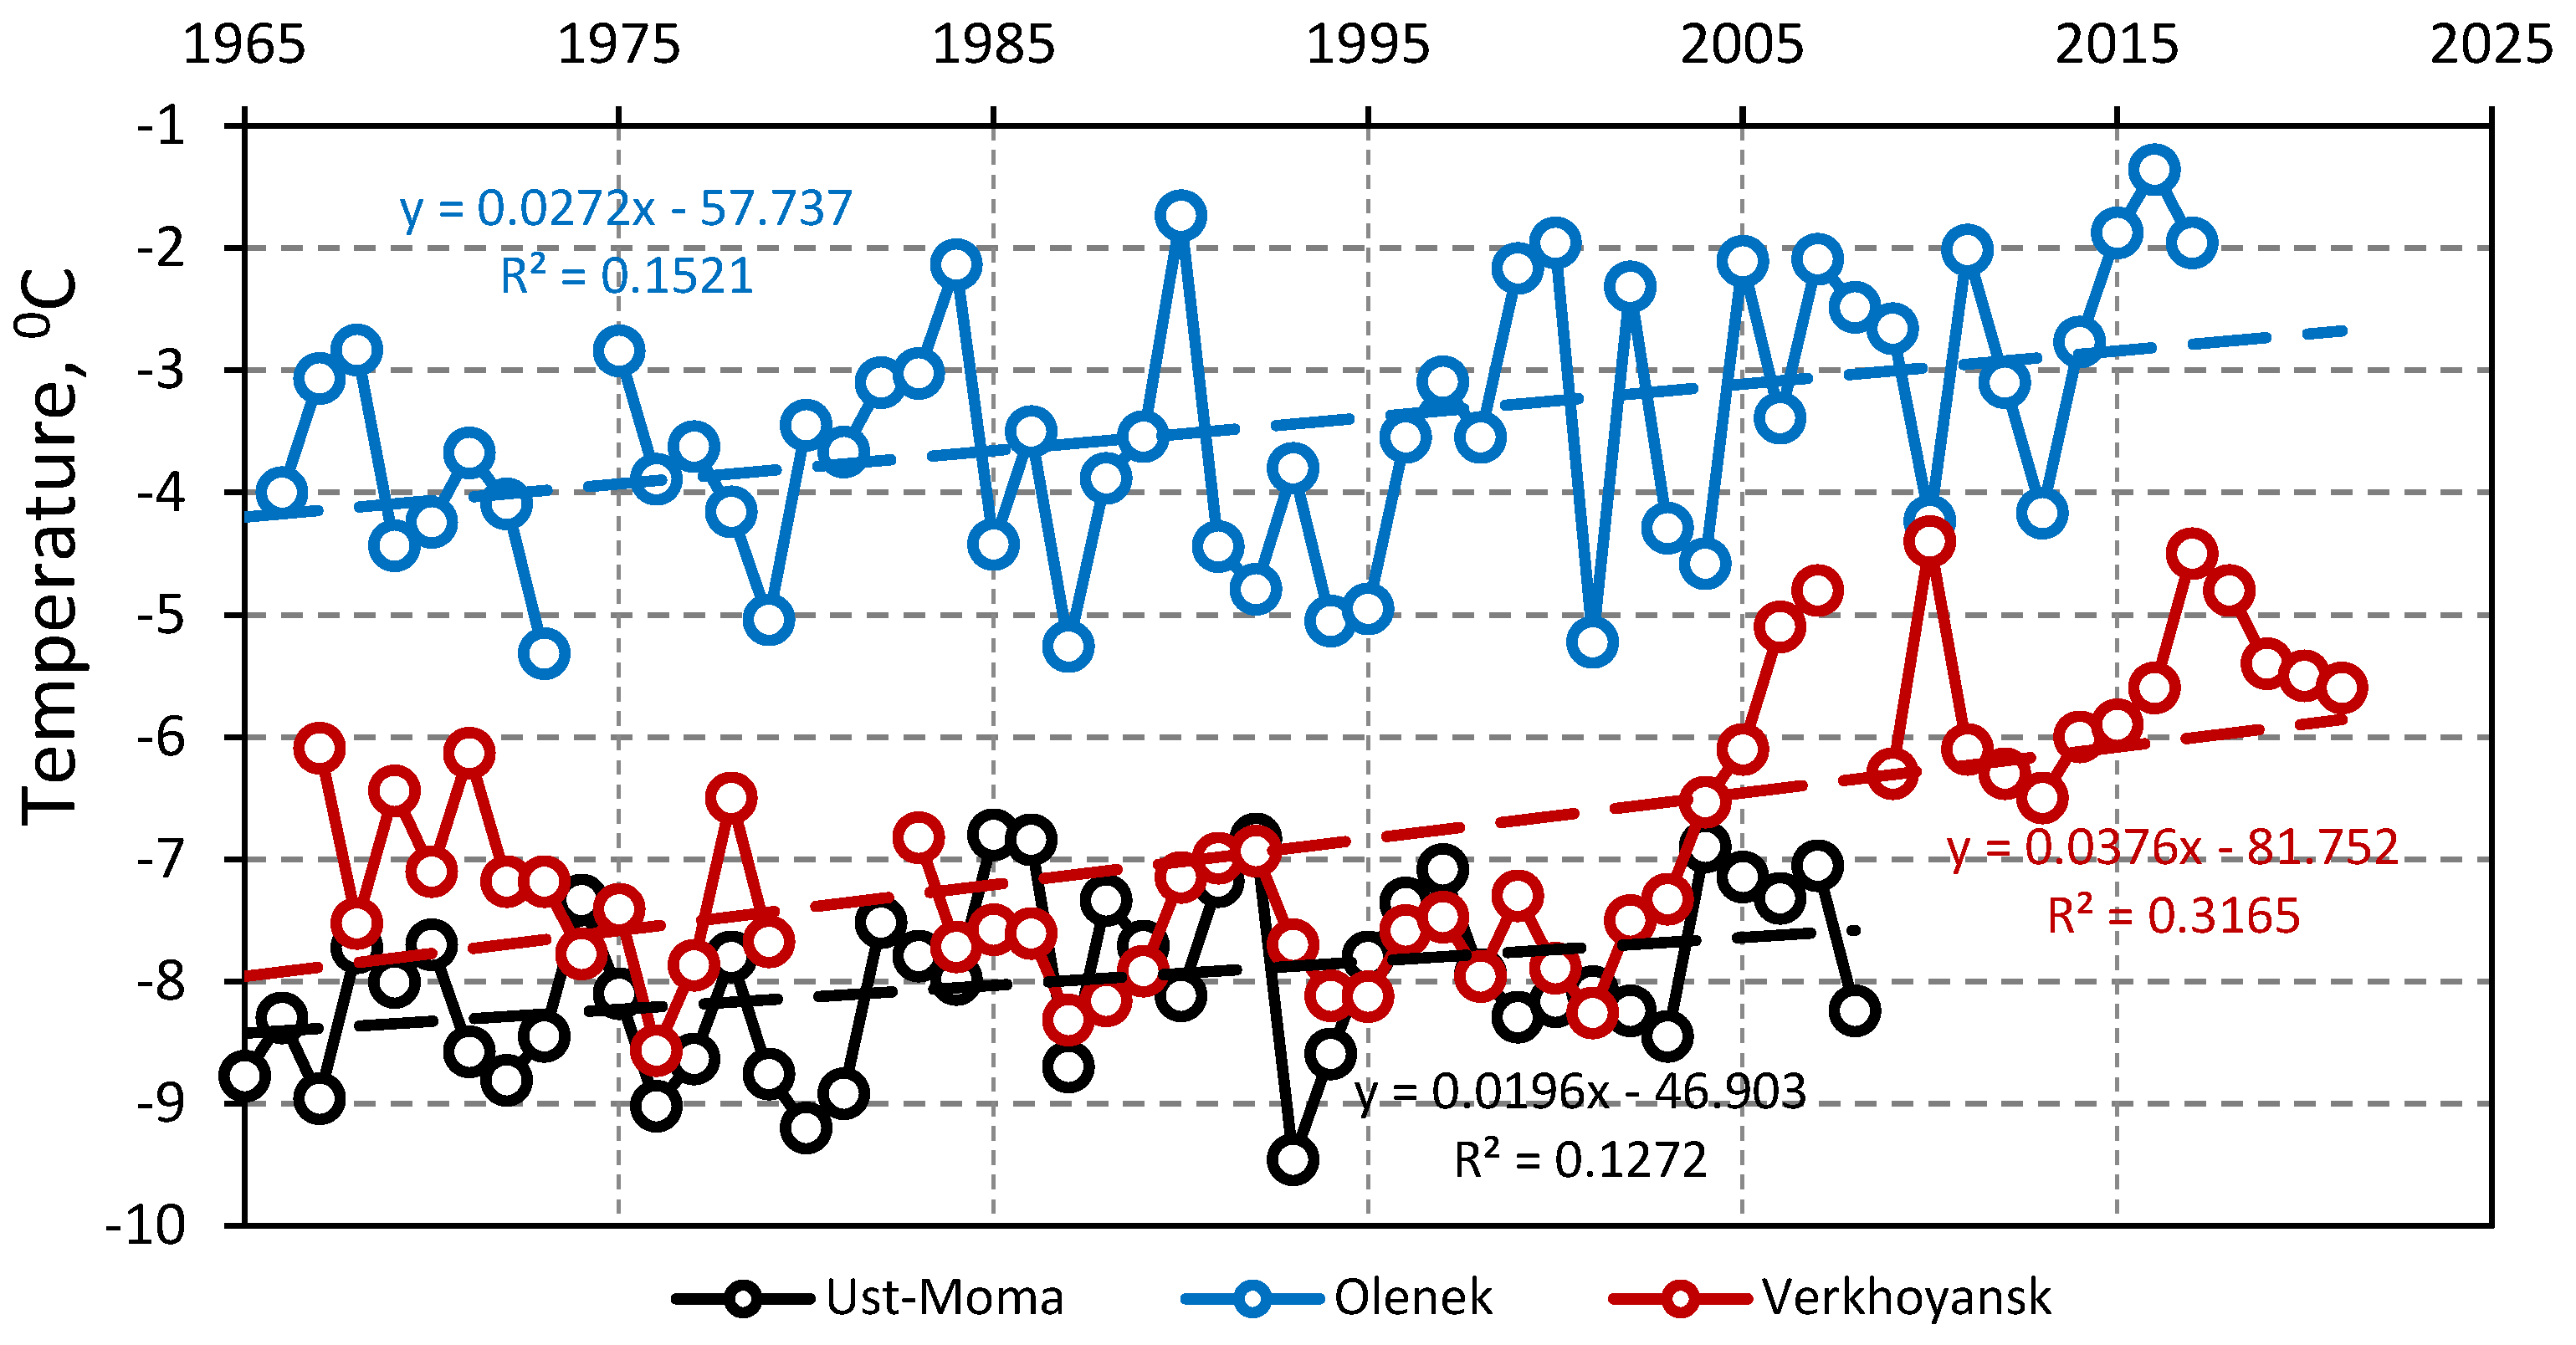
The permafrost temperature in the Subarctic zone of Yakutia is monitored through long-term observations at Roshydromet weather stations. In the Olenyok weather stations from 1966 to 2017, the mean annual permafrost temperature at a depth of 1.6 m increased by 0.03 °C/year (Figure 15).
The Verkhoyansk weather station in the Yana Subarctic region has a long record of permafrost temperature observations. The Verkhoyansk weather station observed a 0.04 °C/year increase in the mean annual temperature at a depth of 1.6 m from 1967 to 2021 (Figure 15). Between 1965 and 2008, the Ust-Moma weather station observed a continuous rise in mean annual permafrost temperature at a depth of 1.6 m in the Verkhoyansk–Chersky mountain region.
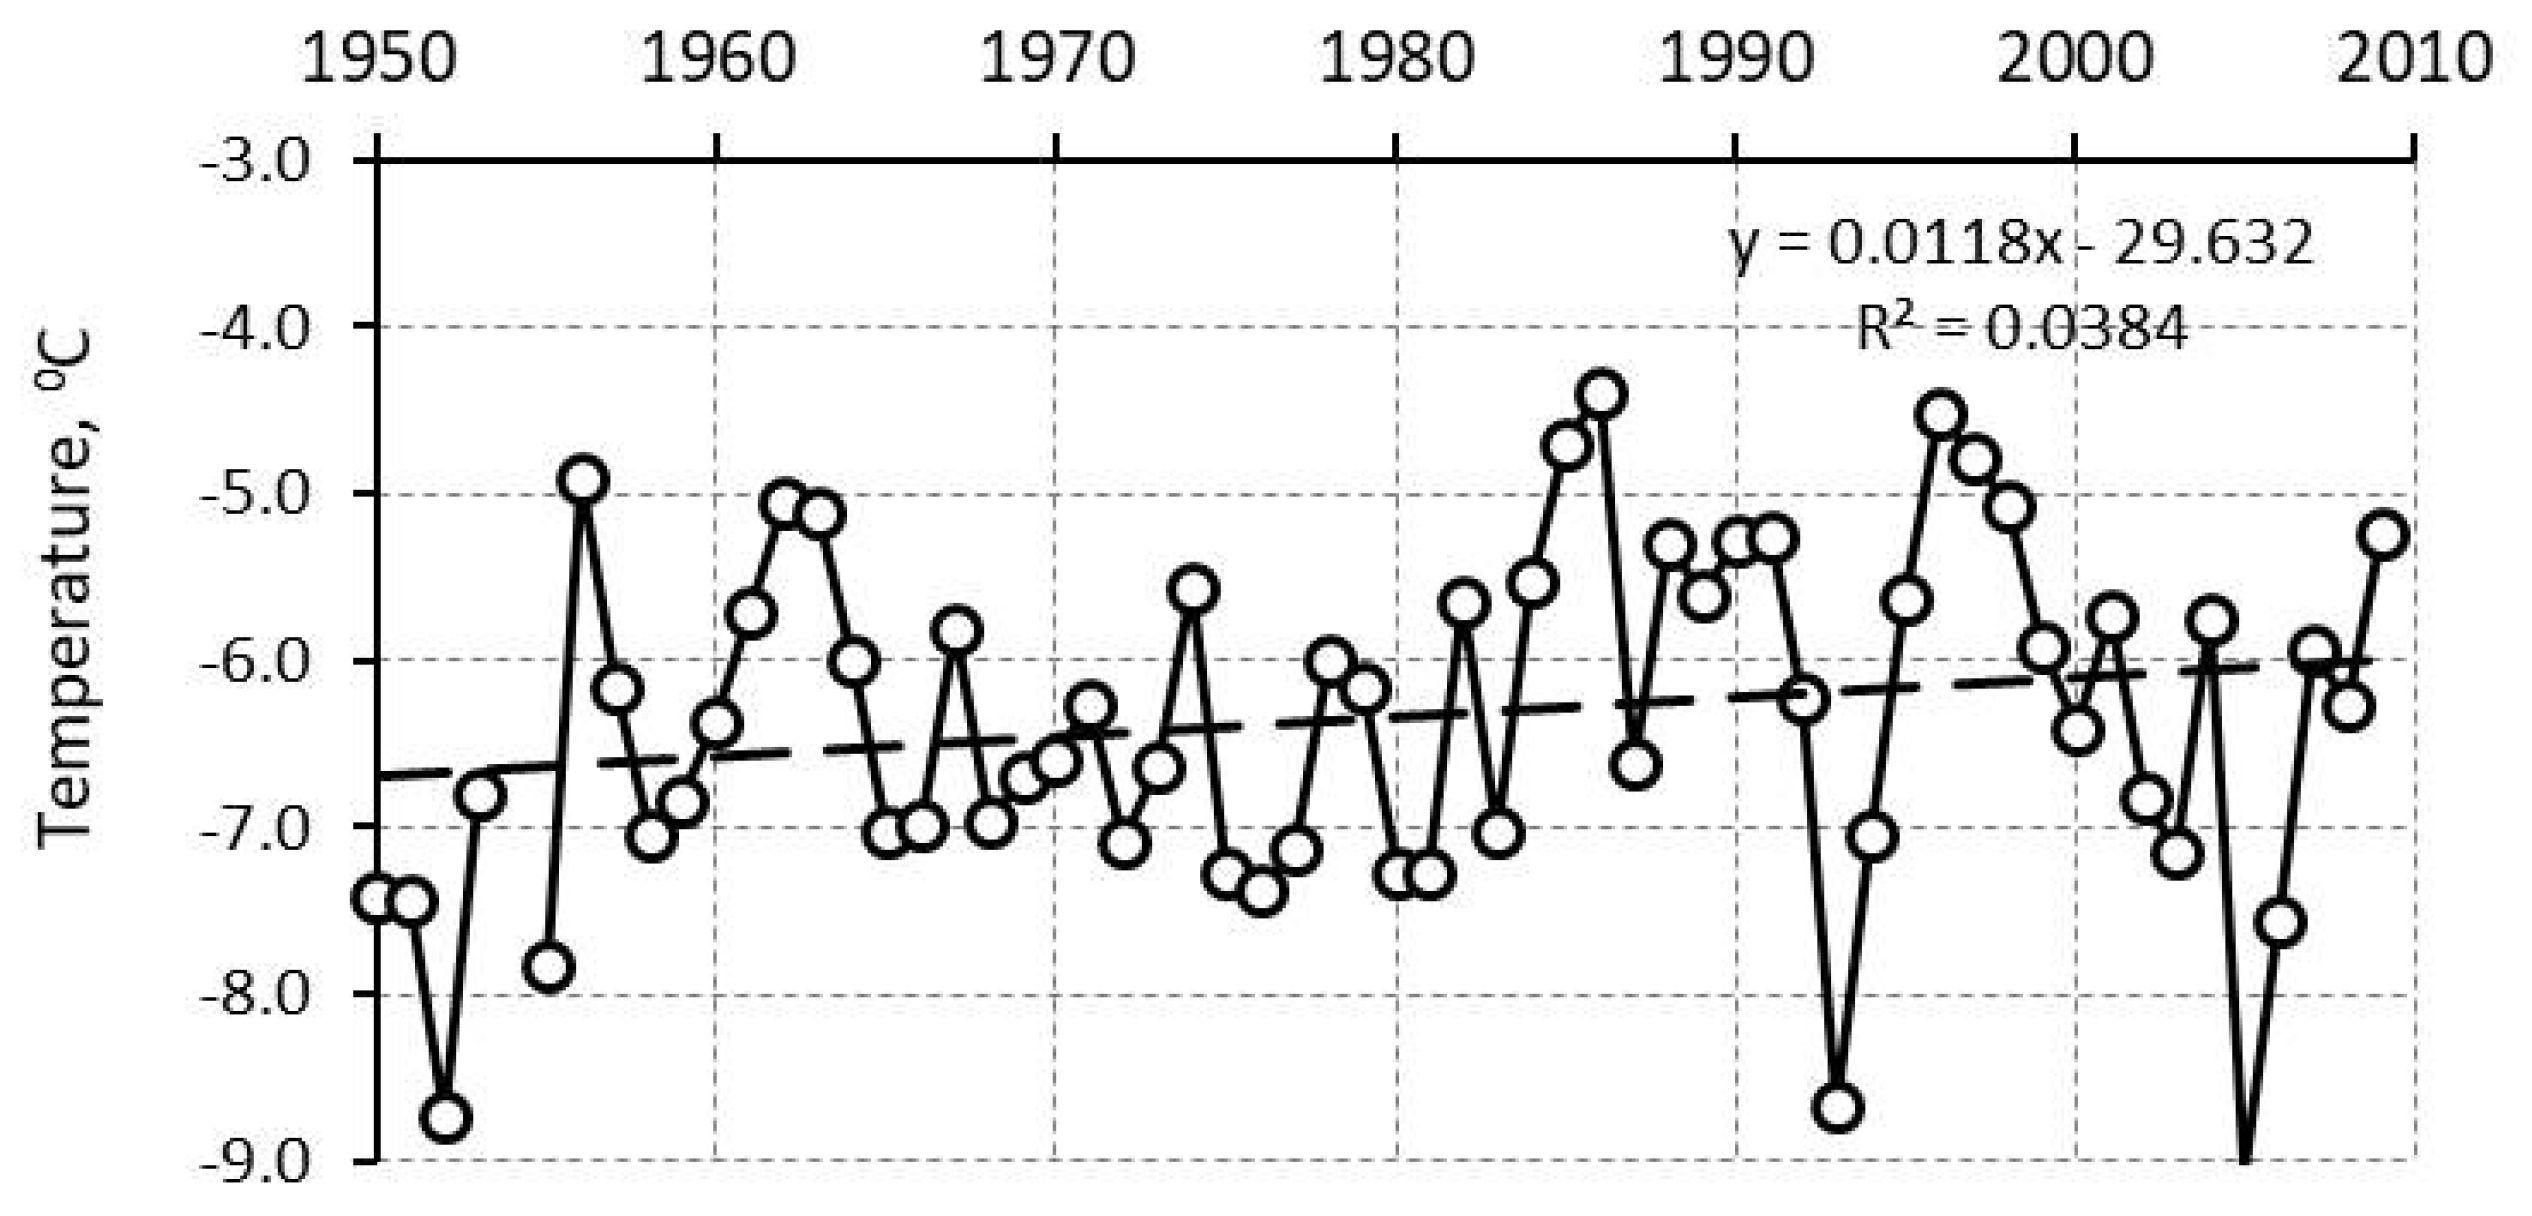
No meteorological stations in high-mountain Subarctic regions record soil temperature data. The Delyankir weather station, located in the highlands but further south, offers a window into the dynamics of permafrost conditions in these areas. Based on data from this weather station, the mean annual permafrost temperature at a depth of 1.6 m showed a insignificant positive trend of 0.01 °C/year from 1950 to 2009 (Figure 16).
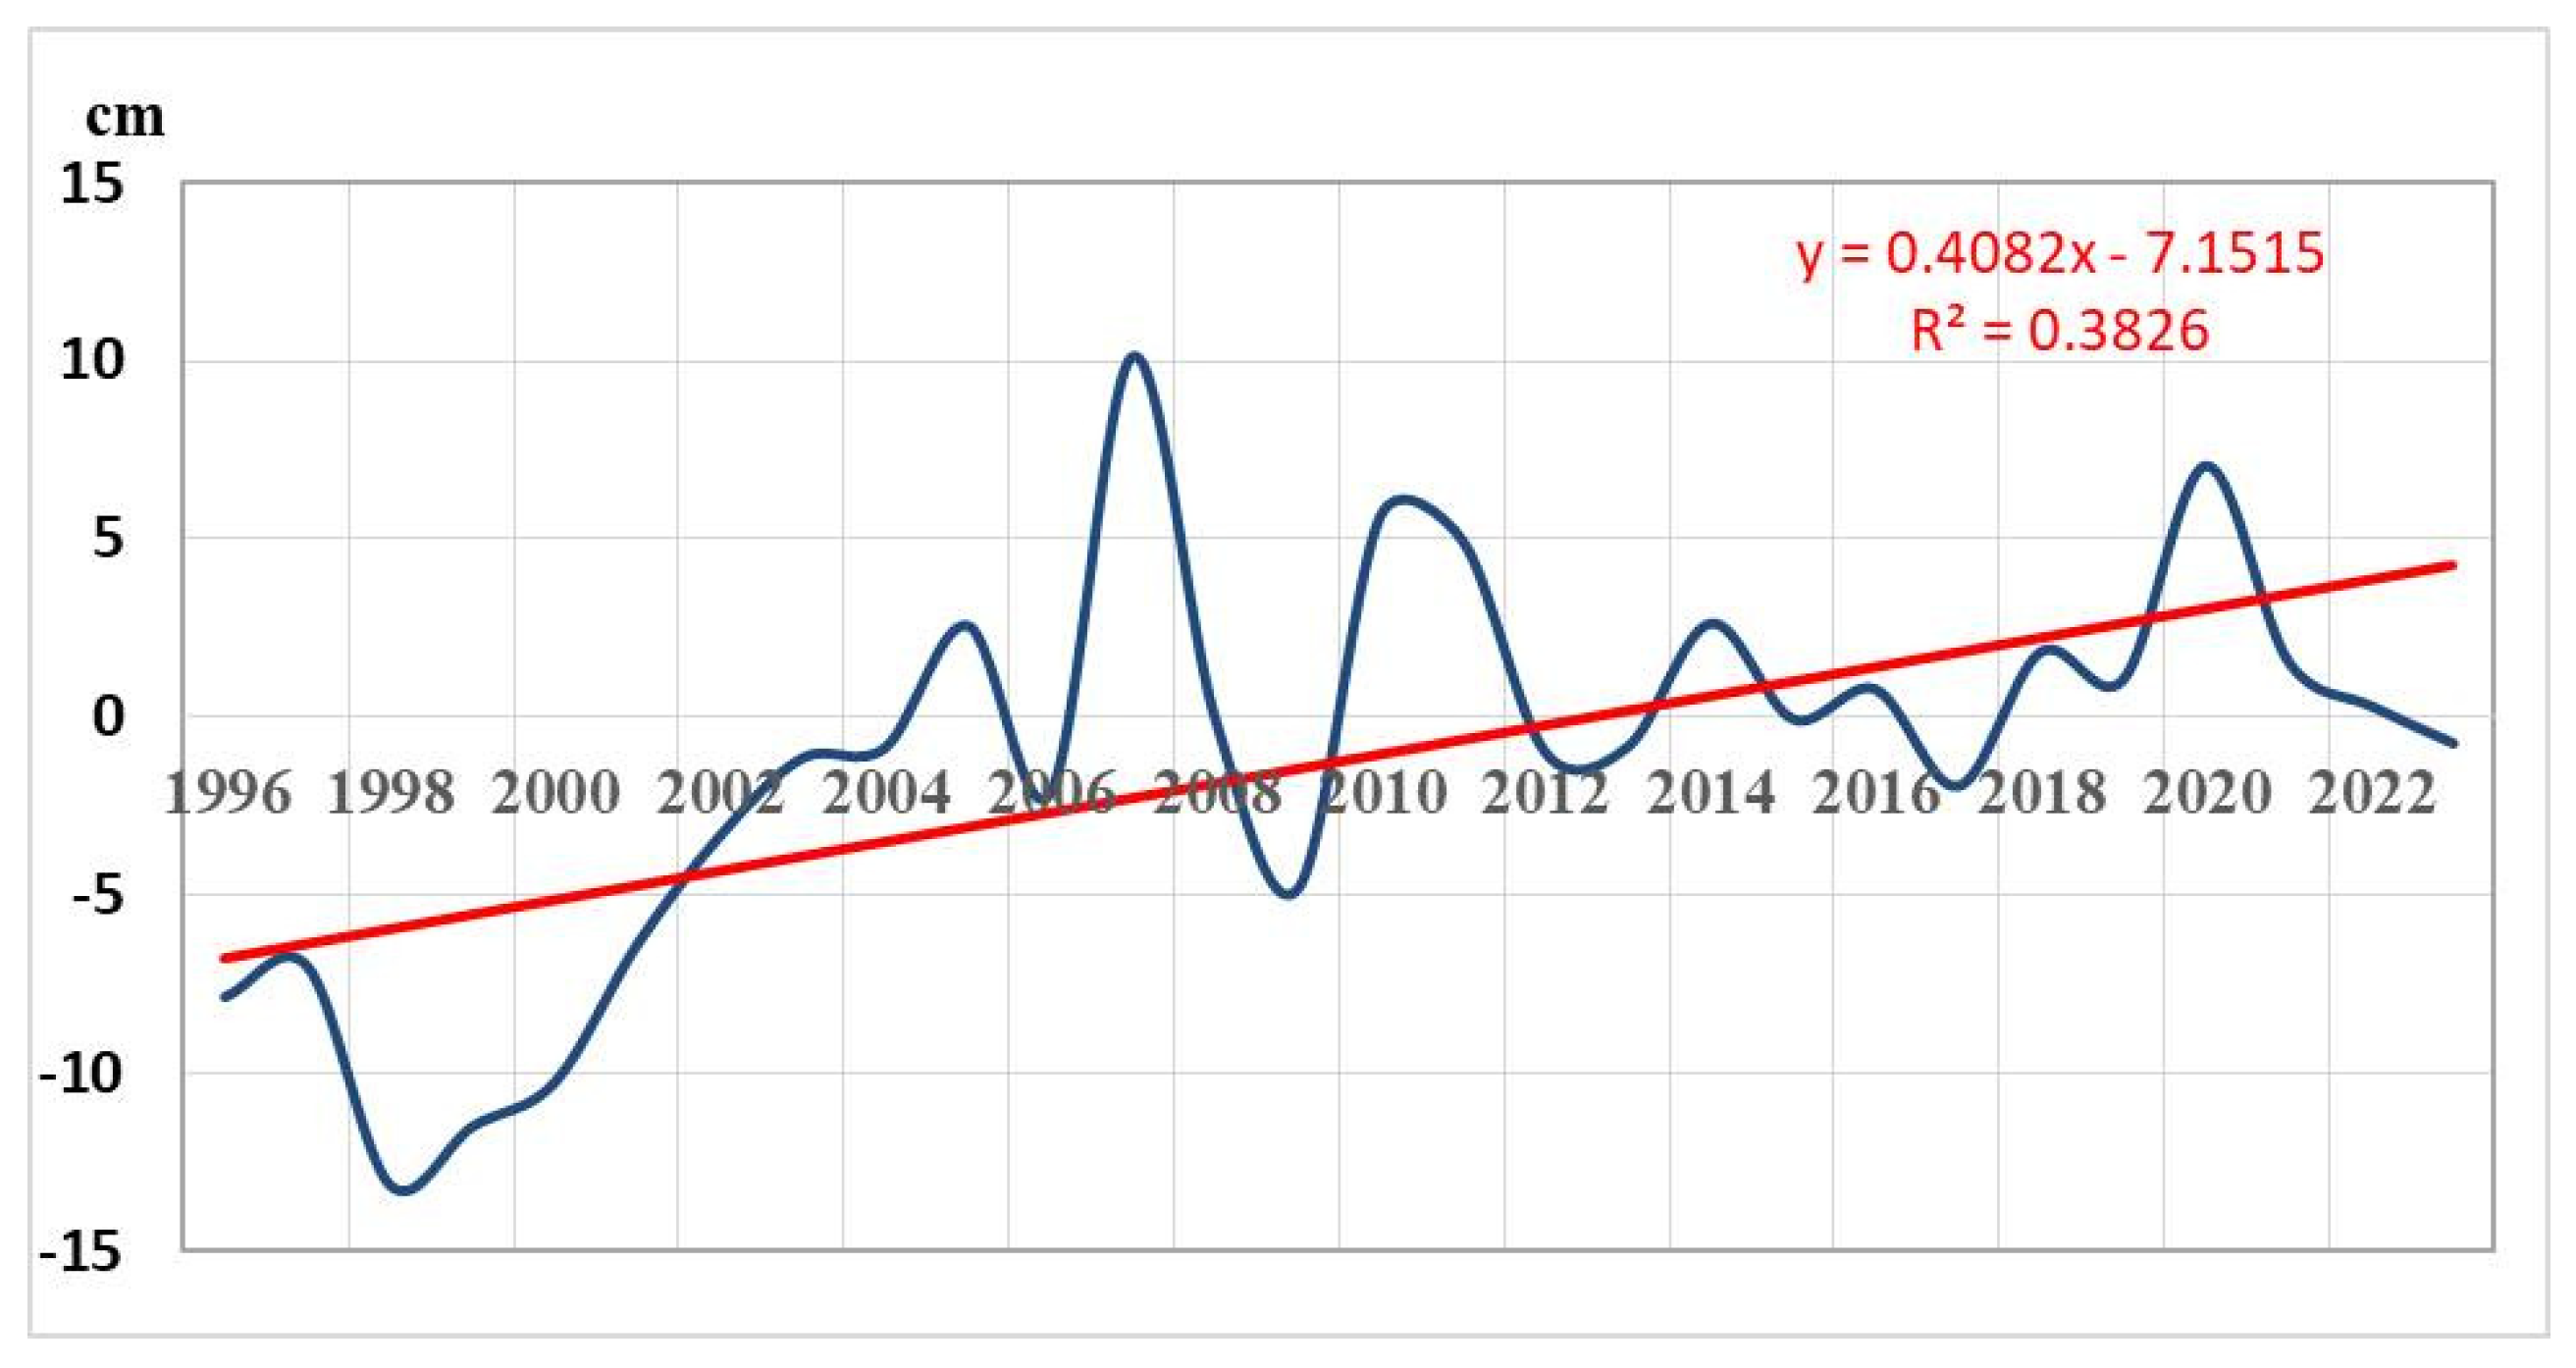
In the Yakutian Arctic zone, monitoring observations of changes in the active layer depth have been carried out since the second half of the 1990s under the international CALM program. On the Yano-Indigirka and Kolyma tundras, the dynamics of active layer depth during the modern warming period before and after 2005 are different [40]. The graph of the average interannual deviations in active layer depth in the Arctic zone of northeastern Yakutia shows negative values from the long-term norm in 1996–2004 and a noticeable increase in the warming period of 2005–2023 (Figure 17). This shows that the dynamics of the active layer depth depend on the period of climate development.

4. Discussion

The analysis of climate data changes shows that the mean annual air temperature increase in the Arctic and Subarctic regions in 2005–2023 was 1.8 and 1.5 °C, the thawing index increased by 151 and 157 degree-days, and the freezing index increased by 504 and 252 degree-days compared to the pre-warming period in 1988–2004. Such changes in climate parameters caused an increase in the permafrost temperature at a depth of 10 m from −11 to −9 °C in the foothills of the eastern slope of the Primorsky Ridge near Tiksi. In Verkhoyansk, from the pre-warming period to the warming period, the mean soil temperature at the depth of 1.6 m also increased by an average of 2 °C. This phenomenon is also observed in Olenek, but the mean soil temperature increase is about 1 °C at the depth 1.6 m.
Air temperature trends have been the main focus in past studies of the permafrost region’s climate. An early study by Pavlov and Malkova [2] focused on mapping trends in mean annual air and soil temperatures in the Russian North from 1965 to 2005. Yakutia’s Arctic and Subarctic regions experience average yearly air temperature increases of less than 0.03 °C per year, whereas average soil temperature increases are generally below 0.02 °C. The time frame they studied includes the periods before warming and those after warming, which we determined in this work. Including data from 2005 to 2023 indicates that the Arctic zone experiences a mean annual air temperature rise of 0.06–0.08 °C per year, and the Subarctic zone experiences a rise of 0.03–0.06 °C per year. This shows a major rise in air temperatures during the period of recent warming we have identified.
According to Bekryaev et al. [41], there are distinct periods of climate development during long-term variations in air temperature in the northern part of the Northern Hemisphere. A high-latitude warming rate of 1.36 °C century has been documented for 1875–2008, which is comparable to the accelerated warming in recent decades (1.35 °C decade). Polar amplification is a manifestation of stronger warming in high-latitude regions. Their results confirm the periodization of climate change in our work.
A study by Romanovsky et al. [3] on permafrost in Russia revealed that changes in average annual air and soil temperatures exhibit zonal patterns, with variations of roughly 1 °C per degree of latitude. Permafrost temperature readings in Tiksi, Yakutia, indicate no change between 1993 and 2005. In the eastern Yana–Kolyma tundra, at a depth of 15 m, the temperature remained stable from 1979 to 1982, showed a slight change between 1990 and 1992, and increased by 1.5 °C in 2009. Their results validate the periods of pre-warming, warming, and current warming that we determined and investigated in this study.
In the Russian Arctic, Malkova et al. [42] similarly employed the division of time intervals. They identified two distinct 30-year periods, 1961–1990 and 1991–2020, characterized by similar trends. Air temperature trends in the Russian cryolithozone during 1961–1990 showed increases of up to 0.03 °C per year in western Arctic Yakutia, while the eastern part experienced a steeper rise of 0.03–0.05 °C per year. The climate dynamics are strongly emphasized by the selection of periods, especially over the long term.
Guo et al. [43] demonstrated the requirement for categorizing development phases based on trend values. Their analysis of air temperature changes in the permafrost region between 1901 and 2014 revealed significantly faster warming during the period from 1979 to 2014 across all permafrost regions. Temperature trends in Russia show a higher average increase of 0.45 °C per year from 1979 to 2014, compared to 0.14 °C per year from 1901 to 2014. Hu et al. [44] found two distinct air temperature trends in the Northern Hemisphere’s permafrost regions: 0.077 ± 0.015 °C per year from 1900 to 1979 and 0.349 ± 0.053 °C per year from 1980 to 2014.
We have used the period division in the above articles to analyze the diverse patterns of modern warming across various climatic periods and specific Arctic and Subarctic regions of Yakutia, using the previously cited works as a base. Each permafrost region is unique in its own way. To better illustrate the use of climatic transitions, such as the transition from a stable climate to modern warming, it is more effective to use periods rather than a single trend. Studies by Litzow [26], Tompson et al. [27,28], and Lobanov [29] analyzing homogeneous periods while accounting for climate shifts have revealed the stages of modern climate warming across the vast northern region of Yakutia. Our research indicates that the Arctic and Subarctic experienced a dramatic transition from a cold climate to a pre-warming period in 1988, followed by a sensitive warming phase starting in 2005 (see Figure 4, Figure 5, Figure 6, Figure 7, Figure 8, Figure 9, Figure 10, Figure 11, Figure 12, Figure 13, Figure 14 and Figure 15, Table 1, Table 2, Table 3, Table 5, Table 6 and Table 7). We can conclude that Arctic and Subarctic Yakutia experienced a warming trend starting in 1988, lasting until 2004. The mean annual air temperature, warming index, and freezing index showed no significant change. Since 2005, permafrost has been experiencing strong warming, a sensitivity that continues today. We found distinct time periods with similar climates, leading to varied permafrost and landscape formation.
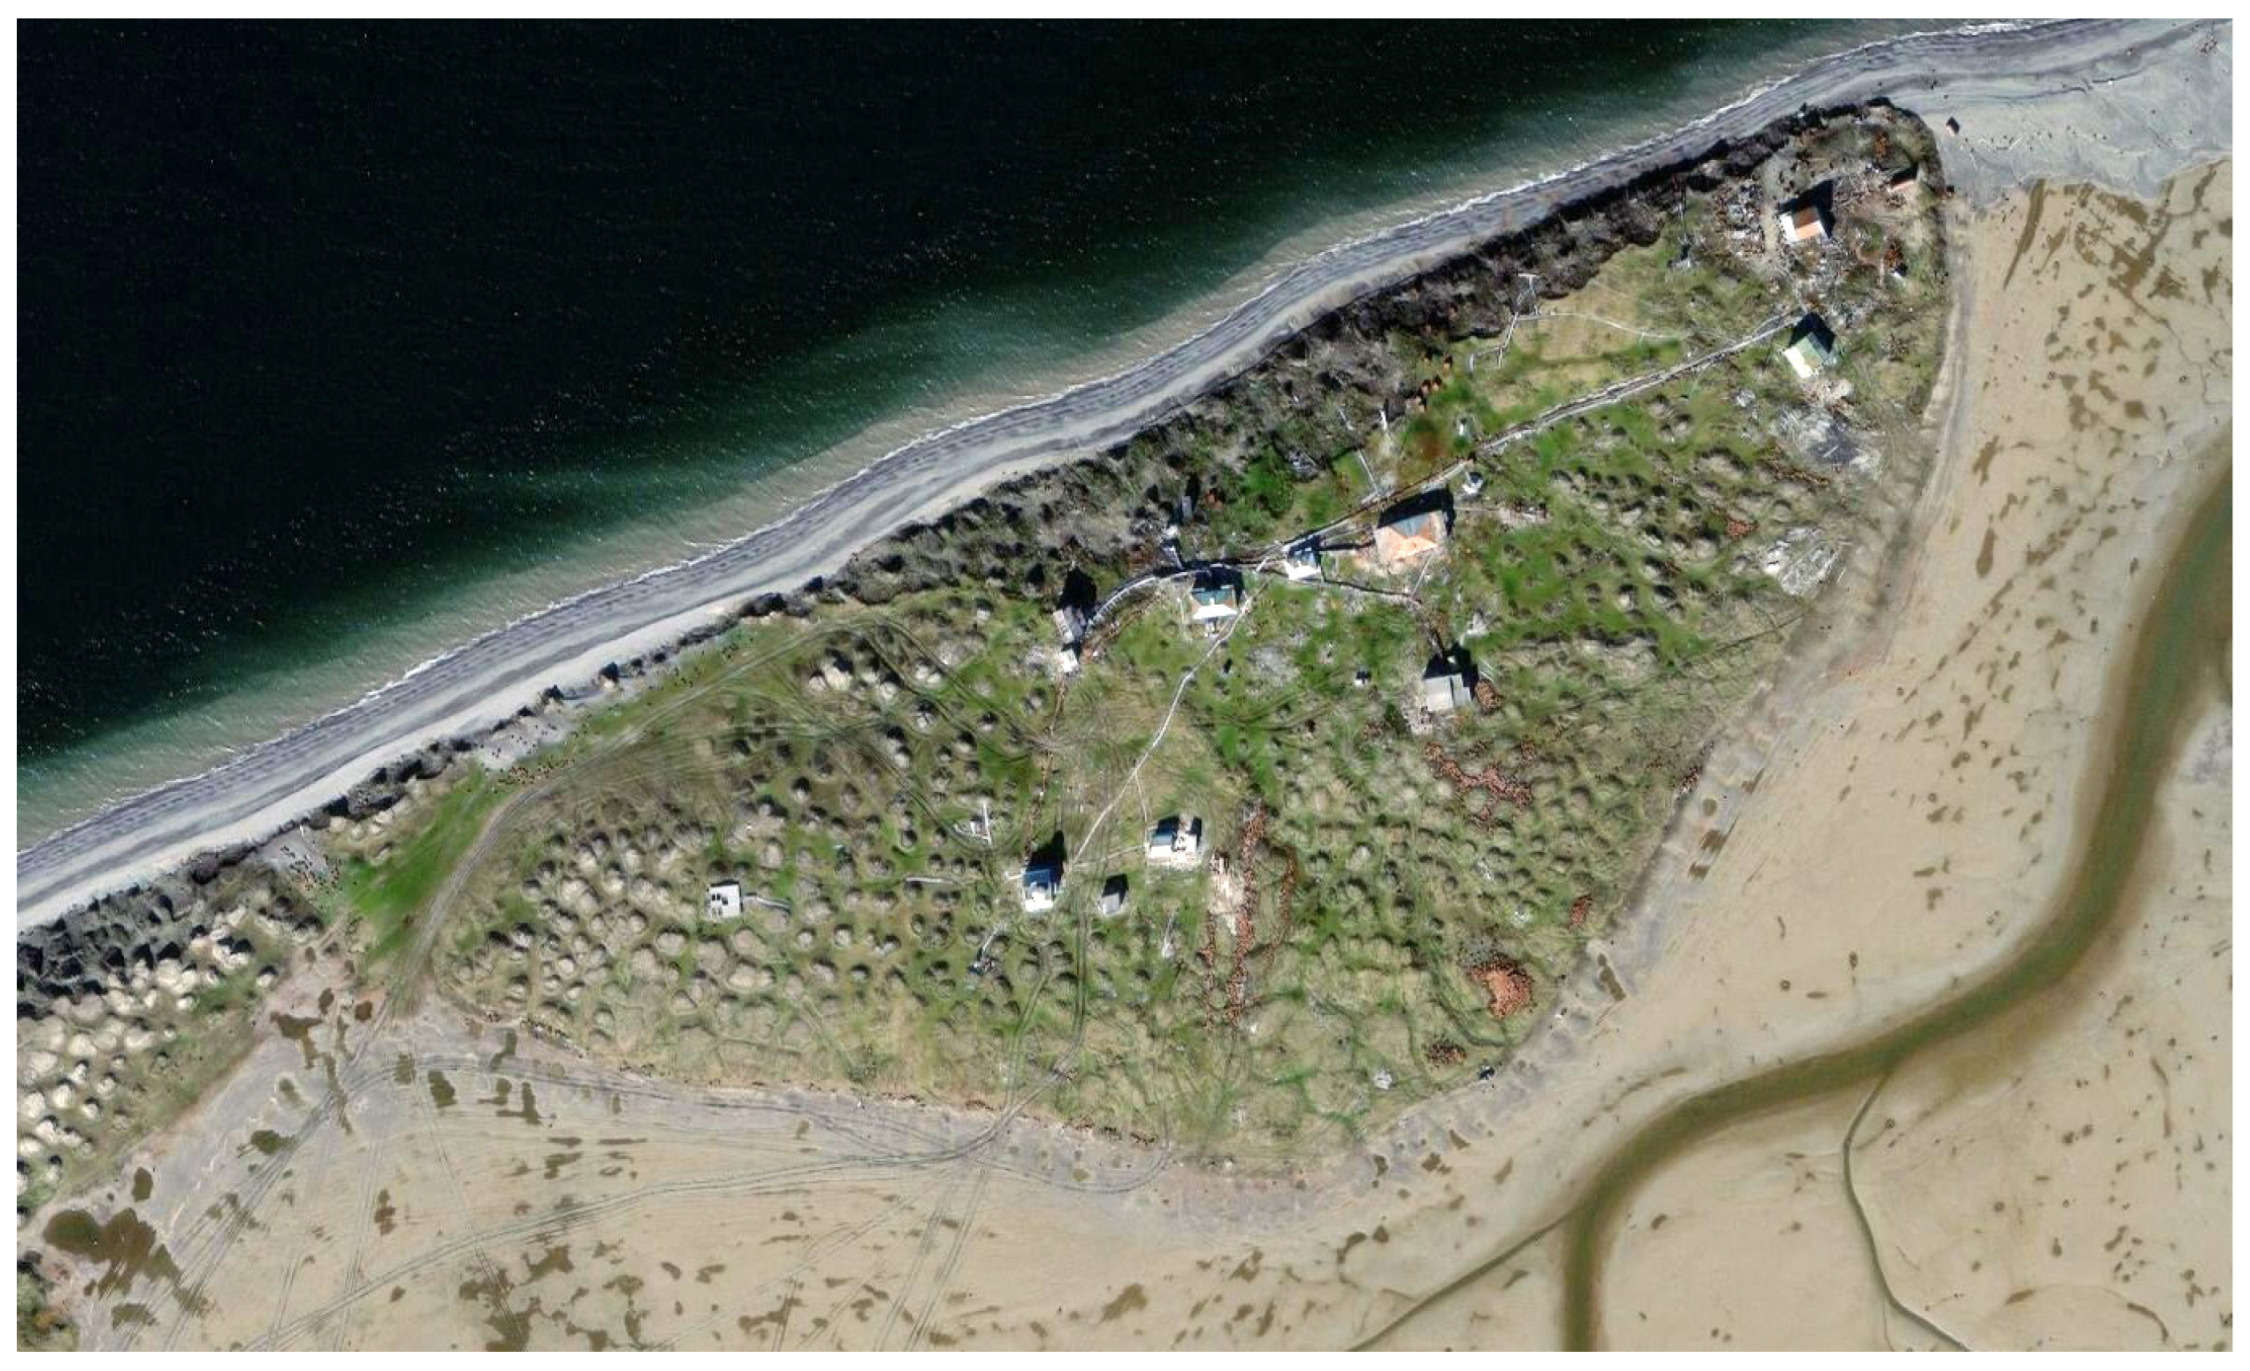
The ice wedges of Yedoma could be affected catastrophically if the active layer thickness increases due to global warming and permafrost. As demonstrated by our observations in the Tiksi area, ice wedges can melt even if permafrost warms by 2 °C (Figure 18). In the Arctic zone of Yakutia, the most common cryogenic process is thermokarst, involving thawing of ice-rich permafrost, leading to subsidence and collapse relief forms. High-centered polygons (Figure 19 and Figure 20) are the common initial relief forms in Yedoma terrain. The existence of initial thermokarst forms signals the degradation of permafrost. Mapping these disturbances would help us gauge the level of degradation of ice-rich permafrost.
The studies conducted reveal that the geocryological situation in the tundra zone of North-Eastern Eurasia involved warming from 2005 to 2023, whereas this was less evident during 1988–1995. According to climate data, the geocryological hazard for landscapes was lower in the 1930–1940s compared to recent years [30].
In Arctic Yakutia, the melting of ice wedges has led to the widespread presence of high-centered polygons in disturbed areas. Other permafrost regions are also experiencing significant thawing of deep-ice permafrost due to the current climate warming [8,9,45,46,47,48,49,50,51]. The emergence of cryogenic risks in Arctic landscapes is indicated by their development. Moreover, global warming activates thermal erosion, landslides, solifluction, and other dangerous phenomena.
The changes in permafrost conditions due to vegetation evolution during global climate warming, including vegetation type and biomass, have not been thoroughly investigated at present. To discuss, let us imagine a change in ground vegetation from moss–lichen to grassy due to climate warming. In Arctic and Subarctic landscapes, researchers have noted a significant increase in the depth of seasonal thawing. Studying the transformation of vegetation species in an evolutionary model can yield valuable insights into permafrost changes. For example, according to Tyrtikov [52], replacing the moss–lichen cover near Igarka with dry bluegrass can triple the active layer thickness from 0.42–0.48 to 1.26 m. In the Dikson settlement area, the active layer thickness ranges from 0.2 to 0.4 m in lichen–moss Arctic tundra while reaching 0.5–0.6 m in dryad–grassy polygonal grassy Arctic tundra [53]. These data illustrate the correlation between vegetation changes and permafrost conditions. When moss–lichen cover is replaced by forb–grass groups, the active layer thickness increases significantly, resulting in permafrost degradation.

5. Conclusions

Our analysis of climate changes over the last 50–60 years has revealed three distinct periods in the climate development of Arctic and Subarctic Yakutia. It is easy to differentiate between the cold period (1965–1987), the pre-warming phase (1988–2004), and the modern warming period (2005–2023). The mean annual air temperature difference between the cold period and modern warming in Yakutia’s Arctic zone is 2.5 °C, compared to a 2.2 °C difference in the Subarctic zone. The average increase in the thawing index was 171 °C days in the Arctic and 214 °C days in Subarctic Yakutia, while the freezing index increased by 702 °C days and 564 °C days, respectively. All three characteristics experienced slight warming during the pre-warming period.
Climate change caused permafrost warming and an increase in the thickness of the active layer, especially in the 2004–2023 period. In the longest-term monitoring site near Tiksi, after the mid-2000s, increasing warming was noted at depths of 3, 10, and 30 m. Thus, at a depth of 10 m during this time, the permafrost temperature increased by 1.7 °C, as well as 1.1 °C at a depth of 30 m. The climatic boundary of 2004/2005 is also felt in the change in the thickness of the active layer. The activation of cryogenic processes is noted during the period of modern warming. All this leads to the formation of geocryological hazards.
Climate shows significant differences over expansive areas. We divided the Yakutian Arctic and Subarctic into seven zones based on the unique ways climate change impacts each area. Modern warming does not affect all regions equally, with some experiencing greater intensity than others. These differences are obvious with our zoning. Different climate intensities influence the formation of cryogenic features, such as melting ice wedges, impacting the study of permafrost landscapes and their response to climate change.
The results of the conducted research are the information base for further study of the impact of global climate warming on permafrost, retrospective assessments of the formation of permafrost conditions in the Holocene and Late Pleistocene, and forecasts of changes in permafrost landscapes in the future. All this can be a basis for conducting environmental studies on adapting socio-economic conditions in the north of Yakutia to modern climate warming.

Author Contributions

Conceptualization, A.N.F., M.N.Z. and P.Y.K.; methodology, A.N.F.; validation, A.N.F.; formal analysis, A.N.F.; investigation, N.F.V., S.P.V., Y.B.S., A.N.G., S.V.K., R.N.I., A.N.P., V.V.A., V.A.N., M.A.S. and M.N.Z.; resources, A.N.F.; data curation, A.N.F.; writing—original draft preparation, A.N.F. and P.Y.K.; writing—review and editing, A.N.F. and P.Y.K.; visualization, A.N.F.; supervision, A.N.F. and M.N.Z.; project administration, A.N.F. and M.N.Z.; funding acquisition, A.N.F. and M.N.Z. All authors have read and agreed to the published version of the manuscript.

Funding

These studies were supported by a grant from the Ministry of Science and Higher Education from the Russian Federation (agreement N° 075-15-2024-554 of 24 April 2024).

Data Availability Statement

The data presented in this study are available on request from the corresponding author.

Acknowledgments

We are grateful to researchers from the Melnikov Permafrost Institute of SB RAS, Yakutsk, Russia, for their support in investigating Siberian permafrost.

Conflicts of Interest

The authors declare no conflicts of interest.

References

  1. Osterkamp, T.E. The recent warming of permafrost in Alaska. Glob. Planet. Chang. 2005, 49, 187–202. [Google Scholar] [CrossRef]
  2. Pavlov, A.V.; Malkova, G.V. Small-scale mapping of trends of contemporary ground temperature changes in the Russian North. Earth’s Cryosphere 2009, 13, 32–39. (In Russian) [Google Scholar]
  3. Romanovsky, V.E.; Drozdov, D.S.; Oberman, N.G.; Malkova, G.V.; Kholodov, A.L.; Marchenko, S.S.; Moskalenko, N.G.; Sergeev, D.O.; Ukraintseva, N.G.; Abramov, A.A.; et al. Thermal state of permafrost in Russia. Permafr. Periglac. Process. 2010, 21, 136–155. [Google Scholar] [CrossRef]
  4. Guo, D.; Sun, J. Permafrost Thaw and Associated Settlement Hazard Onset Timing over the Qinghai-Tibet Engineering Corridor. Int. J. Disaster Risk Sci. 2015, 6, 347–358. [Google Scholar] [CrossRef]
  5. Biskaborn, B.K.; Smith, S.L.; Noetzli, J.; Matthes, H.; Vieira, G.; Streletskiy, D.A.; Schoeneich, P.; Romanovsky, V.E.; Lewkowicz, A.G.; Abramov, A.; et al. Permafrost is warming at a global scale. Nat. Commun. 2019, 10, 264. [Google Scholar] [CrossRef] [PubMed]
  6. Etzelmüller, B.; Guglielmin, M.; Hauck, C.; Hilbich, C.; Hoelzle, M.; Isaksen, K.; Noetzli, J.; Oliva, M.; Ramos, M. Twenty years of European mountain permafrost dynamics—The PACE legacy. Environ. Res. Lett. 2020, 15, 104070. [Google Scholar] [CrossRef]
  7. Hu, G.; Zhao, L.; Wua, T.; Wu, X.; Park, H.; Fedorov, A.; Wei, J.; Li, R.; Zhu, X.; Sun, Z.; et al. Spatiotemporal variations and regional differences in air temperature in the permafrost regions in the Northern Hemisphere during 1980–2018. Sci. Total Environ. 2021, 791, 148358. [Google Scholar] [CrossRef]
  8. Liljedahl, A.K.; Boike, J.; Daanen, R.P.; Fedorov, A.N.; Frost, G.V.; Grosse, G.; Hinzman, L.D.; Iijima, Y.; Jorgenson, J.C.; Matveyeva, N.; et al. Pan-Arctic ice- wedge degradation in warming permafrost and its influence on tundra hydrology. Nat. Geosci. 2016, 9, 312–318. [Google Scholar] [CrossRef]
  9. Kokelj, S.; Trevor, C.; Tunnicliffe, J.; Segal, R.; Lacelle, D. Climate-driven thaw of permafrost preserved glacial landscapes, northwestern Canada. Geology 2017, 45, 371–374. [Google Scholar] [CrossRef]
  10. Nitze, I.; Grosse, G.; Jones, B.M.; Arp, C.D.; Ulrich, M.; Fedorov, A.; Veremeeva, A. Landsat-Based Trend Analysis of Lake Dynamics across Northern Permafrost Regions. Remote Sens. 2017, 9, 640. [Google Scholar] [CrossRef]
  11. Saito, H.; Iijima, Y.; Basharin, N.I.; Fedorov, A.N.; Kunitsky, V.V. Thermokarst development detected from high-definition topographic data in Central Yakutia. Remote Sens. 2018, 10, 1579. [Google Scholar] [CrossRef]
  12. Luo, J.; Lin, Z.; Yin, G.; Niu, F.; Liu, M.; Gao, Z.; Fan, X. The ground thermal regime and permafrost warming at two upland, sloping, and undisturbed sites, Kunlun Mountain, Qinghai-Tibet Plateau. Cold Reg. Sci. Technol. 2019, 167, 102862. [Google Scholar] [CrossRef]
  13. Shiklomanov, N.I.; Streletskiy, D.A.; Swales, T.B.; Kokorev, V.A. Climate Change and Stability of Urban Infrastructure in Russian Permafrost Regions: Prognostic Assessment based on GCM Climate Projections. Geogr. Rev. 2017, 107, 125–142. [Google Scholar] [CrossRef]
  14. Streletskiy, D.A.; Suter, L.J.; Shiklomanov, N.I.; Porfiriev, B.N.; Eliseev, D.O. Assessment of Climate Change impactson buildings, structures and infrastructurein the Russian regions on permafrost. Environ. Res. Lett. 2019, 14, 025003. [Google Scholar] [CrossRef]
  15. Streletskiy, D.A.; Clemens, S.; Lanckmanand, J.-P.; Shiklomanov, N.I. The costs of Arctic infrastructure damages due to permafrost degradation. Environ. Res. Lett. 2023, 18, 015006. [Google Scholar] [CrossRef]
  16. Hjort, J.; Karjalainen, O.; Aalto, J.; Westermann, S.; Romanovsky, V.E.; Nelson, F.E.; Etzelmüller, B.; Luoto, M. Degrading permafrost puts Arctic infrastructure at risk by mid-century. Nat. Commun. 2018, 9, 5147. [Google Scholar] [CrossRef]
  17. Hjort, J.; Streletskiy, D.; Doré, G.; Wu, Q.; Bjella, K.; Luoto, M. Impacts of permafrost degradationon infrastructure. Nat. Rev. Earth Environ. 2022, 3, 24–38. [Google Scholar] [CrossRef]
  18. Skachkov, Y.B. Climatic variability in Yakutia at the turn of the 20th and 21th centuries. In Proceedings of the Fourth Conference of Geocryologists of Russia, Moscow, Russia, 7–9 June 2011; Publishing House Moscow state University: Moscow, Russia, 2011; Volume 2, Part 6, pp. 312–318. (In Russian). [Google Scholar]
  19. Gorokhov, A.N.; Fedorov, A.N. Current Trends in Climate Change in Yakutia. Geogr. Nat. Resour. 2018, 39, 153–161. [Google Scholar] [CrossRef]
  20. Boike, J.; Juszak, J.; Lange, S.; Chadburn, S.; Burke, E.; Overduin, P.; Roth, K.; Ippisch, O.; Bornemann, N.; Stern, L.; et al. A 20-year record (1998–2017) of permafrost, active layer and meteorological conditions at a high Arctic permafrost research site (Bayelva, Spitsbergen). Earth Syst. Sci. Data 2018, 10, 355–390. [Google Scholar] [CrossRef]
  21. Fyodorov-Davydov, D.G.; Kholodov, A.L.; Ostroumov, V.E.; Kraev, G.N.; Sorokovikov, V.A.; Kholodov, S.; Merekalova, A.A. Seasonal Thaw of Soils in the North Yakutian Ecosystems. In Proceedings of the 9th International Conference on Permafrost. Institute of Northern Engineering, Fairbanks, Alaska, 29 June–3 July 2008; Volume 2, pp. 481–486. [Google Scholar]
  22. Kholodov, A.; Gilichinsky, D.; Ostroumov, V.; Sorokovikov, V.; Abramov, A.; Davydov, S.; Romanovsky, V. Regional and Local Variability of Modern Natural Changes in Permafrost Temperature in the Yakutia Coastal Lowlands, Northeastern Siberia. In Proceedings of the Tenth International Conference of Permafrost, Salehard, Russia, 25–29 June 2012; Volume 1, pp. 203–208. [Google Scholar]
  23. Kunitsky, V.V.; Syromyatnikov, I.; Schirrmeister, L.; Skachov, Y.B.; Grosse, G.; Wetterich, S.; Grigoriev, M.N. Ice-rich permafrost and thermal denudation in the Batagay area (Yana Upland, East Siberia). Earths Cryosphere 2013, 17, 56–58. (In Russian) [Google Scholar]
  24. Desyatkin, R.; Okoneshnikova, M.; Ivanova, A.; Nikolaeva, M.; Filippov, N.; Desyatkin, A. Dynamics of Vegetation and Soil Cover of Pyrogenically Disturbed Areas of the Northern Taiga under Conditions of Thermokarst Development and Climate Warming. Land 2022, 11, 1594. [Google Scholar] [CrossRef]
  25. Murton, J.; Opel, T.; Wetterich, S.; Ashastina, K.; Savvinov, G.; Danilov, P.; Boeskorov, V. Batagay megaslump: A review of the permafrost deposits, Quaternary environmental history, and recent development. Permafr. Periglac Process. 2023, 34, 399–416. [Google Scholar] [CrossRef]
  26. Litzow, M.A. Climate regime shifts and community reorganization in the Gulf of Alaska: How do recent shifts compare with 1976/1977? ICES J. Mar. Sci. 2006, 63, 1386–1396. [Google Scholar] [CrossRef]
  27. Thompson, D.W.J.; Wallage, J.M.; Jones, P.D.; Kennedy, J.J. Identifying Signatures of Natural Climate Variability in Time Series of Global-Mean Surface Temperature: Methodology and Insights. J. Clim. 2009, 22, 6120–6141. [Google Scholar] [CrossRef]
  28. Thompson, D.W.J.; Wallage, J.M.; Kennedy, J.J.; Jones, P.D. An abrupt drop in Northern Hemisphere sea surface temperature around 1970. Nature 2010, 467, 444–447. [Google Scholar] [CrossRef]
  29. Lobanov, V.A. Textbook on Regional Climatology, Training ed.; RSHU: St. Petersburg, Russia, 2020; 60p. [Google Scholar]
  30. Fedorov, A.N.; Ivanova, R.N.; Park, H.; Hiyama, T.; Iijima, Y. Recent air temperature changes in the permafrost landscapes of northeastern Eurasia. Polar Sci. 2014, 8, 114–128. [Google Scholar] [CrossRef]
  31. Romanovsky, V.E.; Sazonova, T.S.; Balobaev, V.T.; Shender, N.I.; Sergueev, D.O. Past and recent changes in air and permafrost temperatures in eastern Siberia. Glob. Planet. Chang. 2007, 56, 399–413. [Google Scholar] [CrossRef]
  32. Romanovsky, V.E.; Smith, S.L.; Christiansen, H.H. Permafrost thermal state in the polar Northern Hemisphere during the international polar year 2007–2009: A synthesis. Permafr. Periglac Process. 2010, 21, 106–116. [Google Scholar] [CrossRef]
  33. Vasiliev, A.A.; Streletskaya, I.D.; Shirokov, R.S.; Oblogov, G.E. Coastal permafrost evolution of Western Yamal in context of climate change. Earths Cryosphere 2011, 2, 56–64. (In Russian) [Google Scholar]
  34. Vasiliev, A.A.; Drozdov, D.S.; Gravis, A.; Malkova, G.; Nyland, K.E.; Streletskiy, D.A. Permafrost degradation in the Western Russian Arctic. Environ. Res. Lett. 2020, 10, 045001. [Google Scholar] [CrossRef]
  35. Kraev, G.; Abramov, A.; Bykhovets, S.; Fyodorov-Davydov, D.; Kholodov, A.; Lupachev, A.; Mamykin, V.; Ostroumov, V.; Sorokovikov, V.; Gilichinsky, D.; et al. Thermal State of Permafrost in the Eastern Arctic. In Tenth International Conference on Permafrost; Kane, D.L., Hinkel, K.M., Eds.; Institute of Northern Engineering, University of Alaska Fairbanks: Fairbanks, AK, USA, 2012; Volume 1, pp. 993–998. [Google Scholar]
  36. Konstantinov, P.; Basharin, N.; Fedorov, A.; Iijima, Y.; Andreeva, V.; Semenov, V.; Vasiliev, N. Impact of Climate Change on the Ground Thermal Regime in the Lower Lena Region, Arctic Central Siberia. Land 2023, 12, 19. [Google Scholar] [CrossRef]
  37. Fyodorov-Davydov, D.G.; Davydov, S.P.; Davydova, A.I.; Shmelev, D.G.; Ostroymov, V.E.; Kholodov, A.L.; Sorokovikov, V.A. The thermal state of soils in northern Yakutia. Earths Cryosphere 2018, 22, 47–58. [Google Scholar]
  38. Ostroymov, V.E.; Fedoryov-Davydov, D.G.; Kholodov, A.L.; Davydov, S.P.; Davydova, A.I.; Sorokovikov, V.A. Thermal regime of soils and permafrost subsoil of northern Yakutia in connection with global climate change. In Proceedings of the VIII Congress of the V.V. Dokuchaev Soil Science Society, Part 3, FRC Komi RC UB RAS, Syktyvkar, Russia, 19–24 July 2021; pp. 995–997. (In Russian). [Google Scholar]
  39. Andreeva, V.V.; Maksimov, G.T.; Spektor, V.V.; Kholodov, A.L.; Davydov, S.P. Temperature regime of permafrost in post-pyrogenic areas of the northern Kolyma lowland. Adv. Mod. Nat. Sci. 2021, 8, 29–40. (In Russian) [Google Scholar]
  40. Abramov, A.; Davydov, S.; Ivashchenko, A.; Karelin, D.; Kholodov, A.; Kraev, G.; Lupachev, A.; Maslakov, A.; Ostroumov, V.; Rivkina, E.; et al. Two decades of active layer thickness monitoring in northeastern Asia. Polar Geogr. 2019, 44, 186–202. [Google Scholar] [CrossRef]
  41. Bekryaev, R.V.; Polyakov, I.V.; Alexeev, V.A. Role of Polar Amplification in Long-Term Surface Air Temperature Variations and Modern Arctic Warming. J. Clim. 2010, 23, 3888–3906. [Google Scholar] [CrossRef]
  42. Jones, B.M.; Grosse, G.D.A.C.; Jones, M.C.; Walter Anthony, K.M.; Romanovsky, V.E. Modern thermokarst lake dynamics in the continuous permafrost zone, northern Seward Peninsula, Alaska. J. Geophys. Res.–Biogeo 2011, 116, G00M03. [Google Scholar] [CrossRef]
  43. Jones, B.; Grosse, G.; Arp, C.; Miller, E.; Liu, L.; Hayes, D.; Larsen, C. Recent Arctic tundra fire initiates widespread thermokarst development. Sci. Rep. 2015, 5, 15865. [Google Scholar] [CrossRef]
  44. Morgenstern, A.; Ulrich, M.; Günther, F.; Roessler, S.; Fedorova, I.V.; Rudaya, N.A.; Wetterich, S.; Boike, J.; Schirrmeister, L. Evolution of thermokarst in East Siberian ice-rich permafrost: A case study. Geomorphology 2013, 201, 363–379. [Google Scholar] [CrossRef]
  45. Niu, F.; Cheng, G.; Luo, J.; Jin, Z. Advances thermokarst lake research in permafrost regions. Sci. Cold Arid Reg. 2014, 6, 388–397. [Google Scholar]
  46. Luo, J.; Niu, F.; Lin, Z.; Liu, M.; Yin, G. Thermokarst lake changes between 1969 and 2010 in the Beilu River Basin, Qinghai–Tibet Plateau, China. Sci. Bull. 2015, 60, 556–564. [Google Scholar] [CrossRef]
  47. Farquharson, L.M.; Romanovsky, V.E.; Cable, W.L.; Walker, D.A.; Kokelj, S.V.; Nicolsky, D. Climate change drives widespread and rapid thermokarst development in very cold permafrost in the Canadian High Arctic. Geophys. Res. Lett. 2019, 46, 6681–6689. [Google Scholar] [CrossRef]
  48. Guglielmin, M.; Ponti, S.; Forte, E.; Cannone, N. Recent thermokarst evolution in the Italian Central Alps. Permafr. Periglac Process. 2021, 32, 299–317. [Google Scholar] [CrossRef]
  49. Malkova, G.; Drozdov, D.; Vasiliev, A.; Gravis, A.; Kraev, G.; Korostelev, Y.; Nikitin, K.; Orekhov, P.; Ponomareva, O.; Romanovsky, V.; et al. Spatial and Temporal Variability of Permafrost in the Western Part of the Russian Arctic. Energies 2022, 15, 2311. [Google Scholar] [CrossRef]
  50. Guo, D.; Wang, H. The significant climate warming in the northern Tibetan Plateau and its possible causes. Int. J. Climatol. 2011, 32, 1775–1781. [Google Scholar] [CrossRef]
  51. Hu, G.; Zhao, L.; Wu, T.; Wu, X.; Park, H.; Li, R.; Zhu, X.; Ni, J.; Zou, D.; Hao, J.; et al. Continued warming of the permafrost regions over the Northern Hemisphere under future climate change. Earth’s Future 2022, 10, e2022EF002835. [Google Scholar] [CrossRef]
  52. Tyrtikov, A.P. The Influence of Vegetation on Freezing and Thawing of Soils; Publishing House of Moscow State University: Moscow, Russia, 1969; 192p. (In Russian) [Google Scholar]
  53. Tyrtikov, A.P. Dynamics of Vegetation Cover and Development of Permafrost Landforms; Nauka: Moscow, Russia, 1979; 116p. (In Russian) [Google Scholar]
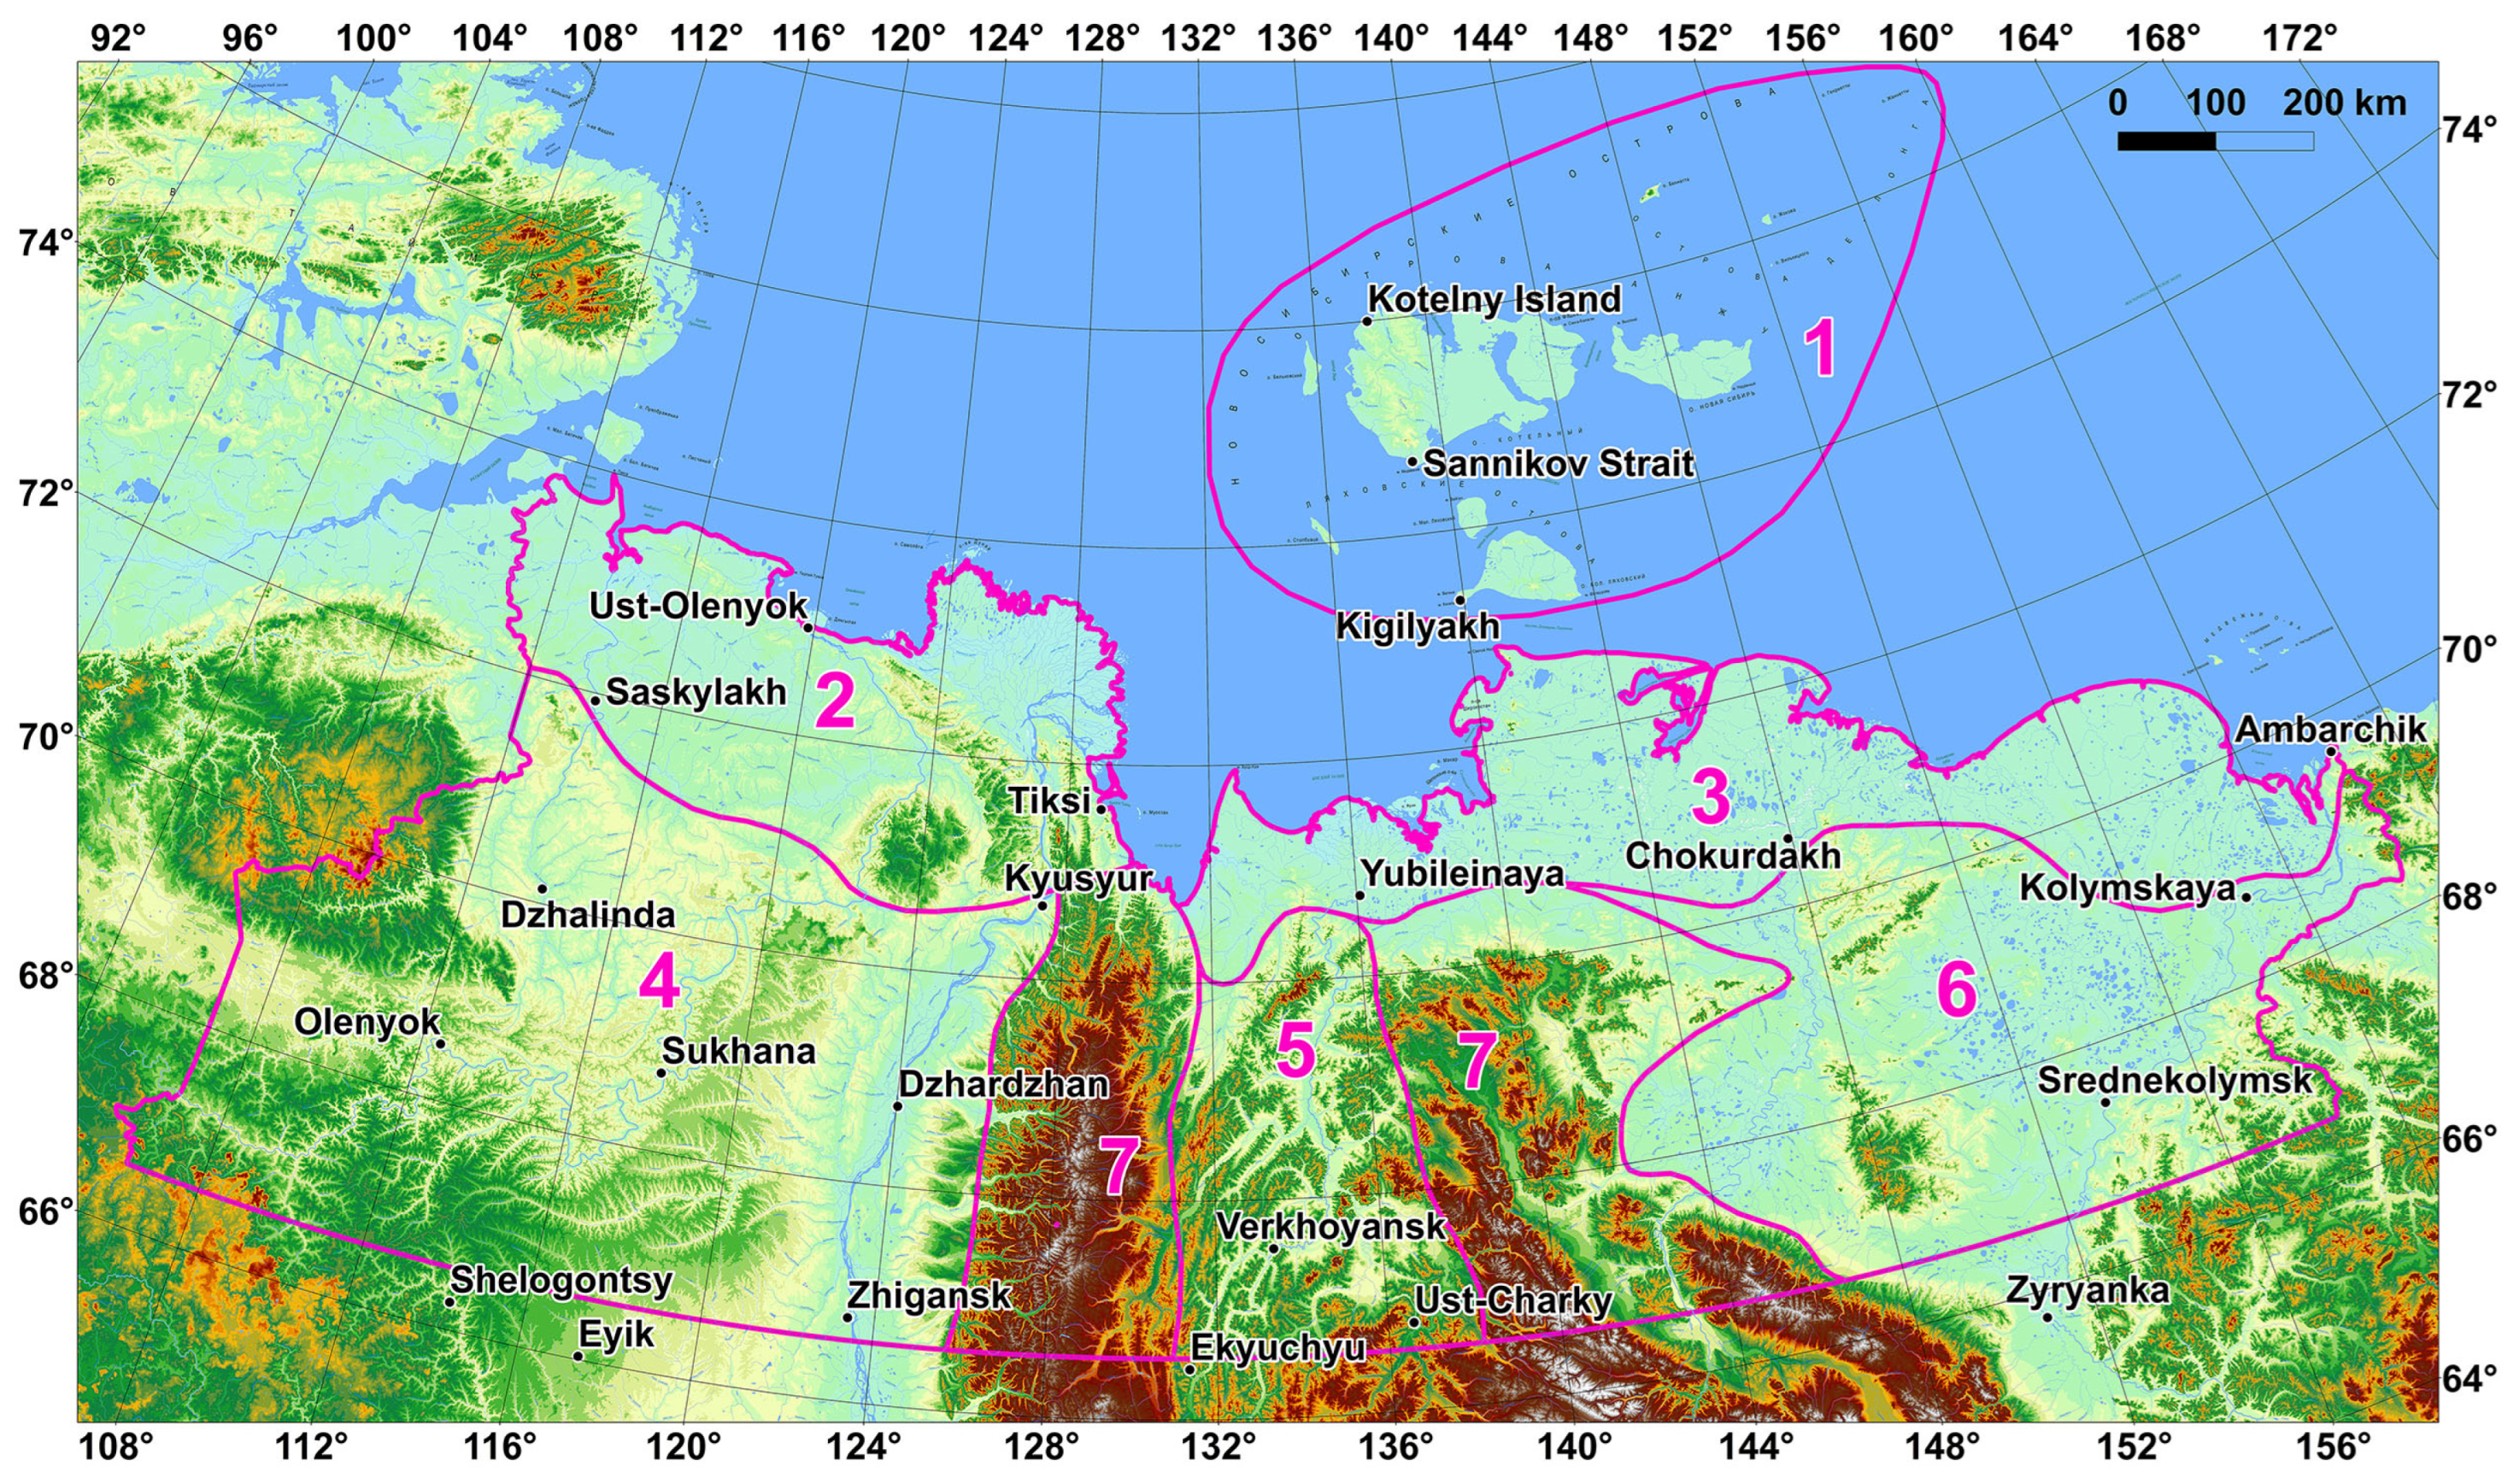
Figure 1. Permafrost–climatic zoning of Yakutia. Arctic regions: 1—New Siberian Islands; 2—Lena–Anabar; 3—Yana–Kolyma. Subarctic regions: 4—Lena–Olenek; 5—Yana; 6—Kolyma–Indigirka; 7—Verkhoyansk–Chersky.
Land 13 02150 g001
Figure 2. A generalized model for deviations in mean annual air temperature in the Arctic zone of Yakutia. Thin blue line—the mean deviation for all weather stations; thick brown line—the 5-year moving average deviations for all weather stations; thick red line—the trend of the mean deviation for 1965–2023; thick, intermittent purple line—the mean deviation of all weather stations in different periods (1965–1987, 1988–2004, and 2005–2023).
Land 13 02150 g002
Figure 3. The fluctuations in the deviations of the mean annual air temperature according to 5-year moving averages across various areas in the Arctic zone of Yakutia. Thin blue line—New Siberian Islands; thin brown line—Lena–Anabar region; thin gray line—Yana; thick red line—the total mean deviation for the Arctic zone in Yakutia.
Land 13 02150 g003
Figure 4. A generalized model of deviations in the thawing index in the Arctic zone of Yakutia. Thin blue line—the mean deviation for all weather stations; thick brown line—5-year moving average deviation for all weather stations; thick red line—the trend of mean deviation for 1965–2023; thick intermittent purple line—the mean deviation for all weather stations in different periods (1965–1987, 1988–2004, and 2005–2023).
Land 13 02150 g004
Figure 5. The deviations in the thawing index according to the 5-year moving average across various areas in the Arctic zone of Yakutia. Thin blue line—Novosibirsk islands; thin brown line—Lena–Anabar; thin gray line—Yana–Kolyma region; thick red line—the total mean deviation for the Arctic zone in Yakutia.
Land 13 02150 g005
Figure 6. A generalized model of freezing index deviation in the Arctic zone of Yakutia. Thin blue line—the mean deviation for all weather stations; thick brown line—the 5-year moving average deviation for all weather stations; thick red line—the mean deviation trend for 1965–2023; thick, intermittent purple line—the mean deviation for all weather stations in different periods (1965–1987, 1988–2004, and 2005–2023).
Land 13 02150 g006
Figure 7. Deviations in the freezing index according to 5-year moving averages across various areas in the Arctic zone of Yakutia. Thin blue—New Siberian Islands; thin brown line—Lena–Anabar; thin gray line—Yana–Kolyma regions; thick red line—the total mean deviation for the Arctic zone in Yakutia.
Land 13 02150 g007
Figure 8. A generalized model for deviations in the mean annual air temperature in the Subarctic zone of Yakutia. Thin blue line—mean deviation for all weather stations; thick brown line—5-year moving average deviations for all weather stations; thick red line—the mean deviation trend for 1965–2023; thick, intermittent purple line—the mean deviation for all weather stations in different periods (1965–1987, 1988–2004, and 2005–2023).
Land 13 02150 g008
Figure 9. Deviations in the mean annual air temperature according to 5-year moving averages across various areas in the Subarctic zone of Yakutia. Thin blue line—Kolyma–Indigirka region; thin brown line—Lena–Olenek region; thin green line—Yana region; thick red line—the general average deviation for the sparse forest zone in Yakutia.
Land 13 02150 g009
Figure 10. A generalized model showing deviations in the thawing index in the Subarctic zone of Yakutia. Thin blue line—the mean deviation for all weather stations; thick brown line—the 5-year moving average deviation for all weather stations; thick red line—the trend of the mean deviation for 1965–2023; thick, intermittent purple line—the mean deviation for all weather stations in different periods (1965–1987, 1988–2004, and 2005–2023).
Land 13 02150 g010
Figure 11. Fluctuations in the deviations of the thawing index according to 5-year moving averages across various areas in the Subarctic zone of Yakutia. Thin blue line—Kolyma–Indigirka region; thin brown line—Lena–Olenek region; thin green line—Yana region; thick red line—the general average deviation for the Subarctic zone in Yakutia.
Land 13 02150 g011
Figure 12. A generalized model of freezing index deviation in the Arctic zone of Yakutia. Thin blue line—the mean deviation for all weather stations; thick brown line—the 5-year moving mean deviation for all weather stations; thick red line—the mean deviation trend for 1965–2023; thick, intermittent purple line—the mean deviation for all weather stations in different periods (1965–1987, 1988–2004, and 2005–2023).
Land 13 02150 g012
Figure 13. Freezing index deviations across various regions in the Subarctic zone of Yakutia according to a 5-year moving average. Thin blue line—Kolyma–Indigirka region; thin brown line—Lena–Olenek region; thin green line—Yana region; thick red line—the general average deviation for the northern sparse forest zone in Yakutia.
Land 13 02150 g013
Figure 14. The annual temperature of the permafrost fluctuates at depths of 3 m, 10 m, and 30 m in the foothills of the eastern slope of the Primorsky Ridge near Tiksi town. MAGT—mean annual ground temperature.
Land 13 02150 g014
Figure 15. The mean annual temperature changes at a depth of 1.6 m at the Ust-Moma, Olenek and Verkhoyansk weather stations. Circle in line—mean annual temperature; intermittent line—trend.
Land 13 02150 g015
Figure 16. The mean annual temperature changes at a depth of 1.6 m at the Delyankir weather station.
Land 13 02150 g016
Figure 17. Interannual variability of active layer thickness in the Arctic zone of Yakutia in 1996–2023 (CALM data).
Land 13 02150 g017
Figure 18. Thermokarst with high-centered polygons in Tiksi area, near the Melnikov Permafrost Institute temperature monitoring site.
Land 13 02150 g018
Figure 19. Thermokarst forms as ice wedges melt with high-centered polygons in Kazachye village near the Yana River (Google Earth Data).
Land 13 02150 g019
Figure 20. High-centered polygons occur on Kotelny Island as a result of ice wedge thawing (Google Earth Data).
Land 13 02150 g020
Table 1. Meteorological station information and measurement data.
RegionWeather StationLatitude, Longitude ASL, m.Air TemperaturePrecipitation
New SiberianKotelny Island76°00′, 137°52′ 121965–20231966–2023
IslandsSannikov Strait74°40′, 138°54′161965–20231983–1990,
2011–2023
Kigilyakh 73°20′, 139°52′261965–20231966–1992, 2001–2003, 2005–2023
Lena–AnabarSaskylakh71°58′, 114°05′161965–20231966–2023
Ust-Olenek73°00′, 119°52′161965–20231973–1981, 1983–1990, 2008–2018
Tiksi71°35′, 128°55′61965–20231966–2023
Lena–OlenyokDzhalinda70°08′, 113°58′611965–20231966–2023
Olenyok68°31′, 112°29′1951965–20231966–2023
Kyusyur70°41′, 127°24′301965–20231966–2023
Sukhana68°37′, 118°20′781965–20231966–2023
Shelagontsy66°15′, 114°17′2331965–20231966–2023
Eyik66°02′, 117°24′3041965–20231966–2023
Dzhardzhan68°44′, 124°00′381965–20231966–2023
Zhigansk66°46′, 123°24′881965–20231966–2023
YanaVerkhoyansk67°34′, 133°24′1361965–20231966–2023
Ekyuchyu66°34′, 131°36′1991965–20232011–2023
Ust-Charky66°48′, 136°41′2741965–20231966–2023
Iema65°18′, 135°48′6751965–20231966–1974, 1977–1992, 1914–2023
YanaSredne-kolymsk67°27′, 153°43′201965–20231966–2023
Zyryanka65°44′, 150°54′411965–20231966–2023
Kolymskaya68°44′,
158°43′
91965–20231973–1981,
2007–2023
Table 2. The mean annual air temperatures at weather stations in the tundra zone of Yakutia.
RegionWeather StationMean for
1965–2023
Mean for
1965–1987
Mean for
1988–2004
Mean for
2005–2023
New SiberianKotelny Island−14.0 ± 1.6−15.1 ± 0.9−14.6 ± 1.1−12.1 ± 0.9
IslandsSannikov Strait−14.4 ± 1.5−15.6 ± 0.9−14.8 ± 1.1−12.7 ± 0.8
Kigilyakh −13.8 ± 1.4−14.9 ± 0.9−14.0 ± 1.0−12.2 ± 0.7
Lena–AnabarSaskylakh−13.8 ± 1.7−14.8 ± 1.4−14.3 ± 1.0−12.1 ± 1.2
Ust-Olenek−13.5 ± 1.6−14.6 ± 1.1−14.0 ± 1.3−11.8 ± 1.1
Tiksi−12.5 ± 1.7−13.5 ± 1.3−12.8 ± 1.3−11.1 ± 1.0
Yana–KolymaYubileinaya−13.1 ± 1.4−14.0 ± 1.2−13.1 ± 1.4−11.9 ± 0.9
Chokurdakh−13.3 ± 1.3−14.3 ± 0.8−13.5 ± 1.0−11.8 ± 0.8
Ambarchik−11.8 ± 1.5−12.9 ± 0.8−12.4 ± 1.2−10.3 ± 1.1
Table 3. The thawing index at weather stations in the Arctic zone of Yakutia, °C days.
RegionWeather Station Mean for
1965–2023
Mean for
1965–1987
Mean for
1988–2004
Mean for
2005–2023
New Siberian Islands *Kotelny Island198 ± 119145 ± 181161 ± 106294 ± 117
Kigilyakh256 ± 12480 ± 91106 ± 116239 ± 102
Lena–AnabarSaskylakh858 ± 165784 ± 109809 ± 161990 ± 153
Ust-Olenek597 ± 196550 ± 112465 ± 187772 ± 169
Tiksi656 ± 162566 ± 144623 ± 139793 ± 114
Yana–KolymaYubileinaya929 ± 167838 ± 146913 ± 1601050 ± 127
Chokurdakh795 ± 156718 ± 148775 ± 143907 ± 117
Ambarchik600 ± 171519 ± 154581 ± 147716 ± 157
Note: * due to insufficient correlation, the data from the weather station in the Sannikov Strait were not included in the assessment.
Table 4. The thawing index at weather stations in the Arctic zone of Yakutia, °C days.
RegionWeather Station Mean for
1965–2023
Mean for
1965–1987
Mean for
1988–2004
Mean for
2005–2023
New Siberian IslandsKotelny Island−5345 ± 491−5692 ± 289−5526 ± 269−4763 ± 286
Sannikov Strait−5497 ± 481−5870 ± 271−5616 ± 311−4940 ± 253
Kigilyakh−5394 ± 451−5736 ± 286−5522 ± 234−4864 ± 240
Lena–AnabarSaskylakh−5935 ± 496−6211 ± 461−6075 ± 346−5476 ± 320
Ust-Olenek−5569 ± 455−5896 ± 340−5626 ± 358−5122 ± 270
Tiksi−5272 ± 459−5535 ± 408−5346 ± 396−4887 ± 312
Yana–KolymaYubileinaya−5742 ± 418−5966 ± 350−5785 ± 421−5440 ± 323
Chokurdakh−5672 ± 391−5946 ± 243−5750 ± 320−5270 ± 255
Ambarchik−4936 ± 458−5237 ± 260−5000 ± 389−4515 ± 404
Table 5. The annual precipitation in Yakutia’s Arctic weather stations.
RegionWeather Station Mean for
1965–2023
Mean for
1965–1987
Mean for
1988–2004
Mean for
2005–2023
New Siberian Island Kotelny Island162.4 ± 33.4169.0 ± 36.8158.4 ± 30.2158.4 ± 32.1
Lena–AnabarSaskylakh197.7 ± 60.5214.9 ± 55.7168.4 ± 41.3200.7 ± 70.6
Yana–KolymaYubileinaya214.7 ± 65.4237.2 ± 54.4229.7 ± 35.0185.2 ± 76.5
Chokurdakh208.7 ± 63.7224.8 ± 65.6219.7 ± 44.8184.0 ± 67.9
Ambarchik150.1 ± 57.3169.5 ± 51.0138.7 ± 66.7137.7 ± 54.3
Table 6. The mean annual air temperatures at weather stations in the Subarctic zone of Yakutia.
RegionWeather Station Mean for
1965–2023
Mean for
1965–1987
Mean for
1988–2004
Mean for
2005–2023
Lena–OlenekDzhalinda−13.0 ± 1.7−14.1 ± 1.4−13.3 ± 0.9−11.3 ± 1.1
Olenyok−11.4 ± 1.6−12.3 ± 1.6−11.7 ± 0.9−9.9 ± 1.0
Kyusyur−13.0 ± 1.4−13.9 ± 1.2−13.3 ± 1.0−11.6 ± 0.8
Sukhana−12.9 ± 1.6−14.0 ± 1.5−13.2 ± 0.9−11.4 ± 1.1
Shelagontsy−12.3 ± 1.6−13.3 ± 1.4−12.7 ± 0.8−10.8 ± 1.1
Eyik−10.9 ± 1.5−11.9 ± 1.4−11.1 ± 0.8−9.5 ± 0.9
Dzhardzhan−11.8 ± 1.3−12.6 ± 1.3−11.9 ± 0.9−10.6 ± 1.0
Zhigansk−11.0 ± 1.3−11.8 ± 1.2−11.1 ± 0.8−10.0 ± 1.1
YanaVerkhoyansk−14.4 ± 1.3−15.4 ± 1.1−14.3 ± 1.1−13.2 ± 0.7
Ekyuchyu−14.2 ± 1.3−15.1 ± 1.3−14.3 ± 0.9−13.0 ± 0.7
Ust-Charky−13.1 ± 1.1−13.7 ± 1.1−13.1 ± 1.0−12.3 ± 0.6
Iema−15.3 ± 1.2−16.1 ± 1.1−15.2 ± 0.8−14.3 ± 0.6
Kolyma–IndigirkaSrednekolymsk−11.3 ± 1.4−12.5 ± 0.8−11.5 ± 1.1−9.8 ± 0.8
Zyryanka−10.5 ± 1.1−11.3 ± 0.7−10.7 ± 1.0−9.4 ± 0.7
Kolymskaya−12.4 ± 1.6−13.6 ± 0.8−12.7 ± 1.3−10.8 ± 1.0
Table 7. The thawing index at weather stations in the Subarctic zone of Yakutia.
RegionWeather Station Mean for
1965–2023
Mean for
1965–1987
Mean for
1988–2004
Mean for
2005–2023
Lena–OlenekDzhalinda1108 ± 1721018 ± 1131057 ± 1641261 ± 132
Olenyok1237 ± 1841161 ± 1381164 ± 1731395 ± 141
Kyusyur1043 ± 178963 ± 139977 ± 1571198 ± 137
Sukhana1276 ± 1661194 ± 1191229 ± 1521416 ± 138
Shelagontsy1290 ± 1611204 ± 1221233 ± 1301445 ± 113
Eyik1341 ± 1701249 ± 1361289 ± 1291500 ± 125
Dzhardzhan1291 ± 1681223 ± 1381239 ± 1461421 ± 150
Zhigansk1462 ± 1691384 ± 1341412 ± 1291602 ± 148
YanaVerkhoyansk1472 ± 1631366 ± 1431481 ± 1541591 ± 100
Ekyuchyu1397 ± 1571310 ± 1431387 ± 1311524 ± 125
Ust-Charky1387 ± 1381339 ± 1431347 ± 1251481 ± 91
Iema1172 ± 1481071 ± 1191149 ± 1151314 ± 84
Kolyma–IndigirkaSrednekolymsk1300 ± 1721200 ± 1371285 ± 1631434 ± 130
Zyryanka1530 ± 1531448 ± 1511519 ± 1221640 ± 114
Kolymskaya940 ± 153859 ± 141932 ± 1451044 ± 114
Table 8. The freezing index at weather stations in the Subarctic zone of Yakutia.
RegionWeather Station Mean for
1965–2023
Mean for
1965–1987
Mean for
1988–2004
Mean for
2005–2023
Lena–OlenekDzhalinda−5878 ± 488−6181 ± 454−5969 ± 322−5430 ± 314
Olenyok−5429 ± 481−5695 ± 508−5483 ± 362−5058 ± 296
Kyusyur−5824 ± 384−6049 ± 380−5879 ± 283−5501 ± 241
Sukhana−6037 ± 460−6315 ± 438−6101 ± 321−5645 ± 323
Shelagontsy−5831 ± 479−6101 ± 456−5910 ± 358−5432 ± 340
Eyik−5347 ± 419−5598 ± 406−5376 ± 337−5017 ± 276
Dzhardzhan−5613 ± 395−5834 ± 379−5611 ± 343−5348 ± 309
Zhigansk−5516 ± 377−5716 ± 340−5510 ± 306−5280 ± 363
YanaVerkhoyansk−6768 ± 380−7016 ± 315−6753 ± 371−6482 ± 257
Ekyuchyu−6621 ± 383−6830 ± 365−6660 ± 313−6310 ± 275
Ust-Charky−6186 ± 336−6348 ± 316−6169 ± 340−6015 ± 285
Iema−6786 ± 320−6988 ± 326−6738 ± 262−6596 ± 233
Kolyma–IndigirkaSrednekolymsk−5470 ± 391−5768 ± 240−5526 ± 280−5058 ± 257
Zyryanka−5393 ± 321−5593 ± 256−5444 ± 252−5105 ± 244
Kolymskaya−5519 ± 467−5835 ± 242−5611 ± 373−5054 ± 396
Table 9. Annual precipitation at weather stations in the Subarctic zone of Yakutia.
RegionWeather Station Mean for
1965–2023
Mean for
1965–1987
Mean for
1988–2004
Mean for
2005–2023
Lena–OlenyokDzhalinda262.7 ± 52.7262.2 ± 52.5266.0 ± 59.6260.3 ± 49.0
Olenyok300.9 ± 58.2293.3 ± 60.9312.6 ± 56.7299.2 ± 57.9
Sukhana261.8 ± 47.6240.6 ± 44.5268.2 ± 37.1280.6 ± 51.6
Dzhardzhan315.4 ± 72.9284.8 ± 64.4331.4 ± 59.3336.4 ± 83.6
Zhigansk328.5 ± 70.8278.3 ± 57.7335.4 ± 60.3380.6 ± 53.6
YanaVerkhoyansk193.5 ± 43.2174.4 ± 44.9178.5 ± 35.9192.2 ± 47.2
Ust-Charky226.1 ± 44.6217.8 ± 51.4225.5 ± 40.6236.4 ± 39.4
Kolyma–IndigirkaSrednekolymsk249.2 ± 63.8227.0 ± 54.0244.3 ± 65.6279.3 ± 63.9
Zyryanka289.8 ± 71.9258.5 ± 59.6281.5 ± 58.8333.5 ± 76.7
Table 10. Observation of permafrost temperature trends within a rock ridge at different depths over time.
YearsTrends in Mean Annual Permafrost Temperature (°C/year)
3 m10 m30 m
1993–20240.09410.07690.0414
1993–20040.0156−0.01070.0046
2005–20240.09120.09280.0615
Disclaimer/Publisher’s Note: The statements, opinions and data contained in all publications are solely those of the individual author(s) and contributor(s) and not of MDPI and/or the editor(s). MDPI and/or the editor(s) disclaim responsibility for any injury to people or property resulting from any ideas, methods, instructions or products referred to in the content.