
Forecasting of Grasslands Distribution on Mount Zireia Using Ecological Niche Modeling and Future Climatic Scenarios

 , , , and
Abstract
1. Introduction
2. Materials and Methods
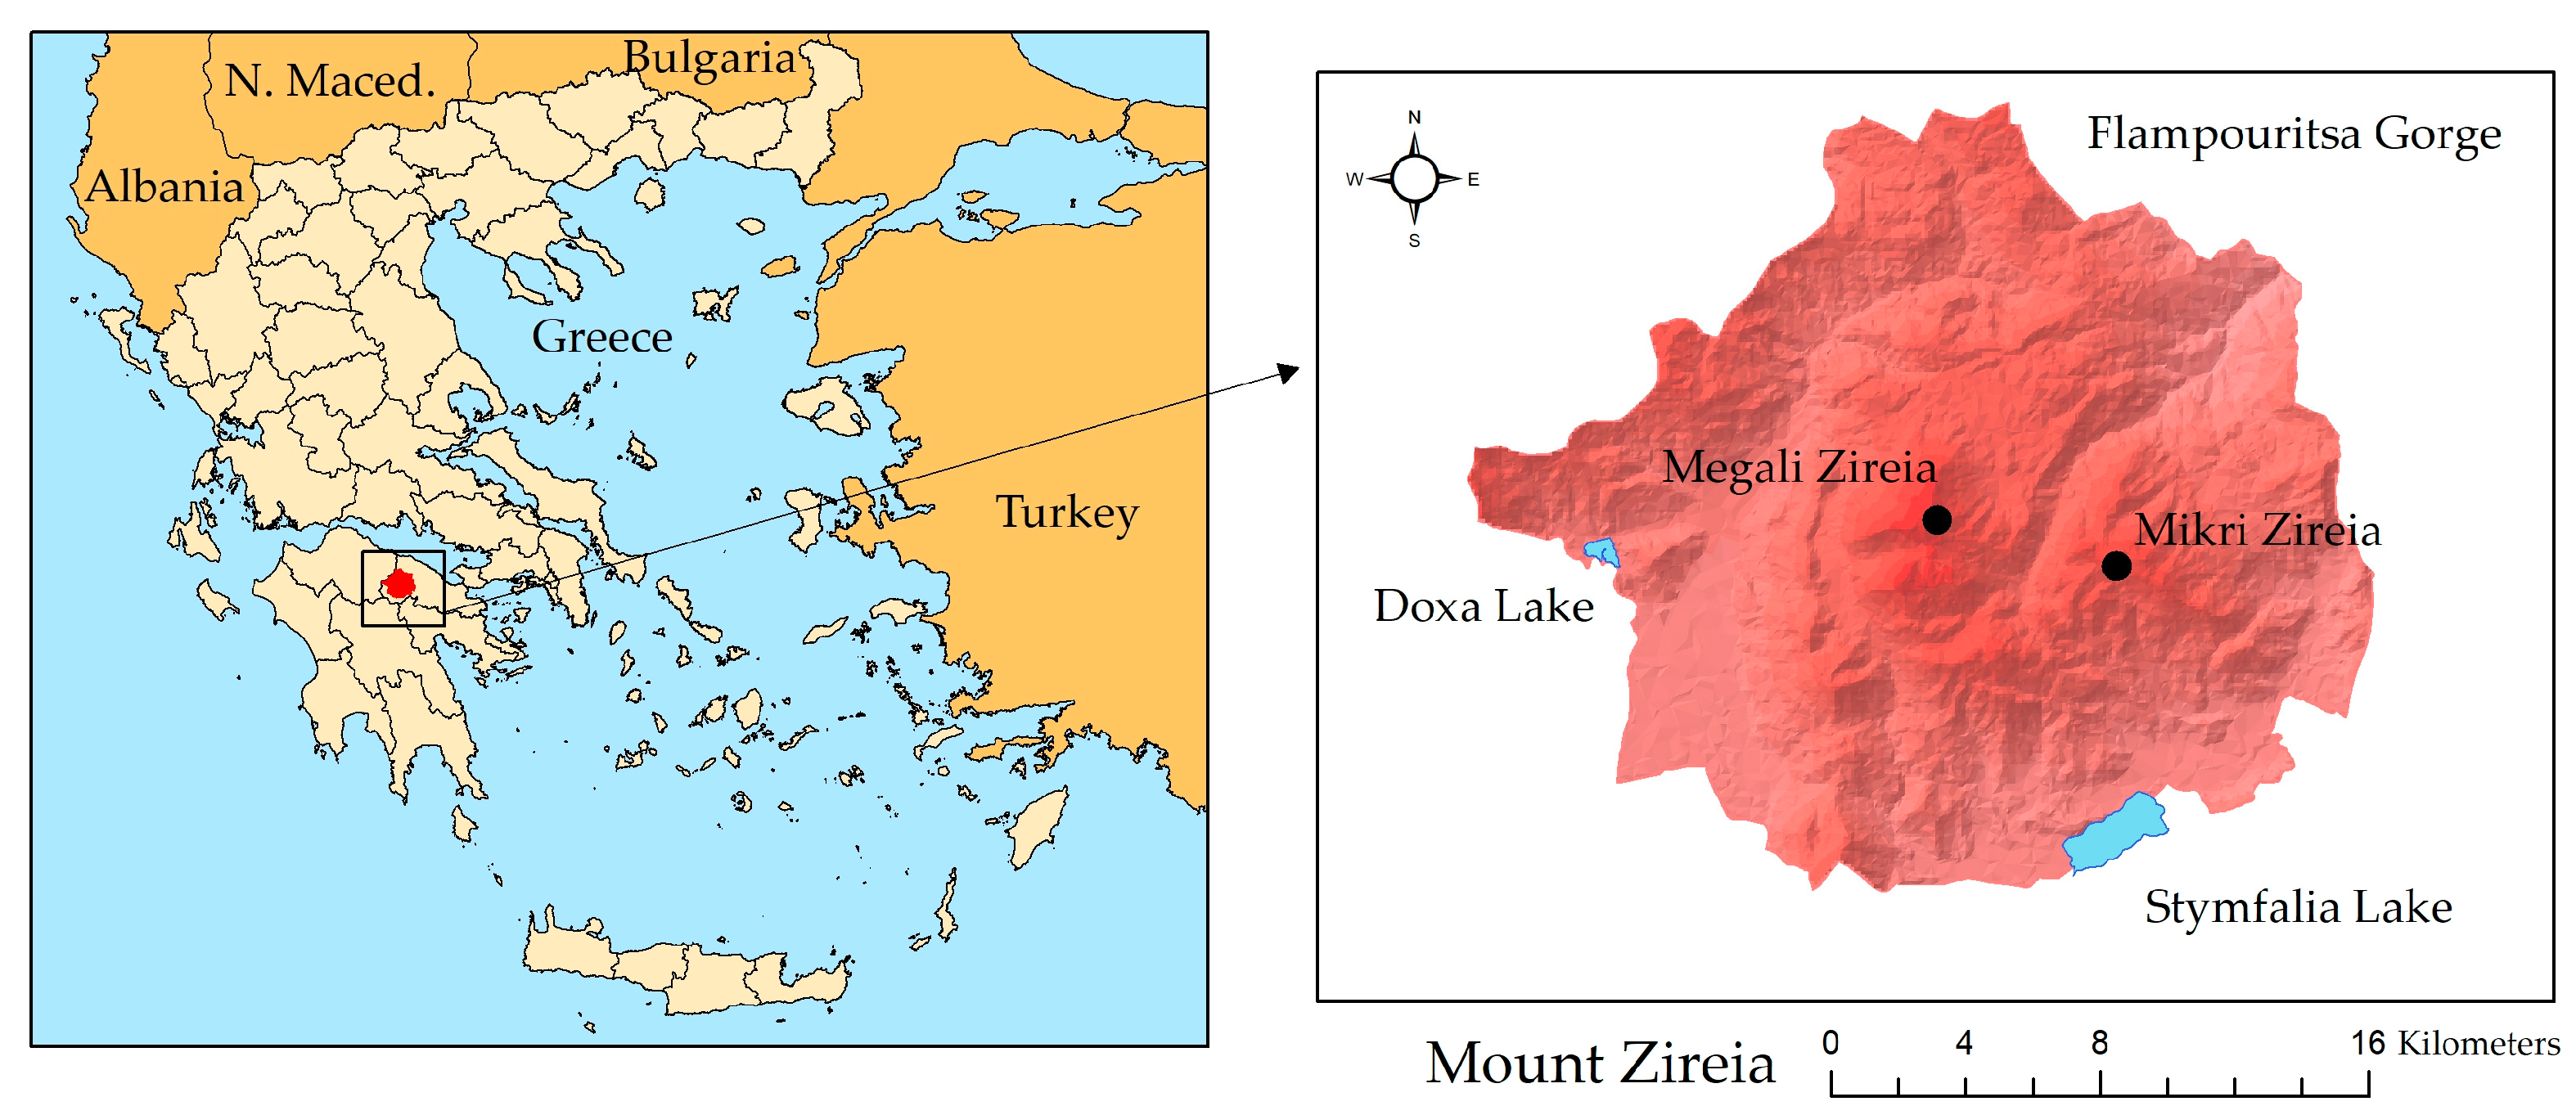
2.1. Study Area
2.2. Current Land Use/Land Cover Data
2.3. Environmental Variables for Model Fitting
2.4. Environmental Variables for Forecasting Model
2.5. MaxEntropy Modeling
3. Results
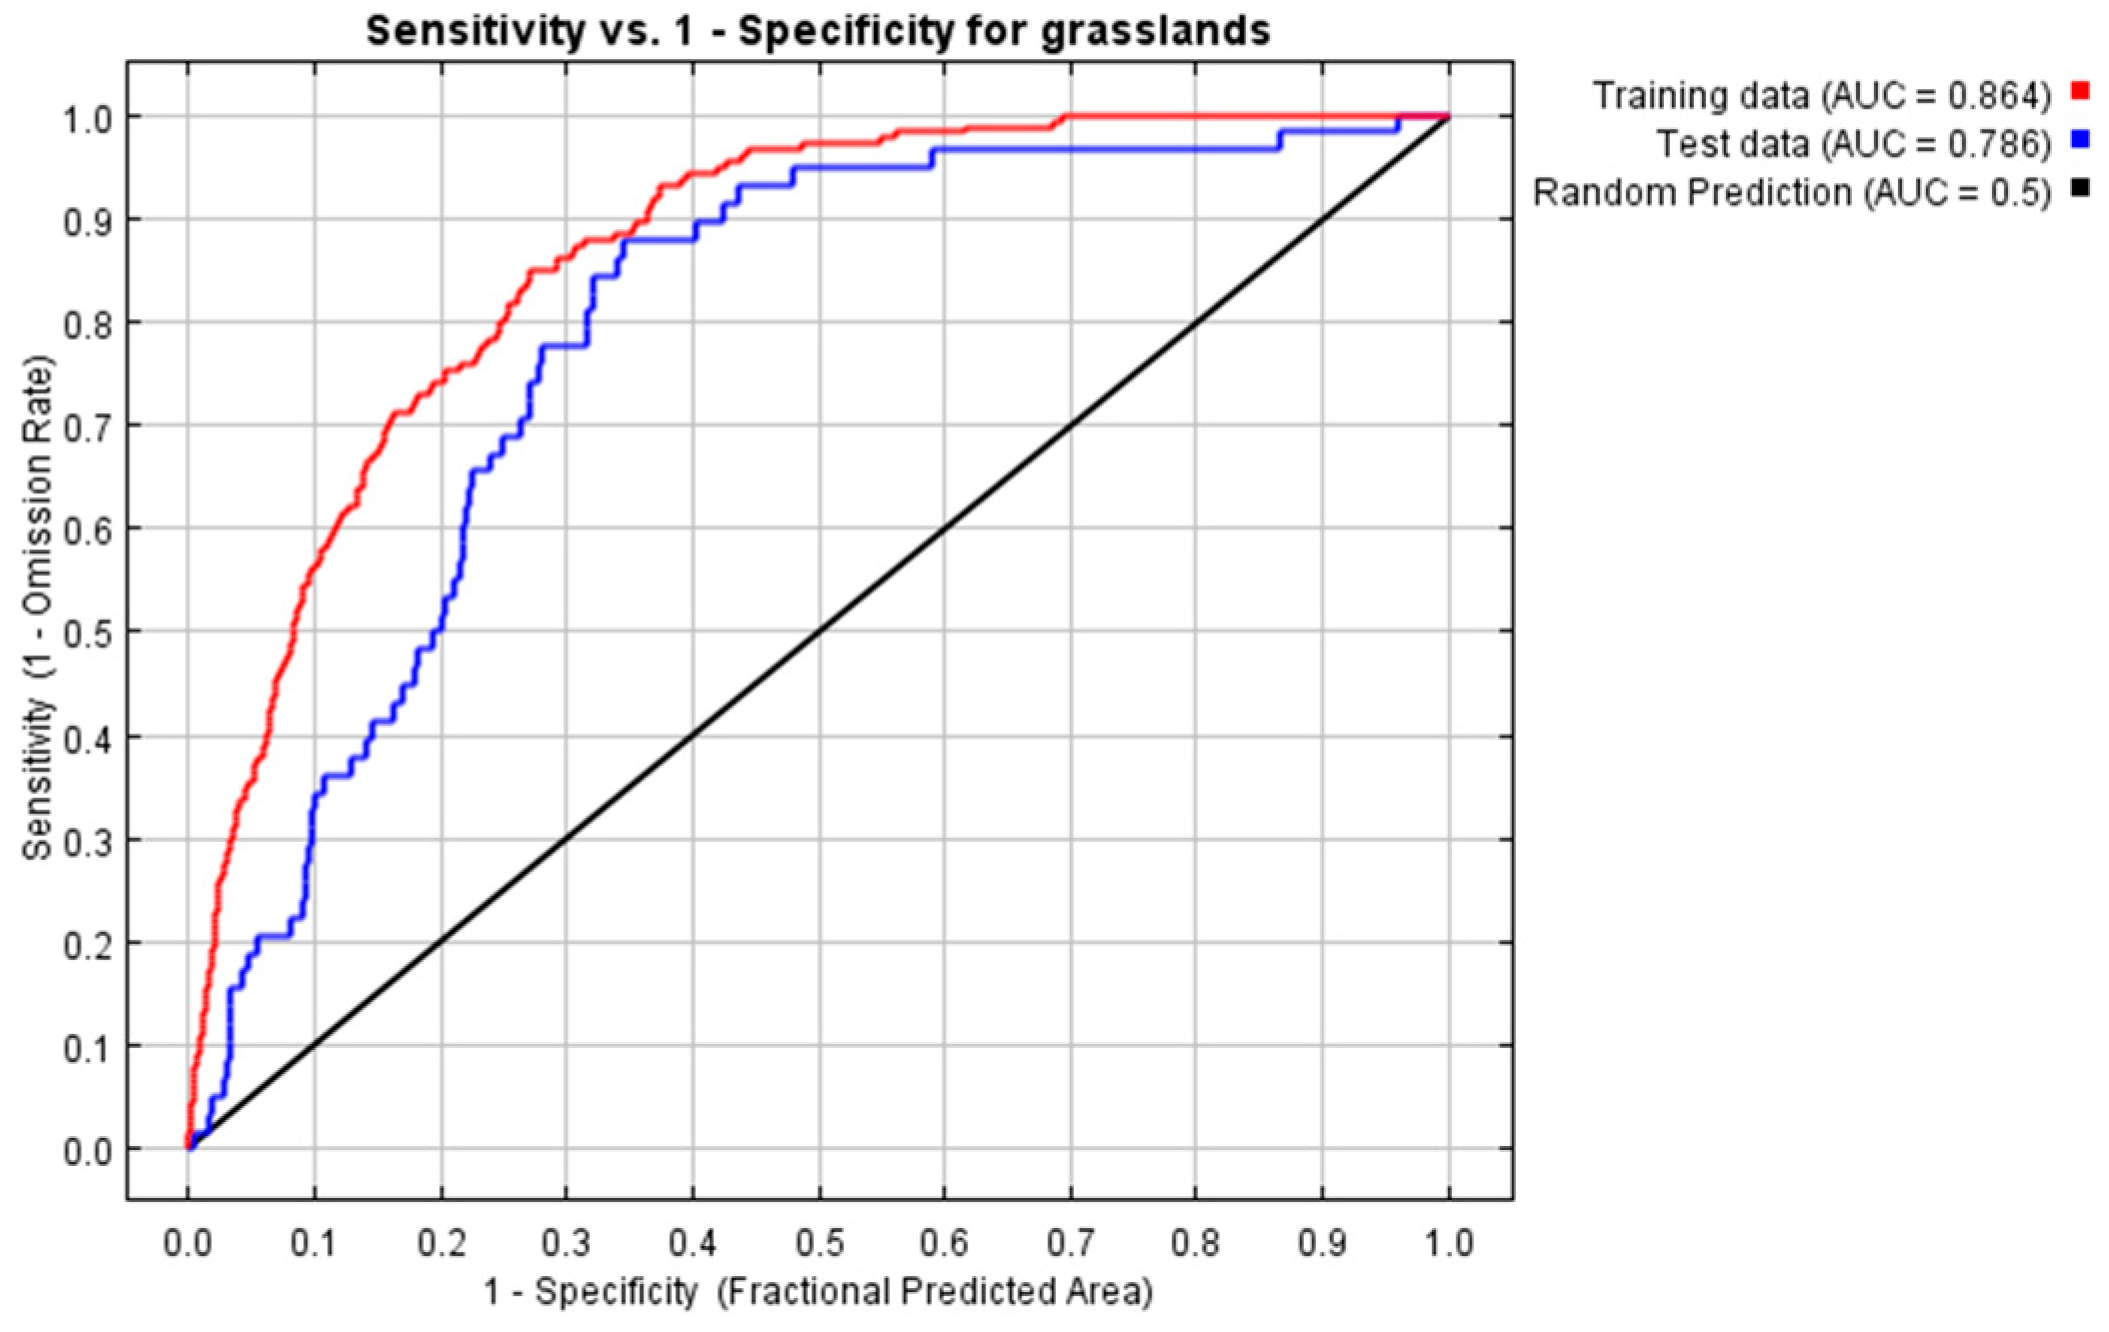
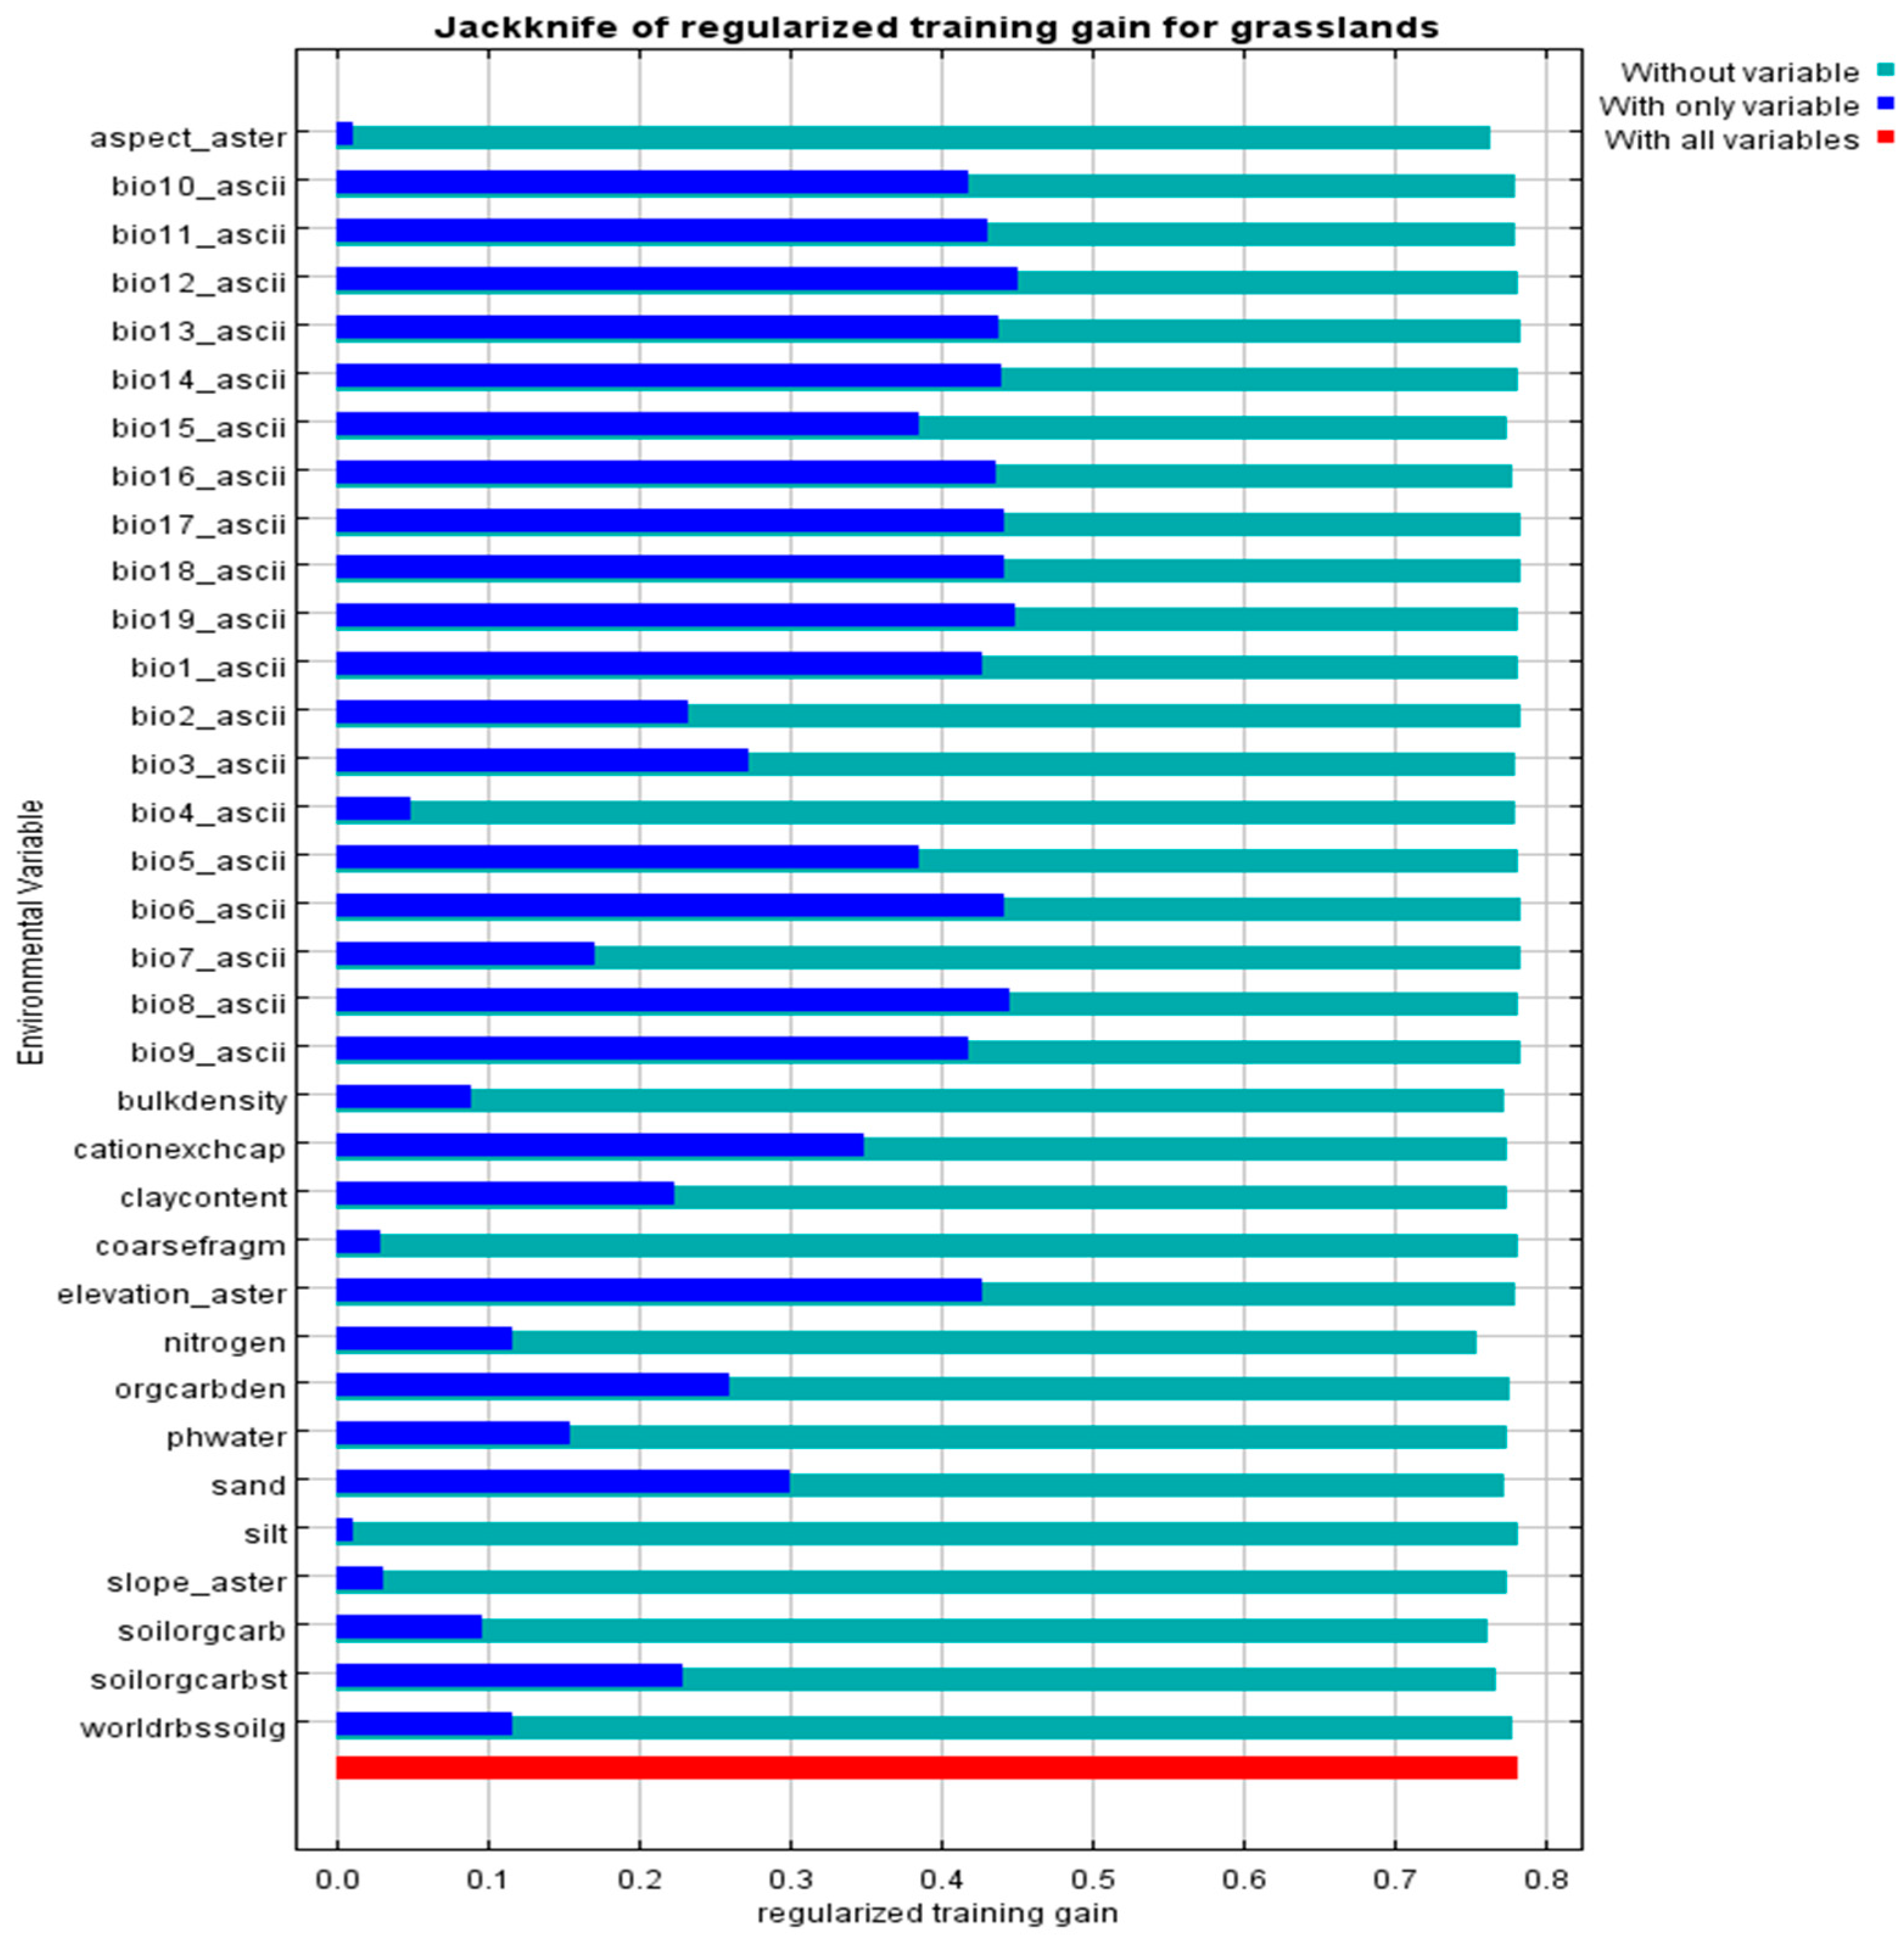
3.1. Evaluations of the Model and Its Importance of Variables Under Current Climatic Conditions
3.2. Model Evaluations and Jackknife Test of Variables for Future Periods Under Different Climate Models and Scenarios
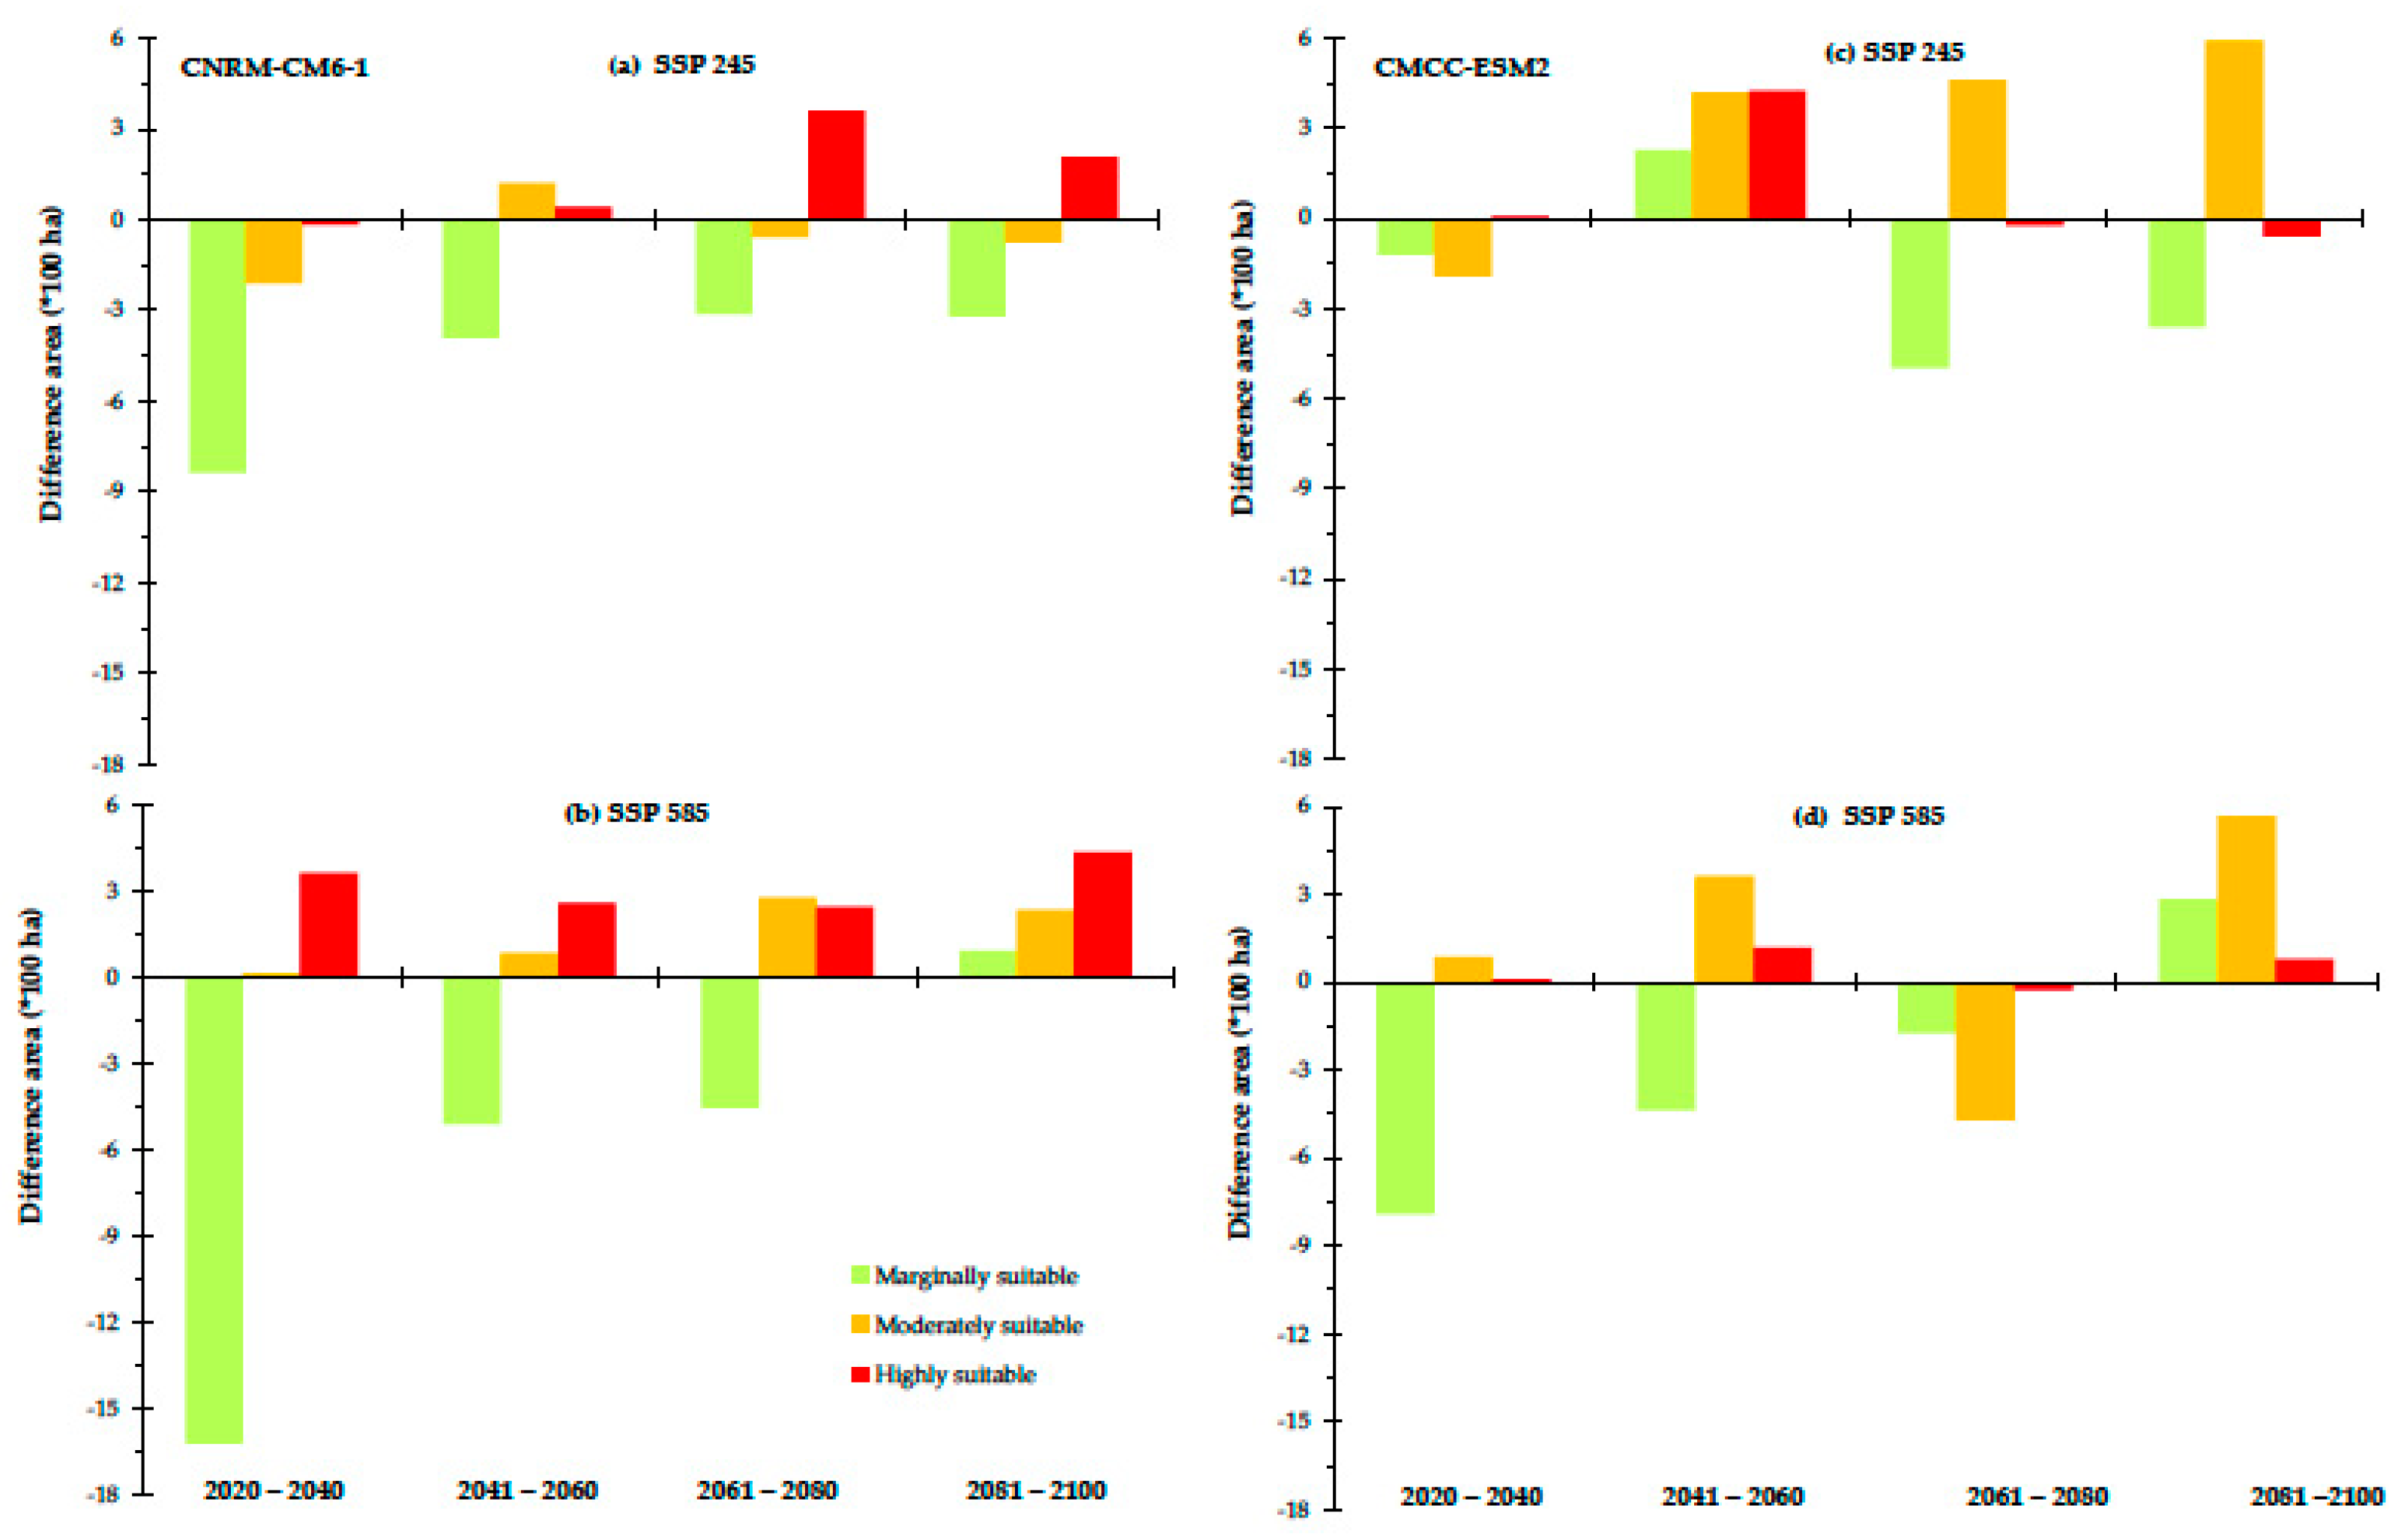
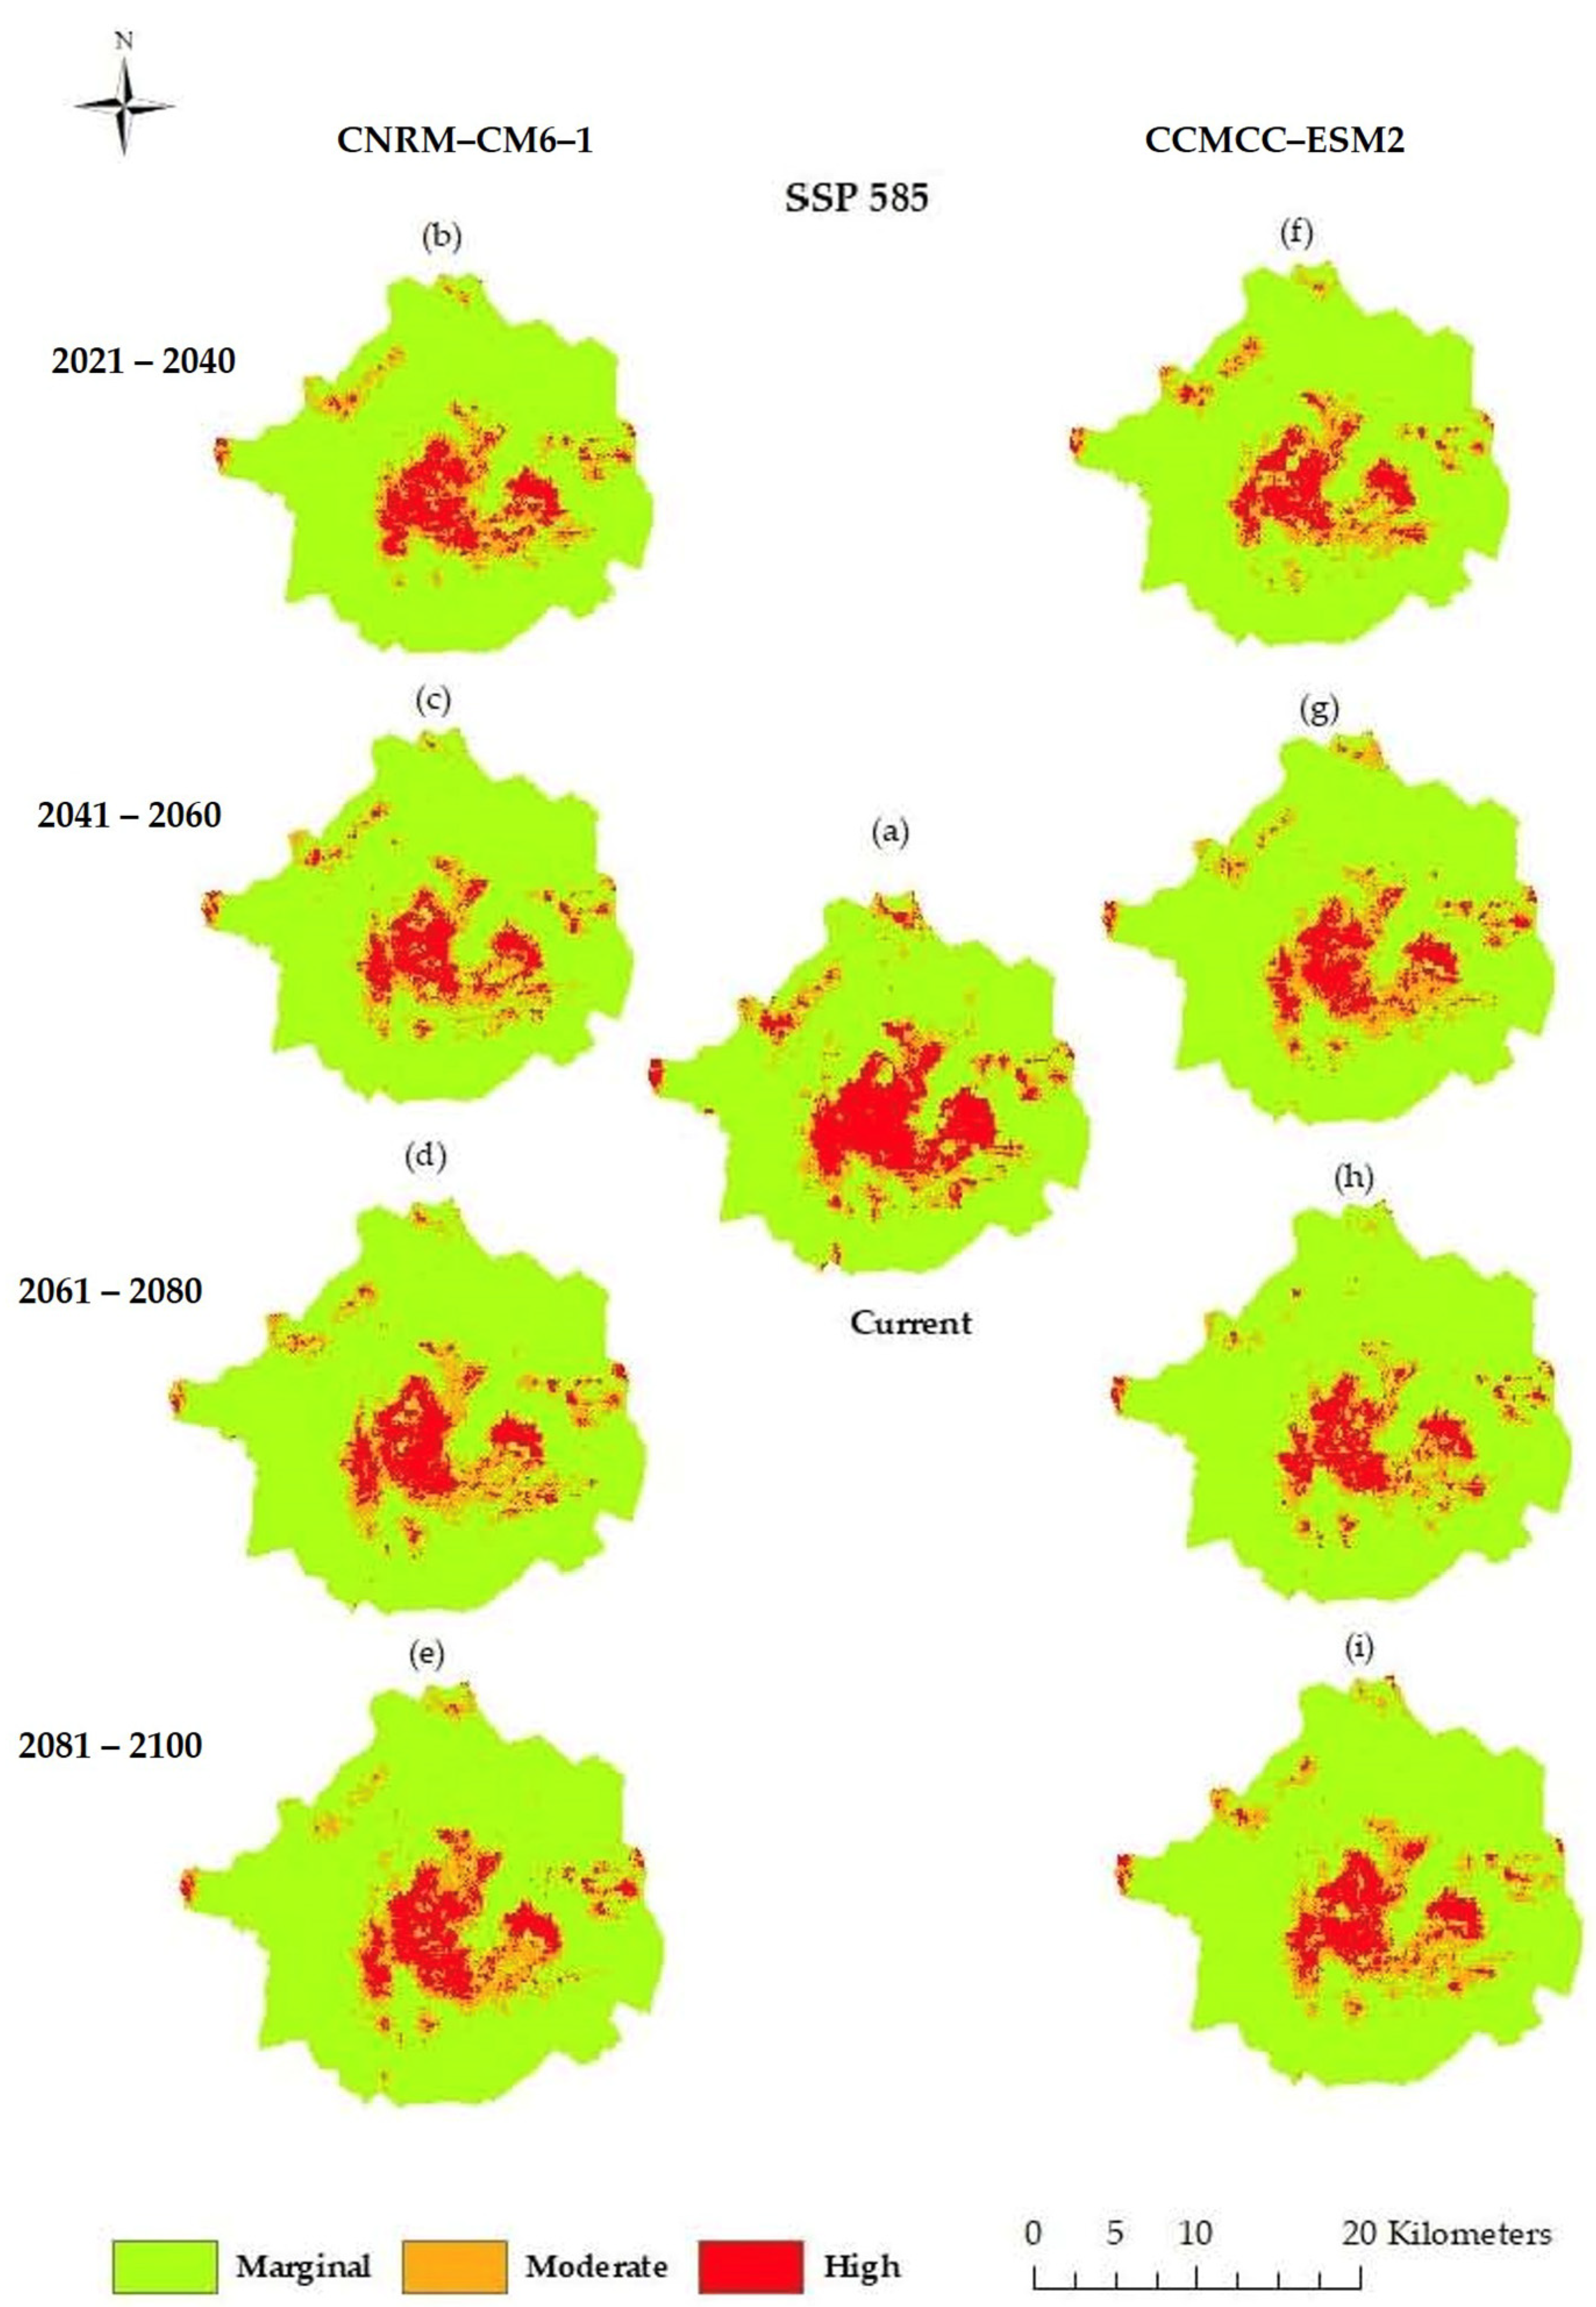
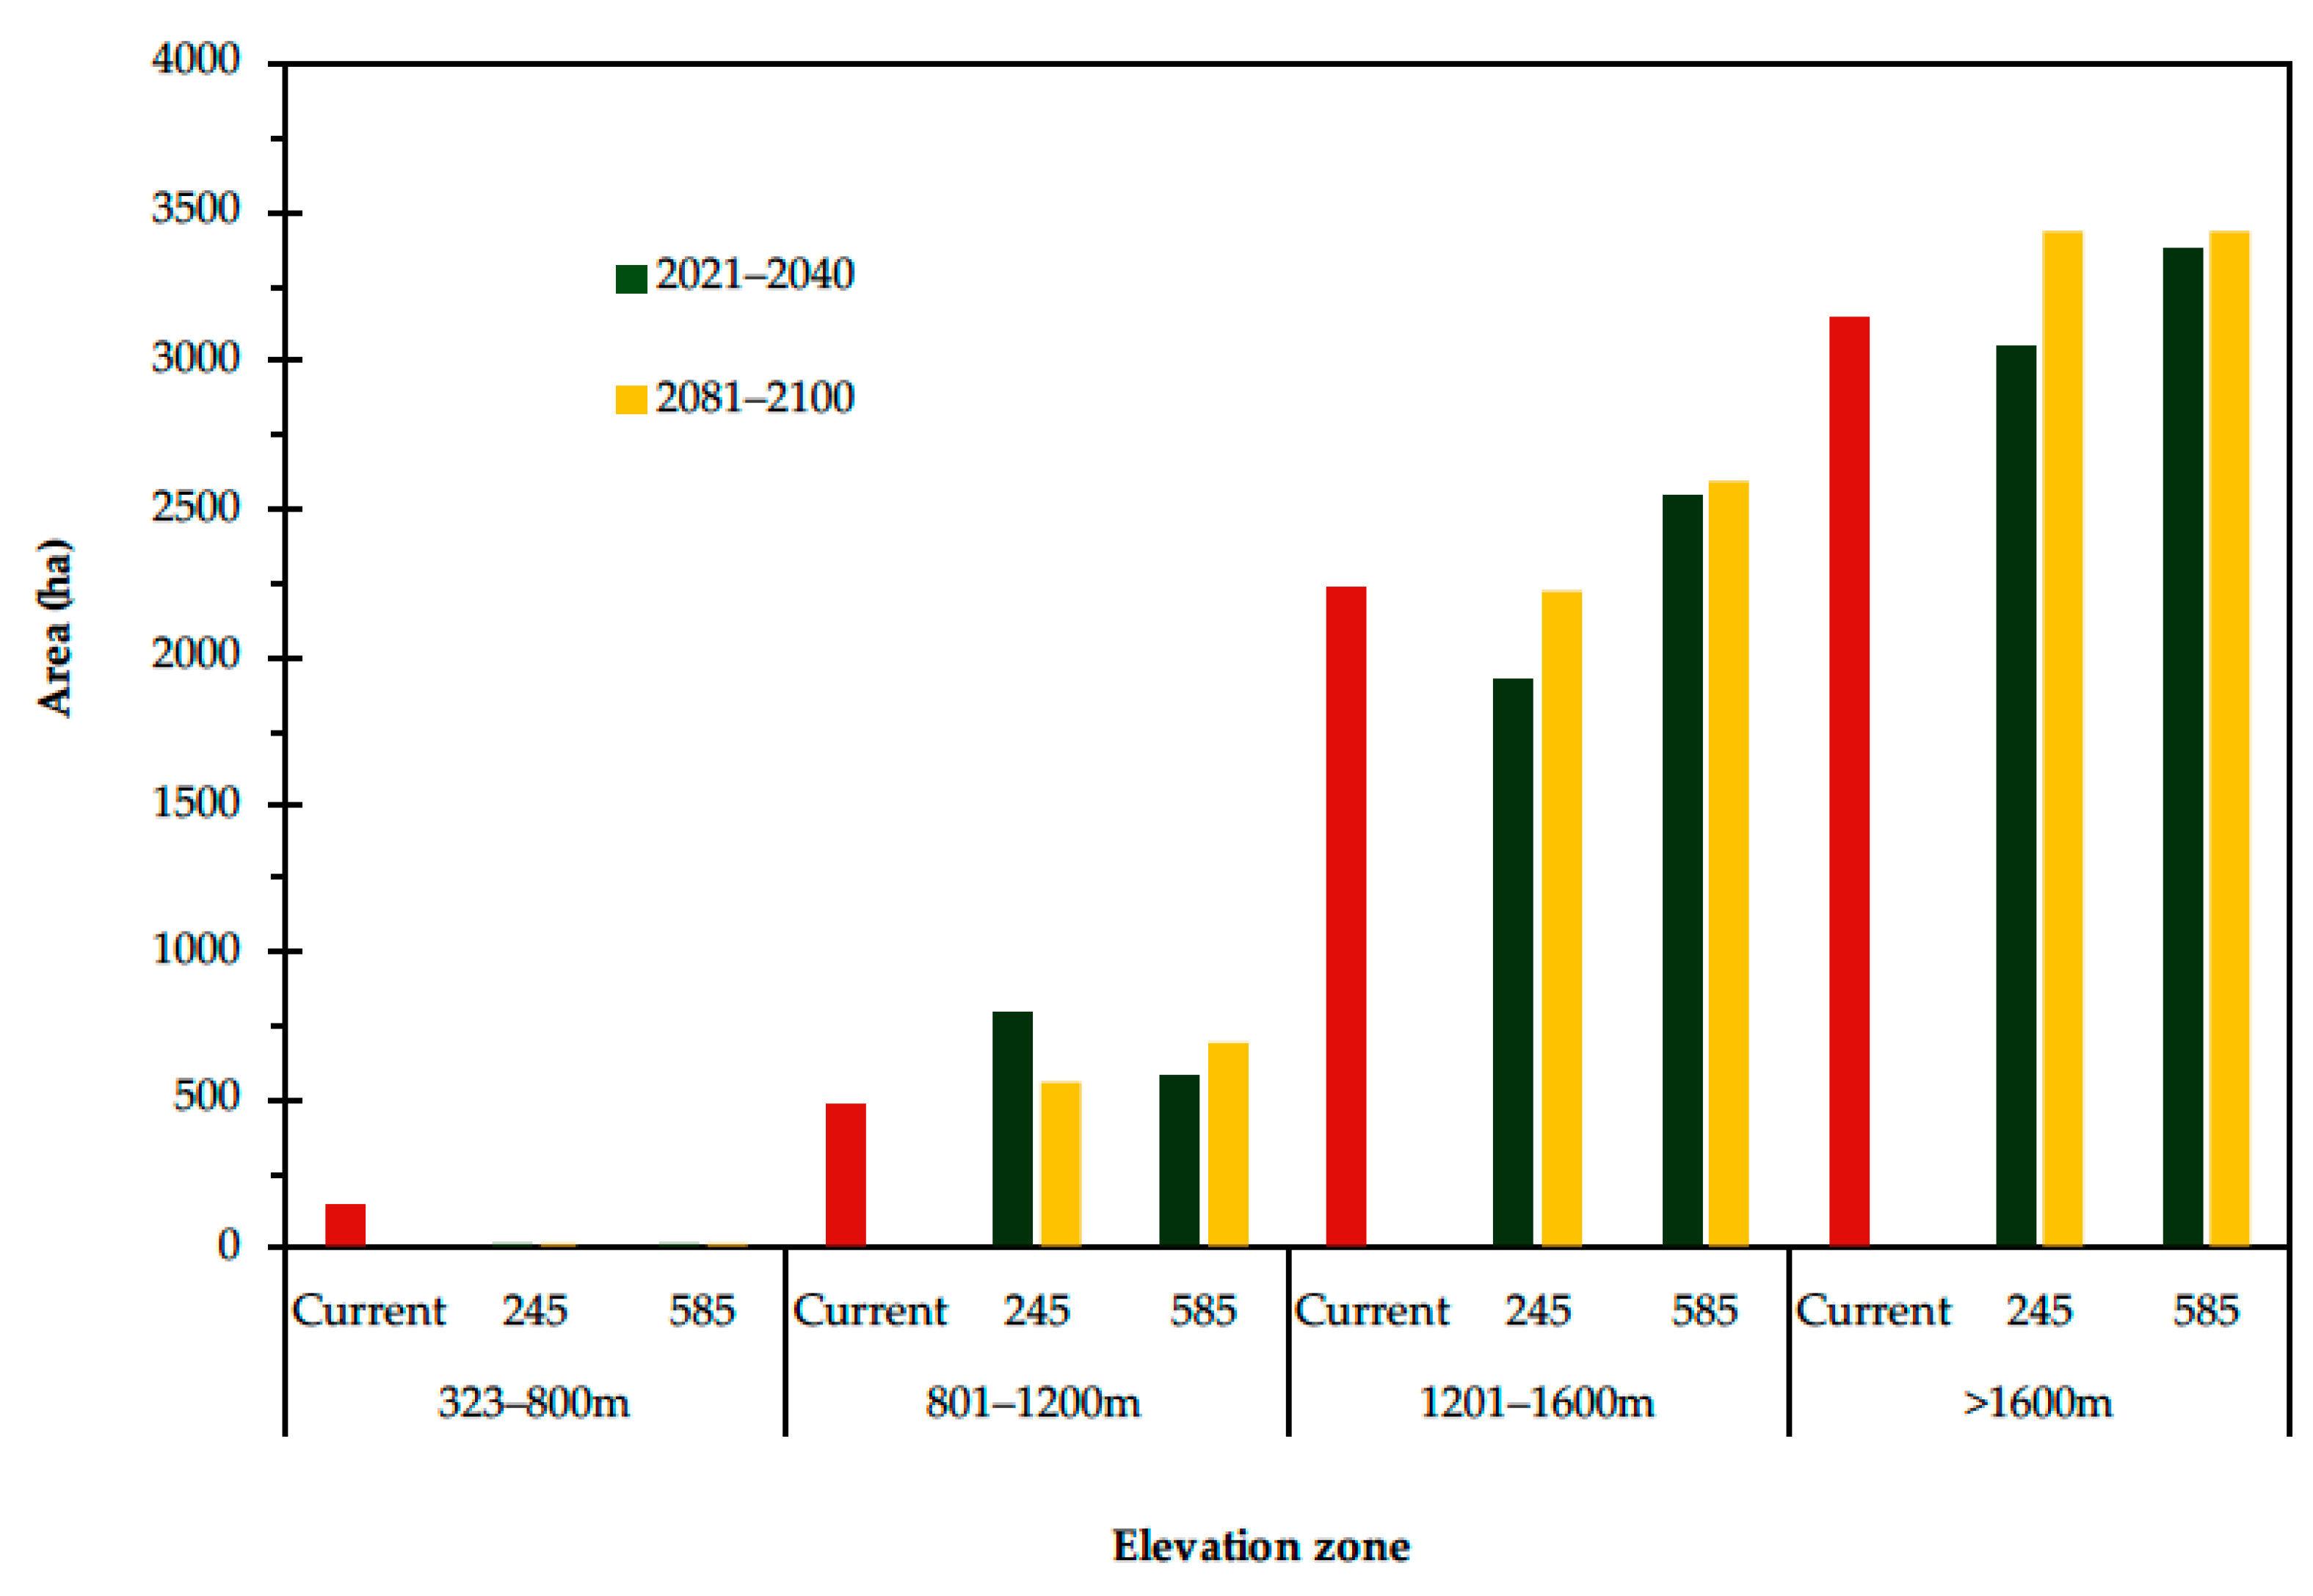
3.3. Current and Future Predictions of the Potential Distribution of Grasslands Using Ecological Niche Modeling
4. Discussion
Supplementary Materials
Author Contributions
Funding
Data Availability Statement
Conflicts of Interest
References
- He, S.; Su, Y.; Shahtahmassebi, A.R.; Huang, L.; Zhou, M.; Gan, M.; Deng, J.; Zhao, G.; Wang, K. Assessing and mapping cultural ecosystem services supply, demand and flow of farmlands in the Hangzhou metropolitan area, China. Sci. Total Environ. 2019, 692, 756–768. [Google Scholar] [CrossRef] [PubMed]
- Lawler, J.J.; Lewis, D.J.; Nelson, E.; Plantinga, A.J.; Polasky, S.; Withey, J.C.; Helmers, D.P.; Martinuzzi, S.; Pennington, D.; Radeloff, V.C. Projected land-use change impacts on ecosystem services in the United States. Proc. Natl. Acad. Sci. USA 2014, 111, 7492–7497. [Google Scholar] [CrossRef]
- Meyfroidt, P.; Lambin, E.F.; Erb, K.H.; Hertel, T.W. Globalization of land use: Distant drivers of land change and geographic displacement of land use. Curr. Opin. Environ. Sustain. 2013, 5, 438–444. [Google Scholar] [CrossRef]
- Mottet, A.; Ladet, S.; Coqué, N.; Gibon, A. Agricultural land-use change and its drivers in mountain landscapes: A case study in the Pyrenees. Agric. Ecosyst. Environ. 2006, 114, 296–310. [Google Scholar] [CrossRef]
- Amici, V.; Marcantonio, M.; La Porta, N.; Rocchini, D. A multi-temporal approach in MaxEnt modelling: A new frontier for land use/land cover change detection. Ecol. Inform. 2017, 40, 40–49. [Google Scholar] [CrossRef]
- Jongman, R.H.G. Homogenisation and fragmentation of the European landscape: Ecological consequences and solutions. Landsc. Urban Plan. 2002, 58, 211–221. [Google Scholar] [CrossRef]
- Zhai, R.; Zhang, C.; Allen, J.M.; Li, W.; Boyer, M.A.; Segerson, K.; Foote, K.E. Predicting land use/cover change in Long Island Sound Watersheds and its effect on invasive species: A case study for glossy buckthorn. Ann. GIS 2018, 24, 83–97. [Google Scholar] [CrossRef]
- Chouvardas, D.; Karatassiou, M.; Stergiou, A.; Chrysanthopoulou, G. Identifying the Spatiotemporal Transitions and Future Development of a Grazed Mediterranean Landscape of South Greece. Land 2022, 11, 2141. [Google Scholar] [CrossRef]
- Polasky, S.; Nelson, E.; Pennington, D.; Johnson, K.A. The Impact of Land-Use Change on Ecosystem Services, Biodiversity and Returns to Landowners: A Case Study in the State of Minnesota. Environ. Resour. Econ. 2011, 48, 219–242. [Google Scholar] [CrossRef]
- Yang, S.; Zhao, W.; Liu, Y.; Wang, S.; Wang, J.; Zhai, R. Influence of land use change on the ecosystem service trade-offs in the ecological restoration area: Dynamics and scenarios in the Yanhe watershed, China. Sci. Total Environ. 2018, 644, 556–566. [Google Scholar] [CrossRef]
- Pelorosso, R.; Leone, A.; Boccia, L. Land cover and land use change in the Italian central Apennines: A comparison of assessment methods. Appl. Geogr. 2009, 29, 35–48. [Google Scholar] [CrossRef]
- Rivas-Martínez, S.; Penas, Á.; Díaz González, T.Ε.; Cantó, P.; del Río, S.; Costa, J.C.; Herrero, L.; Molero, J. Biogeographic Units of the Iberian Peninsula and Baelaric Islands to District Level. A Concise Synopsis. In The Vegetation of the Iberian Peninsula: Volume 1; Loidi, J., Ed.; Springer International Publishing: Cham, Switzerland, 2017; pp. 131–188. [Google Scholar]
- Williams, A.P.; Allen, C.D.; Macalady, A.K.; Griffin, D.; Woodhouse, C.A.; Meko, D.M.; Swetnam, T.W.; Rauscher, S.A.; Seager, R.; Grissino-Mayer, H.D.; et al. Temperature as a potent driver of regional forest drought stress and tree mortality. Nat. Clim. Chang. 2013, 3, 292–297. [Google Scholar] [CrossRef]
- Guisan, A.; Tingley, R.; Baumgartner, J.B.; Naujokaitis-Lewis, I.; Sutcliffe, P.R.; Tulloch, A.I.T.; Regan, T.J.; Brotons, L.; McDonald-Madden, E.; Mantyka-Pringle, C.; et al. Predicting species distributions for conservation decisions. Ecol. Lett. 2013, 16, 1424–1435. [Google Scholar] [CrossRef] [PubMed]
- del Río, S.; Canas, R.; Cano, E.; Cano-Ortiz, A.; Musarella, C.; Pinto-Gomes, C.; Penas, A. Modelling the impacts of climate change on habitat suitability and vulnerability in deciduous forests in Spain. Ecol. Indic. 2021, 131, 108202. [Google Scholar] [CrossRef]
- IPCC. Mitigation of Climate Change. Contribution of Working Group III to the Fifth Assessment Report of the Intergovernmental Panel on Climate Change; Edenhofer, O., Pichs-Madruga, R., Sokona, Y., Farahani, E., Kadner, S., Seyboth, K., Adler, A., Baum, I., Brunner, S., Eickemeier, P., et al., Eds.; Cambridge University Press: Cambridge, NY, USA, 2014. [Google Scholar]
- Worth, J.R.P.; Harrison, P.A.; Williamson, G.J.; Jordan, G.J. Whole range and regional-based ecological niche models predict differing exposure to 21st century climate change in the key cool temperate rainforest tree southern beech (Nothofagus cunninghamii). Austral Ecol. 2015, 40, 126–138. [Google Scholar] [CrossRef]
- IPCC. Climate Change 2021: The Physical Basis. Contribution of Working Group I to the Sixth Assessment Report of the Intergovernmental Panel on Climate Change; Masson-Delmotte, V., Zhai, P., Pirani, A., Connors, S.L., Péan, C., Berger, S., Caud, N., Chen, Y., Goldfarb, L., Gomis, M.I., et al., Eds.; Cambridge University Press: Cambridge, NY, USA, 2021. [Google Scholar]
- Purohit, S.; Rawat, N. MaxEnt modeling to predict the current and future distribution of Clerodendrum infortunatum L. under climate change scenarios in Dehradun district, India. Model. Earth Syst. Environ. 2022, 8, 2051–2063. [Google Scholar] [CrossRef]
- Warren, R.; VanDerWal, J.; Price, J.; Welbergen, J.A.; Atkinson, I.; Ramirez-Villegas, J.; Osborn, T.J.; Jarvis, A.; Shoo, L.P.; Williams, S.E.; et al. Quantifying the benefit of early climate change mitigation in avoiding biodiversity loss. Nat. Clim. Chang. 2013, 3, 678–682. [Google Scholar] [CrossRef]
- Qin, A.; Liu, B.; Guo, Q.; Bussmann, R.W.; Ma, F.; Jian, Z.; Xu, G.; Pei, S. Maxent modeling for predicting impacts of climate change on the potential distribution of Thuja sutchuenensis Franch., an extremely endangered conifer from southwestern China. Glob. Ecol. Conserv. 2017, 10, 139–146. [Google Scholar] [CrossRef]
- Muhammad, R.; Zhang, W.; Abbas, Z.; Guo, F.; Gwiazdzinski, L. Spatiotemporal Change Analysis and Prediction of Future Land Use and Land Cover Changes Using QGIS MOLUSCE Plugin and Remote Sensing Big Data: A Case Study of Linyi, China. Land 2022, 11, 419. [Google Scholar] [CrossRef]
- Phillips, S.J.; Anderson, R.P.; Schapire, R.E. Maximum entropy modeling of species geographic distributions. Ecol. Model. 2006, 190, 231–259. [Google Scholar] [CrossRef]
- Elith, J.; Graham, C.H. Do they? How do they? WHY do they differ? On finding reasons for differing performances of species distribution models. Ecography 2009, 32, 66–77. [Google Scholar] [CrossRef]
- Peterson, A.T.; Papeş, M.; Eaton, M. Transferability and model evaluation in ecological niche modeling: A comparison of GARP and Maxent. Ecography 2007, 30, 550–560. [Google Scholar] [CrossRef]
- Warren, D.L.; Seifert, S.N. Ecological niche modeling in Maxent: The importance of model complexity and the performance of model selection criteria. Ecol. Appl. 2011, 21, 335–342. [Google Scholar] [CrossRef] [PubMed]
- Cao, Y.T.; Lu, Z.P.; Gao, X.Y.; Liu, M.L.; Sa, W.; Liang, J.; Wang, L.; Yin, W.; Shang, Q.H.; Li, Z.H. Maximum Entropy Modeling the Distribution Area of Morchella Dill. ex Pers. Species in China under Changing Climate. Biology 2022, 11, 1027. [Google Scholar] [CrossRef]
- Helmstetter, N.A.; Conway, C.J.; Stevens, B.S.; Goldberg, A.R. Balancing transferability and complexity of species distribution models for rare species conservation. Divers. Distrib. 2021, 27, 95–108. [Google Scholar] [CrossRef]
- Pandit, P.R.; Fulekar, M.H.; Karuna, M.S.L. Effect of salinity stress on growth, lipid productivity, fatty acid composition, and biodiesel properties in Acutodesmus obliquus and Chlorella vulgaris. Environ. Sci. Pollut. Res. Int. 2017, 24, 13437–13451. [Google Scholar] [CrossRef]
- Hemati, T.; Pourebrahim, S.; Monavari, M.; Baghvand, A. Species-specific nature conservation prioritization (a combination of MaxEnt, Co$ting Nature and DINAMICA EGO modeling approaches). Ecol. Model. 2020, 429, 109093. [Google Scholar] [CrossRef]
- Xiong, Q.; Luo, X.; Liang, P.; Xiao, Y.; Xiao, Q.; Sun, H.; Pan, K.; Wang, L.; Li, L.; Pang, X. Fire from policy, human interventions, or biophysical factors? Temporal–spatial patterns of forest fire in southwestern China. For. Ecol. Manag. 2020, 474, 118381. [Google Scholar] [CrossRef]
- Bosso, L.; Ancillotto, L.; Smeraldo, S.; D’Arco, S.; Migliozzi, A.; Conti, P.; Russo, D. Loss of potential bat habitat following a severe wildfire: A model-based rapid assessment. Int. J. Wildland Fire 2018, 27, 756–769. [Google Scholar] [CrossRef]
- Yoshimura, N.; Hiura, T. Demand and supply of cultural ecosystem services: Use of geotagged photos to map the aesthetic value of landscapes in Hokkaido. Ecosyst. Serv. 2017, 24, 68–78. [Google Scholar] [CrossRef]
- Thonfeld, F.; Steinbach, S.; Muro, J.; Kirimi, F. Long-Term Land Use/Land Cover Change Assessment of the Kilombero Catchment in Tanzania Using Random Forest Classification and Robust Change Vector Analysis. Remote Sens. 2020, 12, 1057. [Google Scholar] [CrossRef]
- Li, Z.; Liu, Y.; Zeng, H. Application of the MaxEnt model in improving the accuracy of ecological red line identification: A case study of Zhanjiang, China. Ecol. Indic. 2022, 137, 108767. [Google Scholar] [CrossRef]
- Saha, A.; Rahman, S.; Alam, S. Modeling current and future potential distributions of desert locust Schistocerca gregaria (Forskål) under climate change scenarios using MaxEnt. J. Asia-Pac. 2021, 14, 399–409. [Google Scholar] [CrossRef]
- Mack, B.; Roscher, R.; Stenzel, S.; Feilhauer, H.; Schmidtlein, S.; Waske, B. Mapping raised bogs with an iterative one-class classification approach. ISPRS J. Photogramm. Remote Sens. I 2016, 120, 53–64. [Google Scholar] [CrossRef]
- FAO. Global Forest Resources Assessment 2010; FAO: Rome, Italy, 2010; Volume 163, p. 340. [Google Scholar]
- White, R.P.; Murray, S.; Rohweder, M. Pilot Analysis of Global Ecosystems: Grassland Ecosystems. World Resources Institute: Washington, DC, USA, 2000; p. 81. [Google Scholar]
- Reynolds, J.F.; Smith, D.M.S.; Lambin, E.F.; Turner, B.L.; Mortimore, M.; Batterbury, S.P.J.; Downing, T.E.; Dowlatabadi, H.; Fernández, R.J.; Herrick, J.E. Global desertification: Building a science for dryland development. Science 2007, 316, 847–851. [Google Scholar] [CrossRef] [PubMed]
- Neely, M.E.; Schallert, D.L.; Mohammed, S.S.; Roberts, R.M.; Chen, Y.J. Self-kindness when facing stress: The role of self-compassion, goal regulation, and support in college students’ well-being. Motiv. Emot. 2009, 33, 88–97. [Google Scholar] [CrossRef]
- Allen-Diaz, B.; Chapin, F.S.; Diaz, S.; Howden, M.; Puidefabregas, J.; Stafford, M.; Benning, T.; Bryant, F.; Campbell, B.; duToit, J. Grassland and rangelands. In Climate Change 1995: Impacts, Adaptations, and Mitigation of Climate Change: Scientific-Technical Analyses. Contribution of Working Group II to the Second Assessment Report of the Intergovernmental Panel on Climate Change; Watson, R.T., Zinyowera, M.C., Moss, R.H., Eds.; Cambridge Univ. Press: Cambridge, UK; New York, NY, USA, 1996; p. 878. [Google Scholar]
- Olff, H.; Ritchie, M.E.; Prins, H.H.T. Global environmental controls of diversity in large herbivores. Nature 2002, 415, 901–904. [Google Scholar] [CrossRef]
- Alkemade, R.; Reid, R.S.; van den Berg, M.; de Leeuw, J.; Jeuken, M. Assessing the impacts of livestock production on biodiversity in rangeland ecosystems. Proc. Natl. Acad. Sci. USA 2013, 110, 20900–20905. [Google Scholar] [CrossRef]
- Hayati, D.; Ranjbar, Z.; Karami, E. Measuring agricultural sustainability. In Biodiversity, Biofuels, Agroforestry and Conservation Agriculture; Springer: Dordrecht, The Netherlands, 2011; pp. 73–100. [Google Scholar] [CrossRef]
- Straffelini, E.; Luo, J.; Tarolli, P. Climate change is threatening mountain grasslands and their cultural ecosystem services. Catena 2024, 237, 107802. [Google Scholar] [CrossRef]
- Liu, Y.; Dong, J.; Ren, S.; Liu, Y. Differential impacts of degradation on grassland ecosystems in the Tibetan Plateau and the Northern agro-pastoral ecotone: A meta-analysis. Plant Soil 2024, 496, 677–696. [Google Scholar] [CrossRef]
- Gibson, D.J.; Newman, J.A. Grasslands and climate change: An overview. In Grasslands and Climate Change; Gibson, D.J., Newman, J.A., Eds.; Ecological Reviews; Cambridge University Press: Cambridge, NY, USA, 2019; pp. 3–18. [Google Scholar]
- Bond, W.J.; Keeley, J.E. Fire as a global ‘herbivore’: The ecology and evolution of flammable ecosystems. Trends Ecol. Evol. 2005, 20, 387–394. [Google Scholar] [CrossRef] [PubMed]
- Middleton, N.J. Rangeland management and climate hazards in drylands: Dust storms, desertification and the overgrazing debate. Nat. Hazards Obs. 2018, 92, 57–70. [Google Scholar] [CrossRef]
- Middleton, N.J.; Sternberg, T. Climate hazards in drylands: A review. Earth-Sci. Rev. 2013, 126, 48–57. [Google Scholar] [CrossRef]
- Reid, W.V.; Mooney, H.; Cropper, A.; Capistrano, D.; Carpenter, S.R.; Chopra, K.R.; Dasgupta, P.; Dietz, T.; Duraiappah, A.K.; Hassan, R.M.; et al. Millennium Ecosystem Assessment, 2005. Ecosystem and Human Well-being:Synthesis; Island Press: Wasinghton, DC, USA, 2005; p. 156. [Google Scholar]
- Eteraf, H.; Telvari, A.A.R. Effects of animal grazing on some physical characteristics of loose soil in Maravetapeh rangelands, Golestan, Iran. Pajouhesh-Va-Sazandegi 2005, 17, 8–13. [Google Scholar]
- Rahmati, O.; Samani, A.N.; Mahmoodi, N.; Mahdavi, M. Assessment of the Contribution of N-Fertilizers to Nitrate Pollution of Groundwater in Western Iran (Case Study: Ghorveh–Dehgelan Aquifer). Water Qual. Expo. Health 2015, 7, 143–151. [Google Scholar] [CrossRef]
- Marușca, T.; Roman, A.; Taulescu, E. Detecting trends in the quality and productivity of grasslands by analyzing the historical vegetation relevés: A case study from Southeastern Carpathians, Vlădeasa Mountains (Romania). Not. Bot. Horti Agrobot. 2021, 49, 12378. [Google Scholar] [CrossRef]
- Wu, Y.; Du, Y.; Liu, X.; Wan, X.; Yin, B.; Hao, Y.; Wang, Y.S. Grassland biodiversity response to livestock grazing, productivity, and climate varies across biome components and diversity measurements. Sci. Total Environ. 2023, 878, 162994. [Google Scholar] [CrossRef] [PubMed]
- Karatassiou, M.; Parissi, Z.M.; Panajiotidis, S.; Stergiou, A. Impact of Grazing on Diversity of Semi-Arid Rangelands in Crete Island in the Context of Climatic Change. Plants 2022, 11, 982. [Google Scholar] [CrossRef]
- Blondel, J. The Mediterranean Region: Biological Diversity in Space and Time; Oxford University Press: Oxford, UK, 2010. [Google Scholar]
- Papachristou, T.G.; Ispikoudis, I.P. Multifunctionality of rangelands and its relevance to the development of mountainous and less favoured areas. In Range Science and Development of Mountainous Regions, Proceedings of the 3rd Panhellenic Rangeland Congress, Karpenissi, Greece, 4–6 September 2002; Hellenic Range & Pasture Society: Athens, Greece, 2003; pp. 13–23, (in Greek with English abstract). [Google Scholar]
- Kyriazopoulos, A.P.; Karatassiou, M.; Parissi, Z.M.; Abraham, E.M.; Sklavou, P. Effects of Ski-Resort Activities and Transhumance Livestock Grazing on Rangeland Ecosystems of Mountain Zireia, Southern Greece. Land 2022, 11, 1462. [Google Scholar] [CrossRef]
- Ragkos, A. Transhumance in Greece: Multifunctionality as an Asset for Sustainable Development. In Grazing Communities; Letizia, B., Ed.; Berghahn Books: New York, NY, USA; Oxford, UK, 2022; pp. 23–43. [Google Scholar]
- Bravo, D.N.; Araújo, M.B.; Lasanta, T.; Moreno, J.I.L. Climate Change in Mediterranean Mountains during the 21st Century. AMBIO J. Hum. Environ. 2008, 37, 280–285. [Google Scholar] [CrossRef]
- Peters, D.P.C.; Yao, J.; Sala, O.E.; Anderson, J.P. Directional climate change and potential reversal of desertification in arid and semiarid ecosystems. Glob. Chang. Biol. 2012, 18, 151–163. [Google Scholar] [CrossRef]
- Chrysanthopoulou, G. Synergy of Climate and Grazing in the Evolution of Vegetation on Mount Kyllini; Aristotle University of Thessaloniki: Thessaloniki, Greece, 2021. [Google Scholar]
- Zhou, Y.; Zhang, Z.; Zhu, B.; Cheng, X.; Yang, L.; Gao, M.; Kong, R. MaxEnt Modeling Based on CMIP6 Models to Project Potential Suitable Zones for Cunninghamia lanceolata in China. Forests 2021, 12, 752. [Google Scholar] [CrossRef]
- Feng, X.; Park, D.S.; Liang, Y.; Pandey, R.; Papeş, M. Collinearity in ecological niche modeling: Confusions and challenges. Ecol. Evol. 2019, 9, 10365–10376. [Google Scholar] [CrossRef] [PubMed]
- Elith, J.; Phillips, S.J.; Hastie, T.; Dudík, M.; Chee, Y.E.; Yates, C.J. A statistical explanation of MaxEnt for ecologists. Divers. Distrib. 2011, 17, 43–57. [Google Scholar] [CrossRef]
- Hu, W.; Wang, Y.S.; Zhang, D.; Yu, W.; Chen, G.; Xie, T.; Liu, Z.; Ma, Z.; Du, J.; Chao, B.; et al. Mapping the potential of mangrove forest restoration based on species distribution models: A case study in China. Sci. Total Environ. 2020, 748, 142321. [Google Scholar] [CrossRef]
- De Marco, P.J.; Nóbrega, C.C. Evaluating collinearity effects on species distribution models: An approach based on virtual species simulation. PLoS ONE 2018, 13, e0202403. [Google Scholar] [CrossRef]
- Luna, S.; Peña-Peniche, A.; Mendoza-Alfaro, R. Species distribution model accuracy is strongly influenced by the choice of calibration area. Biodivers. Inform. 2024, 18, 43–55. [Google Scholar] [CrossRef]
- Voldoire, A.; Saint-Martin, D.; Sénési, S.; Decharme, B.; Alias, A.; Chevallier, M.; Colin, J.; Guérémy, J.-F.; Michou, M.; Moine, M.-P.; et al. Evaluation of CMIP6 DECK Experiments With CNRM-CM6-1. J. Adv. Model. Earth Syst. 2019, 11, 2177–2213. [Google Scholar] [CrossRef]
- Cherchi, A.; Fogli, P.G.; Lovato, T.; Peano, D.; Iovino, D.; Gualdi, S.; Masina, S.; Scoccimarro, E.; Materia, S.; Bellucci, A.; et al. Global Mean Climate and Main Patterns of Variability in the CMCC-CM2 Coupled Model. J. Adv. Model. Earth Syst. 2019, 11, 185–209. [Google Scholar] [CrossRef]
- Lovato, T.; Peano, D.; Butenschön, M.; Materia, S.; Iovino, D.; Scoccimarro, E.; Fogli, P.G.; Cherchi, A.; Bellucci, A.; Gualdi, S.; et al. CMIP6 Simulations With the CMCC Earth System Model (CMCC-ESM2). J. Adv. Model. Earth Syst. 2022, 14, e2021MS002814. [Google Scholar] [CrossRef]
- Riahi, K.; van Vuuren, D.P.; Kriegler, E.; Edmonds, J.; O’Neill, B.C.; Fujimori, S.; Bauer, N.; Calvin, K.; Dellink, R.; Fricko, O.; et al. The Shared Socioeconomic Pathways and their energy, land use, and greenhouse gas emissions implications: An overview. Glob. Environ. Chang. 2017, 42, 153–168. [Google Scholar] [CrossRef]
- Carozzi, M.; Martin, R.; Klumpp, K.; Massad, R.S. Effects of climate change in European croplands and grasslands: Productivity, greenhouse gas balance and soil carbon storage. Biogeosciences 2022, 19, 3021–3050. [Google Scholar] [CrossRef]
- Yan, H.; Feng, L.; Zhao, Y.; Feng, L.; Wu, D.; Zhu, C. Prediction of the spatial distribution of Alternanthera philoxeroides in China based on ArcGIS and MaxEnt. Glob. Ecol. Conserv. 2020, 21, e00856. [Google Scholar] [CrossRef]
- Abolmaali, S.M.R.; Tarkesh, M.; Bashari, H. MaxEnt modeling for predicting suitable habitats and identifying the effects of climate change on a threatened species, Daphne mucronata, in central Iran. Ecol. Inform. 2018, 43, 116–123. [Google Scholar] [CrossRef]
- Duan, X.; Li, J.; Wu, S. MaxEnt Modeling to Estimate the Impact of Climate Factors on Distribution of Pinus densiflora. Forests 2022, 13, 402. [Google Scholar] [CrossRef]
- Tavanpour, T.; Sarafrazi, A.; Mehrnejad, M.R.; Imani, S. Distribution modelling of Acrosternum spp. (Hemiptera: Pentatomidae) in south of Iran. Biologia 2019, 74, 1627–1635. [Google Scholar] [CrossRef]
- Ramasamy, M.; Das, B.; Ramesh, R. Predicting climate change impacts on potential worldwide distribution of fall armyworm based on CMIP6 projections. J. Pest Sci. 2022, 95, 841–854. [Google Scholar] [CrossRef]
- Yang, X.Q.; Kushwaha, S.P.S.; Saran, S.; Xu, J.; Roy, P.S. Maxent modeling for predicting the potential distribution of medicinal plant, Justicia adhatoda L. in Lesser Himalayan foothills. Ecol. Eng. 2013, 51, 83–87. [Google Scholar] [CrossRef]
- Wei, X.; Zhu, C.; Xiao, K.; Yin, Q.; Zha, Y. Shortest Path Network Interdiction With Goal Threshold. IEEE Access 2018, 6, 29332–29343. [Google Scholar] [CrossRef]
- Wang, Y.S.; Xie, B.Y.; Wan, F.H.; Xiao, Q.M.; Dai, L.Y. The Potential Geographic Distribution of Radopholus similis in China. Agric. Sci. China 2007, 6, 1444–1449. [Google Scholar] [CrossRef]
- Coban, O.; Örücü, Ö.K.; Arslan, E. MaxEnt Modeling for Predicting the Current and Future Potential Geographical Distribution of Quercus libani Olivier. Sustainability 2020, 12, 2671. [Google Scholar] [CrossRef]
- Fielding, A.H. A review of methods for the assessment of prediction errors in conservation presence/absence models. Environ. Conserv. 1997, 24, 38–49. [Google Scholar] [CrossRef]
- Peavey, L. Predicting pelagic habitat with presence-only data using maximum entropy for olive ridley sea turtles in the Eastern Tropical Pacific in the Eastern Tropical Pacific. Master’s Thesis, Duke University, Durham, NC, USA, 2010. [Google Scholar]
- Thuiller, W.; Richardson, D.M.; Rouget, M.; Procheş, Ş.; Wilson, J.R.U. Interactions between environment, species traits, and human uses describe patterns of plant invasions. Ecology 2006, 87, 1755–1769. [Google Scholar] [CrossRef]
- Buckman-Sewald, J.; Whorton, C.R.; Root, K.V. Developing macrohabitat models for bats in parks using maxent and testing them with data collected by citizen scientists. Int. J. Biodivers. Conserv. 2014, 6, 171–183. [Google Scholar] [CrossRef]
- Jaskowiak, P.A.; Costa, I.G.; Campello, R.J.G.B. The area under the ROC curve as a measure of clustering quality. Data Min. Knowl. Discov. 2022, 36, 1219–1245. [Google Scholar] [CrossRef]
- Shi, X.; Wang, J.; Zhang, L.; Chen, S.; Zhao, A.; Ning, X.; Fan, G.; Wu, N.; Zhang, L.; Wang, Z. Prediction of the potentially suitable areas of Litsea cubeba in China based on future climate change using the optimized MaxEnt model. Ecol. Indic. 2023, 148, 110093. [Google Scholar] [CrossRef]
- Bede-Fazekas, Á.; Somodi, I. Precipitation and temperature timings underlying bioclimatic variables rearrange under climate change globally. Glob. Chang. Biol. 2024, 30, e17496. [Google Scholar] [CrossRef]
- Hawkins, E.; Sutton, R. The potential to narrow uncertainty in projections of regional precipitation change. Clim. Dyn. 2011, 37, 407–418. [Google Scholar] [CrossRef]
- Wang, Z.; Li, X.; Mao, Y.; Li, L.; Wang, X.; Lin, Q. Dynamic simulation of land use change and assessment of carbon storage based on climate change scenarios at the city level: A case study of Bortala, China. Ecol. Indic. 2022, 134, 108499. [Google Scholar] [CrossRef]
- Zhang, Y.; Tang, J.; Ren, G.; Zhao, K.; Wang, X. Global potential distribution prediction of Xanthium italicum based on Maxent model. Sci. Rep. 2021, 11, 16545. [Google Scholar] [CrossRef]
- Inouye, D.W. Climate change and phenology. WIREs Clim. Chang. 2022, 13, e764. [Google Scholar] [CrossRef]
- Auffret, A.G. Historical floras reflect broad shifts in flowering phenology in response to a warming climate. Ecosphere 2021, 12, e03683. [Google Scholar] [CrossRef]
- Currier, C.M.; Sala, O.E. Precipitation versus temperature as phenology controls in drylands. Ecology 2022, 103, e3793. [Google Scholar] [CrossRef]
- Nemani, R.R.; Keeling, C.D.; Hashimoto, H.; Jolly, W.M.; Piper, S.C.; Tucker, J.; Myneni, R.B.; Running, S.W. Climate-driven increases in global terrestrial net primary production from 1982 to 1999. Science 2003, 300, 1560–1563. [Google Scholar] [CrossRef]
- Gibson, D.J. Grasses and Grassland Ecology; Oxford University Press: Oxford, UK, 2009. [Google Scholar]
- Xun, Q.; An, S.; Lu, M. Climate change and topographic differences influence grassland vegetation greening across environmental gradients. Front. Environ. Sci. 2024, 11, 1324742. [Google Scholar] [CrossRef]
- Cui, N.; Luo, G.; Du, S. Analysis of Spatial-Temporal Variation of Grassland Landscape Pattern Based on Terrain Factors in Qinghai Yushu Tibetan Autonomous Prefecture, China. In Proceedings of the 2018 26th International Conference on Geoinformatics, Kunming, China, 28–30 June 2018; pp. 1–7. [Google Scholar]
- Ye, J.; Ji, Y.; Wang, J.; Ma, X.; Gao, J. Climate factors dominate the elevational variation in grassland plant resource utilization strategies. Front. Environ. Sci. 2024, 15, 1430027. [Google Scholar] [CrossRef]
- Rayamajhi, N.; Manandhar, B. Impact of Climate Change and Adaptation Measures on Transhumance Herding System in Gatlang, Rasuwa. Air Soil Water Res. 2020, 13, 1178622120951173. [Google Scholar] [CrossRef]
- Bhatta, L.D.; Udas, E.; Khan, B.; Ajmal, A.; Amir, R.; Ranabhat, S. Local knowledge based perceptions on climate change and its impacts in the Rakaposhi valley of Gilgit-Baltistan, Pakistan. Int. J. Clim. Chang. Strateg. Manag. 2020, 12, 222–237. [Google Scholar] [CrossRef]
- Satti, Z.; Naveed, M.; Shafeeque, M.; Li, L. Investigating the impact of climate change on trend shifts of vegetation growth in Gilgit Baltistan. Glob. Planet. Chang. 2024, 232, 104341. [Google Scholar] [CrossRef]
- Kiziridis, D.A.; Mastrogianni, A.; Pleniou, M.; Karadimou, E.; Tsiftsis, S.; Xystrakis, F.; Tsiripidis, I. Acceleration and relocation of abandonment in a Mediterranean mountainous landscape: Drivers, consequences, and management implications. Land 2022, 11, 406. [Google Scholar] [CrossRef]
- Karatassiou, M.; Parissi, Z.M.; Stergiou, A.; Chouvardas, D.; Mantzanas, K. Patterns of transhumant livestock system on Mount Zireia, Peloponnese, Greece. In Proceedings of the Pastoralism and Sustainable Development, Valenzano, Bari, 14–15 July 2021; pp. 197–200. [Google Scholar]
- Sidiropoulou, A.; Chouvardas, D.; Mantzanas, K.; Stefanidis, S.; Karatassiou, M. Impact of Transhumant Livestock Grazing Abandonment on Pseudo-Alpine Grasslands in Greece in the Context of Climatic Change. Land 2022, 11, 2126. [Google Scholar] [CrossRef]
- Almeida, A.M.; Martins, M.J.; Campagnolo, M.L.; Fernandez, P.; Albuquerque, T.; Gerassis, S.; Gonçalves, J.C.; Ribeiro, M.M. Prediction scenarios of past, present, and future environmental suitability for the Mediterranean species Arbutus unedo L. Sci. Rep. 2022, 12, 84. [Google Scholar] [CrossRef]
- Almeida, A.M.; Ribeiro, M.M.; Ferreira, M.R.; Roque, N.; Quintela-Sabarís, C.; Fernandez, P. Big data help to define climate change challenges for the typical Mediterranean species Cistus ladanifer L. Front. Ecol. Evol. 2023, 11, 1136224. [Google Scholar] [CrossRef]
- Chan, D.; Cobb, A.; Zeppetello, L.R.V.; Battisti, D.S.; Huybers, P. Summertime Temperature Variability Increases With Local Warming in Midlatitude Regions. Geophys. Res. Lett. 2020, 47, e2020GL087624. [Google Scholar] [CrossRef]
- Adler, P.B.; Levine, J.M. Contrasting relationships between precipitation and species richness in space and time. Oikos 2007, 116, 221–232. [Google Scholar] [CrossRef]
- Herrero-Jáuregui, C.; Oesterheld, M. Effects of grazing intensity on plant richness and diversity: A meta-analysis. Oikos 2018, 127, 757–766. [Google Scholar] [CrossRef]
- Zhang, K.; Zhang, Y.; Zhou, C.; Meng, J.; Sun, J.; Zhou, T.; Tao, J. Impact of climate factors on future distributions of Paeonia ostii across China estimated by MaxEnt. Ecol. Inform. 2019, 50, 62–67. [Google Scholar] [CrossRef]
- Koerner, S.E.; Burkepile, D.E.; Fynn, R.W.S.; Burns, C.E.; Eby, S.; Govender, N.; Hagenah, N.; Matchett, K.J.; Thompson, D.I.; Wilcox, K.R.; et al. Plant community response to loss of large herbivores differs between North American and South African savanna grasslands. Ecology 2014, 95, 808–816. [Google Scholar] [CrossRef]
- Pinto-Junior, H.V.; Villa, P.M.; de Menezes, L.T.; Pereira, M.C.A. Effect of climate and altitude on plant community composition and richness in Brazilian inselbergs. J. Mt. Sci. 2020, 17, 1931–1941. [Google Scholar] [CrossRef]


| Type | Abbreviation | Description | Units |
|---|---|---|---|
| Bioclimatic | bio1 | Mean Annual Temperature | °C |
| bio2 | Mean Diurnal Range (Mean of monthly (max temp-min temp)) | °C | |
| bio3 | Isothermally (Bio2/Bio7) (×100) | °C | |
| bio4 | Temperature Seasonality (standard deviation ×100) | °C | |
| bio5 | Max Temperature of Warmest Month | °C | |
| bio6 | Min Temperature of Coldest Month | °C | |
| bio7 | Temperature Annual Range (Bio5–Bio6) | °C | |
| bio8 | Mean Temperature of Wettest Quarter | °C | |
| bio9 | Mean Temperature of Driest Quarter | °C | |
| bio10 | Mean Temperature of Warmest Quarter | °C | |
| bio11 | Mean Temperature of Coldest Quarter | °C | |
| bio12 | Annual Precipitation | mm | |
| bio13 | Precipitation of Wettest Month | mm | |
| bio14 | Precipitation of Driest Month | mm | |
| bio15 | Precipitation Seasonality | mm | |
| bio16 | Precipitation of Wettest Quarter | mm | |
| bio17 | Precipitation of Driest Quarter | mm | |
| bio18 | Precipitation of Warmest Quarter | mm | |
| bio19 | Precipitation of Coldest Quarter | mm | |
| elevation_aster | elevation | m | |
| Topographic | slope_aster | slope | % |
| aspect_aster | aspect | ° | |
| Soil | bulk density | Bulk density of the fine earth fraction | cg/cm3 |
| cationexchcap | Cation exchange capacity of the soil | mmol(c)/kg | |
| coarsefragm | Volumetric fraction of coarse fragments (>2 mm) | cm3/dm3 (vol‰) | |
| claycontent | Proportion of clay particles (<0.002 mm) in the fine earth fraction | g/kg | |
| nitrogen | Total nitrogen (N) | cg/kg | |
| phwater | Soil pH | pH × 10 | |
| sand | Proportion of sand particles (>0.05 mm) in the fine earth fraction | g/kg | |
| silt | Proportion of silt particles (≥0.002 mm and ≤0.05 mm) in the fine earth fraction | g/kg | |
| soilorgcarb | Soil organic carbon content in the fine earth fraction | dg/kg | |
| orgcarbden | Organic carbon density | hg/m3 | |
| worldrbssoilg | World reference base (2008) soil groups (an international soil classification system for naming soils) | ||
| soilorcarbst | Organic carbon stocks |
| Future Period | CMIP6 Climatic Models | |||
|---|---|---|---|---|
| CNRM-CM6-1 | CCMCC-ESM2 | |||
| SSP245 | SSP585 | SSP245 | SSP585 | |
| 2021–2040 | 0.874 | 0.870 | 0.883 | 0.871 |
| 2041–2060 | 0.870 | 0.874 | 0.860 | 0.868 |
| 2061–2080 | 0.874 | 0.873 | 0.868 | 0.883 |
| 2081–2100 | 0.866 | 0.859 | 0.869 | 0.866 |
Disclaimer/Publisher’s Note: The statements, opinions and data contained in all publications are solely those of the individual author(s) and contributor(s) and not of MDPI and/or the editor(s). MDPI and/or the editor(s) disclaim responsibility for any injury to people or property resulting from any ideas, methods, instructions or products referred to in the content. |
© 2024 by the authors. Licensee MDPI, Basel, Switzerland. This article is an open access article distributed under the terms and conditions of the Creative Commons Attribution (CC BY) license (https://creativecommons.org/licenses/by/4.0/).
Share and Cite
Karatassiou, M.; Stergiou, A.; Chouvardas, D.; Tarhouni, M.; Ragkos, A. Forecasting of Grasslands Distribution on Mount Zireia Using Ecological Niche Modeling and Future Climatic Scenarios. Land 2024, 13, 2126. https://doi.org/10.3390/land13122126
Karatassiou M, Stergiou A, Chouvardas D, Tarhouni M, Ragkos A. Forecasting of Grasslands Distribution on Mount Zireia Using Ecological Niche Modeling and Future Climatic Scenarios. Land. 2024; 13(12):2126. https://doi.org/10.3390/land13122126
Chicago/Turabian StyleKaratassiou, Maria, Afroditi Stergiou, Dimitrios Chouvardas, Mohamed Tarhouni, and Athanasios Ragkos. 2024. "Forecasting of Grasslands Distribution on Mount Zireia Using Ecological Niche Modeling and Future Climatic Scenarios" Land 13, no. 12: 2126. https://doi.org/10.3390/land13122126
APA StyleKaratassiou, M., Stergiou, A., Chouvardas, D., Tarhouni, M., & Ragkos, A. (2024). Forecasting of Grasslands Distribution on Mount Zireia Using Ecological Niche Modeling and Future Climatic Scenarios. Land, 13(12), 2126. https://doi.org/10.3390/land13122126