Article

Response of Carbon and Water Use Efficiency to Climate Change and Human Activities in Central Asia

1
College of Geography and Remote Sensing Sciences, Xinjiang University, Urumqi 830017, China
2
Xinjiang Key Laboratory of Oasis Ecology, Xinjiang University, Urumqi 830017, China
3
Xinjiang Institute of Technology, Aksu 843000, China
*
Author to whom correspondence should be addressed.
These authors contributed equally to this work.
Land 2024, 13(12), 2072; https://doi.org/10.3390/land13122072
Submission received: 28 October 2024 / Revised: 29 November 2024 / Accepted: 30 November 2024 / Published: 2 December 2024

Abstract

:
Carbon use efficiency (CUE) and water use efficiency (WUE) are key metrics for quantifying the coupling between terrestrial ecosystem carbon and water cycles. The impacts of intensifying climate change and human activities on carbon and water fluxes in Central Asian vegetation remain unclear. In this study, the CUE and WUE in Central Asia from 2001 to 2022 were accurately estimated with the help of the Google Earth Engine (GEE) data platform; the Theil–Sen median slope estimation combined with the Manna–Kendall significance test and partial derivative analysis were used to investigate the CUE and WUE trends and their responses to climate change and human activities. CUE and WUE show overall declining trends with significant spatial variability. Among meteorological factors, vapor pressure deficit and temperature show the strongest correlation with CUE, while precipitation and temperature are most correlated with WUE. Compared to human activities, climate change has a greater impact on CUE and WUE, mainly exerting a negative influence. Human activities are the main drivers in regions with developed agriculture, such as oases, farmlands, and areas near rivers and lakes. This study provides scientific references for the optimization of water and soil resources and the integrated regional environmental management in Central Asia.

1. Introduction

Plants in terrestrial ecosystems establish intricate material and energy links among the soil, hydrosphere, and atmosphere through the coupling of photosynthesis and evapotranspiration processes. Carbon use efficiency (CUE) and water use efficiency (WUE) serve as important indicators for quantifying the linkage between the water and carbon cycles in terrestrial ecosystems. The CUE of ecosystems is defined as the ratio of net primary productivity (NPP) to gross primary productivity (GPP) of vegetation, reflecting the carbon sequestration capacity of vegetation [1,2]. WUE is defined as the ratio of gross primary production (GPP) to evapotranspiration (ET) for carbon sequestration from vegetation photosynthesis, which can characterize the ecosystem’s response to changes in water resources [3,4]. As important parameters and indicators reflecting the water cycle of ecosystems, the study of CUE and WUE helps us to understand the processes and mechanisms of the water and carbon cycles [5,6,7].
Scholars at home and abroad have analyzed the spatial and temporal variations and driving mechanisms of vegetation CUE and WUE at different scales using different methods. CUE and WUE are usually calculated based on in situ observations and data from covariance flux towers [8]. Some studies have obtained large-scale long time series of carbon and water flux data based on site observations, such as model simulations [9,10]. The scarcity of eddy covariance flux tower observational data in dryland ecosystems and the limitations of point-scale observational techniques fail to meet the requirements of large-scale studies on vegetation water and carbon fluxes [11,12,13]. With the rapid development of satellite and data assimilation technology, remote sensing data can not only make up for the lack of ground observation data in arid areas but also provide a better understanding of the regional integrity than ecological model simulation [14,15]. Therefore, large-scale and continuous time series studies of CUE and WUE can be conducted using remotely sensed data. Although remotely sensed data can compensate for the lack of flux data, there are inefficiencies in processing a large number of data. The GEE platform, with its rich data resources, efficient data processing capabilities, and timely data visualization, facilitates and supports the study of CUE and WUE on regional to global scales [16].
CUE and WUE are controlled by various factors such as vegetation type and environmental conditions. Plants that generally grow in cool, dry environments exhibit greater adaptability and higher water uptake and storage capacity [17]. This adaptability stems mainly from the fact that plants require relatively less energy to sustain life in this environment, and secondly, plants in this environment tend to maximize their carbon uptake and storage capacity by optimizing their physiological mechanisms [18]. Given the complexity of ecosystems, factors such as climate change, human activities, and biodiversity can directly or indirectly affect CUE and WUE. Precipitation, temperature, soil moisture, and vapor pressure deficit have been identified as the principal factors affecting CUE and WUE [2]. In dryland ecosystems, plants actively close some of their stomata to prevent excessive water loss through transpiration at high temperatures, resulting in a decrease in CUE and an increase in WUE [19]. In sparsely vegetated arid regions, high surface evapotranspiration and low precipitation can result in a decline in WUE. In drought-stressed ecosystems, plants adapt to water scarcity by reducing leaf area and promoting root growth to enhance water uptake [20]. Vegetation carbon and water fluxes are influenced not only by climate change but also by human activities, which may lead to changes in CUE and WUE to some extent. For example, intensified grazing activities and land use changes complicate the carbon and water cycles of ecosystems. On larger spatial scales, the complexity and spatial heterogeneity of environmental factors, soil types, and topography can significantly affect CUE and WUE [21]. Assessing long-term changes in CUE and WUE at broader spatial scales remains a challenging task, and further research is required for long-term assessment and prediction on such scales.
Central Asia hosts over 80% of the world’s temperate deserts and the most extensive temperate grasslands [22]. Currently, the region faces pressing environmental challenges such as water scarcity, extreme drought stress, frequent dust storms, and ecosystem vulnerability. Human activities are increasingly disturbing the ecosystems of Central Asia, exacerbating the extent of land degradation and desertification in the region [23], making the impacts of climate change and human activities on the CUE and WUE of dryland ecosystems particularly pronounced, to the extent that their carbon and water fluxes are the most variable in recent decades [24,25]. Separating and quantifying the impacts of climatic factors and human activities on CUE and WUE is essential for identifying the dominant regional controlling factors. While previous studies have extensively explored CUE and WUE variations at various scales, most have relied on correlation analyses to investigate vegetation change drivers. This approach often fails to fully distinguish or quantify the contributions of different driving factors. Furthermore, there is a lack of long-term studies on the persistent changes in CUE and WUE of Central Asian vegetation and their attribution, particularly regarding the regional differences in the impacts of human activities. Therefore, uncovering the spatiotemporal variability of vegetation CUE and WUE in arid regions, while quantitatively separating the contributions of climate change and human activities, can enhance our understanding of how ecosystems respond and adapt to environmental change [26,27].
This study investigates the CUE and WUE of dryland ecosystems in Central Asia based on remote sensing data. First, the CUE and WUE in Central Asia were estimated using GEE. Second, trend analysis was applied to examine the basic characteristics of changes in vegetation CUE and WUE from 2001 to 2022. Finally, partial derivative analysis was used to estimate the relative contributions of climatic factors and develop scenarios to isolate and quantify the dominant controlling factors. Therefore, studying the CUE and WUE of vegetation in Central Asia is of great significance for predicting future climate change, optimizing regional water resource management, assessing ecosystem resilience to environmental changes, and promoting sustainable development.

2. Materials and Methods

2.1. Study Area

Central Asia is located in the hinterland of the Eurasian continent (46.24′–97.06′ E, 33.48′–55.48′ N) and consists of Kazakhstan, Uzbekistan, Turkmenistan, Kyrgyzstan, Tajikistan, and the Xinjiang region of China, covering an area of about 5.66 million km2 (Figure 1). The terrain of Central Asia is generally high in the east and low in the west, stretching across the Tian Shan Mountains range. The central and western regions consist of the Turan Plain and the Caspian coastal plain, while the northern part features the Kazakhstan Hills, and the southern part is home to the Kyzylkum, Karakum, and Taklamakan deserts. The terrain is complex and varied, with mountains, plains, deserts, grasslands, and other landform types intertwined to form a unique ecological environment and climatic pattern. Most of Central Asia is arid or semi-arid, with a temperate continental climate. Precipitation is relatively sparse, with annual rainfall varying greatly from region to region. Desert areas typically receive less than 100 mm of rainfall annually, while mountainous regions can receive up to 1000 mm. Sunshine is abundant, with large diurnal temperature differences, and evapotranspiration is high. Central Asia has rich vegetation, but the vegetation cover is sparse, primarily consisting of desert vegetation and grasslands.

2.2. Data Sources and Pre-Processing

The MODIS products used in this study include NPP (MOD17A3HGF), GPP (MOD17A2H), and ET (MOD16A2) data, with a time series length of 2001 to 2022, and every 8 days of data were synthesized to calculate the annual average CUE and WUE from April to October each year. These data were obtained from the GEE platform with data provided by the National Aeronautics and Space Administration (NASA; https://modis.gsfc.nasa.gov/data/, accessed on 13 October 2024). The period covered was 2001 to 2022, and the data for each year were selected growing season (April–October) data with 500 m spatial resolution and 8 days’ temporal resolution and were used to calculate CUE and WUE.
In Central Asia, many areas have no vegetation cover and lack GPP, NPP, and ET data. Therefore, masking is performed on urban built areas, water bodies, snow- and ice-covered areas, and desert areas corresponding to non-vegetation-covered areas based on NPP data. Therefore, to better reflect the growth and dynamics of vegetation, the growing season was chosen for this study to analyze CUE and WUE changes and drivers in Central Asia. Regarding the meteorological factors affecting CUE and WUE, the meteorological data selected in this study include precipitation (PRE), temperature (TEM), net radiation (RN), soil moisture (SW), and saturated water vapor pressure deficit (VPD) data for the time period from April 2001 to October 2022. Specifically, this study used ERA5 data with a resolution of 11,132 m for TEM (surface 2 m temperature), PRE (precipitation accumulation), and RN (net surface solar radiation minus net surface thermal radiation) (https://cds.climate.copernicus.eu/#!/home, accessed on 13 October 2024). Additionally, monthly SW (0–7 cm) and VPD data with a resolution of 4638.3 m were obtained from TERRACLIMATE (https://www.climatologylab.org/terraclimate.html, accessed on 13 October 2024). The data used in this study were resampled to 1000 m from data sources of different temporal and spatial scales.

2.3. Methods

2.3.1. CUE and WUE Calculations

The CUE and WUE of plants were estimated using the Google Earth Engine (GEE) platform. CUE was defined as the ratio between NPP (MOD17A3) and GPP (MOD17A2) for 8 days, while WUE, measured as the amount of carbon produced per unit mass of water ( g C k g 1   H 2 O ), was defined as the ratio between GPP (MOD17A2) and ET (MOD16A2).
C U E = N P P G P P
W U E = G P P E T
where CUE is carbon use efficiency (dimensionless), WUE is water use efficiency ( g C k g 1   H 2 O ), NPP is net primary productivity ( g C m 2 ), GPP is primary productivity ( g C m 2 ), and ET is evapotranspiration (mm).

2.3.2. Theil–Sen Median Trend Analysis

To quantify CUE and WUE in Central Asia, Theil–Sen median trend analysis was used to determine the trend changes in CUE and WUE over a long period of time and combined with the Manna–Kendall (MK) test to assess the significance of the trend changes in CUE and WUE [28] The Theil–Sen trend degree is calculated as follows:
β = M e d i a n · ( X j X i j i ) ,     j > i
where X i and X j denote the time series data and M e d i a n ( ) represents the taking of the median value; if β is greater than 0, it indicates that X is in a growing trend, and vice versa. The Manna–Kendall significance test formula is as follows:
Z = S 1 V a r ( S ) , S > 0 0 , S = 0 S + 1 V a r ( S ) , S < 0
According to the S standardized test statistic Z:
s i g n X j X i = 1 ,                   X j X i > 0 0 ,                   X j X i = 0 1 ,               X j X i < 0
When the absolute value of Z is greater than 1.64 and 2.32, it means that the test of significance is passed with 95% and 99% confidence, respectively. Manna–Kendall mutation detection is a non-parametric statistical test that is computationally simple and can determine the starting point of a mutation and indicate the corresponding time period of the mutation.

2.3.3. Partial Derivatives Analysis

The partial derivative method has been widely used in evaluating the response of various disturbance factors to hydrological and meteorological changes [29,30,31]. Therefore, the partial derivative method was used to quantify the contribution of climatic factors and human activities to CUE and WUE.
d Y d t = Y X a × d X a d t + Y X b × d X b d t + Y X c × d X c d t + + Y X n × d X n d t
where d Y d t = X a c o n + X b c o n + X c c o n + + X n c o n , d Y d t is the linear trend of Y change, X a c o n , X b c o n , X c c o n , and X n c o n represent the contribution of X a , X b , X c , and X n to the change in Y . Y X a Y X b Y X c Y X n represent the partial derivatives of the contribution of each variable to the change in Y .
It is hypothesized that PRE, TEM, RN, SW, and VPD are the main reasons for the variation in CUE and WUE, and K represents the variation trend of CUE and WUE under the interaction of PRE, TEM, RN, SW, and VPD, as shown below.
K P R E _ c o n + T E M _ c o n + R N _ c o n + S W _ c o n + V P D _ c o n = C U E P R E × d P R E d t + C U E T E M × d T E M d t + C U E R N × d R N d t + C U E S W × d S W d t + C U E V P D × d V P D d t ,
where P R E _ c o n , T E M _ c o n , R N _ c o n , S W _ c o n , and V P D _ c o n are the contributions of PRE, TEM, RN, SW, and VPD to the changes in CUE, respectively. Positive values of the contribution indicate that the impact factor has a positive effect on CUE and can contribute to its growth, while negative values reflect that the impact factor has an unfavorable effect on CUE and inhibits its growth [32].
Considering that each climatic factor has a linear effect on the variation in CUE and WUE, by eliminating the effect of other variables, each partial derivative is equal to the corresponding second-order partial correlation coefficient [33]. The formula is calculated as follows:
R X Y , Z λ = R X Y , Z R X λ , Z × R Y λ , Z 1 R X λ , Z 2 × 1 R Y λ , Z 2
where R X Y , Z denotes the second-order partial correlation coefficient between X and Y based on eliminating the effects of factors Z and λ. The definitions of R X λ , Z , R Y λ , Z , and R X Y , Z are similar. A t-test was conducted to determine whether the correlation between the two variables is significant or not; the multi-source results show that the coefficient of the influencing factor is positive and statistically significant (e.g., p < 0.05); then, it passes the test of significance at a 95% confidence level, and the two variables are considered to have a significant relationship; otherwise, it is not significant.

2.3.4. Scenario Design

Based on meteorological data and regression model parameters, calculate the C U E c c to represent the impact of climate factors on vegetation CUE. Calculate the difference between the C U E o b s and C U E c c , defined as the CUE residual C U E H A , to represent the impact of human activities on vegetation CUE. The specific formula is as follows:
C U E C C = a × P R E + b × T E M + c × R N + d × S W + e × V P D + f
C U E H A = C U E o b s C U E C C
where C U E C C and C U E C C refer to the predicted CUE value based on the regression model and the observed CUE value from remote sensing imagery, respectively. Parameters a , b , c , d , e , f are the model coefficients, and C U E H A represents the residual.
The linear trend rates of C U E c c and C U E H A , representing the trends in CUE under the influence of climate change and human activities, respectively, are calculated. If s l o p e C U E c c > 0 and s l o p e C U E H A > 0 , it indicates that climate change or human activities can promote an increase in vegetation CUE; conversely, s l o p e C U E c c < 0 and s l o p e C U E H A < 0 suggest a decrease in vegetation CUE. We developed six scenarios to objectively analyze the relevant contributions. The main drivers change in Central Asia were differentiated according to Table 1 [34].

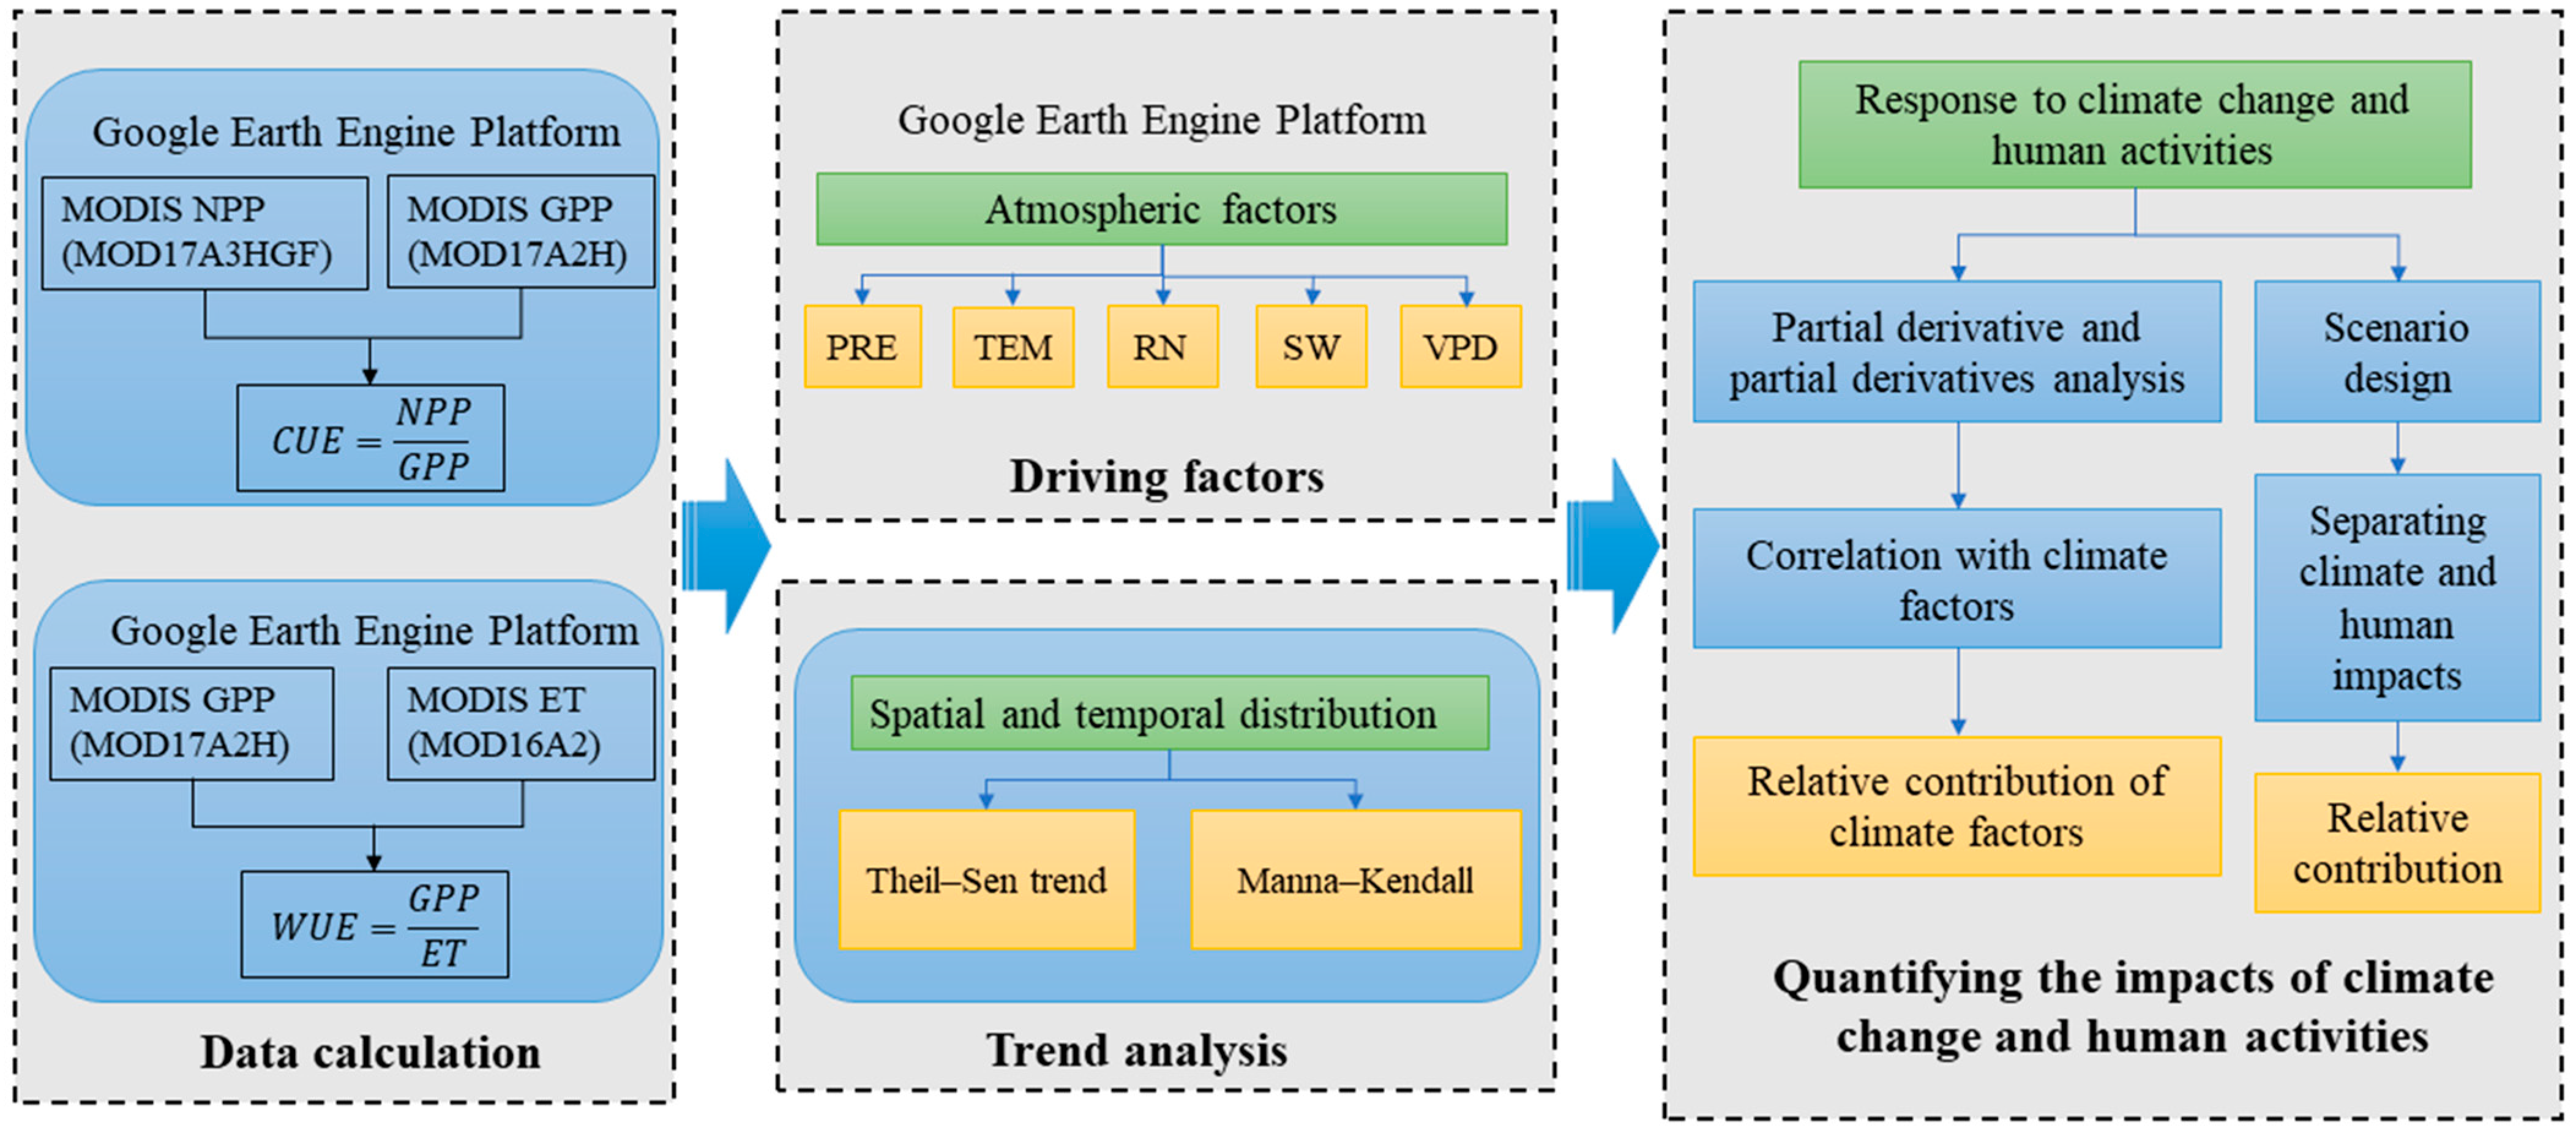
2.3.5. Processing Flow

The flow chart of CUE and WUE for climate change and human activity studies is shown in Figure 2.

3. Results

3.1. Spatial and Temporal Distribution and Change Characteristics of CUE and WUE

3.1.1. Spatio-Temporal Distribution of CUE and WUE

According to statistics, the average CUE value in Central Asia from 2001 to 2022 was 0.569 (Figure 3a). Regions with higher CUE values are concentrated in the northern part of Kazakhstan to the Upper Urals, central Kyrgyzstan, western Tajikistan, the Tian Shan Mountains, the Altai Mountains, and the northern Kunlun Mountains, showing strong spatial heterogeneity. CUE values are generally higher in cold and arid environments, where plants require relatively less energy to sustain life. In contrast, low CUE values are primarily found in the Syr Darya, Amu Darya, and Karakum Canal basins, as well as in the oases surrounding the Taklamakan Desert. The mean value of WUE in Central Asia is 2.152  g C k g 1   H 2 O . High WUE values are mainly found in the eastern part of Uzbekistan to the Syr Darya Basin, the southern edge of Turkmenistan, the southern part of Kazakhstan from the Aral Sea to the Lake Balkhash Basin, and the southern and northern edges of the Tian Shan Mountains (Figure 3b). Low WUE values, on the other hand, are mainly distributed in the Tian Shan Mountains, northern Kunlun Mountains, and northern Altai Mountains at relatively high altitudes and low temperatures, which directly affect plant photosynthesis and respiration, thus leading to a decrease in plant WUE.
From 2001 to 2022, NPP in Central Asia exhibited a slight decreasing trend, while GPP showed a slight increasing trend, and ET experienced an upward trend. These dynamics collectively led to declining trends in both CUE and WUE across the region (Figure 3). The spatial and temporal variations in areas with high CUE and WUE values were particularly significant, and their variation trends differed, indicating that the factors driving these changes were spatially and temporally complex.

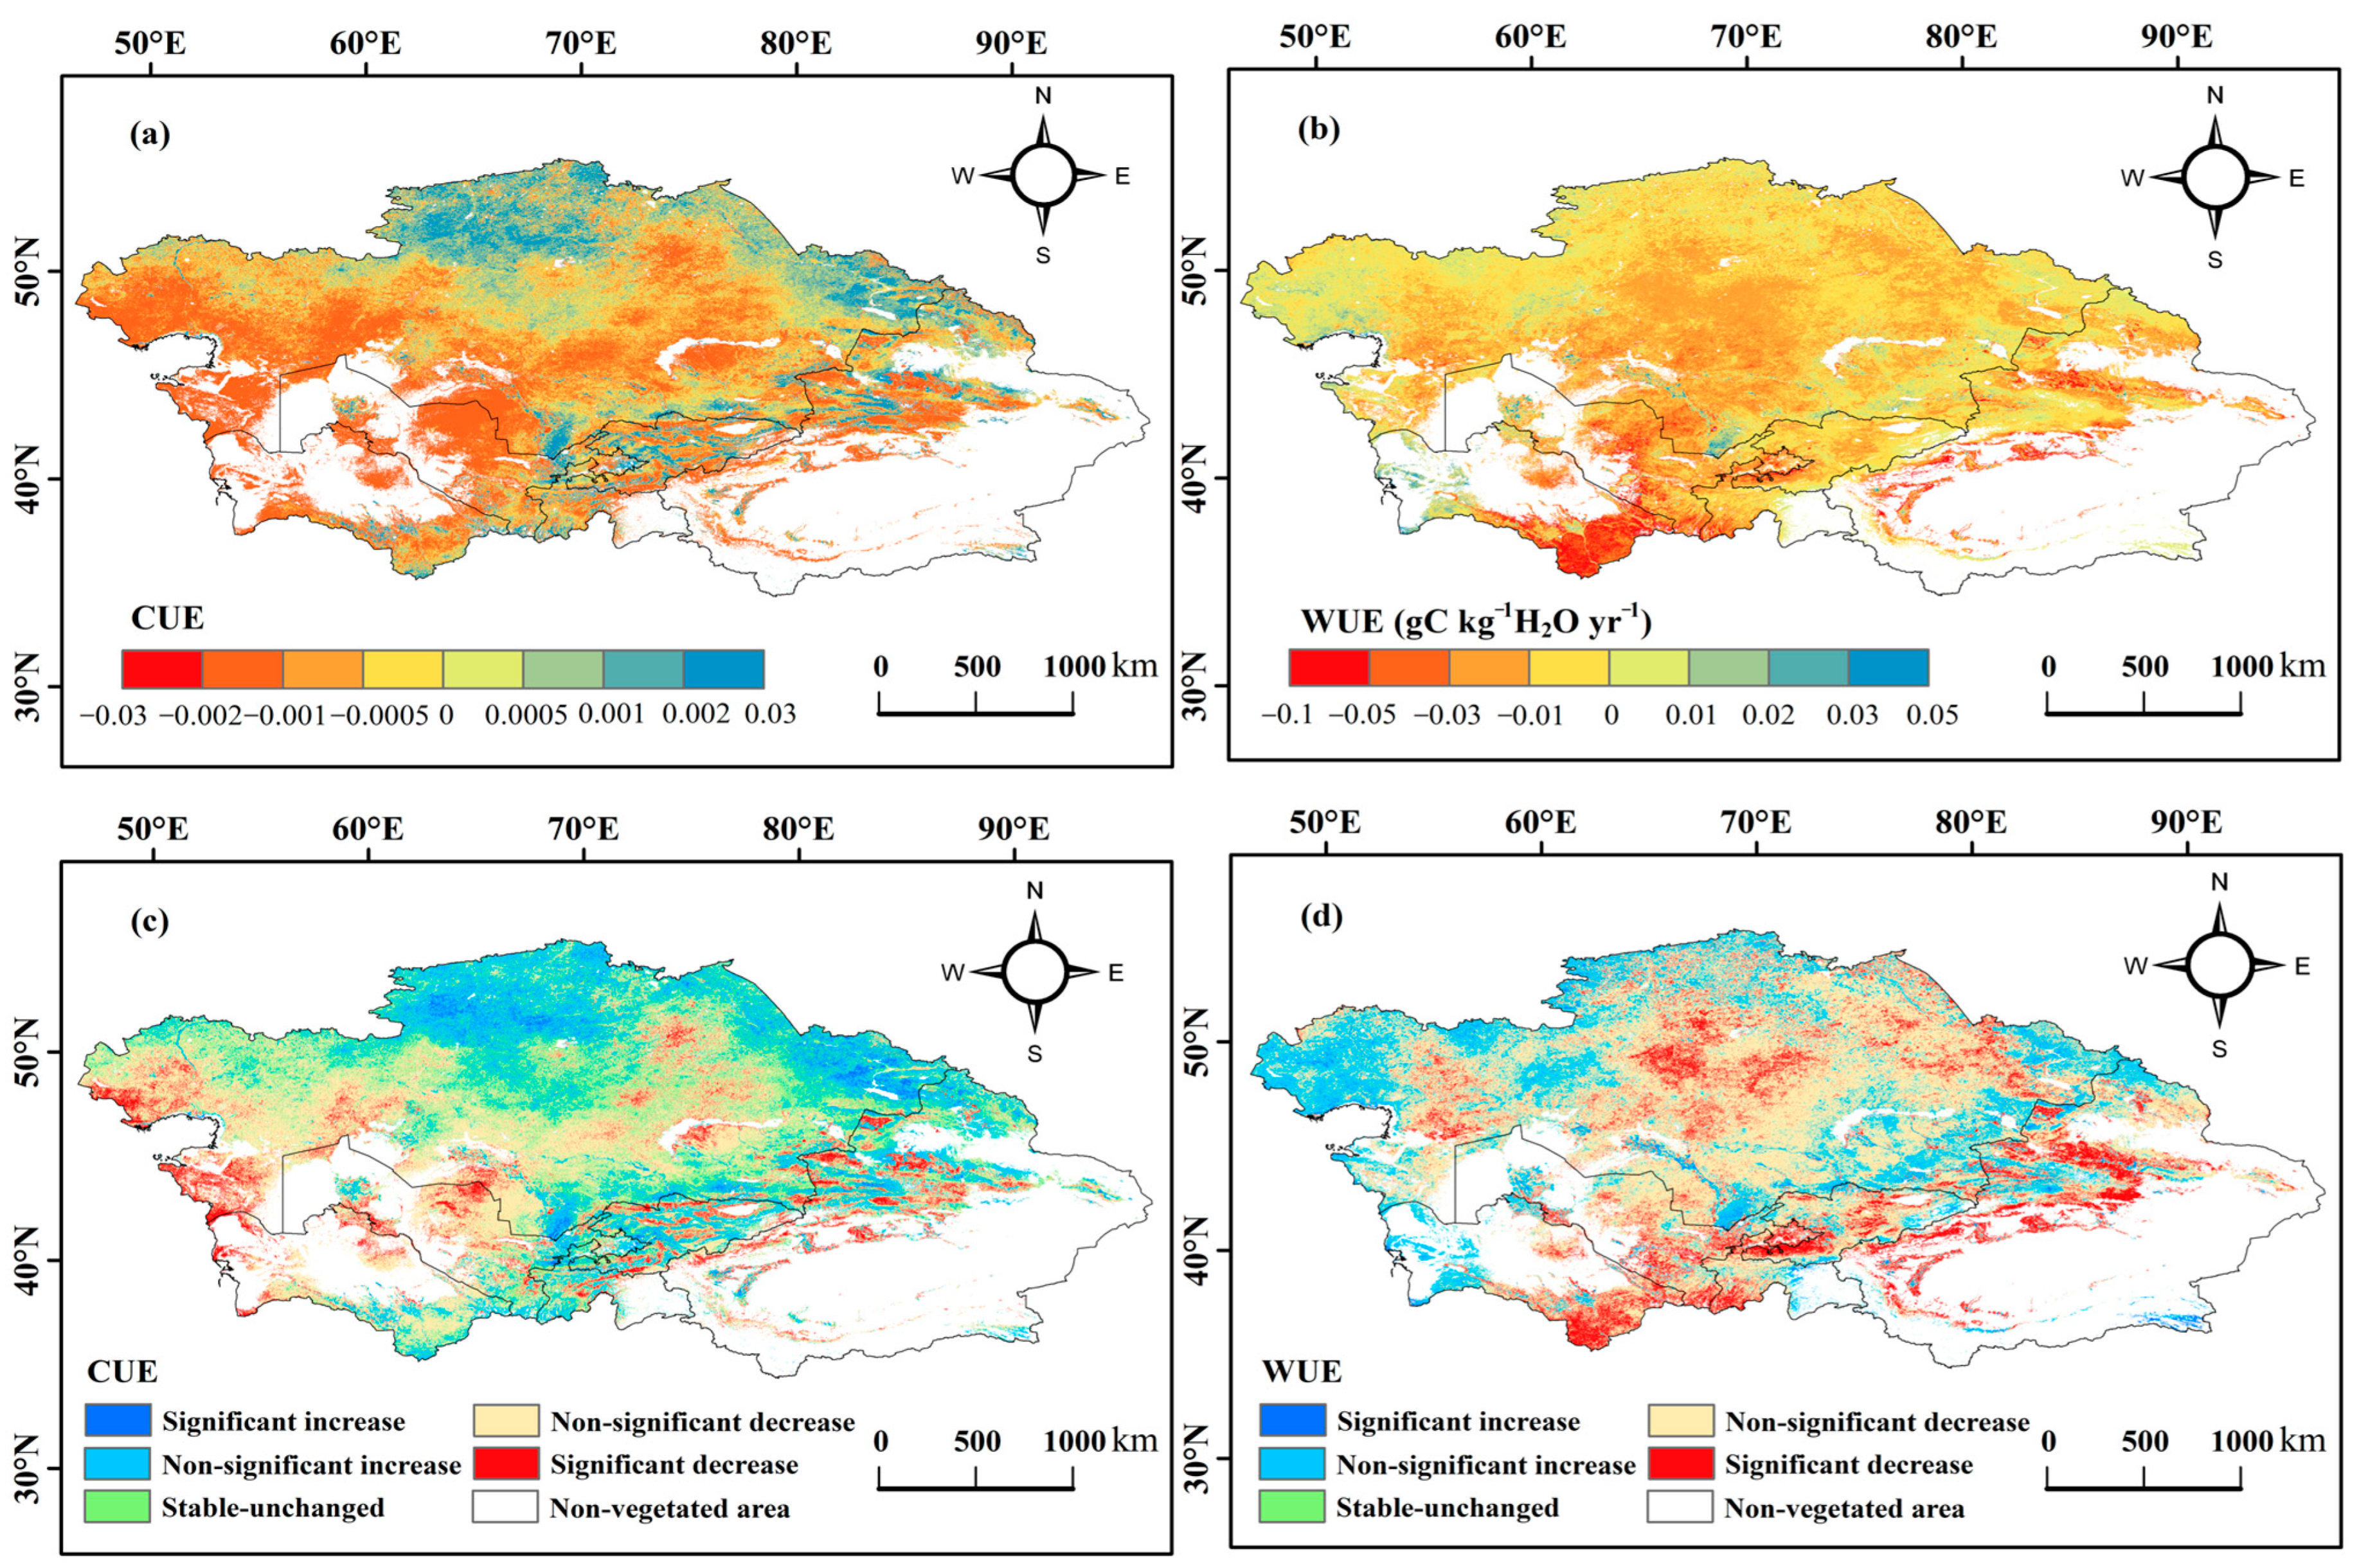
3.1.2. Trends in CUE and WUE

CUE showed a decreasing trend of 0.5 × 10 3   y e a r 1 , with significant decreases concentrated in the Kazakh Hills, the lowlands along the Caspian Sea, the Syr Darya Basin, the Tian Shan Mountains range, and the oases around the Taklamakan Desert (Figure 4a). Remarkable increases in CUE were mainly found in the Turgai Plateau of Kazakhstan, the Irtysh River Basin, the basin from the Aral Sea to Lake Balkhash, the southern edge of Turkmenistan, western Tajikistan, the Altai and Tian Shan Mountains margins, and the oases surrounding the Gurbantünggüt Desert (Figure 4c). According to the trend analysis in Table 2, the area with a non-significant decline in CUE is the largest, accounting for 42.7% of the study area. Over the past 22 years, WUE has varied greatly across Central Asia, showing a decreasing trend of 9.8 × 10 3   g C k g 1 H 2 O y e a r 1 . Although the annual average change across the entire area of Central Asia was relatively small, there were notable spatial differences (Figure 4b). Significantly lower WUE was observed in central Kazakhstan, eastern Uzbekistan, southeastern Turkmenistan, southwestern Tajikistan, and oases around the Gurbantünggüt and Taklamakan deserts (Figure 4d). Regions with dramatic increases in WUE were observed in the Ural River Basin in western Kazakhstan, the basin from the Aral Sea to Lake Balkhash, the Ili River Valley, and central Tajikistan. The area with a non-significant decline in WUE accounts for the largest proportion, at 62.63%.

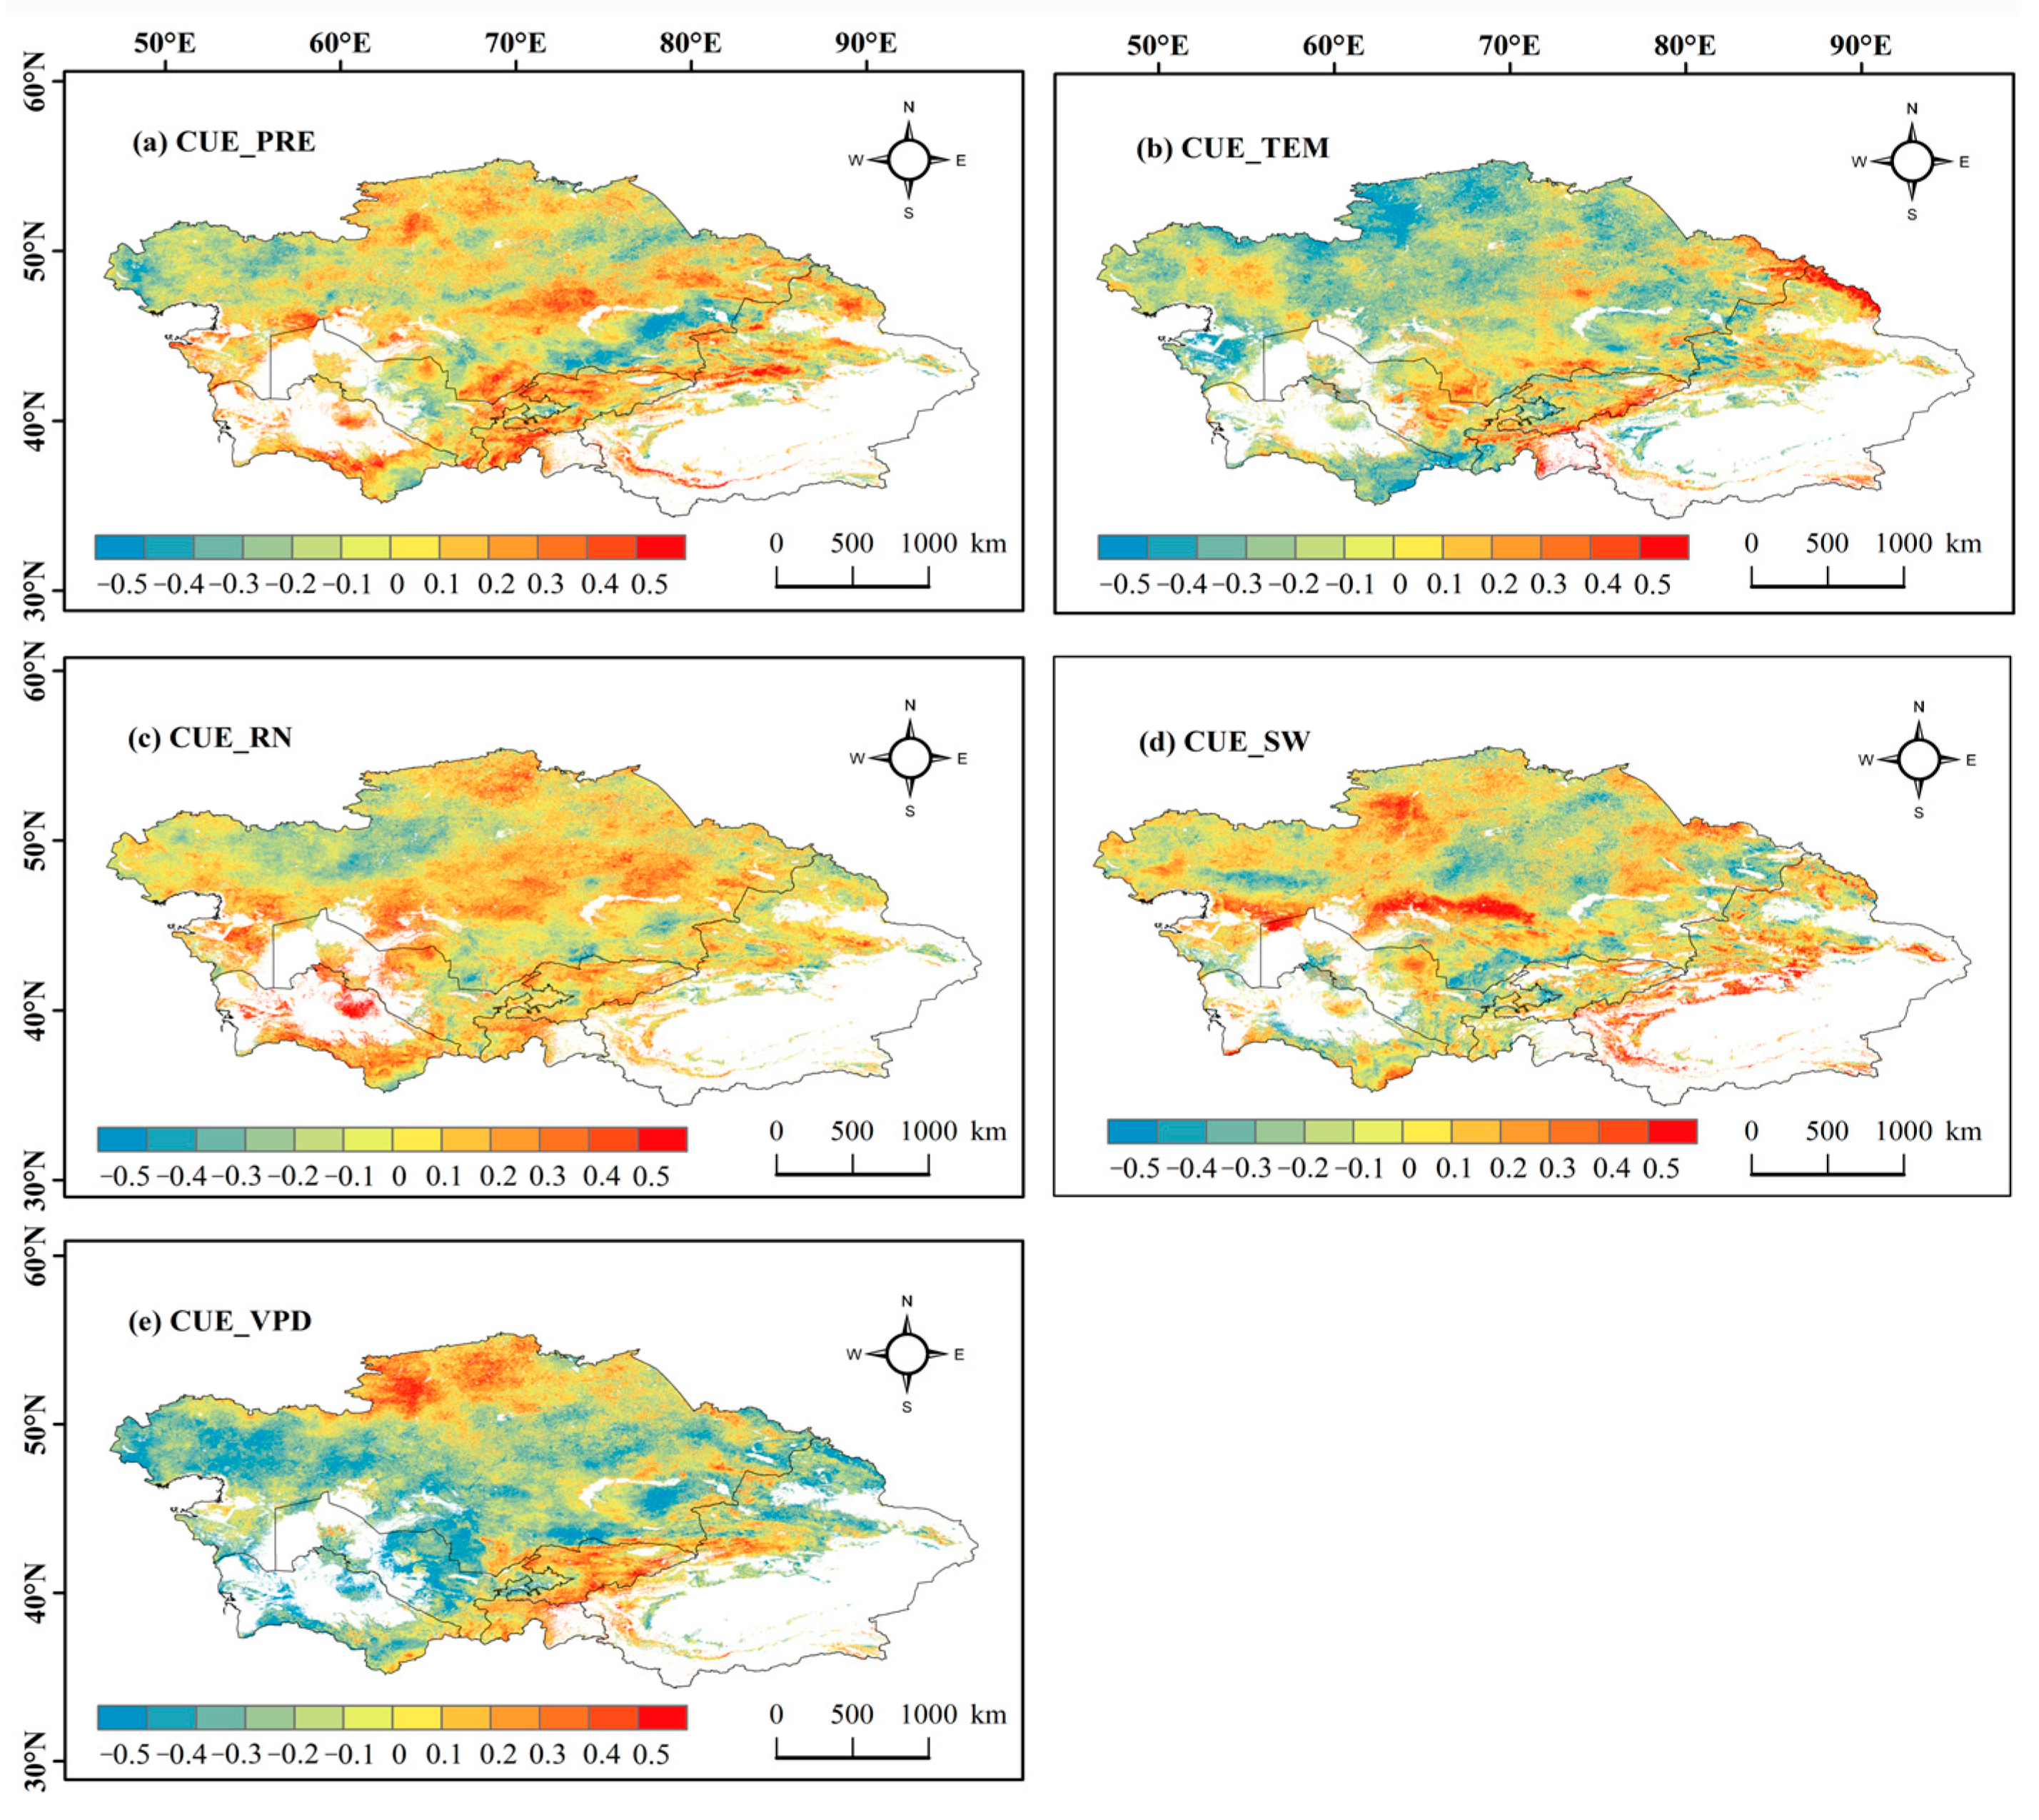
3.2. Correlation of CUE and WUE with Factors

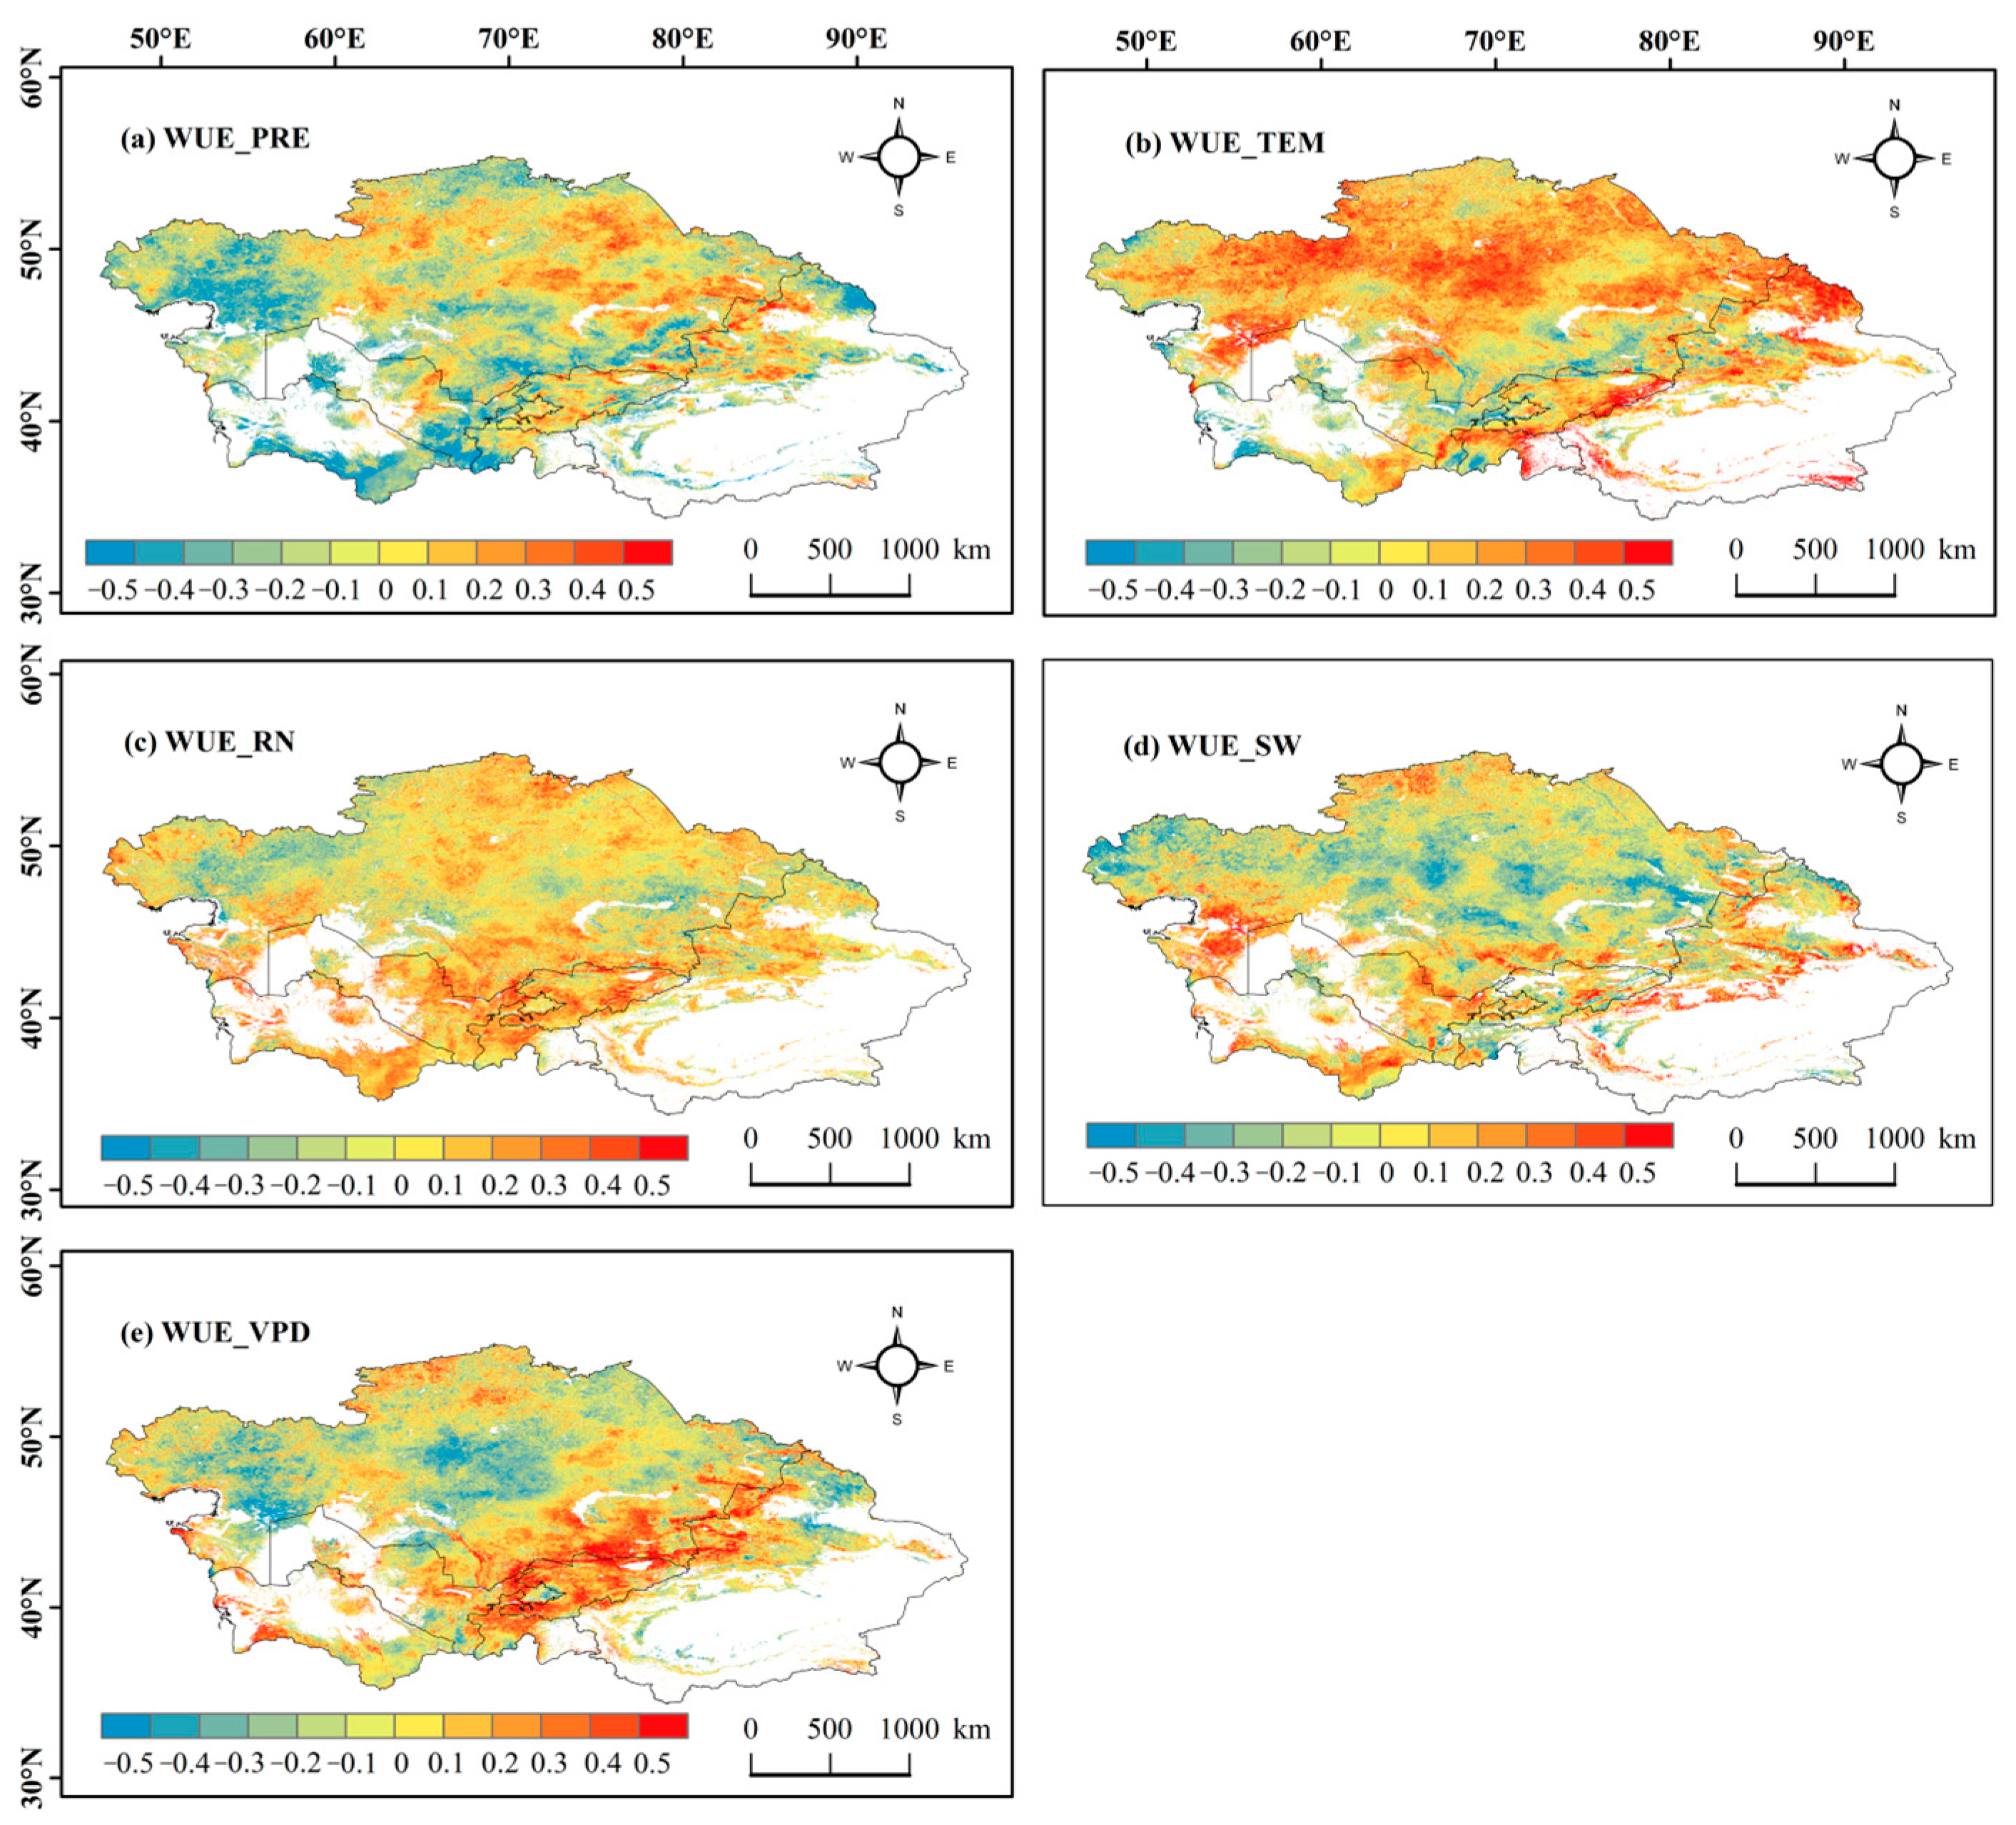
3.2.1. Correlation of CUE and WUE with Climate Factors

We conducted a correlation analysis to explore the relationship between climatic factors and changes in CUE and WUE. Overall, CUE showed negative correlation with TEM, SW, and VPD, while CUE was positively correlated with PRE and net radiation RN (Figure 5).
In 72.5% of the study area, CUE showed a negative correlation with VPD, with a correlation coefficient of −0.15. This was mainly distributed in western Kazakhstan, eastern Uzbekistan, and the northern border regions of China. CUE and RN exhibited a positive correlation in most of the study areas, including central Kazakhstan, central Uzbekistan, southern Turkmenistan, and the Tian Shan Mountains. The correlation of WUE with each climatic factor in Central Asia is shown in Figure 6. WUE was negatively correlated with PRE, SW, and VPD, while it was positively correlated with RN and TEM. Among these, the correlation between WUE and TEM was the largest, and the correlation between WUE and VPD was the smallest. Overall, 63.7% of the studied regions exhibit a negative correlation between WUE and PRE, mainly in the eastern part of Kazakhstan and the area extending from the Syr Darya River Basin to the Lake Balkhash Basin. In addition, most of the study area displayed a positive correlation between WUE and TEM, primarily in the steppes of central Kazakhstan. PRE and TEM were the two most important meteorological factors influencing changes in WUE in Central Asia.

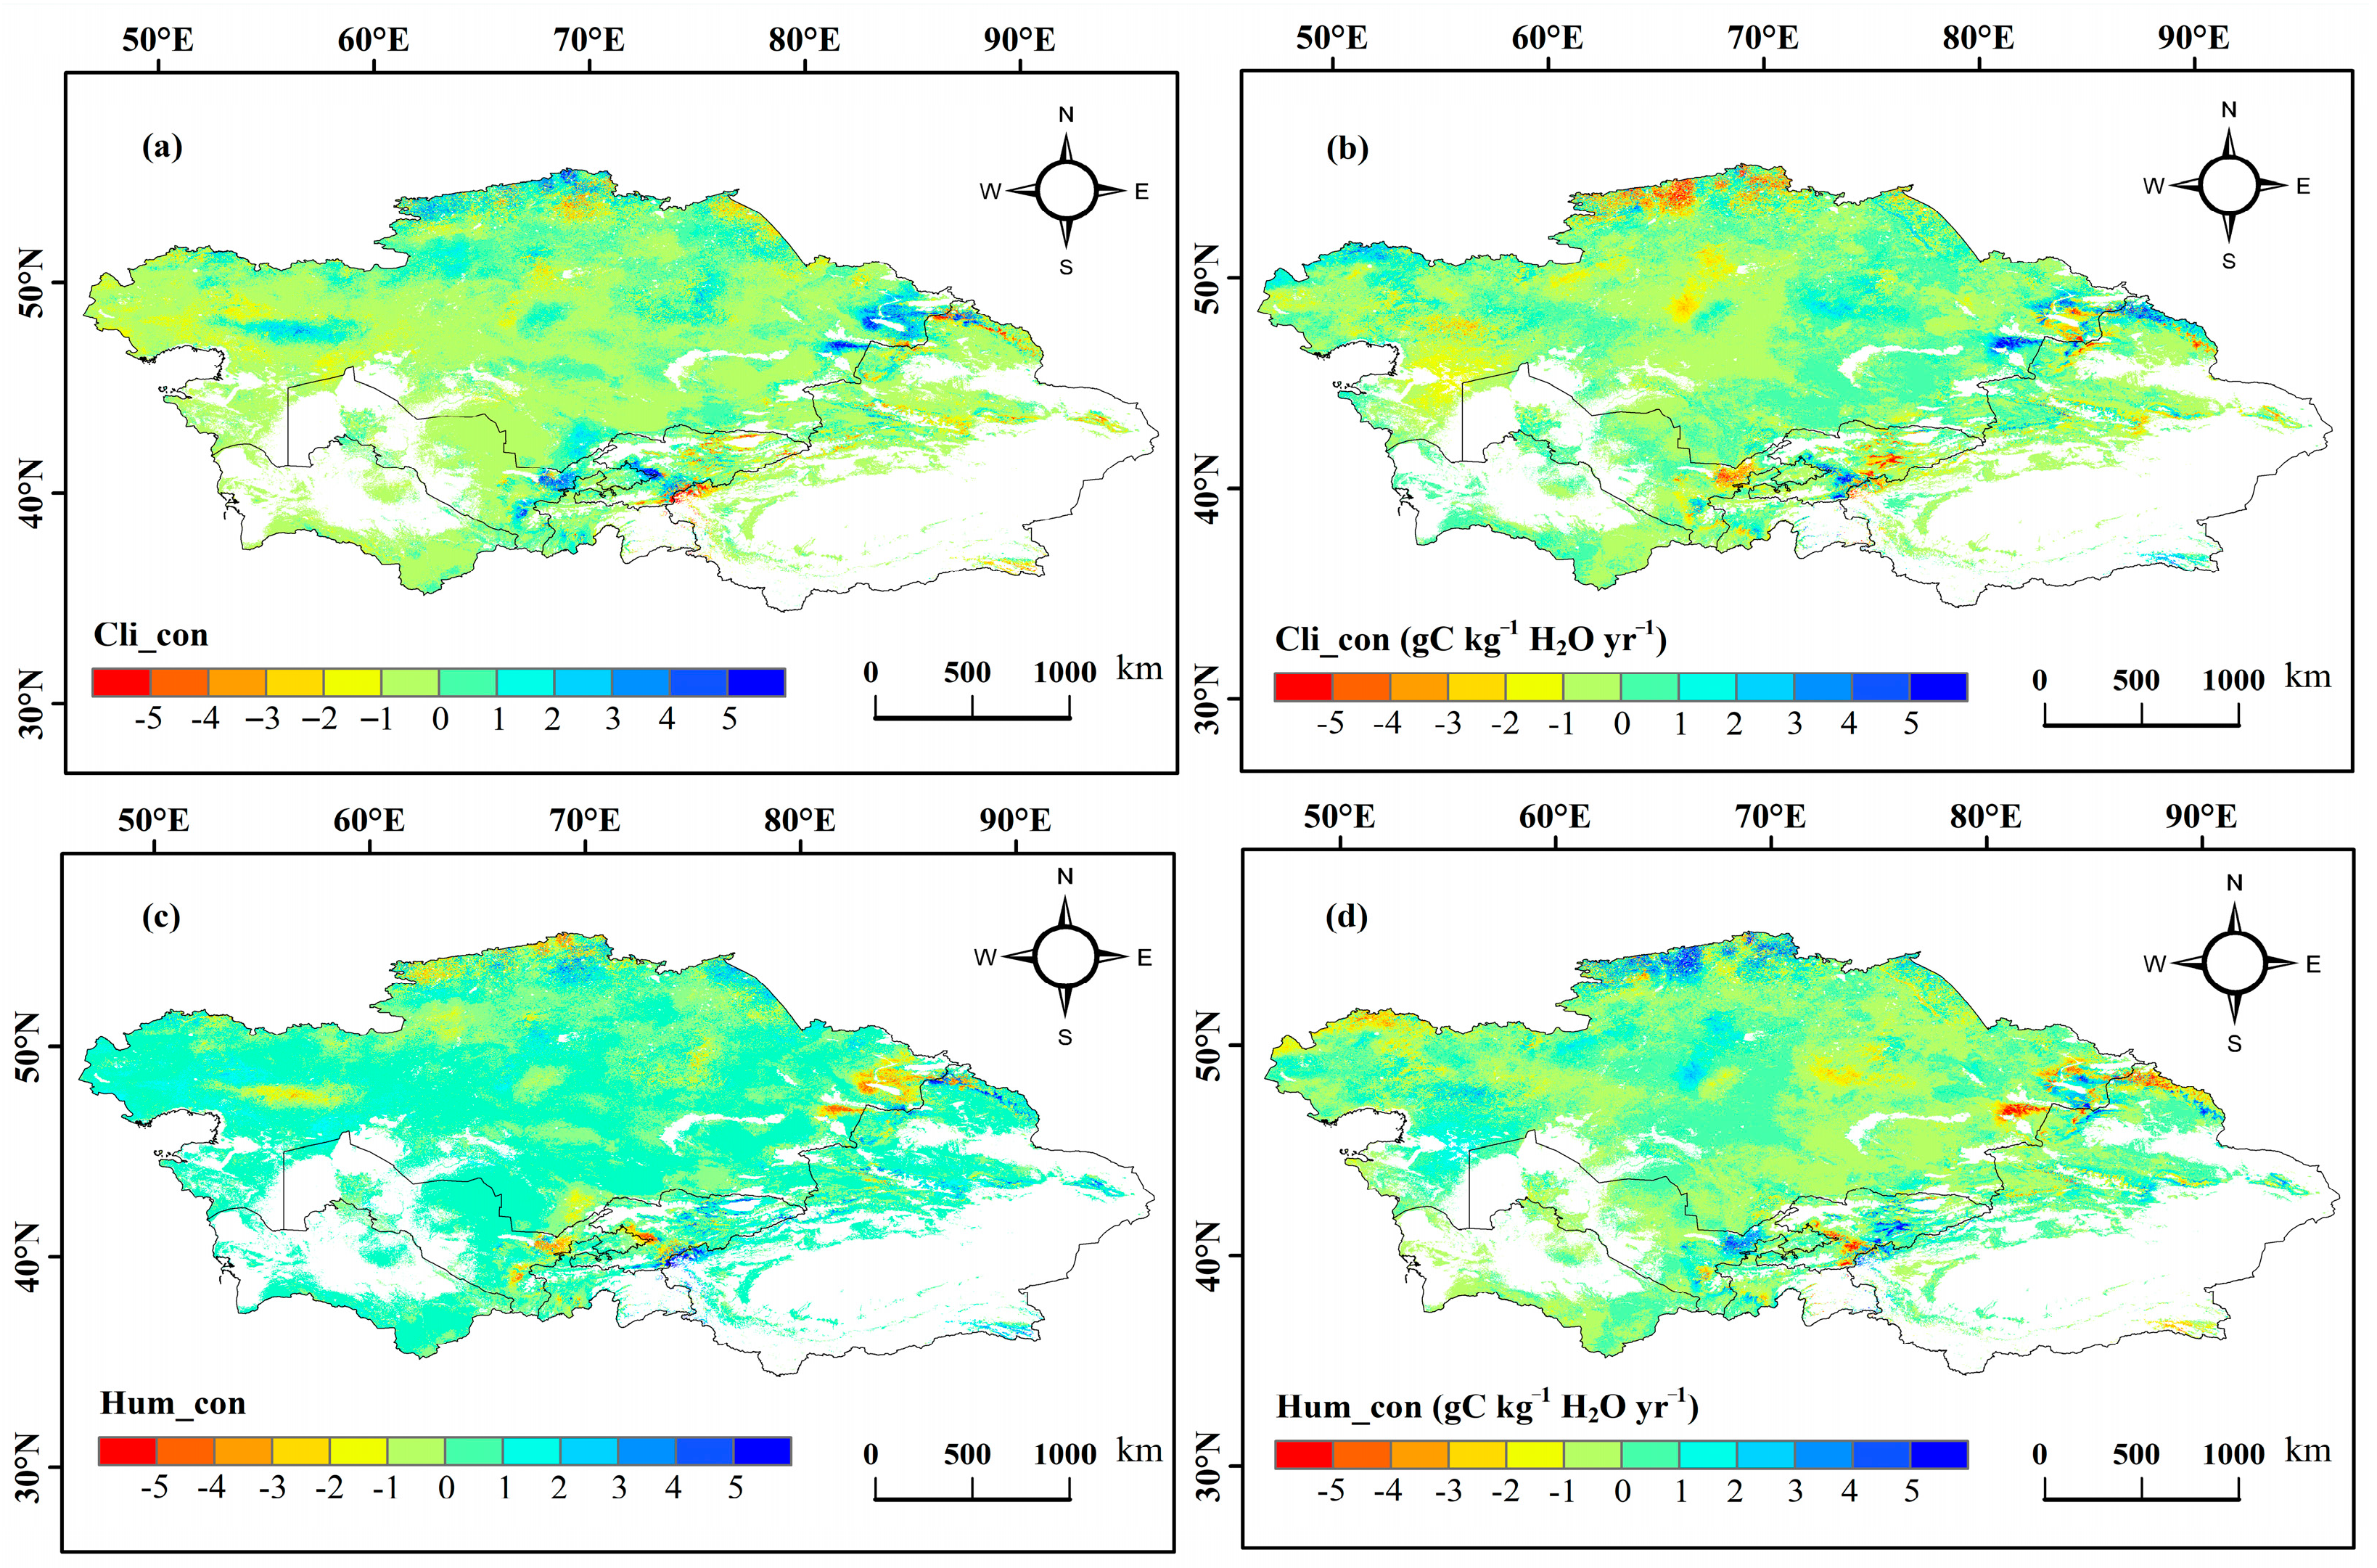
3.2.2. Contribution of Climate Factors

To accurately identify the contribution rates of climatic factors, we calculated their respective contributions. PRE and TEM made significant contributions to CUE changes, with contribution rates of 21.79% and 21.75%, respectively. RN had a relatively smaller contribution to CUE, at 16.92%. As shown in Figure 7, the contribution rates of most climatic factors were around 20%, indicating that changes in CUE were driven by the combined influence of multiple climatic factors. For WUE, TEM and VPD contributed 22.02% and 24.7%, respectively, while the contributions of the other three climatic factors were below 20%. This suggests that VPD and RN were the primary drivers of changes in WUE.

3.3. Dominant Factors Affecting CUE and WUE

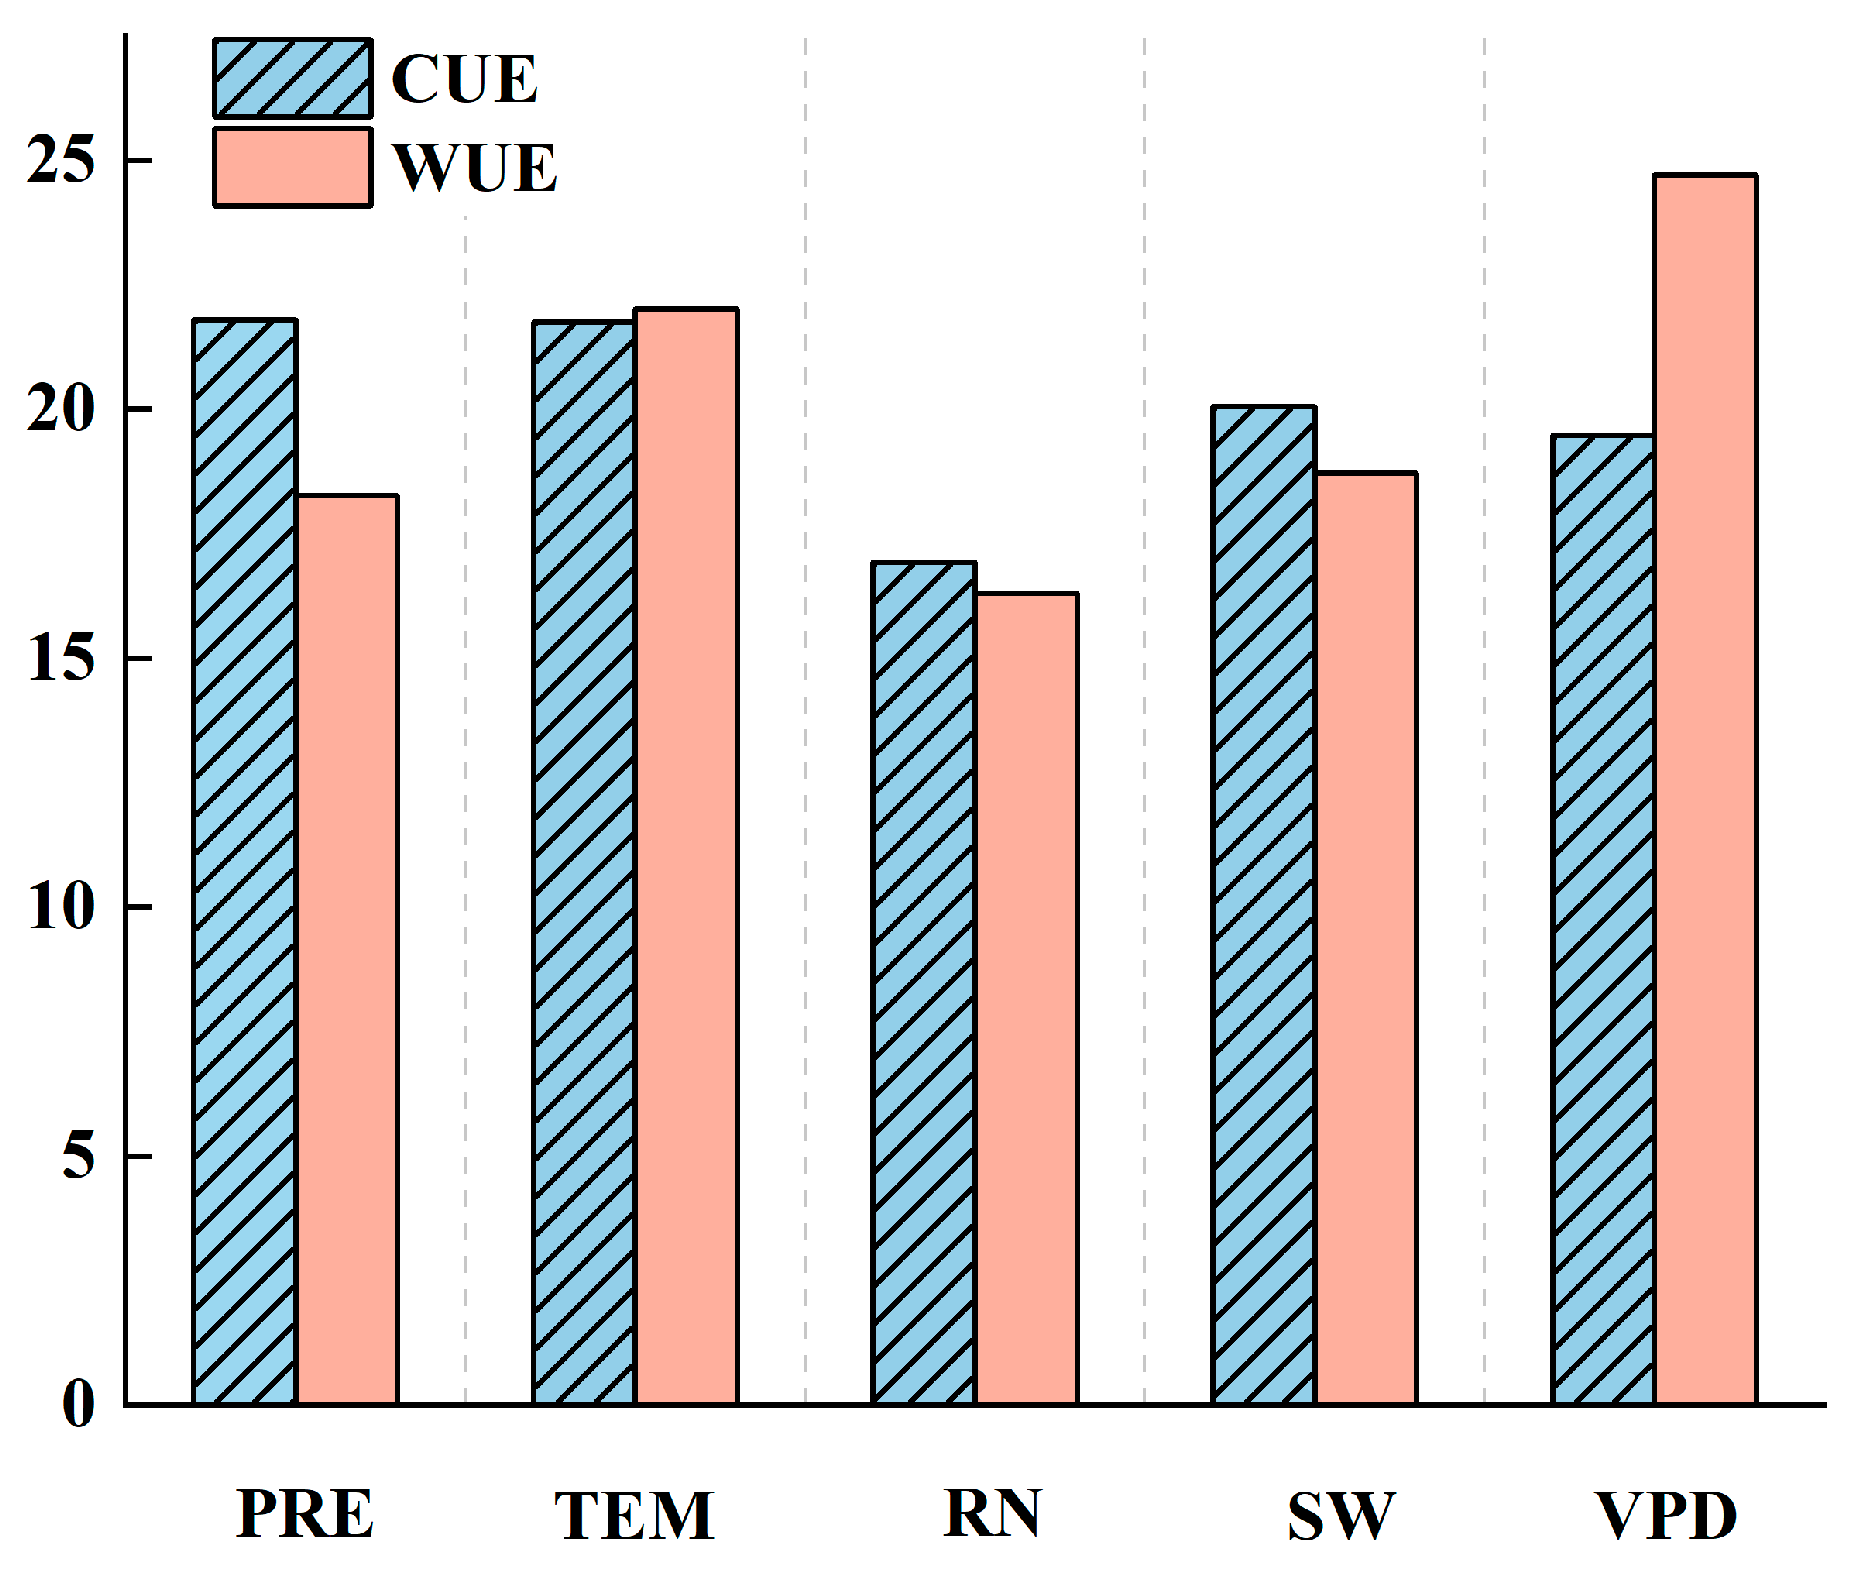
3.3.1. Relative Contribution of Climate Factors

During the study period, PRE, TEM, RN, SW, and VPD showed significant spatial differences in their contributions to CUE and WUE in Central Asia. Overall, PRE made a positive contribution to CUE, with the area of its positive contribution accounting for 53.78%. TEM, RN, and VPD made negative contributions to CUE in most of the study area, with VPD contributing negatively to CUE in 75.63% of the study area. PRE and TEM made positive contributions to the decline in WUE, with contribution areas accounting for 59.58% and 69.39%, respectively, indicating that PRE and TEM contributed to the decrease in WUE in the study area. RN, SW, and VPD made negative contributions to WUE, suggesting that these three climatic factors have suppressed the decline in WUE to some extent (Figure 8).

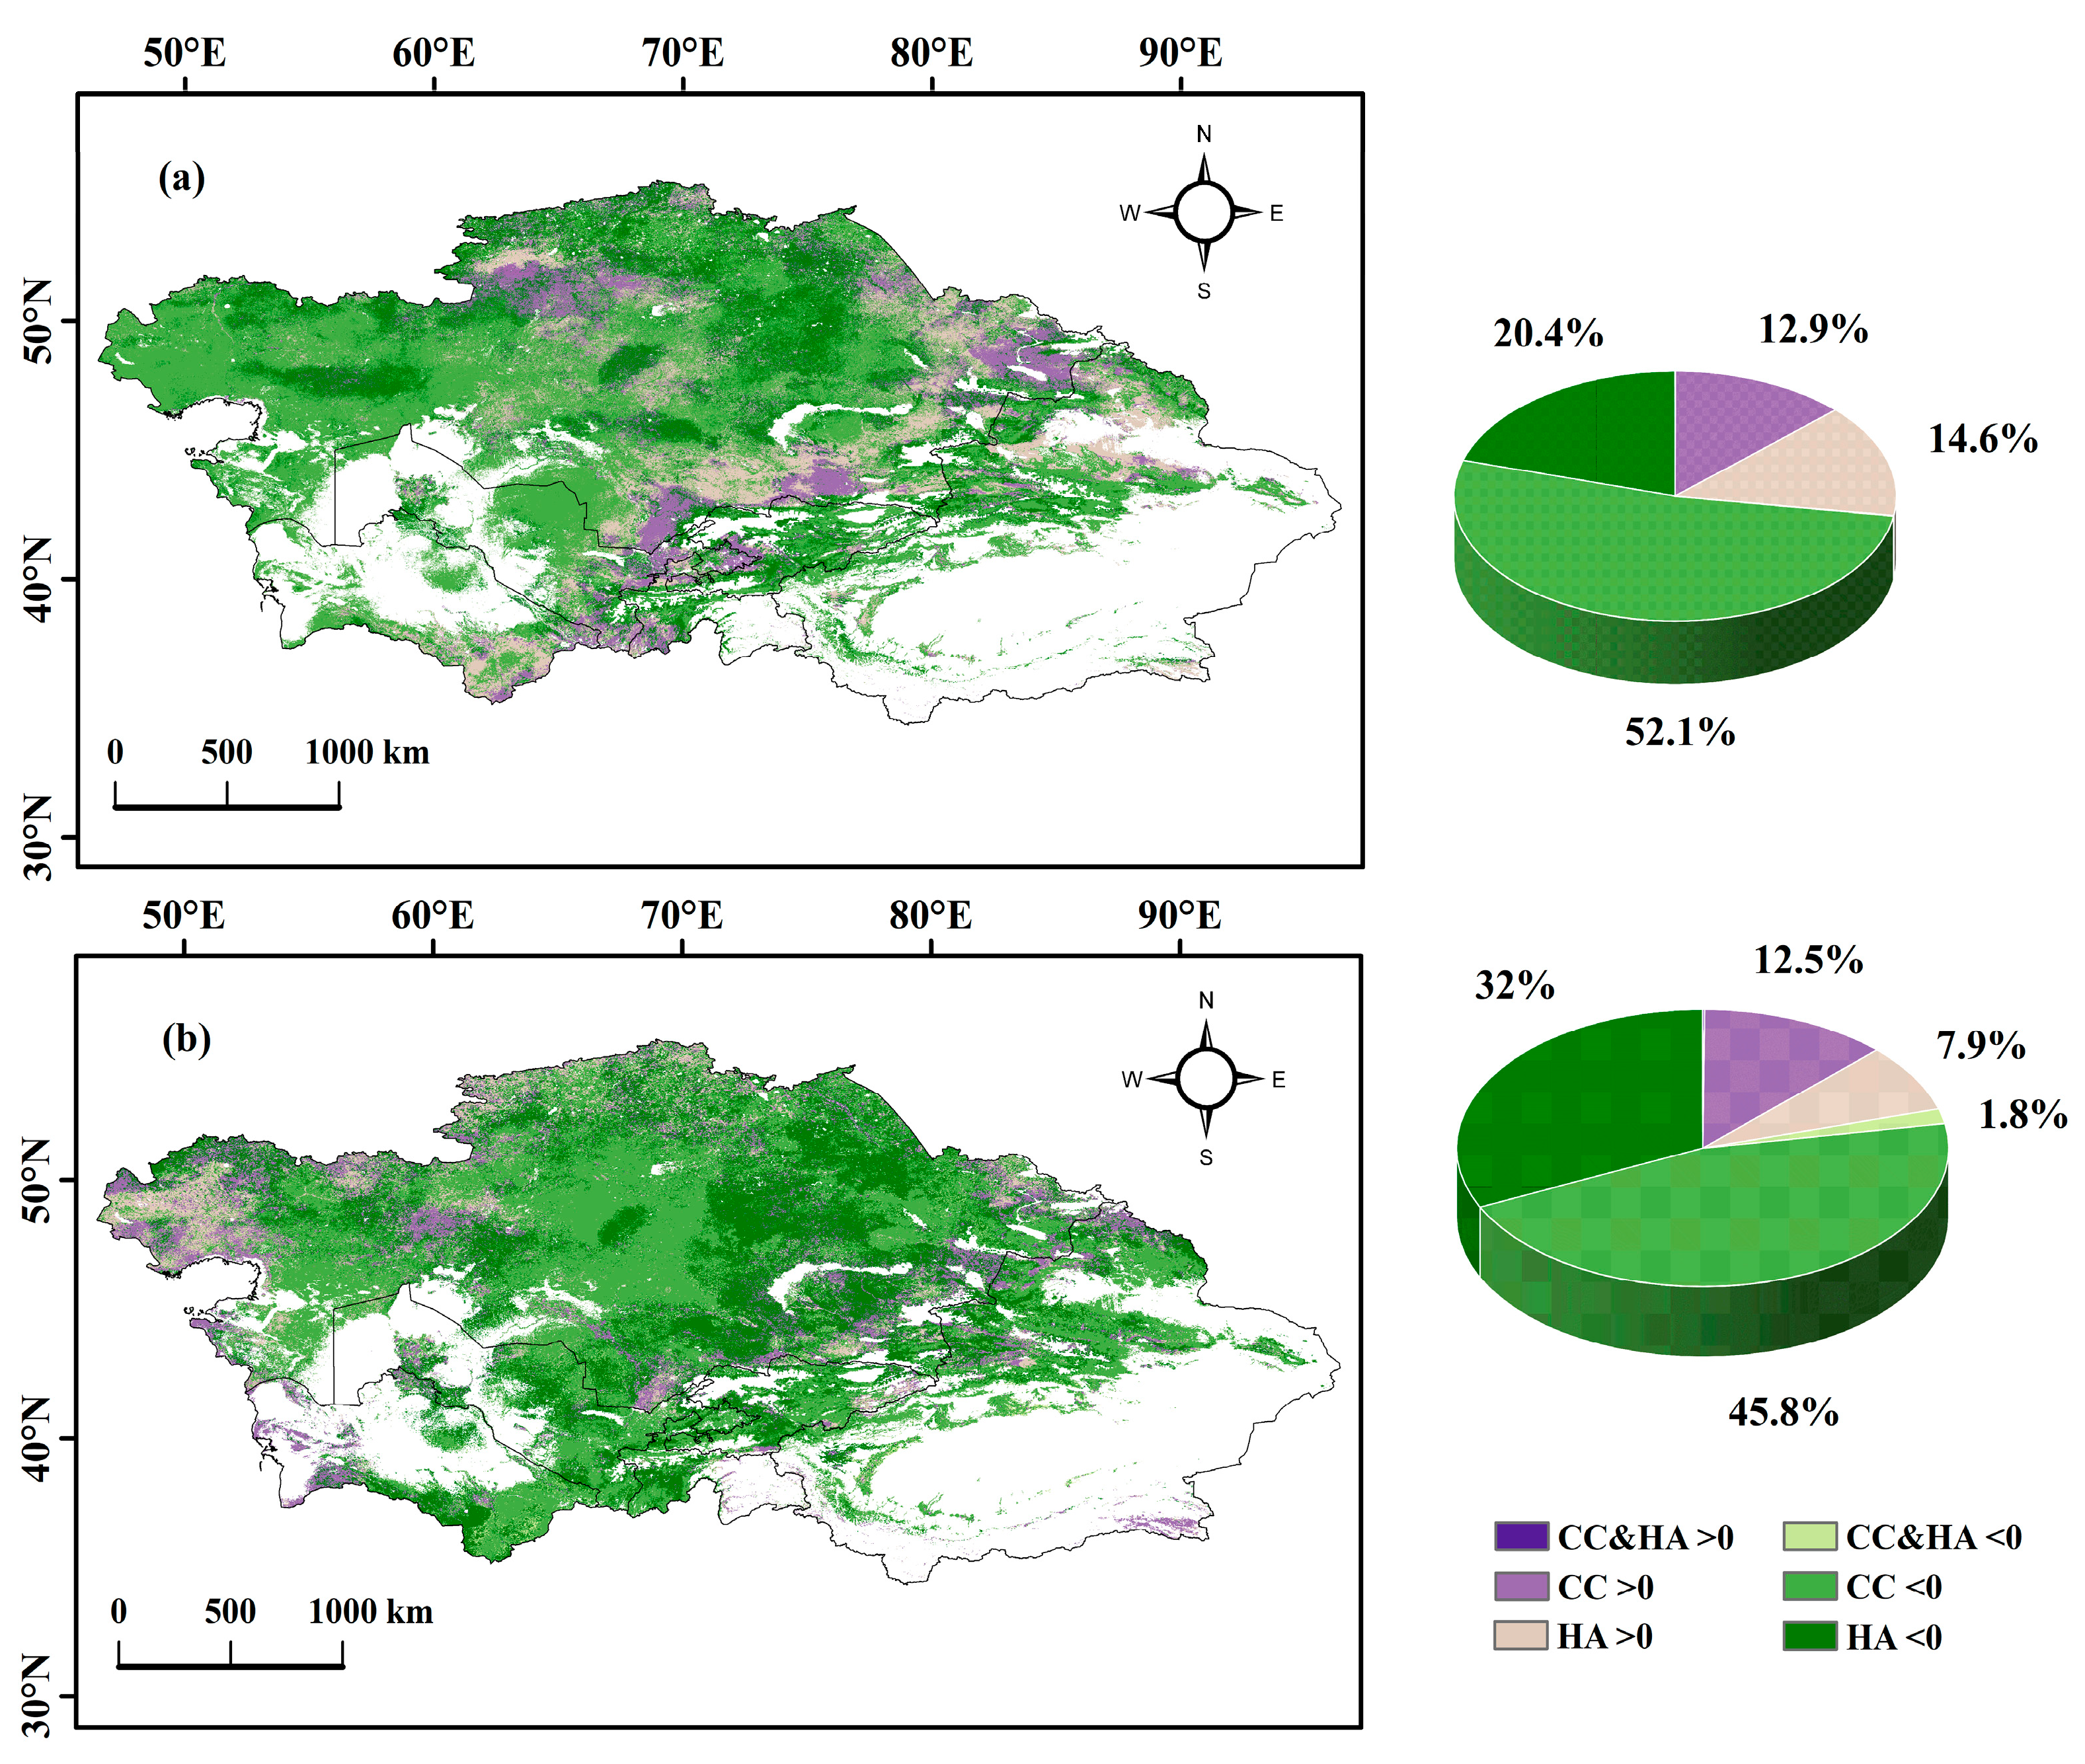
3.3.2. The Relative Contributions of Climate Change and Human Activities to Changes in CUE and WUE

Analysis of the residual trends of CUE and WUE from 2001 to 2022 revealed that climate factors overall made negative contributions. The average contributions of climate factors to CUE and WUE were −0.104 and −0.097 g C k g 1 H 2 O y e a r 1 , respectively. Negative contributions of climate factors to CUE accounted for 66.78% of the vegetated area, while the area proportion for negative contributions to WUE covered 55.52% of the area (Figure 9). In Central Asia, CUE and WUE are influenced not only by climate change but also by human activities such as grazing and cultivation. It was found that human activities had a relatively large impact on CUE and WUE changes, mostly making positive contributions, with mean contributions of 0.103 and 0.086 g C k g 1 H 2 O y e a r 1 , respectively.
Based on the results of trend and contribution analyses, a dominant factor partitioning of CUE and WUE changes in Central Asia from 2001 to 2022 was conducted. CUE and WUE in Central Asia are primarily influenced by climatic factors, which contribute to the decline in CUE, accounting for 52.05% of the total regional vegetation area (Figure 10a). This decline is mainly distributed in the Caspian coastal lowlands, the Syr Darya Basin, the Tian Shan Mountains and Kunlun Mountains, and the Altai Mountains. Climatic factors dominated the decline in WUE, accounting for 45.81% of the total vegetation area. These areas are distributed along the Aral Sea coast, in the oases around the Karakum Desert, in southeastern Turkmenistan, at the edges of the Tian Shan Mountains and Kunlun Mountains, and in the oases around the Gurbantünggüt and Taklamakan Deserts (Figure 10b). Anthropogenic activities were the second major factor leading to the decrease in CUE and WUE. These activities were particularly dominant in the decrease in CUE, accounting for 20.39% of the total area, primarily in the Kazakh Hills, the Ural River Basin, and the Lower Amu Darya.
Human activities are the second largest driving factor contributing to the reduction in CUE and WUE, primarily in the Kazakh Hills, the Ural River Basin, and the lower reaches of the Amu Darya River (Figure 10a). Areas where human activities have led to an increase in CUE account for 14.6% of the total area, with these regions mainly concentrated from the Aral Sea to the Balkhash Lake Basin, southeastern Turkmenistan, and the edges of the Gurbantünggüt Desert. These regions are mostly located in areas with relatively abundant water resources, such as rivers and lakes, and have well-developed agriculture. Irrigation and fertilization by human activities have enhanced vegetation growth and strengthened carbon sequestration capacity in these areas. Conversely, areas where human activities have driven a decrease in CUE account for 20.39% of the total area. These declines are primarily found in the Kazakh Hills, dominated by grasslands that are significantly affected by overgrazing. Human activities have also caused a decline in WUE, affecting 32.02% of the total area, mainly distributed in the Kazakh Hills, the Aral Sea to the Balkhash Lake Basin, the southern edges of Turkmenistan, and western Tajikistan. These regions, characterized by relatively abundant water resources and agriculture in hilly and oasis areas, have experienced an increase in GPP due to human-induced irrigation. However, the rapid rise in ET caused by water supplementation has ultimately resulted in a declining trend in WUE.

4. Discussion

4.1. Spatio-Temporal Distribution and Variability of CUE and WUE in Central Asia

Previous studies have confirmed that the MODIS GPP and NPP products effectively capture the spatiotemporal patterns of GPP and NPP across various biomes and climate conditions, and are consistent with GPP estimates from ground-based flux towers and NPP estimates from field observations [35]. In Central Asia, NPP has declined at a rate of −1.58 g C m 2 y e a r 1 , primarily driven by changes in precipitation and warming [36]. GPP values in most parts of the region show an increasing trend, with notable spatial variation [37]. Over the past four decades, evapotranspiration in Central Asia has also demonstrated an upward trend [38]. The ecosystem CUE and WUE data derived from NPP, GPP, and ET calculated using MODIS products show a high degree of agreement with the results obtained from covariance flux towers at ground stations, demonstrating the accuracy and reliability of MODIS products in assessing ecosystem water efficiency [39]. The multi-year mean value of CUE in Central Asia is 0.569, which is consistent with the estimated mean value of CUE, which is greater than 0.5 in arid and semi-arid regions. The high values of CUE in Central Asia are observed at higher elevations in the Tian Shan and Kunlun Mountains, where ecosystems consume less energy for autotrophic respiration, allowing vegetation to fix and transfer carbon more efficiently. WUE estimation has been widely validated in Asia, Central Asia, China, India, and Africa [17,40]. The global WUE mean calculated from MODIS data is 1.7 g C k g 1 H 2 O , while the mean value of WUE in Central Asia is 2.152  g C k g 1 H 2 O based on the same methodology used in this study. It is obvious that WUE in Central Asia is higher than the global level. Vegetation in dryland ecosystems, having adapted to arid environments over a long period of time, has evolved a variety of drought-tolerant characteristics and adaptive mechanisms, which have resulted in its WUE being higher than the global average. The range of WUE is 0~5 g C k g 1 H 2 O , which is consistent with previous studies on WUE in arid regions and aligns with the range used to analyze spatio-temporal variations in ecosystem WUE in Central Asia and Xinjiang [41,42].
The estimation of CUE and WUE based on GEE significantly improved the research efficiency of this study. Dryland ecosystems, as areas sensitive to global climate change and human activities, respond strongly to multiple factors, which together lead to significant spatio-temporal variability and high uncertainty in dryland carbon and water fluxes [43]. Therefore, detecting and assessing CUE and WUE in dryland ecosystems can help clarify the spatial and temporal distribution of CUE and WUE, as well as the drivers of these changes, providing valuable insights into predicting future climate change. In addition, this study found that CUE and WUE showed a significant increase in these places from the Aral Sea to the Lake Balkhash Basin and Ili River Valley. It has been shown that the actual net primary productivity (ANPP) shows an overall increasing trend in the Ili River Basin in China and Kazakhstan, mainly due to the change in the basin climate towards warmer and wetter conditions and the rationalization of grazing in the region which contributes to the growth of vegetation [44]. The overall interannual variability of CUE and WUE in Central Asia is small, but the intensity of spatial variability is large. Therefore, studying the spatio-temporal variations in CUE and WUE in Central Asia can help us better understand the development trends and cyclical mechanisms of the carbon and water cycles in arid regions, thus providing strong support for optimizing water resource management.

4.2. Main Factors Driving Spatial and Temporal Variations in CUE and WUE

CUE and WUE are not only affected by their own physiological conditions but also related to the climatic and non-climatic factors of their growing environment. The response of WUE to various factors is mainly driven by the core process of photosynthesis, and it is also significantly influenced by the water loss status of the ecosystem. However, changes in CUE are more dependent on the efficiency and performance of plants in the processes of carbon fixation, transformation, and utilization [45,46]. Based on the results of this study, we found that the MODIS product NPP gradually decreased during the study period, while GPP showed an increasing trend. However, it is noteworthy that the growth rate of GPP did not keep pace with the growth rate of ecosystem transpiration, revealing a significant disparity that highlights the underlying reasons for the decrease in both CUE and WUE.
Climatic factors were found to have a significant effect on the variation in CUE and WUE in Central Asia. TEM, SW, and VPD were negatively correlated with CUE in most regions of Central Asia. Increased temperature and high VPD demand more energy to maintain plant growth, accelerating vegetation respiration, which is more sensitive to increased temperature than photosynthesis. As a result, vegetation CUE tends to decrease with rising temperatures [47,48]. PRE mostly positively affects CUE, while it mostly negatively affects WUE. In dryland ecosystems under drought stress, vegetation alters its water uptake channels, experiences increased pressure on photosynthesis, faces reduced nitrogen supply, and exhibits slower vegetative tissue growth. These factors collectively lead to an increase in CUE due to the rise in precipitation [18]. It has been shown that changes in water use efficiency, driven by GPP and ET, display contrasting patterns in wet and arid regions. In wet regions, GPP is the primary driver of changes in WUE, whereas in arid regions, ET plays a more significant role in affecting WUE [22]. This explains the negative correlation between PRE and SW with WUE in the arid zone of Central Asia, where increased moisture in water-limited regions leads to a rise in ET that outpaces the increase in GPP, resulting in a decrease in ecosystem WUE.
The results of the differentiation of dominant factors show that the decline in CUE and WUE in Central Asia is mainly affected by climate, followed by a decreasing trend due to human activities. Especially in the water-scarce arid regions, human activities have increasingly disturbed the ecological environment. The main kinds of influence include land use change, grazing, ecological engineering, and economic development methods [25]. The effects of anthropogenic activities on CUE and WUE exhibit spatial variation, largely depending on factors such as vegetation types, grazing practices, and local environmental conditions. The increase in CUE due to human activities was mainly concentrated in the Aral Sea to the Lake Balkhash Basin, oases around the Gurbantünggüt Desert, and southeastern Turkmenistan and was due to long-term human efforts in irrigated agriculture and ecological conservation. In contrast, the significant decrease in the interannual variability of WUE in Central Asia was concentrated in the oases, which may be due to human activities such as irrigation and irrational cropping structure of arable land during the monitoring period. Therefore, protecting dryland ecosystems requires comprehensive measures, including water resource management, vegetation restoration, and optimization of land use practices, to achieve a harmonious balance between human activities and ecosystems.

4.3. Uncertainty and Future Outlook

The study explores the spatio-temporal distribution of CUE and WUE in Central Asian ecosystems, along with the underlying driving mechanisms, significantly advancing our understanding of these critical ecological processes. Given the low vegetation cover and exposed soil surfaces in arid regions, the study selectively excluded desert areas with sparse vegetation during data analysis to improve the reliability of the results. However, some uncertainties persist. CUE and WUE estimates were derived from MODIS data, with variables such as GPP, NPP, and ET obtained from global datasets. Due to the scarcity of in situ data for characterizing CUE and WUE in Central Asia, the uncertainty of the results is increased. Therefore, expanding the carbon and water flux observation network in arid regions is essential for providing better data support for future research. CUE is influenced by multiple factors, including vegetation type, climate conditions, tree age, and human management. Moreover, human activities such as grazing and land use changes also play a significant role. As such, future research will comprehensively address these factors and further refine our understanding of the impacts of human activities on these ecological processes.

5. Conclusions

This study estimated CUE and WUE in the Central Asiatic region for 2001–2022 using the GEE platform. In addition, partial derivative analysis was adopted to explore the contribution of climate and human activities to CUE and WUE and to quantify the dominant factors controlling CUE and WUE in Central Asia. The main conclusions of the study were as follows:
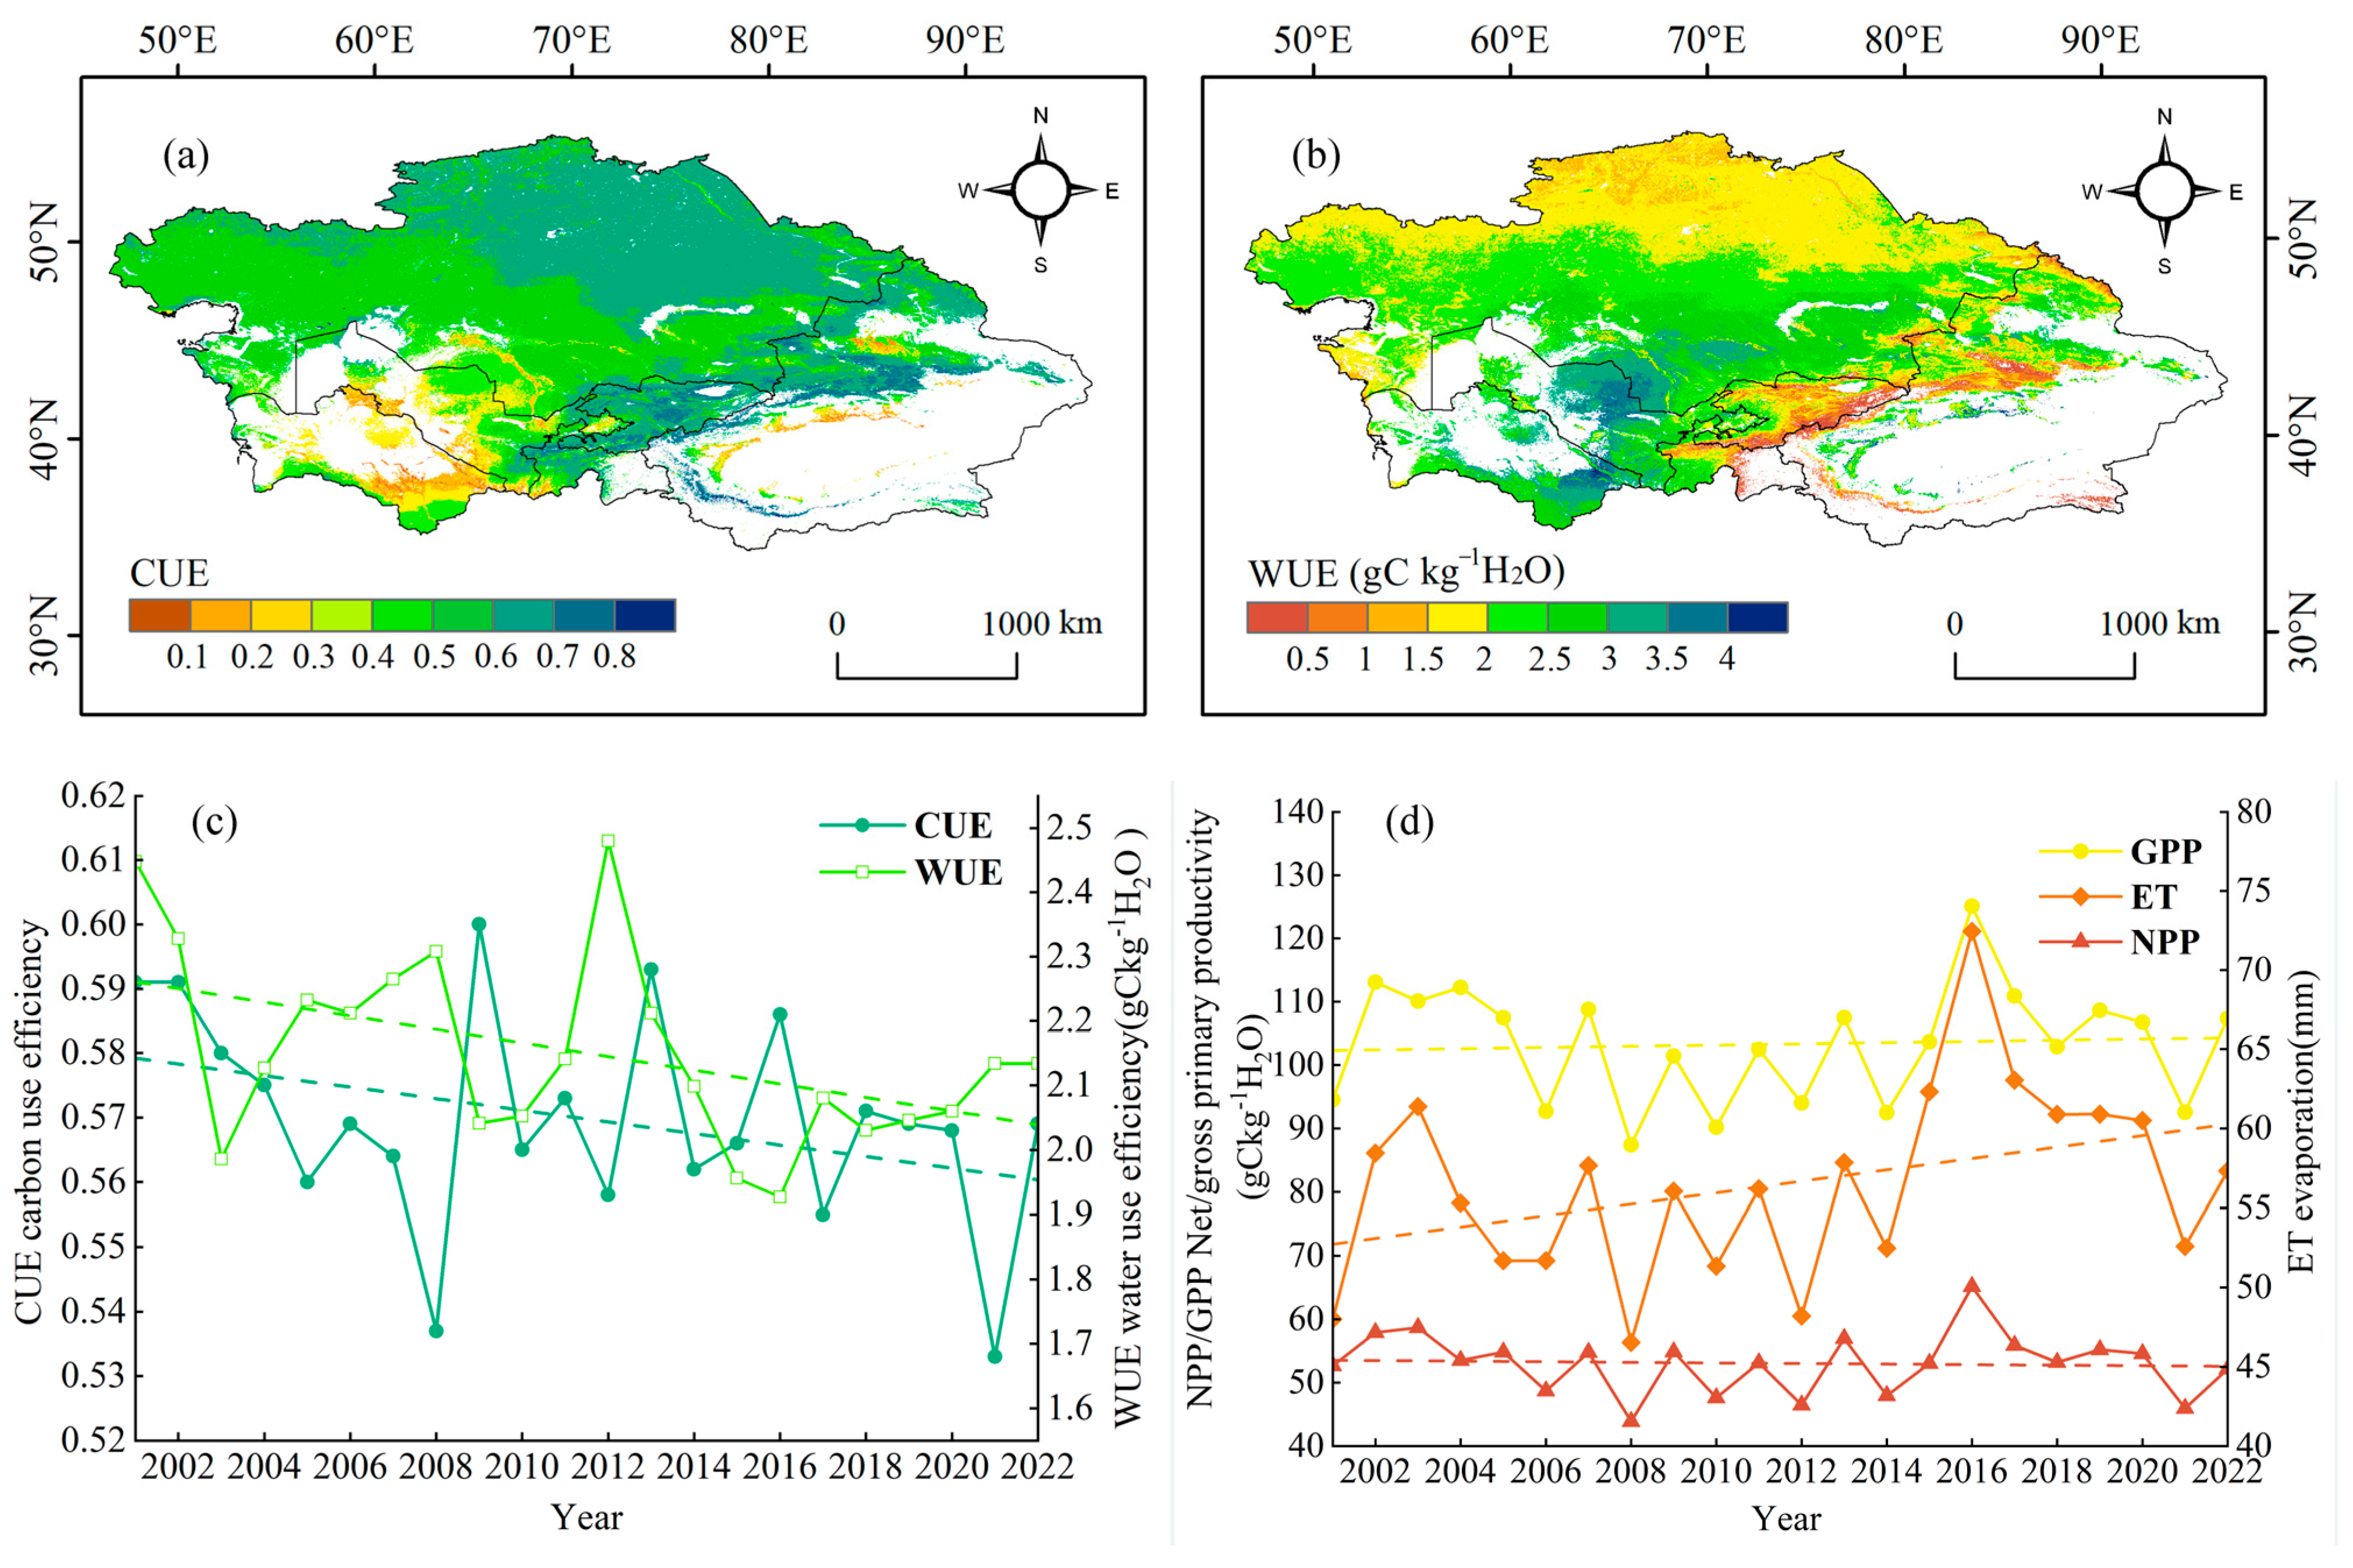
  • The mean values of CUE and WUE in Central Asia are 0.569 and 2.152   g C k g 1 H 2 O , respectively. Both show significant spatial distribution differences. High CUE values are generally distributed in relatively cold and dry regions, while high WUE values are mainly concentrated in basins and oasis areas.
  • The CUE and WUE in Central Asia show an overall insignificant decreasing trend, with CUE declining at a rate of 0.5 × 10 3   y e a r 1 and WUE decreasing at a rate of 9.8 × 10 3   g C k g 1 H 2 O y e a r 1 .
  • Among the climatic factors, VPD has the strongest correlation with CUE, and its negative contribution to CUE covers 75.63% of the study area. PRE and TEM have the strongest correlation with WUE, contributing to the decline in WUE.
  • The impacts of climate change and human activities show significant differences. Climate factors generally contribute negatively to changes in CUE and WUE, while human activities mainly have a positive impact. In Central Asia, CUE and WUE are primarily driven by climate factors, with climate-induced declines accounting for 52.05% and 45.81% of the total vegetation area, respectively. Human activities are the second largest factor contributing to the decrease in CUE and WUE, mainly in areas with developed agriculture, such as rivers, lakes, and oases, which are heavily disturbed by human activities.

Author Contributions

L.X.: conceptualization, methodology, software, validation, and writing—original draft; J.W.: methodology, software, supervision, project administration, and writing—review and editing; J.D.: resources, supervision, and funding acquisition; Z.Z.: methodology and supervision; S.Q.: methodology and software; R.W.: methodology and software. All authors have read and agreed to the published version of the manuscript.

Funding

This study was funded by the Innovation Team for Efficient Use of Water Resources in Arid Zones (2022TSYCTD0001) (Jianli Ding) and by the China-Harbinia Transboundary Basin Ili River-Lake Balkhash Recent Modern Climate and Hydrological Changes and Mechanisms (U2003202) (Jinjie Wang).

Data Availability Statement

Data are contained within the article.

Acknowledgments

The authors would like to thank the reviewers for their expertise and valuable input.

Conflicts of Interest

The authors declare no conflicts of interest.

References

  1. Zhang, Y.J.; Yu, G.R.; Yang, J.; Wimberly, M.C.; Zhang, X.Z.; Tao, J.; Jiang, Y.B.; Zhu, J.T. Climate-driven global changes in carbon use efficiency. Glob. Ecol. Biogeogr. 2014, 23, 144–155. [Google Scholar] [CrossRef]
  2. Huang, M.; Piao, S.; Sun, Y.; Ciais, P.; Cheng, L.; Mao, J.; Poulter, B.; Shi, X.; Zeng, Z.; Wang, Y. Change in terrestrial ecosystem water-use efficiency over the last three decades. Glob. Chang. Biol. 2015, 21, 2366–2378. [Google Scholar] [CrossRef]
  3. Yang, Y.T.; Guan, H.; Batelaan, O.; McVicar, T.R.; Long, D.; Piao, S.L.; Liang, W.; Liu, B.; Jin, Z.; Simmons, C.T. Contrasting responses of water use efficiency to drought across global terrestrial ecosystems. Sci. Rep. 2016, 6, 23284. [Google Scholar] [CrossRef]
  4. Cheng, L.; Zhang, L.; Wang, Y.P.; Canadell, J.G.; Chiew, F.H.S.; Beringer, J.; Li, L.H.; Miralles, D.G.; Piao, S.L.; Zhang, Y.Q. Recent increases in terrestrial carbon uptake at little cost to the water cycle. Nat. Commun. 2017, 8, 110. [Google Scholar] [CrossRef]
  5. Beer, C.; Reichstein, M.; Tomelleri, E.; Ciais, P.; Jung, M.; Carvalhais, N.; Rödenbeck, C.; Arain, M.A.; Baldocchi, D.; Bonan, G.B.; et al. Terrestrial Gross Carbon Dioxide Uptake: Global Distribution and Covariation with Climate. Science 2010, 329, 834–838. [Google Scholar] [CrossRef]
  6. Cai, W.Y.; Ullah, S.; Yan, L.; Lin, Y. Remote Sensing of Ecosystem Water Use Efficiency: A Review of Direct and Indirect Estimation Methods. Remote Sens. 2021, 13, 2393. [Google Scholar] [CrossRef]
  7. Cho, E.; Choi, M. Regional scale spatio-temporal variability of soil moisture and its relationship with meteorological factors over the Korean peninsula. J. Hydrol. 2014, 516, 317–329. [Google Scholar] [CrossRef]
  8. Beringer, J.; Hutley, L.B.; Hacker, J.M.; Neininger, B. Patterns and processes of carbon, water and energy cycles across northern Australian landscapes: From point to region. Agric. For. Meteorol. 2011, 151, 1409–1416. [Google Scholar] [CrossRef]
  9. Rayner, P.J.; Scholze, M.; Knorr, W.; Kaminski, T.; Giering, R.; Widmann, H. Two decades of terrestrial carbon fluxes from a carbon cycle data assimilation system (CCDAS). Glob. Biogeochem. Cycles 2005, 19, GB2026. [Google Scholar] [CrossRef]
  10. Smith, W.K.; Fox, A.M.; MacBean, N.; Moore, D.J.P.; Parazoo, N.C. Constraining estimates of terrestrial carbon uptake: New opportunities using long-term satellite observations and data assimilation. New Phytol. 2019, 225, 105–112. [Google Scholar] [CrossRef]
  11. Smith, W.K.; Dannenberg, M.P.; Yan, D.; Herrmann, S.; Barnes, M.L.; Barron-Gafford, G.A.; Biederman, J.A.; Ferrenberg, S.; Fox, A.M.; Hudson, A.; et al. Remote sensing of dryland ecosystem structure and function: Progress, challenges, and opportunities. Remote Sens. Environ. 2019, 233, 111401. [Google Scholar] [CrossRef]
  12. Scott, R.L.; Edwards, E.A.; Shuttleworth, W.J.; Huxman, T.E.; Watts, C.; Goodrich, D.C. Interannual and seasonal variation in fluxes of water and carbon dioxide from a riparian woodland ecosystem. Agric. For. Meteorol. 2004, 122, 65–84. [Google Scholar] [CrossRef]
  13. Dragoni, D.; Schmid, H.P.; Grimmond, C.S.B.; Loescher, H.W. Uncertainty of annual net ecosystem productivity estimated using eddy covariance flux measurements. J. Geophys. Res.-Atmos. 2007, 112, D17102. [Google Scholar] [CrossRef]
  14. He, B.; Wang, H.Y.; Huang, L.; Liu, J.J.; Chen, Z.Y. A new indicator of ecosystem water use efficiency based on surface soil moisture retrieved from remote sensing. Ecol. Indic. 2017, 75, 10–16. [Google Scholar] [CrossRef]
  15. Tang, X.; Li, H.; Desai, A.R.; Nagy, Z.; Luo, J.; Kolb, T.E.; Olioso, A.; Xu, X.; Yao, L.; Kutsch, W.; et al. How is water-use efficiency of terrestrial ecosystems distributed and changing on Earth? Sci. Rep. 2014, 4, 7483. [Google Scholar] [CrossRef]
  16. Gorelick, N.; Hancher, M.; Dixon, M.; Ilyushchenko, S.; Thau, D.; Moore, R. Google Earth Engine: Planetary-scale geospatial analysis for everyone. Remote Sens. Environ. 2017, 202, 18–27. [Google Scholar] [CrossRef]
  17. Li, B.; Huang, F.; Qin, L.J.; Qi, H.; Sun, N. Spatio-Temporal Variations of Carbon Use Efficiency in Natural Terrestrial Ecosystems and the Relationship with Climatic Factors in the Songnen Plain, China. Remote Sens. 2019, 11, 2513. [Google Scholar] [CrossRef]
  18. Kim, D.; Lee, M.I.; Jeong, S.J.; Im, J.; Cha, D.H.; Lee, S. Intercomparison of Terrestrial Carbon Fluxes and Carbon Use Efficiency Simulated by CMIP5 Earth System Models. Asia-Pac. J. Atmos. Sci. 2018, 54, 145–163. [Google Scholar] [CrossRef]
  19. Peters, W.; van der Velde, I.R.; van Schaik, E.; Miller, J.B.; Ciais, P.; Duarte, H.F.; van der Laan-Luijkx, I.T.; van der Molen, M.K.; Scholze, M.; Schaefer, K.; et al. Increased water-use efficiency and reduced CO2 uptake by plants during droughts at a continental scale. Nat. Geosci. 2018, 11, 744–748. [Google Scholar] [CrossRef]
  20. Blum, A. Drought resistance, water-use efficiency, and yield potential—Are they compatible, dissonant, or mutually exclusive? Aust. J. Agric. Res. 2005, 56, 1159–1168. [Google Scholar] [CrossRef]
  21. Xiao, B.; Bai, X.; Zhao, C.; Tan, Q.; Li, Y.; Luo, G.; Wu, L.; Chen, F.; Li, C.; Ran, C.; et al. Responses of carbon and water use efficiencies to climate and land use changes in China’s karst areas. J. Hydrol. 2023, 617, 128968. [Google Scholar] [CrossRef]
  22. Chen, T.; Bao, A.; Jiapaer, G.; Guo, H.; Zheng, G.; Jiang, L.; Chang, C.; Tuerhanjiang, L. Disentangling the relative impacts of climate change and human activities on arid and semiarid grasslands in Central Asia during 1982–2015. Sci. Total Environ. 2019, 653, 1311–1325. [Google Scholar] [CrossRef]
  23. Jiang, L.L.; Jiapaer, G.; Bao, A.M.; Kurban, A.; Guo, H.; Zheng, G.X.; De Maeyer, P. Monitoring the long-term desertification process and assessing the relative roles of its drivers in Central Asia. Ecol. Indic. 2019, 104, 195–208. [Google Scholar] [CrossRef]
  24. Zhang, L.; Xiao, J.F.; Zheng, Y.; Li, S.N.; Zhou, Y. Increased carbon uptake and water use efficiency in global semi-arid ecosystems. Environ. Res. Lett. 2020, 15, 1478–9326. [Google Scholar] [CrossRef]
  25. Jiang, L.; Bao, A.; Guo, H.; Ndayisaba, F. Vegetation dynamics and responses to climate change and human activities in Central Asia. Sci. Total Environ. 2017, 599–600, 967–980. [Google Scholar] [CrossRef]
  26. Gedney, N.; Cox, P.M.; Betts, R.A.; Boucher, O.; Huntingford, C.; Stott, P.A. Detection of a direct carbon dioxide effect in continental river runoff records. Nature 2006, 439, 835–838. [Google Scholar] [CrossRef]
  27. Sun, H.; Bai, Y.; Lu, M.; Wang, J.; Tuo, Y.; Yan, D.; Zhang, W. Drivers of the water use efficiency changes in China during 1982–2015. Sci. Total Environ. 2021, 799, 149145. [Google Scholar] [CrossRef]
  28. Lunetta, R.S.; Knight, J.F.; Ediriwickrema, J. Land-cover characterization and change detection using multitemporal MODIS NDVI data. In Proceedings of the International Workshop on the Analysis of Multi-Temporal Remote Sensing Images, Biloxi, MS, USA, 16–18 May 2005; Volume 105, pp. 142–154. [Google Scholar]
  29. Roderick, M.L.; Rotstayn, L.D.; Farquhar, G.D.; Hobbins, M.T. On the attribution of changing pan evaporation. Geophys. Res. Lett. 2007, 34, 34. [Google Scholar] [CrossRef]
  30. Liu, W.B.; Sun, F.B. Assessing estimates of evaporative demand in climate models using observed pan evaporation over China. J. Geophys. Res.-Atmos. 2016, 121, 8329–8349. [Google Scholar] [CrossRef]
  31. Qu, S.; Wang, L.; Lin, A.; Yu, D.; Yuan, M.; Li, C.a. Distinguishing the impacts of climate change and anthropogenic factors on vegetation dynamics in the Yangtze River Basin, China. Ecol. Indic. 2020, 108, 105724. [Google Scholar] [CrossRef]
  32. Song, F.J.; Wang, S.J.; Bai, X.Y.; Wu, L.H.; Wang, J.F.; Li, C.J.; Chen, H.; Luo, X.L.; Xi, H.P.; Zhang, S.R.; et al. A New Indicator for Global Food Security Assessment: Harvested Area Rather Than Cropland Area. Chin. Geogr. Sci. 2022, 32, 204–217. [Google Scholar] [CrossRef]
  33. Ge, W.; Deng, L.; Wang, F.; Han, J. Quantifying the contributions of human activities and climate change to vegetation net primary productivity dynamics in China from 2001 to 2016. Sci. Total Environ. 2021, 773, 145648. [Google Scholar] [CrossRef]
  34. Xue, B.L.; Guo, Q.H.; Otto, A.; Xiao, J.F.; Tao, S.L.; Li, L. Global patterns, trends, and drivers of water use efficiency from 2000 to 2013. Ecosphere 2015, 6, 1890. [Google Scholar] [CrossRef]
  35. Zhang, Y.; Xu, M.; Chen, H.; Adams, J. Global pattern of NPP to GPP ratio derived from MODIS data: Effects of ecosystem type, geographical location and climate. Glob. Ecol. Biogeogr. 2010, 18, 280–290. [Google Scholar] [CrossRef]
  36. Li, Z.; Chen, Y.; Zhang, Q.; Li, Y. Spatial patterns of vegetation carbon sinks and sources under water constraint in Central Asia. J. Hydrol. 2020, 590, 125355. [Google Scholar] [CrossRef]
  37. Ma, W.; Ding, J.; Wang, J.; Zhang, J. Effects of aerosol on terrestrial gross primary productivity in Central Asia. Atmos. Environ. 2022, 288, 119294. [Google Scholar] [CrossRef]
  38. Ren, Y.; Yu, H.; Liu, C.; He, Y.; Huang, J.; Zhang, L.; Hu, H.; Zhang, Q.; Chen, S.; Liu, X.; et al. Attribution of Dry and Wet Climatic Changes over Central Asia. J. Clim. 2022, 35, 1399–1421. [Google Scholar] [CrossRef]
  39. Yahefujiang, H.; Zou, J.; Ding, J.L.; Zou, W.S.; Tangjialeke, W.; Yang, M. Spatial and Temporal Variation in Water Use Efficiency and Ecosystem Photosynthetic Efficiency in Central Asia. Remote Sens. 2023, 15, 5240. [Google Scholar] [CrossRef]
  40. Zou, J.; Ding, J.L.; Welp, M.; Huang, S.; Liu, B.H. Assessing the Response of Ecosystem Water Use Efficiency to Drought During and after Drought Events across Central Asia. Sensors 2020, 20, 581. [Google Scholar] [CrossRef]
  41. Qin, S.F.; Ding, J.L.; Ge, X.Y.; Wang, J.J.; Wang, R.M.; Zou, J.; Tan, J.; Han, L.J. Spatio-Temporal Changes in Water Use Efficiency and Its Driving Factors in Central Asia (2001–2021). Remote Sens. 2023, 15, 767. [Google Scholar] [CrossRef]
  42. Yang, L.S.; Feng, Q.; Wen, X.H.; Barzegar, R.; Adamowski, J.F.; Zhu, M.; Yin, Z.L. Contributions of climate, elevated atmospheric CO2 concentration and land surface changes to variation in water use efficiency in Northwest China. Catena 2022, 213, 106260. [Google Scholar] [CrossRef]
  43. Li, Q.; Zhang, C.L.; Shen, Y.P.; Jia, W.R.; Li, J. Quantitative assessment of the relative roles of climate change and human activities in desertification processes on the Qinghai-Tibet Plateau based on net primary productivity. Catena 2016, 147, 789–796. [Google Scholar] [CrossRef]
  44. Zhao, J.; Feng, H.; Xu, T.; Xiao, J.; Guerrieri, R.; Liu, S.; Wu, X.; He, X.; He, X. Physiological and environmental control on ecosystem water use efficiency in response to drought across the northern hemisphere. Sci. Total Environ. 2021, 758, 143599. [Google Scholar] [CrossRef] [PubMed]
  45. Du, L.T.; Gong, F.; Zeng, Y.J.; Ma, L.L.; Qiao, C.L.; Wu, H.Y. Carbon use efficiency of terrestrial ecosystems in desert/grassland biome transition zone: A case in Ningxia province, northwest China. Ecol. Indic. 2021, 120, 106971. [Google Scholar] [CrossRef]
  46. Novick, K.A.; Ficklin, D.L.; Stoy, P.C.; Williams, C.A.; Bohrer, G.; Oishi, A.C.; Papuga, S.A.; Blanken, P.D.; Noormets, A.; Sulman, B.N.; et al. The increasing importance of atmospheric demand for ecosystem water and carbon fluxes. Nat. Clim. Chang. 2016, 6, 1023–1027. [Google Scholar] [CrossRef]
  47. Niu, S.; Wu, M.; Han, Y.; Xia, J.; Li, L.; Wan, S. Water-mediated responses of ecosystem carbon fluxes to climatic change in a temperate steppe. New Phytol. 2007, 177, 209–219. [Google Scholar] [CrossRef]
  48. Lu, X.L.; Zhuang, Q.L. Evaluating evapotranspiration and water-use efficiency of terrestrial ecosystems in the conterminous United States using MODIS and AmeriFlux data. Remote Sens. Environ. 2010, 114, 1924–1939. [Google Scholar] [CrossRef]
Figure 1. Overview of the study area.
Land 13 02072 g001
Figure 2. The flow chart.
Land 13 02072 g002
Figure 3. Characteristics of spatial and temporal variations of CUE (a,c) and WUE (b,c) and trends of GPP, NPP and ET (d) in Central Asia from 2001 to 2022.
Land 13 02072 g003
Figure 4. Interannual rates of change and significance of CUE (a,c) and WUE (b,d) in Central Asia, 2001–2022.
Land 13 02072 g004
Figure 5. Correlation between CUE and PRE (a), TEM (b), RN (c), SW (d), VPD (e) in Central Asia, 2001–2022.
Land 13 02072 g005
Figure 6. Correlation between WUE and PRE (a), TEM (b), RN (c), SW (d), VPD (e) in Central Asia, 2001–2022.
Land 13 02072 g006
Figure 7. The contribution rates of each climatic factor to CUE and WUE, 2001–2022.
Land 13 02072 g007
Figure 8. Contribution of climatic factors to CUE (a,c,e,g,i) and WUE (b,d,f,h,j), and their respective area proportions (k).
Land 13 02072 g008
Figure 9. Central Asia region and climate and human activities’ contribution to CUE (a,b) and WUE (c,d), 2001–2022.
Land 13 02072 g009
Figure 10. Dominant factors for CUE (a) and WUE (b) changes in Central Asia, 2001–2022.
Land 13 02072 g010
Table 1. Criteria for determining drivers and calculation of contribution rate.
S l o p e C U E o b s  aScenarioDriving FactorClassification CriteriaContribution Rate of Driving Factors
S l o p e C U E c c  b S l o p e C U E H A  cContribution of
Climate Change/%
Contribution of
Human Activities/%
>0Scenario 1CC&HA>0>0 s l o p e ( C U E c c ) s l o p e ( C U E o b s ) s l o p e ( C U E H A ) s l o p e ( C U E o b s )
Scenario 2CC>0<01000
Scenario 3HA<0>00100
<0Scenario 4CC&HA<0<0 s l o p e ( C U E c c ) s l o p e ( C U E o b s ) s l o p e ( C U E H A ) s l o p e ( C U E o b s )
Scenario 5CC<0>01000
Scenario 6HA>0<00100
Note: a represents the trend rate of observed CUE, while b and c indicate the variation trends under the influence of climate change and human activities, respectively.
Table 2. Statistics of CUE and WUE Trend.
SlopeZ ValueTrend of CUE and WUEPercentage of Area (CUE)Percentage of Area (WUE)
0.0005 1.96 Significant increase 2.47%1.29%
0.0005 1.96 1.96 Non-significant increase22.93%19.51%
0.000 0.0005 1.96 1.96 Stable—unchanged23.25%1.40%
0.0005 1.96 1.96 Non-significant decrease42.70%62.63%
0.0005 1.96 Significant decrease8.65%15.17%
Disclaimer/Publisher’s Note: The statements, opinions and data contained in all publications are solely those of the individual author(s) and contributor(s) and not of MDPI and/or the editor(s). MDPI and/or the editor(s) disclaim responsibility for any injury to people or property resulting from any ideas, methods, instructions or products referred to in the content.

