
Exploring the Effects of Farmland Transfer on Farm Household Well-Being: Evidence from Ore–Agriculture Compound Areas in Northwest China


Abstract
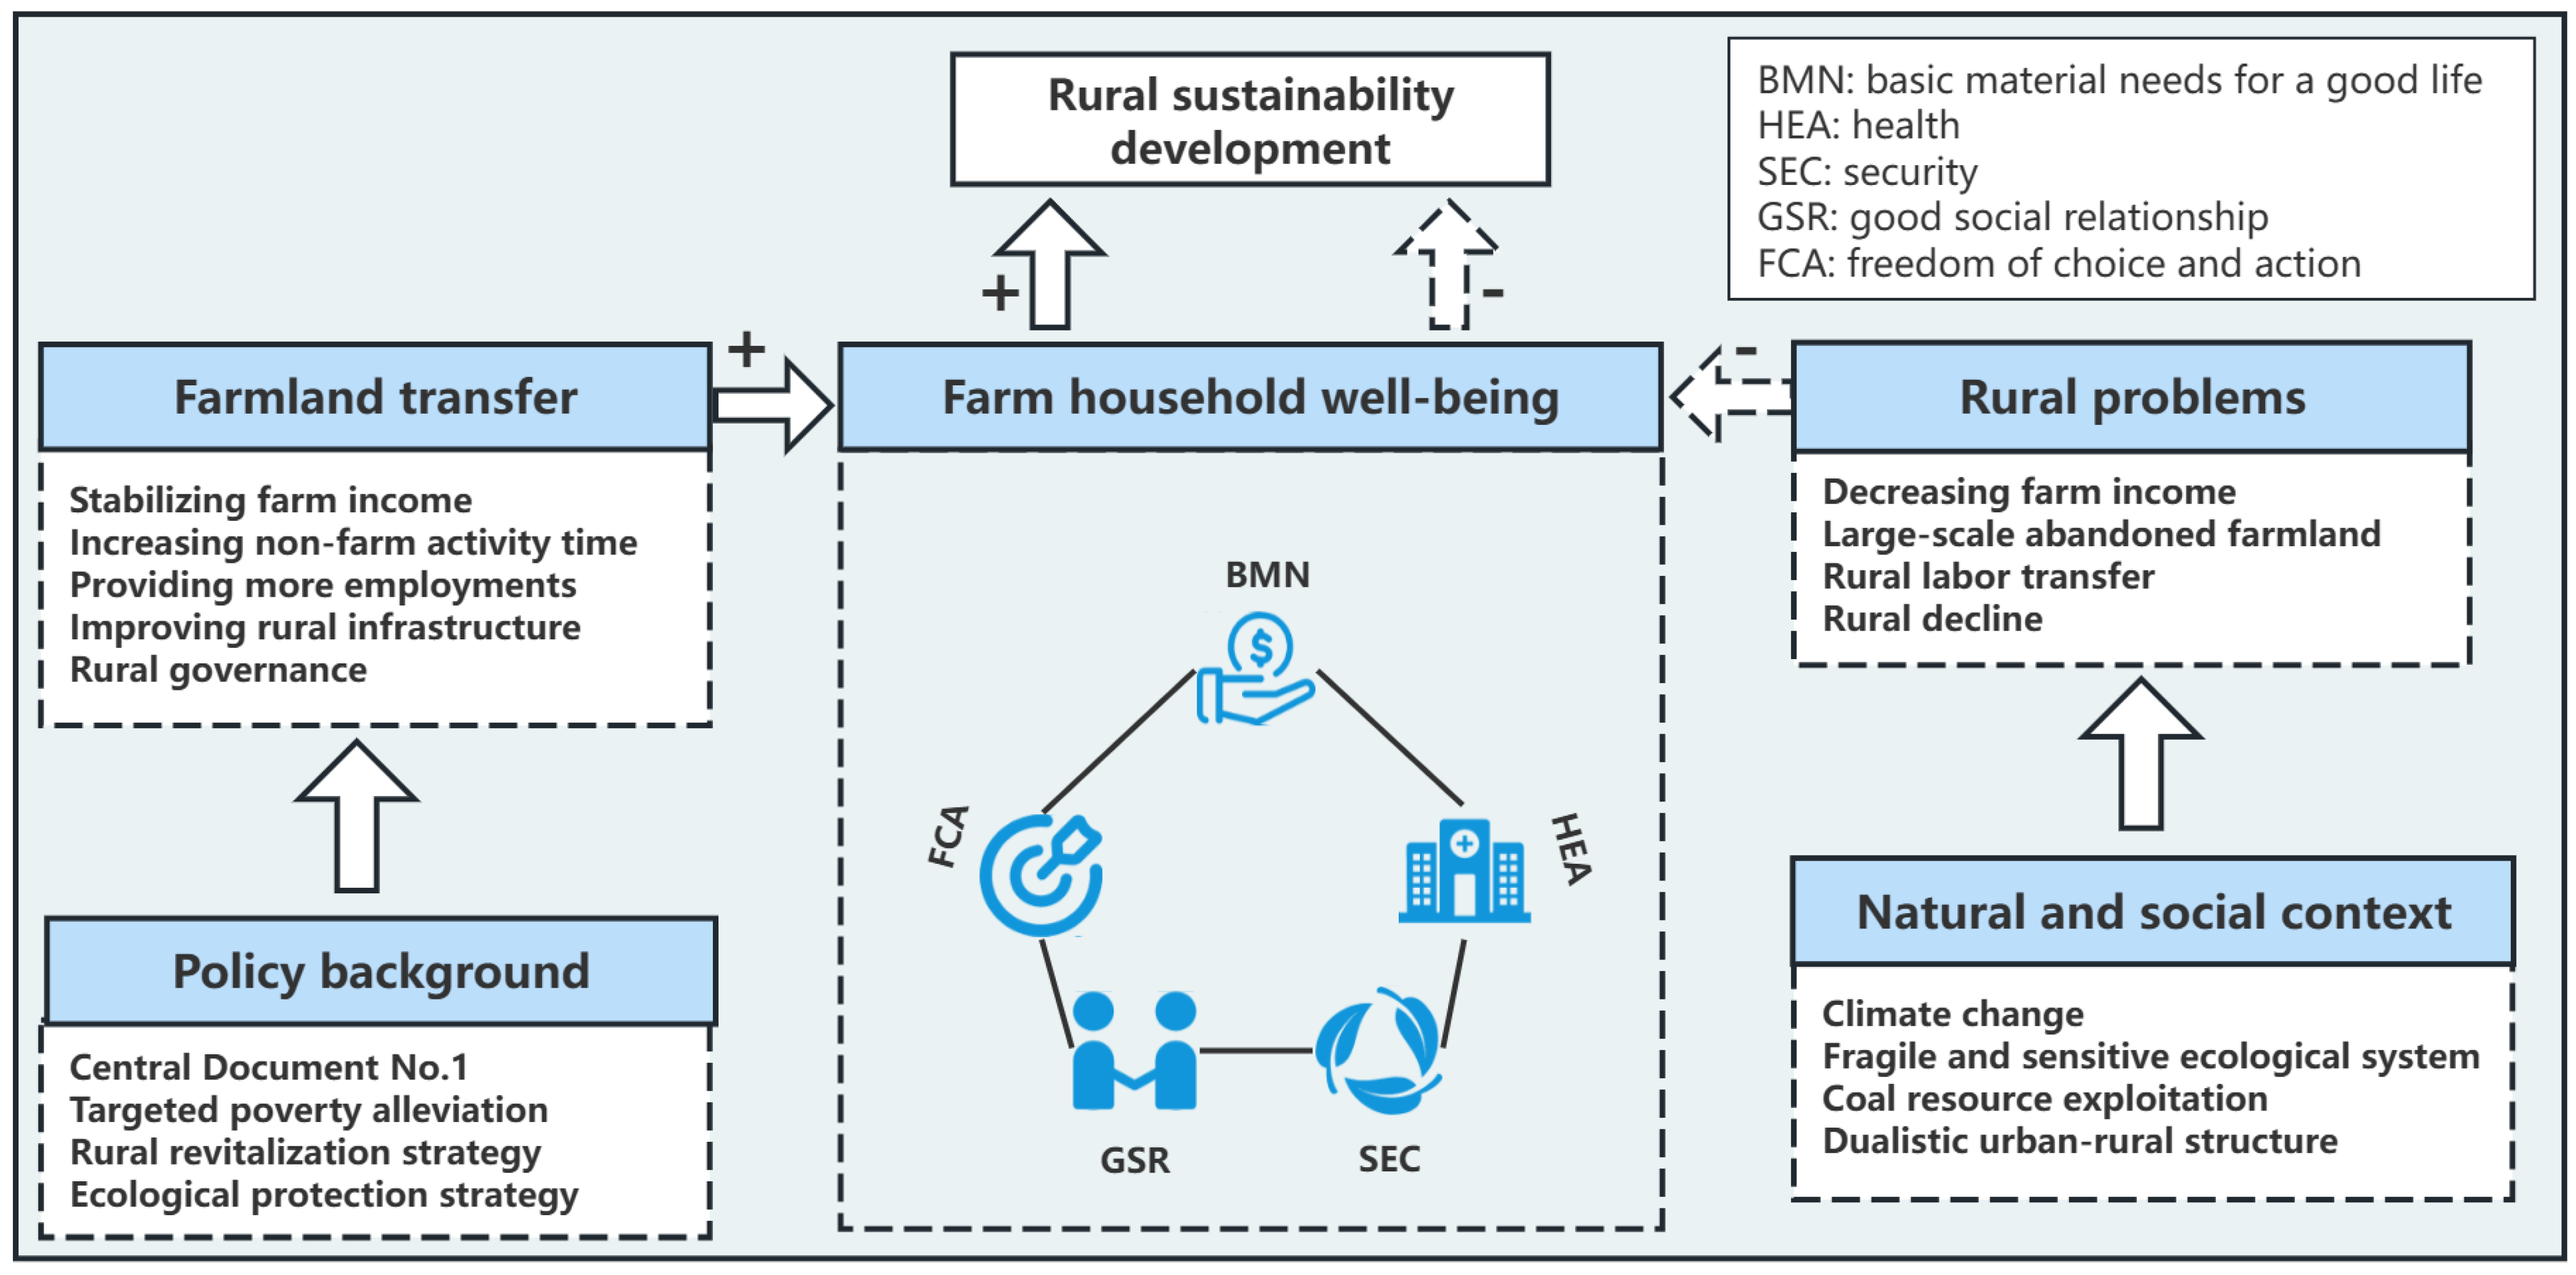
1. Introduction
2. Literature Review and Theoretical Analysis
3. Materials and Data
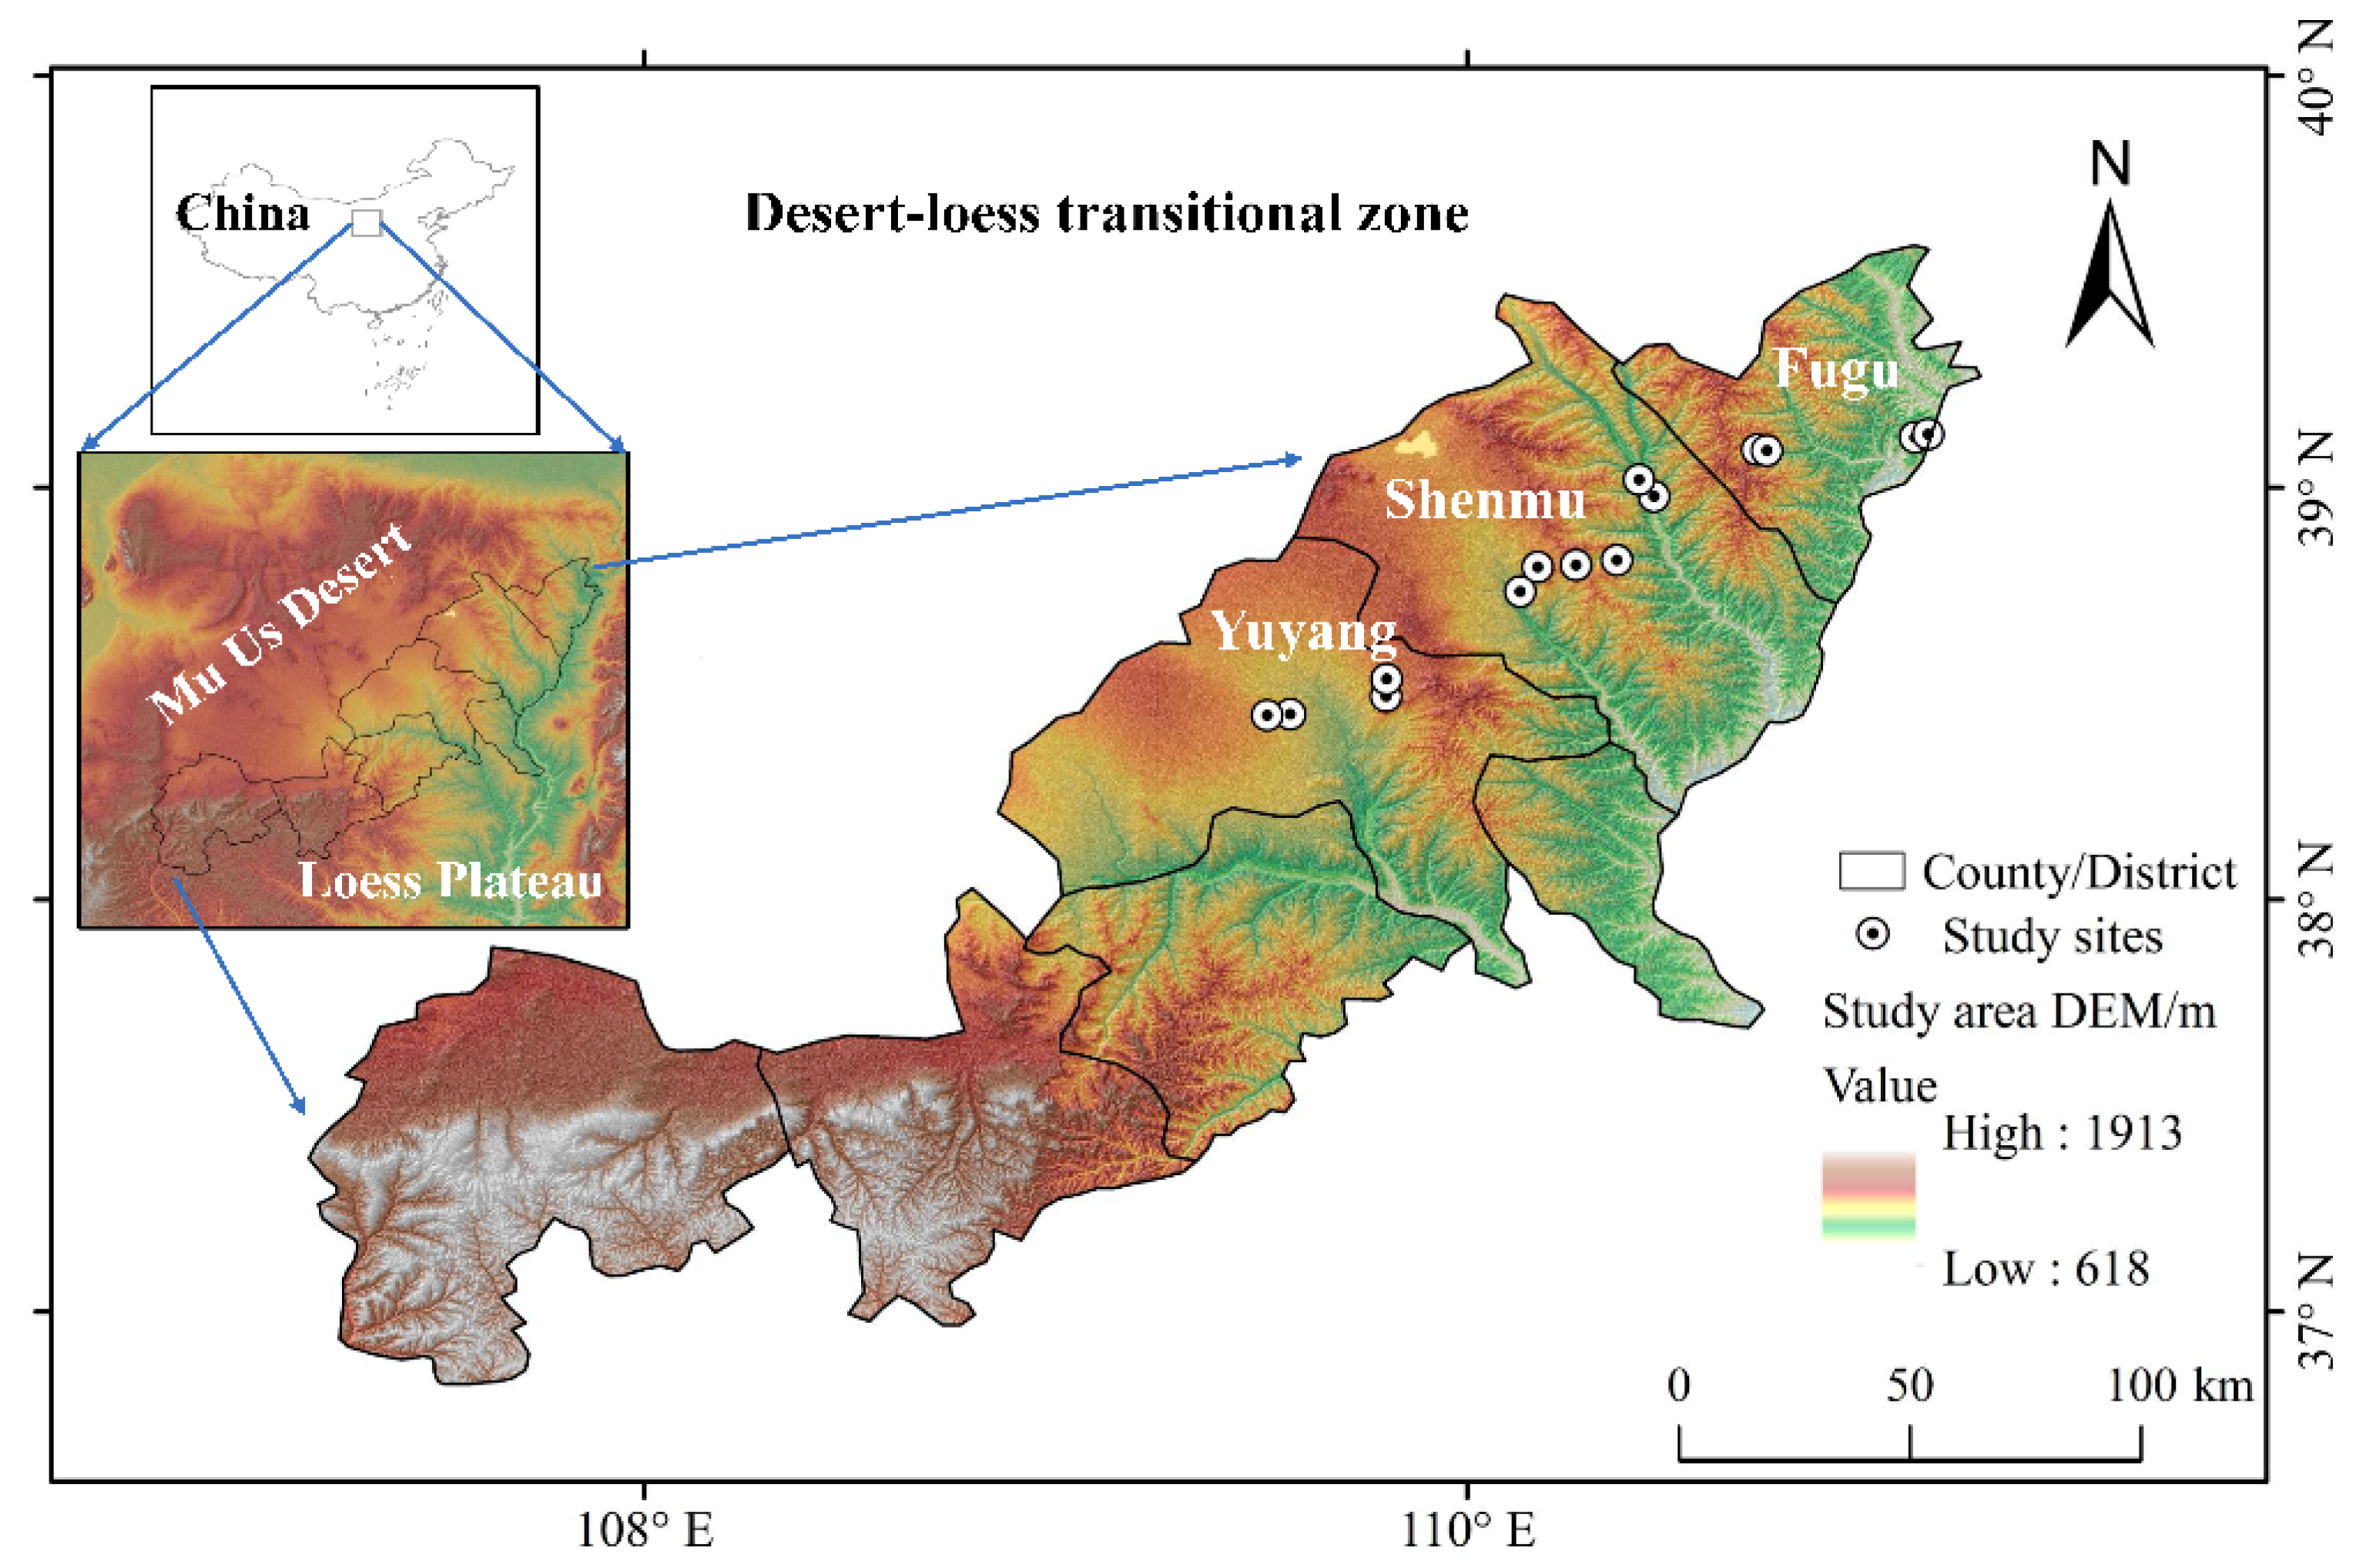
3.1. Study Areas
3.2. Sampling and Data Collection
3.3. Measurement of Farm Household Well-Being
3.3.1. Indicator System
3.3.2. Calculating the Well-Being Index of Farm Households
3.4. Calculating the Net Effect of Farmland Transfer
3.4.1. Propensity Score Matching
3.4.2. Variable Selection
4. Results and Analysis
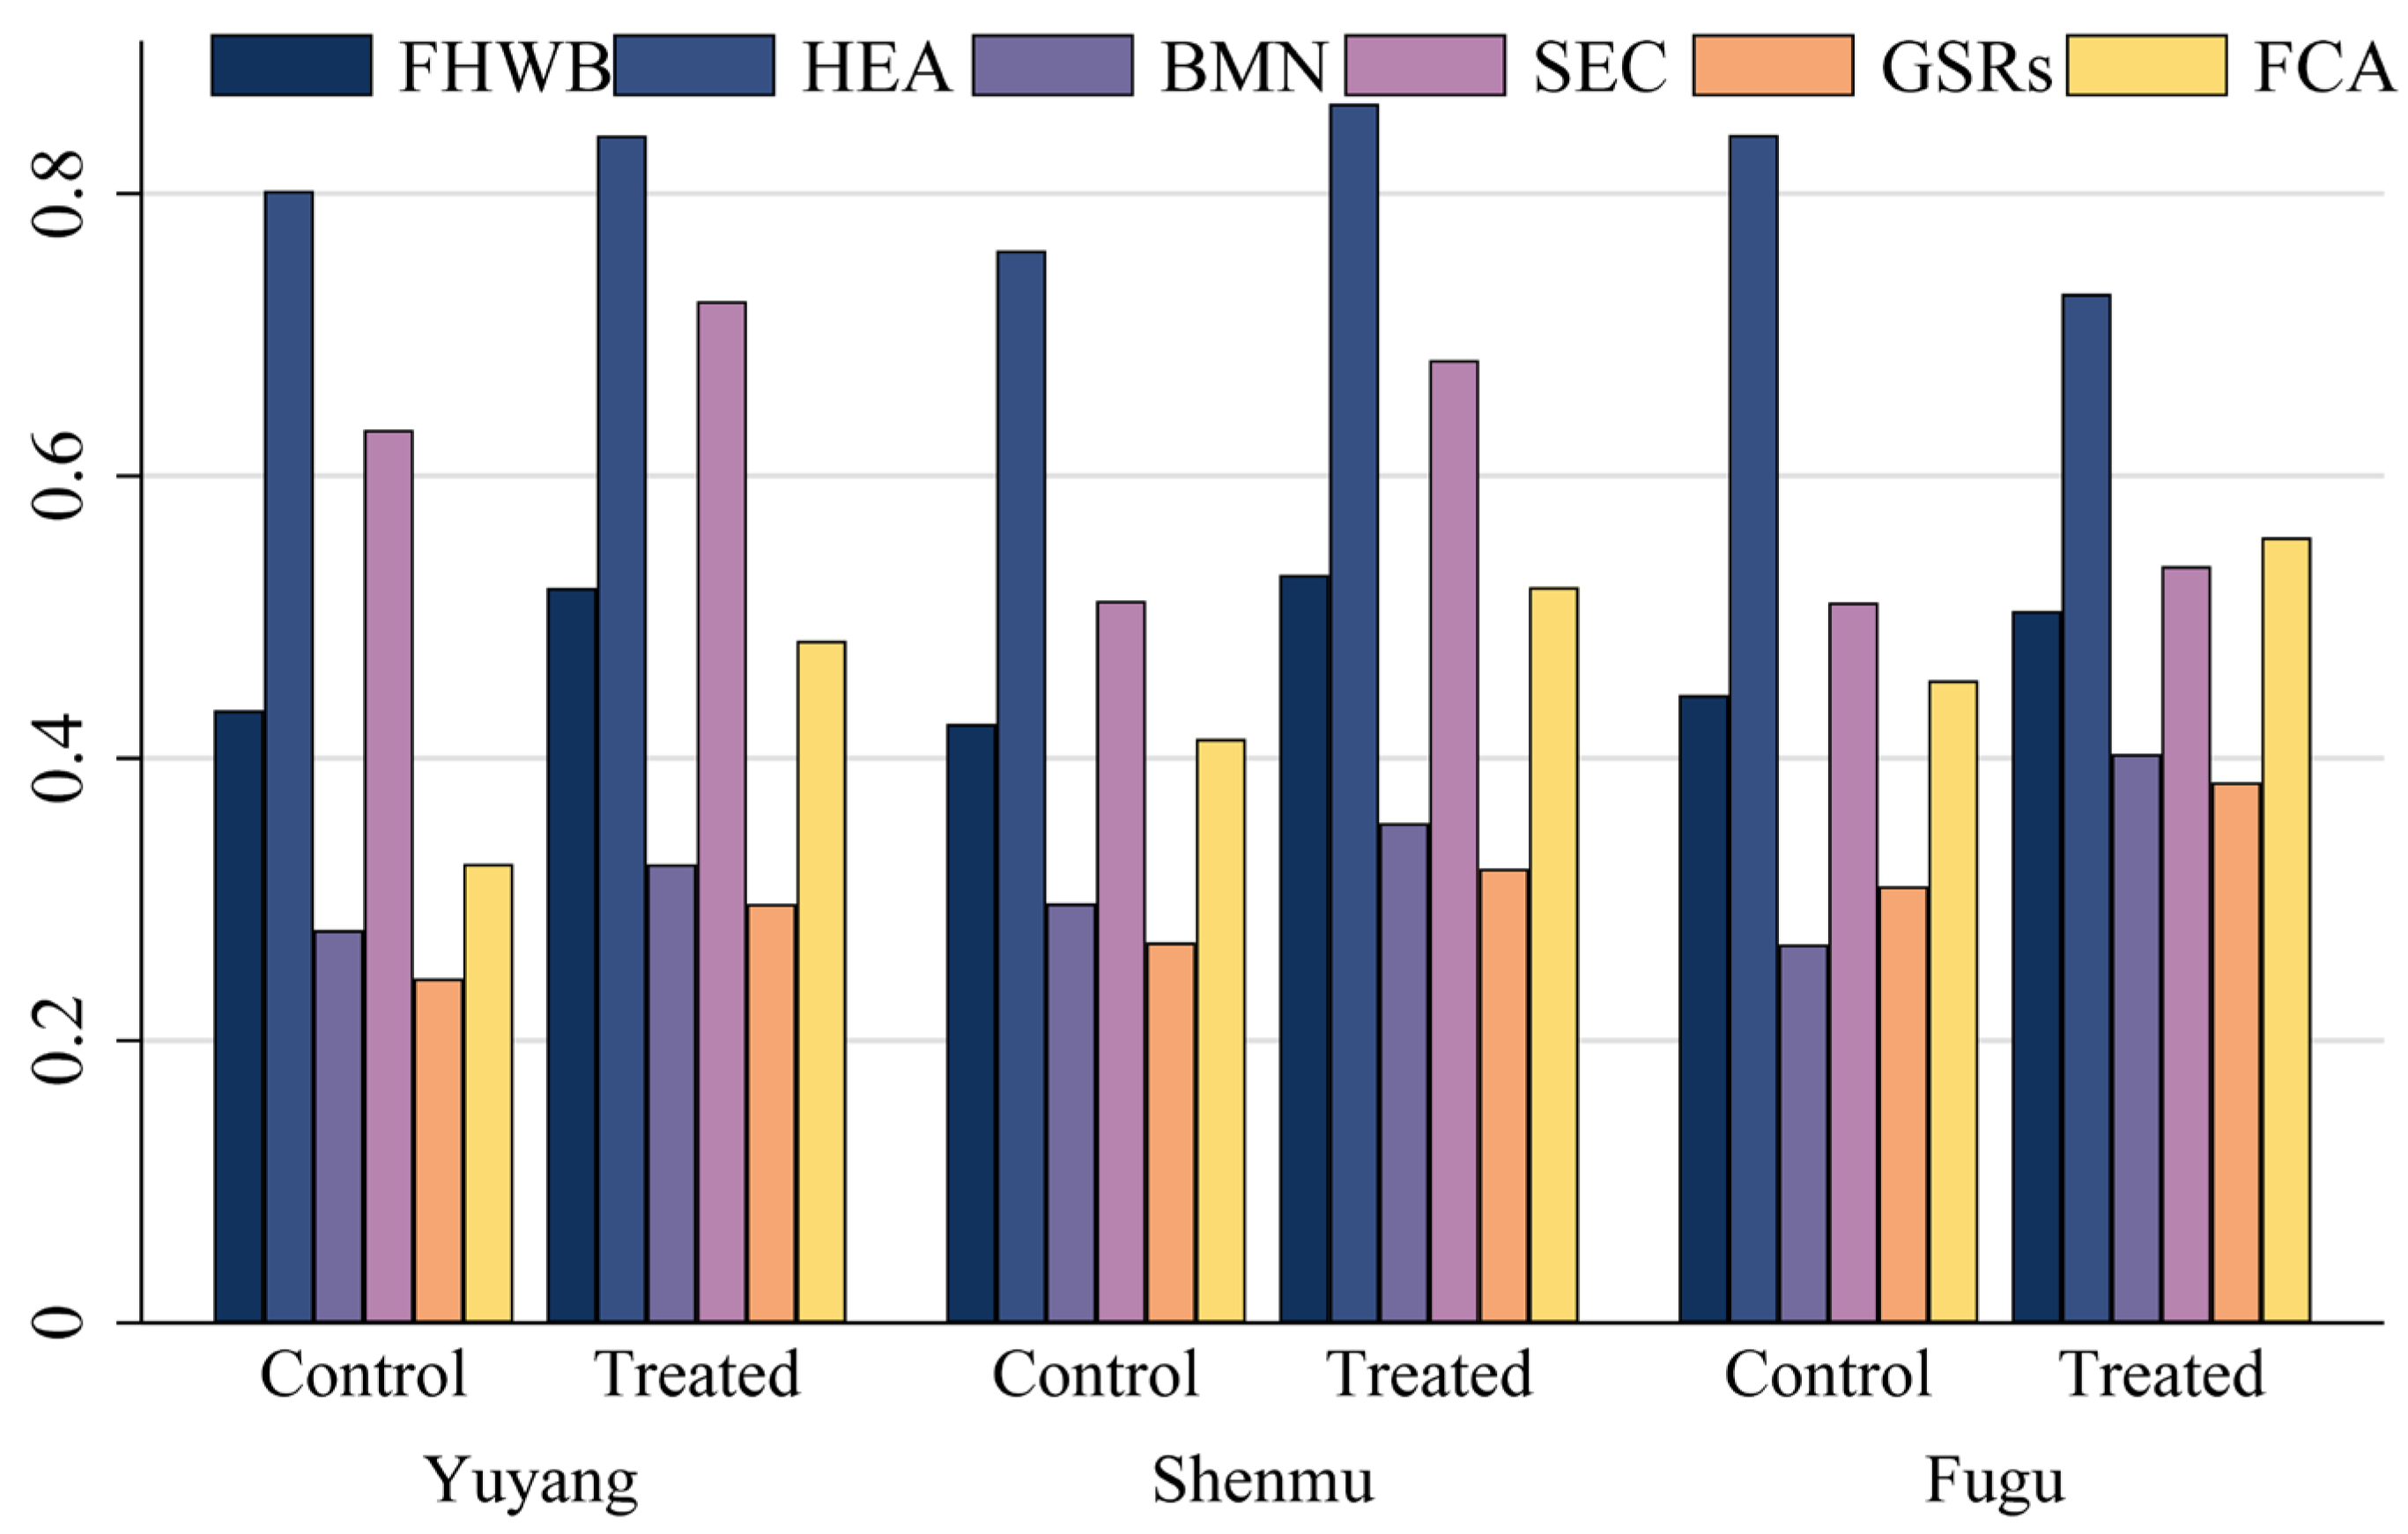
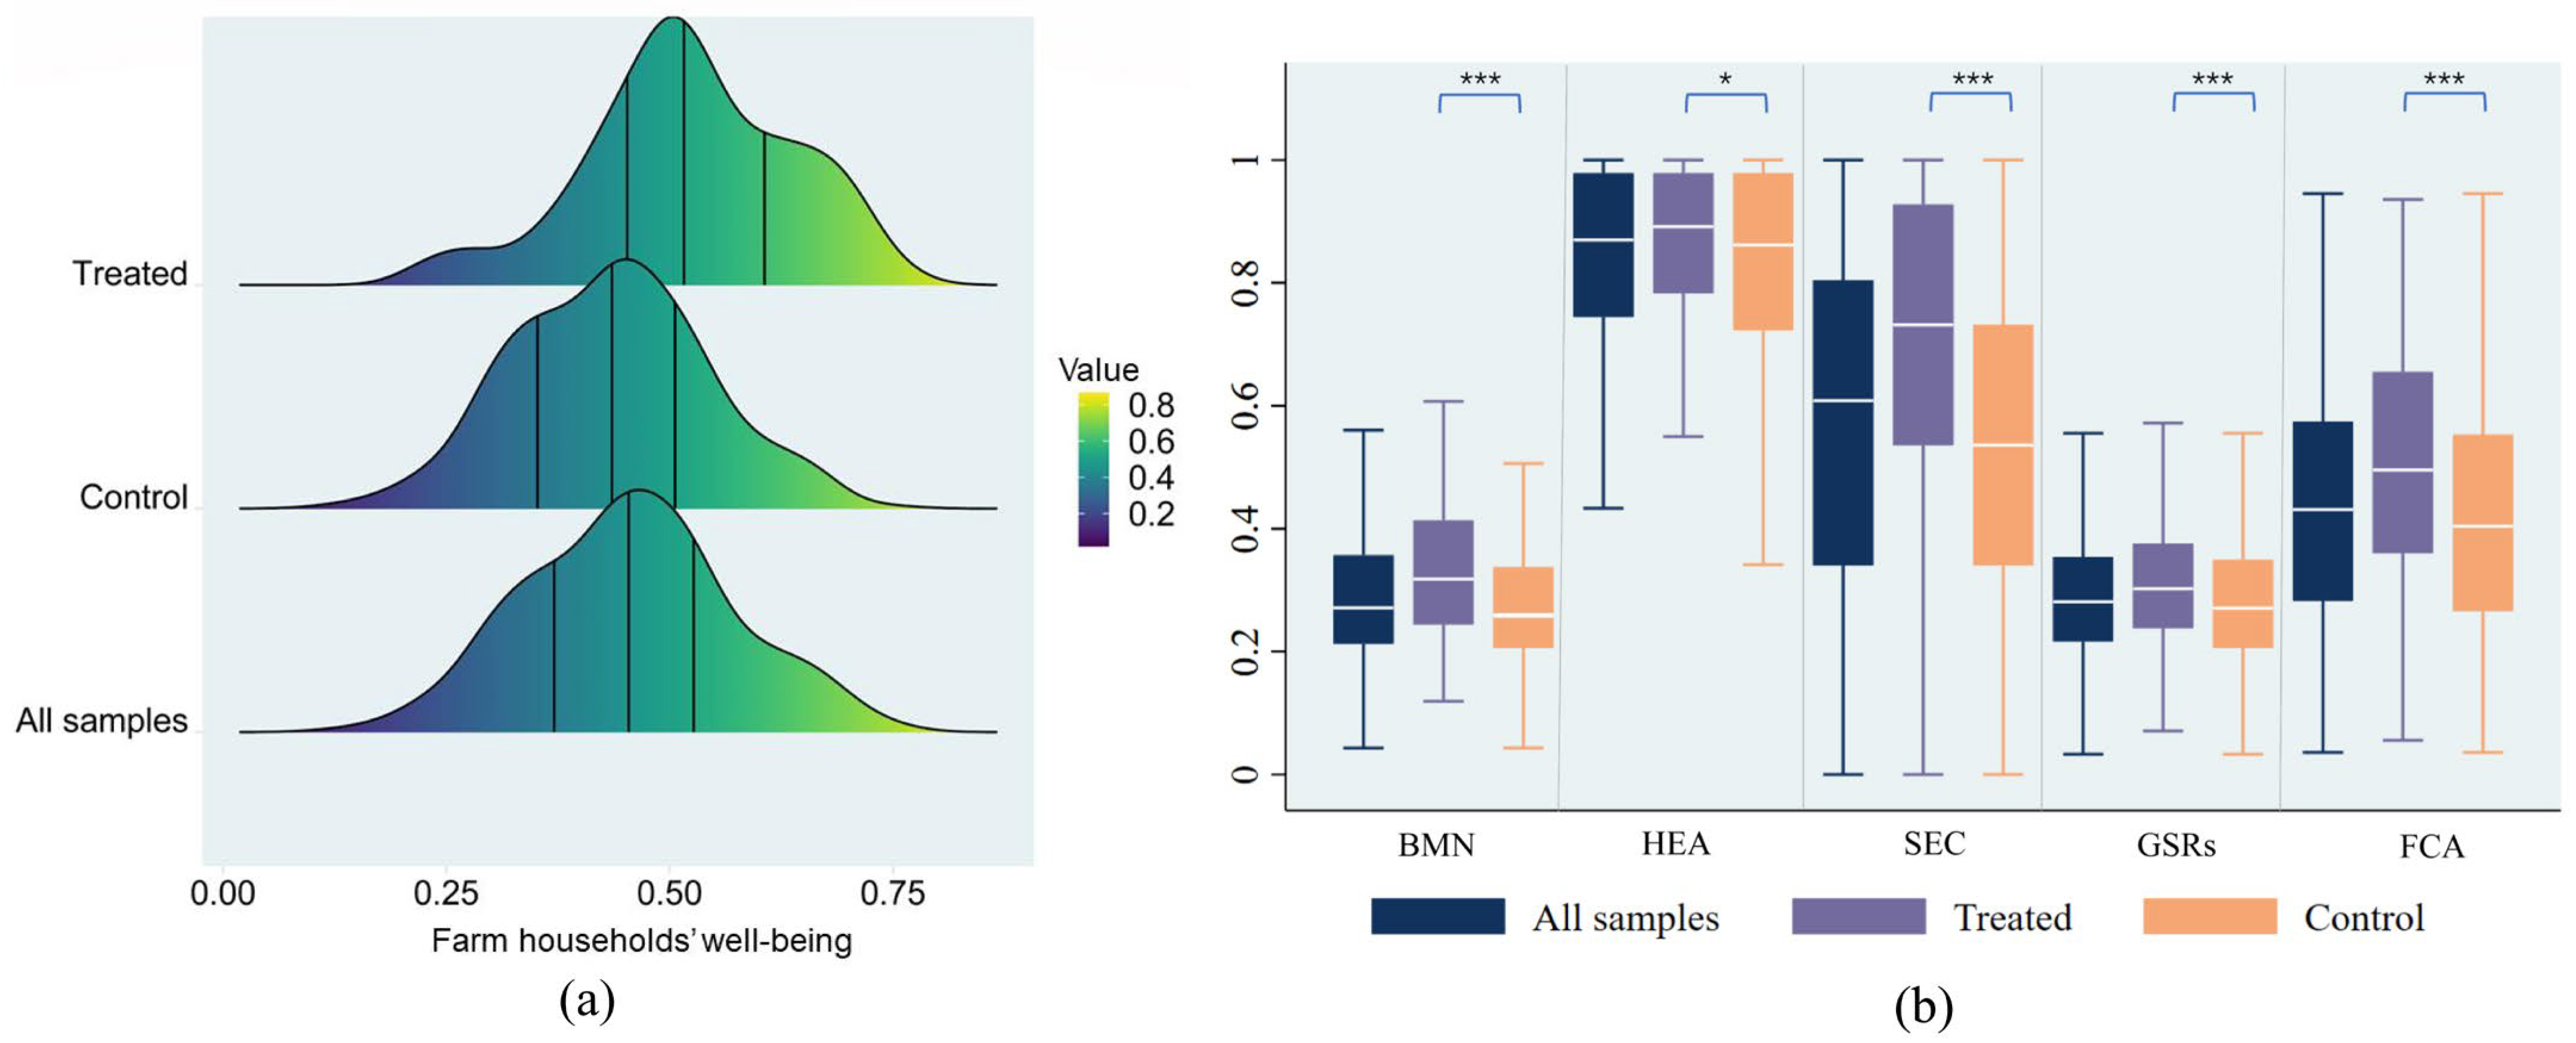
4.1. Statistical Descriptions of Farm Household Well-Being
4.2. Results of Propensity Score Matching
4.3. Hypothesis Test
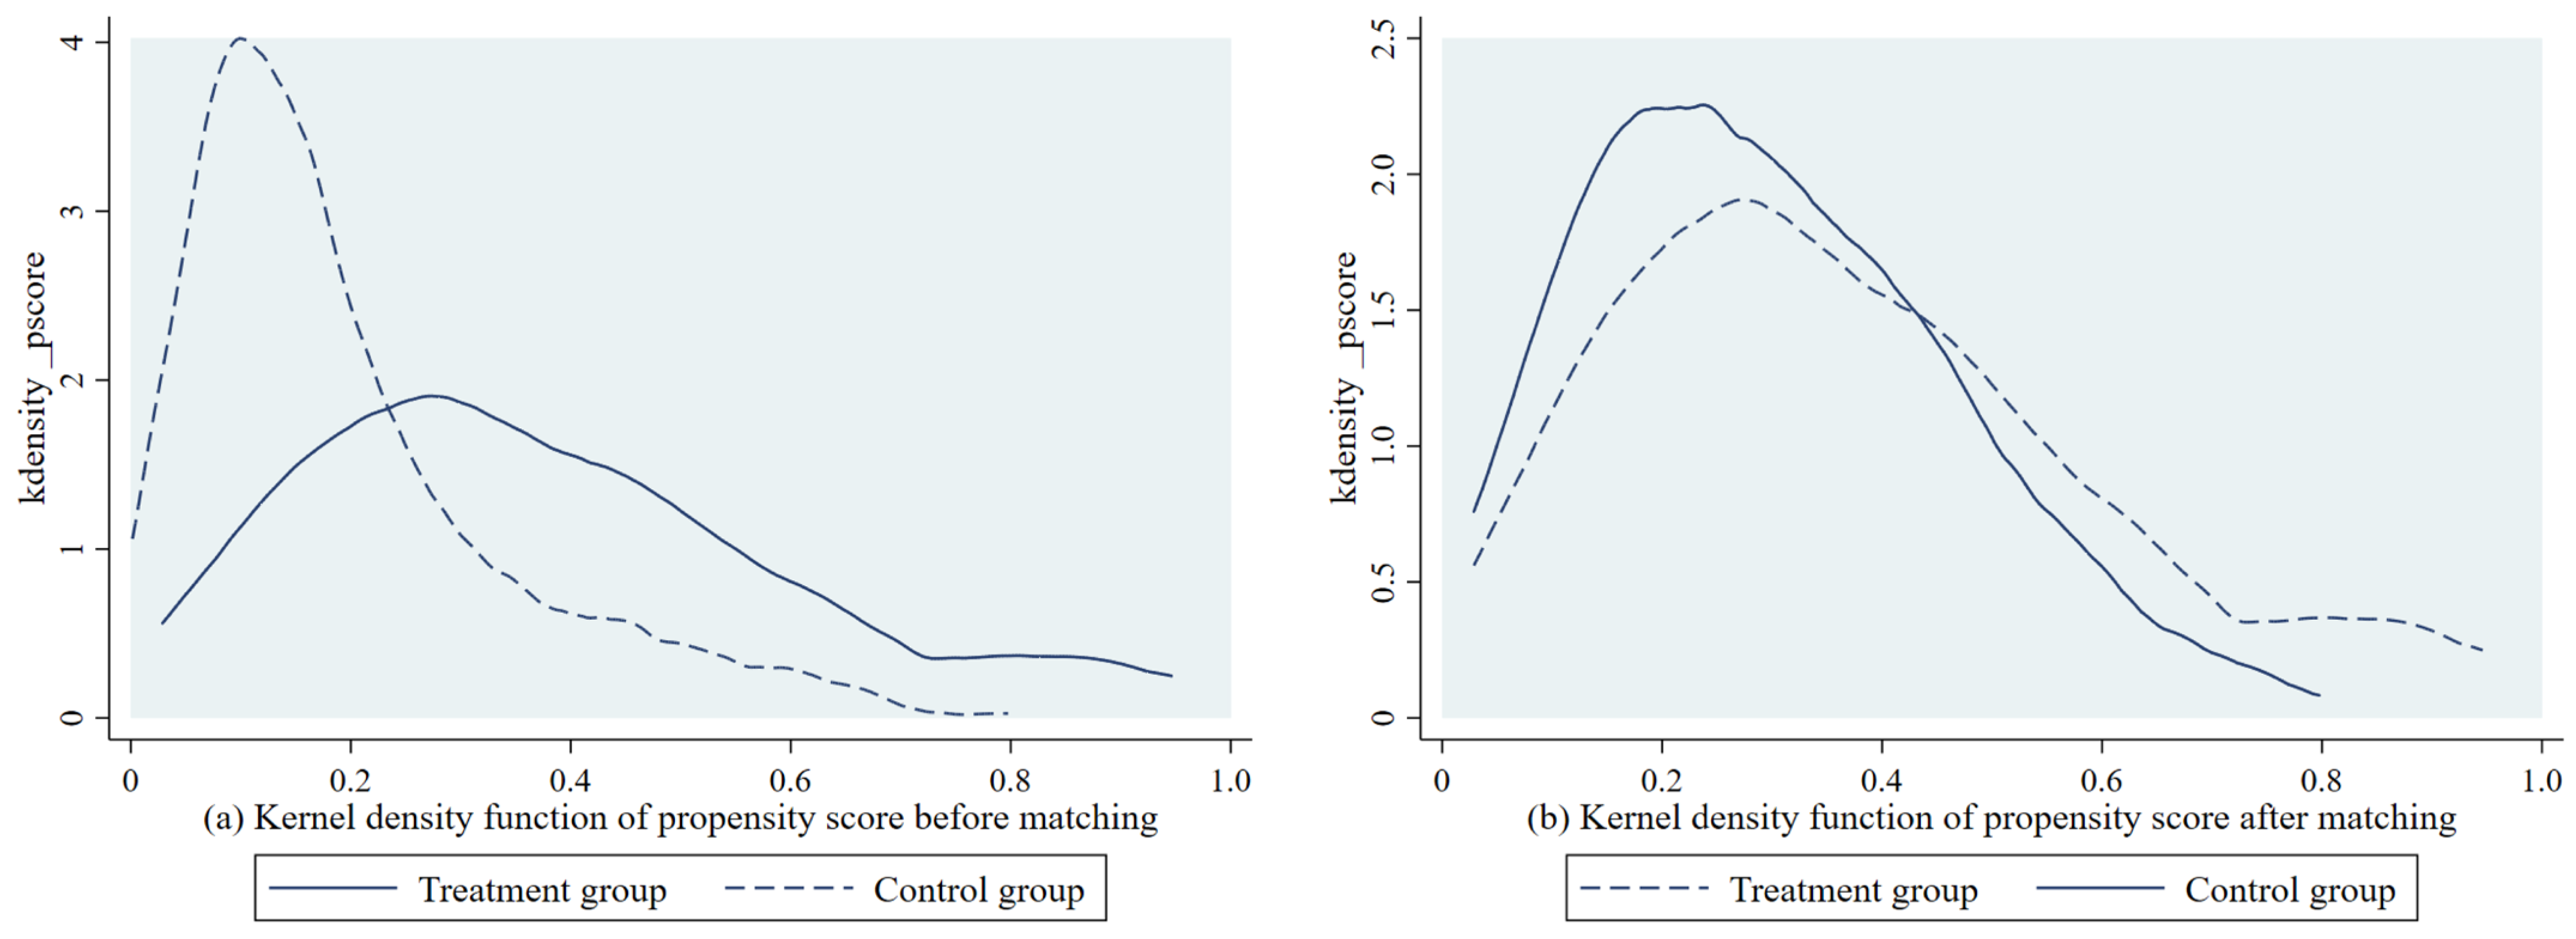
4.3.1. Common Support Region Test
4.3.2. Balancing Test
4.3.3. Sensitivity Analysis
4.4. Heterogeneity Analysis of Effects of Farmland Transfer
5. Discussion
5.1. The Well-Being Effects of Farmland Transfer
5.2. Group Heterogeneities of Well-Being Effects
5.3. Policy Implications
5.4. Limitations
6. Conclusions
Author Contributions
Funding
Data Availability Statement
Conflicts of Interest
References
- Zhu, J.; Sun, X.; He, Z. Research on China’s sustainable development evaluation indicators in the framework of SDGs. China Popul. Resour. Environ. 2018, 28, 9–18. [Google Scholar]
- United Nations. Transforming Our World: The 2030 Agenda for Sustainable Development; United Nations: New York, NY, USA, 2014; pp. 1–14. [Google Scholar]
- World Bank Group. Poverty and Inequality Platform (PIP). Available online: https://www.worldbank.org/en/topic/poverty (accessed on 25 October 2024).
- McGuire, S.; FAO; IFAD; WFP. The state of food insecurity in the world 2015: Meeting the 2015 international hunger targets: Taking stock of uneven progress. Rome: FAO, 2015. Adv. Nutr. 2015, 6, 623–624. [Google Scholar] [CrossRef] [PubMed]
- Bruno, J.E.; Fernandez-Gimenez, M.E.; Balgopal, M.M. An integrated livelihoods and well-being framework to understand northeastern Colorado ranchers’ adaptive strategies. Ecol. Soc. 2021, 26, 27. [Google Scholar] [CrossRef]
- Gautam, Y.; Andersen, P. Rural livelihood diversification and household well-being: Insights from Humla, Nepal. J. Rural Stud. 2016, 44, 239–249. [Google Scholar] [CrossRef]
- Kimengsi, J.N.; Mukong, A.K.; Balgah, R.A. Livelihood diversification and household well-being: Insights and policy implications for forest-based communities in cameroon. Soc. Nat. Resour. 2020, 33, 876–895. [Google Scholar] [CrossRef]
- You, H.; Wu, C.; Bao, H. Farrmland transfer, non-farm employment and farmland transfer welfare: Evidence from farm households in Guizhou, Zhejiang and Shandong. Issues Agric. Econ. 2013, 34, 16–25+110. [Google Scholar]
- Solomon, D.; Ishtiaque, A.; Agarwal, A.; Gray, J.M.; Lemos, M.C.; Moben, I.; Singh, B.; Jain, M. The role of rural circular migration in shaping weather risk management for smallholder farmers in India, Nepal, and Bangladesh. Glob. Environ. Chang. 2024, 89, 102937. [Google Scholar] [CrossRef]
- Chen, F.; Zhai, W. Land transfer incentive and welfare effect research from perspective of farmers’ behavior. Econ. Res. J. 2015, 50, 163–177. [Google Scholar]
- Yan, X.; Huo, X. Farmer employment, rural social security and farmland transfer: An analysis based on a survey of 476 farm households in Henan Province. J. Agrotech. Econ. 2013, 7, 34–44. [Google Scholar]
- Smith, L.M.; Case, J.L.; Smith, H.M.; Harwell, L.C.; Summers, J.K. Relating ecosystem services to domains of human well-being: Foundation for a U.S. index. Ecol. Indic. 2013, 28, 79–90. [Google Scholar] [CrossRef]
- Li, Y.; Li, S.; Gao, Y.; Wang, Y. Ecosystem services and hierarchic human well-being: Concepts and service classification framework. Acta Geogr. Sinica 2013, 68, 1038–1047. [Google Scholar]
- Millennium Ecosystem Assessment (MA). Ecosystems and Human Well-Being: Synthesis; Island Press: Washington, DC, USA, 2005; pp. 4–85. [Google Scholar]
- Sollis, K.; Yap, M.; Campbell, P.; Biddle, N. Conceptualisations of wellbeing and quality of life: A systematic review of participatory studies. World Dev. 2022, 160, 106073. [Google Scholar] [CrossRef]
- Gilbert, A.; Colley, K.; Roberts, D. Are rural residents happier? A quantitative analysis of subjective wellbeing in Scotland. J. Rural Stud. 2016, 44, 37–45. [Google Scholar] [CrossRef]
- Western, M.; Tomaszewski, W. Subjective wellbeing, objective wellbeing and inequality in Australia. PLoS ONE 2016, 11, e0163345. [Google Scholar] [CrossRef] [PubMed]
- Tang, Q.; Wang, W.; Tian, L.; Wang, W. Cognition and integrated assessment of farmers well-being in desert-oasis ecotone: Case of Shapotou. J. Arid Land Resour. Environ. 2017, 31, 51–56. [Google Scholar]
- Li, X.; Lei, M.; Xi, J.; Cao, X.; Zhao, Z. A study on the influencing factors of rural residents’ well-being under the ecological migration: Based on the sampling survey of rural areas in Lantian county of Shaanxi Province. Geogr. Res. 2018, 37, 1127–1141. [Google Scholar]
- Gao, B.; Li, C.; Li, S.; Han, X. Welfare status and the influencing factors for anti-poverty relocated households in ecologically fragile area. J. Arid Land Resour. Environ. 2020, 34, 88–95. [Google Scholar]
- Huang, G.; Jiang, Y.; Liu, Z.; Nie, M.; Liu, Y.; Li, J.; Bao, Y.; Wang, Y.; Wu, J. Advances in human well-being research: A sustainbility science perspective. Acta Ecol. Sinica 2016, 36, 7519–7527. [Google Scholar]
- Feng, X.; Shi, X.; Zhao, Z. Impact of geographical indication agricultural products on farmers’ livelihood vulnerability and well-being: A case study of the dryland plateau of the Yellow River Basin. Geogr. Res. 2024, 43, 2702–2720. [Google Scholar]
- Duc, N.M. Contribution of fish production to farmers’ subjective well-being in Vietnam—A logistic model. J. World Aquacult. Soc. 2009, 40, 17497345. [Google Scholar] [CrossRef]
- Adams, H.; Bell, A.R.; Tamal, M.E.H. Temporal dimensions of reported life satisfaction in a low-income, agricultural environment. Ecol. Soc. 2019, 24, 29. [Google Scholar] [CrossRef]
- Zhang, X.; Gao, J. A study on the welfare effect of farmers’ new round of returning farmland to forest in southern Shaanxi. J. Arid Land Resour. Environ. 2021, 35, 14–20. [Google Scholar]
- Huang, Z.; Li, J. Influence of land acquisition for rural tourism on the well-being of landless farmers based on the empirical analysis of PSM model. Resour. Sci. 2021, 43, 171–184. [Google Scholar] [CrossRef]
- Abokyi, E.; Strijker, D.; Asiedu, K.F.; Daams, M.N.; Fave, A.D. Buffer stock operations and well-being: The case of smallholder farmers in Ghana. J. Happiness Stud. 2022, 23, 125–148. [Google Scholar] [CrossRef]
- Hu, C.; Huang, X.; Zhang, L. Analysis of welfare economic effects of land transfer—Based on the analysis of farm household survey. Inq. Econ. Iss. 2008, 1, 184–186. [Google Scholar]
- Ma, J.; Liu, C. The impact of land transfer on the welfare of middle-aged and elderly farmers: Evidence from CHARLS data in 2018. Rural Econ. 2022, 10, 102–109. [Google Scholar]
- Gao, X.; Zhang, A.; Yang, X.; Li, C. Farmers’ income and income distribution effect of farmland transfer: A case study on 5 cities in Hunan Province. China Land Sci. 2016, 30, 48–56. [Google Scholar]
- Liu, X.; Zhou, H.; Wang, X. Does farmland transfer narrow income gap among farmers? Microcosmic evidence from CFPS. J. Agro-For. Econ. Manag. 2021, 20, 501–510. [Google Scholar]
- He, X.; Yan, J.; Yang, L. The influence of farmland circulation on the efficiency and equity of agricultural production in mountainous areas: A case study of three districts and counties in Chongqing. Res. Agric. Mod. 2019, 40, 591–600. [Google Scholar]
- Ricker-Gilbert, J.; Chamberlin, J.; Kanyamuka, J.; Jumbe, C.B.L.; Lunduka, R.; Kaiyatsa, S. How do informal farmland rental markets affect smallholders’ well-being? Evidence from a matched tenant-landlord survey in Malawi. Agric. Econ. 2019, 50, 595–613. [Google Scholar] [CrossRef]
- Yuan, D.; Chen, M.; Liao, C.; Xie, X.; Liao, X.; Yao, D. Analysis of subjective well-being of farmers with land transfer and its influencing factors: From the perspective of livelihood capitals. China Land Sci. 2019, 33, 25–33. [Google Scholar]
- Qiu, T.; He, Q.; Luo, B. Does land renting-out increase farmers’ subjective well-being? Evidence from rural China. Appl. Econ. 2021, 53, 2080–2092. [Google Scholar] [CrossRef]
- Tong, Q.; Zhang, L.; Zhang, J. Can land renting improve farmers’ life satisfaction? —Empirical evidence from Jianghan Plain, Hubei Province. Resour. Environ. Yangtze Basin 2019, 28, 614–622. [Google Scholar]
- Hu, G.; Wang, J.; Fahd, S.; Li, J. Influencing factors of farmers’ land transfer, subjective well-being, and participation in agri-environment schemes in environmentally fragile areas of China. Environ. Sci. Pollut. Res. 2023, 30, 4448–4461. [Google Scholar] [CrossRef] [PubMed]
- Schultz, T.W. Agricultural economics: Transforming traditional agriculture. Science 1964, 144, 688–689. [Google Scholar] [CrossRef]
- Chayanov, A. Peasant Economic Organization (Z.H., Xiao, Trans.); Central Compilation Press: Beijing, China, 1996. [Google Scholar]
- Shi, C.; Zhan, P.; Zhu, J. Land transfer, factor allocation and agricultural production efficiency improvement. China Land Sci. 2020, 34, 49–57. [Google Scholar]
- Cui, B.; Tang, L.; Liu, J.; Sriboonchitta, S. How does land transfer impact the household labor productivity in China? Empirical evidence from survey data in Shandong. Land 2023, 12, 881. [Google Scholar] [CrossRef]
- He, Q.; Deng, X.; Li, C.; Kong, F.; Qi, Y. Does land transfer improve farmers’ quality of life? Evidence from rural China. Land 2022, 11, 15. [Google Scholar] [CrossRef]
- Peng, K.; Yang, C.; Chen, Y. Land transfer in rural China: Incentives, influencing factors and income effects. Appl. Econ. 2020, 52, 5477–5490. [Google Scholar] [CrossRef]
- Cui, Y.; Zhang, H.; Hao, X.; Zhang, X. Sustainable livelihood of farmers in Yangquan mining area of Shanxi Province. Acta Ecol. Sin. 2020, 40, 6821–6830. [Google Scholar]
- Pu, C.; Liu, Z.; Hu, S.; Yan, Z.; Liu, C.; Zhang, Y.; Tao, C. Relocation obstacle factors for involuntary migrants in mining and agriculture area of the west region and the regulatory mechanism. J. Arid Land Resour. Environ. 2017, 31, 64–68. [Google Scholar]
- Yulin Municipal Government. Government Work Report of Yunlin City. Available online: http://www.yl.gov.cn (accessed on 2 April 2023).
- Zhang, L.; Wang, F.; Yue, L.; Li, Z.; Wang, M.; Nie, H. A dynamic study of land desertification in desert-loess transitional zones based on RS and GIS: A case study of Yulin area. Acta Geosci. Sincia 2004, 1, 63–66. [Google Scholar]
- Bu, Y.; Zhang, X.; AI, H.; Liu, G.; Ji, X. Species diversity in the wind-sandy grass shoal area of Yulin Region. Bull. Soil Water Conserv. 2008, 4, 80–85. [Google Scholar]
- Shaanxi Provincial Bureau of Statistics. Shaanxi Statistical Yearbook 2021; China Statistics Press: Beijing, China, 2022. [Google Scholar]
- Dong, H. Social Survey and Statistics; Wuhan University Press: Wuhan, China, 2015; pp. 126–130. [Google Scholar]
- Wang, F.; Shi, X.; Fan, Y. Factors influencing the relationship between perceptions of ecosystem services and well-being of farmers in the ore-agriculture zone, China. Ecol. Indic. 2024, 166, 112350. [Google Scholar] [CrossRef]
- Liang, X.; Feng, Q.; Duan, B. Spatial coupling Characteristics of ecosystem services and residents’ well-being in Mining areas of the Loess Plateau of western Shanxi Province. Bull. Soil Water Conserv. 2022, 42, 400–408. [Google Scholar]
- Liu, X.; Zhang, B.; Zheng, Q.; He, X.; Zhang, T.; Jia, Y.; Luo, Z. Impacts of Converting farmland into forests on farmer well-being in the earth-rock mountain areas of the Loess Plateau. Resour. Sci. 2014, 36, 397–405. [Google Scholar]
- Ciftcioglu, G.C. Assessment of the relationship between ecosystem services and human wellbeing in the social-ecological landscapes of Lefke Region in North Cyprus. Landsc. Ecol. 2017, 32, 897–913. [Google Scholar] [CrossRef]
- Xiong, Y.; Hou, K.; Zheng, S.; Zhang, K.; Yang, T.; Zhao, D.; Sun, B.; Chen, L. Relationship between farmer’s well-being and ecosystem services in hilly and mountainous areas of South China based on structural equation model: A case study of Lechang in Guangdong Province. Trop. Geogr. 2020, 40, 843–855. [Google Scholar]
- Huang, X.; Wang, C.; Hu, K. Multi-scale assessment of social vulnerability to rapid urban expansion in urban fringe: A case study of Xi’an. Acta Geogr. Sin. 2018, 73, 1002–1017. [Google Scholar]
- Holland, P.W. Statistics and causal inference. J. Am. Stat. Assoc. 1986, 81, 945–960. [Google Scholar] [CrossRef]
- Rosenbaum, P.R.; Rubin, D.B. The central role of the propensity score in observational studies for causal effects. Biometrika 1983, 70, 41–45. [Google Scholar] [CrossRef]
- Chen, Q. Advanced Econometrics and Stata Applications, 2nd ed.; Higher Education Press: Beijing, China, 2014. [Google Scholar]
- Mojo, D.; Fisher, C.; Degefa, T. The determinants and economic impacts of membership in coffee farmer cooperatives: Recent evidence from rural Ethiopia. J. Rural Stud. 2017, 50, 84–94. [Google Scholar] [CrossRef]
- Rosenbaum, P.R. Bahadur efficiency of sensitivity analyses in observational studies. J. Am. Stat. Assoc. 2015, 110, 205–217. [Google Scholar] [CrossRef]
- Naidoo, R.; Gerkey, D.; Hole, D.; Pfaff, A.; Ellis, A.M.; Golden, C.D.; Herrera, D.; Johnson, K.; Mulligan, M.; Ricketts, T.H.; et al. Evaluating the impacts of protected areas on human well-being across the developing world. Sci. Adv. 2019, 5, eaav3006. [Google Scholar] [CrossRef]
- Imbens, G.W.; Rubin, D.B. Causal Inference in Statistics, Social, and Biomedical Sciences; Cambridge University Press: New York, NY, USA, 2015. [Google Scholar]
- Li, C.; Sun, B.; Dong, Z. Farmer’ heterogeneity, transfer of farmland management right and rural income distribution. Rural Econ. 2019, 442, 26–33. [Google Scholar]
- Department of Agriculture and Rural Affairs of Shaanxi Province. Available online: http://nynct.shaanxi.gov.cn/ (accessed on 2 April 2023).
- Zhang, X.; Sang, X. Development status and policy suggestions of land stock cooperatives in Shaanxi Province. China Farmers’ Coop. 2016, 12, 33–35. [Google Scholar]
- Tang, Y.; Han, H.; Wu, Q. Research on the influence of land joint-stock cooperation on the rural labor migration to non-agricultural sectors: Framework and action path. J. Nanjing Agric. Univ. (Soc. Sci. Ed.) 2021, 21, 117–129. [Google Scholar]
- Zhao, C.; Hou, P.; Liu, Y.; Yu, Y. The practice of land joint stock cooperative in traditional agricultural cultivation village: A case of L village in Henan Province. Issues Agric. Econ. 2018, 12, 86–94. [Google Scholar]
- Abebaw, D.; Haile, M.G. The impact of cooperatives on agricultural technology adoption: Empirical evidence from Ethiopia. Food Policy 2013, 38, 82–91. [Google Scholar] [CrossRef]

| Components (Weights) | Indicators | Variable Descriptions | Properties | Weights | References |
|---|---|---|---|---|---|
| The basic material needs for a good life (BMN) (0.171) | Per capita net income | Per capita net income of a farm household/10,000 yuan | + | 0.484 | [20,53] |
| Income satisfaction | 1 = very dissatisfied; 2 = dissatisfied; 3 = general; 4 = satisfied; 5 = very satisfied | + | 0.146 | [20,22,26,51] | |
| Durable goods | Number of durable goods owned by a farm household/piece | + | 0.058 | [22,51] | |
| Per capita housing area | Per capita living area of a farm household/m2 | + | 0.209 | [18,53] | |
| Housing structure | 1 = wigwam; 2 = civil house; 3 = brick house; 4 = concrete house; 5 = storied house | + | 0.104 | [18] | |
| Health (HEA) (0.092) | Medical expenditure | Total annual medical expenditure of family members in a farm household | − | 0.650 | [26,51,52] |
| Number of patients | Number of patients in a farm household | − | 0.350 | [19] | |
| Security (SEC) (0.291) | Public security satisfaction | 1 = very dissatisfied; 2 = dissatisfied; 3 = general; 4 = satisfied; 5 = very satisfied | + | 0.217 | [22,51,52] |
| Residential environment satisfaction | 1 = very dissatisfied; 2 = dissatisfied; 3 = general; 4 = satisfied; 5 = very satisfied | + | 0.783 | [22,26,53] | |
| Good social relations (GSRs) (0.206) | Neighborhood trust | 1 = very distrust; 2 = distrust; 3 = general; 4 = trust; 5 = very trust | + | 0.066 | [51,55] |
| External help in difficult times | 1 = very few; 2 = fewer; 3 = general; 4= more; 5 = a great many | + | 0.292 | [51] | |
| Cash gift expenditure | Cash gift expenditure of a farm household per year/yuan | + | 0.642 | [26] | |
| Freedom of choice and action (FCA) (0.240) | Non-farming working time | Number of months for family labor to engage in migrant work or non-farm activities | + | 0.390 | [26,51] |
| Income source diversity | Number of income sources owned by a farm household (mainly included 12 income sources such as wage income, operating income, property income and transfer income) | + | 0.158 | [26] | |
| Public service satisfaction | 1 = very dissatisfied; 2 = dissatisfied; 3 = general; 4=satisfied; 5 = very satisfied | + | 0.072 | [26,51] | |
| Frequency of participation in public affairs | 1 = very few; 2 = fewer; 3 = general; 4 = more; 5 = a great many | + | 0.381 | [22,51] |
| Variables | Variable Descriptions | Treatment Group | Control Group | Difference | ||
|---|---|---|---|---|---|---|
| Mean | Std. Dev | Mean | Std. Dev | |||
| Treatment variables | ||||||
| Farmland transfer | Whether farm households transferred their farmland (1 = yes, 0 = no) | |||||
| Dependent variables | ||||||
| FHWB | Farm household well-being | 0.521 | 0.116 | 0.433 | 0.109 | 0.088 *** |
| BMN | The basic material needs for a good life | 0.342 | 0.131 | 0.283 | 0.116 | 0.058 *** |
| HEA | Health | 0.835 | 0.187 | 0.796 | 0.219 | 0.038 * |
| SEC | Security | 0.691 | 0.248 | 0.533 | 0.266 | 0.158 *** |
| GSRs | Good social relations | 0.313 | 0.128 | 0.279 | 0.123 | 0.034 *** |
| FCA | Freedom of choice and action | 0.502 | 0.199 | 0.412 | 0.191 | 0.090 *** |
| Covariates | ||||||
| Age | Age of household head | 53.28 | 12.014 | 59.48 | 11.525 | −6.200 *** |
| Education level | Education level of household head (1 = primary school and below, 2 = junior high school, 3 = senior high school, 4 = junior college, 5 = university and above) | 1.900 | 1.009 | 1.630 | 0.862 | 0.275 *** |
| Income change | Total income changes of a farm household in recent years (1 = decreased a lot, 2 = decreased a little, 3 = no change, 4 = increased a little, 5 = increased a lot) | 3.310 | 0.705 | 2.760 | 0.768 | 0.554 *** |
| Farm income | Farm income of the farm household/yuan | 1.829 | 2.341 | 1.085 | 1.895 | 0.744 *** |
| Non-farm income | Non-farm income of the farm household/yuan | 9.594 | 11.706 | 6.443 | 8.339 | 3.151 *** |
| Rural cadres | Whether the farm household has rural cadres (1 = yes, 0 = no) | 0.430 | 0.738 | 0.170 | 0.406 | 0.253 ** |
| Education stress | Whether the farm household has education stress from children (1 = yes, 0 = no) | 0.100 | 0.295 | 0.170 | 0.374 | −0.072 *** |
| Soil erosion | 1 = no, 2 = slight, 3 = general, 4 = serious, 5 = very serious | 2.970 | 1.376 | 3.210 | 1.296 | −0.248 * |
| Dry degree | 1 = no, 2 = slight, 3 = general, 4 = serious, 5 = very serious | 4.300 | 0.850 | 4.540 | 0.714 | −0.236 *** |
| Components | Sample | Treated | Controls | Differences | S.E. | T-Stat |
|---|---|---|---|---|---|---|
| FHWB | Unmatched | 0.521 | 0.433 | 0.088 | 0.012 | 7.47 |
| ATT | 0.515 | 0.470 | 0.045 *** | 0.014 | 3.13 | |
| BMN | Unmatched | 0.342 | 0.283 | 0.058 | 0.013 | 4.55 |
| ATT | 0.336 | 0.324 | 0.012 | 0.016 | 0.74 | |
| HEA | Unmatched | 0.835 | 0.796 | 0.038 | 0.023 | 1.69 |
| ATT | 0.828 | 0.823 | 0.006 | 0.026 | 0.22 | |
| SEC | Unmatched | 0.691 | 0.533 | 0.158 | 0.028 | 5.66 |
| ATT | 0.683 | 0.595 | 0.088 ** | 0.033 | 2.68 | |
| GSRs | Unmatched | 0.313 | 0.279 | 0.034 | 0.013 | 2.59 |
| ATT | 0.311 | 0.299 | 0.012 | 0.016 | 0.71 | |
| FCA | Unmatched | 0.502 | 0.412 | 0.090 | 0.021 | 4.35 |
| ATT | 0.496 | 0.434 | 0.061 ** | 0.026 | 2.40 |
| Components | Sample | Treated | Controls | Differences | S.E. | T-Stat |
|---|---|---|---|---|---|---|
| Unmatched | 0.521 | 0.433 | 0.088 ** | 0.012 | 7.46 | |
| K-nearest neighbor matching (k = 4) | ATT | 0.515 | 0.470 | 0.045 *** | 0.014 | 3.36 |
| CK-nearest neighbor matching within caliper (k = 4, r = 0.04) | ATT | 0.515 | 0.464 | 0.051 *** | 0.015 | 3.50 |
| Radius matching (r = 0.04) | ATT | 0.515 | 0.433 | 0.053 *** | 0.014 | 3.81 |
| Kernel matching | ATT | 0.515 | 0.461 | 0.054 *** | 0.014 | 3.92 |
| Local linear matching | ATT | 0.515 | 0.462 | 0.053 *** | 0.017 | 3.04 |
| Average | ATT | - | - | 0.049 | - | - |
| Variables | Unmatched | Mean | %bias | t-Test | ||
|---|---|---|---|---|---|---|
| Matched | Treated | Control | t | P > |t| | ||
| Age of household head | U | 53.278 | 59.407 | −52.2 | −4.95 | 0.000 |
| M | 54.299 | 55.028 | −6.2 | −0.46 | 0.650 | |
| Educational level of household head | U | 1.904 | 1.659 | 24.6 | 2.31 | 0.021 |
| M | 1.860 | 1.862 | −0.2 | −0.02 | 0.986 | |
| Income change | U | 3.313 | 2.759 | 75.1 | 6.88 | 0.000 |
| M | 3.262 | 3.269 | −1.0 | −0.07 | 0.941 | |
| Farm income | U | 1.868 | 1.002 | 41.1 | 4.14 | 0.000 |
| M | 1.772 | 1.803 | −1.5 | −0.09 | 0.931 | |
| Non-farm income | U | 9.594 | 6.406 | 31.4 | 3.23 | 0.001 |
| M | 9.124 | 8.631 | 4.9 | 0.33 | 0.740 | |
| Rural cadres | U | 0.426 | 0.173 | 42.4 | 4.68 | 0.000 |
| M | 0.308 | 0.301 | 1.2 | 0.09 | 0.925 | |
| Education stress | U | 0.096 | 0.168 | −21.5 | −1.90 | 0.058 |
| M | 0.103 | 0.131 | −8.3 | −0.64 | 0.525 | |
| Soil erosion degree | U | 2.965 | 3.209 | −18.2 | −1.73 | 0.084 |
| M | 3.037 | 2.951 | 6.5 | 0.47 | 0.636 | |
| Drought degree | U | 4.304 | 4.542 | 4.297 | 2.31 | 0.021 |
| M | 4.365 | 4.297 | 8.6 | −0.02 | 0.986 | |
| Sample | Matching Method | Pseudo R2 | LR chi2 | P > chi2 | Mean Bias | Med Bias | B Value |
|---|---|---|---|---|---|---|---|
| Before matching | 0.166 | 88.29 | 0.000 | 38.0 | 31.0 | 103.2 | |
| After matching | K-nearest neighbor (k = 4) | 0.005 | 1.52 | 0.997 | 5.5 | 5.6 | 16.8 |
| One-to-four matching within caliper (k = 4, c = 0.04) | 0.005 | 1.43 | 0.998 | 5.2 | 4.2 | 16.4 | |
| Radius matching (r = 0.04) | 0.001 | 0.36 | 1.000 | 2.5 | 2.2 | 8.2 | |
| Kernel matching | 0.003 | 0.75 | 1.000 | 3.8 | 3.1 | 11.7 | |
| Local linear matching | 0.009 | 2.74 | 0.974 | 7.5 | 7.0 | 22.7 |
| Gamma (Γ) | Sig+ | Sig- | t-hat+ | t-hat- | CI+ | CI- |
|---|---|---|---|---|---|---|
| 1 | 0.000 | 0.000 | 0.04955 | 0.04955 | 0.0256 | 0.0740 |
| 1.1 | 0.000 | 0.000 | 0.0447 | 0.0548 | 0.021 | 0.0801 |
| 1.2 | 0.001 | 0.000 | 0.0406 | 0.0603 | 0.0157 | 0.0842 |
| 1.3 | 0.0027 | 0.000 | 0.0362 | 0.0645 | 0.0114 | 0.0883 |
| 1.4 | 0.0069 | 0.000 | 0.0319 | 0.0681 | 0.0064 | 0.0928 |
| 1.5 | 0.0149 | 0.000 | 0.0275 | 0.0719 | 0.0024 | 0.0972 |
| 1.6 | 0.0284 | 0.000 | 0.0244 | 0.0756 | 0.0004 | 0.1011 |
| 1.7 | 0.0491 | 0.000 | 0.0215 | 0.0795 | 0.0046 | 0.1045 |
| 1.8 | 0.0779 | 0.000 | 0.0190 | 0.0819 | −0.0083 | 0.1072 |
| 40 Years and Below | 41–50 Years | 51–60 Years | More Than 60 Years | Primary School and Below | Junior High School | Senior High School | ||
|---|---|---|---|---|---|---|---|---|
| K-nearest neighbor matching (k = 4) | ATT | 0.163 * | 0.059 * | 0.077 ** | 0.062 ** | 0.048 * | 0.072 *** | 0.106 * |
| S.E. | 0.084 | 0.034 | 0.036 | 0.028 | 0.029 | 0.028 | 0.058 | |
| K-nearest neighbor matching within caliper (k = 4, c = 0.04) | ATT | 0.163 * | 0.066 * | 0.081 ** | 0.049 * | 0.048 * | 0.071 ** | 0.106 * |
| S.E. | 0.088 | 0.040 | 0.037 | 0.029 | 0.029 | 0.030 | 0.059 | |
| Radius matching (r = 0.04) | ATT | 0.128 * | 0.066 * | 0.056 * | 0.045 * | 0.035 * | 0.067 ** | 0.100 * |
| S.E. | 0.080 | 0.040 | 0.029 | 0.027 | 0.021 | 0.026 | 0.053 | |
| Kernel matching | ATT | 0.142 * | 0.062 | 0.049 * | 0.055 ** | 0.032 | 0.067 *** | 0.102 * |
| S.E. | 0.084 | 0.038 | 0.027 | 0.026 | 0.021 | 0.026 | 0.053 | |
| Local linear matching | ATT | 0.138 * | 0.054 | 0.050 * | 0.055 ** | 0.036 * | 0.077 *** | 0.091 * |
| S.E. | 0.090 | 0.039 | 0.028 | 0.025 | 0.021 | 0.024 | 0.052 | |
| Average | ATT | 0.147 | 0.061 | 0.062 | 0.053 | 0.040 | 0.071 | 0.101 |
Disclaimer/Publisher’s Note: The statements, opinions and data contained in all publications are solely those of the individual author(s) and contributor(s) and not of MDPI and/or the editor(s). MDPI and/or the editor(s) disclaim responsibility for any injury to people or property resulting from any ideas, methods, instructions or products referred to in the content. |
© 2024 by the authors. Licensee MDPI, Basel, Switzerland. This article is an open access article distributed under the terms and conditions of the Creative Commons Attribution (CC BY) license (https://creativecommons.org/licenses/by/4.0/).
Share and Cite
Li, X.; Shi, X.; Qin, Y. Exploring the Effects of Farmland Transfer on Farm Household Well-Being: Evidence from Ore–Agriculture Compound Areas in Northwest China. Land 2024, 13, 2042. https://doi.org/10.3390/land13122042
Li X, Shi X, Qin Y. Exploring the Effects of Farmland Transfer on Farm Household Well-Being: Evidence from Ore–Agriculture Compound Areas in Northwest China. Land. 2024; 13(12):2042. https://doi.org/10.3390/land13122042
Chicago/Turabian StyleLi, Xueping, Xingmin Shi, and Yuhan Qin. 2024. "Exploring the Effects of Farmland Transfer on Farm Household Well-Being: Evidence from Ore–Agriculture Compound Areas in Northwest China" Land 13, no. 12: 2042. https://doi.org/10.3390/land13122042
APA StyleLi, X., Shi, X., & Qin, Y. (2024). Exploring the Effects of Farmland Transfer on Farm Household Well-Being: Evidence from Ore–Agriculture Compound Areas in Northwest China. Land, 13(12), 2042. https://doi.org/10.3390/land13122042