Article

Ecosystem Services’ Response to Land Use Intensity: A Case Study of the Hilly and Gully Region in China’s Loess Plateau

1
Key Laboratory of Regional Sustainable Development Modeling, Institute of Geographic Sciences and Natural Resources Research, Chinese Academy of Sciences, Beijing 100101, China
2
Department of Architecture and Civil Engineering, City University of Hong Kong, Hong Kong 518057, China
3
School of Civil Engineering and Architecture, Southwest University of Science and Technology, Mianyang 621010, China
4
College of Land Science and Technology, China Agricultural University, Beijing 100193, China
*
Authors to whom correspondence should be addressed.
Land 2024, 13(12), 2039; https://doi.org/10.3390/land13122039
Submission received: 1 November 2024 / Revised: 26 November 2024 / Accepted: 27 November 2024 / Published: 28 November 2024

Abstract

:
The hilly and gully region of the Loess Plateau represents one of China’s most ecologically vulnerable landscapes, characterized by severe soil erosion, intensive land use, and pronounced disturbances to the structure and functionality of ecosystem services. Taking Zichang City as a case study, this research integrates grid-scale analysis with the InVEST-PLUS model and bivariate spatial autocorrelation techniques to examine the spatiotemporal dynamics and inter-relations of four critical ecosystem services—carbon storage, water yield, biodiversity, and soil retention—under varying land use intensity scenarios from 1990 to 2035. The findings indicate that (1) between 1990 and 2020, land use intensity in Zichang City steadily declined, exhibiting a spatial distribution pattern typified by central-area clustering and gradual peripheral transitions. (2) Across three development scenarios, the spatial distribution of the four ecosystem services aligned with the patterns observed in 2020, with central areas showing pronounced fluctuations, whereas peripheral regions experienced relatively minor changes. Specifically, from 1990 to 2020, the proportion of low-carbon storage areas increased by 2.89%, and high water yield areas expanded by 9.45%, while the shares of low habitat quality and low soil retention areas decreased by 5.59% and 6.25%, respectively. (3) A significant spatial autocorrelation was observed between land use intensity and the four ecosystem services, with widespread cold and hot spots reflecting dynamic spatial clustering patterns. These results offer valuable insights for optimizing land use strategies, improving ecosystem service performance, and advancing ecological conservation and sustainable development initiatives.

1. Introduction

With the rapid progression of socioeconomic development, the tensions between humanity and the environment have escalated, resulting in significant degradation of the Earth’s ecological systems and posing a profound threat to the sustainable development of both people and nature [1]. In light of these challenges, the United Nations has articulated the Sustainable Development Goals (SDGs), which offer a definitive framework for reconciling human-environment relationships and preserving the Earth’s natural ecosystems. Notably, Goal 15 underscores the imperative to protect, restore, and promote the sustainable use of terrestrial ecosystems, implement sustainable forest management, adopt effective measures to combat desertification, halt and reverse land degradation, and mitigate biodiversity loss [2]. Realizing these objectives will not only safeguard and restore the health and stability of ecosystems but also sustain the critical services they provide, which are essential for human well-being. Furthermore, ensuring the availability of ecosystem services contributes to alleviating the conflicts between humanity and the environment, thereby providing robust ecological support for economic development [3]. Consequently, grounded in the principle of coexistence between humanity and nature, it is crucial to harmonize human-environment relationships and enhance sustainable resource management practices to ensure the long-term utilization of resources and the stability of ecosystems, thereby establishing a durable environmental foundation for global sustainable development [4].
Land use changes are primarily driven by the interplay of varying land use demands and types, encompassing key dimensions such as land use categories, intensity, and their spatiotemporal dynamics [5]. Existing research on the relationship between land use changes and ecosystem services has largely concentrated on the effects of alterations in land use structure and quantity [6]. Nonetheless, land use transformation processes also entail shifts in structural composition, functional attributes, and efficiency [7]. A quantitative examination of these processes and their intensities is crucial for comprehensively evaluating their impacts on ecosystem services [8].
Land use intensity quantifies the concentration of human activities per unit area, while ecosystem services encompass the diverse functions and benefits provided by the natural environment, such as food production, water purification, and climate regulation [9]. The interplay between these two elements is vital for achieving environmental sustainability and promoting human well-being. Land use intensity is intricately linked to the sustainable management of natural resources and the overall health of ecosystems [10]. As land use intensity escalates, ecosystem services increasingly confront the risk of degradation, evidenced by challenges such as diminished biodiversity, declining soil quality, and water scarcity [11]. Conversely, moderate land use intensity can generate positive ecological outcomes [12]. For example, the adoption of sustainable agricultural practices can enhance soil organic matter content, thereby increasing crop yields and bolstering the overall functional services of ecosystems. Thus, a comprehensive examination of the dynamic relationship between land use intensity and ecosystem services not only contributes to a deeper understanding of ecosystem operational mechanisms but also provides a robust scientific foundation for effective land management and policy development [13].
The profound impacts of changes in land use intensity on the structure and functionality of ecosystem services have garnered increasing attention [14,15,16]. Such changes, however, are not solely reflected in historical and current trends but are also crucial under various future development scenarios. The PLUS model, renowned for its high precision and patch-scale analytical capabilities, has been extensively employed for future scenario simulations across multiple scales, including national, provincial, municipal, and watershed levels [17]. Despite these advancements, the interaction mechanisms and response dynamics between land use intensity and ecosystem services remain insufficiently elucidated. Existing research primarily emphasizes simple correlation or sensitivity analyses, with limited exploration of the spatial relationships between land use intensity and ecosystem services through quantitative methods. Spatial autocorrelation models provide a powerful tool for revealing these spatial interactions, enabling the quantification of distribution characteristics and interdependencies in spatial datasets while uncovering latent linkages or similarities among adjacent regions. These models thus offer critical insights for comprehensive assessments [18,19]. In this context, the present study integrates the PLUS-InVEST model with the bivariate Moran’s index to systematically quantify the spatiotemporal response relationships between land use intensity and ecosystem service functions from historical, current, and future perspectives.
China has actively engaged with the Sustainable Development Goals by enacting a comprehensive array of policy measures focused on the conservation of land resources and advancing the principle that “lucid waters and lush mountains are invaluable assets” [20]. By protecting natural ecosystems and ensuring the sustainability of ecological resources, humanity can achieve enduring and stable well-being. These policies not only facilitate the restoration and maintenance of ecosystem functions but also lay a robust foundation for fostering harmonious coexistence between humanity and nature [21].
Zichang City, situated within the hilly and gully region of the Loess Plateau, exhibits an ecologically sensitive structure and function, rendering its ecosystems highly susceptible to anthropogenic influences. The region is confronted with severe soil erosion and substantial biodiversity threats [22]. As land use intensity escalates, the degradation of local ecosystem services is likely to intensify, necessitating a deeper understanding of the underlying response mechanisms to preserve ecological equilibrium and restore functional integrity. Moreover, located in an arid to semi-arid zone with complex topography and diverse soil types, the alteration of land use patterns exerts far-reaching effects on soil and water conservation, agricultural productivity, and biodiversity. Investigating the region’s distinct characteristics offers valuable guidance for the optimization of land management practices.
With economic development and population growth, Zichang City is confronted with escalating resource pressures and environmental challenges, necessitating the formulation of sustainable land use policies through scientific research to achieve a balance between economic development and ecological conservation, enhance the quality of life for local residents, and promote regional sustainable development. Consequently, investigating the responsiveness of land use intensity in Zichang City to ecosystem services not only holds academic significance but also provides a foundation for addressing pressing ecological and economic issues. In light of this, the objectives of this study are as follows: (1) to analyze the temporal and spatial characteristics of land use intensity in Zichang City; (2) to quantify and map changes in ecosystem services; (3) to elucidate the spatial relationships between land use intensity and ecosystem services.

2. Overview of the Study Area and Data Sources

2.1. Overview of the Study Area

Zichang City (109°11′58″ E−110°01′22″ E, 36°59′30″ N−37°30′00″ N), a county-level city under the administration of Yan’an, Shaanxi Province, lies in the central Loess Plateau, to the north of the revolutionary site of Yan’an. It borders Hengshan District of Yulin City to the north, Zizhou and Qingjian counties to the east, Yanchuan County and Baota District to the south, and Ansai District of Yan’an and Jingbian County of Yulin City to the west, covering a total area of 2,405 square kilometers (Figure 1). The region is dominated by the hilly and gully terrain characteristic of the Loess Plateau, with ridges and valleys accounting for approximately 94.6% of its area. Elevations range from 916 to 1,557 m above sea level. Zichang City experiences a warm, temperate, semi-arid continental monsoon climate characterized by relatively low temperatures and significant seasonal temperature variations. The city has an average annual temperature of 9.1 °C, an average annual precipitation of 514.7 mm, and a frost-free period of 175 days. The Qingjian, Wuding, and Yan rivers form the major water systems in the area. By the end of 2023, Zichang had a permanent population of 215,000 and a gross regional product of CNY 15.74 billion [23].
Zichang City is endowed with rich natural resources, including substantial deposits of coal, oil, and natural gas. Over time, amidst population growth and rapid economic development, the region has undergone significant transformations in land use patterns and intensity, resulting in escalating pressure on the human-environment relationship and posing considerable challenges to the ecological environment. Since 1999, China has implemented ecological conservation initiatives, such as the Grain-to-Green Program, which have led to notable improvements in the region’s ecological conditions. Therefore, within the context of substantial fluctuations in land use intensity, exploring the spatiotemporal dynamics of land use intensity and its responsive mechanisms with respect to ecosystem service functions is essential for advancing regional ecological sustainability.

2.2. Data Sources

The data utilized in this study encompass land use and land cover data, topographic information, soil characteristics, and meteorological variables. The land use data were obtained from remote sensing imagery provided by the Resource and Environmental Science Data Center, Chinese Academy of Sciences (http://www.resdc.cn, accessed on 1 June 2024), with a spatial resolution of 30 m [24]. The digital elevation model (DEM) data were sourced from the ASTER Global Digital Elevation Model (ASTER GDEM), available through the Geospatial Data Cloud (http://www.gscloud.cn/#page1/1, accessed on 1 June 2024), also with a resolution of 30 m [25]. Soil data were acquired from the World Soil Database (http://westdc.westgis.ac.cn/data/611f7d50-b419-4d14-b4dd-4a944b141175, accessed on 1 June 2024), encompassing soil types such as sand, silt, and clay, along with organic carbon content, at a resolution of 1 km [26]. Additionally, the meteorological data, including precipitation and potential evapotranspiration, were provided by the Resource and Environmental Science Data Center, Chinese Academy of Sciences (http://www.resdc.cn, accessed on 1 June 2024) [24]. A comprehensive description of these data is presented in Table 1.

3. Methods

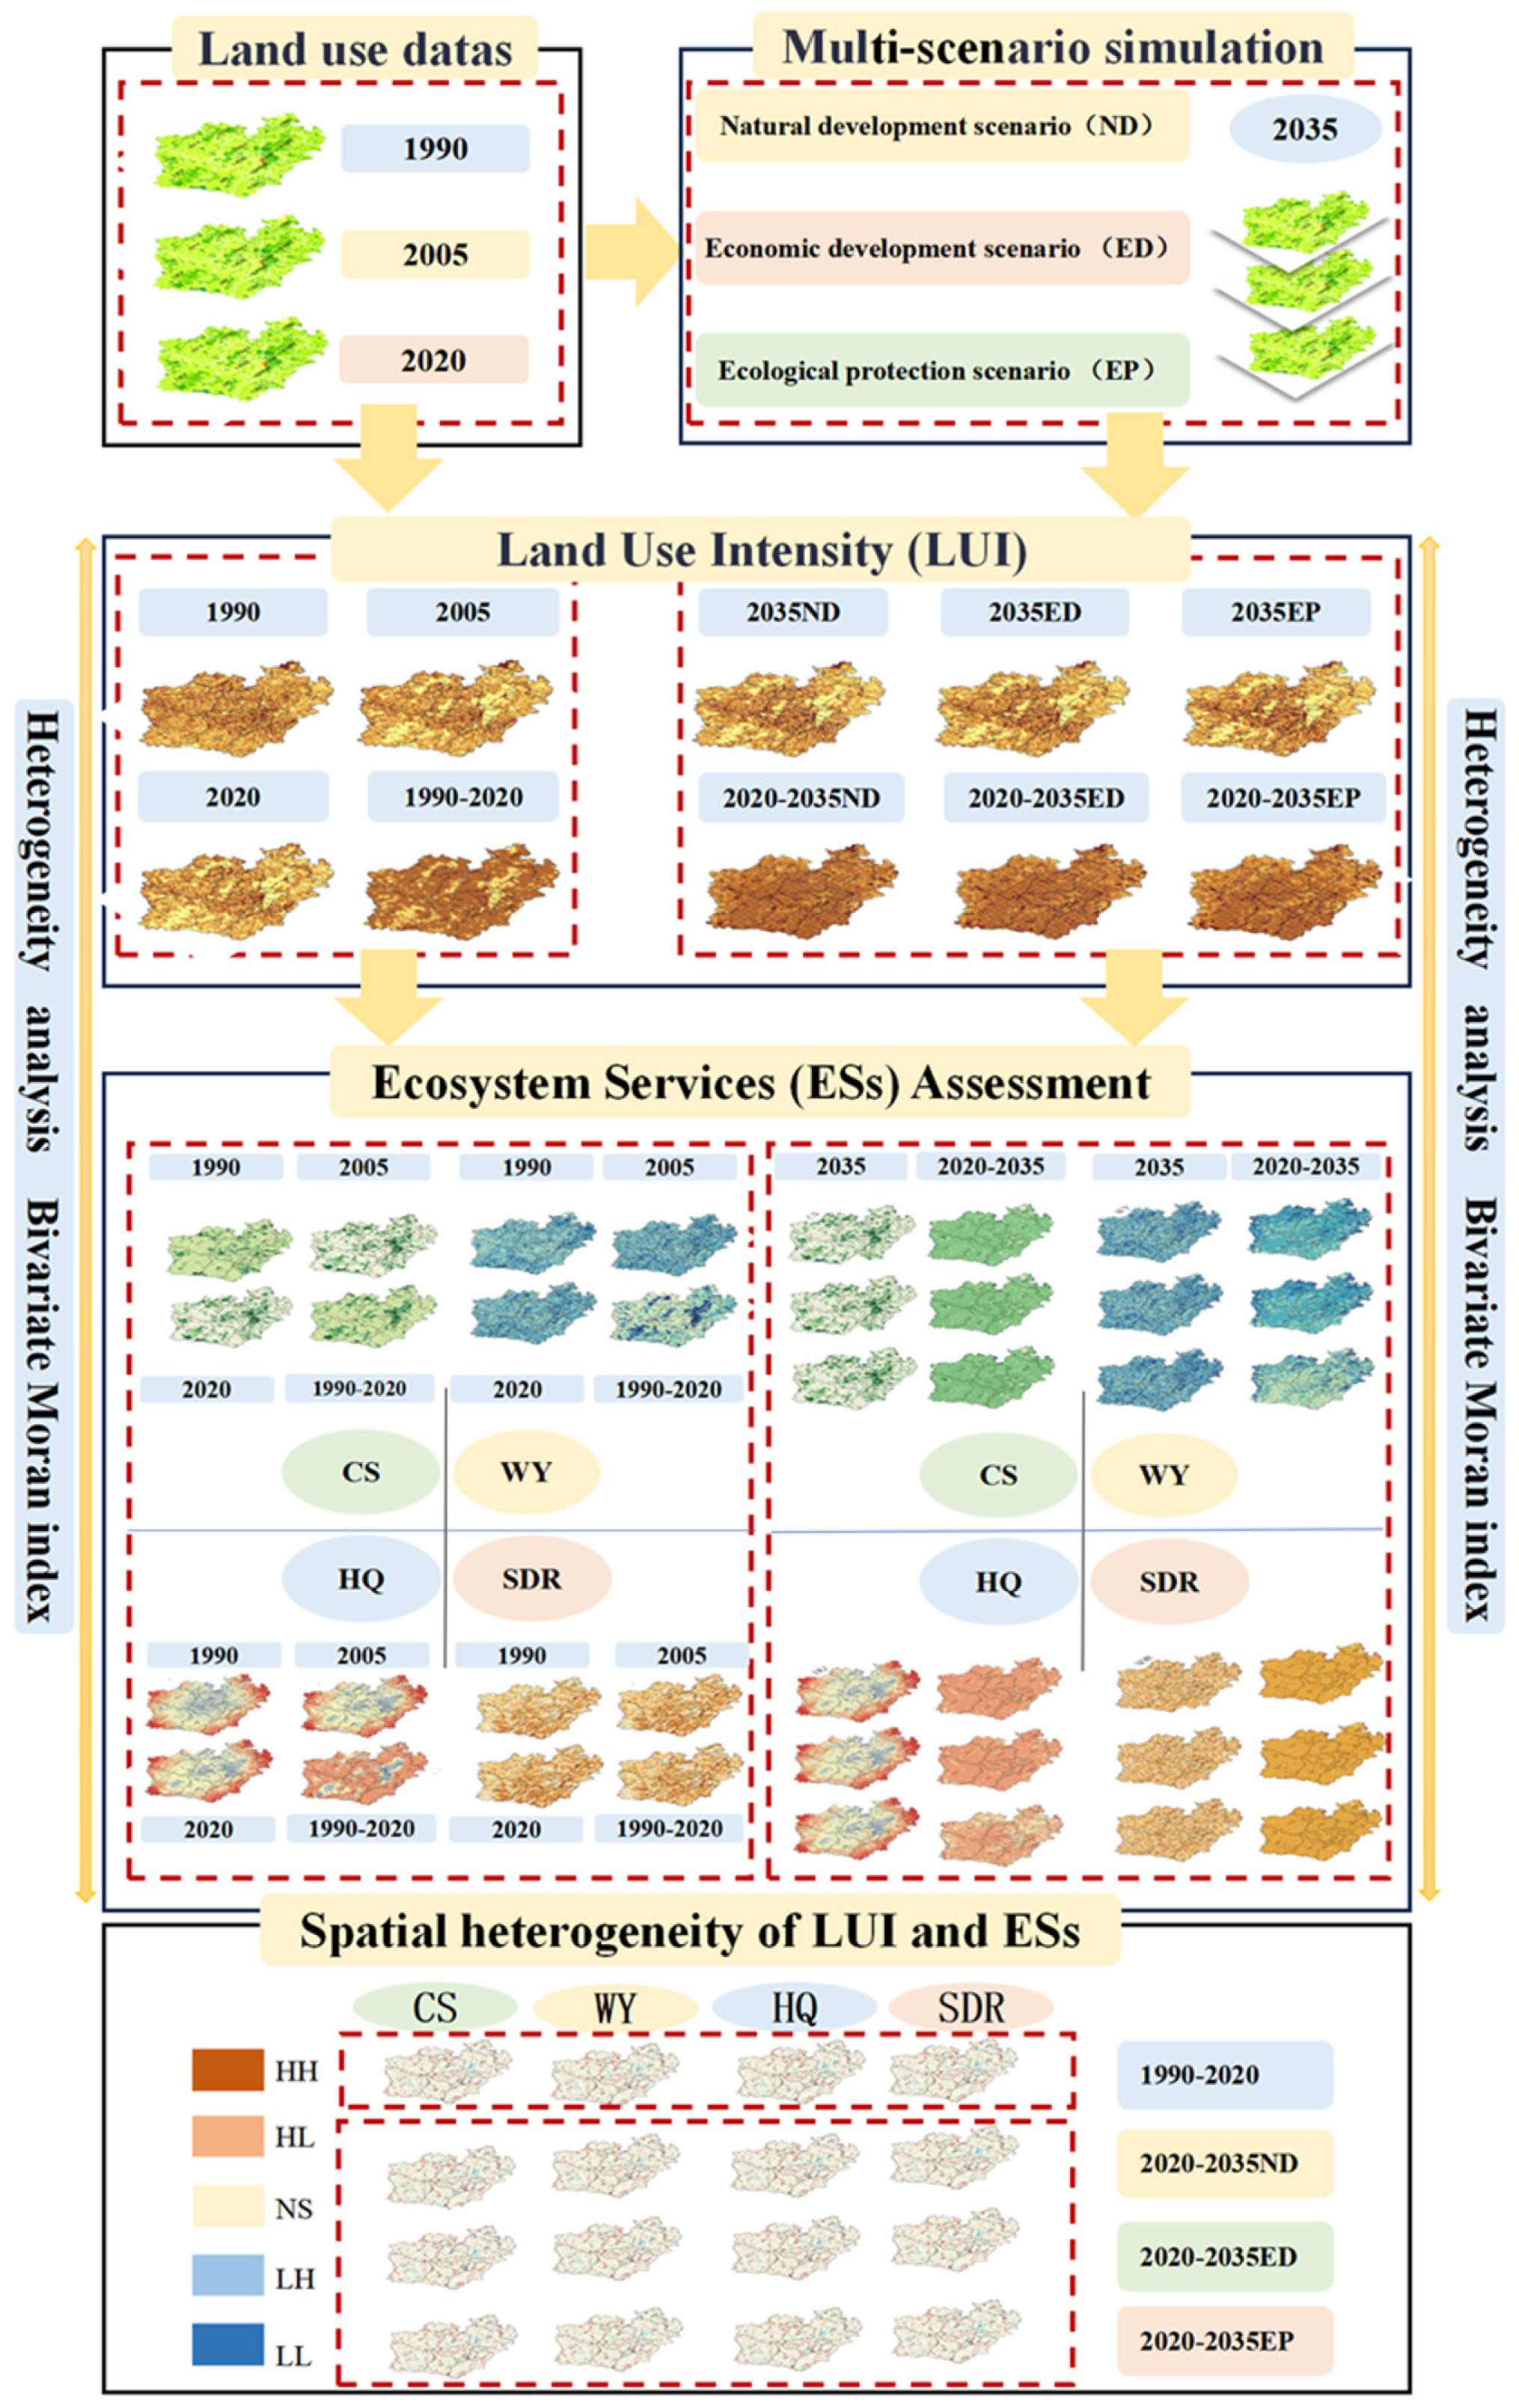
3.1. Research Framework

This study harnesses remote sensing data and GIS technology to gather multidimensional datasets pertinent to land use, climate, and ecosystem services, thereby quantifying land use intensity (LUI) and evaluating carbon storage, water yield, habitat quality, and soil conservation capacity. By employing spatial statistical techniques and regression analysis, the research elucidates the intricate inter-relationships between LUI and ecosystem services. Furthermore, based on the available data, the study will develop various scenarios for 2035, encompassing natural, economic, and ecological protection frameworks, thus providing empirical support for regional sustainable management. The technical pathway for this research is delineated in Figure 2.

3.2. Grid Effect

A spatial quantification sampling approach was employed for Zichang City through a grid-based methodology to obtain land use data for each sampling unit [27]. Prior to the grid construction for data processing, the selection of a 300 m × 300 m grid was based on a comprehensive assessment of factors such as the resolution of land use data, regional extent, and ecological characteristics. First, the 300 m × 300 m grid efficiently balances spatial resolution with computational efficiency and storage requirements, mitigating the data volume expansion and computational burden associated with finer grids (e.g., 100 m × 100 m). Second, given the complex land use structure and prominent topographic features of Zichang City, this grid size effectively captures spatial variations in land use intensity while minimizing noise interference that could arise from excessively fine grids without sacrificing critical detail. Finally, this grid size has been widely applied in similar studies conducted in regions such as the Loess Plateau, adhering to established norms in the literature and facilitating result comparisons and validation. Thus, the 300 m × 300 m grid is deemed optimal for providing precise and efficient data support for land use and ecosystem service analyses.

3.3. Land Use Intensity

The land use intensity model employed in this study is designed to quantify the extent of human-induced disturbances to land use patterns [28]. Drawing from prior studies [29,30], land use intensity is categorized into four levels based on the distinctive characteristics of each land use type: other land use (corresponding to unused land), forest, grassland, water use (corresponding to forests, grasslands, and water bodies), agricultural land use (corresponding to arable land), and built-up land use (corresponding to urban areas, settlements, industrial zones, and transportation infrastructure). The intensity index for each category is assigned sequential values of 1, 2, 3, and 4. Given the potential coexistence of multiple land use types within a region, a composite land use intensity index is employed to reflect the overall intensity of land use activities. Based on this, the calculation expression for land use intensity is formulated as follows:
L L U I = i = 1 n A i × C i C × 100 %
In Equation (1), L L U I represents the comprehensive land use intensity index for Zichang City; A i denotes the graded index of land use intensity for the i level within Zichang City; C i stands for the area of land use at the i level within Zichang City; C is the total area of land use within Zichang City; and n signifies the number of grades for land use intensity.

3.4. Ecosystem Service Assessment

Ecosystem service assessment represents a pivotal approach to understanding the contributions of ecosystems to human well-being, encompassing both the direct and indirect benefits provided by natural systems [31]. Zichang City, situated on the Loess Plateau, is marked by its complex topography, diverse land use patterns, and fragile ecological conditions, particularly in terms of soil erosion, carbon storage, and biodiversity conservation, all of which hold substantial ecological value. In this study, drawing from prior research and considering the regional context, land use intensity, along with four critical ecosystem service functions—carbon storage, water yield, habitat quality, and soil retention—are selected as the primary indicators for quantifying ecosystem service functions and values. These indicators were chosen for their comprehensive ability to reflect the primary functions and services of the Zichang ecosystem and their close alignment with the region’s distinctive environmental characteristics [32,33].

3.4.1. Carbon Fixation Service

The evaluation of carbon sequestration services was conducted using the carbon storage module within the InVEST model for quantification [34]. This model employs land use and land cover types as assessment units, facilitating the calculation of regional carbon stock by multiplying the carbon densities of aboveground biomass, belowground biomass, soil organic carbon, and dead organic matter for each land cover type by their respective areas.
C t o t a l = C a b o v e + C below + C dead + C soil
In Equation (2), C t o t a l , C a b o v e , C b e l o w , C dead , and C soil , respectively, represent total carbon (t), aboveground biomass (t), root biomass (t), carbon in dead organic matter (t), and soil organic carbon storage (t).
Acknowledging that dead organic matter carbon represents a relatively minor fraction of the carbon pool and presents challenges in data acquisition, this study has opted not to incorporate it into the analysis. By utilizing a modified carbon density formula, adjustments were made to the national carbon density data, thereby facilitating the estimation of carbon densities associated with various land use types within Zichang City.
C S P = 3.3968 × M A P + 3996.1 R 2 = 0.11
C B P = 6.798 × e 0.0054 × M A P R 2 = 0.70
C B T = 28 × M A T + 398 R 2 = 0.47 , P < 0.1
K B P = C B P C B P
K B T = C B T C B T
K B = K B P × K B T
K s = C S P C S P
In the equation, C S P represents the soil carbon density (t·hm−2) derived from annual precipitation; C B P and C B T represent the biomass carbon density (t·hm−2) derived from annual precipitation and annual mean temperature, respectively; M A P stands for mean annual precipitation (mm); M A T stands for mean annual temperature (°C); K B P and K B T are the correction coefficients for precipitation and temperature factors in biomass carbon density; C and C are the carbon density data for Zichang City and China, respectively; K B and K S are the correction coefficients for biomass carbon density and soil carbon density, respectively.

3.4.2. Water Production Service

The water yield module of the InVEST model is predicated on the principles of water balance and is grounded in the hypothesis of water-thermal coupling equilibrium, utilizing annual average precipitation data for quantification [35]. The water yield Y(x) is defined as the difference between rainfall and actual evapotranspiration within a grid cell, encompassing surface runoff, soil moisture, canopy interception, and the water retention capacity of litter. Accordingly, this study employs the water yield module of the InVEST model to calculate the water yield in Zichang City. The calculation formula is presented as follows:
Y x = 1 A E T x P x × P x
A E T x P x = 1 P E T x P x 1 P E T x P x ω x 1 / ω x
P E T x = K c l x × E T 0 x
ω x = Z A W C x P x + 1.25
In the equation, Y x represents the annual water yield (mm) for the grid cell x ; A E T x represents the annual actual evapotranspiration (mm) for the grid cell x ; P x represents the annual precipitation (mm) for the grid cell x ; P E T x represents the potential evapotranspiration (mm); ω x represents a non-physical parameter related to natural climate and soil properties; E T 0 x represents the crop (vegetation) evapotranspiration coefficient for a specific land use type in the grid cell x ; A W C x represents the available water capacity (mm) for plants; Z is an empirical constant that can be obtained based on calculations related to annual precipitation events.

3.4.3. Biodiversity Services

Habitat quality is closely tied to both regional structure and ecological functionality, with its level determined by the availability of resources necessary for the survival, reproduction, and growth of species within a given region. It is generally recognized that higher habitat quality is associated with greater biodiversity. In this study, the habitat quality module of the InVEST model was utilized to evaluate habitat quality, integrating land cover data with biodiversity threat factors to generate raster datasets [36]. The stressors were initially selected and assigned weights to represent the extent of their disturbance on different habitat types. The intensity of these stressors decreases with distance, necessitating the definition of a maximum effective range. Moreover, the response of various habitat types to these stressors differs significantly. The calculation formula is outlined as follows:
Q x j = H j 1 D x j z D x j z + k 2
D x j = r = 1 R y = 1 Y r ω r / r = 1 R ω r r y i r x y β x S j r
i r x y = 1 d x y / d r max
In the equation, Q x j represents the habitat quality of grid x in habitat type j ; D x j represents the degree of disturbance to grid x in habitat type j ; k is the half-saturation constant, typically set to Q x j , which is half of the maximum value obtained after a trial run; H j represents the habitat suitability for habitat type j ; R represents the stressor factor; y represents the number of grids in the raster layer for stressor factor r ; Y r represents the total number of grids occupied by stressor factors; ω r represents the weight of stressor factor r , with values ranging from [0, 1]; r y represents the value of stressor factor r for grid y (0 or 1); i r x y represents the degree of disturbance caused by stressor factor r of grid y to habitat grid x ; β x represents the accessibility level of grid x , with values ranging from [0, 1], where 1 indicates extreme ease of access; S j r represents the sensitivity of habitat type j to stressor factor r ; d x y represents the straight-line distance between grid x and grid y ; and d r max represents the maximum impact distance of stressor factor r .

3.4.4. Soil Conservation Services

This study utilized the sediment delivery ratio module of the InVEST model to evaluate soil erosion and soil retention in Zichang City [37]. This module thoroughly incorporates the sediment interception capacity of the land surface and acknowledges the dual functions of vegetation in both mitigating soil erosion and trapping sediments. As a result, it yields an estimate of the soil retention capacity (SD) within the study area. The calculation formula is presented as follows:
U S L E = R × K × S × L × P × C
R K L S = R × K × L × S
S D = R K L S U S L E
In the equation, U S L E represents the actual soil erosion amount (t); R K L S represents the potential soil erosion amount (t); R is the rainfall erosivity factor (MJ·mm·hm−2·h−1); K is the soil erodibility factor (t·hm·h·MJ−1·hm−2·mm−1); L and S are slope length and slope steepness factors, respectively; P is the engineering measure factor; and C is the vegetation cover and management factor.

3.5. Ecosystem Service Volume Classification

This study employed the natural breaks classification method, which not only effectively reflects the distribution characteristics of the data but also avoids the smoothing effect associated with fixed breakpoints [38]. By analyzing four ecosystem services—carbon storage (CS), water yield (WY), habitat quality (HQ), and soil retention capacity (SDR)—in Zichang City for the years 1990, 2005, and 2020, as well as during the period from 1990 to 2020, we classified ecosystem service values into five density levels using ArcGIS 10.8. These levels—low, medium-low, medium, high-medium, and high—capture the spatial and temporal dynamics of ecosystem services at the township scale across Zichang City.

3.6. Multi-Scenario Simulation of Land Use

3.6.1. PLUS Model and Accuracy Verification

The PLUS model, developed from the cellular automata framework, is specifically designed to simulate changes across multiple land use types [39]. This model integrates a land expansion strategy analysis module with a cellular automata model that operates on multi-class random patch seeds. The land expansion strategy analysis module extracts expansion data for different land categories over two periods, while the cellular automata model, combined with random seed generation and a decreasing threshold mechanism, facilitates the simulation of spatial-temporal patch dynamics. Before conducting formal simulations, the land use map of Zichang City in 2015 was utilized as a benchmark to validate the accuracy of the PLUS model and to predict land use patterns for 2020. The predicted results were compared to the actual land use map of Zichang City in 2020. High similarity between the two maps indicates good model performance, while low similarity suggests otherwise. To assess the degree of similarity, the Kappa coefficient was applied to quantify the spatial distribution consistency between the images.

3.6.2. Multi-Scenario Settings

In light of the complexities inherent in addressing multifaceted policy and societal changes through a singular future development scenario, this study employs the PLUS model to delineate three distinct scenarios. By analyzing land use transitions in Zichang City from 2015 to 2020 and incorporating the relevant development plans and policies from both Yan’an City and Shaanxi Province, the PLUS model was utilized to refine the transition probabilities, intensities, and directions between various land use categories, thereby constructing three future development pathways for Zichang City.
(1)
Natural development scenario: By serving as the reference scenario for the others, this scenario operates under the assumption of no interference from local policies or planning frameworks. It forecasts land use demands in 2035 based solely on the land use transition probabilities observed in Zichang City between 2015 and 2020, as projected by the PLUS model [40].
(2)
Economic development scenario: This scenario posits a framework of unconstrained urban expansion. Derived from the land use transition matrix for 2010–2015, the following adjustments were made: a 60% increase in the transition probability from farmland to construction land, a 50% increase from grassland to construction land, and a 30% increase from unused land to construction land, while other transition probabilities remained unchanged [41].
(3)
Ecological protection scenario: In accordance with the directives outlined in the “Shaanxi Provincial Territorial Spatial Plan (2021–2035)” and the “Zichang City Territorial Spatial Plan (2021–2035)”, this scenario places paramount importance on ecological redlines and protective frameworks. Water systems and natural reserves within the study area collectively delineate restricted zones. Specific adjustments to land use transitions include the following: a 50% reduction in the probability of grassland and forest land converting to construction land; a 30% increase in the probability of farmland transitioning to forest land, and a 60% increase of it transitioning to grassland; a 50% decrease in the probability of farmland transitioning to construction land; an 80% reduction in the likelihood of forest land shifting to farmland, an 80% reduction in the likelihood of it shifting to grassland, and a 90% reduction in the likelihood of it shifting to construction land; a 20% increase in the probability of grassland transitioning to farmland and an 80% decrease in its probability of transitioning to construction land; a 20% increase in the probability of unused land transitioning to both farmland and forest land, and a 50% increase in the probability of it transitioning to grassland, with other transition probabilities remaining largely unchanged [42].

3.7. Bivariate Moran Index

Spatial autocorrelation is a critical method used to examine whether the attribute values of a given factor are significantly correlated with the attribute values at neighboring spatial points. It typically involves tests of both global and local spatial autocorrelation [43]. By building on this, the study extends the analysis to bivariate global and local spatial autocorrelation to uncover the spatial distributional relationships between different factors, specifically land use intensity and ecosystem service quantities. The formula is provided as follows:
I = N i N j 1 N W i j z i e z j u N 1 i N j 1 N W i j
I e u = z e j = 1 N W i j z i j u
In the equation, I e u and I e u represent the bivariate global Moran’s I and local Moran’s I indices, respectively; z i e is the land use intensity of the i unit; z j u is the ecosystem service energy in the neighboring area of j ; W i j is the spatial weight matrix; and N is the number of grid cells for the evaluation in the city of Zichang. The Moran’s I index ranges from [−1, 1]. A positive index indicates a positive correlation between regions; a negative index indicates a negative correlation between regions; and an index of 0 indicates no spatial correlation.

4. Results

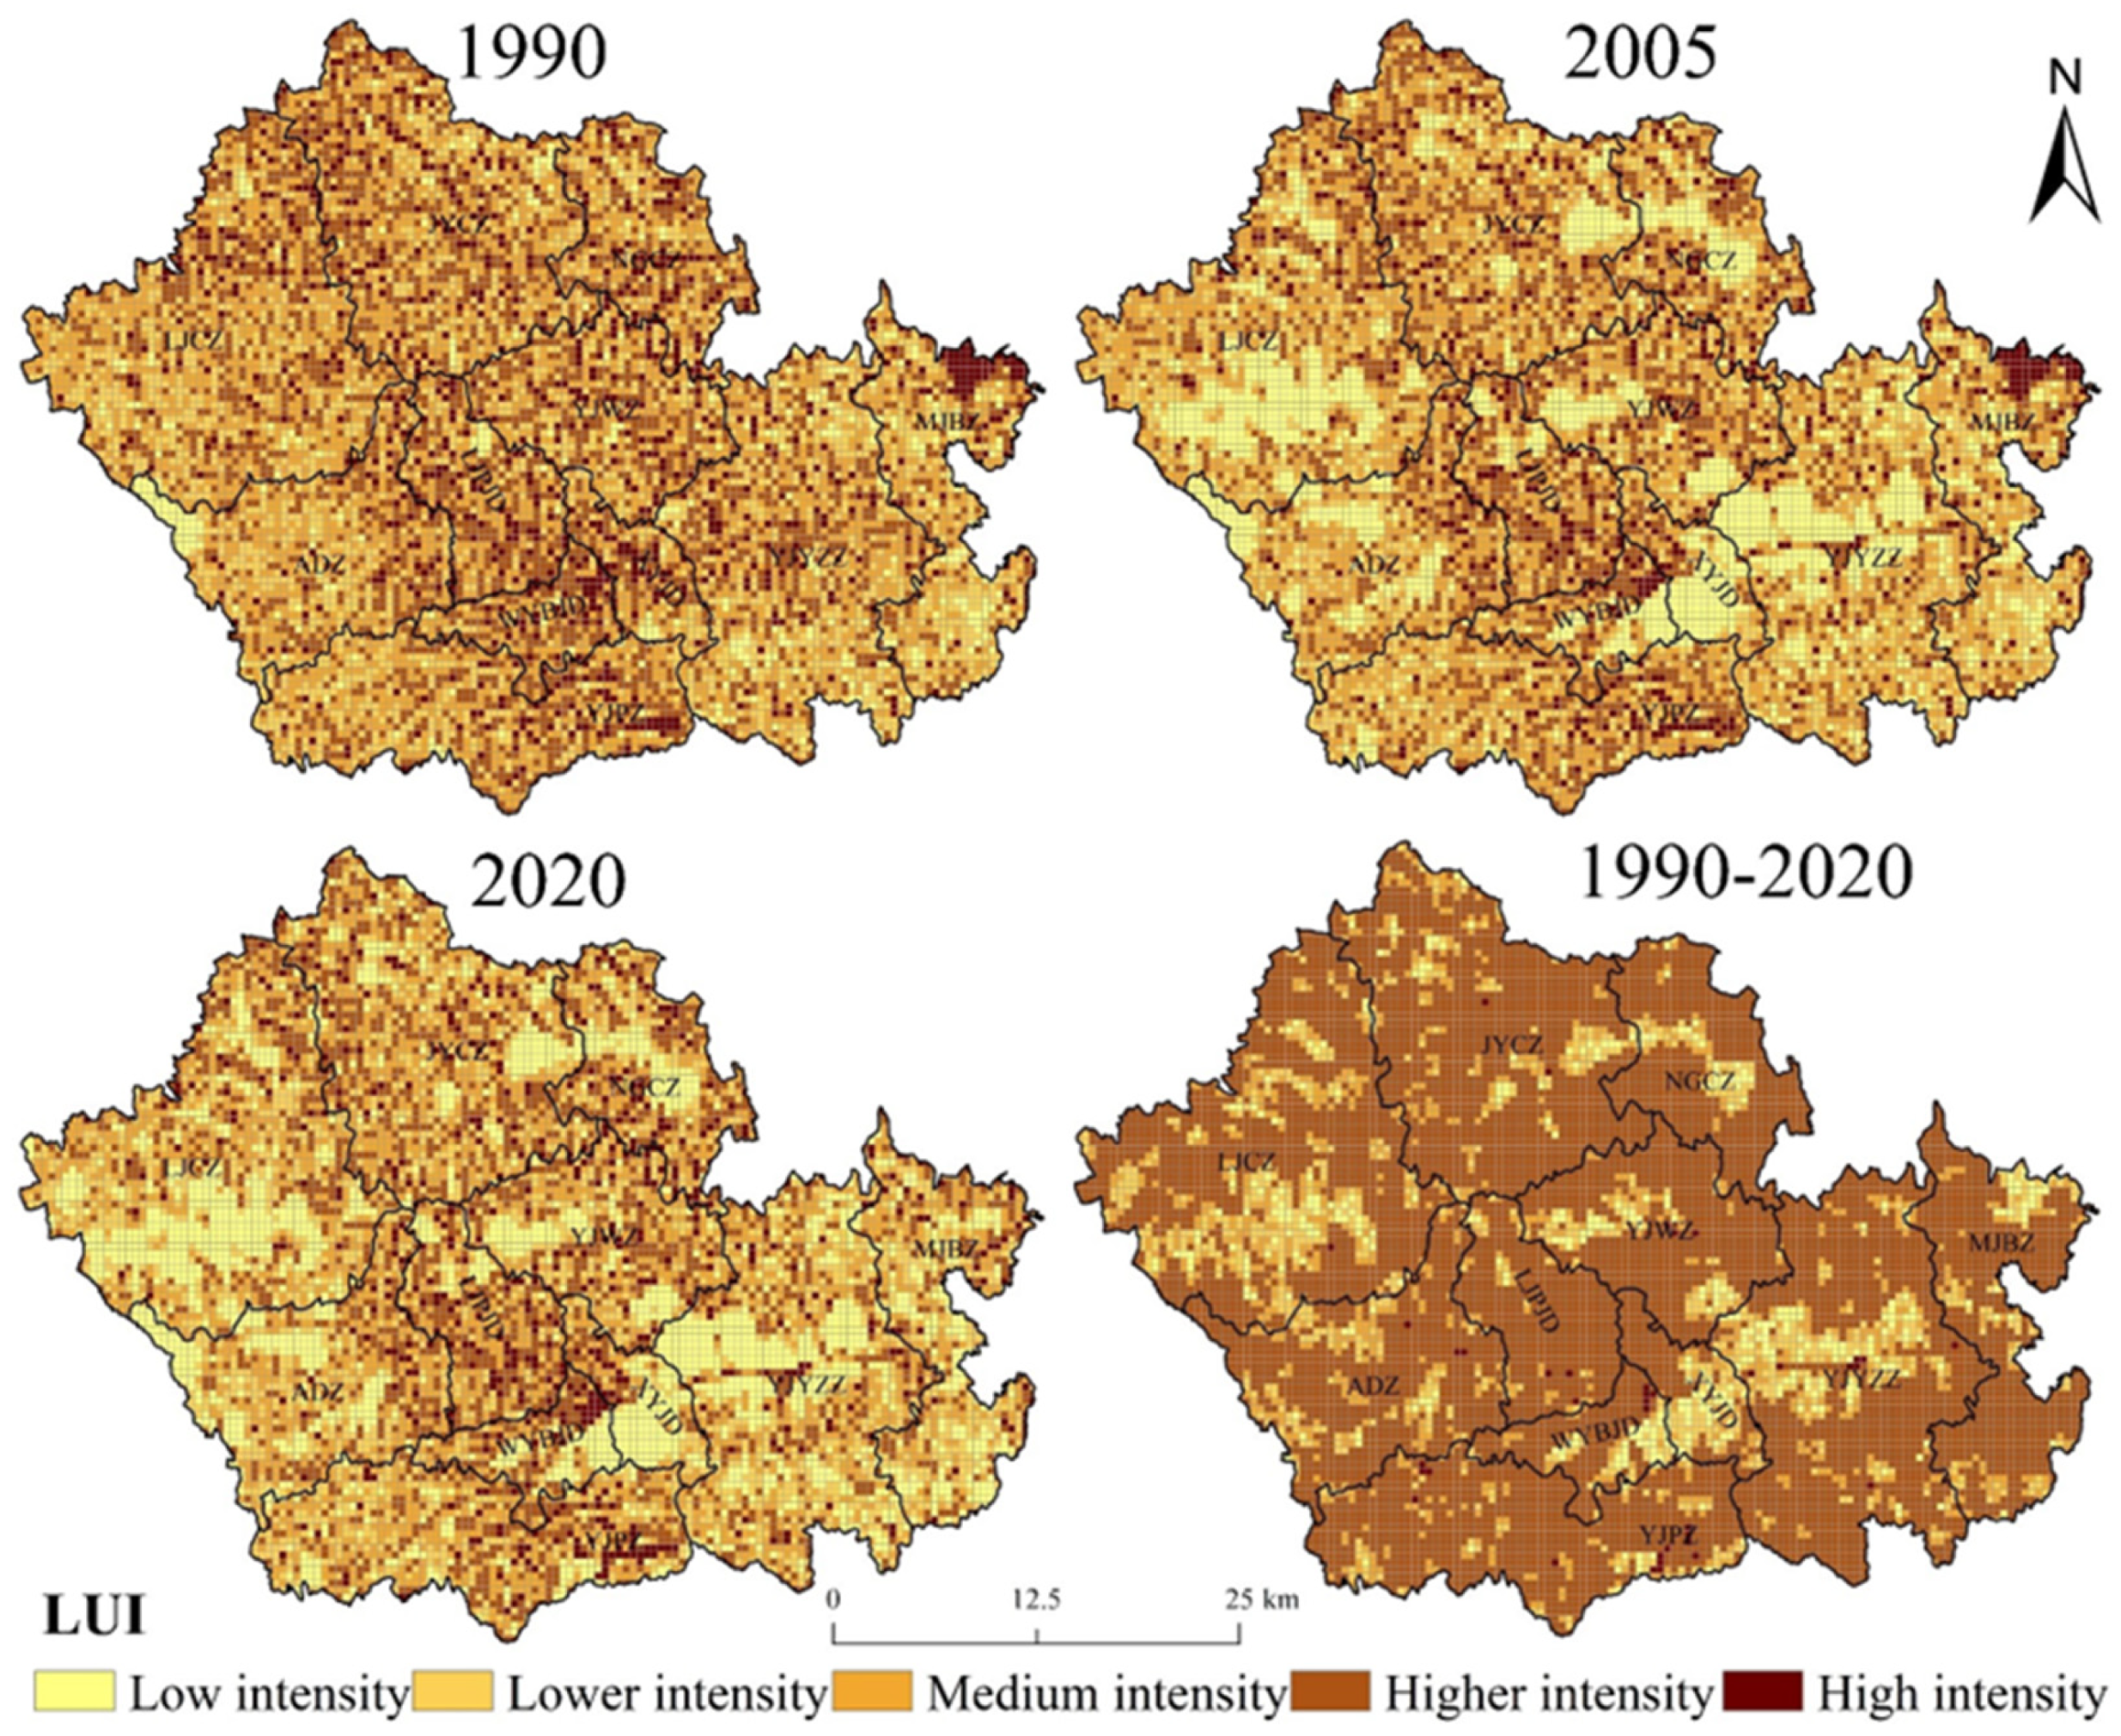
4.1. Spatial and Temporal Distribution of Land Use Intensity

Between 1990 and 2020, the land use intensity in Zichang City exhibited a continuous decreasing trend, characterized by a distribution pattern that is concentrated in the central areas while exhibiting a gentler slope towards the peripheries. Overall, the land use intensity predominantly reflects low intensity (average proportion: 22.83%), moderate intensity (average proportion: 29.78%), and high intensity (average proportion: 25.37%) (Figure 3). Specifically, in 1990, the area designated as low intensity was relatively small (proportion: 4.69%) and displayed a dispersed distribution, primarily manifested as patchy clusters in the western and southeastern regions. In contrast, the area classified as high intensity was more concentrated (proportion: 10.39%), primarily located in the northern part of MJBZ, as well as in the WYBJD and LJPJD regions. By 2005, the low-intensity area had gradually expanded (proportion: 16.85%) and become more centralized, with predominant distribution in the central region of LJCZ, southern XYJD, and western YJYZZ. Meanwhile, the moderate-intensity (proportion: 24.22%) and high-intensity (proportion: 7.10%) areas exhibited an interleaved distribution, primarily concentrated in LJPJD, WYBJD, YJPZ, and the northern part of MJBZ. By 2020, the low-intensity area further extended (proportion: 20.17%), forming a continuous region; conversely, the moderate- (proportion: 27.22%), high- (proportion: 23.07%), and very high-intensity (proportion: 6.83%) areas gradually diminished, particularly the high- and very high-intensity areas, which were notably concentrated in the LJPJD and WYBJD regions.
Between 1990 and 2020, the overall changes in land use intensity revealed distinct spatial characteristics, predominantly characterized by the expansion of low-intensity areas and a corresponding decline in other intensity categories (low, moderate, and high) (Figure 3). Notably, low-intensity areas have continued to expand (proportion: 15.48%) and are relatively concentrated, primarily located in regions such as LJCZ, XYJD, YJYZZ, YJWZ, MJBZ, NGCZ, and JYCZ. The variation within the low-intensity category is minimal (proportion: −0.46%), primarily interacting with adjacent low-intensity regions. Conversely, moderate-intensity (proportion: −5.67%) and high-intensity (proportion: −5.77%) areas have experienced substantial reductions, with significant concentrations observed in the central regions of WYBJD, XYJD, and YJYZZ within the study area. The decrease in high-intensity areas is relatively modest (proportion: −3.57%) and is predominantly situated in the WYBJD and YJPZ regions. Furthermore, land use intensity in other towns has exhibited relative stability.

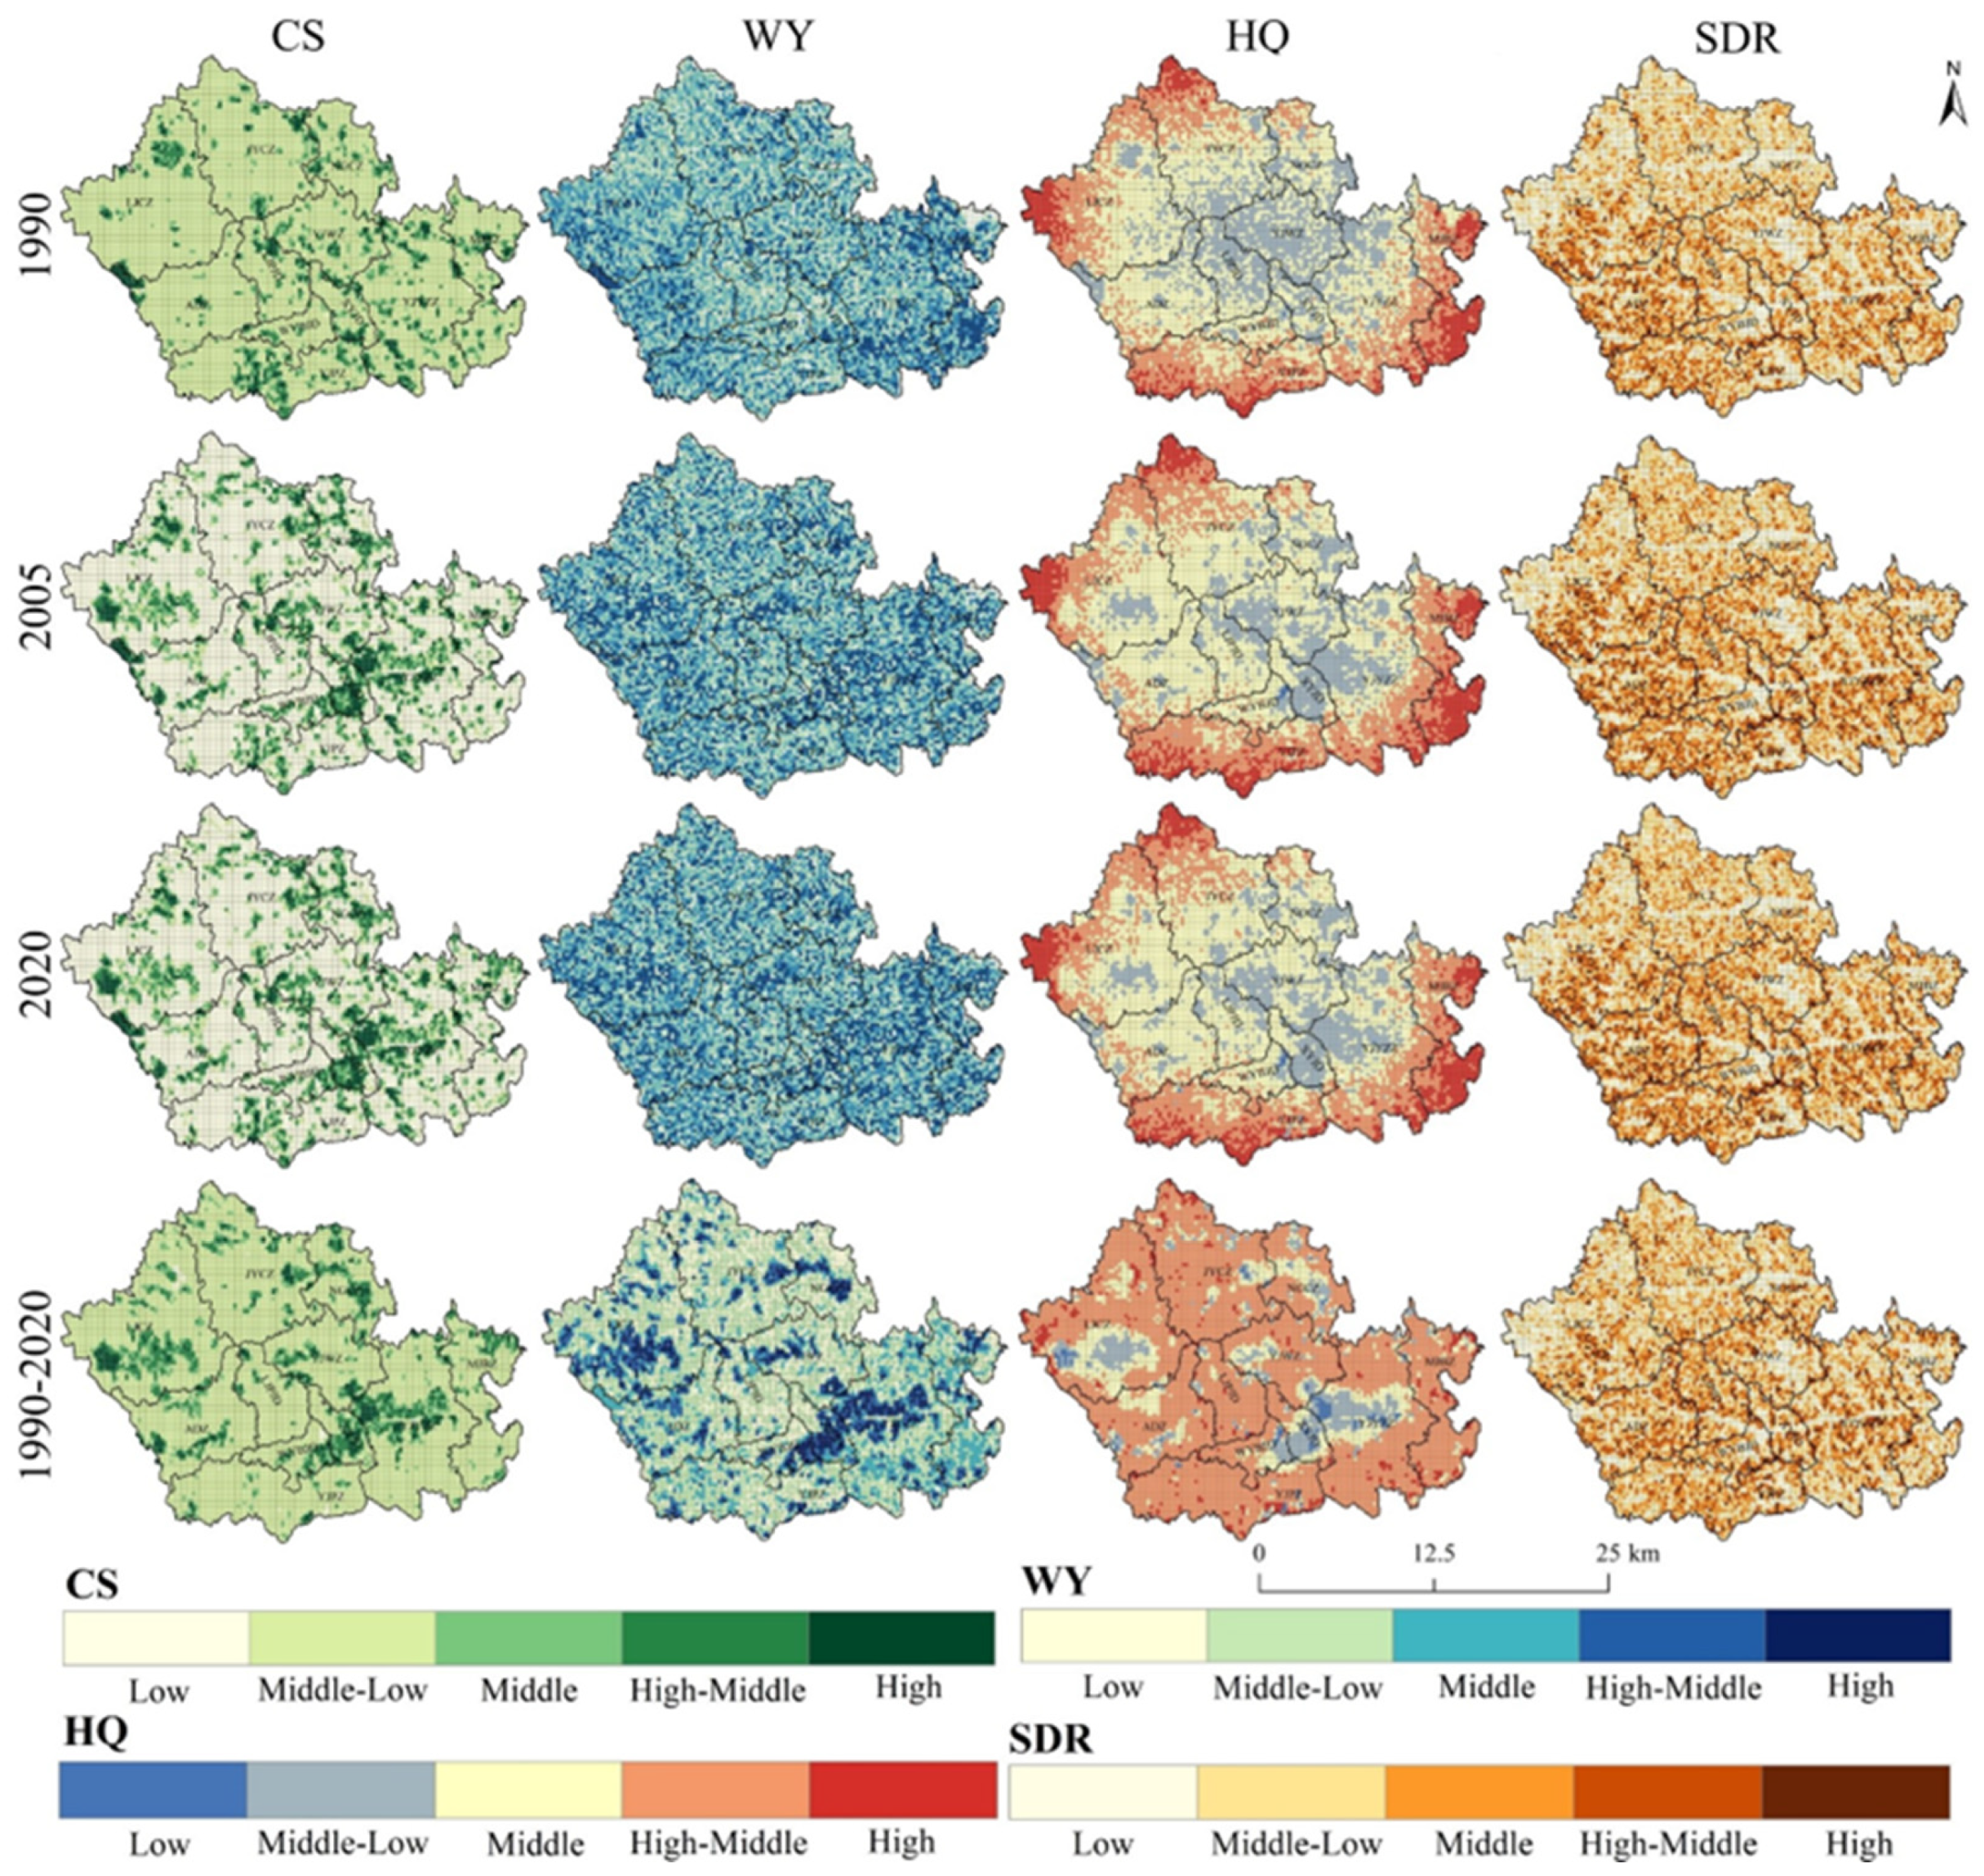
4.2. Temporal and Spatial Changes of Ecosystem Services

Between 1990 and 2020, the four categories of ecosystem services in Zichang City—carbon storage, water yield, habitat quality, and soil retention—exhibited significant spatial differentiation characteristics (Figure 4). Specifically, carbon storage displayed a pronounced patchy distribution, predominantly characterized by low carbon storage areas (average proportion: 61.69%), while high carbon storage regions constituted a relatively small proportion (average proportion: 5.75%). Water yield was primarily concentrated in the southeastern region, with moderate water yield areas prevailing (average proportion: 30.35%), whereas low water yield areas represented the smallest fraction (average proportion: 2.67%). The spatial distribution of habitat quality was marked by lower values in the central region and higher values in the peripheral areas, where moderate habitat quality dominated (average proportion: 44.83%), and low habitat quality was exceedingly rare (average proportion: 0.08%). Soil retention services exhibited a distribution pattern of higher values in the southwest and lower values in the northeast, predominantly characterized by low soil retention (average proportion: 35.39%), with high soil retention areas comprising the smallest proportion (average proportion: 3.13%).
Between 1990 and 2020, the trend in carbon storage exhibited an increase in low carbon storage, while other categories of carbon storage witnessed a decline (Figure 4). Medium carbon storage (average proportion: 11.50%), higher carbon storage (average proportion: 9.06%), and high carbon storage (average proportion: 5.75%) were predominantly concentrated in the convergence zones of XYJD, YJYZZ, and YJWZ, characterized by relatively large areas. Additional high carbon storage regions were dispersed across the western part of LJCZ, the central area of NGCZ, and the central region of YJPZ. Regarding water production, medium water yield (average proportion: 30.35%), higher water yield (average proportion: 24.93%), and lower water yield (average proportion: 23.49%) emerged as the primary distribution types, with high water yield (average proportion: 18.56%) predominantly concentrated in the convergence areas of XYJD, YJYZZ, and YJWZ, as well as in MJBZ and LJCZ, while low water yield exhibited a patchy distribution. Habitat quality was primarily characterized by medium habitat quality (average proportion: 44.83%), followed by higher habitat quality (average proportion: 26.60%) and lower habitat quality (average proportion: 18.60%), with low habitat quality (average proportion: 0.08%) being the least prevalent, primarily concentrated in WYBJD and also distributed across XYJD, YJYZZ, YJWZ, NGCZ, and LJCZ. Soil conservation services were predominantly represented by low soil conservation (average proportion: 35.39%), followed by medium soil conservation (average proportion: 26.20%) and low soil conservation (average proportion: 22.45%), while high soil conservation (average proportion: 3.13%) was the least represented, mainly concentrated in the regions of LJCZ, ADZ, and YJPZ, with low soil conservation predominantly distributed in the northern part of LJCZ, JYCZ, NGCZ, and MJBZ.
Between 1990 and 2020, the dynamics of ecosystem services demonstrated a distinct spatial pattern characterized by pronounced fluctuations in the central regions, contrasted by more gradual changes in the peripheral areas (Figure 4). Specifically, low carbon storage exhibited a significant increase, with a proportional rise of 2.89%, predominantly concentrated in the northern sector of LJCZ, the central area of JYCZ, and the southern portions of MJBZ and YJPZ. Conversely, carbon storage in other categories experienced a decline, particularly evident in the convergence zones of XYJD, YJYZZ, and YJWZ. In terms of water production, high water yield registered a notable increase, marked by a proportional rise of 9.45%, primarily situated at the boundary between LJCZ and JYCZ. In contrast, yields in other categories diminished in the convergence zones of XYJD and YJYZZ, as well as in the central region of LJCZ. Regarding habitat quality, lower habitat quality underwent a significant reduction of 5.59%, primarily concentrated at the intersections of XYJD and YJYZZ, along with the central area of LJCZ. Notably, habitat quality in adjacent regions exhibited signs of improvement. For soil conservation, the proportions of both low and moderate soil conservation declined by 4.39% and 1.86%, respectively, with these reductions primarily observed in the northern section of LJCZ, the central region of NGCZ, and MJBZ. In contrast, increases in other categories of soil conservation were noted in the ADZ and YJPZ regions.

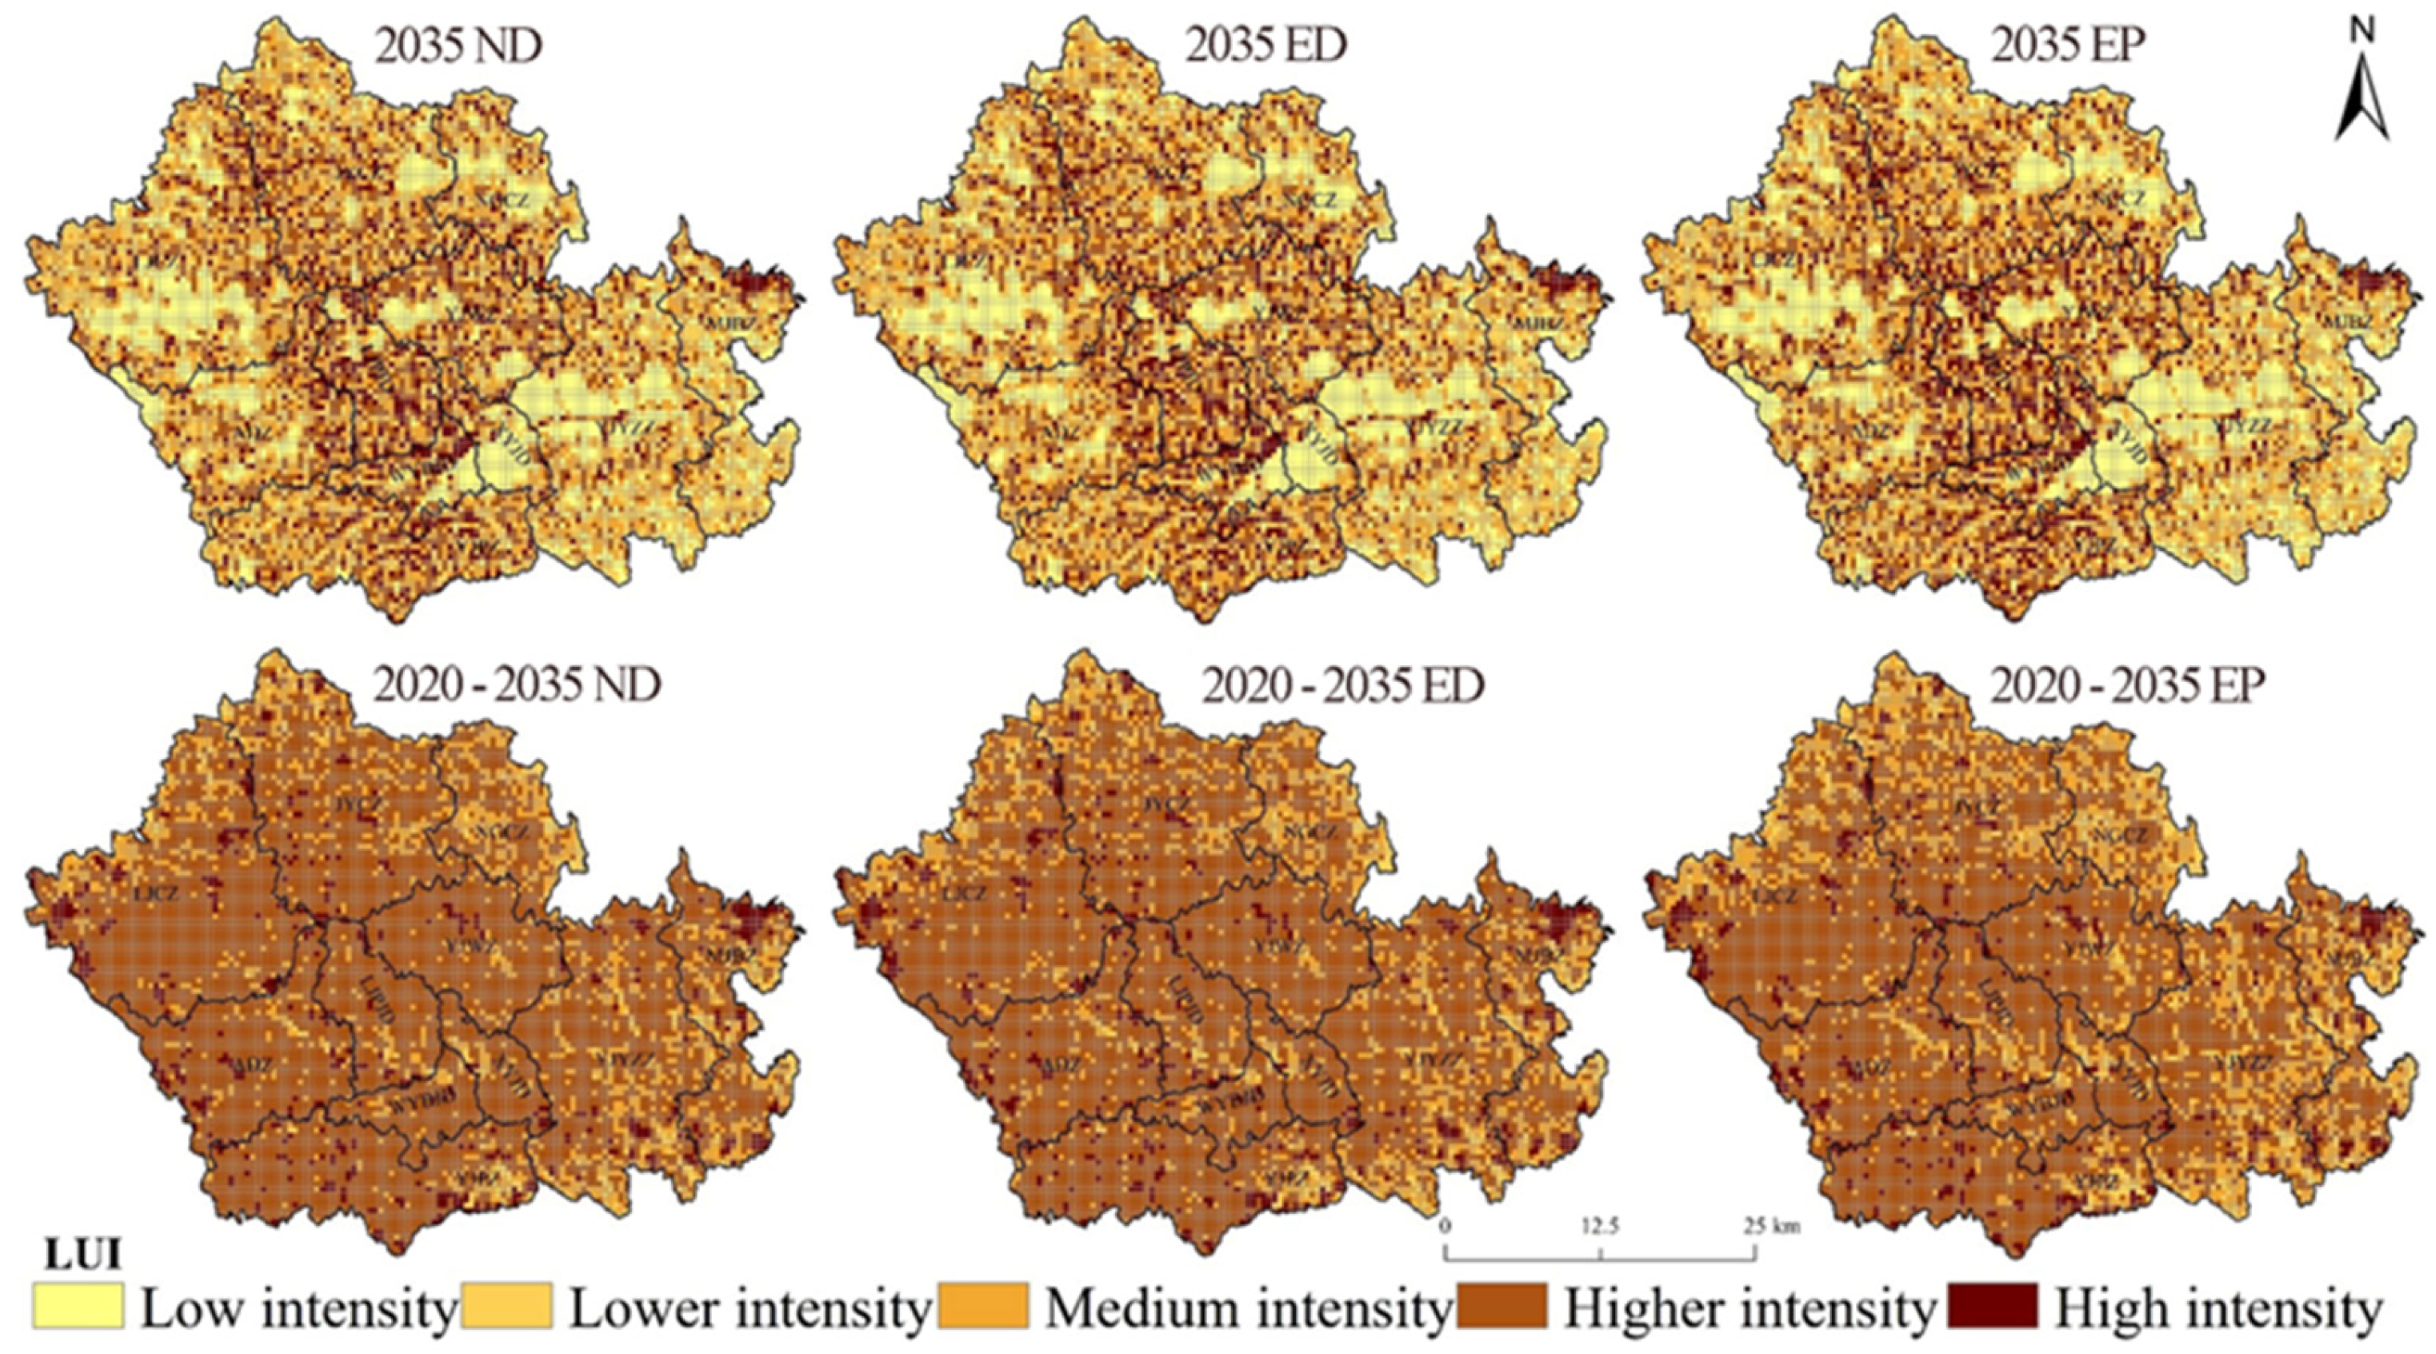
4.3. Spatial and Temporal Distribution of Land Use Intensity in Multiple Scenarios

The simulated land use results for Zichang City in 2020 were compared with actual land use conditions, yielding a Kappa coefficient approaching 0.90. This indicates a high level of simulation accuracy, which is sufficient to support the modeling and forecasting of land use changes under multiple scenarios in Zichang City. Furthermore, the model can also be employed to calculate land use intensity and ecosystem service quantities in Zichang City under various future scenarios.
By 2035, land use intensity in Zichang City is projected to exhibit similar spatial consistency across three scenarios, characterized by a central area of moderate intensity and more gradual distributions towards the periphery (Figure 5). In the natural development, ecological conservation, and economic development scenarios, land use intensity is predominantly classified as moderate intensity (average proportion: 26.68%), higher intensity (average proportion: 22.98%), lower intensity (average proportion: 22.88%), and low intensity (average proportion: 17.98%), with high-intensity areas comprising a relatively small proportion (average proportion: 9.10%).
Compared to 2020, under the natural development scenario, low-intensity and high-intensity areas decreased by 2.64% and 0.10%, respectively, while moderate-intensity, lower-intensity, and higher-intensity areas increased by 0.36%, 0.18%, and 1.81%, respectively (Figure 5). Notably, the increase in moderate intensity predominantly occurred in the eastern and northern fringes of the study area, whereas high-intensity areas were concentrated in the western, southern, and northeastern edges. In the ecological protection scenario, high-intensity areas experienced a substantial increase (3.07%), whereas all other intensity categories witnessed a decline. High-intensity land use was primarily distributed along the eastern and western peripheries, with moderate intensity showing a decrease in the central region (−1.68%). Conversely, in the economic development scenario, both low-intensity and moderate-intensity areas exhibited reductions, with the most significant decline occurring in low-intensity areas (−2.78%). In contrast, lower-intensity, higher-intensity, and high-intensity areas all expanded, with high-intensity areas experiencing a notable increase (1.94%), particularly concentrated in the western and eastern fringes of the study area, while changes in the central region remained relatively minor.

4.4. Spatial and Temporal Distribution of Multi-Scenario Ecosystem Services

By 2035, the spatial distribution characteristics of the four ecosystem service functions across the three development scenarios will largely remain consistent with those observed in 2020 (Figure 6). Carbon storage will exhibit a pattern characterized by high-value clustering and low-value dispersion, with elevated areas primarily concentrated at the intersections of WYBJD, XYJD, YJYZZ, and YJWZ. Water production will demonstrate a trend of higher values in the southeast and lower values in the northwest, with the primary high-value zones located in WYBJD, XYJD, YJYZZ, and MJBZ, resulting in an overall banded distribution. Habitat quality will reflect a pattern of lower values in the center and higher values surrounding it, with the low-value areas gradually expanding outward, encroaching upon adjacent moderate- and low-value regions. Soil conservation will display a distribution characterized by higher values in the southwest and lower values in the northeast, with high-value areas predominantly concentrated at the convergence of XYJD and WYBJD.
During the period from 2020 to 2035, the overall trends in carbon storage across the three development scenarios indicated a reduction in low-value areas, accompanied by increases in other categories (Figure 6). In the 2020-ND scenario, low-value carbon storage decreased by −2.10%, primarily concentrated in the northern region of MJBZ and the eastern and central areas of YJPZ. Conversely, moderate carbon storage saw an increase of 0.85%, exhibiting a general rise across various townships. High-value carbon storage also increased by 0.43%, predominantly found in the eastern parts of NGCZ, MJBZ, and the northeastern region of LJCZ. The spatial distribution characteristics for the 2020-EP and 2020-CB scenarios were largely consistent with those of the 2020-ND scenario, reflecting patchy changes in the aggregation of different categories. Specifically, in the 2020-EP scenario, low-value carbon storage decreased by −2.89%, while moderate- and high-value categories increased by 1.03% and 0.60%, respectively. In contrast, the 2020-CB scenario recorded a reduction in low-value carbon storage of −2.15%, alongside increases of 0.92% in moderate- and 0.43% in high-value categories.
Between 2020 and 2035, the water yield across the three development scenarios demonstrated a notable trend characterized by a decline in both low- and moderate-value categories, juxtaposed with a significant increase in high-value categories (Figure 6). In the 2020-ND scenario, low-value water yield (proportion: −0.57%) and moderate-low-value water yield (proportion: −1.96%) exhibited a predominantly patchy distribution, concentrating primarily in the northern region of MJBZ and other township areas. In stark contrast, high-value water yield (proportion: 3.12%) registered a significant increase, predominantly located in the southern part of YJYZZ, as well as in the eastern regions of MJBZ, NGCZ, JYCZ, and the northern section of LJCZ. The spatial distribution characteristics of the 2020-CB scenario mirrored those observed in the 2020-ND scenario. In the 2020-EP scenario, low-value (proportion: −1.13%) and moderate-low-value (proportion: −4.34%) water yields experienced reductions in the regions of LJCZ, JYCZ, YJWZ, ADZ, and YJPZ. Conversely, both high-value (proportion: 2.05%) and very high-value (proportion: 5.16%) water yields exhibited significant increases along the margins of YJYZZ, MJBZ, NGCZ, JYCZ, and LJCZ.
During the period from 2020 to 2035, habitat quality across the three development scenarios exhibited a trend characterized by decreases in low and moderate categories, accompanied by increases in higher categories (Figure 6). In the 2020-ND scenario, low habitat quality (proportion: −1.68%) predominantly decreased in a patchy distribution across the eastern parts of XYJD and YJYZZ, as well as in the eastern region of NGCZ. Moderate habitat quality (proportion: −0.23%) also diminished in the areas of YJYZZ, MJBZ, XYJD, and LJCZ, while high habitat quality (proportion: 0.54%) experienced sporadic increases in the regions of JYCZ, MJBZ, and YJPZ. The spatial distribution characteristics of the 2020-CB scenario were largely consistent with those observed in the 2020-ND scenario. In the 2020-EP scenario, low habitat quality (proportion: −1.85%) and moderate habitat quality (proportion: −0.73%) exhibited reductions in a contiguous manner across LJCZ, JYCZ, NGCZ, MJBZ, YJYZZ, and XYJD. Conversely, higher habitat quality (proportion: 1.61%) and very high habitat quality (proportion: 0.90%) significantly increased in the southern regions of YJPZ, the eastern parts of MJBZ, and the northern area of JYCZ.
During the period from 2020 to 2035, the trends in soil conservation across the three development scenarios exhibited a pattern characterized by a reduction in both high and very high categories, while other categories showed an increase (Figure 6). In the 2020-ND scenario, the proportions of high and very high categories both decreased by 0.05%, primarily distributed in LJCZ, WYBJD, XYJD, YJPZ, and YJYZZ, displaying a patchy and sporadic decline. The moderate category remained unchanged (proportion: 0.00%), while other categories experienced slight increases, with more dispersed distributions. The spatial distribution characteristics of the 2020-EP and 2020-CB scenarios closely mirrored those of the 2020-ND scenario, predominantly characterized by patchy changes in aggregated areas across all categories, with minimal variation in the moderate category. In the 2020-EP scenario, the reduction in the higher category was recorded at −0.09%.

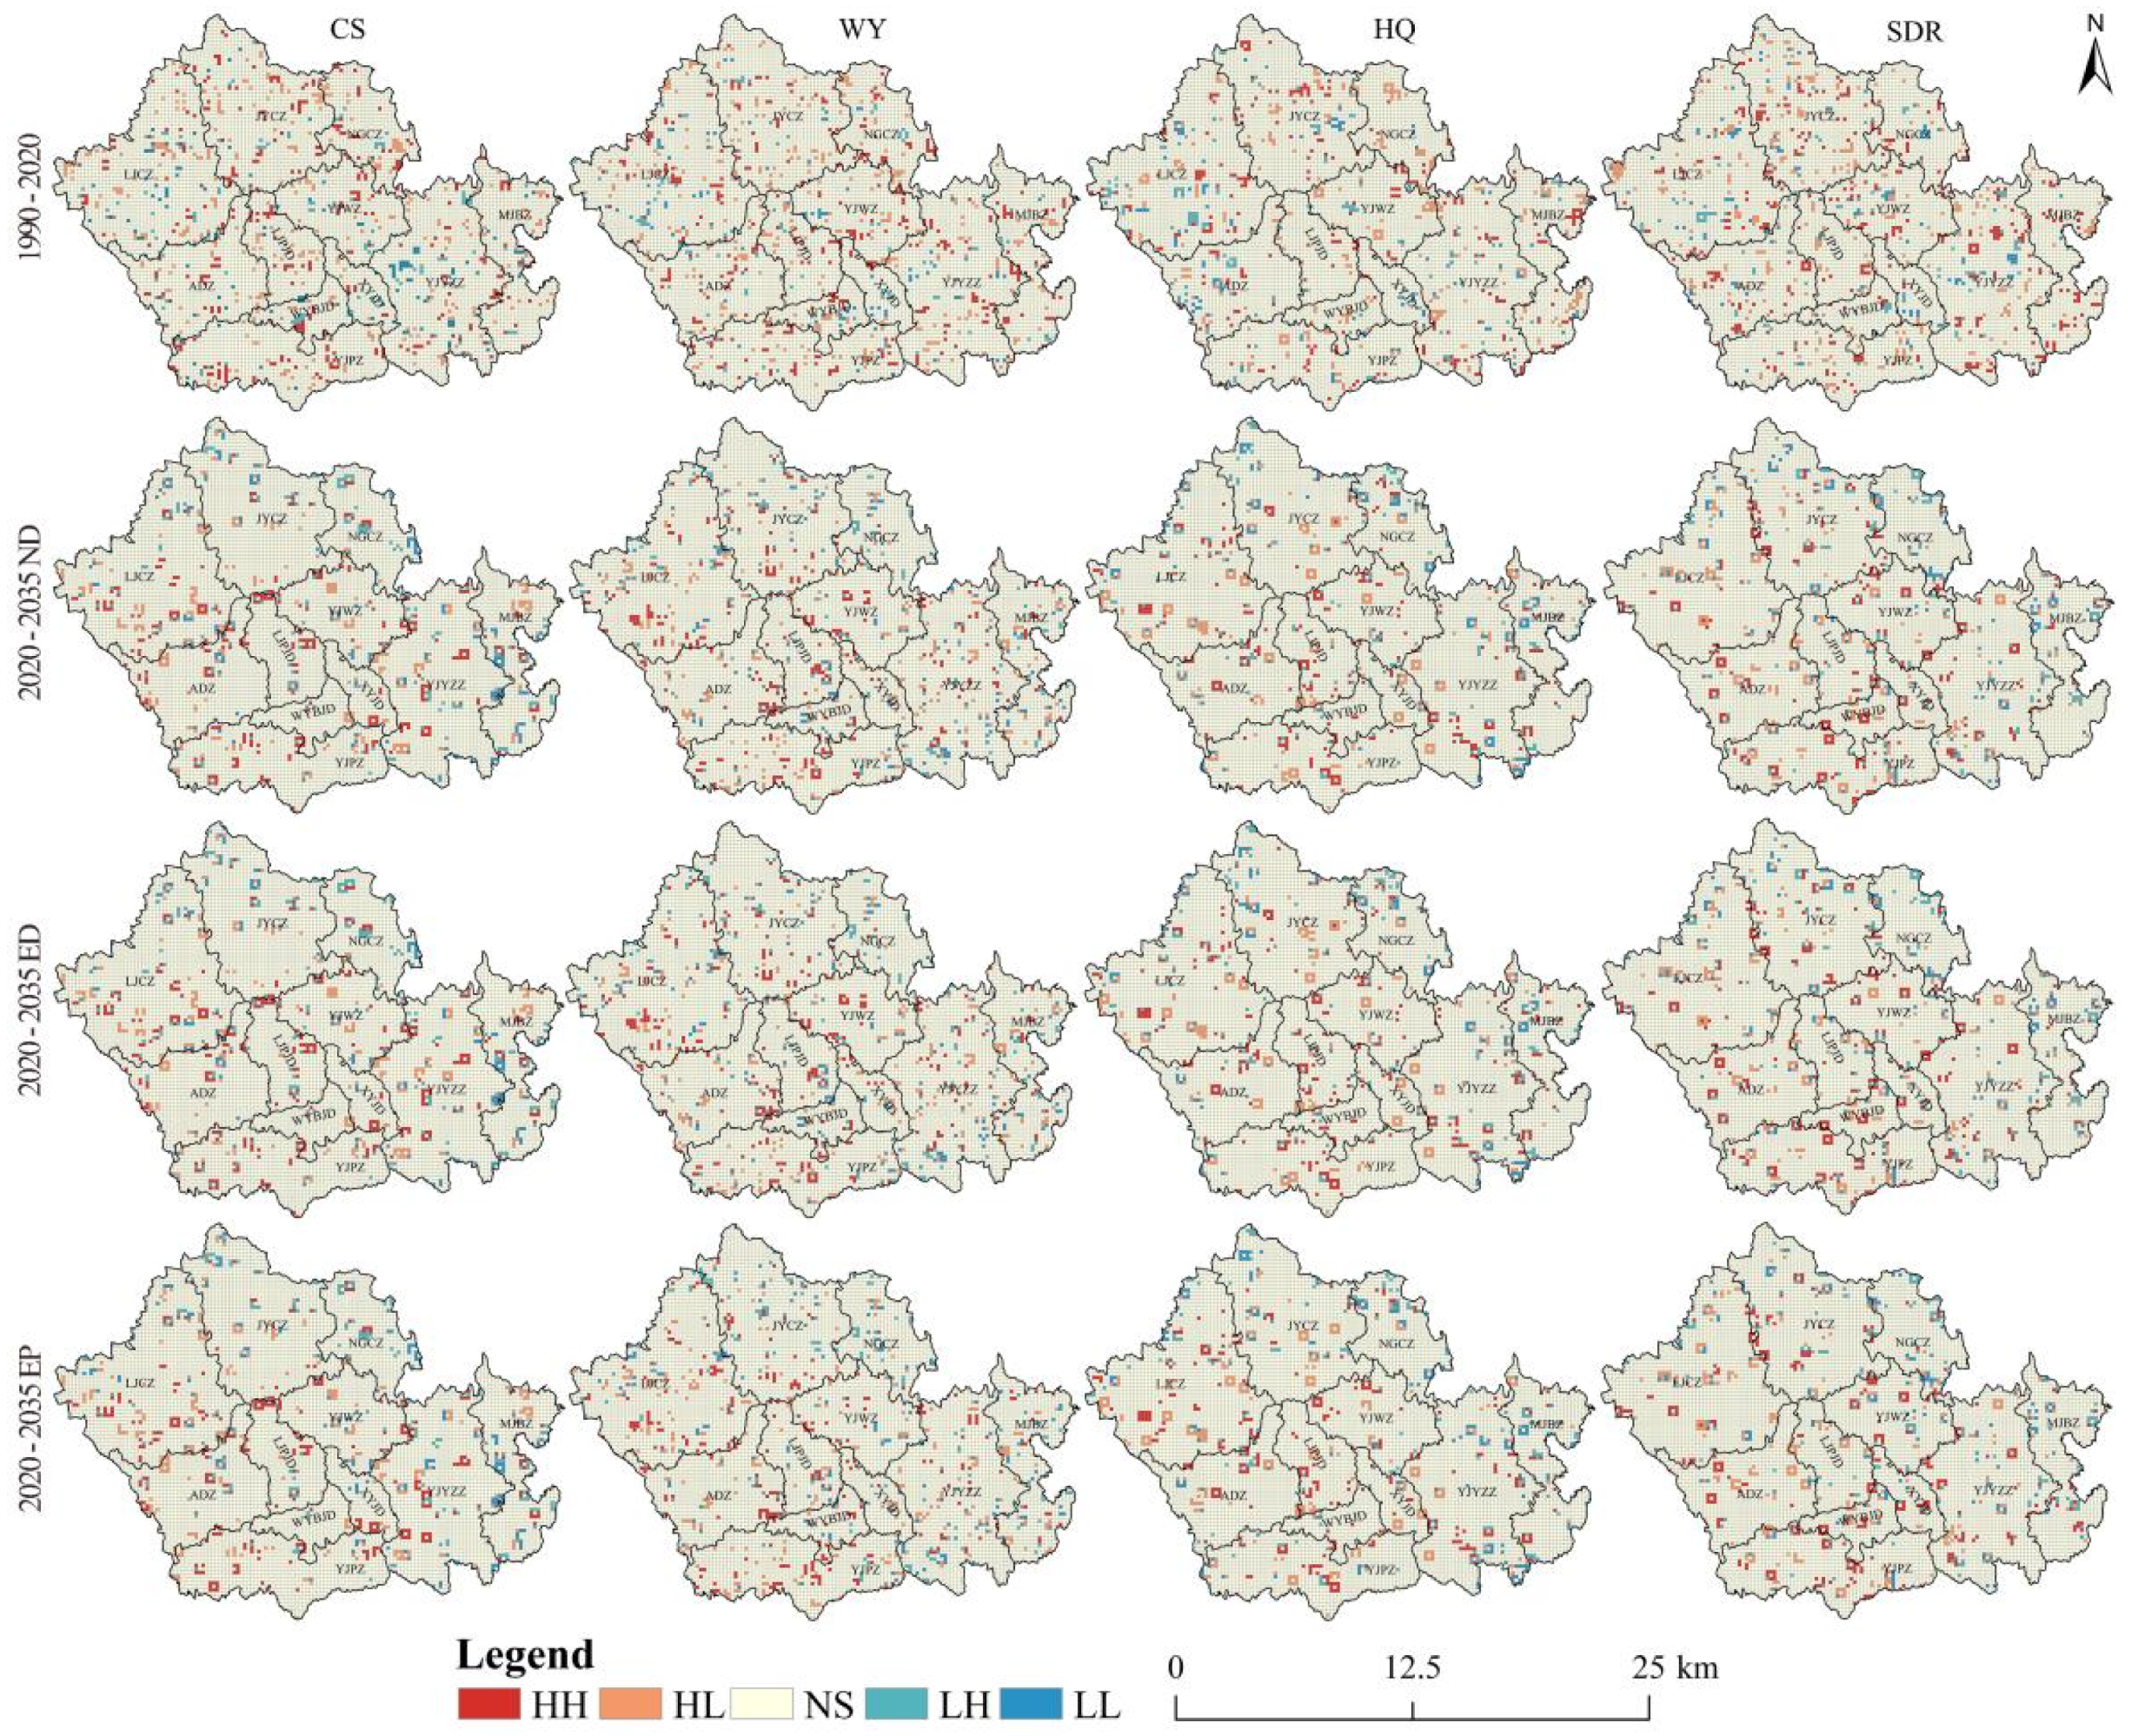
4.5. Spatial Heterogeneity of Ecosystem Services in Relation to Land Use Intensity

During the period from 1990 to 2020, the spatial clustering distribution of land use intensity and four ecosystem service functions exhibited significant spatial heterogeneity. Under three future development scenarios, the spatial clustering distribution of land use intensity and these four ecosystem service functions closely aligned with the patterns observed from 1990 to 2020.
Specifically, the relationship between land use intensity and carbon storage during the 1990–2020 period demonstrated a non-significant distribution characteristic (proportion: 89.86%). Negative impacts were predominantly concentrated in the western and southeastern regions, while positive influences were observed in the central and southern areas (Figure 7). Notably, high-high (HH) (proportion: 3.70%) and high-low (HL) (proportion: 3.87%) clusters were primarily located in the YJPZ and JYCZ regions, with sparse distribution in MJBZ. Low-high (LH) (proportion: 1.39%) exhibited sporadic aggregation in areas such as LJCZ, JYCZ, and NGCZ, while low-low (LL) (proportion: 1.17%) was concentrated in the central part of LJCZ and the southwestern area of YJYZZ. By the 2020–2035 period, the spatial clustering characteristics under the three scenarios remained largely consistent, displaying a reduction in HH and HL regions, while LH and LL regions increased. In the 2020-EP scenario, the positive impacts in the southeastern area were particularly pronounced, whereas the 2020-CB scenario showed enhanced positive influences in the central and western regions.
During the period from 1990 to 2020, the relationship between land use intensity and water yield was characterized by a predominantly non-significant distribution (proportion: 90.10%), with negative impacts concentrated in the southeastern and western regions, while positive influences were more dispersed (Figure 7). Specifically, high-high (HH) (proportion: 3.91%) and high-low (HL) (proportion: 3.87%) clusters were primarily identified in the LJPZ, WYBJD, and XYJD areas, whereas low-low (LL) (proportion: 1.01%) was predominantly concentrated in the central regions of YJWZ and WYBJD. By the period of 2020 to 2035, all three development scenarios revealed a reduction in the aggregation of HH and HL, alongside an increase in the clustering of low-high (LH) and LL categories. In the 2020-ND and 2020-CB scenarios, the HH clusters were mainly distributed in the southern areas of LJCZ, southern JYCZ, and the eastern region of ADZ, while HL and LH exhibited a scattered distribution. Notably, in the 2020-EP scenario, the decrease in HH was particularly pronounced (proportion: 0.92%), with weaker positive impacts observed in the central region and significant negative influences in the northern areas.
During the period from 1990 to 2020, the relationship between land use intensity (LUI) and habitat quality primarily exhibited an insignificant distribution pattern (proportion: 90.42%) (Figure 7). In this timeframe, negative impacts were concentrated in the western and southeastern regions, whereas positive effects were relatively sporadic. Specifically, the HH type (proportion: 3.13%) was predominantly located in the eastern part of LJCZ, the northern section of JYCZ, and the northeastern area of YJWZ. The LH type (proportion: 1.55%) and LL type (proportion: 1.20%) were dispersed across other townships, with the smallest area of LH observed in the XYJD region and a similarly limited extent of LL in the NGCZ and LJPJZ areas. In the scenarios projected for 2020–2035, both HH and HL clustering areas exhibited a decrease, while the clustering areas of LH and LL showed an increase, particularly highlighting a more concentrated aggregation of the HH type. This shift is characterized by a reduction in the northern and eastern parts of the study area and an increase in the southern regions. The spatial clustering distribution characteristics across the three scenarios were fundamentally consistent. Notably, in the 2020-EP scenario, the clustering of the HH type demonstrated a significant enhancement (proportion: 3.10%), with marked positive impacts in the central and southern regions. Conversely, in the 2020-ND scenario, the clustering of the LL type (proportion: 1.56%) was more pronounced, accompanied by relatively strong negative impacts in the northern area.
During the period from 1990 to 2020, the relationship between land use intensity (LUI) and soil conservation exhibited a predominantly insignificant distribution (proportion: 89.97%) (Figure 7). Negative impacts were primarily concentrated in the central and southeastern regions, while positive effects were dispersed sporadically. Specifically, high-high (HH) types (proportion: 3.90%) were mainly found in the ADZ, YJYZZ, LJCZ, and JYCZ regions. Low-high (LH) types (proportion: 3.79%) and low-low (LL) types (proportion: 1.10%) also displayed a scattered distribution, whereas high-low (HL) types were characterized by patchy clustering in the western part of LJCZ. LL types (proportion: 1.23%) were primarily concentrated in YJYZZ, with less pronounced distributions in other townships. In the three development scenarios for 2020–2035, both HL and LH clustering areas significantly decreased, while HH types exhibited a gradual aggregation from north to south, maintaining similar spatial clustering characteristics across all three scenarios. Notably, in the 2020-EP scenario, the clustering distribution of HH types in JYCZ was significantly higher than that in the 2020-ND scenario, whereas their performance in NGCZ was relatively weaker.

5. Discussion

5.1. Mechanisms by Which Changes in Land Use Intensity Influence Ecosystem Services

Changes in land use intensity during the process of land use transformation are often accompanied by increased ecological pressures, which, in turn, significantly influence ecosystem service functions [44]. This study, integrating the PLUS-InVEST model and utilizing the bivariate Moran’s I index, explores the response dynamics between land use intensity and four ecosystem service functions across three developmental scenarios from 1990 to 2035.
The results indicate that the implementation of the Grain-to-Green Program in Zichang City since 1999 has resulted in extensive cropland conversion to forestland and grassland, exerting a direct influence on ecosystem structure and functionality [45]. However, the fragile ecological environment and severe soil erosion in Zichang City have contributed to ecosystem instability [46]. Despite these challenges, the significant reduction in cropland has led to a sustained decline in land use intensity, particularly in central areas, with more fragmented changes in peripheral regions. Dynamic fluctuations in high-intensity land use have adversely affected ecosystem services, including water yield, soil retention, and biodiversity. This finding aligns with patterns of intensified soil erosion and ecosystem degradation due to overexploitation in the Loess Plateau [47].
Under the three future development scenarios, overall land use changes from 2020 to 2035 remain limited, reflecting the dominance of cropland, forestland, and grassland in the study area. Variations are primarily localized at the intersections of WYBJD, XYJD, YJYZZ, LJPJD, and YJWZ, with minor fluctuations observed. Small-scale transitions among cropland, forestland, and grassland, combined with climatic, topographical, and soil constraints characteristic of semi-arid regions, have contributed to the slow pace of ecosystem restoration. As a result, anticipated improvements in ecosystem services are expected to be modest, a conclusion consistent with the region’s historical data.
Land use intensity modifies a range of ecological processes, including the structure and composition of ecosystems, thereby influencing ecosystem service functions. As socioeconomic development progresses, the interplay between natural resources and human well-being becomes increasingly complex [48]. Rising land use intensity exacerbates trade-offs among ecosystem services, and exceeding critical intensity thresholds results in a decline in service capacity [49]. The spatial autocorrelation analysis reveals significant spatial dependencies between land use intensity and ecosystem services, with hot spots and cold spots widely distributed and exhibiting dynamic clustering patterns. In the hilly regions of the Loess Plateau, the dual pressures of climate change and land use transformation demonstrate that unsustainable agricultural practices not only amplify land use intensity but also diminish ecosystem service capacity. These observations align with the declining land use intensity trend associated with cropland reduction [50]. The implementation of large-scale ecological programs has contributed to a decrease in land use intensity. Under future development scenarios, high-value ecosystem service areas are projected to expand, particularly at the intersections of WYBJD, XYJD, YJYZZ, and YJWZ, mitigating the negative impacts of land use intensity on ecosystem services and progressively enhancing ecological conditions. These findings corroborate studies emphasizing the role of adjusted agricultural land use intensity in improving water yield functions [51].
In conclusion, the remarkable restoration of ecosystem services following the implementation of the Grain-to-Green Program in Zichang City highlights the critical importance of regional governance policies in ecosystem management. Current land use management strategies primarily focus on changes in land use types, with insufficient attention given to the role of land use intensity in ecosystem restoration and regulation. This study underscores the dynamic impacts of land use intensity on multiple ecosystem service functions before and after the implementation of ecological programs and evaluates these dynamics under future policy scenarios. Future research should prioritize localized analyses of land use intensity changes, particularly their critical role in ecological restoration processes.

5.2. Policy Implications

The hilly and ravine region of the Loess Plateau represents one of China’s most ecologically vulnerable areas, profoundly affected by soil erosion and experiencing long-term impacts on its ecosystem service functions due to land use intensity [52]. Zichang City, as a quintessential representative of this region, has witnessed a gradual degradation of ecosystem services concomitant with increasing land development and utilization intensity. Historically, the expansion of urban areas and high-intensity land use activities, such as mining, have significantly exacerbated soil erosion, resulting in a pronounced decline in ecosystem services associated with water conservation, soil retention, and biodiversity. Under the pressures of slope farmland development and overgrazing, soil erosion has intensified, leading to severe land degradation and a continual deterioration of the ecological environment within the region.
Since 1999, the implementation of ecological restoration policies—including the conversion of farmland to forest and grassland, as well as the protection of forested mountains—has facilitated substantial improvements in Zichang City’s ecological environment. Nevertheless, in recent years, the Chinese government has introduced the “Three Red Lines” for territorial spatial planning: ecological protection red lines, permanent basic farmland red lines, and urban development boundaries. These demarcations serve as non-negotiable limits for adjusting economic structures, planning industrial development, and promoting urbanization, aiming to enforce stringent environmental protection, farmland preservation, and land conservation measures, thereby establishing a robust foundation for sustainable development. This paradigm shift reflects a gradual transition away from a reliance solely on measures such as the conversion of farmland to forest to bolster ecosystem services. When looking ahead, it is imperative to investigate strategies for optimizing land use structure within the framework of spatial planning, harmonizing human-environment interactions, and achieving a dynamic equilibrium in land use to effectively enhance the benefits of ecosystem services.
(1)
Zoning classification management and land use optimization. In ecologically sensitive areas and regions with high risks of soil erosion, it is essential to optimize land use structures by enhancing land planning and usage controls, as well as ensuring a rational allocation of forest and grassland proportions. Strict limitations should be imposed on the non-agricultural and non-grain conversion of arable land while promoting the intensive use of urban construction land to ensure the sustainability of land use [53].
(2)
Strengthening the enforcement of ecological protection red lines. Based on the “Three Red Lines” policy in territorial spatial planning, it is vital to establish the priority of ecological protection red lines in land management, ensuring the reasonable control of land use intensity. In ecologically vulnerable areas and key ecosystem service zones, measures such as stringent development controls and ecological restoration should be implemented to enhance regional ecological resilience [54].
(3)
Promoting ecological compensation mechanisms. It is important to reinforce ecological compensation mechanisms, incentivizing farmers and land users to participate in ecological protection through fiscal subsidies and ecological compensation measures, thereby ensuring the long-term benefits of ecological restoration [55].
(4)
Advancing sustainable agriculture and low-intensity development models. Encouraging the adoption of low-intensity land use practices, such as conservation tillage and precision agriculture, can help achieve a balance between agricultural production and ecological protection. Supporting the development of ecological agriculture and small-scale ecotourism can provide alternative economic benefits to local communities, reducing reliance on land resources [56].
(5)
Enhancing monitoring and early warning of land use intensity. Establishing a dynamic monitoring system that utilizes remote sensing and geographic information systems (GIS) to periodically assess the impacts of changes in land use intensity on ecosystem services is crucial. Early warning information should be issued for high-risk areas, providing timely evidence for policy adjustments.
(6)
Implementing territorial spatial planning tailored to local conditions. Considering the natural characteristics and socioeconomic conditions of the hilly and ravine region of the Loess Plateau, land use policies that align with local realities should be developed. This approach aims to maintain regional economic development while ensuring the sustainable provision of ecosystem services [54].

5.3. Limitations and Future Perspectives

This study is not without its limitations. Firstly, the temporal and spatial dynamics of four ecosystem services in Zichang City were evaluated using the InVEST model coupled with spatial exploratory analysis methods. Due to challenges in data acquisition, most model parameters were adapted from previous studies conducted in similar regions rather than derived from site-specific measurements. This reliance may introduce a degree of uncertainty into the assessment results, though the overall trends are unlikely to be significantly affected. Secondly, although the United Nations identifies a wide array of ecosystem services, the four key services selected in this study may not comprehensively reflect the ecological conditions of the study area. Future research should prioritize field surveys to obtain region-specific model parameters, thereby enhancing the accuracy of the evaluation. Moreover, expanding the scope of ecosystem service assessments could provide a more holistic understanding of ecological functions.
Furthermore, this study predominantly investigates the spatiotemporal disturbances of ecosystem services resulting from land use intensity changes without fully accounting for other contributing factors. Variations in land use intensity are inherently driven by the interplay between natural and socioeconomic forces. As such, future spatial relationship models should integrate geographic and socioeconomic variables to deliver a more robust and comprehensive framework, thus offering scientifically sound guidance for territorial spatial planning.

6. Conclusions

Between 1990 and 2020, Zichang City exhibited a consistent downward trend in land use intensity, with a distinct pattern characterized by higher intensity in central regions and lower intensity in the periphery. The distribution of varying intensity levels demonstrated notable spatial clustering throughout different phases of this period. Simultaneously, ecosystem services—including carbon storage, water yield, habitat quality, and soil retention—displayed clear spatial differentiation. Regions with low carbon storage and reduced water yield were relatively concentrated, whereas areas characterized by high carbon storage and elevated water yield were comparatively rare.
By 2035, under three potential scenarios—natural development, ecological protection, and economic growth—the spatial distribution characteristics of ecosystem service functions are expected to maintain a high degree of consistency with those observed in 2020. Specifically, regions with high carbon storage and high water yield are projected to further consolidate, while the spatial distribution of habitat quality and soil retention services may be influenced by fluctuations in land use intensity. Furthermore, during this period, the spatial clustering of land use intensity in relation to the four ecosystem service functions exhibited significant spatial heterogeneity. Across the three anticipated development scenarios, the spatial clustering of land use intensity aligns closely with the distributions recorded from 1990 to 2020. Consequently, it is imperative that future development planning emphasizes the prudent regulation of land use intensity to foster the protection and restoration of ecosystem services, thereby facilitating sustainable regional development.

Author Contributions

Conceptualization, Z.Z. and S.S.; Methodology, Z.Z. and Y.L.; Software, Z.Z., H.P. and S.S.; Validation, Z.Z., H.P. and Y.L.; Formal analysis, Z.Z. and Y.L.; Investigation, S.S. and Y.L.; Resources, Z.Z. and S.S.; Data curation, H.P.; Writing original draft preparation, Z.Z. and S.S.; Writing review and editing, S.S. and Y.L.; Visualization, Z.Z. and H.P.; Supervision, Y.L.; Project administration, Y.L.; Funding acquisition, Y.L. and Z.Z. All authors have read and agreed to the published version of the manuscript.

Funding

This research was supported by the National Natural Science Foundation of China (Grant No. 42201289) and the Open Collaboration Fund of State Key Laboratory of Black Soils Conservation and Utilization (Grant No. 2023HTDGZ-KF-09).

Data Availability Statement

The majority of the datasets used in this study are publicly available and can be accessed through public repositories. All used data repositories are cited either in the main text. Land use data were derived from the Remote Sensing Image Database maintained by the Resource and Environment Science Data Center of the Chinese Academy of Sciences (http://www.resdc.cn, accessed on 1 June 2024), with a spatial resolution of 30 m. The digital elevation model (DEM) utilized in this study was the ASTER Global Digital Elevation Model (ASTER GDEM), supplied by the Geospatial Data Cloud (http://www.gscloud.cn/#page1/1, accessed on 1 June 2024), also with a resolution of 30 m. Soil data were acquired from the World Soil Database (http://westdc.westgis.ac.cn/data/611f7d50-b419-4d14-b4dd-4a944b141175, accessed on 1 June 2024), which includes characteristics such as sand, silt, and clay fractions, as well as organic carbon content, with a resolution of 1 km. Furthermore, meteorological data, encompassing precipitation and potential evapotranspiration, were obtained from the Resource and Environment Science Data Center of the Chinese Academy of Sciences (http://www.resdc.cn, accessed on 1 June 2024).

Conflicts of Interest

The authors declare no conflict of interest.

References

  1. Jones, H.P.; Jones, P.C.; Barbier, E.B.; Blackburn, R.C.; Benayas, J.M.R.; Holl, K.D.; McCrackin, M.; Meli, P.; Montoya, D.; Mateos, D.M. Restoration and repair of Earth’s damaged ecosystems. Proc. R. Soc. B-Biol. Sci. 2018, 285, 20172577. [Google Scholar] [CrossRef] [PubMed]
  2. United Nations, Department of Economic and Social Affairs. Available online: https://www.un.org/zh/node/21032 (accessed on 1 August 2024).
  3. Zamboni, N.S.; Filho, E.M.N.; Carvalho, A.R. Unfolding differences in the distribution of coastal marine ecosystem services values among developed and developing countries. Ecol. Econ. 2021, 189, 107151. [Google Scholar] [CrossRef]
  4. Li, F.; Altermatt, F.; Yang, J.; An, S.; Li, A.; Zhang, X. Human activities’ fingerprint on multitrophic biodiversity and ecosystem functions across a major river catchment in China. Glob. Change Biol. 2020, 26, 6867–6879. [Google Scholar] [CrossRef] [PubMed]
  5. Wang, Q.; Bai, X. Spatiotemporal characteristics and driving mechanisms of land-use transitions and landscape patterns in response to ecological restoration projects: A case study of mountainous areas in Guizhou, Southwest China. Ecol. Inform. 2024, 82, 102748. [Google Scholar] [CrossRef]
  6. Hasan, S.S.; Zhen, L.; Miah, M.G.; Ahamed, T.; Samie, A. Impact of land use change on ecosystem services: A review. Environ. Dev. 2020, 34, 100527. [Google Scholar] [CrossRef]
  7. Stefanidis, S.; Proutsos, N.; Alexandridis, V.; Mallinis, G. Ecosystem Services Supply from Peri-Urban Watersheds in Greece: Soil Conservation and Water Retention. Land 2024, 13, 765. [Google Scholar] [CrossRef]
  8. Millennium Ecosystem Assessment. Ecosystems and Human Well-Being: Synthesis; Island Press: Washington, DC, USA, 2005. [Google Scholar]
  9. Foley, J.A.; DeFries, R.; Asner, G.P.; Barford, C.; Bonan, G.; Carpenter, S.R.; Chapin, F.S.; Coe, M.T.; Daily, G.C.; Gibbs, H.K.; et al. Global Consequences of Land Use. Science 2005, 309, 570–574. [Google Scholar] [CrossRef]
  10. Felipe-Lucia, M.R.; Soliveres, S.; Penone, C.; Fischer, M.; Ammer, C.; Boch, S.; Boeddinghaus, R.S.; Bonkowski, M.; Buscot, F.; Fiore-Donno, A.M.; et al. Land-use intensity alters networks between biodiversity, ecosystem functions, and services. Proc. Natl. Acad. Sci. USA 2020, 117, 28140–28149. [Google Scholar] [CrossRef]
  11. Chen, B.; Jing, X.; Liu, S.; Jiang, J.; Wang, Y. Intermediate human activities maximize dryland ecosystem services in the long-term land-use change: Evidence from the Sangong River watershed, northwest China. J. Environ. Manag. 2022, 319, 115708. [Google Scholar] [CrossRef]
  12. Kremen, C.; Miles, A. Ecosystem Services in Biologically Diversified versus Conventional Farming Systems: Benefits, Externalities, and Trade-Offs. Ecol. Soc. 2012, 17, 40. [Google Scholar] [CrossRef]
  13. Olaiya, A. Transforming Our World: The 2030 Agenda for Sustainable Development: International. Civ. Eng. = Siviele Ingenieurswese 2015, 24, 26–30. [Google Scholar]
  14. Degefu, M.A.; Argaw, M.; Feyisa, G.L.; Degefa, S. Dynamics of urban landscape nexus spatial dependence of ecosystem services in rapid agglomerate cities of Ethiopia. Sci. Total Environ. 2021, 798, 149192. [Google Scholar] [CrossRef] [PubMed]
  15. Le Noe, J.; Erb, K.-H.; Matej, S.; Magerl, A.; Bhan, M.; Gingrich, S. Socio-ecological drivers of long-term ecosystem carbon stock trend: An assessment with the LUCCA model of the French case. Anthropocene 2021, 33, 100275. [Google Scholar] [CrossRef]
  16. Dahan, K.S.; Kasei, R.A.; Husseini, R. Land use land cover (LULC) degradation intensity analysis of Guinea savannah and mosaic Forest savannah zones in Ghana. All Earth 2023, 35, 302–328. [Google Scholar] [CrossRef]
  17. Wang, Z.; Guo, M.; Zhang, D.; Chen, R.; Xi, C.; Yang, H. Coupling the Calibrated GlobalLand30 Data and Modified PLUS Model for Multi-Scenario Land Use Simulation and Landscape Ecological Risk Assessment. Remote Sens. 2023, 15, 5186. [Google Scholar] [CrossRef]
  18. Moindjie, I.-A.; Pinsard, C.; Accatino, F.; Chakir, R. Interactions between ecosystem services and land use in France: A spatial statistical analysis. Front. Environ. Sci. 2022, 10, 954655. [Google Scholar] [CrossRef]
  19. Shi, L.; Halik, U.; Mamat, Z.; Aishan, T.; Abliz, A.; Welp, M. Spatiotemporal investigation of the interactive coercing relationship between urbanization and ecosystem services in arid northwestern China. Land Degrad. Dev. 2021, 32, 4105–4120. [Google Scholar] [CrossRef]
  20. Ministry of Ecology and Environment of the People’s Republic of China. Available online: https://www.mee.gov.cn/xxgk2018/xxgk/xxgk15/202101/t20210115_817536_wh.html (accessed on 20 August 2024).
  21. Jorge-Garcia, D.; Estruch-Guitart, V.; Aragones-Beltran, P. How geographical factors and decision-makers’ perceptions influence the prioritization of ecosystem services: Analysis in the Spanish rice field areas in RAMSAR Mediterranean wetlands. Sci. Total Environ. 2023, 869, 161823. [Google Scholar] [CrossRef]
  22. Zhang, Z.; Liu, Y.; Sheng, S.; Liu, X.; Xue, Q. Evolving Urban Expansion Patterns and Multi-Scenario Simulation Analysis from a Composite Perspective of “Social–Economic–Ecological”: A Case Study of the Hilly and Gully Regions of Northern Loess Plateau in Shaanxi Province. Sustainability 2024, 16, 2753. [Google Scholar] [CrossRef]
  23. Zichang Municipal People’s Government. Available online: http://www.zichang.gov.cn/ (accessed on 20 August 2024).
  24. Resource and Environmental Science Data Platform. Available online: http://www.resdc.cn (accessed on 20 August 2024).
  25. Geospatial Data Cloud. Available online: https://www.gscloud.cn/sources/index?pid=1&rootid=1 (accessed on 20 August 2024).
  26. A Big Earth Data Platform for Three Poles. Available online: https://poles.tpdc.ac.cn/zh-hans/data/611f7d50-b419-4d14-b4dd-4a944b141175/ (accessed on 20 August 2024).
  27. Schmidt, H.; Rast, S.; Bao, J.; Cassim, A.; Fang, S.-W.; la Cuesta, D.J.-d.; Keil, P.; Kluft, L.; Kroll, C.; Lang, T.; et al. Effects of vertical grid spacing on the climate simulated in the ICON-Sapphire global storm-resolving model. Geosci. Model Dev. 2024, 17, 1563–1584. [Google Scholar] [CrossRef]
  28. Fahad, S.; Li, W.; Lashari, A.H.; Islam, A.; Khattak, L.H.; Rasool, U. Evaluation of land use and land cover Spatio-temporal change during rapid Urban sprawl from Lahore, Pakistan. Urban Clim. 2021, 39, 100931. [Google Scholar] [CrossRef]
  29. Feng, X.; Li, Y.; Wang, X.; Yang, J.; Yu, E.; Wang, S.; Wu, N.; Xiao, F. Impacts of land use transitions on ecosystem services: A research framework coupled with structure, function, and dynamics. Sci. Total Environ. 2023, 901, 166366. [Google Scholar] [CrossRef] [PubMed]
  30. Zhang, Y.; Zhao, X.; Gong, J.; Luo, F.; Pan, Y. Effectiveness and driving mechanism of ecological restoration efforts in China from 2009 to 2019. Sci. Total Environ. 2024, 901, 166366. [Google Scholar] [CrossRef]
  31. Martini, F.; Conroy, K.; King, E.; Farrell, C.A.; Kelly-Quinn, M.; Obst, C.; Buckley, Y.M.; Stout, J.C. A capacity index to connect ecosystem condition to ecosystem services accounts. Ecol. Indic. 2024, 167, 112731. [Google Scholar] [CrossRef]
  32. Jiang, C.; Zhang, H.; Zhang, Z. Spatially explicit assessment of ecosystem services in China’s Loess Plateau: Patterns, interactions, drivers, and implications. Glob. Planet. Change 2018, 161, 41–52. [Google Scholar] [CrossRef]
  33. Zhao, T.; Pan, J. Ecosystem service trade-offs and spatial non-stationary responses to influencing factors in the Loess hilly-gully region: Lanzhou City, China. Sci. Total Environ. 2022, 846, 157422. [Google Scholar] [CrossRef]
  34. Kohestani, N.; Rastgar, S.; Heydari, G.; Jouibary, S.S.; Amirnejad, H. Spatiotemporal modeling of the value of carbon sequestration under changing land use/land cover using InVEST model: A case study of Nour-rud Watershed, Northern Iran. Environ. Dev. Sustain. 2024, 26, 14477–14505. [Google Scholar] [CrossRef]
  35. Liu, X.; Liu, Y.S.; Wang, Y.; Liu, Z.J. Evaluating potential impacts of land use changes on water supply-demand under multiple development scenarios in dryland region. J. Hydrol. 2022, 610, 127811. [Google Scholar] [CrossRef]
  36. Aznarez, C.; Svenning, J.-C.; Taveira, G.; Baro, F.; Pascual, U. Wildness and habitat quality drive spatial patterns of urban biodiversity. Landsc. Urban Plan. 2022, 228, 104570. [Google Scholar] [CrossRef]
  37. Tamire, C.; Elias, E.; Argaw, M. Spatiotemporal dynamics of soil loss and sediment export in Upper Bilate River Catchment (UBRC), Central Rift Valley of Ethiopia. Heliyon 2022, 8, e11220. [Google Scholar] [CrossRef]
  38. Nasr, M.; Orwin, J.F. A geospatial approach to identifying and mapping areas of relative environmental pressure on ecosystem integrity. J. Environ. Manag. 2024, 370, 122445. [Google Scholar] [CrossRef] [PubMed]
  39. Mutale, B.; Qiang, F. Modeling future land use and land cover under different scenarios using patch-generating land use simulation model. A case study of Ndola district. Front. Environ. Sci. 2024, 12, 1362666. [Google Scholar] [CrossRef]
  40. Bacau, S.; Domingo, D.; Palka, G.; Pellissier, L.; Kienast, F. Integrating strategic planning intentions into land-change simulations: Designing and assessing scenarios for Bucharest. Sustain. Cities Soc. 2022, 76, 103446. [Google Scholar] [CrossRef]
  41. Peng, K.; Jiang, W.; Ling, Z.; Hou, P.; Deng, Y. Evaluating the potential impacts of land use changes on ecosystem service value under multiple scenarios in support of SDG reporting: A case study of the Wuhan urban agglomeration. J. Clean. Prod. 2021, 307, 127321. [Google Scholar] [CrossRef]
  42. Tang, H.; Halike, A.; Yao, K.; Wei, Q.; Yao, L.; Tuheti, B.; Luo, J.; Duan, Y. Ecosystem service valuation and multi-scenario simulation in the Ebinur Lake Basin using a coupled GMOP-PLUS model. Sci. Rep. 2024, 14, 5071. [Google Scholar] [CrossRef]
  43. Ahmadi-Mirghaed, F.; Rahmani, M.; Molla-Aghajanzadeh, S. Quantification of water yield concerning land use and climate scenarios in the Tajan watershed, North of Iran. Int. J. Environ. Sci. Technol. 2024. [Google Scholar] [CrossRef]
  44. Borrelli, P.; Robinson, D.A.; Fleischer, L.R.; Lugato, E.; Ballabio, C.; Alewell, C.; Meusburger, K.; Modugno, S.; Schütt, B.; Ferro, V. An assessment of the global impact of 21st century land use change on soil erosion. Nat. Commun. 2017, 8, 2013. [Google Scholar] [CrossRef]
  45. Chen, W.; Zeng, J.; Li, N. Change in land-use structure due to urbanisation in China. J. Clean. Prod. 2021, 321, 128986. [Google Scholar] [CrossRef]
  46. Oliver, T.H.; Isaac, N.J.B.; August, T.A.; Woodcock, B.A.; Roy, D.B.; Bullock, J.M. Declining resilience of ecosystem functions under biodiversity loss. Nat. Commun. 2015, 6, 10122. [Google Scholar] [CrossRef]
  47. Bai, Y.; Liu, Y.; Li, Y.; Wang, Y.; Yuan, X. Land consolidation and eco-environmental sustainability in Loess Plateau: A study of Baota district, Shaanxi province, China. J. Geogr. Sci. 2022, 32, 1724–1744. [Google Scholar] [CrossRef]
  48. Schirpke, U.; Tscholl, S.; Tasser, E. Spatio-temporal changes in ecosystem service values: Effects of land-use changes from past to future (1860–2100). J. Environ. Manag. 2020, 272, 111068. [Google Scholar] [CrossRef] [PubMed]
  49. Bennett, E.M.; Peterson, G.D.; Gordon, L.J. Understanding relationships among multiple ecosystem services. Ecol. Lett. 2009, 12, 1394–1404. [Google Scholar] [CrossRef] [PubMed]
  50. Xu, Y.; Tang, H.; Wang, B.; Chen, J. Effects of land-use intensity on ecosystem services and human well-being: A case study in Huailai County, China. Environ. Earth Sci. 2016, 75, 416. [Google Scholar] [CrossRef]
  51. Zheng, H.; Peng, J.; Qiu, S.; Xu, Z.; Zhou, F.; Xia, P.; Adalibieke, W. Distinguishing the impacts of land use change in intensity and type on ecosystem services trade-offs. J. Environ. Manag. 2022, 316, 115206. [Google Scholar] [CrossRef] [PubMed]
  52. Liu, Y.; Huang, X.; Liu, Y. Detection of long-term land use and ecosystem services dynamics in the Loess Hilly-Gully region based on artificial intelligence and multiple models. J. Clean. Prod. 2024, 447, 141560. [Google Scholar] [CrossRef]
  53. Rahman, M.M.; Szabo, G. Multi-objective urban land use optimization using spatial data: A systematic review. Sustain. Cities Soc. 2021, 74, 103214. [Google Scholar] [CrossRef]
  54. Liu, Y.; Zhou, Y. Territory spatial planning and national governance system in China. Land Use Policy 2021, 102, 105288. [Google Scholar] [CrossRef]
  55. Li, Y.; Zhang, X.; Cao, Z.; Liu, Z.; Lu, Z.; Liu, Y. Towards the progress of ecological restoration and economic development in China’s Loess Plateau and strategy for more sustainable development. Sci. Total Environ. 2021, 756, 143676. [Google Scholar]
  56. Qu, L.; Liu, Y.; Li, Y.; Wang, J.; Yang, F.; Wang, Y. Sustainable use of gully agricultural land and water resources for sustainable development goals: A case study in the Loess Plat. Land Degrad. Dev. 2023, 34, 4935–4949. [Google Scholar] [CrossRef]
Figure 1. Location of Zichang City, Shaanxi Province, China. Note: LJCZ refers to Lijiacha Town, JYCZ to Jianyucha Town, NGCZ to Nangoucha Town, ADZ to Anding Town, LJP to Luanjiaping Town, YJW to Yujiawan Town, YJP to Yujiaoping Town, WYB to Wayao Fortress Town, XYJD to Xiuyan Subdistrict, YJYZZ to Yangjiayuanze Town, and MJBZ to Majiabian Town.
Land 13 02039 g001
Figure 2. Technical route.
Land 13 02039 g002
Figure 3. Spatial distribution of land use intensity in Zichang City from 1990 to 2020.
Land 13 02039 g003
Figure 4. Spatial distribution and changes of ecosystem services in Zichang City from 1990 to 2020.
Land 13 02039 g004
Figure 5. Spatial distribution of land use intensity in Zichang City under different scenarios.
Land 13 02039 g005
Figure 6. Spatial distribution and changes of ecosystem services in Zichang City (2020–2035) under different scenarios.
Land 13 02039 g006
Figure 7. Local spatial autocorrelation distribution of land use intensity (LUI) and ecosystem services in Zichang City from 1990 to 2035.
Land 13 02039 g007
Table 1. Data category, type, source, and resolution.
CategoryData TypeSourceResolution
Land use and coverRemote sensing imageResource Science Data Center, Chinese Academy of Sciences [24]30 m
Terrain dataDEMASTER Global Digital Elevation Model (ASTER GDEM) [25]30 m
Soil dataSoil attribute data World Soil Database [26]1 km
Meteorological dataPrecipitation and potential evapotranspirationResource Science Data Center, Chinese Academy of Sciences [24]
Disclaimer/Publisher’s Note: The statements, opinions and data contained in all publications are solely those of the individual author(s) and contributor(s) and not of MDPI and/or the editor(s). MDPI and/or the editor(s) disclaim responsibility for any injury to people or property resulting from any ideas, methods, instructions or products referred to in the content.

