Article

Integrating Ecosystem Service Values into Urban Planning for Sustainable Development

1
The Center for Modern Chinese City Studies, Institute of Urban Development, East China Normal University, Shanghai 200062, China
2
State Key Laboratory of Urban and Regional Ecology, Research Center for Eco-Environment Sciences, Chinese Academy of Sciences, Shuangqing Rd. 18, Beijing 100085, China
3
The Digital Engineering Technology Innovation Center for Ecological Governance of Land and Space Under the Ministry of Natural Resources, Shanghai Jiao Tong University, Shanghai 200240, China
4
College of Landscape Architecture and Art, Fujian Agriculture and Forestry University, Fuzhou 350002, China
*
Author to whom correspondence should be addressed.
Land 2024, 13(12), 1985; https://doi.org/10.3390/land13121985
Submission received: 19 October 2024 / Revised: 14 November 2024 / Accepted: 20 November 2024 / Published: 21 November 2024

Abstract

:
Urbanization, despite driving regional economic growth, has led to significant disparities in development levels among cities. Many studies have made valuable suggestions for ecological conservation in economically underdeveloped regions. However, for medium-level cities with large economic development needs, the question of how to strike a balance between development and conservation in land development patterns is a critical issue to be addressed. By integrating ecosystem services assessment models and land use prediction models, we proposed a framework for guiding future land-use strategies based on ecosystem service values, using Jiaxing City as a case study. Firstly, we assessed and mapped the current status of ecosystem services value. Then, we simulated the land use distribution pattern and ecosystem services value under three development strategies: inertial development, cropland protection, and ecological development. Eventually, we determined the optimal urban land development pattern. The results showed that the total ecosystem service value for Jiaxing is CNY 124.82 billion, with climate regulation, water conservation, and flood mitigation contributing the most. The ecological development strategy yields the highest service value, with a 0.81% increase compared to the current situation, while the cropland protection and inertial development strategies result in decreases of 0.73% and 10.93%, respectively. Furthermore, the ecological strategy expands high-value service areas, concentrated in the northern river network and southern hilly regions. These findings offer valuable insights for urban planners and policymakers in formulating sustainable strategies and integrating ecosystem service values into economic policies to promote urban development.

1. Introduction

Since the Industrial Revolution, the process of global urbanization has accelerated, with both urban populations and urban construction land growing continuously [1,2,3,4]. The latest “World Cities Report 2022” released by the United Nations Habitat shows that in 2021, urban populations accounted for 56% of the world’s population, and it is expected that this proportion will reach 68% by 2050 [5]. China is one of the countries with the fastest urbanization in the world. Since the reform and opening-up began, the urban population in China has grown from less than 30% of the total population to nearly 70%. In terms of urban spatial development patterns, with the continuous expansion of construction land in various cities, highly developed urban agglomerations with advanced social and economic statuses have gradually formed [6]. Although the development of cities and the formation of urban agglomerations have greatly improved human living conditions and material well-being [7,8,9], encroachment on ecological space has also caused increasingly serious ecological and environmental problems and resource shortages [10], such as urban flooding [11,12], extremely high temperatures [13,14], water scarcity [15], and air pollution [16]. From a long-term perspective, the trend of ecological environmental deterioration has a negative impact on regional economic development, threatening the health of residents and the safety of industrial production. Developing sustainable development strategies to improve ecosystem quality and enhance ecosystem benefits to human society is now widely recognized by researchers and government agencies as an effective pathway. It is worth noting that, even within highly developed urban agglomerations, there are regional differences in the level of socioeconomic development. Cities at medium and lower levels of development typically bear a higher ecological responsibility during the regional development process, which constrains their own economic development. Therefore, to balance the differences in regional development and strengthen the ecological benefits that ensure human well-being and social production, policymakers should consider formulating a sustainable land development strategy.
Ecosystem services refer to the direct and indirect benefits that ecosystems provide to humans, comprising four secondary indicators: material production, regulation services, support services, and cultural services [17,18,19,20]. Ecosystem services are among the most direct, systematic, and comprehensive indicators of ecological benefits. At present, the land development strategies of Chinese cities generally follow the city’s territorial spatial planning [21,22] and other supporting plans, focusing on the comprehensive consideration of factors such as population, resources, transportation, and public services. Ecological factors are also involved, but only at the level of the pattern, such as the city’s blue-green spatial planning [23] and the planning of greenways [24], and ecosystem services have not yet been included in the considerations. Meanwhile, current research on ecosystem services mainly focuses on model development [25,26], spatial service flow [27,28], and trade-offs/synergy [29,30]. The research results have been applied in the fields of ecological compensation [31] and ecological restoration [32]. Ecosystem services are applied less frequently in the field of land development strategy development. The valuation of ecosystem services not only effectively supports future land development strategies for cities but also links the economy with ecology through the monetization of ecosystem service assessments. This provides significant assistance for medium-developed cities to gain advantages in realizing the value of ecological products, such as ecological compensation and ecological product management and development.
Jiaxing is located in the highly developed Yangtze River Delta region of China, but its economic development is at a medium level compared to that of the surrounding cities, with significant development needs. According to the GDP data of Zhejiang Province in 2023, Jiaxing’s GDP and GDP per capita are in the middle level among all cities. With continued population growth, Jiaxing is not only facing urgent development needs but also has tremendous development opportunities as a city near Shanghai, Suzhou, and Hangzhou. However, although the city has flat terrain, a dense network of rivers, and convenient transportation, which provide a favorable natural base and traffic conditions for urban expansion, it faces considerable pressure to protect the cultivated land. The proportion of forest and grassland areas is extremely low, and the demands for food security and ecological safety seriously constrain the sustainable socioeconomic development of the city. There is an urgent need to explore land-use development strategies that coordinate local social, economic, and natural development.
This study takes Jiaxing City, Zhejiang Province, China, as a case study and integrates multi-source remote sensing data, monitoring data, ecological function parameters, socio-economic data, etc., to propose a methodological framework for guiding future land use development strategies based on the value of ecosystem services. Firstly, a complete database is built for ecosystem service assessment and land use simulation. Secondly, based on the land use data of 2005 and 2020, the Land Expansion Strategy Analysis Model (LEAS) built in the PLUS model is used to plot the historical growth probability of various types of land use. Then, on the basis of land growth probability data and 2020 land use data, different constraints and the Cellular Automaton Model based on Multi-class Random Patch Seeds (CARS) built into the PLUS model are integrated to simulate the land use distribution pattern under different development strategies. Finally, the Integrated Valuation of Ecosystem Services and Tradeoffs Platform (InVEST) [33,34,35] and the Intelligent Urban Ecosystem Management System (IUEMS) [36] are used to carry out the assessment and spatial mapping of ecosystem services under the current situation and different development strategies (Figure 1). The objectives of this study were (1) to assess the current status of ecosystem services in terms of physical quantity and monetary value; (2) to study the historical development patterns and driving mechanisms of various land use types across the city; (3) to simulate future land use distribution patterns under different development strategies and evaluate the ecosystem services value; and (4) to analyze the spatial variation characteristics of ecosystem service values under different development strategies and determine the optimal land development strategy.

2. Materials and Methods

2.1. Study Area

Jiaxing City is located in the northeast of Zhejiang Province, in the central part of the Hangzhou-Jiaxing-Huzhou Plain in the Yangtze River Delta. It is an important city in the Yangtze River Delta, a key city in the Shanghai Metropolitan Area, and a deputy central city in the Hangzhou Metropolitan Area. Jiaxing City is geographically positioned between 120°18′ and 121°16′ E, and 30°21′ and 31°02′ N. It is adjacent to Shanghai City to the east, Suzhou City in Jiangsu Province to the north, and Hangzhou and Huzhou Cities to the west, and faces Ningbo and Shaoxing Cities across the river to the south (Figure 2). The terrain of the city is low and flat, with an average elevation of just 3.7 m [37]. Many hills below 200 m in elevation are distributed along the northern shore of Hangzhou Bay [38]. The city’s water system is generally part of the Yangtze River system within the Taihu Lake basin, and the city is densely covered with rivers and lakes, characteristic of a plain river network area. The Beijing-Hangzhou Grand Canal serves as the main waterway, interconnecting with other rivers and canals, with a total length of 14,700 km [39]. Jiaxing is located on the southern edge of the northern subtropical zone and belongs to the East Asian Monsoon Zone. The city has an average annual temperature of 15.9 °C, an average annual precipitation of 1168.6 mm, and an average annual sunshine duration of 2017.0 h. Favorable hydrothermal conditions, flat terrain, and an intricate network of rivers, canals, and lakes have historically facilitated large-scale land reclamation and agricultural production. Cropland area accounts for nearly 60% of the city’s total area. Although regional food security has been ensured and croplands serve certain ecological functions, the continuous encroachment of urban construction land on farmland poses severe challenges to the city’s ecological and food security. However, with the continuous expansion of urban construction land encroaching on cropland, both the ecological and food security of the city face severe challenges.

2.2. Future Development Strategies Simulation

The Patch-generating Land Use Simulation Model (PLUS) V1.0 is a software developed by the China University of Geosciences (CUG) based on the C++ language to serve in the fields of land use/land cover change simulation, policymaking, mining of land use change patterns, and urban planning [40,41]. The software integrates two modules: the Land Expansion Strategy Analysis Model (LEAS) and Cellular Automaton Model based on Multi-class Random Patch Seeds (CARS). The LEAS model extracts the expansion components of various land use types between two stages of land use change and employs the random forest algorithm to mine the driving force factors, obtaining the contribution of these factors to land expansion and the probability of land type development. The CARS model, which combines random seed generation with a threshold-decreasing mechanism, simulates the formation of various land-use patches under different development strategies in both time and space based on user-input development probabilities for each land-use type, predefined areas for each land-use type, constraint conditions, and neighborhood factors. In this study, the land use data for 2005 and 2020 were used as the basis for calculating the neighborhood factor of each land use type. The specific calculation formula is as follows:
W i = C i C m i n C m a x C m i n
where W i is the neighborhood factor for category i land use (dimensionless). C i is the area of change for land use category i (km2). C m i n is the minimum value of the area for all land-use changes (km2). C m a x is the maximum value of the area for all land-use changes (km2).
This paper reviews previous studies and considers 11 socio-economic data indicators, including population, gross domestic product, nighttime light, proximity to railway station, proximity to railway, proximity to the trunk, proximity to highway, proximity to primary roads, proximity to secondary roads, proximity to tertiary roads, and proximity to government, as well as six climatic and environmental data indicators, including proximity to open water, Digital Elevation, Slope, Annual mean temperature, soil type, and annual precipitation, making a total of 17 indicators as potential driving factors for land use change [41,42,43,44]. In the accuracy validation phase, this study simulated the land use for the year 2020 based on 2005 land use data and compared it with the actual land use distribution pattern of 2020. The Kappa coefficient reached 0.89, the FoM coefficient reached 0.214, and the overall simulation accuracy was 0.96. This indicates that the PLUS model has high simulation accuracy and can be used to simulate land use conditions under different future development strategies for Jiaxing.
This study sets 2035 as the target year and presets three different land development strategies for Jiaxing City: Inertial Development Strategy (IDS), Cropland Protection Strategy (CPS), and Ecological Development Strategy (EDS). Under the IDS strategy, the land-use development pattern refers only to historical development patterns without any input of constraint conditions. It considers the actual change patterns of various land use types from 2005 to 2020. The predefined areas for each land-use type in the PLUS model were predicted by the Markov chain based on historical change patterns. The CPS strategy requires consideration of the protection and restoration of croplands. In this study, the PLUS model inputs the red line for the protection of permanent basic cropland as a constraint condition to restrict the conversion of cropland while strictly prohibiting the conversion of cropland to construction land, reducing the probability of cropland being converted to forest, grassland, and wetland, and increasing the probability of forest, grassland, and wetland conversion to cropland. The EDS strategy aims to restore ecological spaces such as forestland, grassland, and wetlands. This study inputs the ecological protection red line as a constraint condition in the PLUS model to limit land use conversion within it. Moreover, we refer to the “Jiaxing City Territorial Spatial Master Plan (2021–2035)” and the “Jiaxing City Territorial Spatial Ecological Restoration Special Plan (2021–2035)” to preset the areas for various types of land use in the PLUS model.

2.3. Ecosystem Services Evaluation and Valuation

This study comprehensively considers the natural ecological background of the study area and the actual ecological problems that it faces. Eight typical ecosystem services were assessed using quantitative methods based on the local parameters. The calculation methods were derived from published literature [19,45] and the technical specifications for accounting for national ecological product valuation (https://www.ndrc.gov.cn/xwdt/ztzl/jljqstcpjzsxjz/gzdt/202301/t20230120_1347277_ext.html) (accessed on 1 August 2024). Ecosystem services were calculated using the Intelligent Urban Ecosystem Management System (IUEMS) (https://www.iuems.com/eco/index.html) (accessed on 1 August 2024) and the InVEST 3.12 model (https://naturalcapitalproject.stanford.edu/software/invest) (accessed on 1 August 2024).
Ecosystems conserve water through their structure and processes by intercepting precipitation, enhancing soil infiltration, retaining soil moisture, replenishing groundwater, and regulating river flow, thereby increasing available water resources. The formula for water conservation (WC) is as follows:
Q w c = i = 1 i = n ( P i R i E T i ) × 0.001 × S g r i d
V w c = Q w c × ( P o c + P c c × D R )
where Q w c represents the physical quantity of water conservation service (m3/a); V w c represents the monetary value of water conservation service (CNY/a); P i represents precipitation in grid i (mm/a); R i represents runoff in grid i (mm/a); E T i represents evapotranspiration in grid i , including evaporation from water surfaces, soil, snow, and ice, and transpiration from plants (mm/a); i represents grid number, i = 1, 2, 3, …, n ; S g r i d represents the area of each grid (m2); P o c represents the annual operational cost per unit volume of the reservoir (CNY/(m3·year)); P c c represents the construction cost per unit volume of the reservoir (CNY/m3); D R represents the annual depreciation rate of the reservoir.
Flood mitigation (FM) refers to the role of ecosystems, through vegetation and water bodies, in regulating stormwater runoff, reducing flood peaks, and mitigating flood hazards. The formula is as follows:
Q s r r = i = 1 i = n ( P s i R s i ) × 0.001 × S g r i d
V s r r = C f m × ( P o c + P c c × D R )
where Q s r r represents physical quantity of flood mitigation services (m3/year); V s r r represents monetary value of flood mitigation services (CNY/year); P s i represents rainfall during storms in grid i (mm/year); R s i represents stormwater runoff in grid i (mm/year); i represents grid number, i = 1, 2, 3, …, n ; S g r i d represents the area of each grid (m2); P o c represents annual operational cost per unit volume of the reservoir (CNY/(m3·year)); P c c represents construction cost per unit volume of the reservoir (CNY/m3); D R represents annual depreciation rate of the reservoir.
Ecosystems sequester carbon by absorbing carbon dioxide through organic matter synthesis in organisms and dissolving it in water bodies, thereby reducing its atmospheric concentration. The formula for carbon sequestration (CS) is as follows:
Q c d s = Q V c d s + Q W c d s
Q V c d s = i = 1 i = n ( M C O 2 / M C × N E P i ) × 0.0001 × S g r i d
N E P i = α × N P P i
Q W c d s = S w e t × V w e t
V c d s = Q c d s × C C O 2
where Q c d s represents physical quantity of carbon sequestration service (t· C O 2 /a); V c d s represents monetary value of carbon sequestration services (CNY/year); Q V c d s represents physical quantity of carbon sequestration service by vegetation ecosystems (t· C O 2 /a); Q W c d s represents physical quantity of carbon sequestration service by wetland ecosystems (t· C O 2 /a); M C O 2 / M C represents conversion coefficient of C to C O 2 ; N E P i represents net ecosystem productivity in grid i (t· C /ha/a); α represents conversion coefficient between N E P and N P P ; N P P i represents net primary productivity in grid i (t· C /ha/a); S w e t represents area of wetland ecosystems (km2); V w e t represents fixed carbon dioxide rate of wetland ecosystems (t· C O 2 /km2/a); i represents grid number, i = 1, 2, 3, …, n ; S g r i d represents the area of each grid (m2); C C O 2 represents price of CO2 (CNY/t).
Ecosystems reduce sedimentation by protecting soil through their structure and processes, reducing rainwater erosion, and minimizing soil loss and sediment blocking in river channels. In this study, soil retention was calculated using a modified universal soil loss equation, and the sediment accumulation coefficient and soil bulk density were used to calculate the final amount of reduced sedimentation. Furthermore, nitrogen purification (NP) and phosphorus purification (PP) refer to the ecosystem’s ability to retain soil, thereby decreasing the transport of soil-borne nutrients, such as nitrogen and phosphorus, into downstream aquatic environments, including rivers, lakes, and reservoirs. The formulae for sedimentation reduction (SR), nitrogen purification (NP), and phosphorus purification (PP) are as follows:
Q s r = λ × Q s r / ρ
Q r s = i = 1 i = n R i × K i × L i × S i × 1 C i × 0.0001 × S g r i d
Q n p = i = 1 i = n R i × K i × L i × S i × 1 C i × β n i t r o . × 0.0001 × S g r i d
Q p p = i = 1 i = n R i × K i × L i × S i × 1 C i × β p u r i . × 0.0001 × S g r i d
V s r = Q s r × c s r
V n p = Q n p × c n p
V p p = Q p p × c p p
where Q s r represents physical quantity of sedimentation reduction service (m3/a); Q r s represents soil retention amount (t/a); V s r represents monetary value of sedimentation reduction service (CNY/year); Q n p represents physical quantity of nitrogen purification service (t/a); V n p represents monetary value of nitrogen purification service (CNY/year); Q p p represents physical quantity of phosphorus purification service (t/a); V p p represents monetary value of phosphorus purification service (CNY/year); λ represents sediment accumulation coefficient, dimensionless; ρ represents soil bulk density (t/m3); R i represents the rainfall erosivity factor in grid i, indicating the potential for rainfall-induced soil erosion, quantified by the long-term mean annual rainfall erosivity index (MJ·mm/(hm2·h·a)); K i represents the soil erodibility factor in grid i, which reflects the ease of soil particle disintegration and transport by water, this factor primarily depends on soil texture, organic matter content, soil structure, and permeability, typically expressed in terms of soil loss per unit of rainfall erosivity on a standard plot (t·hm2·h/(hm2·MJ·mm)); L i is the slope length factor in grid i, indicating the impact of slope length on soil erosion, dimensionless; S i is the slope steepness factor in grid i, reflecting the influence of slope gradient on soil erosion, dimensionless; C i is the vegetation cover factor in grid i, depicting the ecosystem’s impact on soil erosion, which varies with the type of ecosystem and the extent of vegetation cover, dimensionless; i represents grid number, i = 1, 2, 3, …, n ; S g r i d represents the area of each grid (m2); c s r represents sediment removal costs (CNY/t); c n p and c p p represent the removal cost of nitrogen and phosphorus pollutants, respectively (CNY/t).
Climate regulation (CR) is a function of ecosystems that absorbs energy and regulates temperature through vegetation transpiration and water evaporation. The formula is as follows:
E e e = E v e + E w e
E v e = i n E P P i × S i × D × 10 6 / ( 3600 × r )
E w e = E w t × ρ w × q × 10 3 / ( 3600 × r )
V e e = E e e × c e
where E e e represents the physical quantity of the climate regulation service (kWh/a); V e e represents the monetary value of climate regulation service (CNY/year); E v e represents the physical quantity of climate regulation services from vegetation space (kWh/a); E w e represents the physical quantity of climate regulation services from wetland (kWh/a); E P P i represents the heat consumption per unit area of transpiration for type i ecosystems (kJ/(m2 · d)), S i represents the area of type i ecosystems (km2), D represents the days of open air-conditioning for cooling (d/a); r represents the air conditioner energy efficiency ratio (dimensionless); i represents the ecosystem type, i = 1, 2, 3, …, n ; E w t represents water evaporation during open air-conditioning cooling (m3/a); ρ w represents the density of water (g/cm3). q represents the latent heat of evaporation, that is, the heat required to evaporate 1 g of water.
The function of ecosystems to absorb and filter atmospheric pollutants (e.g., sulfur dioxide, nitrogen oxides, dust), reduce the concentration of air pollution, and improve the air environment is called air purification (AP). The formula is as follows:
Q s d p = i = 1 n V S D i × 0.000001 × S g r i d
Q n o p = i = 1 n V N O i × 0.000001 × S g r i d
Q d u p = i = 1 n V D U i × 0.000001 × S g r i d
V a p = Q s d p × c s d + Q n o p × c n o + Q d u p × c d u
where Q s d p , Q n o p , and Q d u p represent the physical quantities of SO2, NOX, and dust for air purification service, respectively (t/a); V a p represents the monetary value of air purification service (CNY/year); V S D i , V N O i , and V D U i represent the purification capacity of ecosystem types on grid i for SO2, NOX, and dust, respectively (g/(m2·a)); i represents the grid number, i = 1, 2, 3, …, n ; S g r i d represents the area of each grid (m2); c s d , c n o , and c d u represent the removal cost of SO2, NOX, and dust, respectively.

2.4. Data Collection

This study integrated land use/land cover data, meteorological and environmental monitoring data, socio-economic development data, and ecological function parameters to conduct ecosystem service assessments and simulations of future land-use development strategies. Detailed information regarding the data used in the ecosystem service assessment process is presented in Table 1. Some data are not annotated with specific years because they are standardized values set by the relevant technical specification or have small interannual variability. To reduce the impact of inter-annual fluctuations in meteorological factors on the assessment results of ecosystem services and to improve the comparability of ecosystem service assessment results under current and future development strategies, thereby better reflecting the actual changes in the quality and quantity of ecosystems, this study refers to previous research [46,47] and uses the meteorological conditions of Jiaxing City in 2020 as meteorological conditions comparable to those of related ecosystem service assessments.
This study used 11 socio-economic data indicators and 6 climate environmental data indicators as potential driving factors for land use change, inputting them into the PLUS model for simulation. A detailed description of each data indicator is presented in Table 2. All data are from 2020.

3. Results

3.1. The Current Status of Ecosystem Services Values Supply

The results showed that the total ecosystem service value was CNY 124.82 billion in 2020. The city’s ecosystem retained a total of 145,855.60 ten thousand tons of rainfall, valued at CNY 37,762.02 million, effectively replenishing local groundwater resources. During heavy rain events, a total of 92,937.88 ten thousand tons of runoff was intercepted by the surface ecosystem, valued at CNY 24,061.62 million, reducing urban flooding pressure. The city’s vegetation and wetland spaces absorbed and sequestered a total of 953,856.30 tons of carbon dioxide, valued at approximately CNY 22.63 million, effectively mitigating regional climate pressure. The city’s forest land, grassland, and cropland reduced surface erosion by intercepting rainwater, preventing a total of 392.62 ten thousand cubic meters of sediment from entering the city’s rivers and lakes, valued at approximately CNY 103.14 million. Meanwhile, the ecosystem also reduced the formation of non-point source pollution by 11,582.66 tons of total nitrogen and 7795.86 tons of total phosphorus, with economic values of CNY 110.88 million and CNY 77.96 million, respectively, effectively ensuring the safety of agricultural product production in the city. The city’s ecological spaces regulated environmental temperature through transpiration and evaporation, effectively reducing the city’s electrical energy consumption by a total of 1159.47 100 million kWh during high-temperature periods, valued at approximately CNY 62,611.20 million. Vegetation and wetland spaces significantly reduced the concentration of air pollutants in the city by absorbing and retaining pollutants, purifying a total of 18,786.07 tons of SO2, 7671.94 tons of NOX, and 35,528.65 tons of dust, with a combined value of CNY 67.55 million (Tables S1 and S2). Overall, the service values of climate regulation, water conservation, and flood reduction accounted for a higher proportion at 50.16%, 30.25%, and 19.28%, respectively.
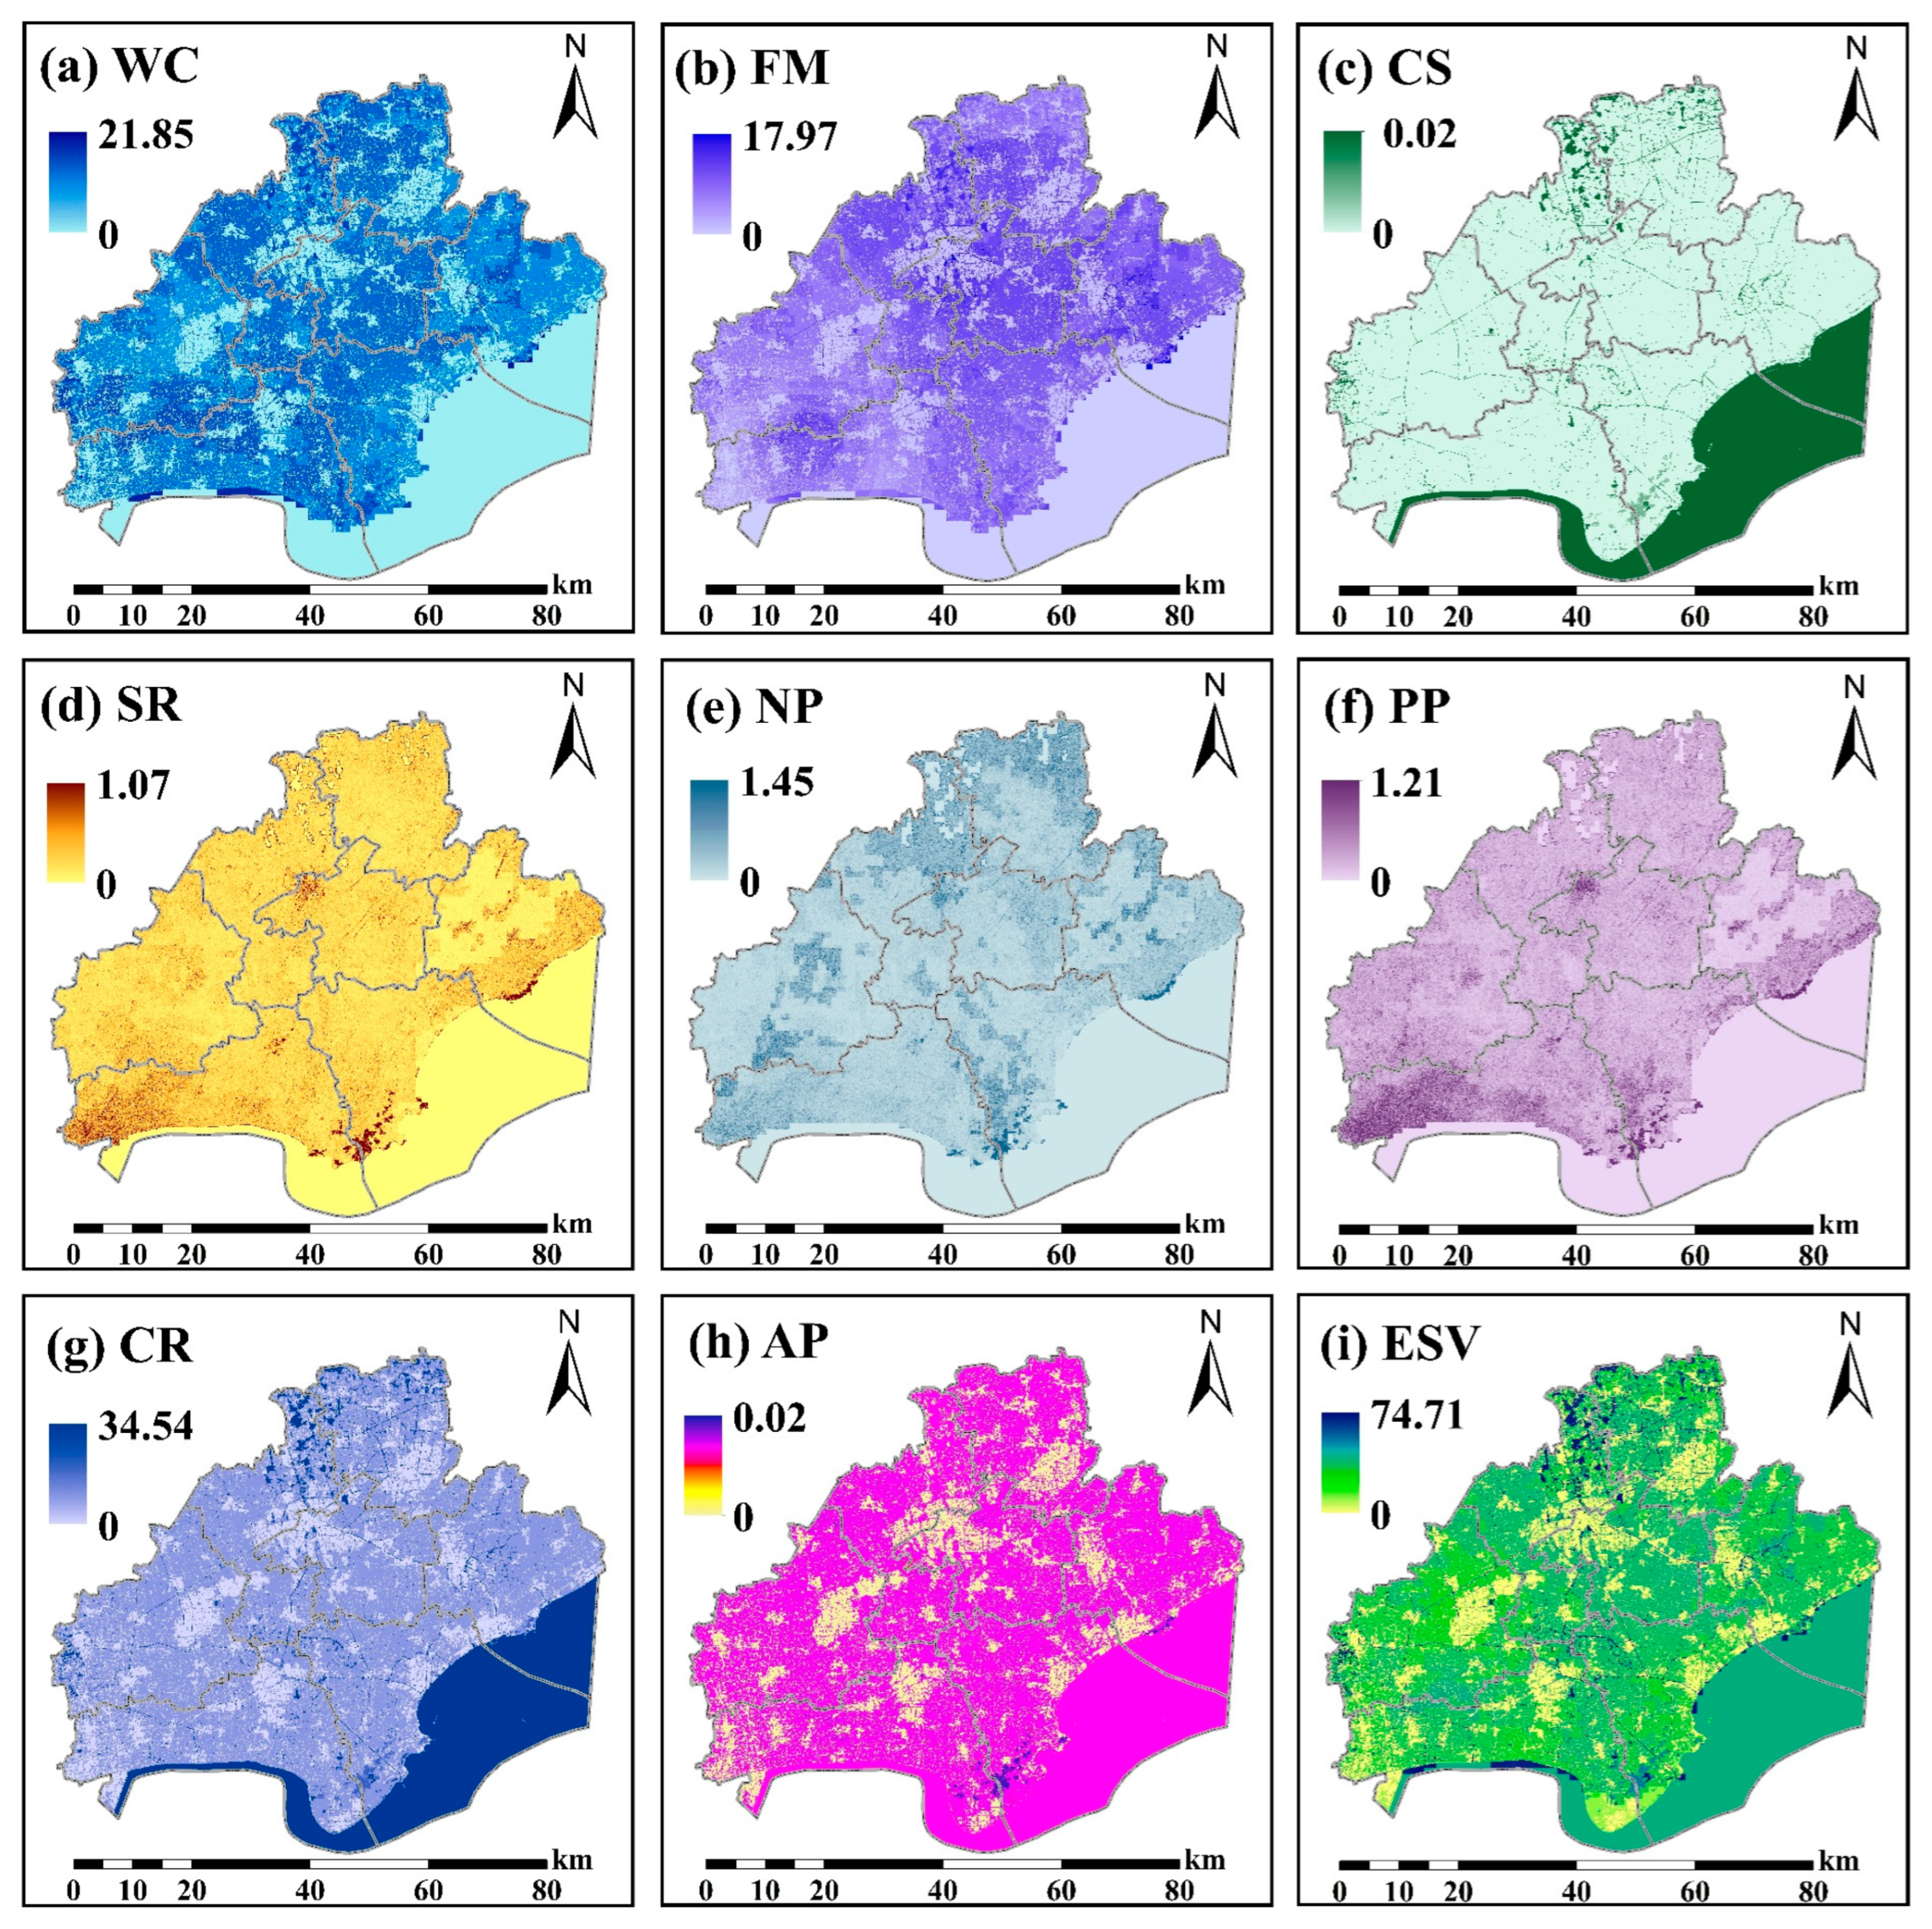
Figure 3 shows the spatial distribution of the values of the various ecosystem services. The high-value areas for water conservation were mainly distributed in terrestrial wetland spaces, especially in the dense river network areas in the north, and the water conservation values in the southern part of Tongxiang and the eastern part of Haining were also high (Figure 3a). Influenced by the spatial distribution of heavy rain, the high-value areas for flood mitigation were mainly distributed in the northern part of the city and a small area in the southern part of Pinghu (Figure 3b). The city’s wetland spaces showed high values for carbon sequestration, particularly in the southeastern sea area and the dense river network areas in the north. However, owing to the high proportion of cropland and construction land, which have lower carbon sequestration capacity, the spatial distribution of carbon sequestration across the city is relatively homogeneous (Figure 3c). The spatial distribution characteristics of the values for sedimentation reduction, nitrogen purification, and phosphorus purification were similar, with high-value areas located in the Nanbei Lake scenic area in the southern part of the city’s land and the southwestern area (Figure 3d–f), and high-value areas for nitrogen purification were also distributed in the north (Figure 3e). Due to the high latent heat of vaporization, the high-value areas for climate regulation were mainly located in the dense river network areas in the north and southeastern sea areas (Figure 3g). The air purification values were high in the city’s cropland and in small areas of the southern forests (Figure 3h). Overall, the high-value areas of ecosystem services were mainly located in the southeastern sea area, as well as in the central and northern parts of the terrestrial ecosystem, especially in the dense river network areas in the north and hilly and mountainous forests in the south, with higher values per unit area (Figure 3i).

3.2. Driving Factors of Historical Land Use Change

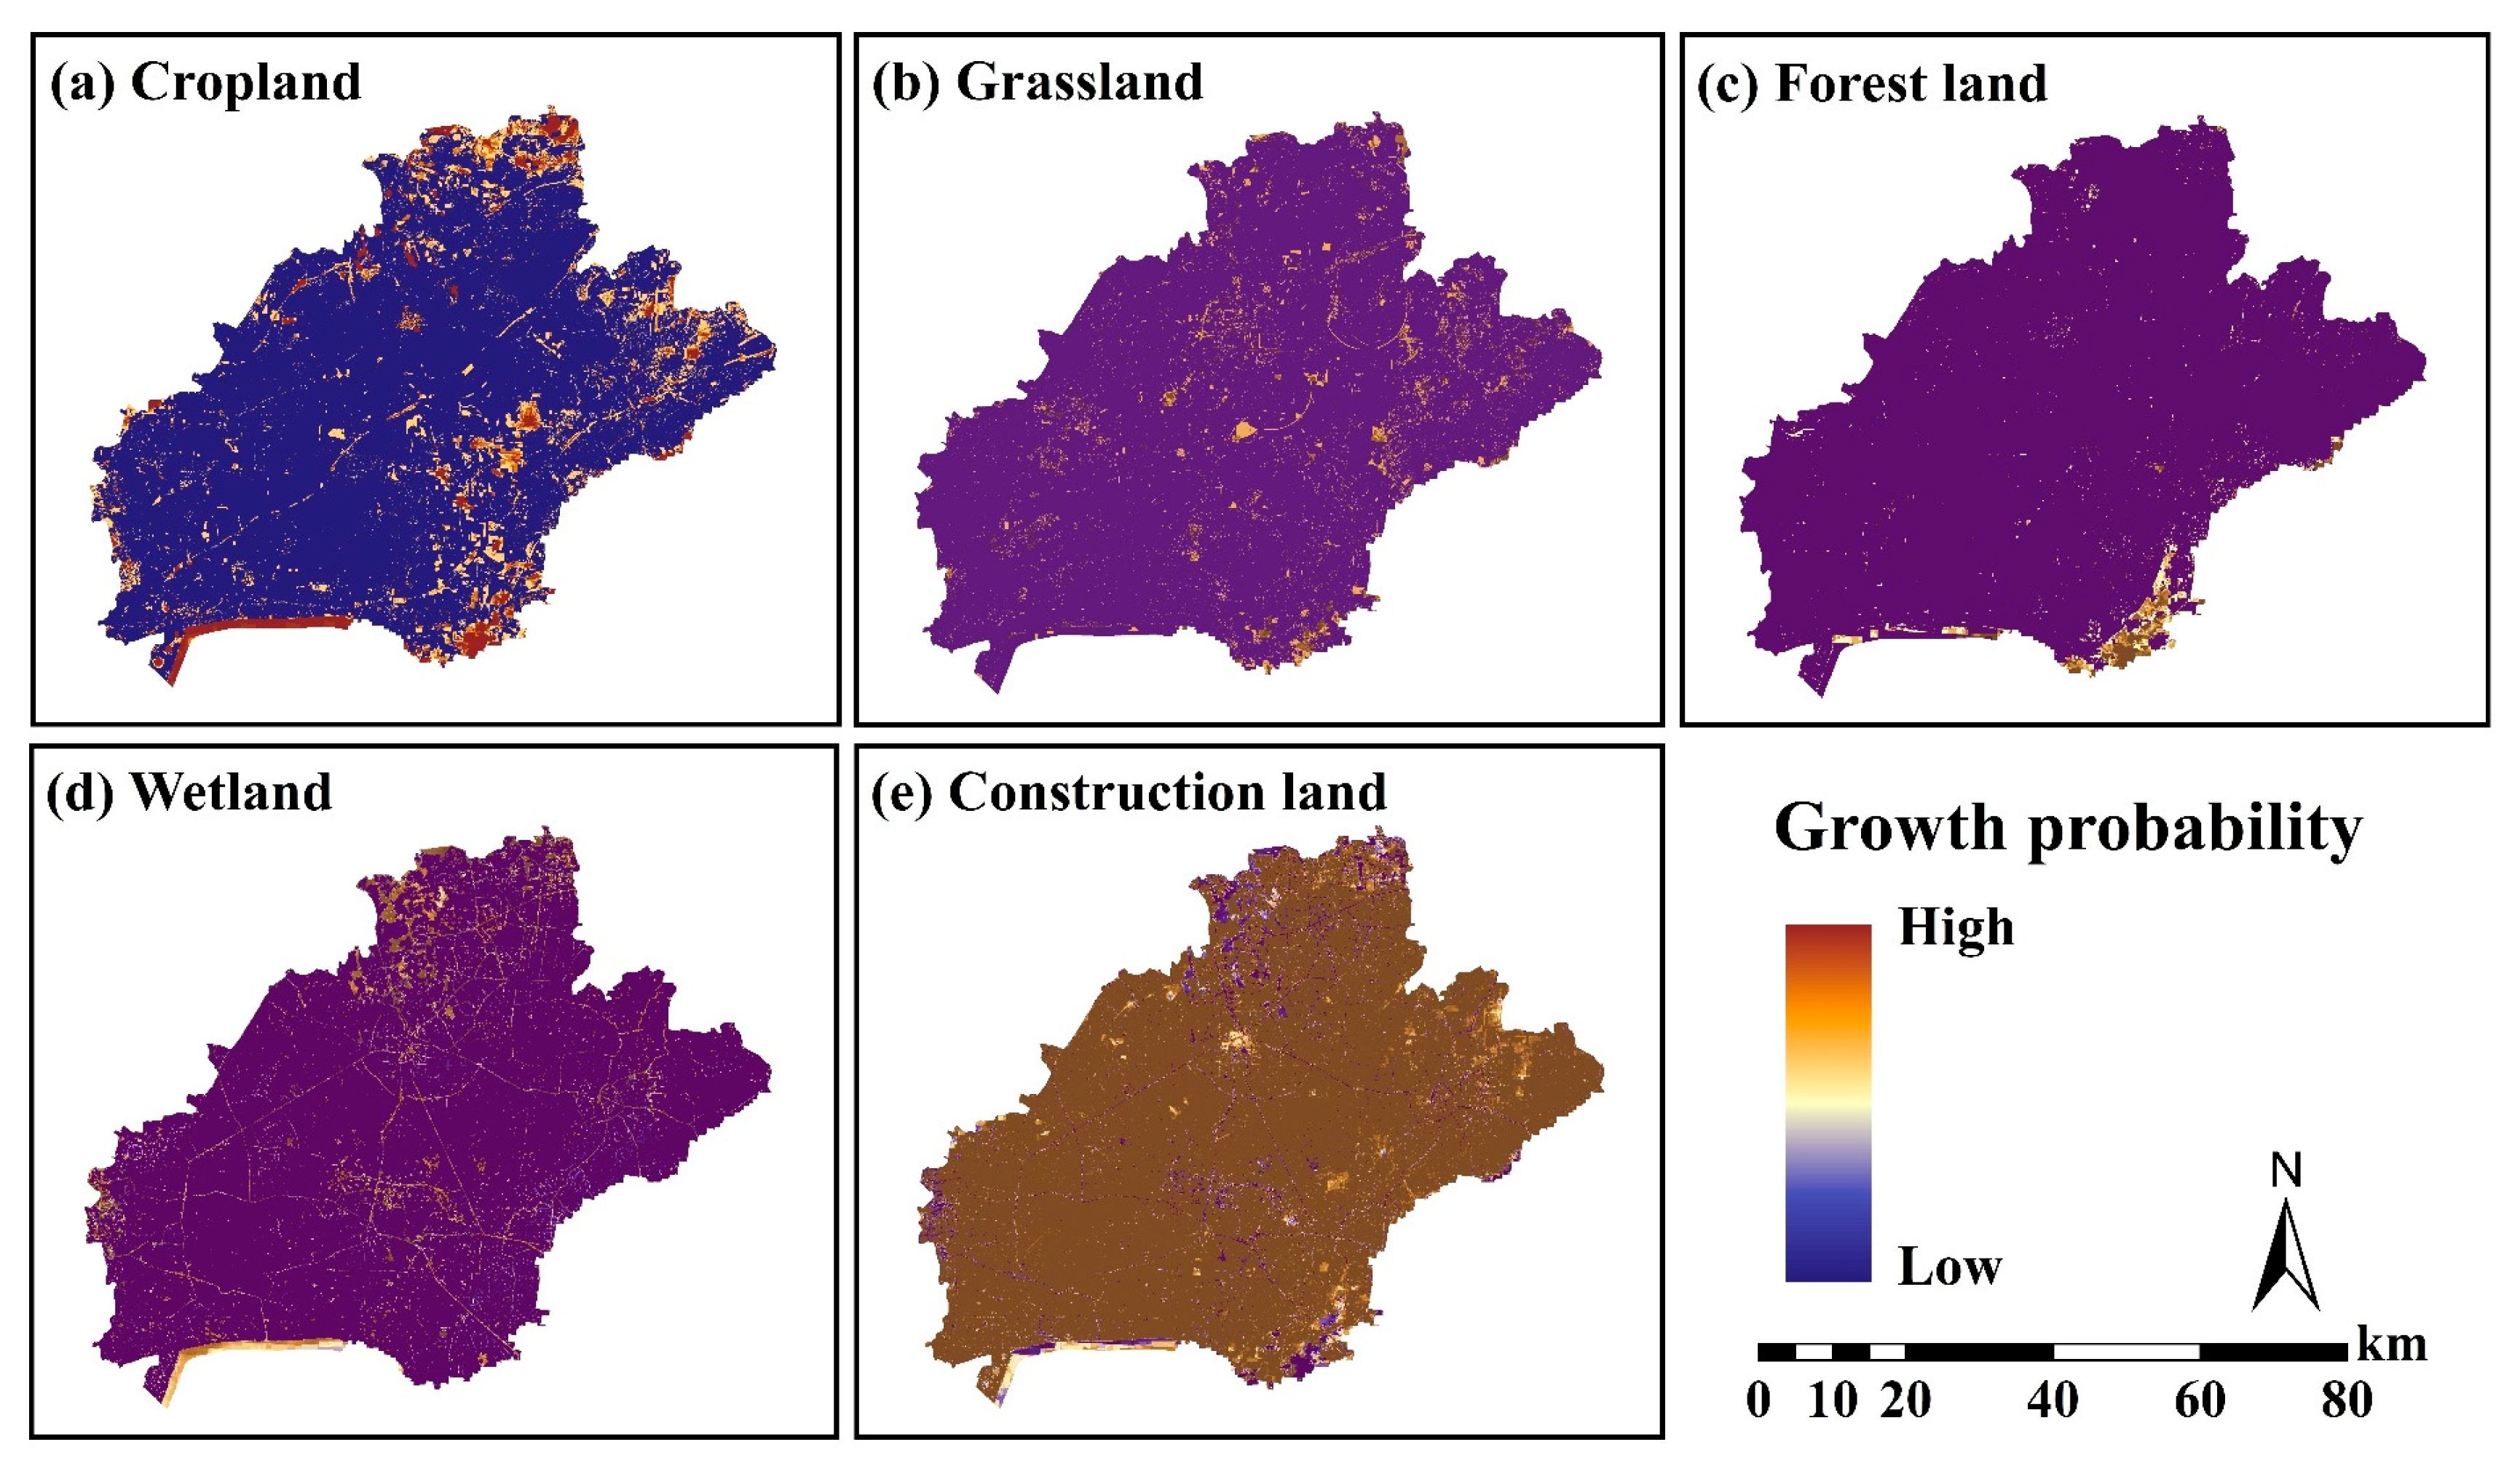
Figure 4 shows the probability of growth for each land use type. Among the five land use types, construction land contributed the most to land expansion from 2005 to 2020 (Figure 4e), meaning that the rapid urban expansion in the past 15 years has greatly affected the spatial distribution of other land use types. The high-growth areas for cropland were concentrated in the dense river network region in the north, and the higher terrain areas in the southern estuary, with several concentrated distribution areas also found in the central and eastern parts (Figure 4a). In contrast, the high-growth areas for grasslands were more scattered across the entire city (Figure 4b). The high-growth areas for forestland were concentrated in the Nanbei Lake Scenic Area in the south and its surrounding regions (Figure 4c). The high-growth areas for wetlands were concentrated along the entire water system throughout the city (Figure 4d).
Figure 5 shows the contribution of each driving factor to the change in each land-use type. The annual average temperature and elevation had significant driving effects on historical changes in cropland and construction land, and the change in cropland was most affected by elevation. Proximity to open water was the factor that contributed the most to the change in construction land. In addition, changes in cropland were also affected by nighttime light. The changes in forestland were mainly driven by two factors, temperature and nighttime lighting, and their contribution values were much higher than those of other factors. Only proximity to open water significantly affected wetland changes, while the contribution values of other factors were relatively small. Elevation, proximity to primary roads, and soil type were the main factors influencing grassland changes.

3.3. Land Use Distribution Patterns Under Different Development Strategies

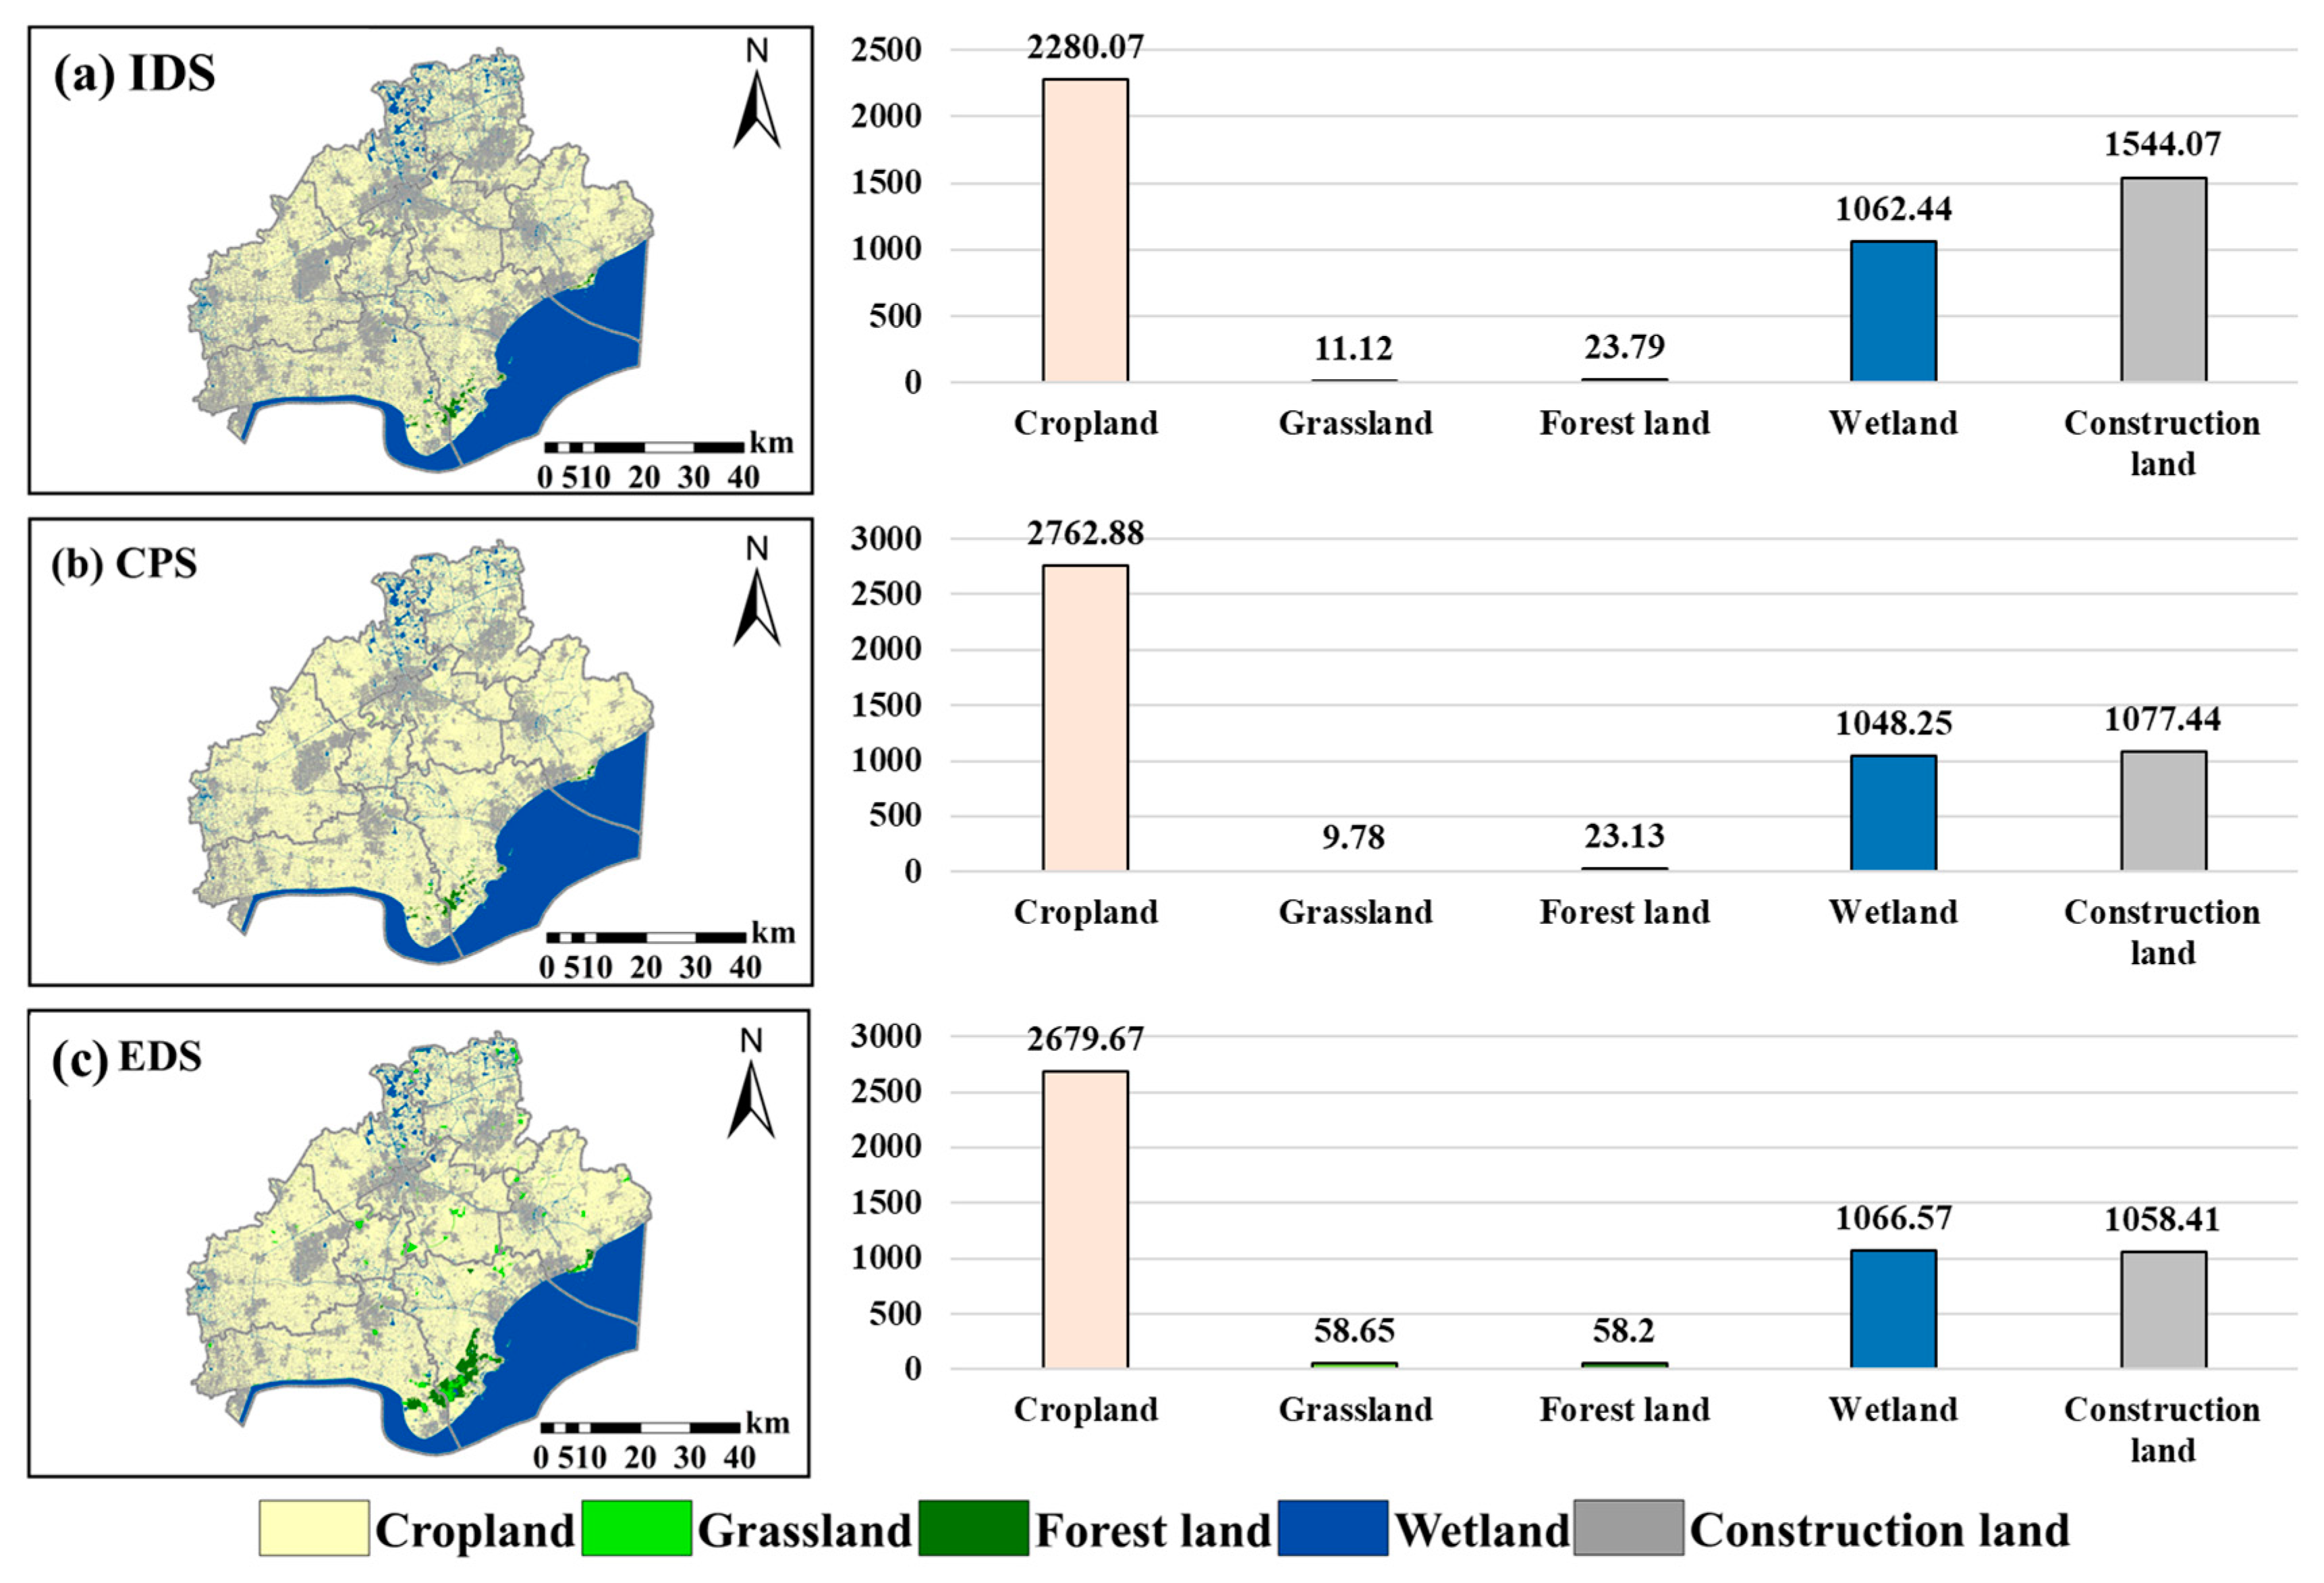
Figure 6 shows the land-use distribution pattern and composition of Jiaxing in 2035 under different development strategies. Under the inertial development strategy, urban construction land further expanded, with the area increasing by 44.75% compared with 2020, leading to more severe encroachment on cropland across the city, with the area of cropland declining by 17.27%. As the widely distributed cropland in Jiaxing was closely integrated with irrigated wetlands, the wetland area decreased by 0.39%. The forestland and grassland areas increased by 2.63% and 24.52%, respectively, due to the impact of greening construction during urban development (Figure 6a). Under the cropland protection strategy, the safety of croplands across cities is effectively ensured. Compared to 2020, the cropland area increased by 0.25%, while the expansion of construction land was not significant, with an increase of only 1.01%. The area of grassland increased by 9.52%, whereas the areas of wetlands and forest land decreased by 1.72% and 0.22%, respectively (Figure 6b). Under the ecological development strategy, the wetland spaces across cities were effectively protected. The cropland area decreased by only 2.77%, with the ‘Returning Farmland to Forests’ and ‘Returning Farmland to Grasslands’ measures showing significant results, leading to a 151.08% increase in forest land area and a 556.77% increase in grassland area. Urban construction intensification increased, resulting in a 0.78% decrease in construction land area (Figure 6c).

3.4. Differences in Ecosystem Service Values Under Various Land Development Strategies

Significant differences in the values of various ecosystem services were observed under different land development strategies (Tables S3–S8). For the values of water conservation, flood reduction, climate regulation, air purification, and total ecosystem service value, the ecological development strategy yielded the highest values, the inertial development strategy yielded the lowest, and the cropland protection strategy fell at an intermediate level. The inertial development strategy yielded the highest values for sedimentation reduction and nitrogen and phosphorus purification. This was because the expansion of urban construction land further hardened the soil and enhanced its resistance to rainwater erosion. The cropland protection strategy yielded the lowest value, as the cropland in the river network areas of the plains was predominantly paddy fields, which are less capable of sedimentation and pollutant reduction. For carbon sequestration, the ecological development strategy yielded the highest value, the cropland protection strategy yielded the lowest value, and the inertial development strategy fell to an intermediate level. This was because, under the ecological development strategy, with the intensification of construction land, the areas of forests and grasslands were restored, whereas, under the cropland protection strategy, the carbon sequestration capacity of the newly added cropland was far less than that of the reduced wetland, forest, and grassland areas.
Under the ecological development strategy, the city’s land use distribution pattern exhibited optimal ecological benefits, with the value of ecosystem services reaching up to CNY 125.83 billion. This was 0.81%, 13.19%, and 1.56% higher than the values in 2020, the inertial development strategy, and the cropland protection strategy, respectively (Tables S2, S4, S6, and S8). Notably, the current values of water conservation, flood mitigation, carbon sequestration, climate regulation, air purification, and the total value of ecosystem services were all higher than those under the inertial development and cropland protection strategies (Tables S2, S4, and S6). The land-use distribution pattern under the farmland protection strategy did not significantly enhance ecological benefits.
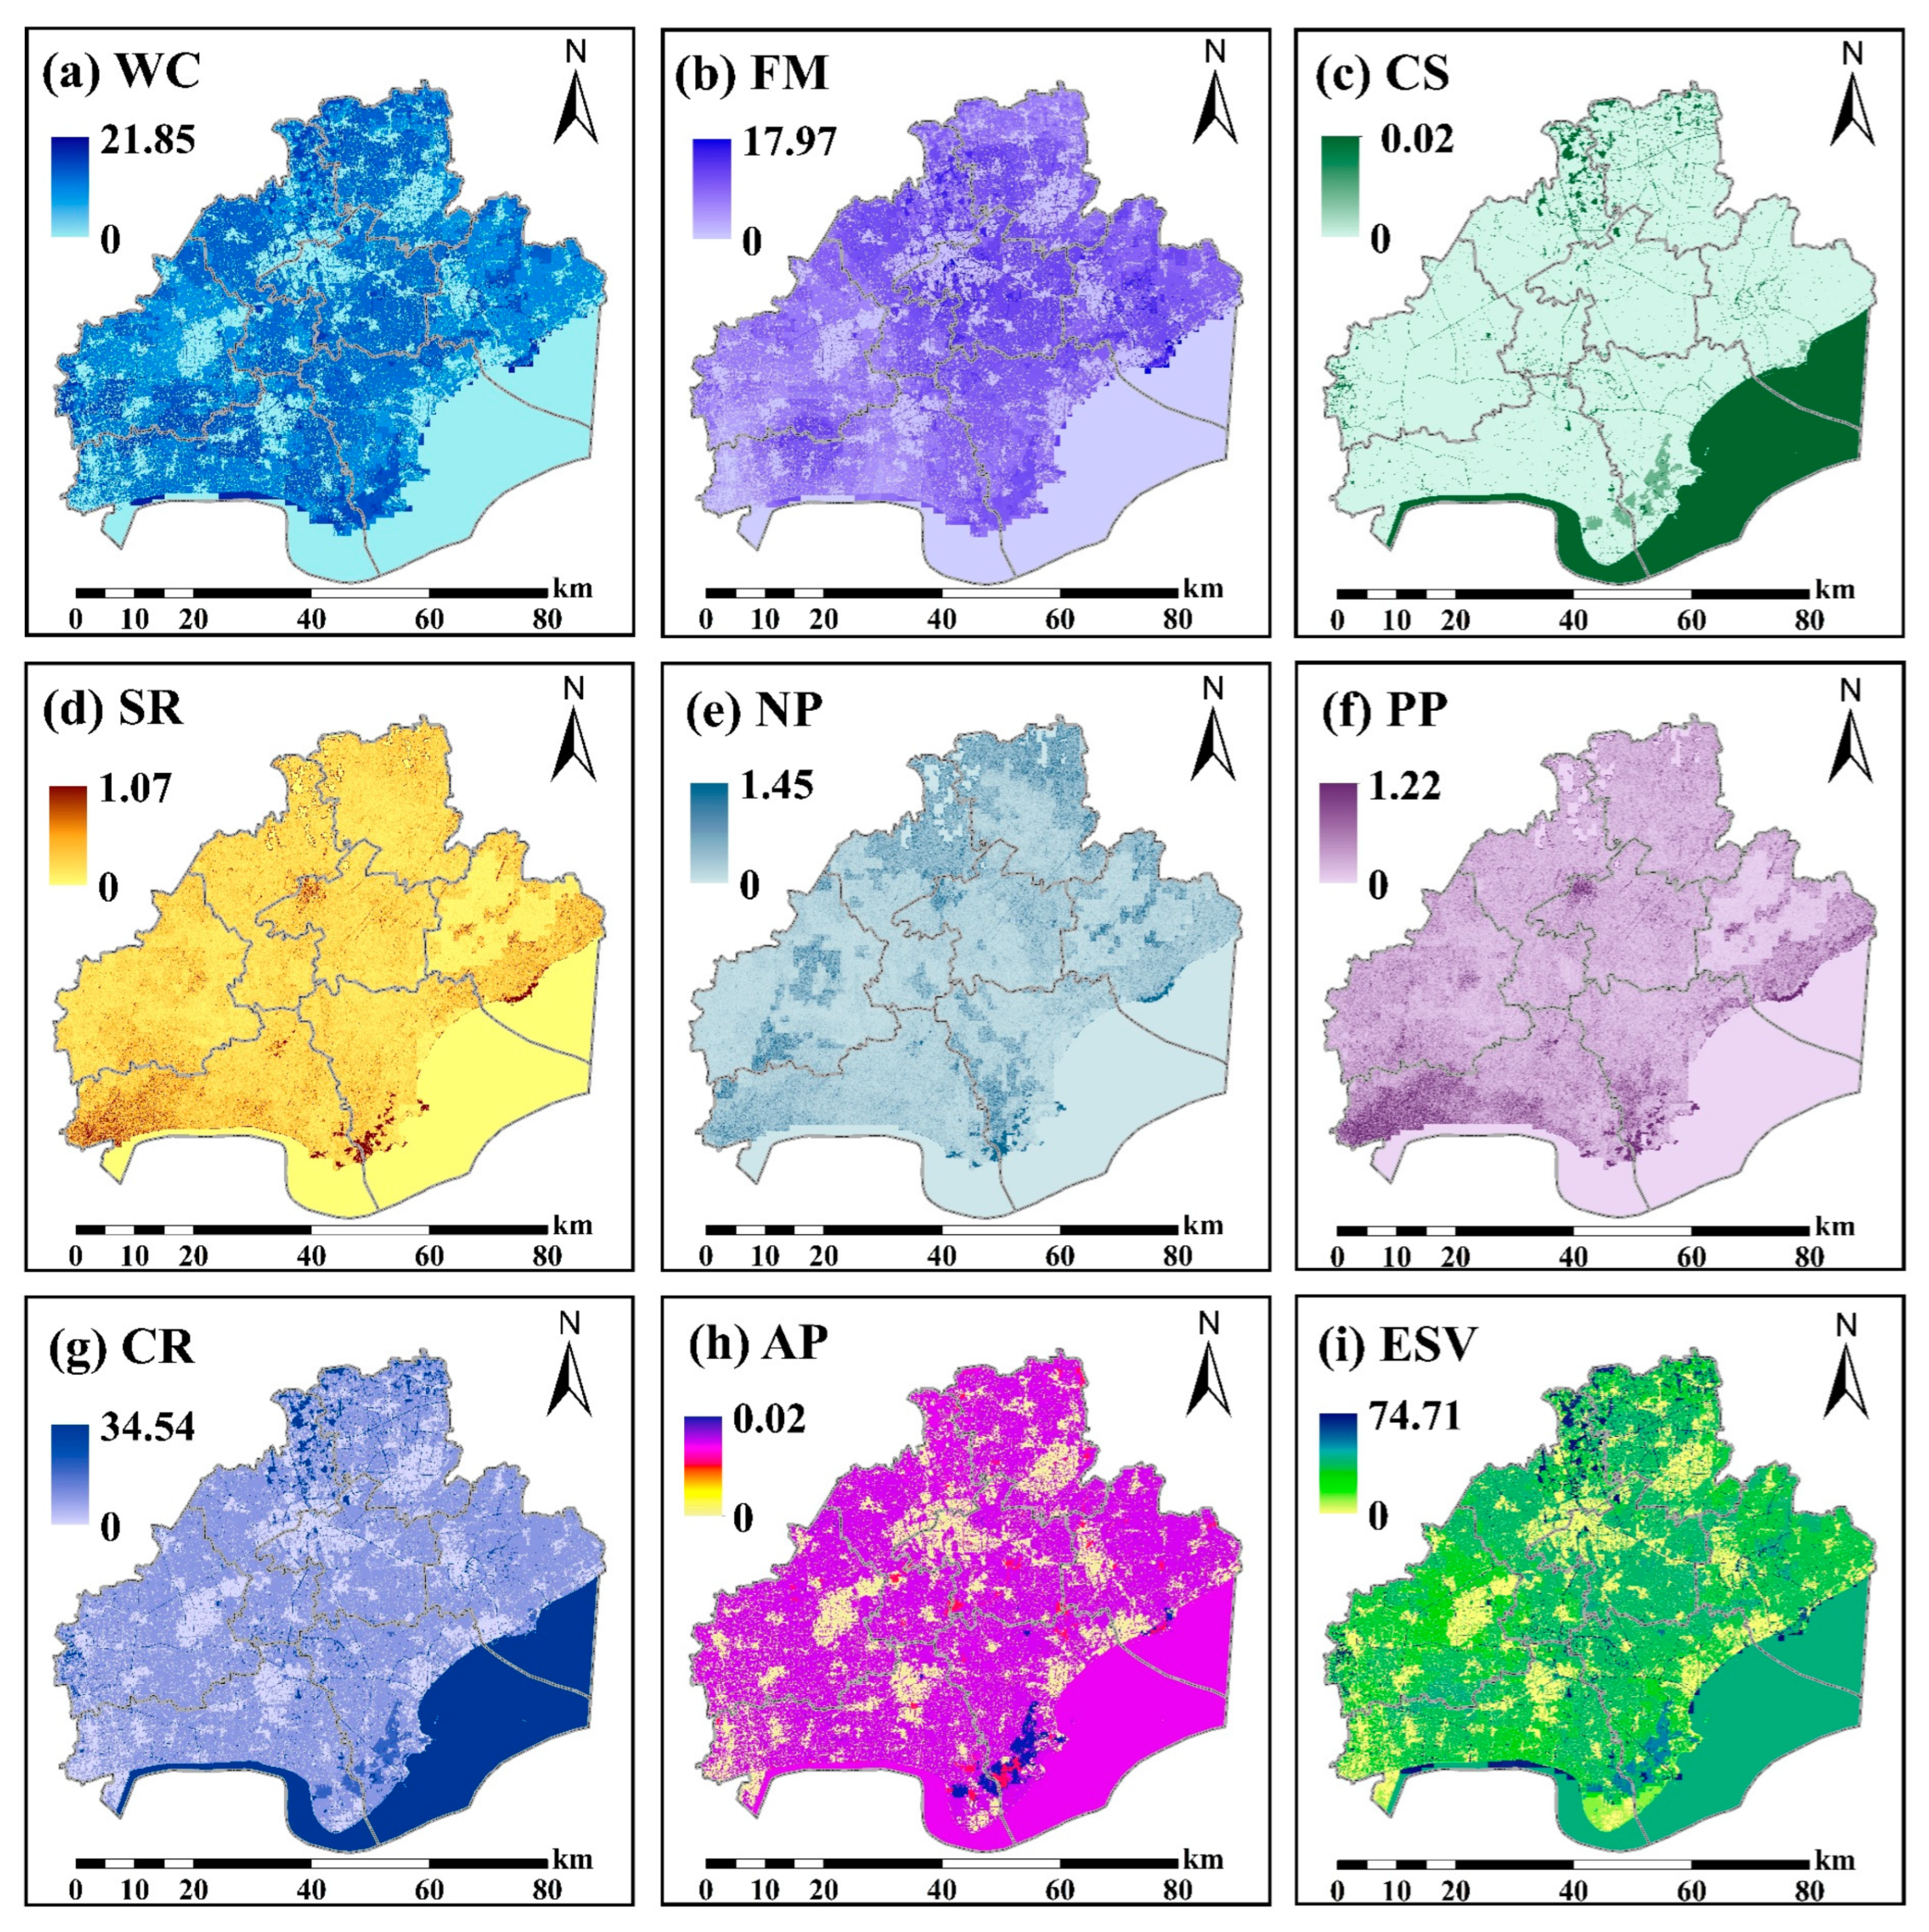
Figure 7, Figure 8 and Figure 9 show the spatial distribution of ecosystem service values under the different development strategies. The locations of high- and low-value areas showed little change compared to the current situation, but there were significant differences in the size of high- and low-value areas between the current situation and the different development strategies. The results showed that, under the three different land development strategies, the spatial distribution differences in the values of sedimentation reduction, nitrogen purification, and phosphorus purification were not significant, and the changes compared with the current situation were also minor (Figure 3d–f, Figure 7d–f, Figure 8d–f and Figure 9d–f). This was because the elevation factors had a significant influence on the calculation process of these ecosystem services. For plain areas, there was almost no change in elevation, regardless of the land development strategy adopted. Other ecosystem services showed significant differences in spatial distribution under different land development strategies. Under the ecological development strategy, influenced by the restoration of forest and grassland areas and the reduction of construction land area, high-value areas for other ecosystem services and the total value of ecosystem services, except for sedimentation reduction, nitrogen purification, and phosphorus purification services, exhibited a significant expansion trend. This was especially evident in the Nanbei Lake Scenic Area in the southern hilly forest region (Figure 3 and Figure 9). Under the inertial development strategy, with the continuous expansion of construction land occupying a large area of cropland across the city, a significant number of low-value areas emerged in the original farmland, which was previously of medium value. This trend was more pronounced in areas surrounding large-scale construction land (Figure 3 and Figure 7). Under the cropland development strategy, the most significant spatial changes in value occurred in the southern hilly and northern river network areas of the land, where high-value areas showed a decreasing trend (Figure 3 and Figure 8). This was due to the restoration of cropland and expansion of construction land, which led to the degradation of forests and wetlands.

4. Discussion

For cities where economic development is lagging but ecological quality is relatively high, extensive research and policies have helped them to implement ecological protection strategies more comprehensively and obtain economic benefits in the form of ecological compensation [50,51,52]. However, in the context of net population inflow and industrial development, cities at the medium level of development still face huge development needs but also bear the responsibility of regional ecological protection. In economically developed regions, how medium-developed cities can balance the economic development gap between themselves and surrounding cities through sustainable land development strategies is a challenging issue that policymakers urgently need to address, and there are fewer existing relevant studies. Jiaxing is located in the highly economically developed Yangtze River Delta (YRD) city cluster in eastern China, but, limited by its own relative location conditions and development history, its economic level and urban development level are weaker than that of other neighboring cities and it has tremendous pressure on cropland protection and ecological protection responsibilities, making it a suitable case for study. This study confirms that medium-developed cities provide high-value ecosystem services that support the rapid economic development of the region. They not only ensure the potential for regional water resource supply and reduce the risk of regional flooding by conserving precipitation but also control the region’s extreme heat environment and pollutant concentrations through the regulatory and purification functions of the ecosystem, which is in line with previous studies [53,54]. What is different is that, in this study, we further assessed the value of various ecosystem services through the shadow engineering method or equivalent substitution method. The pricing data used in these methods have a high socioeconomic attribute, and the results lay the foundation for the formulation of future land development strategies for the city.
We integrated the ecosystem service assessment model and the PLUS model to propose a research framework oriented to sustainable urban land development. By setting up three different land development strategies, we predicted the spatial distribution patterns of land use and ecosystem service values in Jiaxing under different development strategies by 2035. The results showed that the supply of ecosystem services under the ecological development strategy was the highest compared to the inertial development and cropland protection strategies. This finding is consistent with those of other multiscenario simulation studies [42,55,56]. This is because an ecologically-friendly land development strategy can effectively restore high-quality ecological spaces, such as forests and grasslands, and limit the rampant expansion of construction land, intensifying the spatial distribution of construction land and improving economic efficiency. Compared to the current situation, only the changes in land use area under the ecological development strategy have achieved an increase in ecosystem service value by approximately 0.81%, while, under the inertial development strategy and cropland protection strategy, the ecosystem service values have decreased by 10.93% and 0.73%, respectively, compared to the current situation. This is because, under the inertial development strategy, the expansion of construction land is more rapid, leading to large-scale encroachment on cropland, whereas, under the cropland protection strategy, the restoration measures for cropland protection and the expansion of construction land have further occupied wetland and forest spaces. Unlike previous studies, we mapped the spatial distribution of the values of various ecosystem services under different land development strategies to clarify the spatial characteristics of the changes in value. Under the ecological development strategy, the high-value areas of various ecosystem services have expanded significantly, while, under the inertial development strategy and cropland protection strategy, high-value areas show a shrinking trend, and low-value areas show an expanding trend.
In this study, compared with other land development strategies, the land-use simulation results under the ecological development strategy are closest to the relevant requirements in the “Jiaxing City Territorial Spatial Master Plan (2021–2035)”. Under the ecological development strategy, the area of cropland was 2679.67 km2, which far exceeded the planned requirement of 1405.18 km2. Moreover, the area of construction land fully meets the plan requirements for urban development boundaries. Compared to the current situation, the area of construction land under the ecological development strategy is reduced by approximately 0.78%, which aligns with the plan’s objectives of “optimizing the supply structure of construction land” and “promoting intensive and economical use of construction land”.
Since the calculation results of ecosystem service values are directly linked to currency, the monetized assessment of ecosystem services can not only support land development strategies but can also be applied more deeply and directly in terms of economic benefits in the field of ecosystem service value realization. The methodological framework proposed in this study for guiding future land-use development strategies based on ecosystem service values is fundamental for establishing a city’s economic development at the spatial planning level. However, there are already mature research cases in the field of value realization, such as watershed ecological compensation and commercial development of ecological products. Cities such as Jiaxing, which are at a medium level of development, can use research findings from this methodological framework to further assess the contribution or spatial flow of ecosystem service values over a larger regional scope. Based on the “beneficiary pays” principle, they can collaborate with surrounding stakeholder cities to jointly formulate regional ecological compensation funding collection and distribution plans.

5. Conclusions

At present, there is a lack of research on land development strategies for middle-level cities. In response to the balance between development and conservation issues faced by these cities, we integrate the Ecosystem Services Assessment Model and the PLUS Model to present a methodological framework for guiding future land-use development strategies based on ecosystem service values. Jiaxing City provides a valuable typical case for our study. As a city with a medium level of development in an economically developed area, Jiaxing provides a significant amount of ecosystem services for regional economic development and human survival, with a total value of CNY 124.82 billion. Among these services, climate regulation, water conservation, and flood mitigation had higher values, accounting for 50.16%, 30.25%, and 19.28%, respectively. The city’s ecosystems not only significantly reduce the risk of extremely high temperatures and electricity consumption but also effectively replenish regional water resources and reduce flood risks through rainwater interception and infiltration. Overall, the ecosystem service values were higher in the southern forested areas, the northern areas with dense river networks, and the southeastern sea areas. Historically, there have been significant spatial distribution differences in the growth probability of various land use types. The growth probability of construction land is high across the city, while the high growth probability areas for cropland are distributed in the northern, eastern, and southern regions. Wetlands have a higher growth probability around their periphery, and forest land only has a higher growth probability in the southern hilly areas. Under the three different land development strategies, the ecological development strategy demonstrates the optimal ecological benefits, providing higher ecosystem service values and areas with high values generally show significant spatial expansion.

Supplementary Materials

The following supporting information can be downloaded at https://www.mdpi.com/article/10.3390/land13121985/s1, Table S1: Ecosystem service physical quantity of each district in Jiaxing city in 2020; Table S2: Ecosystem service value of each district in Jiaxing city in 2020 (million CNY); Table S3: Ecosystem service physical quantity of each district in Jiaxing city under inertial development strategy; Table S4: Ecosystem service value of each district in Jiaxing city under inertial development strategy (million CNY); Table S5: Ecosystem service physical quantity of each district in Jiaxing city under cropland protection strategy; Table S6: Ecosystem service value of each district in Jiaxing city under cropland protection strategy (million CNY); Table S7: Ecosystem service physical quantity of each district in Jiaxing city under ecological development strategy; Table S8: Ecosystem service value of each district in Jiaxing city under ecological development strategy (million CNY).

Author Contributions

Conceptualization, W.C.; methodology, C.S.; software, C.S.; validation, W.C., C.S. and L.L.; formal analysis, W.C.; investigation, C.S.; resources, W.C.; data curation, L.L.; writing—original draft preparation, C.S.; writing—review and editing, W.C.; visualization, L.L.; supervision, W.C.; project administration, W.C.; funding acquisition, W.C. All authors have read and agreed to the published version of the manuscript.

Funding

This research was funded by the National Natural Science Foundation of China (grant No. 72104232) and ‘Research on Renaturalization and Enhancement of Ecological Value in Rural and Suburban Areas of Shanghai Based on BEC Multidimensional Methods’, A soft Science Research project (Grant No. 24692116500) under the 2024 ‘Science and Technology Innovation Action Plan’ of Shanghai.

Data Availability Statement

The data are contained within the article.

Acknowledgments

The authors gratefully acknowledge the support of the Research Institute and the State Key Laboratory of Urban and Regional Ecology, Research Center for Eco-Environment Sciences, and the Center for Modern Chinese City Studies & Institute of Urban Development, East China Normal University.

Conflicts of Interest

The authors declare no conflicts of interest.

References

  1. Li, X.; Zhou, Y.; Hejazi, M.; Wise, M.; Vernon, C.; Iyer, G.; Chen, W. Global urban growth between 1870 and 2100 from integrated high resolution mapped data and urban dynamic modeling. Commun. Earth Environ. 2021, 2, 201. [Google Scholar] [CrossRef]
  2. Elmqvist, T.; Andersson, E.; McPhearson, T.; Bai, X.; Bettencourt, L.; Brondizio, E.; Colding, J.; Daily, G.; Folke, C.; Grimm, N.; et al. Urbanization in and for the Anthropocene. Npj Urban Sustain. 2021, 1, 6. [Google Scholar] [CrossRef]
  3. Seto, K.C.; Fragkias, M.; Güneralp, B.; Reilly, M.K. A Meta-Analysis of Global Urban Land Expansion. PLoS ONE 2011, 6, e23777. [Google Scholar] [CrossRef] [PubMed]
  4. Frolking, S.; Mahtta, R.; Milliman, T.; Esch, T.; Seto, K.C. Global urban structural growth shows a profound shift from spreading out to building up. Nat. Cities 2024, 1, 555–566. [Google Scholar] [CrossRef]
  5. UN-Habitat. World Cities Report 2022: Envisaging the Future of Cities; United Nations Fund for Population Activities: New York, NY, USA, 2000. [Google Scholar]
  6. Niu, F.; Yang, X.; Wang, F. Urban Agglomeration Formation and Its Spatiotemporal Expansion Process in China: From the Perspective of Industrial Evolution. Chin. Geogr. Sci. 2020, 30, 532–543. [Google Scholar] [CrossRef]
  7. Wan, G.; Zhang, X.; Zhao, M. Urbanization can help reduce income inequality. Npj Urban Sustain. 2022, 2, 1. [Google Scholar] [CrossRef]
  8. Di Clemente, R.; Strano, E.; Batty, M. Urbanization and economic complexity. Sci. Rep. 2021, 11, 3952. [Google Scholar] [CrossRef]
  9. Mouratidis, K. Urban planning and quality of life: A review of pathways linking the built environment to subjective well-being. Cities 2021, 115, 103229. [Google Scholar] [CrossRef]
  10. Soni, H.; Yadav, R.K.; Patra, S.K. Global impact of urbanization on ecosystems: A comprehensive bibliometric analysis. Nat. Hazards Res. 2024; in press. [Google Scholar] [CrossRef]
  11. Idowu, D.; Zhou, W. Global Megacities and Frequent Floods: Correlation between Urban Expansion Patterns and Urban Flood Hazards. Sustainability 2023, 15, 2514. [Google Scholar] [CrossRef]
  12. Miller, J.D.; Hutchins, M. The impacts of urbanisation and climate change on urban flooding and urban water quality: A review of the evidence concerning the United Kingdom. J. Hydrol. Reg. Stud. 2017, 12, 345–362. [Google Scholar] [CrossRef]
  13. Li, L.; Zhan, W.; Hu, L.; Chakraborty, T.C.; Wang, Z.; Fu, P.; Wang, D.; Liao, W.; Huang, F.; Fu, H.; et al. Divergent urbanization-induced impacts on global surface urban heat island trends since 1980s. Remote Sens. Environ. 2023, 295, 113650. [Google Scholar] [CrossRef]
  14. Ren, Z.; Fu, Y.; Dong, Y.; Zhang, P.; He, X. Rapid urbanization and climate change significantly contribute to worsening urban human thermal comfort: A national 183-city, 26-year study in China. Urban Clim. 2022, 43, 101154. [Google Scholar] [CrossRef]
  15. He, C.; Liu, Z.; Wu, J.; Pan, X.; Fang, Z.; Li, J.; Bryan, B.A. Future global urban water scarcity and potential solutions. Nat. Commun. 2021, 12, 4667. [Google Scholar] [CrossRef]
  16. Huang, Z.; Du, X. Urban Land Expansion and Air Pollution: Evidence from China. J. Urban Plan. Dev. 2018, 144, 05018017. [Google Scholar] [CrossRef]
  17. Costanza, R.; d’Arge, R.; de Groot, R.; Farber, S.; Grasso, M.; Hannon, B.; Limburg, K.; Naeem, S.; O’Neill, R.V.; Paruelo, J.; et al. The value of the world’s ecosystem services and natural capital. Nature 1997, 387, 253–260. [Google Scholar] [CrossRef]
  18. Ouyang, Z.; Zhu, C.; Yang, G.; Xu, W.; Zheng, H.; Zhang, Y.; Xiao, Y. Gross ecosystem product:concept, accounting framework and case study. Acta Ecol. Sin. 2013, 33, 6747–6761. [Google Scholar] [CrossRef]
  19. Ouyang, Z.Y.; Song, C.S.; Zheng, H.; Polasky, S.; Xiao, Y.; Bateman, I.J.; Liu, J.G.; Ruckelshaus, M.; Shi, F.Q.; Xiao, Y.; et al. Using gross ecosystem product (GEP) to value nature in decision making. Proc. Natl. Acad. Sci. USA 2020, 117, 14593–14601. [Google Scholar] [CrossRef]
  20. Brauman, K.A.; Garibaldi, L.A.; Polasky, S.; Aumeeruddy-Thomas, Y.; Brancalion, P.H.S.; DeClerck, F.; Jacob, U.; Mastrangelo, M.E.; Nkongolo, N.V.; Palang, H.; et al. Global trends in nature’s contributions to people. Proc. Natl. Acad. Sci. USA 2020, 117, 32799–32805. [Google Scholar] [CrossRef]
  21. Yang, B.; Chen, P.; Dong, K.; Sun, J. Formation of the National Territory Development Planning System Under the Background of Ecological Civilization. Urban Plan. Forum 2019, 4, 16–23. [Google Scholar]
  22. Cheng, P.; Fan, Y.; Tang, H.; Liu, K.; Wu, S.; Zhu, G.; Jiang, P.; Guo, W. Research review on land development rights and its implications for China’s national territory spatial planning. Heliyon 2024, 10, e35227. [Google Scholar] [CrossRef] [PubMed]
  23. Huang, D.; Yi, F.; Wang, S.; Wei, H.; Wang, S. Blue-Green Space Pattern and Indicator System in Territorial Planning. City Plan. Rev. 2022, 46, 18–31. [Google Scholar]
  24. Luo, K. Greenway Planning and Construction Strategy in Metropolitan AreasTake Xuhui Greenway in Shanghai as an Example. Urban Plan. Forum 2018, 3, 77–85. [Google Scholar]
  25. Borowiecka, M.; Alcaraz, M.; Manzano, M. Assessment of Ecosystem Services with numerical modelling to support groundwater dependent ecosystems and aquifer management: A demo study in the Medina del Campo Groundwater Body, Spain. Case Stud. Chem. Environ. Eng. 2024, 10, 100914. [Google Scholar] [CrossRef]
  26. Vercambre, G.; Mirás-Avalos, J.M.; Juillion, P.; Moradzadeh, M.; Plenet, D.; Valsesia, P.; Memah, M.-M.; Launay, M.; Lesniak, V.; Cheviron, B.; et al. Analyzing the impacts of climate change on ecosystem services provided by apple orchards in Southeast France using a process-based model. J. Environ. Manag. 2024, 370, 122470. [Google Scholar] [CrossRef] [PubMed]
  27. Molla Sitotaw, T.; Willemen, L.; Tsegaye Meshesha, D.; Nelson, A. Empirical assessments of small-scale ecosystem service flows in rural mosaic landscapes in the Ethiopian highlands. Ecosyst. Serv. 2024, 67, 101622. [Google Scholar] [CrossRef]
  28. Coscieme, L.; Marchettini, N.; Niccolucci, V.; Sporchia, F. Mapping the flows of ecosystem service values in the global land market: The winners and losers of large-scale land acquisitions. Ecosyst. Serv. 2024, 67, 101629. [Google Scholar] [CrossRef]
  29. Medina-Roldán, E.; Lorenzetti, R.; Calzolari, C.; Ungaro, F. Disentangling soil-based ecosystem services synergies, trade-offs, multifunctionality, and bundles: A case study at regional scale (NE Italy) to support environmental planning. Geoderma 2024, 448, 116962. [Google Scholar] [CrossRef]
  30. Burgos-Ayala, A.; Jiménez-Aceituno, A.; Meacham, M.; Rozas-Vásquez, D.; Mancilla García, M.; Rocha, J.; Rincón-Ruíz, A. Mapping ecosystem services in Colombia: Analysis of synergies, trade-offs and bundles in environmental management. Ecosyst. Serv. 2024, 66, 101608. [Google Scholar] [CrossRef]
  31. Zhang, B.; Feng, Q.; Lu, Z.; Li, Z.; Zhang, B.; Cheng, W. Ecosystem service value and ecological compensation in Qilian Mountain National Park: Implications for ecological conservation strategies. Ecol. Indic. 2024, 167, 112661. [Google Scholar] [CrossRef]
  32. del Río-Mena, T.; Willemen, L.; Vrieling, A.; Nelson, A. How remote sensing choices influence ecosystem services monitoring and evaluation results of ecological restoration interventions. Ecosyst. Serv. 2023, 64, 101565. [Google Scholar] [CrossRef]
  33. Dashtbozorgi, F.; Hedayatiaghmashhadi, A.; Dashtbozorgi, A.; Ruiz–Agudelo, C.A.; Fürst, C.; Cirella, G.T.; Naderi, M. Ecosystem services valuation using InVEST modeling: Case from southern Iranian mangrove forests. Reg. Stud. Mar. Sci. 2023, 60, 102813. [Google Scholar] [CrossRef]
  34. Isely, E.S.; Isely, P.; Seedang, S.; Mulder, K.; Thompson, K.; Steinman, A.D. Addressing the information gaps associated with valuing green infrastructure in west Michigan: INtegrated Valuation of Ecosystem Services Tool (INVEST). J. Great Lakes Res. 2010, 36, 448–457. [Google Scholar] [CrossRef]
  35. Duan, L.; Yang, S.; Xiang, M.; Li, W.; Li, J. Spatiotemporal evolution and driving factors of ecosystem service value in the Upper Minjiang River of China. Sci. Rep. 2024, 14, 23398. [Google Scholar] [CrossRef] [PubMed]
  36. Han, B.; Ouyang, Z. The comparing and applying Intelligent Urban Ecosystem Management System (IUEMS)on ecosystem services assessment. Acta Ecol. Sin. 2021, 41, 8697–8708. [Google Scholar]
  37. Liu, Y.; Liu, Y.; Xu, P. Evaluation on Ecological Security of Regional Land Resources: A Case Study of Jiaxing City, Zhejiang Province. Resour. Sci. 2004, 26, 69–75. [Google Scholar]
  38. Hu, C.; Guo, X.; Lian, G.; Zhang, Z. Effects of Land Use Change on Ecosystem Service Value in Rapid Urbanization Areas in Yangtze River Deltaa Case Study of Jiaxing City. Resour. Environ. Yangtze Basin 2017, 26, 333–340. [Google Scholar]
  39. Deng, X.; Xu, Y.; Han, L.; Li, G.; Wang, Y.; Xiang, J.; Xu, G. Spatial-temporal changes of river systems in Jiaxing under the background of urbanization. Acta Geogr. Sin. 2016, 71, 75–85. [Google Scholar]
  40. Liu, J.; Liu, B.; Wu, L.; Miao, H.; Liu, J.; Jiang, K.; Ding, H.; Gao, W.; Liu, T. Prediction of land use for the next 30 years using the PLUS model’s multi-scenario simulation in Guizhou Province, China. Sci. Rep. 2024, 14, 13143. [Google Scholar] [CrossRef]
  41. Liang, X.; Guan, Q.; Clarke, K.C.; Liu, S.; Wang, B.; Yao, Y. Understanding the drivers of sustainable land expansion using a patch-generating land use simulation (PLUS) model: A case study in Wuhan, China. Comput. Environ. Urban Syst. 2021, 85, 101569. [Google Scholar] [CrossRef]
  42. Zhang, C.; Jia, Q.; Liu, Y.; Zheng, Z.; Gao, Y.; Li, K. Evaluation and multi scenario simulation of ecosystem service value in Zhengzhou Metropolitan Area based on PLUS model. Meas. Sens. 2024, 32, 101079. [Google Scholar] [CrossRef]
  43. Huang, C.; Zhou, Y.; Wu, T.; Zhang, M.; Qiu, Y. A cellular automata model coupled with partitioning CNN-LSTM and PLUS models for urban land change simulation. J. Environ. Manag. 2024, 351, 119828. [Google Scholar] [CrossRef] [PubMed]
  44. Jian, L.; Xia, X.; Liu, X.; Zhang, Y.; Wang, Y. Spatiotemporal variations and multi-scenario simulation of urban thermal environments based on complex networks and the PLUS model: A case study in Chengdu central districts. Sustain. Cities Soc. 2024, 115, 105833. [Google Scholar] [CrossRef]
  45. Ouyang, Z.; Zheng, H.; Xiao, Y.; Polasky, S.; Liu, J.; Xu, W.; Wang, Q.; Zhang, L.; Xiao, Y.; Rao, E.; et al. Improvements in ecosystem services from investments in natural capital. Science 2016, 352, 1455–1459. [Google Scholar] [CrossRef]
  46. Shu, C.; Meng, H.; Han, B.; Yang, H.; Pan, X.; Lin, L.; Ouyang, Z. Impact of precipitation factors on gross ecosystem product. Acta Ecol. Sin. 2023, 43, 1054–1063. [Google Scholar]
  47. Cai, W.; Shu, C. Integrating System Perspectives to Optimize Ecosystem Service Provision in Urban Ecological Development. Systems 2024, 12, 375. [Google Scholar] [CrossRef]
  48. GB/T 28592-2012; Grade of Precipitation. China Meteorological Administration: Beijing, China, 2012.
  49. DB33/T 2274-2020; Technical Specification for Accounting Gross Ecosystem Product (GEP)—Terrestrial Ecosystems. Zhejiang Province Market Supervision Administration: Hangzhou, China, 2020.
  50. Lin, Y.; Xu, W.; Li, P.; Wang, X.; Ouyang, Z. Assessing the realization of the values of ecosystem products:A case study of Lishui, China. Acta Ecol. Sin. 2023, 43, 189–197. [Google Scholar]
  51. Cole, S.; Moksnes, P.-O.; Söderqvist, T.; Wikström, S.A.; Sundblad, G.; Hasselström, L.; Bergström, U.; Kraufvelin, P.; Bergström, L. Environmental compensation for biodiversity and ecosystem services: A flexible framework that addresses human wellbeing. Ecosyst. Serv. 2021, 50, 101319. [Google Scholar] [CrossRef]
  52. Rasheed, S.; Venkatesh, P.; Singh, D.R.; Renjini, V.R.; Jha, G.K.; Sharma, D.K. Ecosystem valuation and eco-compensation for conservation of traditional paddy ecosystems and varieties in Kerala, India. Ecosyst. Serv. 2021, 49, 101272. [Google Scholar] [CrossRef]
  53. Wübbelmann, T.; Förster, K.; Bouwer, L.M.; Dworczyk, C.; Bender, S.; Burkhard, B. Urban flood regulating ecosystem services under climate change: How can Nature-based Solutions contribute? Front. Water 2023, 5, 1081850. [Google Scholar] [CrossRef]
  54. Grizzetti, B.; Lanzanova, D.; Liquete, C.; Reynaud, A.; Cardoso, A.C. Assessing water ecosystem services for water resource management. Environ. Sci. Policy 2016, 61, 194–203. [Google Scholar] [CrossRef]
  55. Fu, H.; Chai, B.; Jin, C.; Kang, H.; Zhang, Y.; Tan, X.; Wang, W. Response and prediction of ecosystem service values to land use change resulting from underground coal mining in high groundwater table areas: A case study of Jining City, China. Environ. Sustain. Indic. 2024, 23, 100441. [Google Scholar] [CrossRef]
  56. Luan, C.; Liu, R.; Zhang, Q.; Sun, J.; Liu, J. Multi-objective land use optimization based on integrated NSGA–II–PLUS model: Comprehensive consideration of economic development and ecosystem services value enhancement. J. Clean. Prod. 2024, 434, 140306. [Google Scholar] [CrossRef]
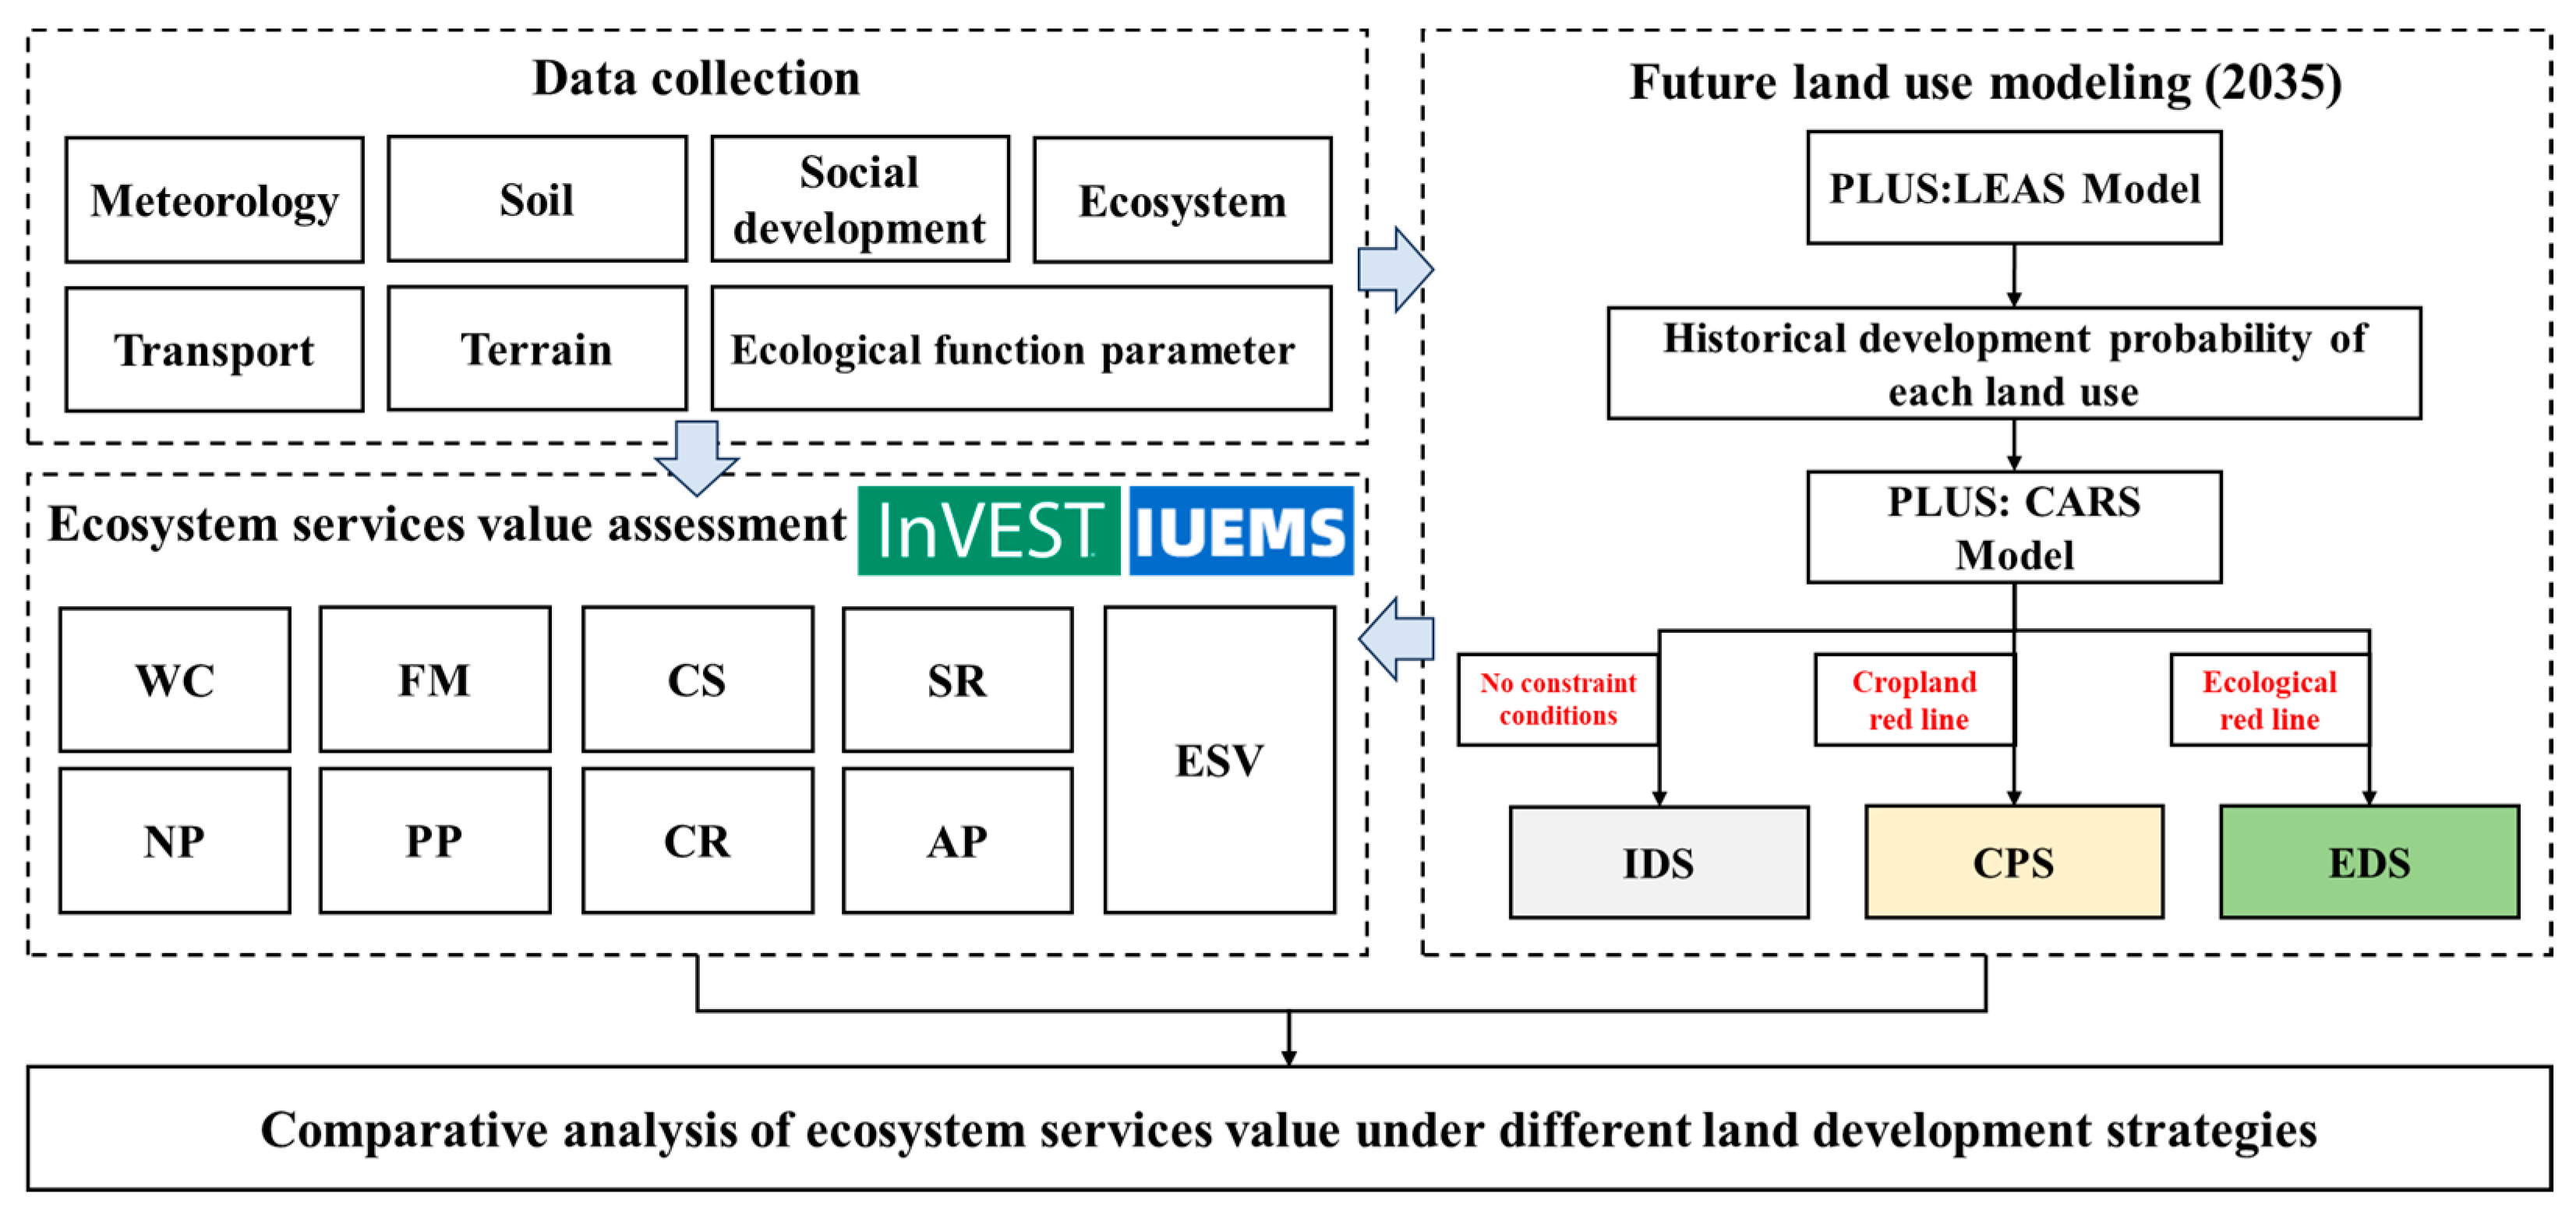
Figure 1. Research framework.
Land 13 01985 g001
Figure 2. Location map. (a) The location of Jiangsu, Zhejiang, and Shanghai provinces within China. (b) The location of Jiaxing within Jiangsu, Zhejiang, and Shanghai provinces. (c) The current land use distribution pattern in Jiaxing. Map Content Approval Number: GS (2019)1822.
Land 13 01985 g002
Figure 3. Distribution of ecosystem service value in 2020 (CNY/m2). (a) Water conservation. (b) Flood mitigation. (c) Carbon sequestration. (d) Sedimentation reduction. (e) Nitrogen purification. (f) Phosphorus purification. (g) Climate regulation. (h) Air purification. (i) Total value of ecosystem services.
Land 13 01985 g003
Figure 4. Each land use type’s growth probabilities.
Land 13 01985 g004
Figure 5. The values of each driving factor’s contribution.
Land 13 01985 g005
Figure 6. Land use distribution pattern under multi-development strategy. (a) The land use distribution pattern under the inertial development strategy. (b) The land use distribution pattern under the cropland protection strategy. (c) The land use distribution pattern under the ecological development strategy.
Land 13 01985 g006
Figure 7. Distribution of ecosystem service value under inertial development strategy (CNY/m2). (a) Water conservation. (b) Flood mitigation. (c) Carbon sequestration. (d) Sedimentation re-duction. (e) Nitrogen purification. (f) Phosphorus purification. (g) Climate regulation. (h) Air purification. (i) Total value of ecosystem services.
Land 13 01985 g007
Figure 8. Distribution of ecosystem service value under cropland protection strategy (CNY/m2). (a) Water conservation. (b) Flood mitigation. (c) Carbon sequestration. (d) Sedimentation re-duction. (e) Nitrogen purification. (f) Phosphorus purification. (g) Climate regulation. (h) Air purification. (i) Total value of ecosystem services.
Land 13 01985 g008
Figure 9. Distribution of ecosystem service value under ecological development strategy (CNY/m2). (a) Water conservation. (b) Flood mitigation. (c) Carbon sequestration. (d) Sedimentation re-duction. (e) Nitrogen purification. (f) Phosphorus purification. (g) Climate regulation. (h) Air purification. (i) Total value of ecosystem services.
Land 13 01985 g009
Table 1. Data used for ES assessment.
NumberDataYearResolutionData TypeData Source
1Land use and land cover2005, 202030 mRasterInstitute of Space and Astronautical Information Innovation, Chinese Academy of Sciences (https://data.casearth.cn/), accessed on 1 August 2024
2Soil Attributes Data (clay, sand, silt, organic matter content, nitrogen content, phosphorus content, soil bulk density)/1000 mRasterHarmonized World Soil Database v2.0 (https://www.fao.org/home/en/), accessed on 1 August 2024
3Ecosystem Type CN Values//TextLiterature data
4Digital Elevation Model/30 mRasterASTER GDEM V3
5Meteorological data (Precipitation, Temperature)2020/TextChinese Academy of Sciences Resource and Environmental Data Center (https://www.resdc.cn/), accessed on 1 August 2024
6Daily Heavy Rainfall Standards--TextChina Meteorological Administration GB/T28592-2012 [48], accessed on 1 August 2024
7Ecosystem Evapotranspiration Data2020500 mRasterThe Earth Science Data Systems (ESDS) Program (https://www.earthdata.nasa.gov/), accessed on 1 August 2024
8Carbon sequestration rates for various ecosystem types//TextStandard: DB33/T 2274-2020 [49], accessed on 1 August 2024
9Air pollutants purification rates for various ecosystems//TextStandard: DB33/T 2274-2020, accessed on 1 August 2024
10Heat consumption coefficients for various ecosystems//TextStandard: DB33/T 2274-2020, accessed on 1 August 2024
11Latent heat of evaporation//TextLiterature data
12Pricing of various ecosystem services//TextStandard: DB33/T 2274-2020, accessed on 1 August 2024
13Normalized Difference Veg-etation Index Data202030 mRasterChinese Academy of Sciences Resource and Environmental Data Center (https://www.resdc.cn/), accessed on 1 August 2024
Table 2. Data used for PLUS model.
TypePotential Driving ForcesAbbreviationData Source
Socio-economic factors1: PopulationPOPChinese Academy of Sciences Resource and Environmental Data Center (https://www.resdc.cn/), accessed on 1 August 2024
2: Gross domestic productGDP
3: Night-time lightNL
4: Proximity to railway stationPRSOpenStreetMap (https://www.openstreetmap.org/), accessed on 1 August 2024
5: Proximity to railwayPR
6: Proximity to trunkPT
7: Proximity to highwayPH
8: Proximity to primary roadsPPR
9: Proximity to secondary roadsPSR
10: Proximity to tertiary roadsPTR
11: Proximity to governmentPG
Climate and environmental factors12: Proximity to open waterPOWOpenStreetMap (https://www.openstreetmap.org/), accessed on 1 August 2024
13: Digital ElevationDEASTER GDEM V3
14: SlopeSLASTER GDEM V3
15: Annual mean temperatureAMTChinese Academy of Sciences Resource and Environmental Data Center (https://www.resdc.cn/), accessed on 1 August 2024
16: Annual precipitationAP
17: Soil typeSTHarmonized World Soil Database v2.0 (https://www.fao.org/home/en/), accessed on 1 August 2024
Disclaimer/Publisher’s Note: The statements, opinions and data contained in all publications are solely those of the individual author(s) and contributor(s) and not of MDPI and/or the editor(s). MDPI and/or the editor(s) disclaim responsibility for any injury to people or property resulting from any ideas, methods, instructions or products referred to in the content.