1. Introduction
Climate change has created significant challenges affecting the land use patterns and livelihoods of arid pastoralist communities. To better understand the complexity of social systems and ecosystems and to address the environmental challenges posed by climate change in arid regions for sustainable development [
1], it is necessary to further explore the interactions between social and ecological systems. In this regard, studies on land use and land cover (LULC) changes and traditional ecological knowledge (TEK) share a common perspective and goal.
LULC changes are an important technical tool for monitoring land use and representing the interactions between social systems and ecosystems on land. How people use land is a major driver of ecosystem change. On the one hand, as the population grows, frequent and extensive human activities drive the shift from natural vegetation to agricultural land [
2] or from agricultural land and natural vegetation to urban land [
3]. On the other hand, humans can enhance ecosystems through vegetation replacement and reforestation [
4], which, in turn, improves human life and influences social development by affecting the climate, the environment, and ecological functions [
5,
6]. Consequently, how humans use land and respond to LULC changes profoundly impacts social and ecological systems.
Remote sensing technology has become a crucial tool for monitoring LULC changes, and it serves as a substantial data source due to its advantages, including long-term monitoring capabilities, and a wide range of applications [
7,
8]. Most previous studies on LULC change have focused on exploring the intensity and trend drivers of LULC changes in specific regions using remotely sensed data, without considering the mechanisms of their impact on local societies. Although LULC studies are moving towards greater granularity to provide more accurate knowledge of the land in question with continued support from remote sensing technology, capturing and addressing the complexity and diversity of LULC changes and their wide-ranging impacts remain challenging. This is particularly true for community development, which often requires complementary demographic or economic data. For example, night-time lighting (NTL) data are used as an indicator of human activity and socioeconomic conditions instead of directly monitoring regional urban changes [
9,
10]. However, this does not substantially address the core issue of how people interact with nature or how social systems and ecosystems influence each other. Remote sensing data analyses still have limitations in interpreting non-spatial data to coherently explain the social reasons behind LULC changes and their impact on community development.
Therefore, this study attempted to incorporate TEK into the LULC assessment. The term is understood using the most classical definition by Berkes, in conjunction with terminology such as indigenous ecological knowledge (IEK), local ecological knowledge (LEK), and traditional ecological knowledge (TEK). TEK is a cumulative body of knowledge, practices, and beliefs, evolving through adaptive processes and handed down through generations by means of cultural transmission, concerning the relationships of living beings (including humans) with one another and with their environment [
11]. TEK, as a body of knowledge that can be used and updated to utilize and manage resources, necessitates a profound comprehension of local ecosystem processes and the interrelationships between communities and the environment. Consequently, TEK is well positioned to elucidate the intricate interconnections between specific social systems and ecosystems.
TEK has been extensively applied in research conducted in the field of ecology and is dedicated to the collaborative generation of knowledge, integrating diverse forms of knowledge to develop more effective solutions to the challenges posed by rapid global change and uncertainty [
12]. For instance, TEK has been instrumental in establishing trust mechanisms and addressing power imbalances in community-based participatory environmental monitoring [
13], highlighting the importance of local ecological knowledge for sustainable development [
14], incorporating the pluralistic values of local people into biodiversity conservation and sustainable development strategies [
15], interpreting the role of indigenous knowledge in complex relationships [
16], and addressing sensitivity to climate change [
17]. Despite the numerous studies that have confirmed the role and potential of TEK, it continues to provoke widespread skepticism and denial. For example, uncritical acceptance and romanticized claims undermine its actual usefulness [
18]. Alternatively, local ecological knowledge is not an active choice of local communities but a forced choice due to poverty [
19]. Furthermore, doubts about the scientific validity of TEK and its general applicability persist [
20]. Moreover, the field has paid less attention to pastoral societies, which are geographically dispersed [
21]. Therefore, if LULC changes monitored using remote sensing data and TEK strategies can corroborate each other, it will not only advance the understanding of the mechanisms by which LULC changes affect community development but also validate the scientific validity and application of TEK. Scientists have already begun to conduct research on the relationship between LULC data and local people’s perceptions, focusing on using TEK to test indicators of land degradation or refine information through participatory mapping.
For instance, participatory photo heuristics can be utilized to help herders identify indicators of pasture quality, which can then be combined with remote sensing data to assess land degradation in the region [
1]. Examples include using focus group interviews to refine participatory mapping for ecotype classifications [
22], testing a regional land degradation assessment using remote sensing and local knowledge (TEK), and modeling community-scale natural resources in South Africa using participatory mapping [
23]. However, it is important to recognize that local people should not be solely regarded as data providers; their response behavior is also crucial for maintaining sustainable development. Pastoralists, in particular, are the first responders and ultimate beneficiaries of understanding pasture dynamics.
In light of these considerations, in this paper, we propose a methodology for testing whether local people’s knowledge of livestock management effectively adjusts to land status. To elicit a comprehensive understanding that can be corroborated with other sources of evidence, we compare camel growth with land cover data, supplemented by interview data and the literature, to elucidate the process of change. The research objectives are threefold: first, to observe land cover changes in the study area and their possible impacts on communities; second, to trace LULC changes and livestock adjustments in recent years from the perspective of local people through interviews; and third, to understand the interrelationships between these changes and assess their relevance to local knowledge.
2. Materials and Methods
2.1. Study Area
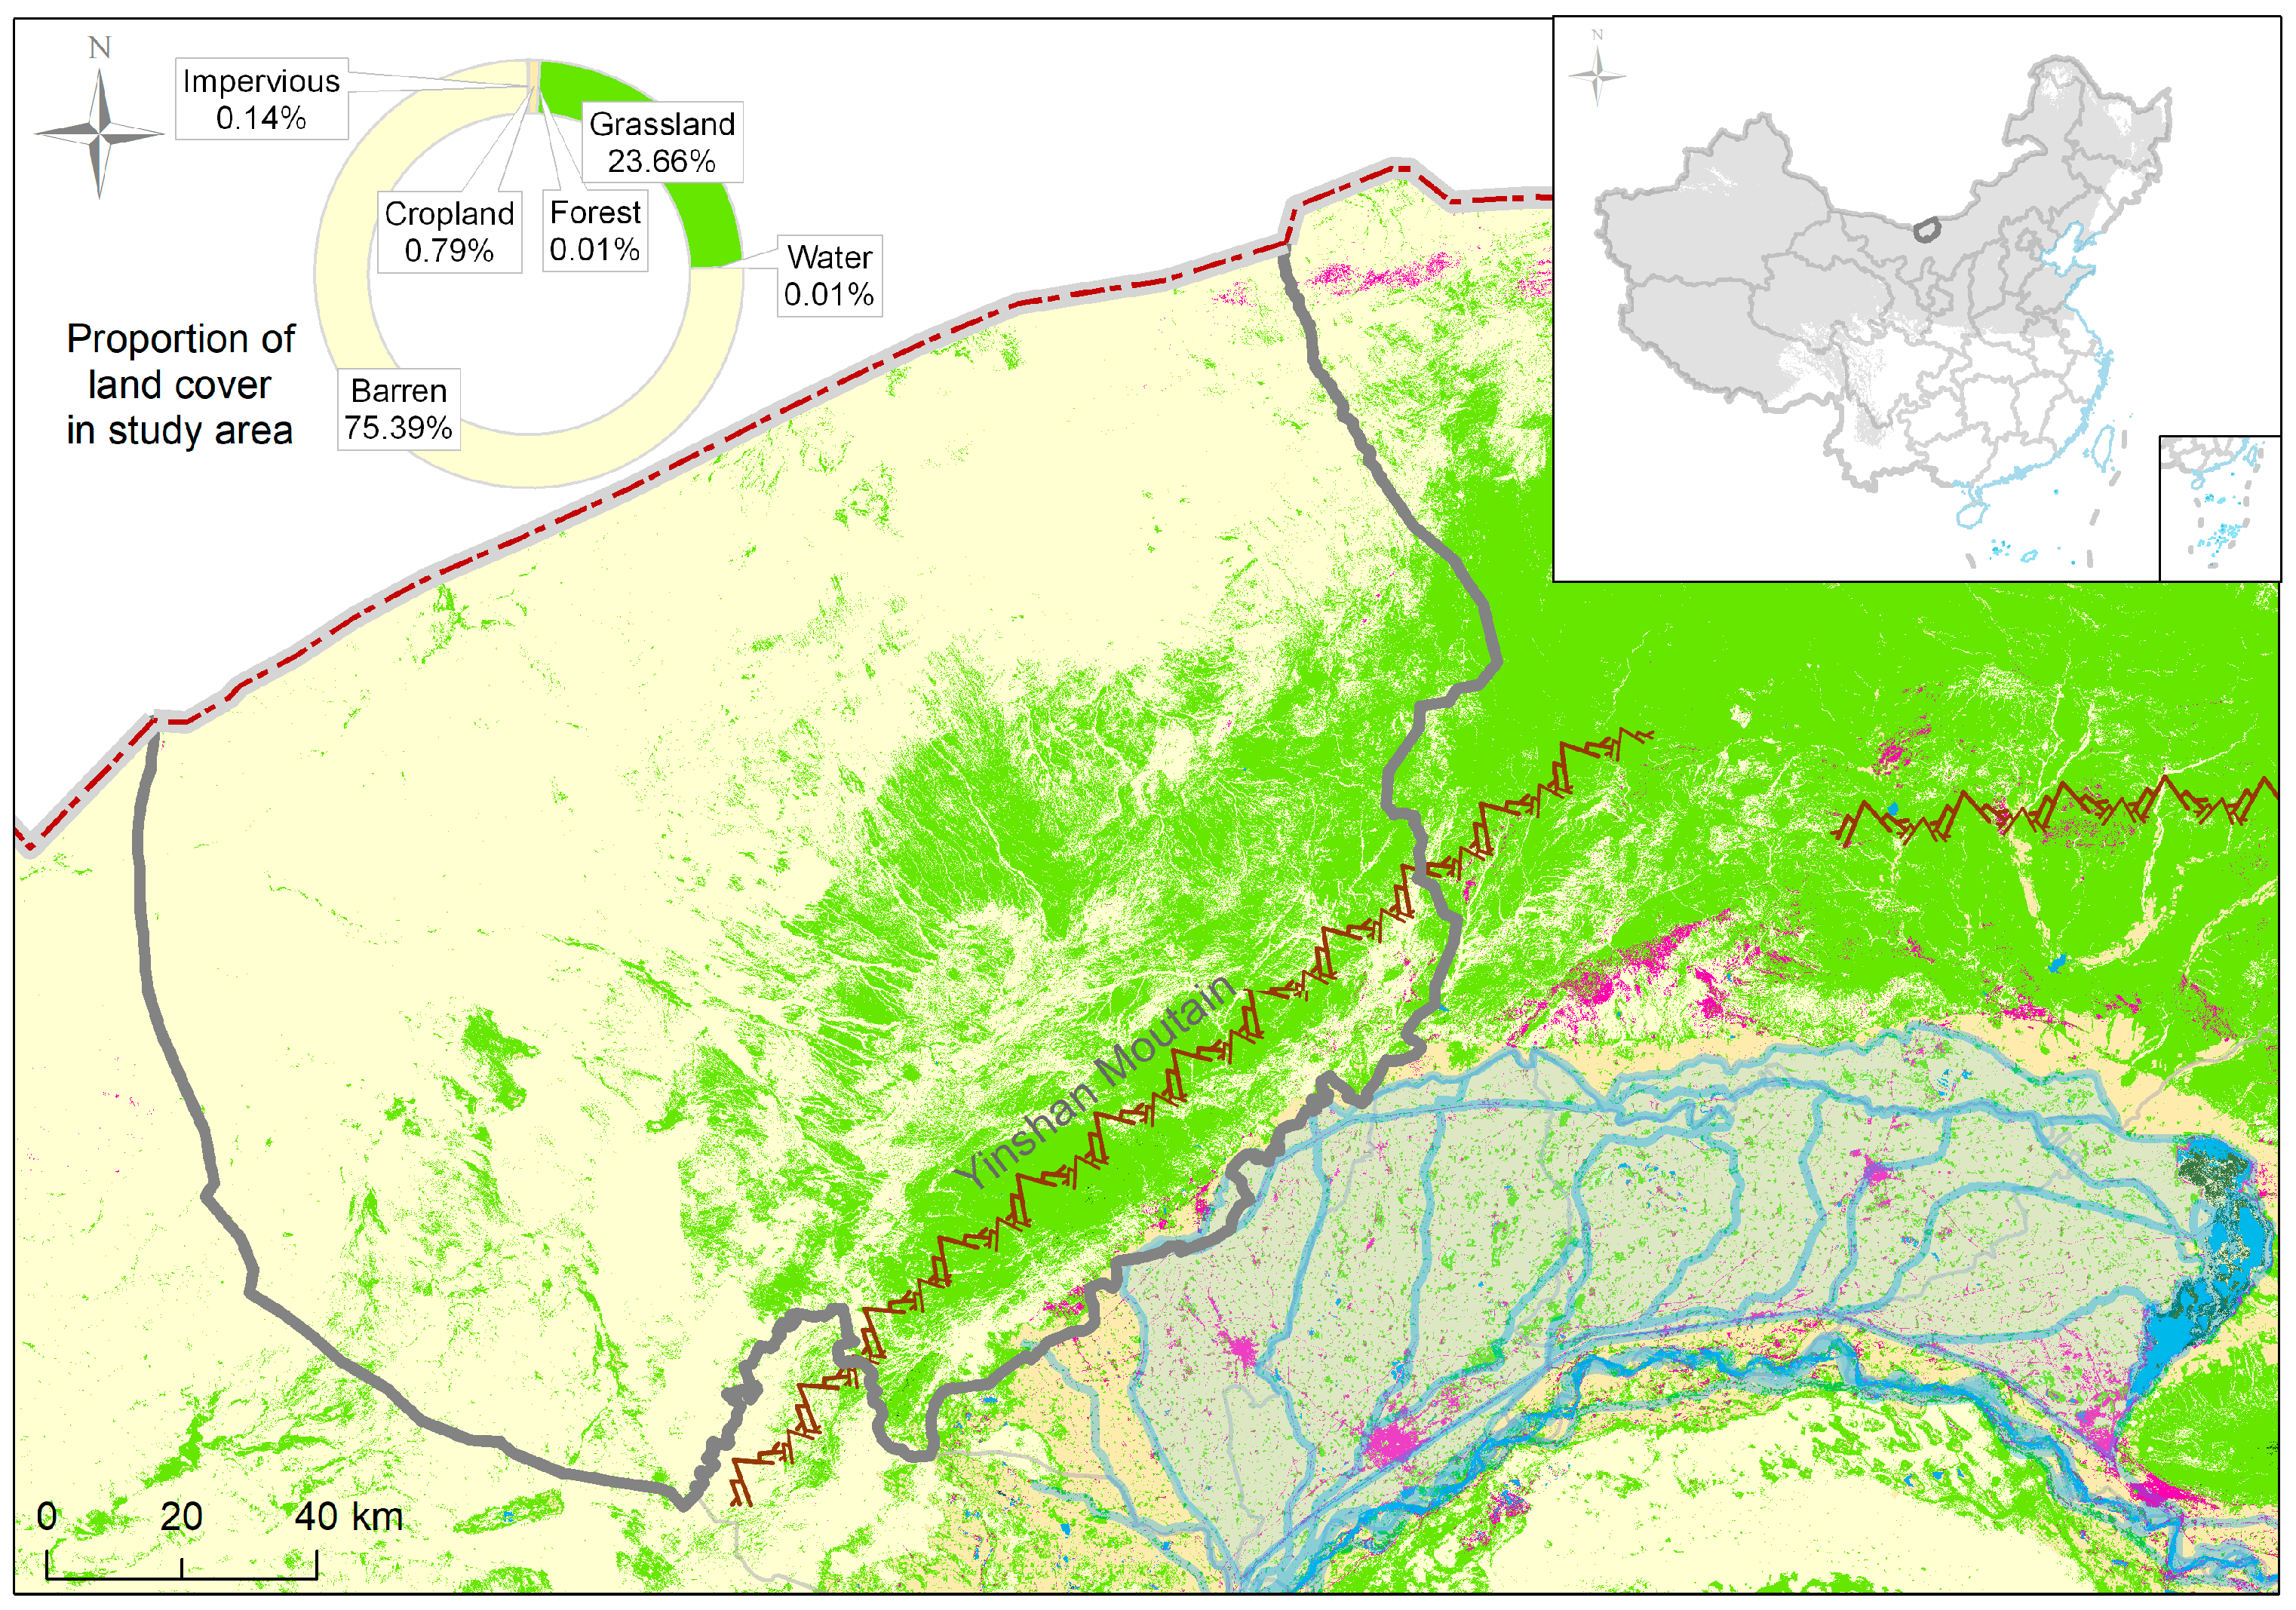
Urad Houqi (40°41′ 30″–42°21′ 40″ N, 105°8′ 20″–107°38′ 20″ E), the chosen study area, is located in the western part of Inner Mongolia, China. With a total population of 58,000 and a total area of about 24,925 square kilometers, of which about two-thirds is natural pastureland, it is an important part of the ecological security barrier of China’s northern border (
Figure 1).
The geomorphology of Urad Houqi is complex, with the Yinshan Mountains acting as a natural boundary. The area south of the Yinshan Mountains is mainly agricultural land, and the area north of them is mainly Gobi grassland. The Gobi grassland accounts for about 83.6% of the total area. Part of the Yinshan Mountains is mountain pasture, the grassland area north of the Yinshan Mountains accounts for a relatively small area, and typical Gobi Desert terrain accounts for a large area. The vegetation of the Gobi Desert is relatively sparse, mainly consisting of shrubs. The terrain is generally elevated in the south and relatively flat in the north, and it has a typical mid-temperate continental monsoon climate with long and cold winters, short spring and autumn seasons, hot summers, aridity, minimal rainfall and uneven distribution, and large sandy winds. In the region north of the Yinshan Mountains, livestock farming is the main form of livelihood. This includes the rearing of cattle, goats, sheep, horses, and camels. Dairy products, cashmere, and camel wool are produced. Generally, the locals consider horses and sheep to be more suited to typical grasslands, goats to mountain grasslands, and cattle to river grasslands. Horses are better suited to the Gobi Desert because they prefer the tips of young grasses, sheep and goats prefer the middle and upper parts of young grasses, cattle need to nibble on taller grasses, and camels prefer shrubs and saline vegetation. When the locals organize grazing, normally, horses and camels are kept in separate herds because of the difference in their movement speed and hoofs: horses are better suited to flat grasslands, while camels have broader hooves and are better able to cope with soft dunes. Cattle and sheep can graze together, with a similar movement speed and radius, as well as similar water requirements. In addition, when organizing a flock, goats are usually interspersed with sheep, as sheep have a simple temperament, and goats are more resourceful and can act as leaders, guiding the flock to spread out to forage, avoid risks, and return to camp on time. However, goats and sheep also have slightly different feeding habits, so mixed grazing also protects the pasture.
Since the 1980s, the region has experienced significant changes in livelihood and land cover patterns, along with climate change and desertification. This also makes it interesting to explore the relationship between herd adjustments by local people and land cover changes.
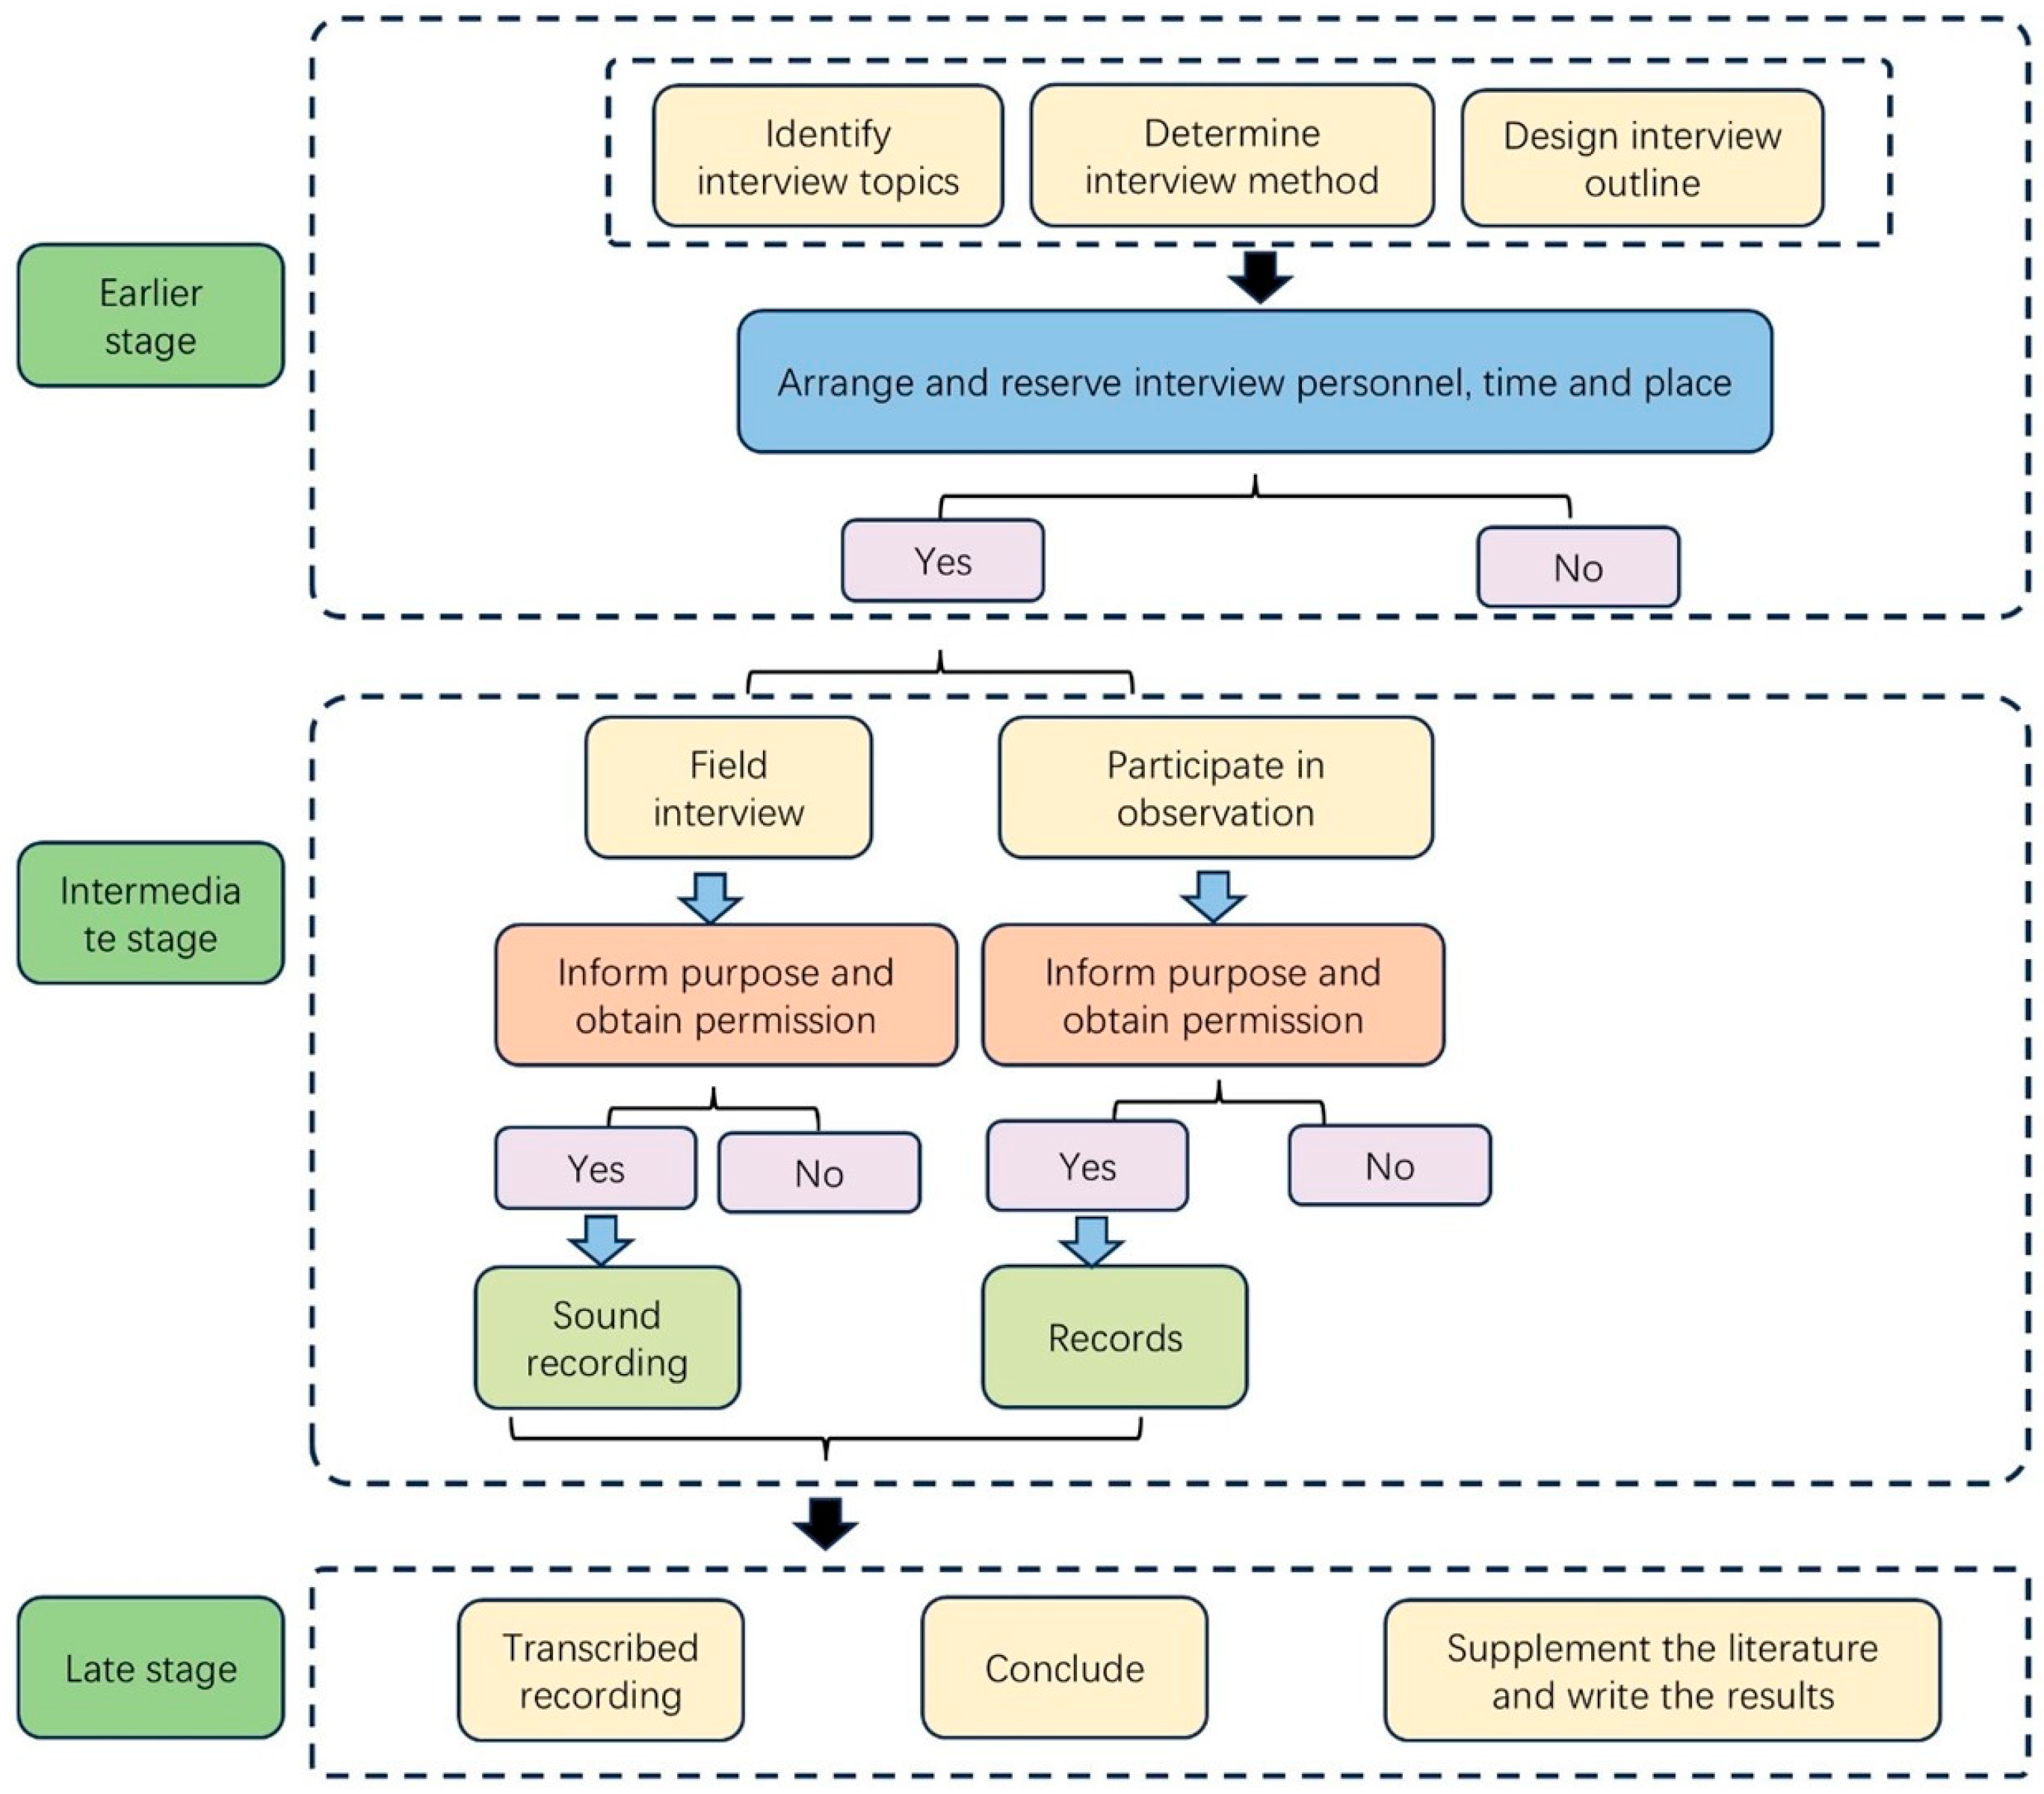
2.2. Access to Social Research Information
To incorporate TEK into the study, several trips were made to the study area between October 2019 and March 2024. Key informant interviews were conducted, alongside participant observation, to collect information on TEK from local pastoralists. In-depth key informant interviews were chosen as the primary form of data collection to effectively avoid sensitive issues and to facilitate the development of deep and open discussions. The participants were adult males and females aged >18 years with practical knowledge and extensive experience of camel herding. Specifically, interviews were conducted with 18 local key informants (
Table 1), and the discussion topics included their basic information, changes in livestock numbers, herd management strategies, and changes in climate and vegetation. This approach was used to collect data on local pastoralist traditions of camel use and management.
In addition to interviews, the researchers participated in the daily lives of the informants, observing camel herding and engaging in informal discussions. Participant observation allowed for data to be collected on the actual use and management of camels by local pastoralists, as well as the condition of camels in the area. This method bridged the gap between informant statements and actual behavior and was supplemented by local documentary evidence. Socioeconomic data, including the total number of livestock (no. of livestock), gross domestic product (GDP), and population (POP) data used in this study were obtained from the Inner Mongolia Statistical Yearbook and local statistics (
Figure 2).
2.3. Acquisition of LULC and Meteorological Data
LULC data from 1985 to 2020 (with a resolution of 30 m × 30 m) were obtained from product data 1.0.2 from Yang and Huang at Wuhan University [
24]. The dataset is an annual land cover product of China (CLCD) constructed from 1985 to 2023 using Landsat images on the Google Earth Engine. This dataset has an overall accuracy of 79.31% and has been widely used to assess LULC [
25]. The dataset includes six primary land types: cropland, forest, grassland, water, impervious land, and barren land. The following social statistics’ time series are consistent with the dataset, which includes time series from 1985 and 1990 to 2020; vector data of administrative boundaries, roads, and settlements (1:1,000,000) were obtained from the National Geographic Information Catalogue Service of the Ministry of Natural Resources of China. Meteorological datasets for the period 1985–2020 were obtained from the Agro-meteorological Big Data System V1.6.4 Ground-Based Meteorological Stations Data (
http://www.wheata.cn/), and the data include the mean annual temperature (MAT), mean annual precipitation (MAP), and mean annual wind speed (MAWS), which were retrieved on 20 March 2024. The WheatA system integrates massive data resources such as FAO, NOAA, NASA, RSS, and Statistical Yearbook, covering global yearly/monthly/daily/hourly measured meteorological data [
26].
2.4. Statistical Analyses
2.4.1. Land Use Dynamic Degree and Land Use Transfer Matrix
LULC data were extracted using vectorization, mask extraction, and other steps in ArcGIS 10.8. Based on the LULC classification products of the study area from 1985 to 2020, the LULC types and changes, including the land use dynamic degree and land use transfer matrix, were analyzed to verify whether the changes in LULC over the last 30 years correspond with those described in the pastoralist interviews.
The land use transfer matrix was calculated as follows:
Here, Bij is the area of land use type i transformed into land use type j, and n is the number of land use types.
The single dynamic degree of LULC (
Ds) and the dynamic degree of comprehensive LULC (
Dc) were calculated as follows:
Here, Ua and Ub are the amount of a certain land use type at the beginning and end of the period, respectively, and T is the length of the study.
2.4.2. Land Use Degree Index and the Multiple Linear Regression Method
The multiple linear regression method was used to estimate the relationships between the composite land use degree index (LUDI) and climatic factors, as well as socioeconomic indicators. Recognizing that multiple factors often interact, a multiple regression model for the dependent variable was used; the degree of geographic utilization was constructed based on the selected independent variables [
27]. Contributing variables were tested for statistical significance at
p < 0.05 to more accurately reflect the independent contribution of each variable to the dependent variable. The LUDI was calculated as follows:
Here, LUDI is the land use degree index value;
Ai is the class value of the degree of utilization of the
i-th land type;
Ci is the area of the
i-th land type;
C is the total area of the study area; and
n is the number of land types. In this study, based on previous studies [
28], the six land use types in the study area are divided into four classes: unused land is class 1; forest, grassland, water, and barren land are class 2; cropland is class 3; and impervious land is class 4.
The multiple regression model is as follows:
Here, Y is the dependent variable, i.e., the land use degree index (LUDI), and Xi represents the independent variables, i.e., the mean annual precipitation (MAP), mean annual temperature (MAT), mean annual wind speed (MAWS), population (POP), gross domestic product (GDP), and total number of livestock (no. of livestock).
2.4.3. The Relationship Between Livestock Number Changes and LULC Changes
To examine the relationship between livestock number changes and LULC changes, we extracted data on goats and camels and conducted a Pearson correlation analysis with the main types of LULC changes, specifically grassland and barren areas, on a yearly basis. This analysis aimed to test whether herders’ adjustments to herd structure correlate with changes in land use types. Additionally, a t-test was used to assess the significance of the correlation coefficients. Statistical analyses were performed using SPSS Statistics 26 (IBM Corp. IBM SPSS Statistics for Windows. Released 2019; Version 26.0. Armonk, NY, USA: IBM Corp.).
3. Results
3.1. LULC Trends
The study area comprises six main LULC types, primarily grassland and barren land, which collectively account for approximately 99% of the total area, characteristic of the Gobi landscape. Cropland and impervious land are predominantly found in the plains south of the Yinshan Mountains, while a vast expanse of continuous pasture occupies the northern region of the Yinshan Mountains. The distribution of grassland gradually diminishes from the southeast to the northwest. Water bodies are scarce, primarily situated in the Yellow River Basin.
To visualize the structural characteristics and conversion relationships of the LULC, we calculated the LULC conversion matrix to depict the transitions between different LULC types in the study area.
Between 1985 and 2000, the LULC changes in grassland rangelands showed a relatively flat performance overall, with a dynamic degree of comprehensive LULC of 0.06%. Specifically, the grassland area experienced a net increase of approximately 107.84 km2, with a single dynamic degree of LULC of 0.10%, indicating a trend of grassland expansion. Concurrently, the barren land area showed a decreasing trend, with a decrease of 110.93 km2 and a single dynamic degree of LULC of -0.04%, suggesting an alleviation of desertification. Additionally, there was a notable increase in the impervious land area, with a gain of 4.96 km2 and a single dynamic degree of LULC of 3.01%, reflecting rapid impervious land expansion.
Regarding land type conversions, 1052.41 km
2 of grassland shifted to barren land, while 1156.37 km
2 of barren land shifted to grassland, indicating a significant inter-conversion relationship between the two. The increase in grassland was predominantly concentrated in the northeast to southwest area in the form of scattered bands, whereas the increase in barren land was mainly concentrated in the diagonal area from northeast to southwest towards the south, exhibiting a more fragmented pattern (
Table 2).
The comprehensive LULC dynamic degree notably increased to 0.57% between 2000 and 2020, indicating an accelerated trend in land use change. During this period, the grassland area decreased significantly by 1395.46 km2, with a single dynamic degree of LULC of −0.97%, indicating a substantial shift of grassland to barren land and fragmented conversion to cropland and impervious land. Additionally, the barren land area increased by 1334.15 km2, and cropland increased by 41.81 km2, with single dynamic degrees of LULC of 0.39% and1.38%, respectively, indicating expansion in both barren land and cropland. The impervious land increased by 18.42 km2, with a single dynamic degree of LULC of 5.78%, indicating rapid growth in impervious land.
The conversion from grassland to barren land totaled 2258.01 km
2, that to cropland totaled 45.09 km
2, and that to impervious land totaled 8.02 km
2. Conversely, the conversion from barren land to grassland totaled 904.84 km
2, that to cropland totaled 11.94 km
2, and that to impervious land totaled 7.64 km
2. The increase in grassland was mainly concentrated in the central and western regions, while the increase in barren land was primarily concentrated in the diagonal area from northeast to southwest towards the south (
Table 3).
Overall, the grassland area in the study area transitioned from relative stability in 1985 to a gradual decreasing trend after 2000. Over the past 35 years, the most extensive changes occurred in the grassland type, with a single dynamic degree of LULC of −0.52%, resulting in a total area decrease of 1287.62 km
2, primarily represented by a shift to barren land. Conversely, the barren land area increased by 1223.21 km
2 with a single dynamic degree of LULC of 0.20%. Impervious land exhibited the highest rate at 6.08%, with an increase of 23.38 km
2, indicating significant expansion. Cropland increased by 40.39 km
2, while changes in water and forest land were less significant (
Table 4).
3.2. Traditional Ecological Knowledge Observations
On the issue of climate, 94.44% of the 18 respondents said that it was the increasing drought in recent years that
had had a major impact on land and livestock livelihoods. Of these, fourteen directly mentioned aridity, two mentioned a lack of water, and one mentioned bad crop years. On the issue of temperature, only 11.11% said that there had been a significant increase in temperature, and the rest did not mention it. Additionally, 61.11% said there was too much wind and sand, while the rest did not mention this. Furthermore, 77.78% thought that the number of camels had increased, while the rest did not mention this. Regarding the vegetation situation, 72.22% of the respondents thought that the vegetation had deteriorated, 16.67% did not mention it, and only 11.11% thought that it had improved. This is because this group of respondents was interviewed in 2019, and the improvement mentioned was relative to previous times when it was drier; for example, “Vegetation has recovered compared to 2002”. On the issue of rainfall, no one explicitly stated that rainfall had increased, 88.89% thought it had decreased, and 11.11% did not mention it (
Table 5).
The reason for the lack of reference to temperature changes is that, locally, the term aridity implies a state of low rainfall and, hence, the dryness of grass and trees, but local people believe that vegetation will recover as soon as it rains. In this way, rainfall compensates for temperature problems in the arid Gobi region. “The year before last, last year was a whole year of drought, last year the beginning of the spring was also a drought, could not grow grass, and then it rained before the grass grew up, last year the grass grew okay. But this fall the grass is still not growing, too dry.”.
Concerning grassland changes, the participants believed that the main manifestation is that the land is not wet enough due to the decrease in rainfall, coupled with the greater wind and sand in the spring growing season, which affects the growth of vegetation. In recent years, droughts and sandy winds have made it difficult for herbaceous plants to survive, reducing the variety of plants in the grasslands, and years of prolonged drought have led to extensive degradation of the indigenous scrub, such as the widespread death of natural saxoul (Haloxylon ammodendron (C.A.Mey.) Bunge ex Fenzl) woodlands. “If it doesn’t rain, the grass doesn’t grow at all, and it’s only by the saxoul trees that we can live.”.
The main potential drivers of the changes in LULC that were mentioned were climate change, with reduced rainfall and frequent droughts considered to be the most important. There was also mention of the adverse impacts of the expansion of built-up lands, such as road construction and LULC changes due to wind and solar energy installations. “After 2000, the rains slowly became less. There used to be three or four, or two or three rains per year, now it may not even rain in some places, and it is only camel herding that can make a living, and it is probably difficult to make a living if you are herding goats”.
During the interviews, individuals mentioned a growing inclination towards restructuring their herds after 2000, with a preference for camel herding over goat herding. This preference stems from the arid conditions, with annual rainfall below 150~200 mm, making it challenging to sustain enough herbaceous plants to feed herbivorous goats. Camels, however, are accustomed to consuming shrubs, exhibit less dependence on drinking water, and boast better adaptation to the environment due to their drought tolerance. Consequently, camels are better suited to desert or barren land than goats and are more favored among pastoralists. “There used to be a lot of camels in the Gobi because they were practical for migration. Goats don’t go far when they migrate. Goats need water every day and camels can do without. After the 1990s, people moved to the cities, and for a while, there were very few camels. More recently, after 2010, there has been a huge increase in camel breeding. There was a time when there were a lot of goats, then the pastures were divided up and each family had a small piece of pasture, so the camels could not go far to feed and were not well adapted, so there was a time when there were very few camels.”.
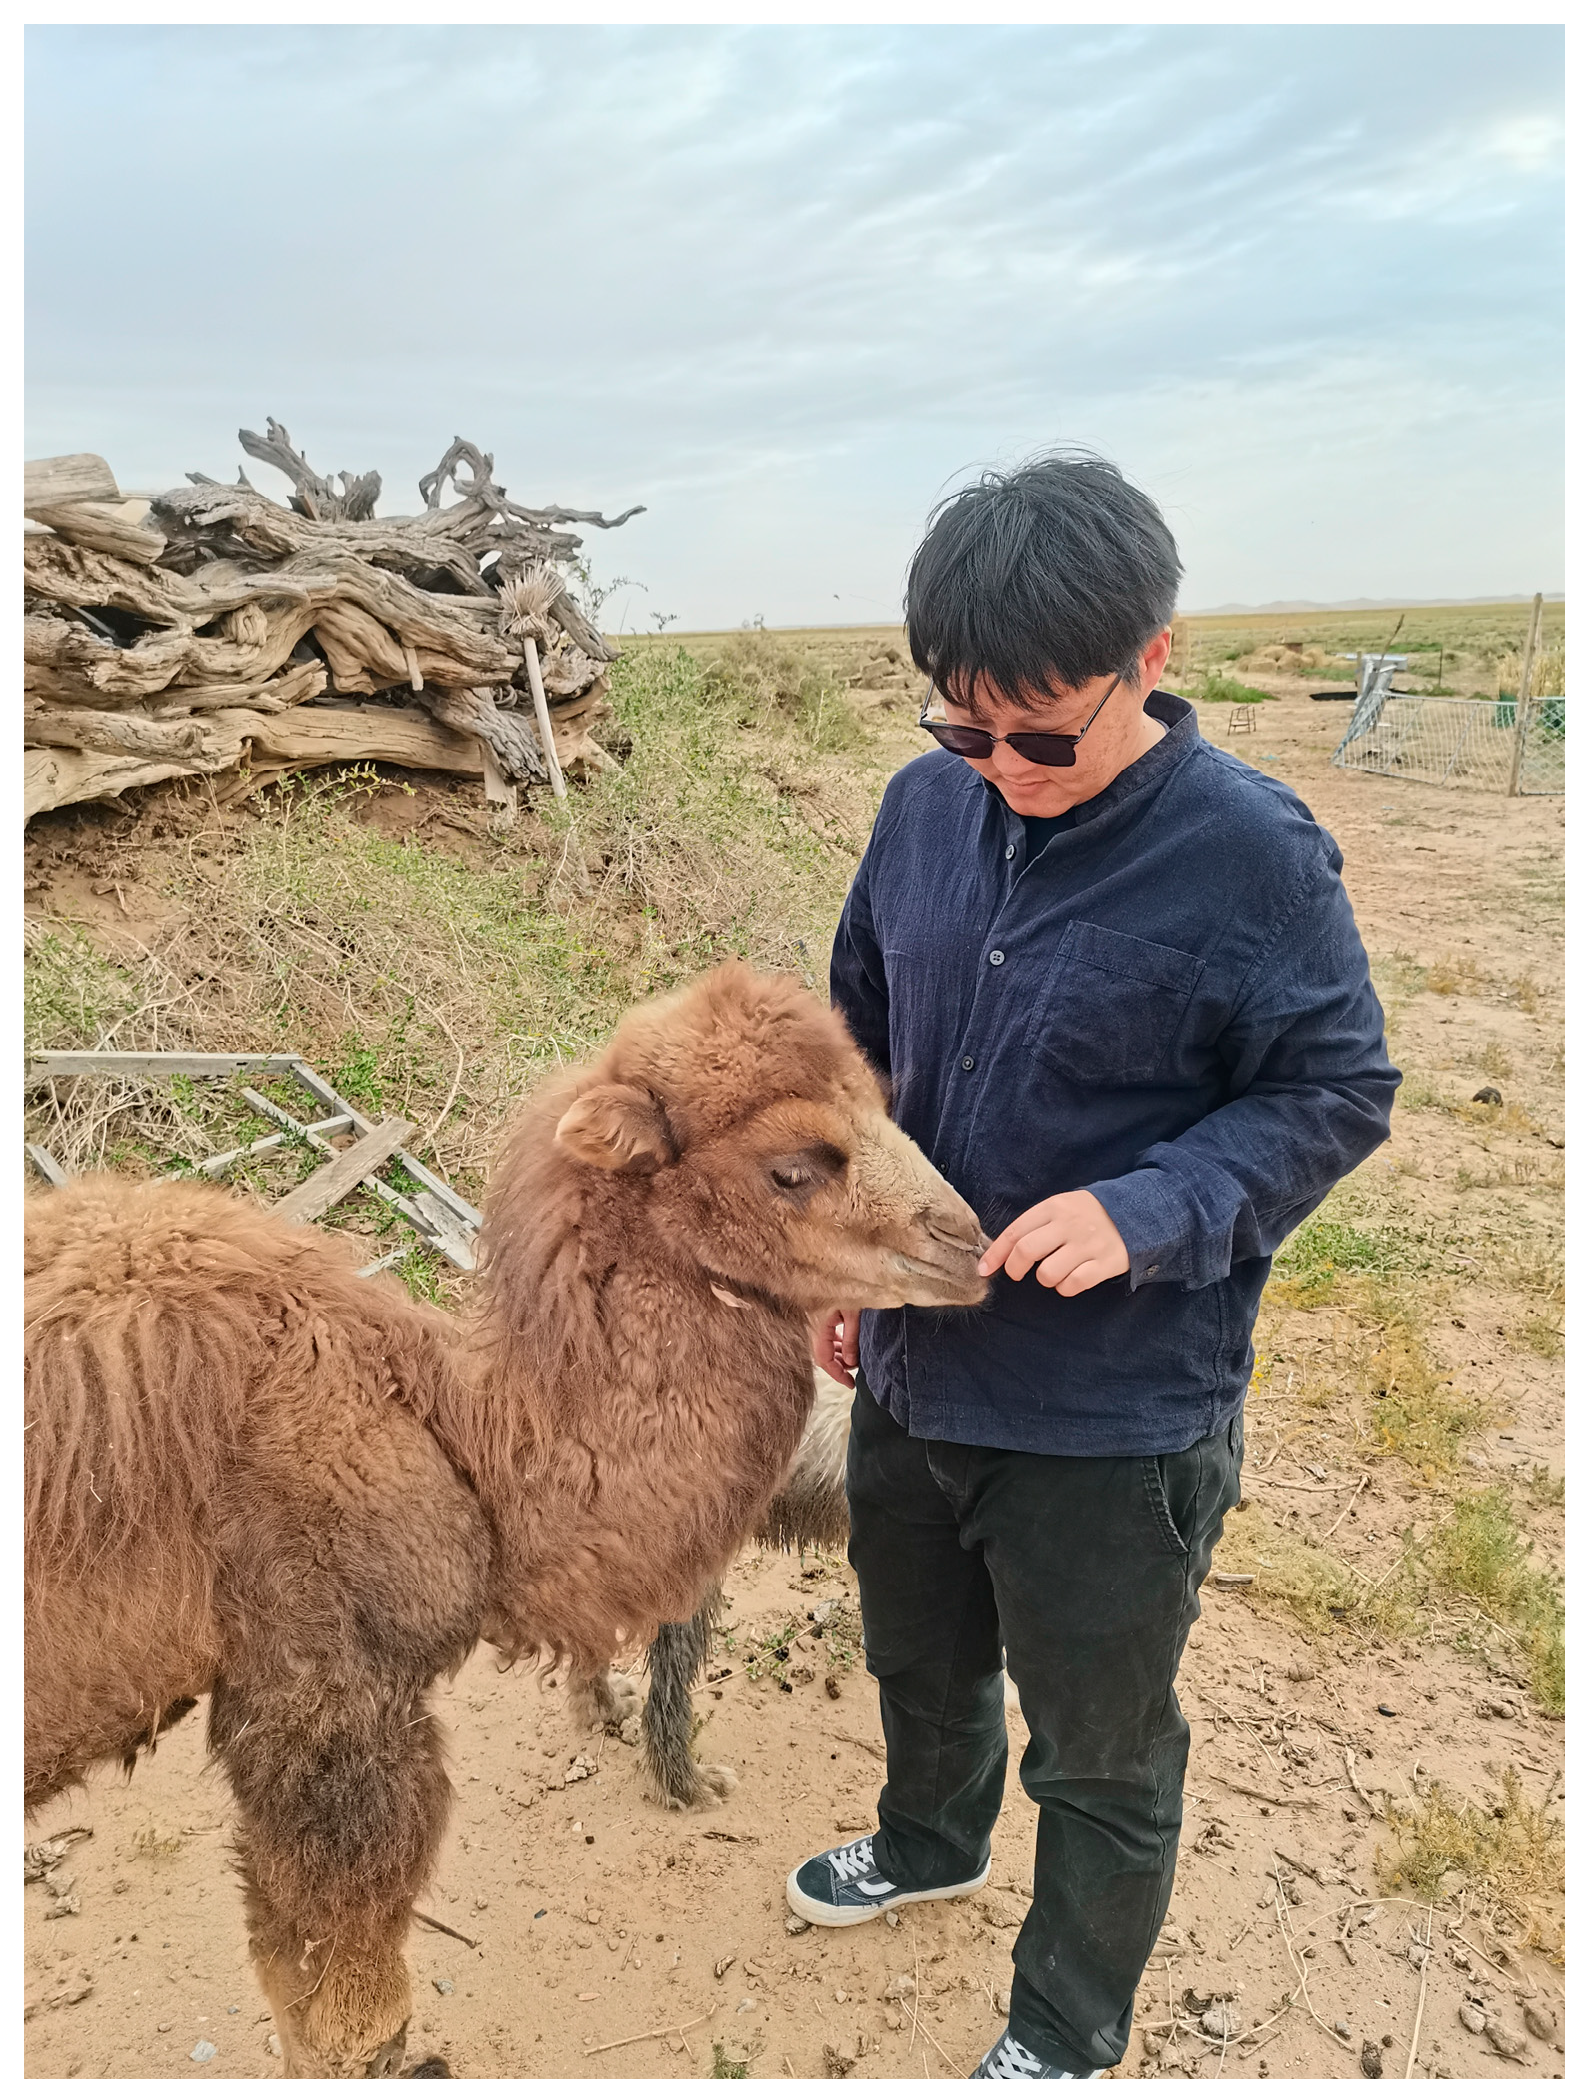
In addition, locally, camels are referred to as equals and are sometimes considered family members or companions. Sometimes camels are given names based on certain habits and characteristics, etc. (
Figure 3); “
We have been herding camels for generations and love them with all our hearts.”
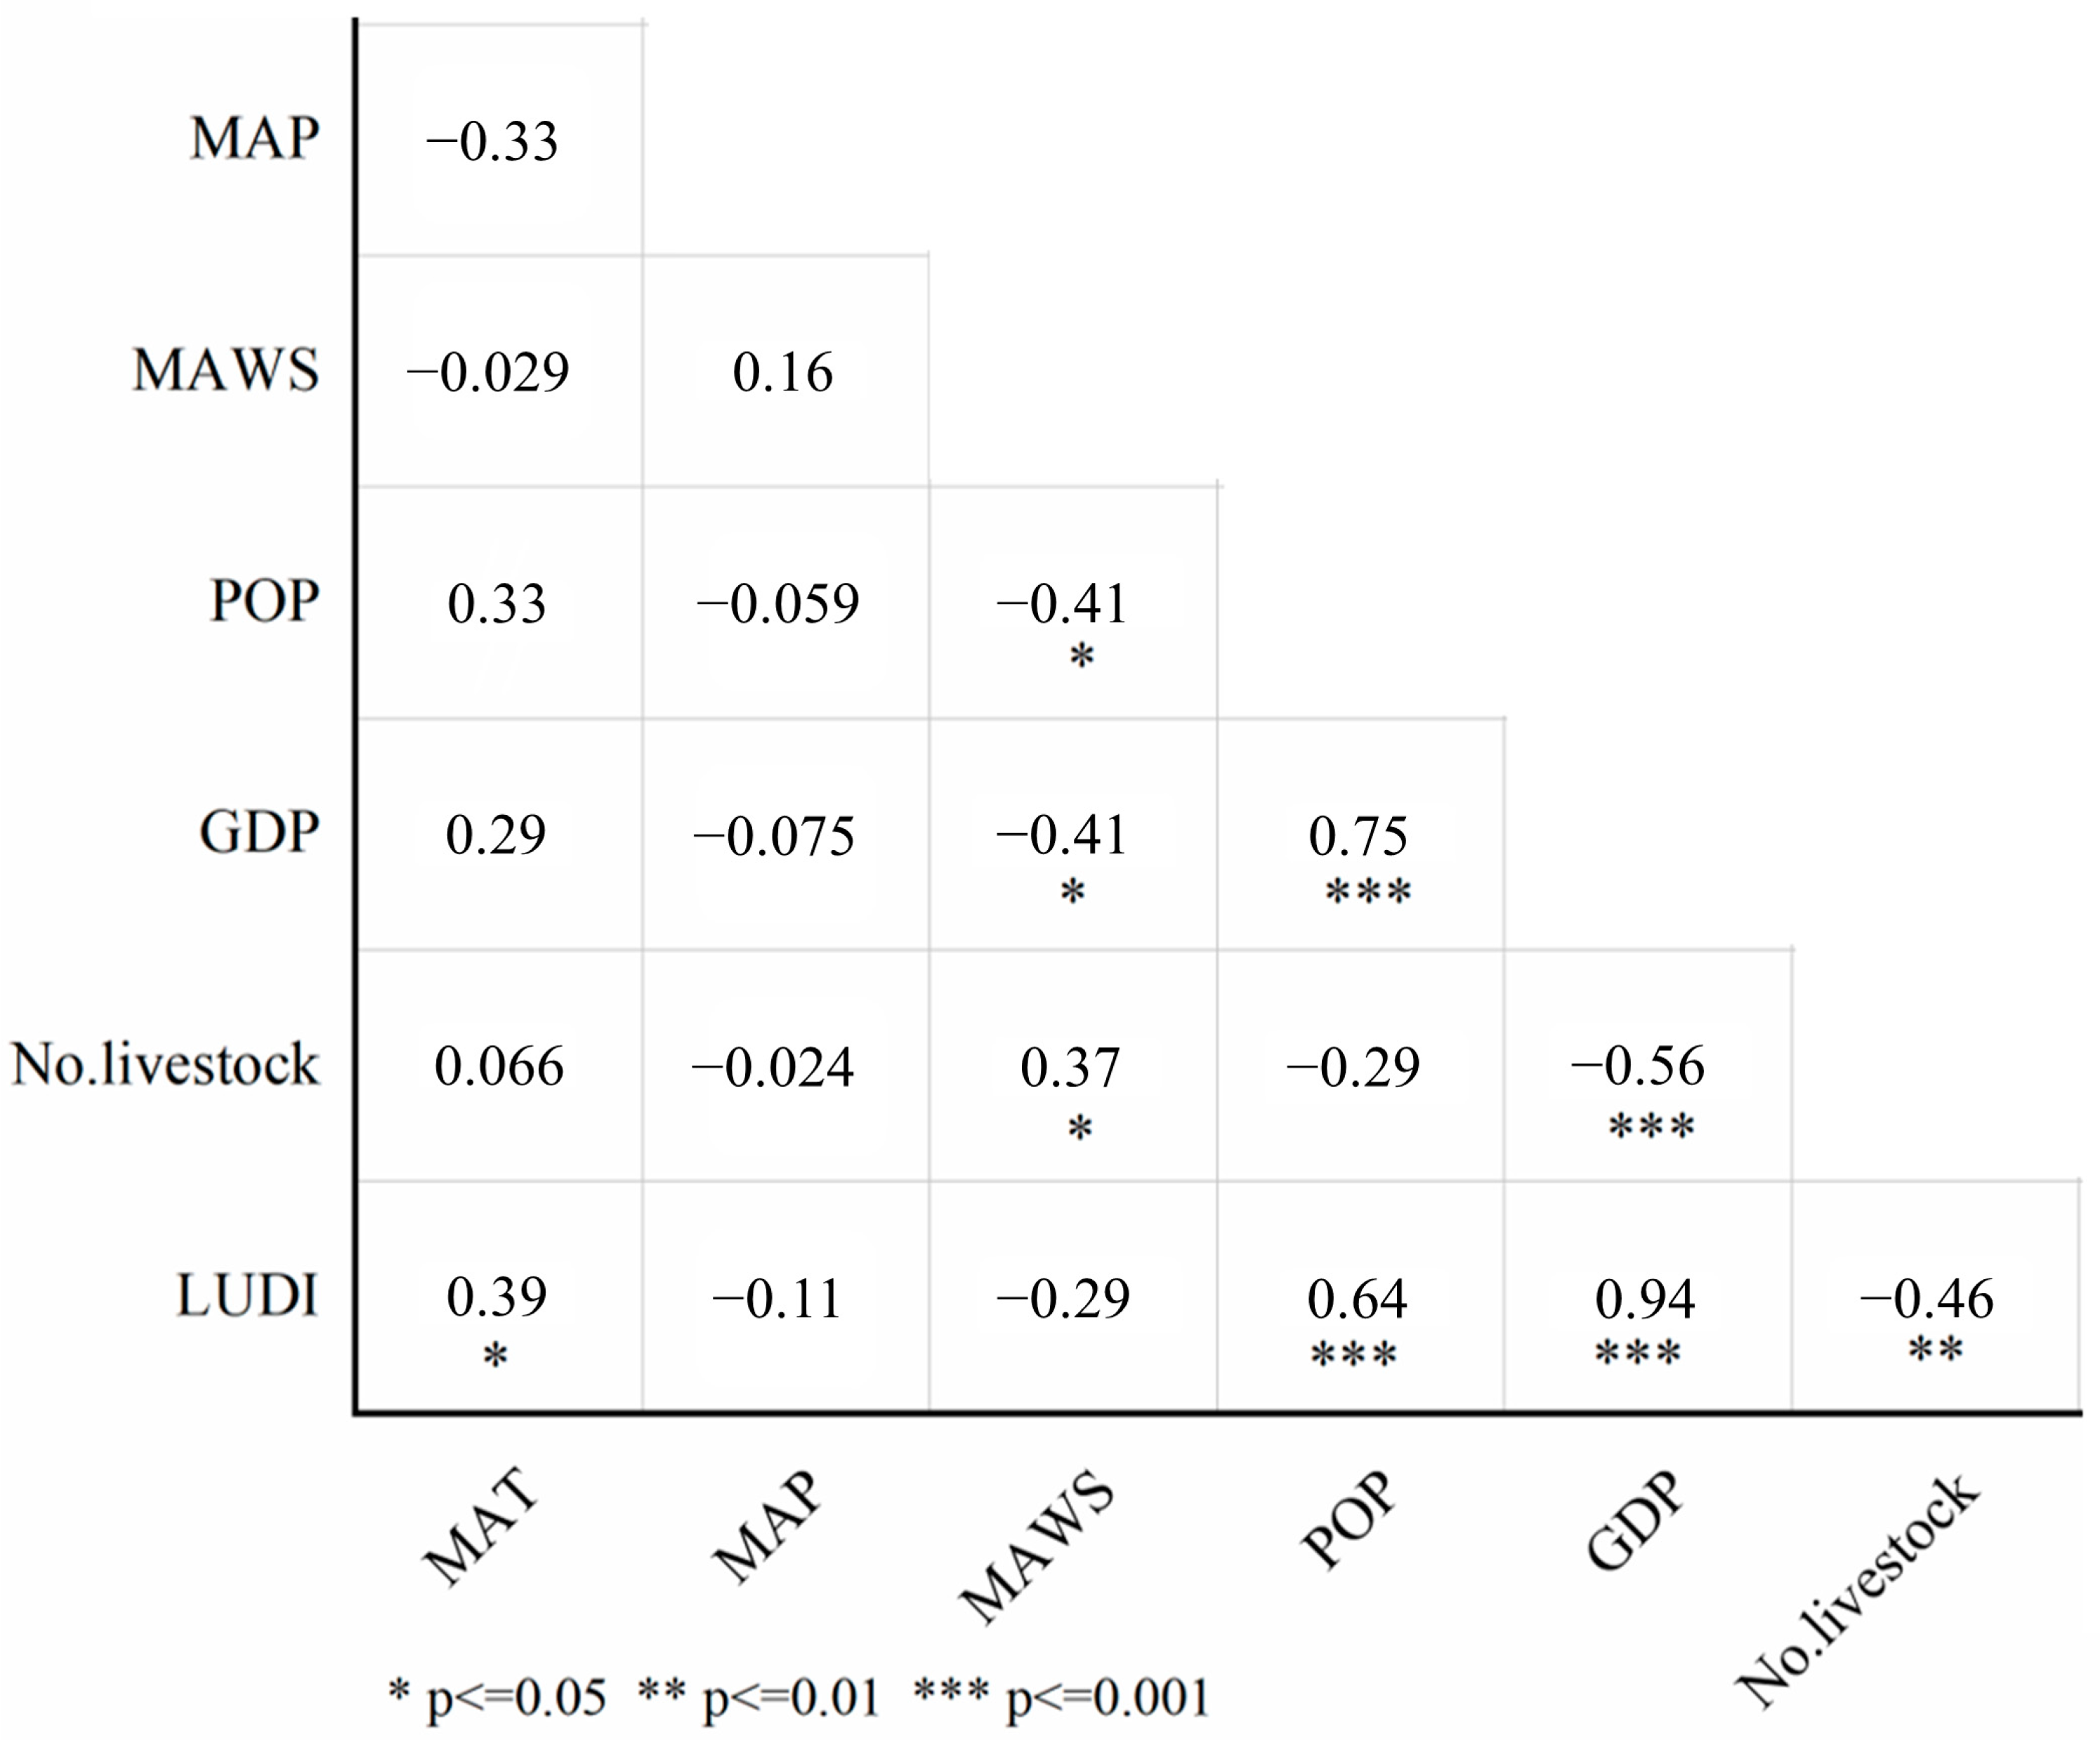
3.3. Land Use Change and Relative Contribution
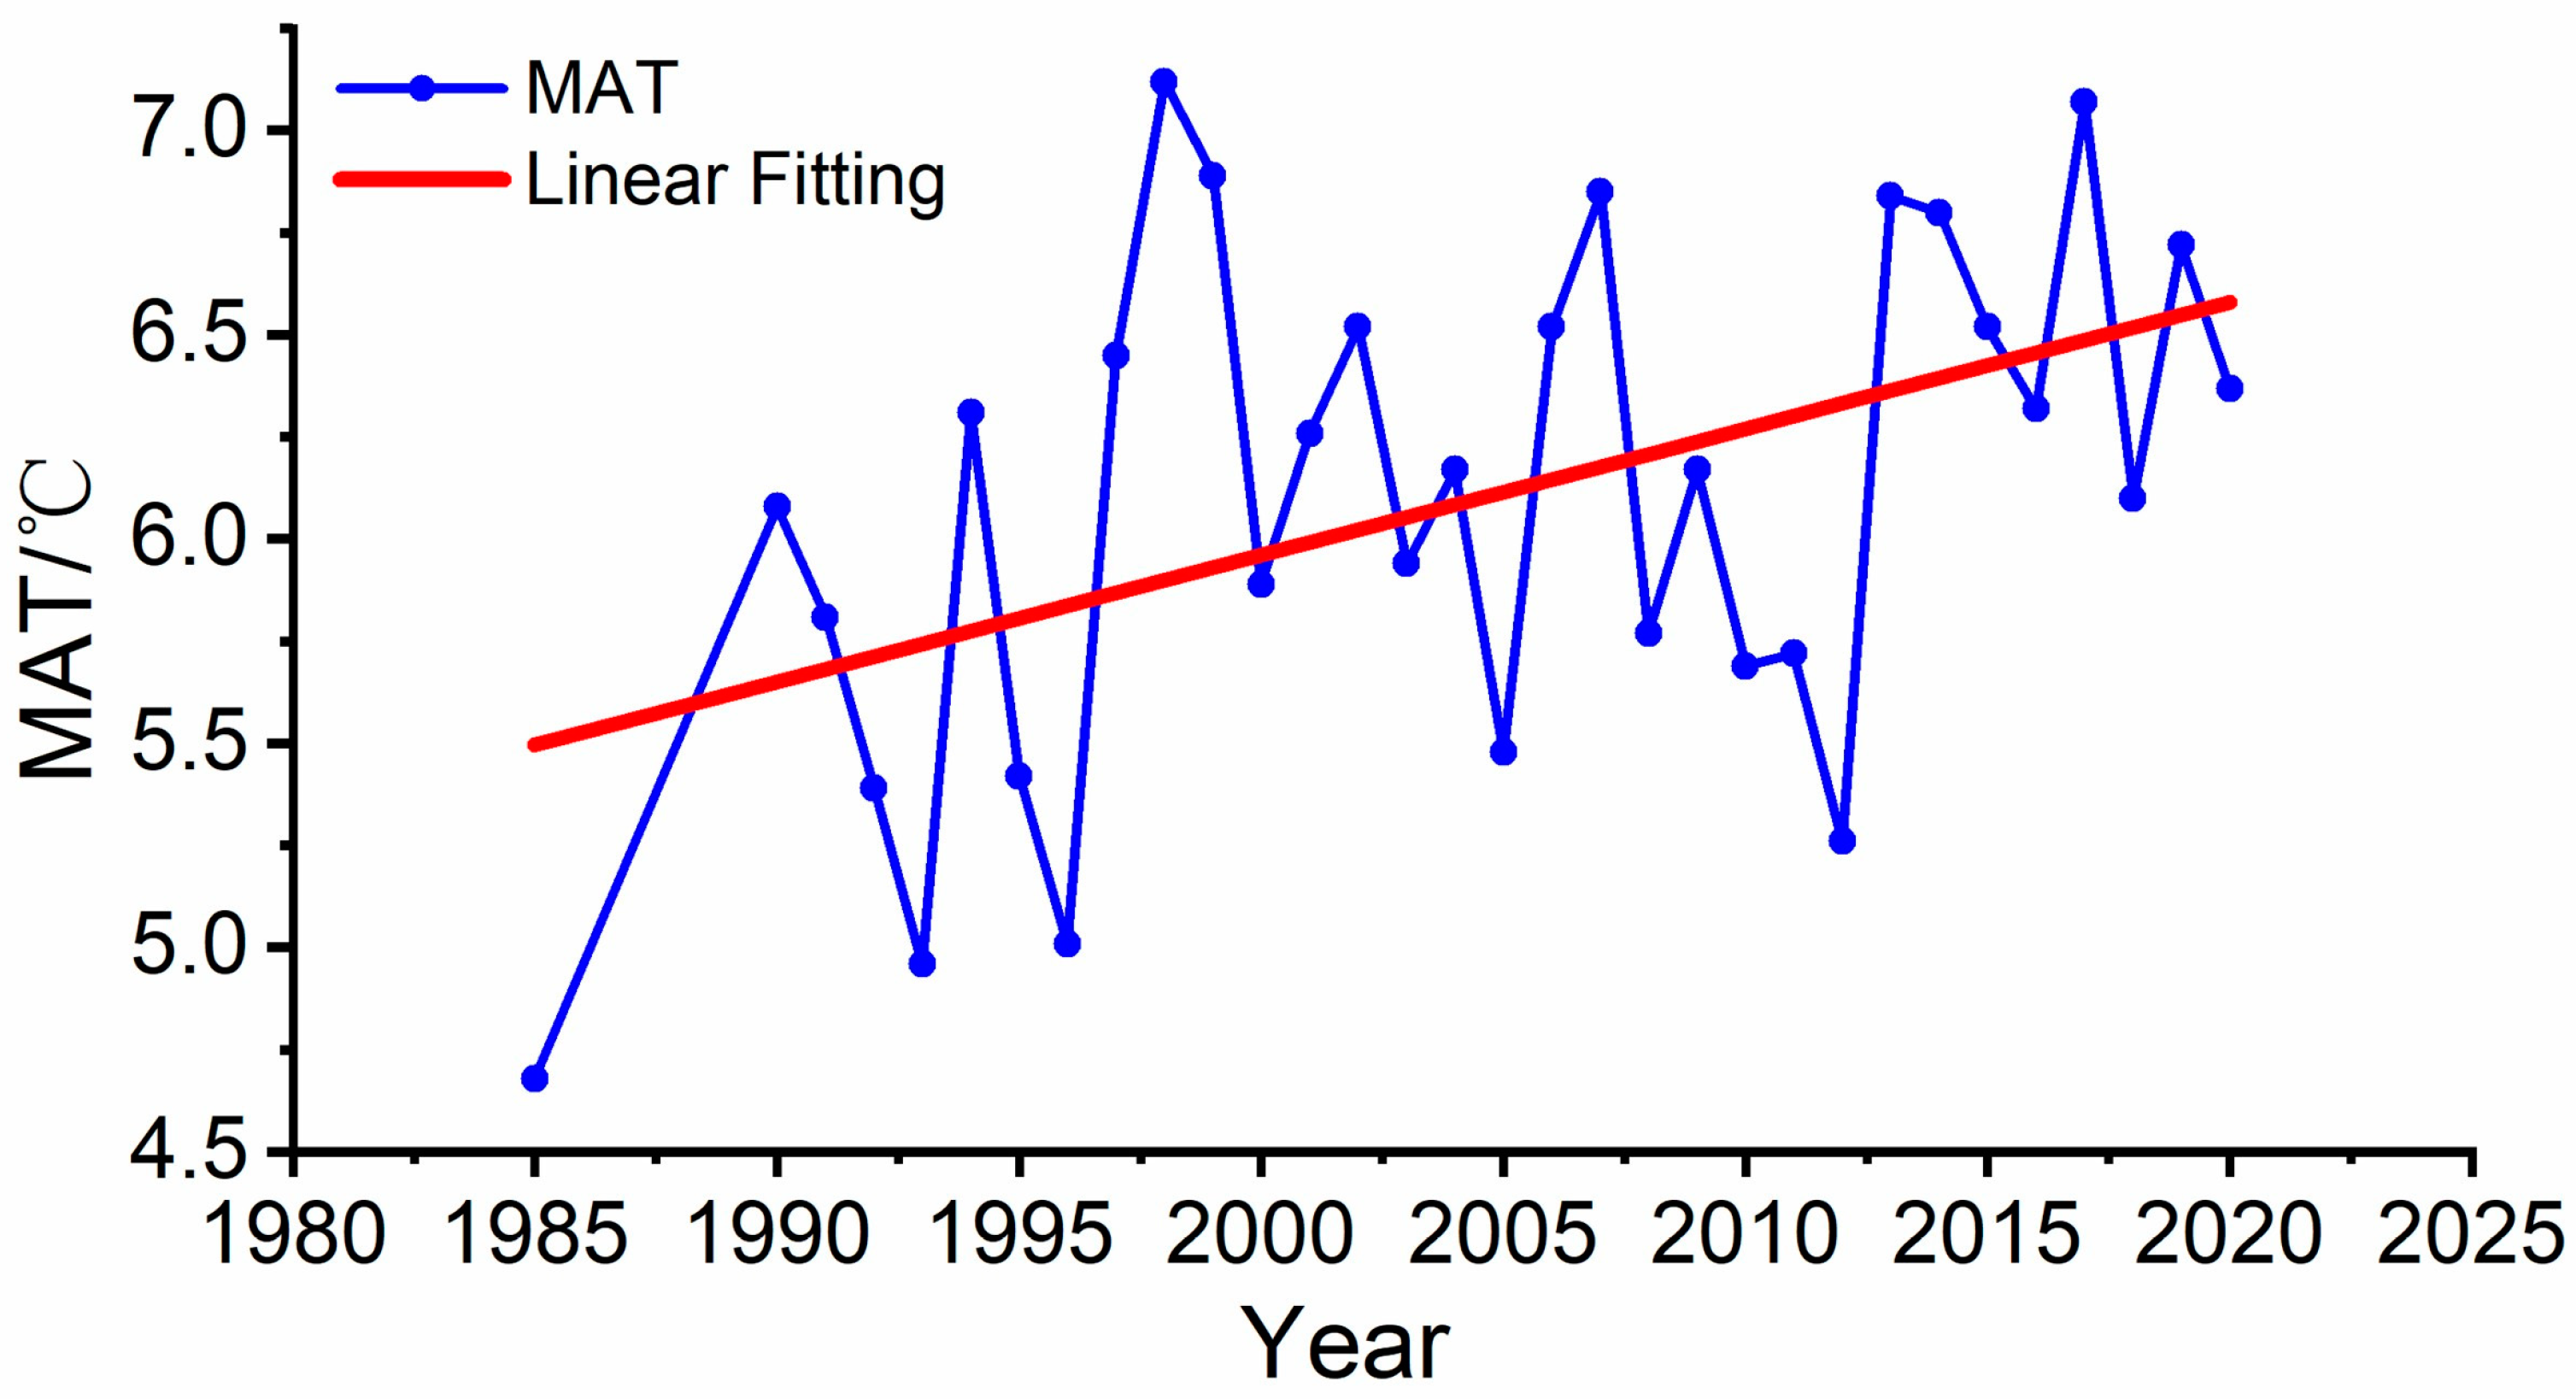
The degree of land use of the study area exhibited an increasing trend, particularly noticeable during the period from 2000 to 2020. Between 1985 and 2020, the degree of land use in the study area did not show a significant correlation with the MAP or MAWS. However, it demonstrated a significant positive correlation with the MAT (
Figure 4), POP, and GDP, while being significantly negatively correlated with the no. of livestock (
Figure 5).
Before conducting a regression analysis, we meticulously examined the drivers included in the model to mitigate potential multicollinearity issues. Multicollinearity could lead to model instability and weaken the explanatory power of the results. Thus, we calculated the variance inflation factor (VIF) for each driver and ensured that all VIF values were below 5. This step aimed to ensure the robustness of the regression model and provide a dependable foundation for subsequent analyses. The regression model demonstrated a high fit, with an adjusted
R2 of 0.92, indicating strong explanatory power. The
F-statistic of the regression equation was 57.54, with significance at the 0.01 level, suggesting that the explanatory variables of the model significantly affect the dependent variable. Additionally, the Durbin–Watson (DW) statistic, close to 1, indicates no significant autocorrelation between the residuals (
Table 6).
Consequently, the model suggests that, at a significance level of 0.05, the MAT, POP, and GDP all have a significant effect on LULC. Particularly noteworthy is the significant contribution of GDP at a 0.01 level of significance. The multiple regression analysis results imply that socioeconomic factors play a predominant role in driving LULC changes in the study area rather than livestock numbers.
3.4. Adaptation Relationship of Herd Structure
The camel population in the study area exhibited a gradual decrease from 1985 to 2000, followed by an increasing trend from 2000 to 2020. Conversely, goats displayed a clear upward trend from 1985 to 2000 but experienced fluctuation and decline from 2000 to 2020. To investigate whether pastoralists adapt to changes in land cover by adjusting their herd structure and to ascertain whether LULC changes impact pastoralists’ livelihoods, we calculated the representative numbers of goats and camels in the livestock between 1985 and 2020. We then compared these figures with the year-to-year areas of grassland and barren land, the main types of LULC changes. Pearson’s correlation coefficient (r) was computed, revealing that camels exhibited a positive correlation with barren land (r = 0.55, t-test p < 0.01) and a negative correlation with grassland (r = −0.55, t-test p < 0.01). Goats exhibited a negative correlation with barren land (r = −0.54, t-test p < 0.01) and a positive correlation (r = 0.55, t-test p < 0.01) with grassland.
Given the significant negative correlation between the degree of land use and livestock numbers in the region, we temporarily disregard the effect of livestock numbers on land use. Our findings indicate that pastoralists’ adjustments to herd structure, particularly their inclination towards herding more camels, are significantly correlated with a decrease in grassland areas and an increase in barren areas. This suggests that LULC changes driven by economic development can indirectly or directly impact local pastoral societies where pastoralism serves as the primary livelihood.
4. Discussion
Changes in livestock numbers over the past 35 years in the northern pastoral area of the Yinshan Mountains of Urad Houqi, along with changes in land cover, can offer a comprehensive explanation for the social causes and influences driving changes in LULC. This illustrates the effectiveness of integrating TEK with remote sensing data in exploring complex human–environment interactions.
4.1. Analysis of the Impact of LULC Changes on Local Livestock and Livelihoods
Our results indicate that the region experienced land use changes between 1985 and 2020, characterized by a significant reduction in the grassland area and a shift to other land types, particularly after 2000. Land use changes typically affect the provision of ecosystem services [
29], such as total primary productivity and effective evapotranspiration [
30]. Alterations in the diversity, productivity, and soil properties of grassland vegetation threaten the grassland’s ability to provide ecosystem services [
31], resulting in more fragile ecosystem functions.
Local pastoralists rely on livestock as their primary source of livelihood, with grassland serving as the principal source of fodder. Although local people can adapt their herd structures to different vegetation types, they still require sufficient grass to sustain their livelihoods. Therefore, a reduction in grassland not only leads to decreased ecosystem function and biodiversity but also constrains the development of local livestock and the well-being of pastoralists. However, previous studies on LULC have often focused on single aspects, such as the impact of environmental factors and human activities on land use change [
32] or the relevance of land use change to revegetation programs [
33], while neglecting the needs of local communities and the impacts and constraints of land use change on these communities, for instance, the impact of large-scale land use change on the livelihoods of pastoral communities, how local pastoralists cope with these changes, and the traditional knowledge and emotional factors that influence their coping strategies.
4.2. Interpretation of Changes in Camel Abundance and LULC Using TEK Observations
Before the reform of the GFRS in the 1980s and the implementation of multiple ecological policies around 2000, individuals living in these areas maintained traditional pastoral livelihoods for centuries [
34]. Camel herding is essential for long-distance nomadic pastoralism in arid areas. Consequently, there is a long history of camel husbandry practices, and the ecological knowledge of local people includes extensive knowledge and skills regarding camels. Camels are effective in withstanding drought, are less dependent on water, can move long distances, and are interdependent with locally grown shrubs. Therefore, they have significant potential in the face of climate change, providing a basis for their resurgence in popularity.
Secondly, the camel is a local symbol of status, wealth, and social position, and it serves as a link to rituals and social interactions. For example, it is common in the region to refer to a family as a camel-herding family, indicating wealth. Additionally, giving a camel to a bride is considered very generous. Camel races are held almost every year, and winning these races and camel beauty contests is considered a great honor. Thus, camel herding fosters social interaction and confers social status. Furthermore, rising temperatures have made local conditions more conducive to camel herding. Despite climate change and the loss of grasslands increasing the cost of raising camels, people still prefer camels over more marketable cattle and smaller livestock. This is particularly noteworthy. In arid environments, camels are believed to bring life and companionship, possessing significant emotional value. When the participants were asked why they chose to keep camels, the most common response was their cultural affection for them.
Finally, the rise in camel products has generated economic benefits. To create a wider market for camels, various camel products have been actively promoted locally. Camel milk is considered rich in nutrients and has significant market demand. Cold-chain logistics have significantly expanded the market for camel products. The promotion of camel products has diversified the income of pastoralists, thereby increasing the elasticity between land use intensity and the well-being of pastoralists.
4.3. Socioeconomic Factors Dominate Vegetation Change in the Region
Land use change in the study area may result from the combined effects of socioeconomic factors and climate change. Our results indicate that socioeconomic factors are the dominant influence, with temperature being the secondary factor. The counties were formally established in 1971. The urbanization process quickly attracted a large influx of foreign populations, leading to rapid development, economic growth, and industrial expansion. This further increased the population and built-up land, contributing to major LULC changes in the study area. These findings are consistent with those of other studies. Since 2000, grassland areas have been degraded and reduced due to economic development, policy changes, climate change, and increased human activities [
32,
35]. Similarly, after 2000, the average temperature in Inner Mongolia increased while precipitation decreased, leading to increased drought and suppressed vegetation growth [
36]. Consequently, large areas of grassland in Inner Mongolia were in a degraded state [
37].
Policy changes have also significantly driven land use change in the region. In 1978, the Chinese government initiated the ‘Three North Sheltered Forest Development Programme“ (TNSDP) [
38] to combat soil erosion and land degradation. At the same time, Inner Mongolia implemented the Grassland Family Responsibility System (GFRS) [
39] policy from the late 1980s into the 21st century. Restrictions on mobility, combined with the market-oriented context of livestock trade, fundamentally changed grassland use. The shift from nomadic to sedentary pastoralism led to homogenized grazing patterns and livestock structures, exacerbating the conflict between land use and conservation. For example, the number of goats increased in the 1990s, while the number of camels decreased, as the same area of pasture can support more goats than camels.
Around 2000, to restore the ecology, the Chinese government initiated projects such as the National Natural Forest Conservation Programme (NFCP) and the Returning Cultivated Land to Forestry Project (GFGP) [
40]. These projects aim to restore vegetation by reducing cropland and pasture areas and increasing planted forests. The implementation of large-scale projects typically leads to significant changes in LULC [
30]. Numerous studies have shown that ecological restoration plays a crucial role in the greening of vegetation in China.
However, studies have also shown that, in Inner Mongolia, warmer temperatures increase evapotranspiration, thereby increasing plant water stress and limiting dryland vegetation [
41]. This may further limit the effectiveness of the project in the region [
42], leading to a reduction in grassland areas under the influence of climate change.
4.4. Integrating the Two Methods of TEK Strategies and Monitoring of LULC Changes
Our study indicates that pastoralists’ TEK strategies align with land use monitoring results. This alignment may further encourage the integration of TEK with remote sensing techniques to address the complexity of LULC changes, including their social drivers and impacts. It can also enhance the evaluation of the applicability and validity of local knowledge, thereby promoting interdisciplinary and cross-situational cooperation. Integrating local experience is essential when studying dryland ecology and exploring sustainable approaches. Local people’s responses to climate and LULC changes are crucial for maintaining sustainable development, and their participation in conservation efforts is key to the successful implementation of projects. Local pastoralists’ adaptations to their herds and preference for camels may reflect the timeliness and effectiveness of TEK in responding to climate change and land use change, as well as their flexible practices suited to arid environments.
It is also important to openly discuss the possible limitations of TEK. Although camels are better able to adapt to drought and mitigate the crises caused by climate and land use changes, the persistence of increased drought, rising fodder prices, and higher mobility costs seem to be weakening this coping mechanism. This weakening is pushing pastoralists into a poverty crisis and increasing pressure on the land.
4.5. Limitations and Future Directions
Many challenges arise when using methods that corroborate TEK with remote sensing data. For instance, temporal and spatial biases exist, and local narratives may be influenced by recent feelings and memories. Specifically, observational data outside of interviews cannot be easily quantified. Conversely, while remotely sensed data and statistics offer considerable advantages in quantitative representation, they may underestimate certain details after discretization or standardization. For instance, a coarse spatial resolution limits the detection of richer and finer details. If population growth drives land use change, how can the proportion of the population engaged in pastoralism be accurately understood? Nevertheless, combining these approaches to complement each other’s strengths can yield more detailed assessments, offering a valuable exploration for comprehensively understanding land change and formulating land policies.


