Abstract
The effects of integrated nutrient-management (INM) practices on soil quality are essential for sustaining agro-ecosystem productivity. The soil quality index (SQI) serves as a tool to assess the physical, chemical, and biological potential of soils as influenced by various edaphic and agronomic practices. A multiyear (2018–2021) field experiment was performed at the University Organic Research Farm, Narendrapur, West Bengal, India, to investigate the influence of integrated and sole applications of different conventional fertilizers, organic (e.g., vermicompost), and natural farming inputs (e.g., Dhrava Jeevamrit and Ghana Jeevamrit) on SQIs and crop productivity of rice–mustard–green gram-based cropping systems. A total of 12 parameters were selected for the assessment of SQI, amongst which only four, namely pH, organic carbon %, total actinomycetes, and bulk density, were retained for the minimum data set based on principal component analysis (PCA). In this study, the maximum SQI value (0.901) of the experimental soil was recorded in the INM practice of 25% organic and 25% inorganic nutrient inputs, and the rest with natural farming inputs, which augments the SQI by 24% compared to the 100% inorganic nutrient treatment. Amongst the different soil parameters, the highest contribution was from the pH (35.18%), followed by organic carbon % (26.77%), total actinomycetes (10.95%), and bulk density (6.98%). The yields in different cropping systems varied year-wise across treatments. Notably, the highest yield in rainy rice was estimated in the 100% organic treatment, followed by INM practices in the subsequent years, and finally, the combination of organic and natural inputs in the final year. In the case of mustard, the combination of organic and natural inputs resulted in the highest productivity in the initial and last years of study, while the 100% organic treatment resulted in higher productivity in subsequent years. Green gram showed a dynamic shift in yield between the 100% organic and integrated treatments over the years. Further, a strong correlation was also established between the soil physico-chemical parameters and the SQI. Overall, this study concludes that the natural and organic input-based INM practice enhances the soil quality and crop productivity of the rice–mustard–green gram cropping system under the coastal saline zone.
1. Introduction
Rice (Oryza sativa) is considered one of the major cereal crops for more than half of the global population [1], while the rice-based cropping system has become the most predominant cropping practice in the Indian subcontinent [2]. However, long-term rice-based cultivation has also led to a gradual reduction in yield and farmer income due to high input costs, improper fertilization practices, excessive soil disturbance, and reduced nutrient use efficiency [3]. These factors are degrading the inherent capacity of soils by negatively impacting their physico-chemical properties and microbial populations [4]. While the continuous application of chemical fertilizers may temporarily enhance crop yields by providing essential nutrients, their surplus often leads to soil organic matter degradation, loss of biodiversity, disruption of vital soil processes, and environmental pollution [5]. Even though the wide adoption of chemical fertilizers has effectively accomplished the target of increasing agricultural productivity while ensuring self-sufficiency in food, the intensive dependency on chemicals endangers the soil microbiota and agro-ecosystem [6]. Implementing organic manures has become a widely recognized method for enhancing soil health by boosting soil organic carbon reserves and improving nutrient use efficiency [7]. However, organic fertilizers in single application could not sustain the long-term crop yield and productivity to feed the ever-increasing population. Therefore, a holistic approach integrating inorganic, organic, and natural input-based nutrient management would be vital to improve crop productivity, maintain soil fertility and health, and ensure environmental quality. In particular, the integration of organic manures in combination with agrochemicals is increasingly popular, which aims to improve crop yield and soil health and provide environmental safety [8].
Natural farming is an agricultural approach that minimizes external inputs and relies on the self-sustaining principles of nature. It operates with the principle of using locally available resources while avoiding chemical fertilizers. It further emphasizes agronomic interventions, such as crop rotation, diversification, legume incorporation, efficient resource use management, and increasing nutrient use efficiency. Amongst the various components of natural farming, Dhrava Jeevamrit and Ghana Jeevamrit are fermented microbial consortia that enhance the activity of soil microorganisms, leading to the mineralization of essential plant nutrients and making them available for uptake by plant roots [9]. Ghana Jeevamrit, Dhrava Jeevamrit, and other organic inputs, such as vermicompost, compost, and farmyard manure (FYM), are incorporated in the form of dairy excreta-based solid and liquid organic manures that have improved soil organic carbon stocks [10,11,12]. The combined application of these organic and inorganic inputs in the crop field ensures the availability of major plant-required nutrients by exacerbating nitrogen mineralization with the help of soil microbes [13]. In this context, integrated nutrient-management (INM) practices are paramount for achieving sustainable production while restoring soil health and thus can be an alternate approach to agrochemicals for the farming community [14].
In addition, integrating oilseeds and legumes into existing rice-based cropping systems, coupled with organic and natural input-based nutrients alongside the recommended NPK dosage, is essential for enhancing crop yield and improving soil fertility. In particular, the rice–mustard–green gram cropping system is well-suited for eastern India, providing a balanced production of food grains, vegetable oil, and protein [15]. The incorporation of legumes in the rice-based cropping system helps reduce the use of agrochemicals and improves soil fertility by augmenting the soil microbial status, the organic carbon of soils, and other soil quality parameters [16].
Soil health has become a vital factor for crop production in terms of quality and quantity, particularly in the post-Green Revolution era. Therefore, adopting suitable agro-technology to maintain soil health and quality is essential to meet the global food requirement. Soil quality indices (SQIs) are comprehensive metrics used to assess the health and functionality of the soil concerning its capacity to induce vigorous plant growth, support agricultural productivity, and regulate ecosystem balance [17]. These indices are derived from a combination of physico-chemical and biological soil properties, viz., soil texture, organic matter content, pH, nutrient availability, microbial activity, water retention capacity, etc., and they offer a more comprehensive assessment of soil quality than investigating sole edaphic parameters [18]. By quantifying these parameters, SQI may provide a standardized way to evaluate soil quality over time, guide sustainable land-management practices, and measure the impact of different agricultural or conservation interventions on soil health [19].
Therefore, assessing SQIs will help achieve accurate and reliable soil quality estimation and result in effective soil health determination and management practices. The present work aims to study the effect of integrated and sole application of different off-farm and on-farm inputs as a soil quality indicator in a rice–mustard–green gram-based cropping system to achieve sustainable agricultural production.
2. Materials and Methods
2.1. Description of the Study Area
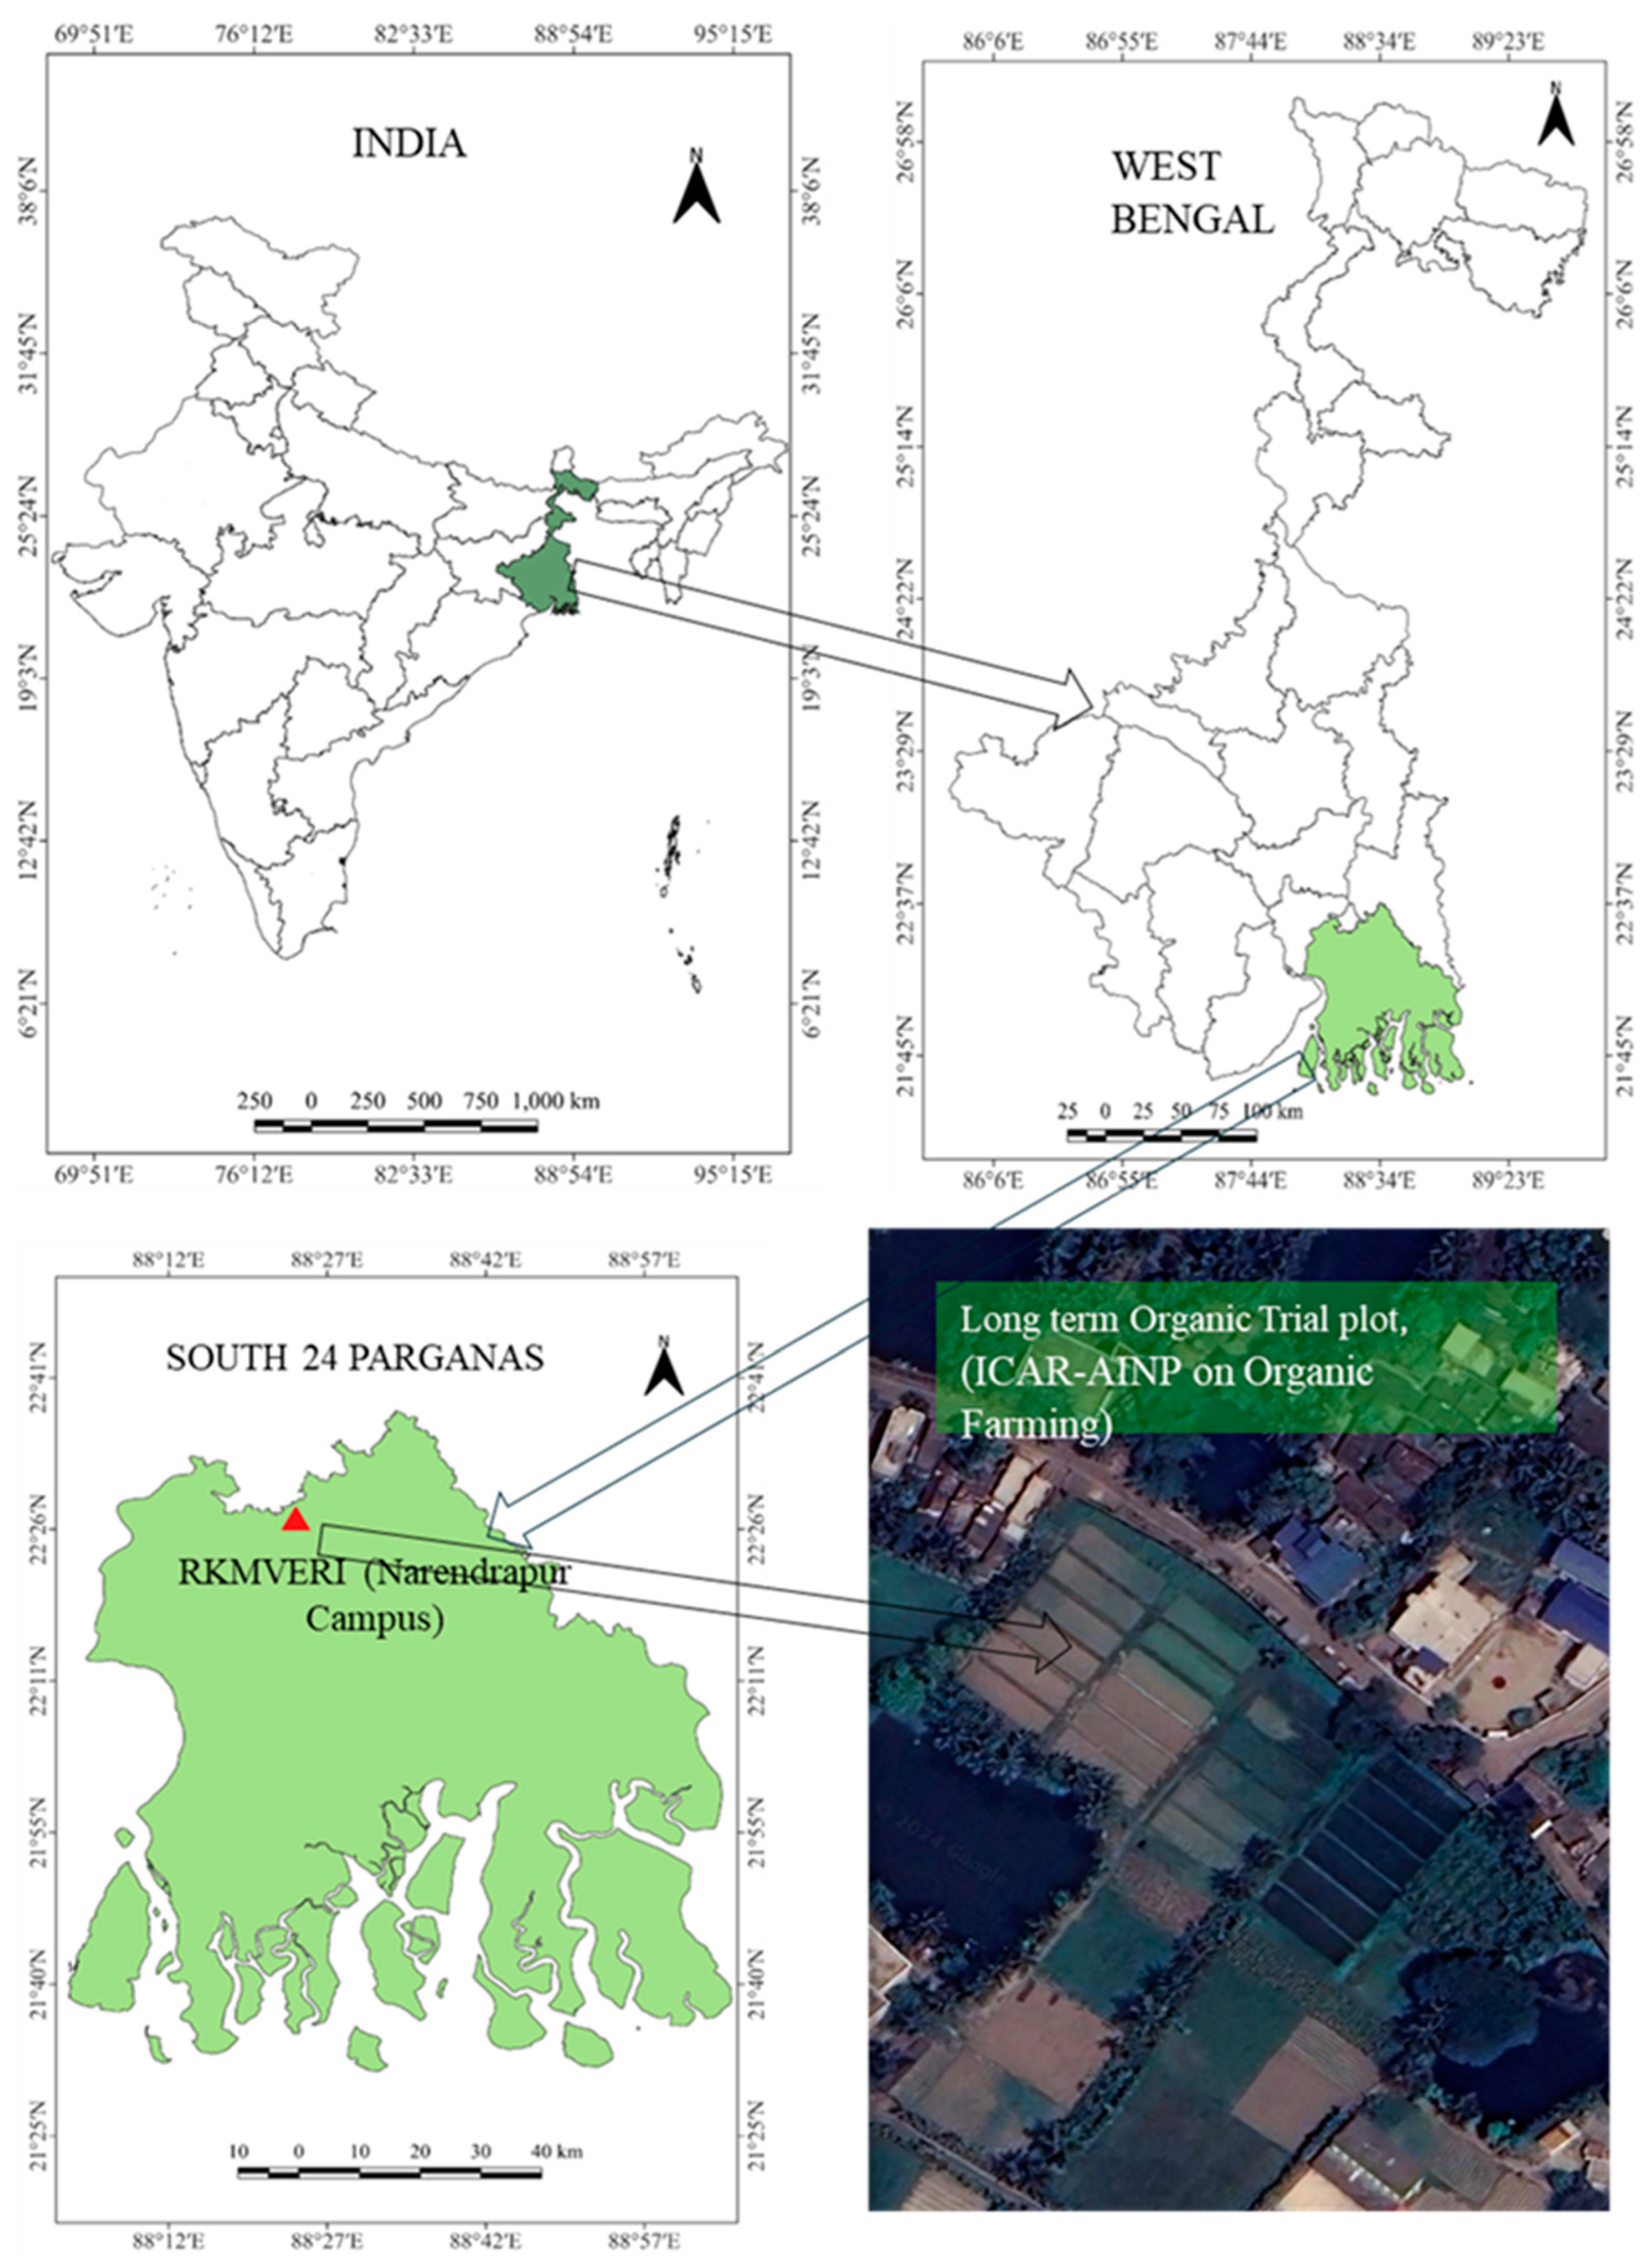
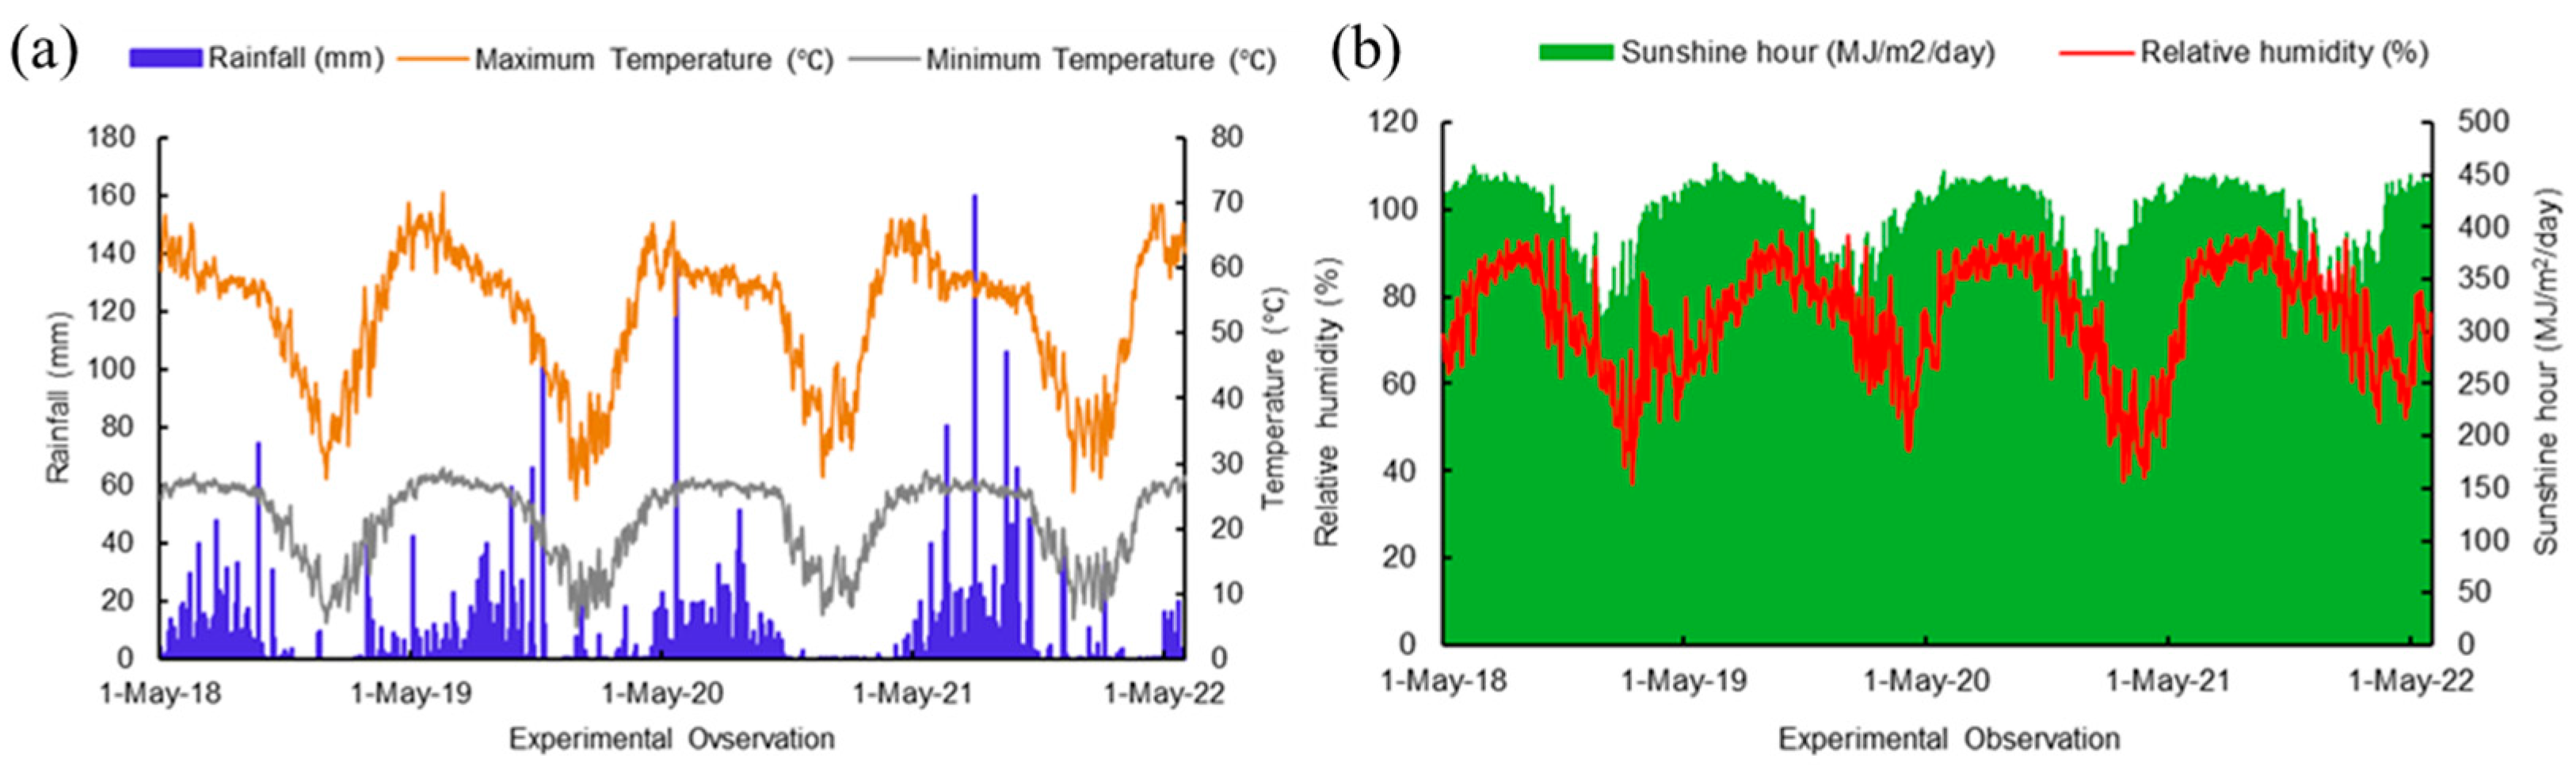
The four-year research work (2018–2021) was conducted at the University Organic Research Farm, Ramakrishna Mission Vivekananda Educational and Research Institute (RKMVERI), Narendrapur, West Bengal, India (situated at 22.438° N latitude and 88.401° E longitude) (Figure 1) falling under the Coastal Saline Zone of West Bengal. With 53.5% sand, 6% silt, and 40.5% clay, the soil texture is marked as sandy clay. Before conducting the experiments, soil samples (0–15 cm depth) were collected and analyzed. The initial values of soil physico-chemical parameters include pH of 6.93, EC (1:2.5 soil/water) of 0.19, organic carbon of 0.87%, available nitrogen of 220 mg/kg, available phosphorus of 52.64 mg/kg, and available potassium of 167 mg/kg. The climate of the coastal region of West Bengal is classified as hot and humid except for a short, mild winter in December and January. The rainfall during the experimentation period was well-distributed, with the highest amounts recorded during the monsoon season, from June to August. The total annual rainfall was 1754 mm, while the average maximum and minimum temperatures were 31.17 °C and 21.47 °C, respectively. The relative humidity varied between 37.3% to 95.5% during the experimental years (Figure 2).
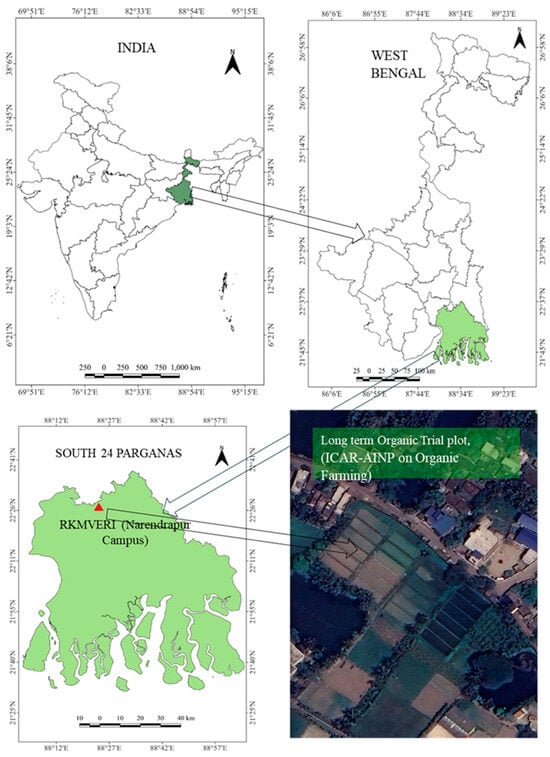
Figure 1.
Location map of the experimental site (The map was prepared with QGIS Open-source Software, not for commercial use).
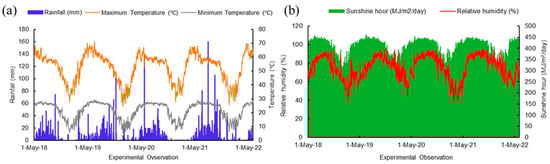
Figure 2.
Metrological parameters (a) maximum minimum temperature, minimum temperature, and rainfall; (b) relative humidity and sunshine hour of the experimental period (2018–2022).
2.2. Treatment and Experimental Details
The target cropping system was rice–mustard–green gram, where the crops were cultivated during the Kharif (rainy), Rabi (winter), and summer seasons, respectively. The crop cultivars were Satabdi (IET-4786) for rice, B9 for mustard, and Samrat (PDM-139) for green gram. However, during the summer of 2019, we were unable to sow the green gram crop due to the COVID-19 pandemic, and thus, the fields were left fallow. The treatment details are mentioned in Table 1. The experiment was carried out in a randomized complete block design (RCBD) encompassing five integrated nutrient-management treatments replicated four times. The natural and organic inputs were prepared at the institution based on the standardized protocol. Before the application of these organic and natural inputs, the macro- and micronutrient content were estimated (Table 2). The recommended dose of nitrogen, phosphorus, and potassium (RDNPK) of rice, mustard, and green gram for the agroclimatic zone are 80:40:40 kg/ha, 60:40:40 kg/ha, and 20:40:20 kg/ha, respectively [20]. The full dose of organic input (vermicompost) was given as a basal dose before sowing, and the natural inputs, such as Dhrava Jeevamrit and Ghana Jeevamrit, were applied twice a month till flowering as 500 l/ha and 250 kg/ha as soil drenching (The details of the preparation of the organic and natural inputs have been given in Supplementary Table S1; the doses of organic and natural inputs were calculated based on the nitrogen content). In the case of green gram, the full basal dose of inorganic chemical fertilizers was applied. For rice and mustard, half of the nitrogen dose, along with the full doses of phosphorus and potassium, was applied as the basal treatment during the final land preparation. The remaining half of the nitrogen was applied in two equal splits for rice—once during tillering and again during grain filling. For mustard, the remaining half was applied in a single split 25 days after sowing.

Table 1.
Treatment details.
Table 2.
Nutritional constituents of the used organic and natural inputs.
2.3. Soil Sampling and Analysis
Soil samples were collected from six points in each plot at a depth of 0–15 cm using a tube auger, both prior to the commencement of the experiment (before sowing of first-year rice) and after the completion of the crop cycle (after the harvest of final year green gram). Samples from each plot were thoroughly mixed to form a composite sample weighing 500 g. These composite samples were then divided into two portions: one portion was refrigerated at 4 °C for the analysis of biological and biochemical soil parameters, while the other portion was air-dried, ground, and sieved through a 2 mm mesh for soil chemical property analysis. Soil pH and electrical conductivity (EC) were measured using a soil-to-water ratio of 1:2.5, following the method described by [24]. Organic carbon (OC) content was determined by the [25] method. Available nitrogen was quantified using the KMnO4 extraction method [21]. Phosphorus availability was assessed using the Olsen method [22], and available potassium was measured using the 1N ammonium acetate extraction method [23]. Bulk density (BD) was determined using the core sampler method [26]. The soil microbial populations of bacteria, fungi, and actinomycetes were estimated through the standard serial dilution spread plate technique using appropriate nutrient media. Total bacteria (media: nutrient agar; incubation temperature: 37 °C; incubation time: overnight), total actinomycetes (media: actinomycetes isolation agar; incubation temperature: 37 °C; incubation time: 24 h), total fungus (media: sabouraud chloramphenicol agar; incubation temperature: 30 °C; incubation time: 48 h) [27,28]. Soil dehydrogenase activity (DHA) was assessed following the method of [29], which involves the reduction of 2, 3, 5-triphenyltetrazolium chloride (TTC) to triphenyl formazan (TPF), followed by spectrophotometric measurement at 485 nm. The initial values of the soil physical and chemical properties are reported in Table 3.
Table 3.
Physico-chemical properties of initial soil (0–15 cm depth).
2.4. Soil Quality Evaluation
The soil quality index (SQI) of the experimental soil was evaluated from the data obtained by analysis of the soil samples collected after the harvesting of the final component crop of the mentioned cropping system. For determination of the soil quality index, four crucial steps needed to be carried out, starting with (i) setting up of the management goal; (ii) selection of the minimum data set, which represents the soil indicators; (iii) scoring of the minimum data set indicators, and (iv) computation of the SQI by integrating the individual scores of the minimum data set [32,33].
2.4.1. Principal Component Analysis
The principal component analysis (PCA) was performed using JASP (ver. 0.19.1) for 12 soil physical (e.g., bulk density, maximum water retention capacity), chemical (e.g., pH, electrical conductivity, organic carbon %, available nitrogen, phosphorus, and potassium), and biological (e.g., culturable total bacteria, fungi, and actinomycetes and dehydrogenase activity) attributes to lower the data dimension while retaining all information [32]. Only four attributes out of a total of 12 attributes were retained in the minimum data set having high loading factor and eigenvalues (≥1) which were considered the best representative of the data and successfully explained the variability [34]. The retained principal components underwent varimax rotation to enhance the interpretability of the factors. This process aimed to maximize the variance explained by each component while minimizing the shared variance [35].
2.4.2. Scoring of the Indicators of Minimum Data Set
After establishing the minimum data set, a linear scoring technique was employed to assign a score to each individual observation of the minimum data set indicators, ranging between 0 and 1 [32,36]. The indicators were ranked in either ascending or descending order, depending on whether higher values were beneficial or detrimental to soil quality. A comprehensive understanding of how soil parameters perform in similar soil types is essential for converting raw data into unitless scores [17]. In this study, bulk density was scored as “lower is better,” while organic carbon content and total actinomycetes were scored as “higher is better,” and pH was evaluated based on the principle of “optimal is better” [37]. For indicators scored as “higher is better,” each observation was divided by the highest value of the indicator so that the highest value scored a 1. Conversely, for “lower is better” indicators, the lowest value was divided by each observation, ensuring that the lowest value scored a 1 [32].
2.4.3. SQI Calculation
In the final step, after giving a score to each minimum data set variable, they were weighted with the help of PCA results. A certain percentage of variation was explained by each principal component in the data set, which was divided by the total variation percentage of all the components having eigenvalue ≥ 1 (Damiba et al., 2024). The soil quality index as a measure of soil health was evaluated by adding all the weighted variables scores of the minimum data set using the following formula:
where Si represents the contribution of the ith variable to the overall factor score, while Wi denotes the relative importance of the ith variable in determining the factor score. These weights are obtained from the PCA [37]. The higher value of SQI determines better soil health and quality and vice versa.
2.5. Productivity of the Cropping System
The grain or seed yield (kg/ha) of rice, mustard, and green gram was calculated post-harvest. For rice, the yield was determined by harvesting the entire produce from the net plot area (excluding border areas) [38]. The grain yield was calculated based on the harvested data and converted to kg/ha at a standard moisture content of 14% [39]. In the case of mustard, mature plants bearing siliqua were harvested, sun-dried, and threshed using sticks. For green gram, mature pods were collected from the net plot area, sun-dried, and threshed. The seeds were then properly dried to reduce moisture content to 14% [40]. The seed weights were recorded as grams per plot and subsequently converted to kg/ha for yield estimation.
2.6. Statistical Analysis
The crop yield and SQI data were analyzed using analysis of variance (ANOVA) following a randomized complete block design (RCBD) as described by Gomez and [41]. The analysis was performed using GenStat software (Windows version 20.0). The significance of variance sources was evaluated by Fisher–Snedecor’s F-test, using error mean square, with a probability threshold of 0.05. The figures and graphs are prepared R ver. 4.4.1.
3. Results
3.1. Soil Physico-Chemical Indicators
Natural and organic input-based integrated nutrient-management strategies significantly affected the physico-chemical parameters of soils, viz. bulk density, maximum water holding capacity, pH, electrical conductivity, oxidizable organic carbon percentage, and plant-available nitrogen, phosphorous, and potassium in the post-harvest experimental soil of the rice–mustard–green gram cropping system (Table 4).
Table 4.
Effect of organic and natural input-based integrated nutrient-management practice on physico-chemical attributes of post-harvest soil.
The BD of the post-harvest soil showed no statistically significant differences across the several nutrient treatments. The highest maximum water holding capacity (WHC) (58.52%) was observed in plots of INM practices with organic, natural, and inorganic nutrient inputs (NM4), followed closely by the 100% organic treatment (NM1) with 58.26%. At the same time, the least value was found in the integration of organic and natural inputs (50.86) (NM2).
The post-cultivation pH values were neutral (6.5–7.5), with the highest pH (7.26) in the treatment involving a mixed application of inorganic, natural, and organic inputs (NM4), while the lowest value (6.92) was recorded from 100% organic nutrient treatment (NM1). The maximum electrical conductivity (EC) (0.328) was found in treatment involving the combined application of organic and natural inputs (NM2), which was statistically at par with 100% organic treatment (0.323) (NM1). The lowest value of EC (0.200) was seen in treatment where integration of organic, natural, and inorganic inputs was applied (NM4) to meet the nutrient requirements of the crop. The highest oxidizable OC (1.12%) was recorded from the 50% organic inputs + natural inputs, and the lowest (0.82%) was seen in the case of fully inorganic treatment (NM5). A similar trend was followed in available nitrogen, depicting the highest (286 mg/kg) with the combined application of natural and organic inputs (NM2) and the lowest (204 mg/kg) in fully inorganic treatment (NM5). The highest available phosphorus (44.60 mg/kg) was recorded in the combined application of organic, inorganic, and natural inputs (NM4), which was statistically at par with the integrated application of organic and natural inputs (NM2) (44.38 mg/kg. However, 100% inorganic nutrient treatment (NM5) recorded the highest available potassium (1374 mg/kg) in the post-harvest soil and the lowest in 100% organic treatment (103 mg/kg) (NM1).
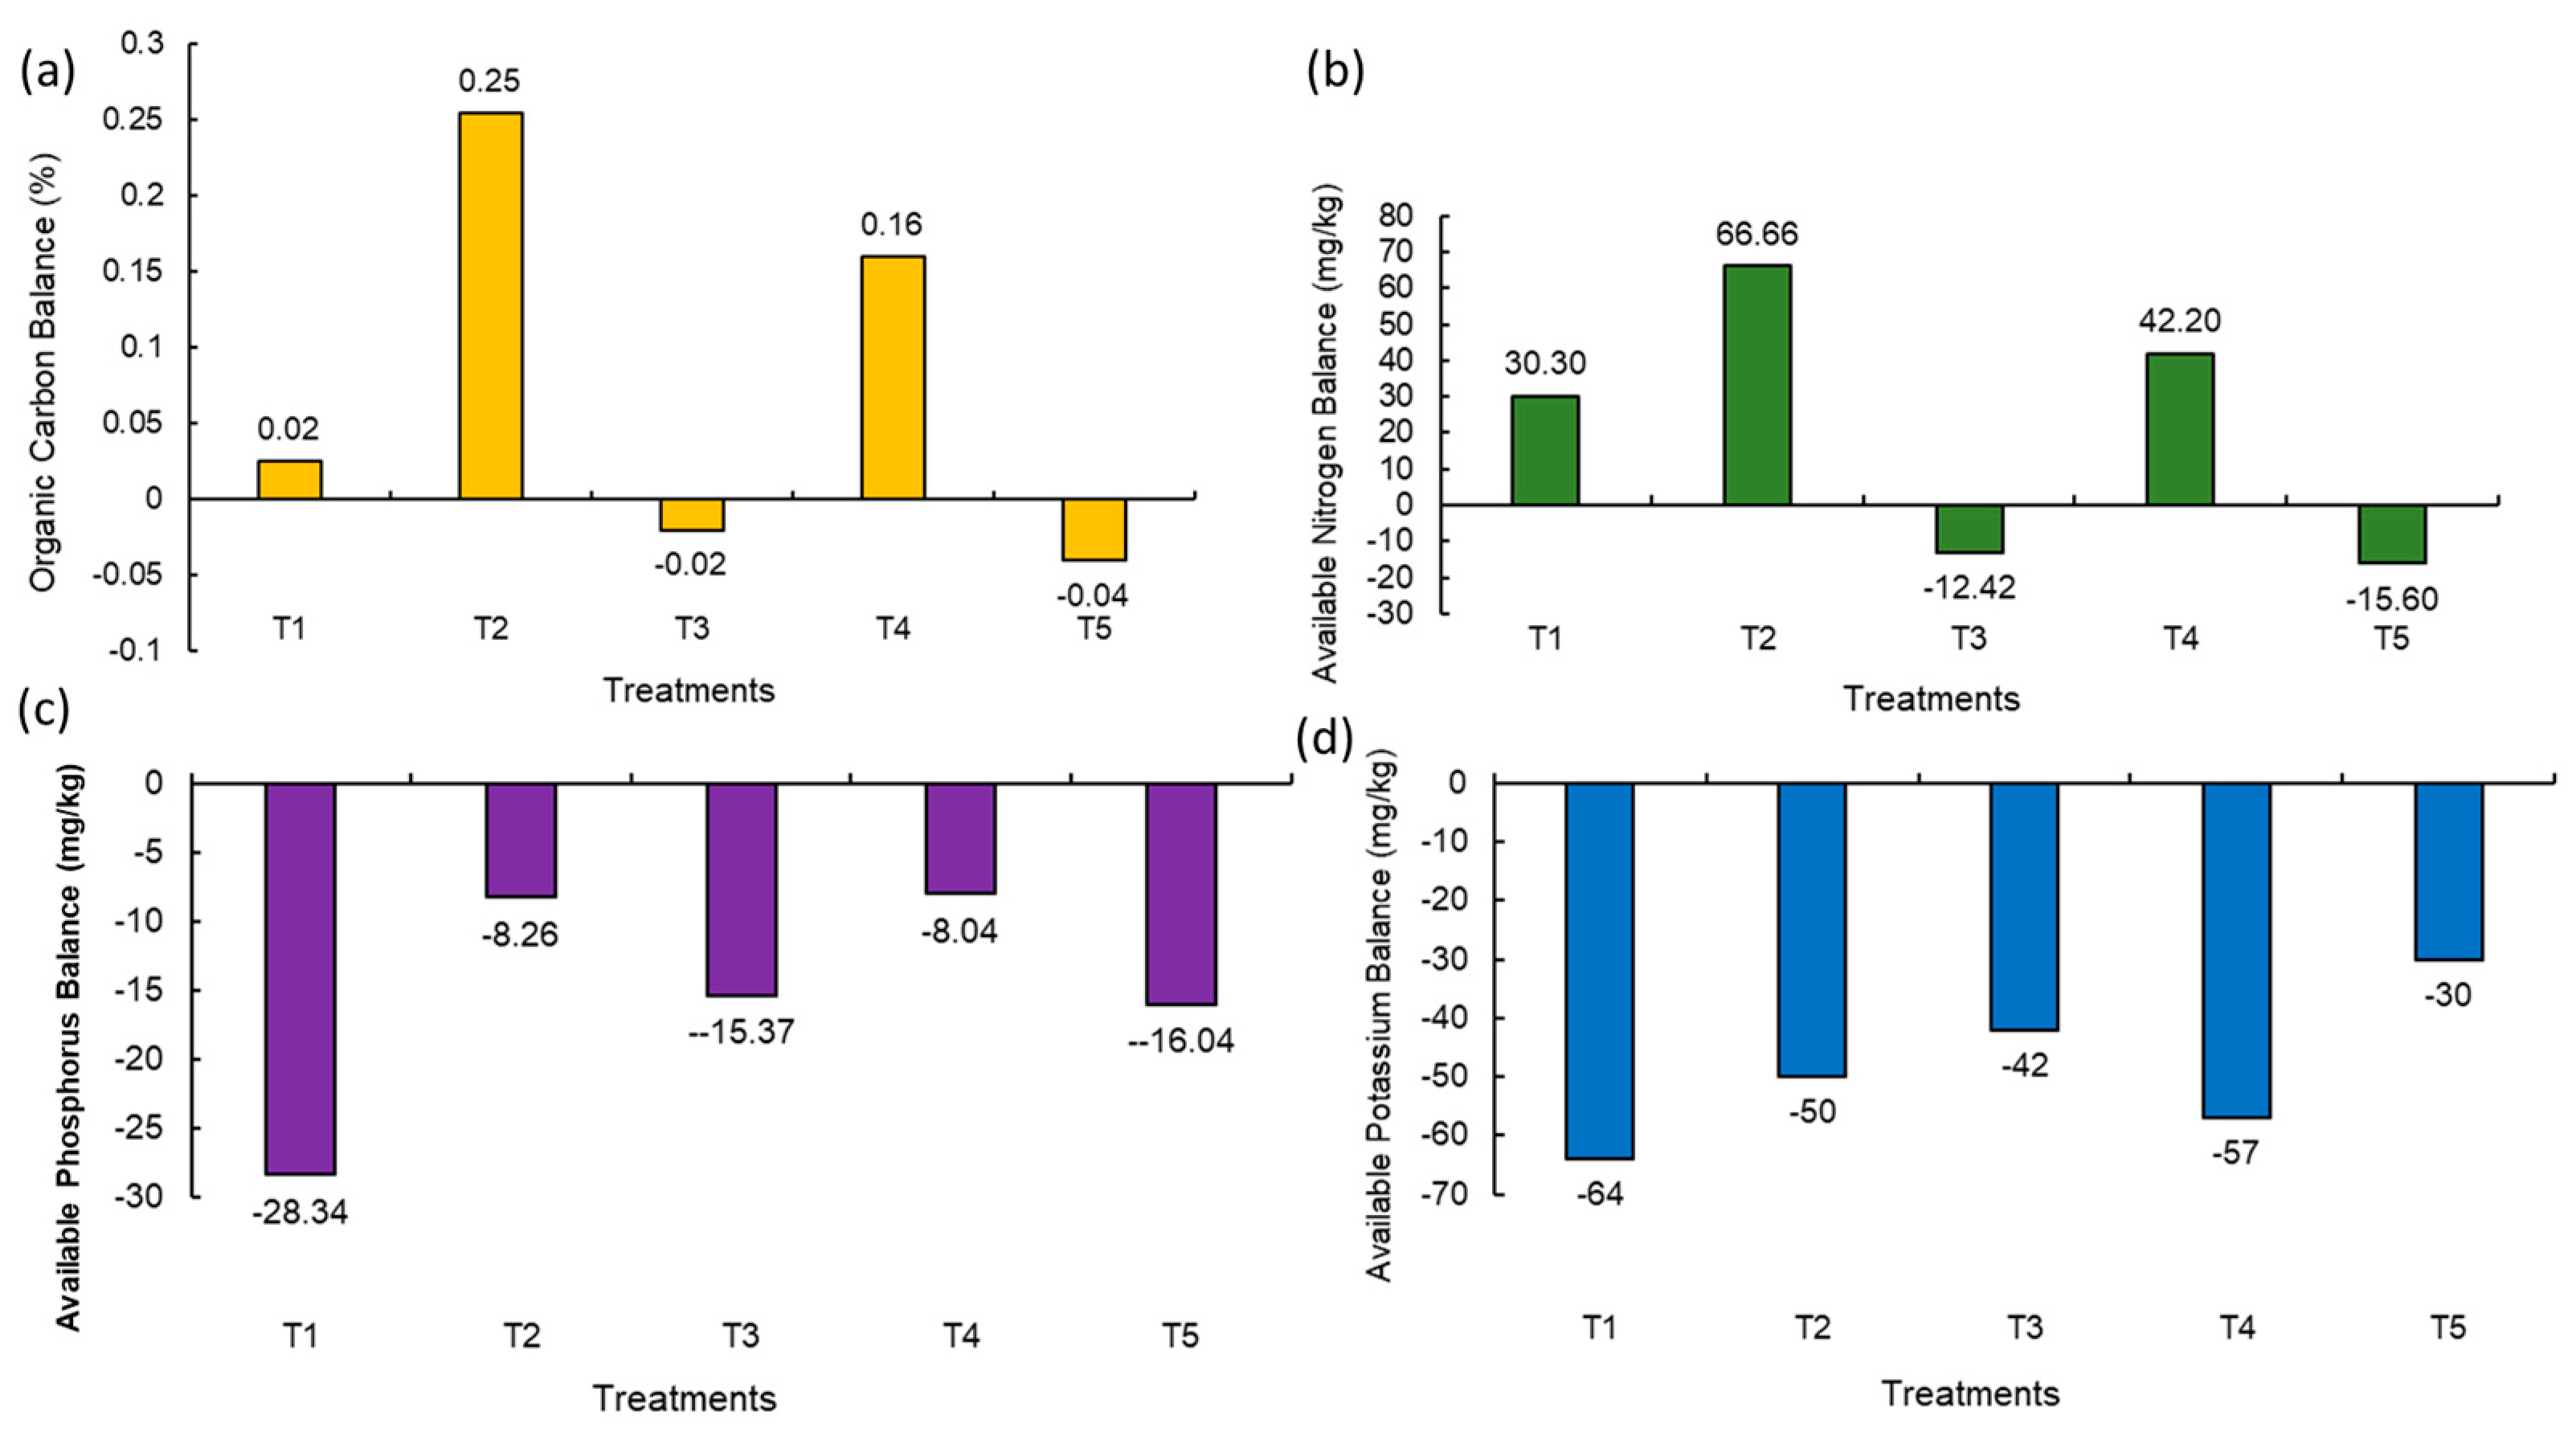
Soil OC is the key aspect of soil health and productivity. It stores nutrients and provides energy for soil organisms. The balance of OC in post-harvest soil was found to be at maximum due to the integration of organic and natural inputs (+0.25%) (NM2) followed by the addition of natural, organic, and inorganic treatments (+0.16%) (NM4) and fully organic input treatment (+0.02%) (NM1) (Figure 3a). Fully inorganic (NM5) and integration of organic and inorganic treatment (NM3) showed a decline in organic carbon balance as compared to the initial soil by 0.04% and 0.02%, respectively (Figure 3a). A similar result was also observed in the available nitrogen balance; the highest positive balance (+66.66 mg/kg) in the treatment where organic and natural inputs (NM2) were combined and applied was observed, followed by the integration of organic, natural, and inorganic inputs (+42.28 mg/kg) (NM4) and fully organic treatment (+30.30 mg/kg) (NM1) (Figure 3b). The negative balance of available nitrogen was observed in fully inorganic (NM5) and integration of organic and inorganic nutrient treatment (NM3) (Figure 3b). Irrespective of various treatment combinations, the available soil phosphrus balance was found to be negative, and the least negative value (−8.04 mg/kg) was observed with 25% organic inputs + 25% inorganic inputs + natural inputs (NM4) (Figure 3c). The soil available potassium balance also showed a declining trend in all the treatments with a maximum negative balance in the 100% organic treatment (−64 mg/kg) (NM1) (Figure 3d).
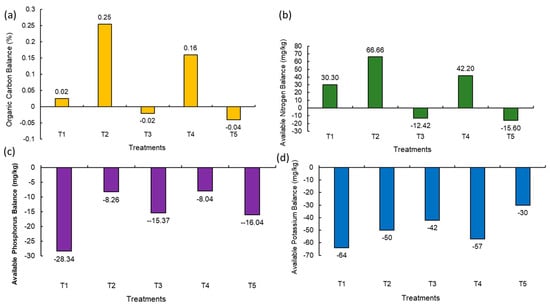
Figure 3.
Balance of (a) soil organic carbon, (b) available nitrogen, (c) available phosphorus, and (d) available potassium in post-harvest soil compared to initial soil. Values in parentheses represent the increase (+) or decrease (−) from the initial value (before starting the experiment). [NM1:100% organic inputs, NM2:50% organic inputs + natural inputs, NM3: 50% organic inputs + 50% inorganic inputs, NM4: 25% organic inputs + 25% inorganic inputs + natural inputs, NM5:100% inorganic inputs].
3.2. Soil Biological Indicators
The biological activity of soil is the function of several microorganisms present in soil. The biological properties of the post-cultivation soil, especially the microbial load (e.g., bacterial, actinomycetes, and fungi) and activity of soil dehydrogenase (DHA) enzyme, were seen to be significantly affected by various organic and natural input-based INM treatments (Table 5)
Table 5.
Effect of organic and natural input-based integrated nutrient-management practice on biological attributes of post-harvest soil.
The highest population of total bacteria (138.00 × 10¹¹ cfu/g) in post-harvest soil was found where 100% organic inputs (NM1) were applied, and the lowest was observed with the collective application of inorganic and organic inputs (NM3). In the case of total fungi, the highest population (43.66 × 10 3 cfu/g) was found due to the combined application of natural and organic inputs (NM2) that was statistically at par with 100% organic (42 × 103 cfu/g) (NM1) and 100% inorganic (38.66 × 10³ cfu/g) treatments (NM5) respectively, while the lowest was seen in the integrated application of inorganic and organic inputs (NM3). The integrated application of natural, organic, and inorganic inputs (NM4) resulted in the maximum actinomycetes load (14.30 × 10⁶ cfu/g) in post-harvest soil.
Soil DHA was measured at 30 DAS and is represented in Table 5. The results revealed that treatment with the integrated application of organic and natural nutrient inputs (NM2) recorded the highest dehydrogenase activity (3.45 µg TPF/g oven dry soil/24 h), and the lowest dehydrogenase activity in soil was noted with the mixed application of organic and inorganic inputs (NM3) (1.70 µg TPF g oven dry/soil/24 h).
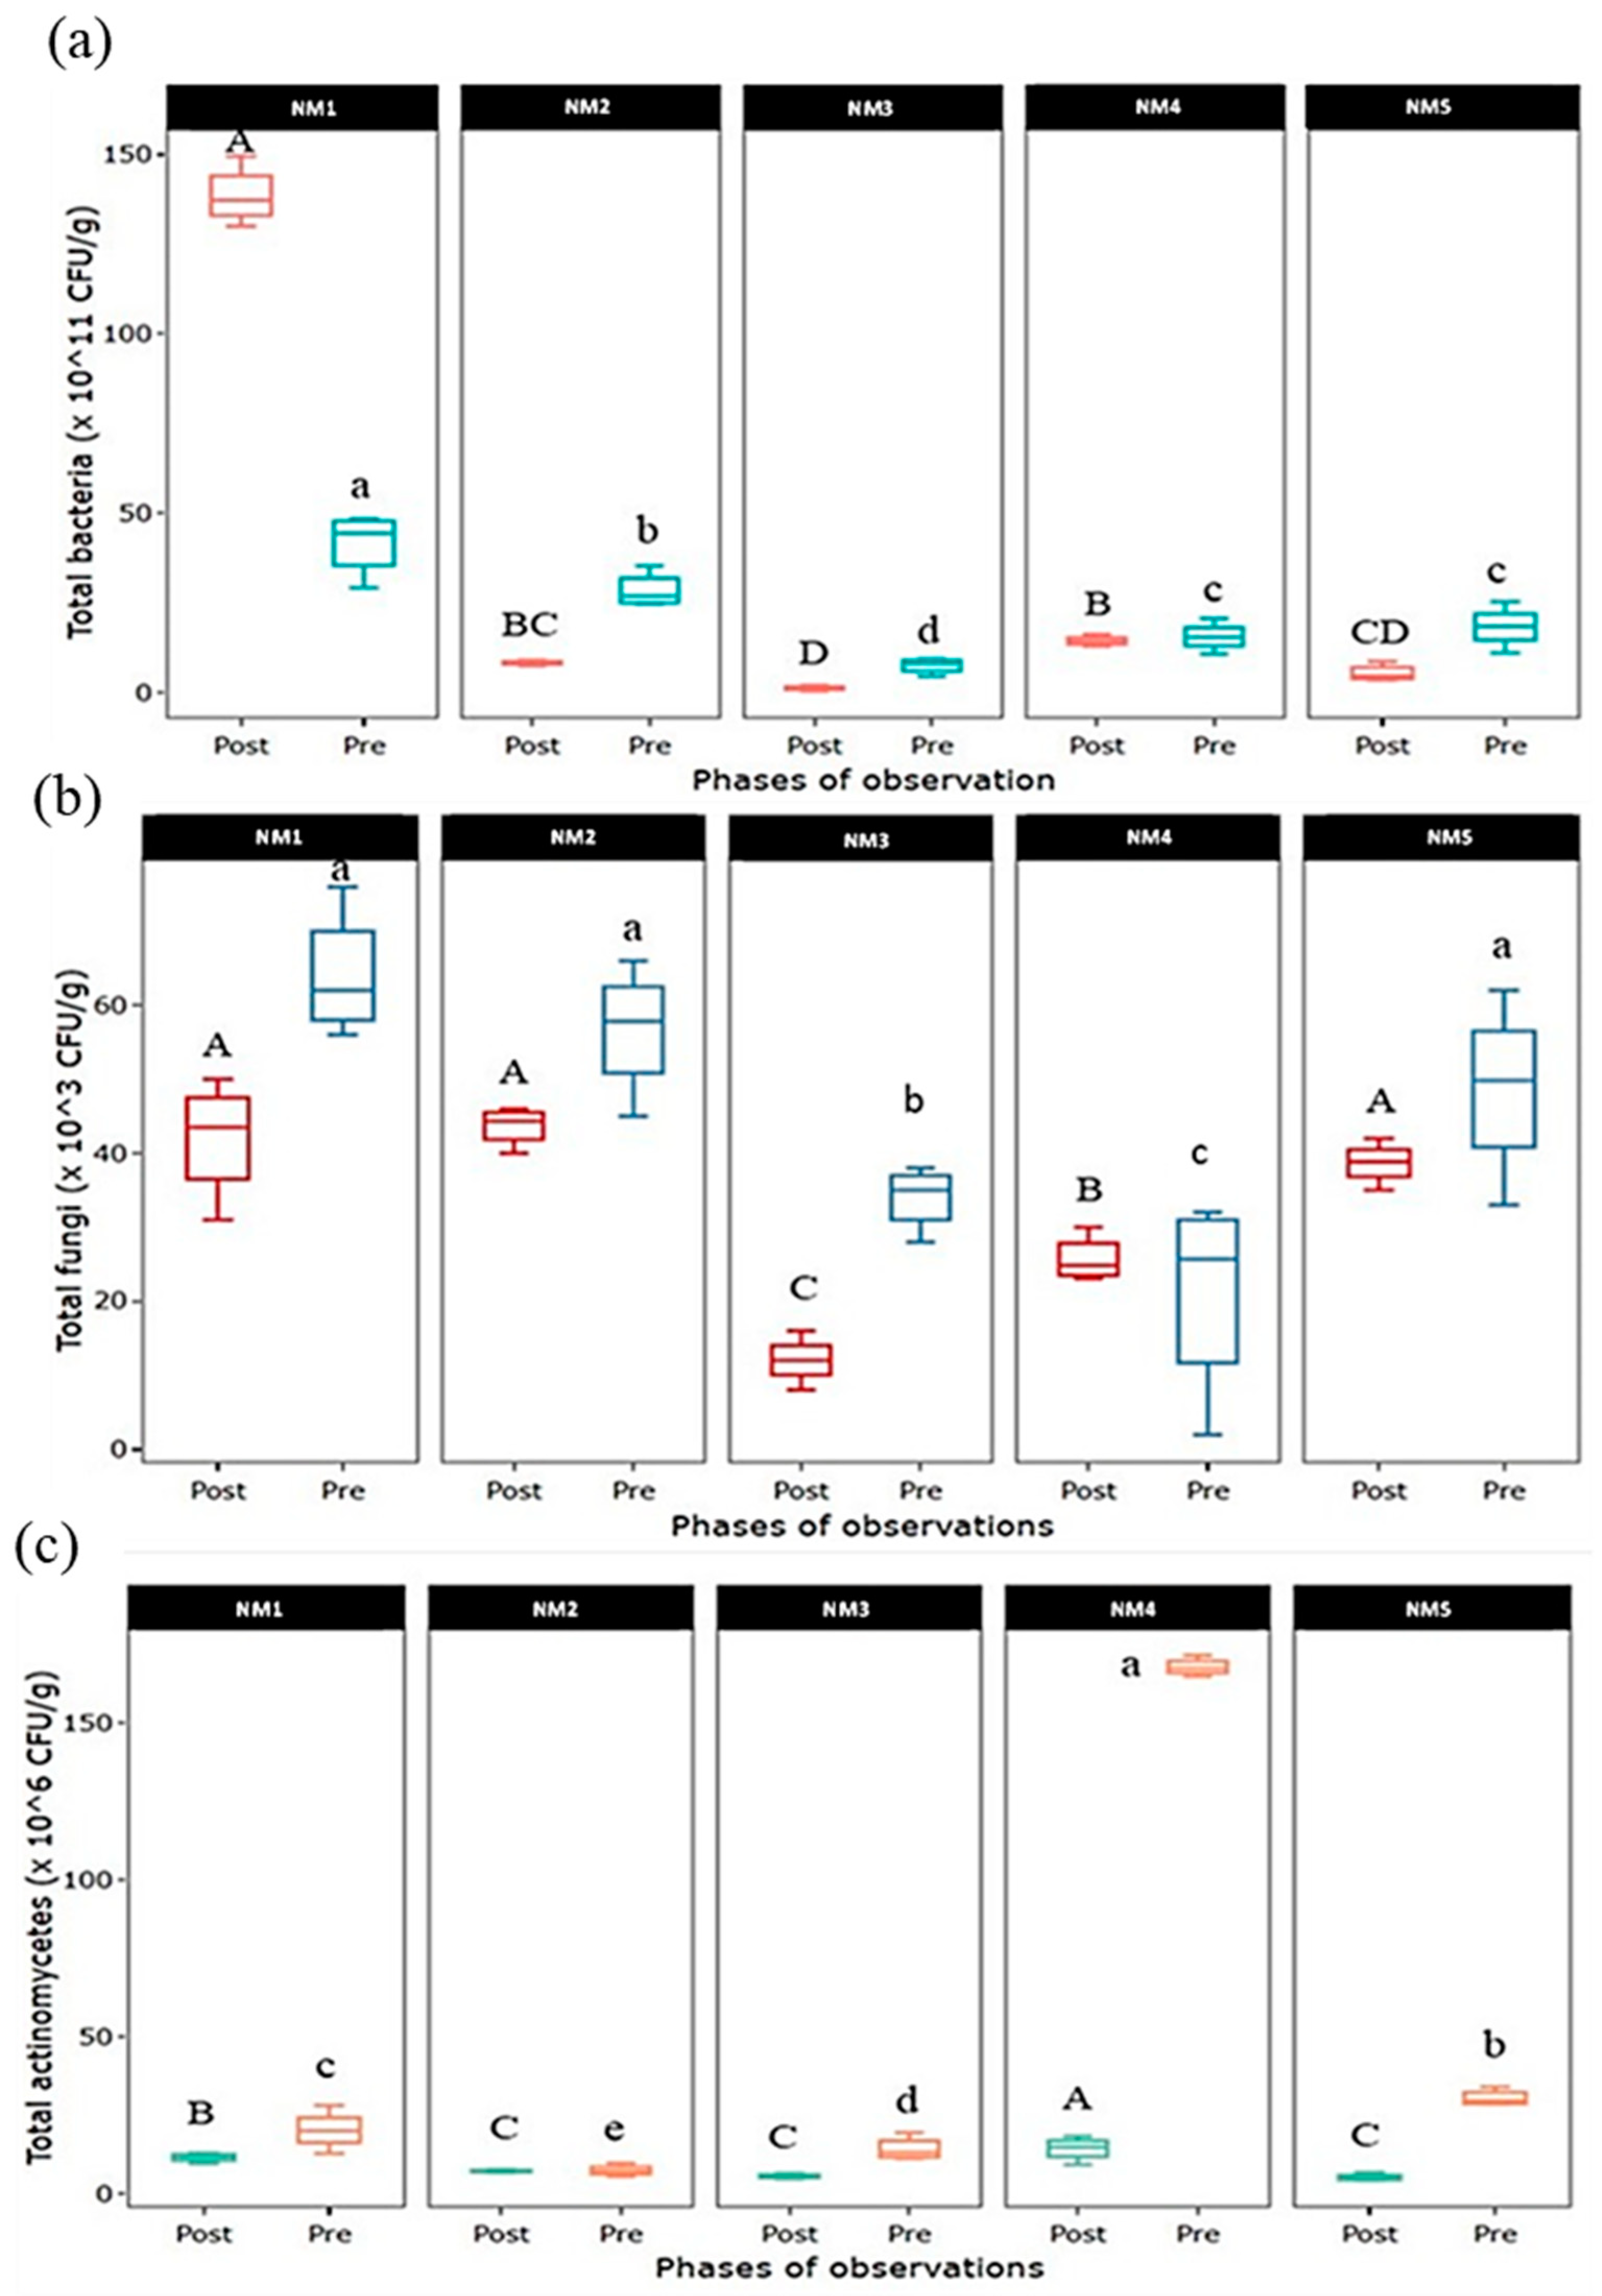
The dynamics of soil microorganisms in the pre- and post-cultivation soil are shown in Figure 4. In the case of the total bacterial count, the population of soil bacteria tended to decrease in all INM treatments after cultivation except in 100% organic treatment (NM1), where the status of the bacterial population was found to be much higher post-cultivation. Like bacteria, the population of fungi was also recorded to drop post-cultivation except in treatment where a combined organic, inorganic, and natural treatment (NM4) was applied, which seemed to be at the same level. In the case of soil actinomycetes, a population decline was recorded in all nutrient treatments except the integration of organic and natural input (NM2) applied treatment, which seems to be on the same level.
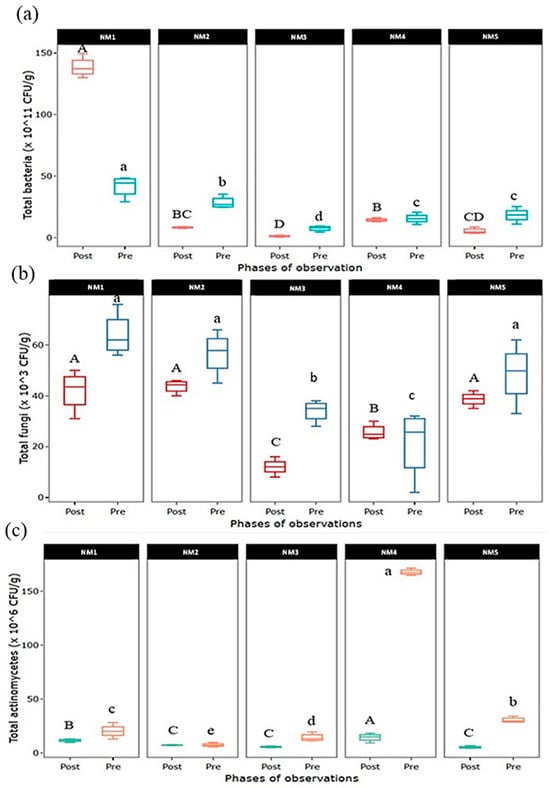
Figure 4.
Dynamics of (a) total bacteria, (b) total fungi, and (c) total actinomycetes population in pre- and post-experimental soil. Values in parentheses represent the increase (+) or decrease (−) from the initial value (before starting the experiment). [NM1:100% organic inputs, NM2:50% organic inputs + natural inputs, NM3: 50% organic inputs + 50% inorganic inputs, NM4: 25% organic inputs + 25% inorganic inputs + natural inputs, NM5:100% inorganic inputs]. Box column followed by different letters is significantly different by Duncan’s Multiple Range Test (DMRT) at p ≤ 0.05.
3.3. Soil Quality Index
A PCA was performed on 12 soil physico-chemical and biological parameters to identify the minimum data set for evaluating the soil quality index of the experimental soils. The minimum data set that includes principal components with a high eigenvalue (≥1) and a minimum 5% data variation among the principal components (PCs) was selected [33]. The eigenvalues of the four PCs were 4.01, 3.58, 2.60, and 1.02, respectively. These, taken together, accounted for a cumulative variance of 94.3%, with the first, second, third, and fourth components explaining 34%, 29.8%, 21.6%, and 8.8% of the variability, respectively (Table 6). For each principal component (PC), only factors with absolute values within 10% of the highest factor loading were retained for the minimum data set. Consequently, highly weighted factors like pH, organic carbon %, total actinomycetes, and bulk density were retained as PC1, PC2, PC3, and PC4, respectively, in the minimum data set (Table 6). The path diagram associated with the PCA is presented in Supplementary Figure S1.
Table 6.
Principle component analysis (PCA) of the soil quality variables.
Post-formation of the minimum data set, a linear scoring technique was applied to assign a score to every individual observation of the minimum data set indicator, which ranged between 0 and 1. Upon considering whether the higher value of the indicators is good or bad for the soil, they are ranked in ascending or descending order. In our present research, bulk density was scored as “less is better”, organic carbon content and total actinomycetes were scored as “more is better”, while pH was scored as “optimum is better”. For the indicators that scored more is better, each value of the indicator was divided with the highest value (7.27 for pH, 1.14 for organic carbon, and 18.3 for total actinomycetes) such that the highest value becomes 1. In the case of the less is better indicators, the lowest value (0.87 for bulk density) was divided by each value of the indicator such that the lowest value scored a 1. The soil quality index for each PC was calculated by multiplying their respective scores with weighting factors.
where 0.36, 0.32, 0.23, and 0.09 were the weighting factors of respective PCs, and S is the score for the subscripted soil parameter.
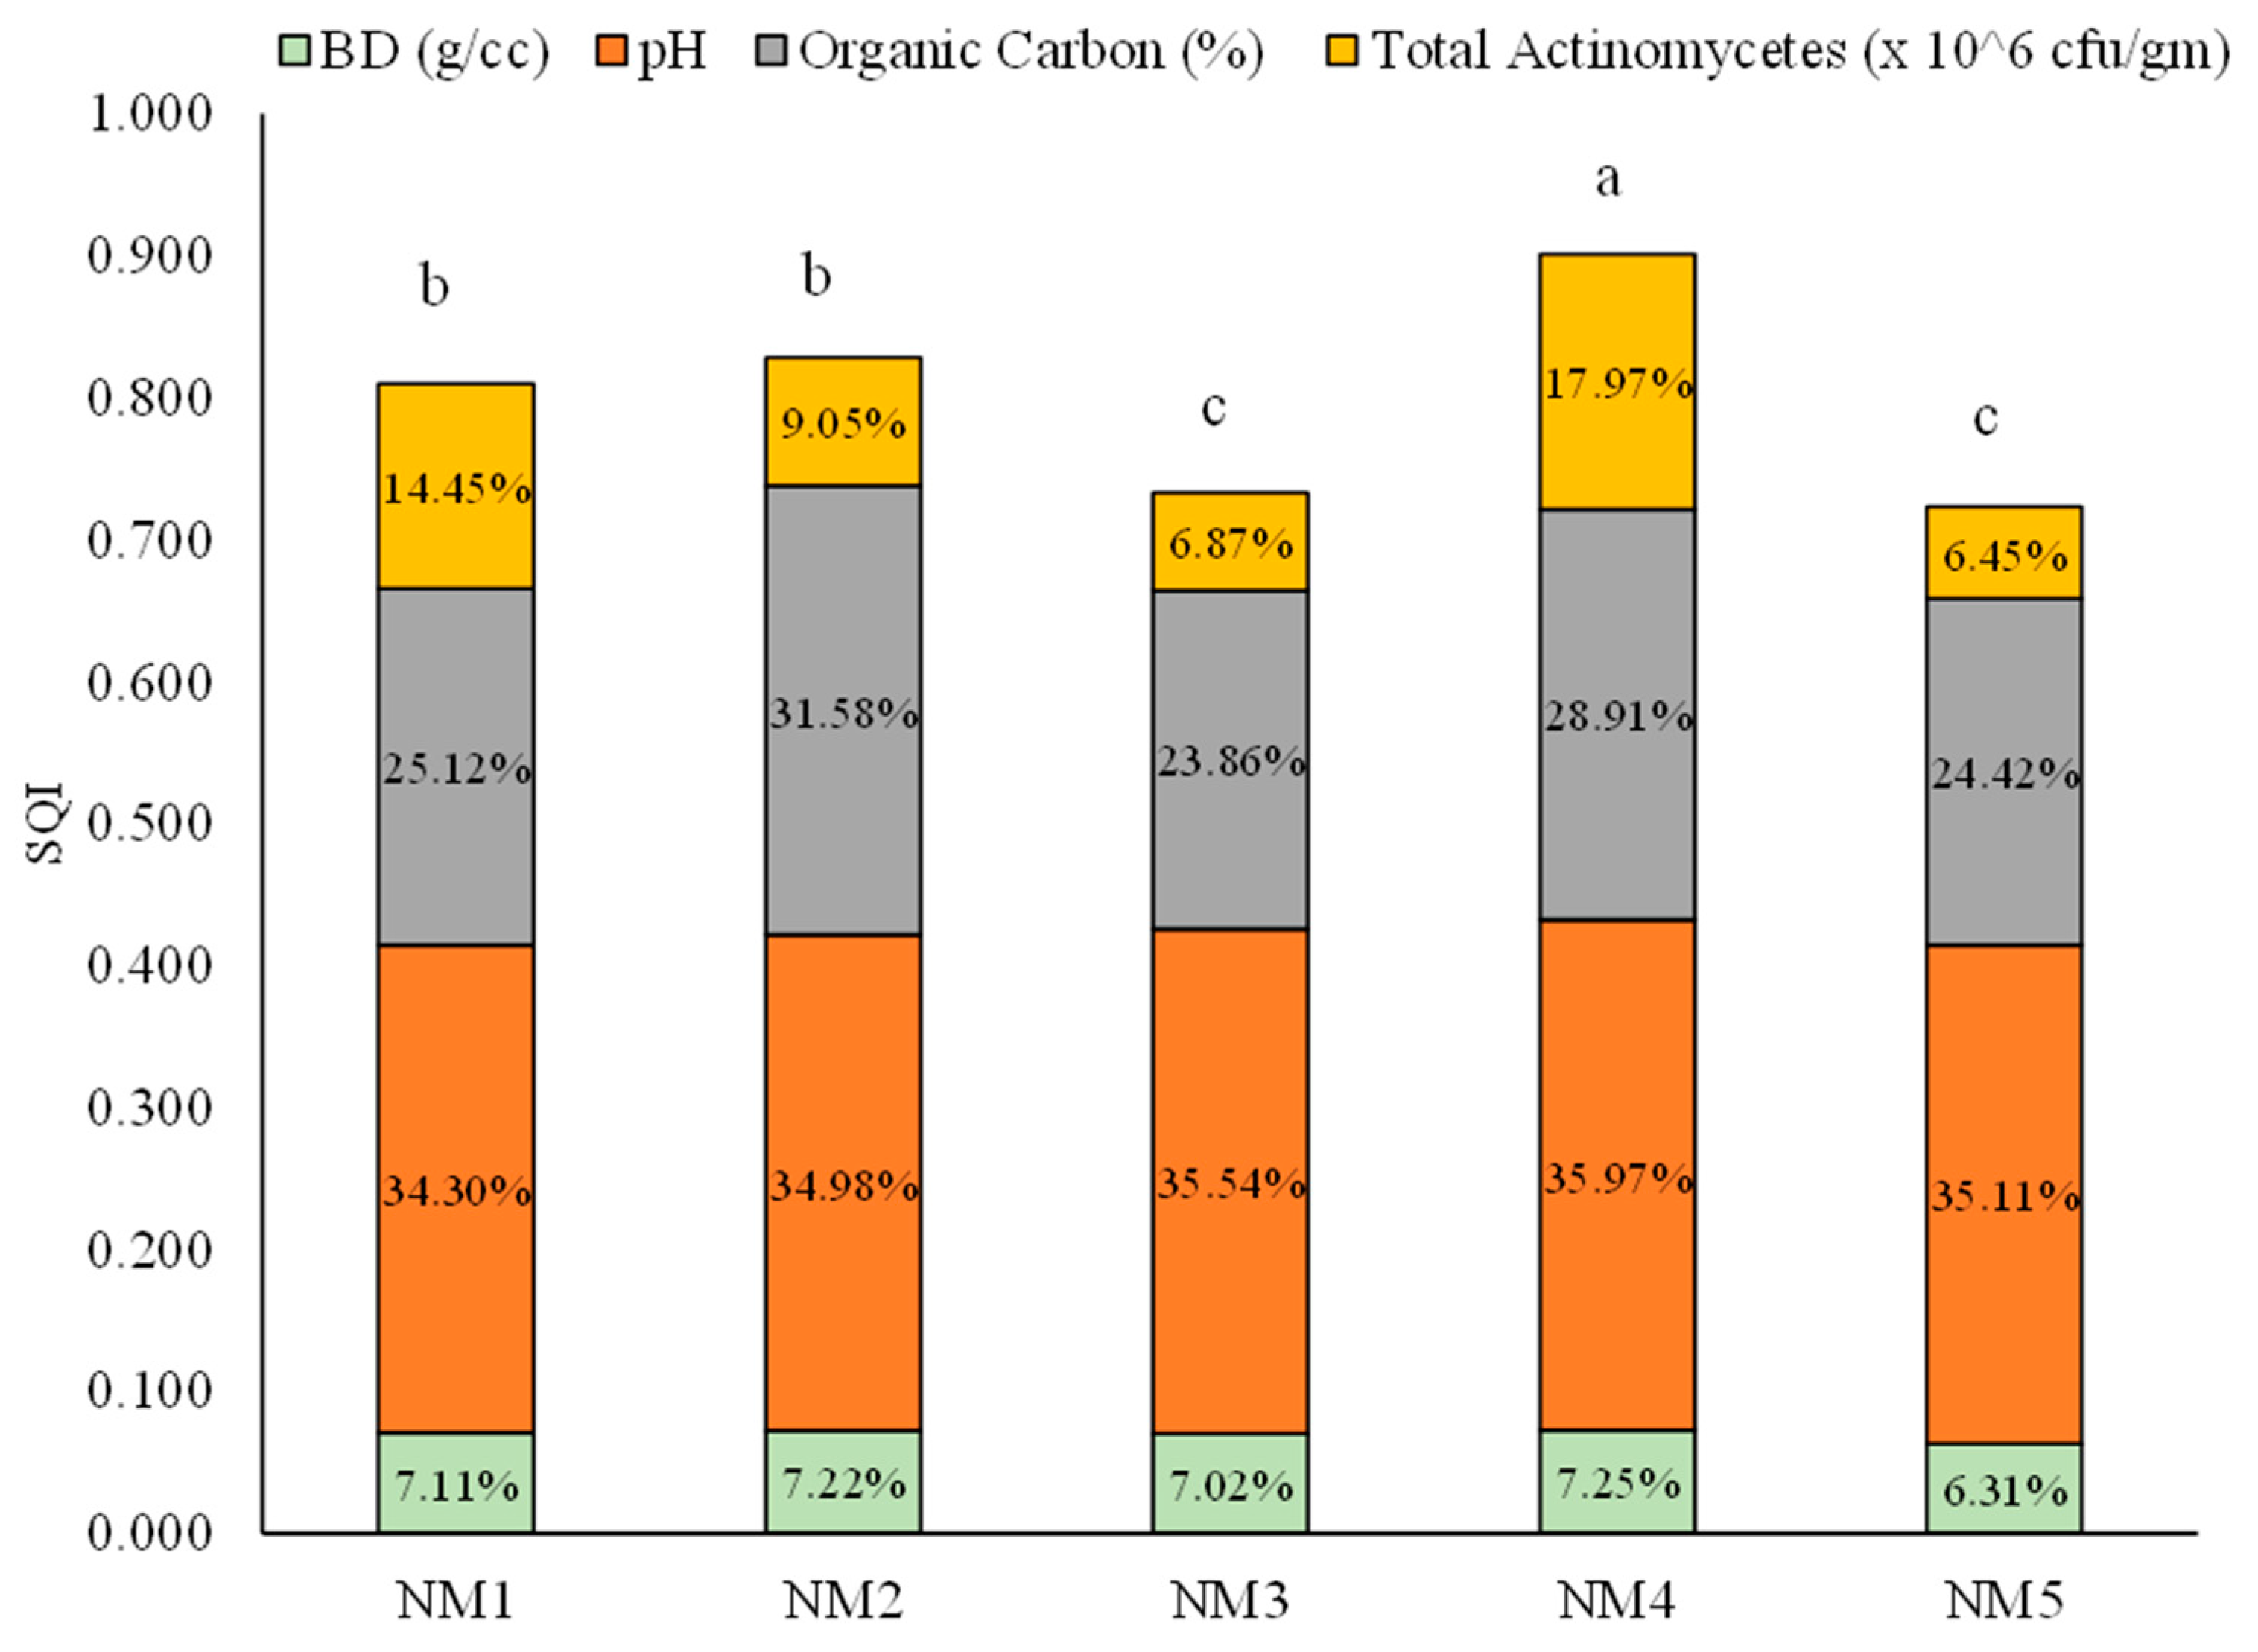
The SQI values of all individual minimum data set components were summed to achieve a single value for each nutrient treatment. Among the five treatments, SQI varied from 0.901 to 0.723 (Figure 5). The highest SQI was recorded from the integration of natural, organic, and inorganic inputs (0.901) (NM4), followed by the integration of organic and natural inputs (NM2) and 100% organic inputs (NM1), respectively. The contributions of minimum data set components were 35.97%, 28.91%, 17.97%, and 7.25% for pH, organic carbon %, total actinomycetes, and bulk density, respectively, in the highest SQI treatment. The lowest value of SQI was received from the fully inorganic treatment (NM5), which was statistically at par with the integration of organic and inorganic treatment.
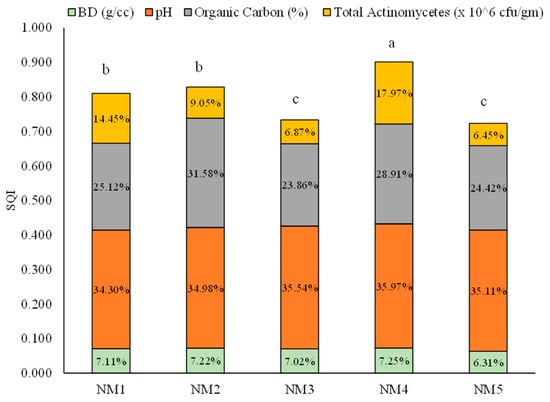
Figure 5.
Soil quality index and contribution of soil quality indicator for different integrated nutrient-management practices. Values in parentheses represent the increase (+) or decrease (−) from the initial value (before starting the experiment). [NM1:100 % organic inputs, NM2:50 % organic inputs + natural inputs, NM3: 50% organic inputs + 50% inorganic inputs, NM4: 25% organic inputs + 25% inorganic inputs + natural inputs, NM5:100% inorganic inputs]. Vertical column followed by different letters is significantly different by Duncan’s Multiple Range Test (DMRT) at p ≤ 0.05.
3.4. Productivity of the Cropping System
Production of the component crops of the rice–mustard–green gram cropping system was significantly influenced by various organic and natural input-based INM strategies during the experimental period (Table 7).
Table 7.
Effect of organic and natural input-based integrated nutrient-management practice on yield of cropping system.
In the case of Kharif (rainy) rice, the highest yield among various nutrient-management treatments in the first year was recorded from the fully organic treatment (NM1), which was statistically at par with the integration of natural and organic inputs (NM2) and a combination of natural, organic, and inorganic inputs (NM4), respectively. Integration of organic and inorganic inputs (NM3) resulted in the maximum value of grain yield in the following year, which was at par with the integration of natural and organic inputs (NM2) and organic, inorganic, and natural inputs (NM4), respectively. A non-significant difference among treatments was observed in the third year of the experiment. In contrast, in the final year, fully organic treatment (NM1) recorded the highest grain yield, which was at par with the integration of organic and natural inputs (NM2) and the integration of organic and inorganic inputs, respectively (NM3). Through the trial period, the 100% inorganic treatment (NM5) recorded the lowest productivity of rice.
The significantly highest yield of rabi mustard in the initial year of the experiment was found from the integration of organic and natural inputs (NM2). In contrast, the second year of the experiment recorded a non-significant yield difference among treatments. In the third year, the 100% organic treatment (NM1) resulted in the highest yield, which was at par with the integration of organic and natural inputs (NM2), and in the final year, a similar trend was followed. The inorganic nutrient treatment (NM5) recorded the lowest yield throughout the experimental period.
Application of 100% organic nutrient input (NM1) resulted in the highest seed yield of green gram in the first year, which was at par with the integration of organic and natural inputs (NM2), integration of organic, natural, and inorganic inputs (NM4), and integration of organic and inorganic inputs (NM3), respectively. In 2019, due to the outbreak of the COVID-19 pandemic, the experiment could not be conducted; hence, the field was left fallow. Post-pandemic, the integration of organic and inorganic treatment (NM3) recorded the highest seed yield, which was statistically at par with the integration of organic, natural, and inorganic treatment (NM4). In the final year, the plot receiving 100% organic treatment (NM1) recorded the highest seed yield, which was at par with the integration of organic and inorganic inputs (NM2). The lowest yield was seen in the case of 100% inorganic treatment (NM5).
4. Discussions
4.1. Soil Physico-Chemical Indicators
The maximum WHC in the post-harvest soil was seen to be the highest in the integrated application of organic, natural, and inorganic inputs, followed by 100% organic inputs (Table 4). Adding a good amount of OC in the form of vermicompost, Dhrava Jeevamrit, and Ghana Jeevamrit might be responsible for increasing the water-retention capacity of the soil [42]. Also, this increment of WHC might be due to the enhancement of the biomass of roots helping in the development and multiplication of soil microbes, triggering a positive effect on the soil’s water-retention capacity [36]. The application of vermicompost enhances the structure of soils, thereby improving porosity and infiltration rate, and thus the WHC of the soil is increased [43]. The combination of various organic and natural farming inputs with inorganic fertilizers failed to achieve significant differences in soil BD across the experimental areas. This outcome is likely due to the relatively static nature of soil physical properties, which tend to remain stable and are not prone to substantial fluctuations over short-term experimental conditions [44]. According to [45], in the case of long-term experiments, the climatic factors and soil physical properties are not static; they were meticulously linked to the soil types, their arrangement, and the agro-ecological system.
The available nitrogen organic and carbon status in the post-harvest soil largely depends on the addition of the organic inputs and modulation in the C:N ratio [46]. Continuous addition of natural and organic inputs in various crops in the cropping system helps to build up the carbon pool in the soil and nutrient availability. In rice cultivation, combining vermicompost or poultry litter with inorganic agrochemicals resulted in higher grain production, nutrient use efficiency, and improved soil inherent status. The incorporation of organic inputs also boosted soil carbon sink, with vermicompost showing promising results [47]. These findings emphasize the importance of integrated nutrient application for sustainable crop productivity and entire soil status.
4.2. Soil Biological Indicators
The soil-dwelling microbes, especially bacteria, fungi, and actinomycetes, perform a crucial role in cycling the essential plant nutrients by acting as a source and sink for bio-chemical transformations and plant mineral nutrition [48]. It was found that the sole and combined application of organic and natural inputs (e.g., NM1, NM2, and NM4) enhanced the beneficial microbial population in the post-harvest soil, as most of these soil-dwelling microbes are chemo-autotrophs; hence, they rely on organic carbon as their food sources. Organic inputs like vermicompost add ample amounts of OC to soils, which, on oxidation, generates energy the microorganisms use [49], and a similar trend was also observed in the present experimentation (e.g., NM1 and NM2). Organic farming increases the activity and diversity of microorganisms in the soil [50]. The highest bacterial population on the post-harvest soil was recorded due to applying 100% organic inputs (NM1) in the form of vermicompost. The incorporation of organic matter enhances the dehydrogenase activity, which in return increases the bacterial population of the soil [48].
The combined application of organic and natural inputs recorded the highest value of actinomycetes in the soil (NM4). The abundance of dead food material present in the vermicompost might be the reason for this population boost [48]. Also, the application of Dhrava Jeevamrit and Ghana Jeevamrit, which are rich in microbial population, may have buffered the root rhizosphere for better co-multiplication of the soil microorganisms [44]. Application of Jeevamrit was recorded to enhance the fungal population load in rice–wheat and maize–wheat cropping systems in Punjab [51]. Integrated applications of natural, organic, and inorganic inputs resulted in the highest actinomycetes found in the post-harvest soil. The addition of a good amount of organic matter in the soil might be the cause of the increment of the actinomycetes population, as there exists a positive and strong correlation between organic matter and actinomycetes load in soil [48]. The microbes in Jeevamrit release proteins, organic acids, and antioxidants that convert soil organic matter into energy, promoting beneficial microbial growth in the rhizosphere [52].
The highest dehydrogenase activity was recorded from the integrated application of organic and natural inputs (NM2) (Table 5). The enzymatic activity of the soil is linked to the organic matter content of the soil, which is increased due to the addition of organic and natural inputs, resulting in better dehydrogenase activity in the soil [53]. Vermicompost is known to improve DHA activity, which implies that vermicompost enhances the activity of soil microbes [54]. A similar result was observed earlier [55] in wheat–maize rotation.
4.3. Soil Quality Index
SQIs varied between different soil orders and within each order depending on the soil-management practices followed by the farmers. Regarding soil physical, chemical, and biological properties, our experimental soil order, viz. inceptisol, recorded higher, and this finding is also corroborated by [56]. A total of 12 soil physical, chemical, and biological parameters were analyzed for the PCA based on their correlation to crop yield. Amongst the 12 soil parameters, only four parameters were selected based on eigenvalue, and the soil pH contributed the most, followed by OC content, total actinomycetes, and BD. Soil pH was selected as the good soil quality indicator, as it has a potential role in regulating the soil’s available essential nutrients and microbial biomass, especially in low and upland soil conditions [57]. According to [58], optimum or neutral soil pH (5.87) was found under a rice-based cropping system with a higher crop yield and soil health. Soil OC is a good indicator of high-quality soil parameters, as the higher soil OC enhances the soil microbial load, which can hasten the rate of organic matter decomposition [59]. As the soil organic matter decomposes faster, the mineralization of soil nutrients also increases and releases organic acid, buffering the soil pH and ultimately increasing the availability of essential nutrients [60]. Among the various soil microorganisms, actinomycetes play a major role in recycling soil nutrients and the production of hydrolytic enzymes. According to [61], actinomycetes perform like a solubilizing agent in the soil; they solubilize the phosphate, promote nitrogen fixation, and increase the siderophores’ production in the soil. While soil physical parameters like BD always show a negative correlation with organic matter content, therefore lower bulk density is considered to be the better-quality soil. Integration of organic inputs in the soil reduces the bulk density by improving the porosity of the soil [33].
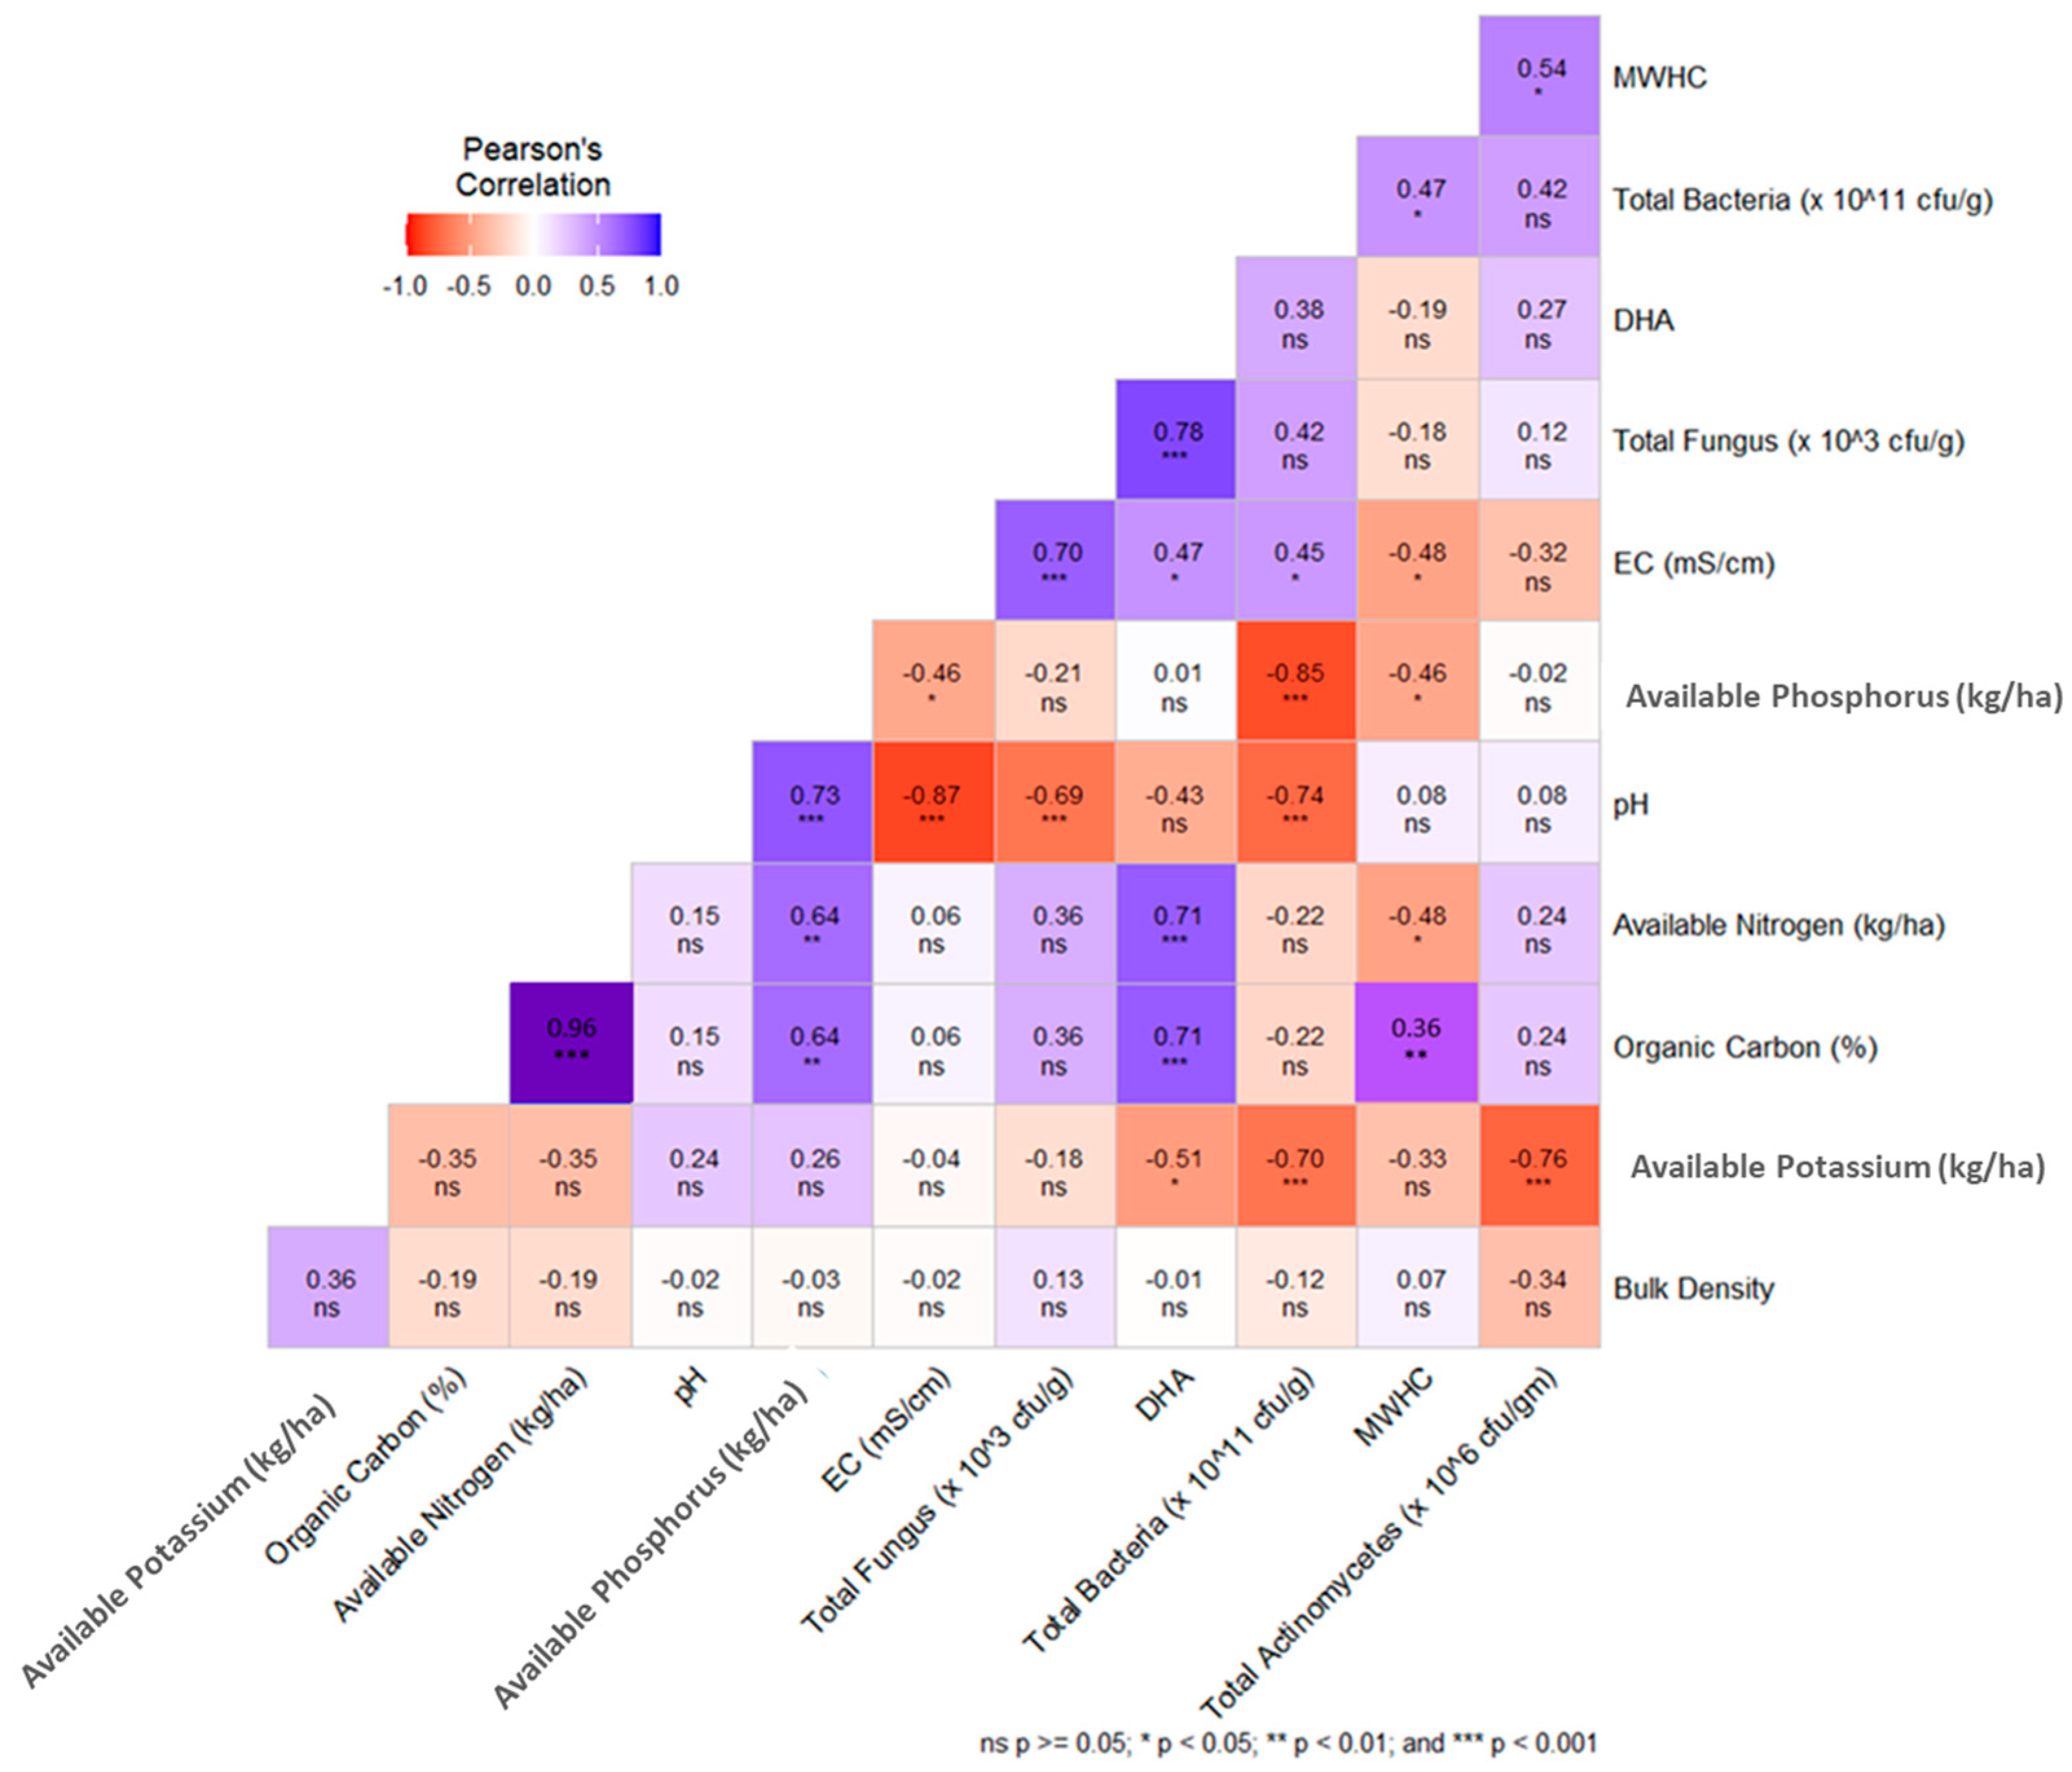
The Pearson correlation matrix between several soil physical, chemical, and biological parameters is presented in Figure 6. The OC recorded a highly positive relationship (p < 0.001) with available nitrogen content (R2 = 0.96), available phosphorus (R2 = 0.64, p < 0.01) DHA (R2 = 0.71, (p < 0.001), and maximum water holding capacity (R2 = 0.36, p < 0.01). BD builds a negative relationship with most of the soil quality parameters except soil available potassium.

Figure 6.
Pearson’s correlation matrix of all soil quality indicating factors.
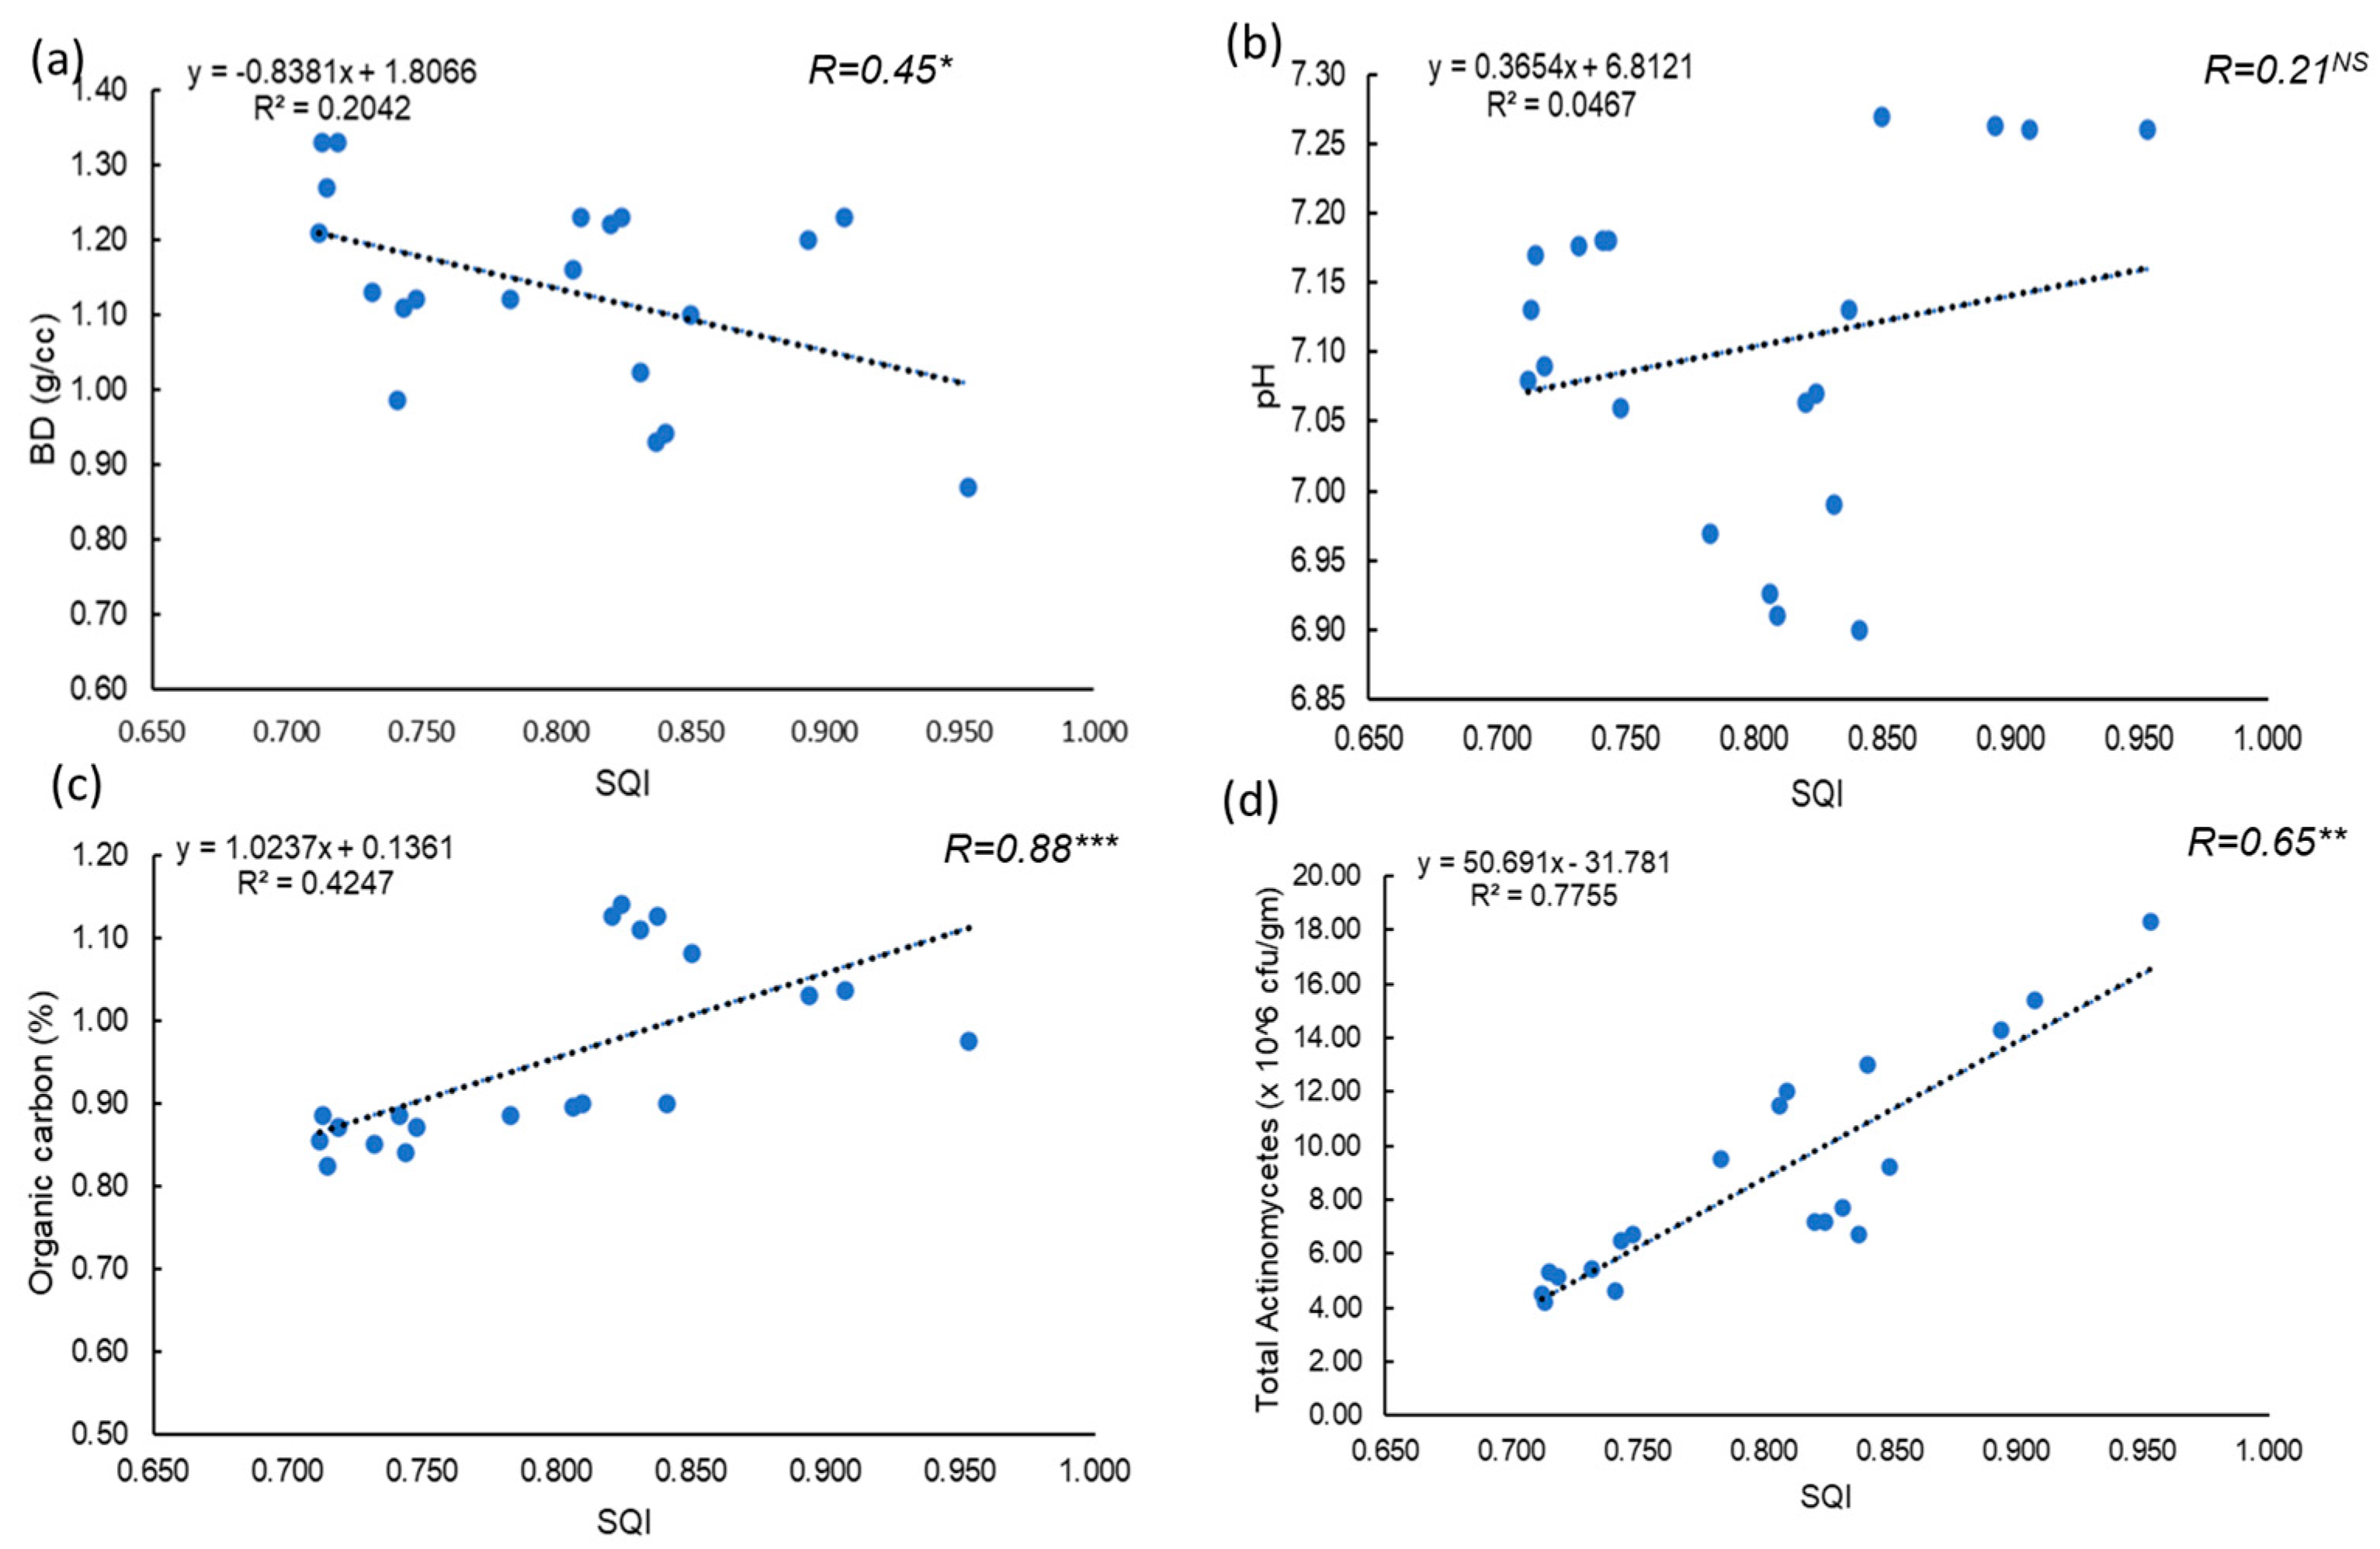
A strong negative correlation was observed between the SQI and BD of the experimental soil, indicating that lower BD improves soil physical properties (Figure 7). This is consistent with the “less is better” scoring approach applied to BD in the minimum data set for soil quality assessment [62]. The relationship between SQI and soil pH was scattered, suggesting that optimal pH is crucial for the availability of macro- and micronutrients, enhancing root uptake and plant growth [63]. A strong positive correlation was found between SQI and soil OC content, highlighting the importance of organic carbon as a key indicator of soil health, as it promotes microbial activity and nutrient cycling [64]. Additionally, a positive correlation between SQI and total actinomycetes count was observed, emphasizing the role of actinomycetes as vital soil microbes that contribute to enhanced organic matter decomposition and nutrient recycling [61].
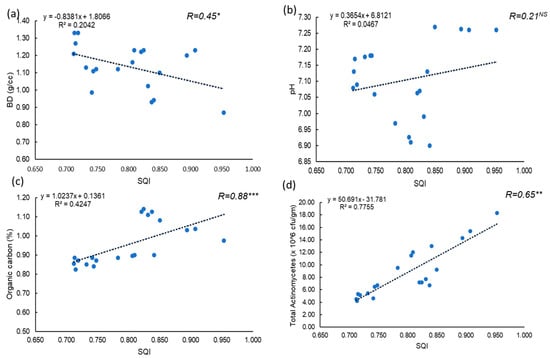
Figure 7.
Relationship between soil quality index (SQI) and (a) Bulk density/cc, (b) Soil pH, (c) organic carbon, and (d) Total actinomycetes (×106 cfu/gm) [Abbreviation: *** correlation is significant at 0.001 level, ** correlation is significant at 0.01 level, * correlation is significant at p ≤ 0.05 level].
4.4. Productivity of the Cropping System:
The yield of all three crops of the cropping system was significantly influenced by different natural and organic input-based INM treatments. The yield of rice, mustard, and green gram throughout the experiment was found to be highest in the case of the organic, combination of natural and organic, and integration of organic, natural, and inorganic input treatments.
The increment in grain yield of rice might be due to the production of more effective tillers, grain per panicle, and panicle weight as influenced by organic and integrated treatments. Organic manure provides essential plant nutrients in a steady and synchronized form, leading to their better availability throughout the growth stages, resulting in better and vigorous growth and, consequently, more production [65]. Similar results were recorded earlier [66]. This slow release of nutrients leads to better photosynthesis and enhanced translocation of photosynthates from the sink to the source of rice [67]. The increased rice yield with organic and natural inputs, such as vermicompost, Ghana Jeevamrit, and Dhrava Jeevamrit, may be due to better and consistent availability of macro- and micronutrients in plant-available ionic forms.
The increment of seed yield in mustard might be due to better availability of both macro- and micronutrients and some essential plant growth-promoting hormones, which overall increased the growth parameters and yield components like the number of siliquae per plant, the number of seeds per siliqua, and the test weight of the plants where organic and natural nutrient inputs were applied. Similar results were also found due to the sole and integrated application of various organic manures in mustard [68,69,70]. Growth-promoting substances like IAA, GA, cytokinin, and beneficial microorganisms in Jeevamrit enhance leaf area, photosynthesis, and nutrient flow, boosting yield. Additionally, foliar spraying of Jeevamrit may stimulate the plant’s production of growth regulators, promoting better growth and development and leading to higher yields [71]. These findings are similar to [72], where the integration of natural and organic inputs recorded the best results in mustard.
Applying organic inputs like vermicompost enhances nutrient availability and supply to plants, promoting flowering, seed formation, and increased yield components such as pods per plant, seeds per pod, and test weight of green gram [73]. In addition, sources are good reservoirs of plant growth regulators, especially several phytohormones and bioactive substances, which actively take part in plant root and shoot elongation [74]. Organics release nutrients slowly, reducing losses and ensuring long-term availability, allowing plants to absorb nutrients needed for better growth and development. The decomposition of organic matter releases macro- and micronutrients, supporting soil microflora, which in turn facilitates nutrient absorption by plants and boosts seed development [75]. Foliar applications of natural inputs enhance cell elongation, photosynthesis, and efficient translocation of photosynthates from source to sink, leading to better seed yield of green gram [76].
5. Conclusions
Integrating natural and organic inputs has proven highly effective in enhancing soil quality, a key indicator of soil health, while ensuring robust yields in the rice–mustard–green gram cropping system. These inputs, such as vermicompost, Ghana Jeevamrit, and Dhrava Jeevamrit, not only improve the physical properties of the soil by lowering bulk density but also enhance its biological activity by stimulating microbial populations. As a result, these helps improve the availability of essential nutrients, leading to improved plant growth and higher crop yields. The slow release of nutrients from organic inputs ensures a sustained supply over the cultivation time, reducing nutrient losses and promoting long-term soil fertility. Thus, integrating natural and organic inputs represents a viable, eco-friendly approach to achieving sustainable agriculture while preserving soil health for future generations.
Supplementary Materials
The following supporting information can be downloaded at: https://www.mdpi.com/article/10.3390/land13111933/s1, Figure S1: Path diagram of the PCA; Table S1: Procedure of preparation of the organic and natural inputs [77].
Author Contributions
Conceptualization; G.C., N.R., S.M., A.C. and S.S.; Methodology; G.C., N.R., S.M., A.C., S.S., A.D. and S.D.; Software; S.S., A.D. and S.D.; Validation; G.C. and S.S.; Formal analysis; G.C., S.S., A.D., S.D., S.M., A.C. and S.K.C.; Investigation: G.C., S.S., S.K.C., A.D., S.D., S.M. and A.C.; Resources; G.C., S.S. and N.R.; data curation; S.M., A.C. and S.K.C.; writing—original draft preparation; S.S., A.D., S.D. and S.K.C.; writing—review and editing; S.S., G.C., S.M., A.C., M.M. and N.R.; visualization; A.D., S.D. and S.S.; supervision; G.C. and S.S.; project administration; S.S., G.C., M.M. and N.R.; funding acquisition; M.M. and N.R. All authors have read and agreed to the published version of the manuscript.
Funding
The study is funded by the Indian Council of Agricultural Research (ICAR), (Ref. No. F. No.1-42/NPOF/201), Government of India, through the project ‘All-India Network Programme on Organic Farming (AI-NPOF)’.
Data Availability Statement
The raw data supporting the conclusions of this article will be made available by the authors on request.
Acknowledgments
This work was supported by the All-India Network Programme on Organic Farming (AI-NPOF), funded by the Indian Council of Agricultural Research (ICAR), Government of India to NR, and GC. Authors acknowledge the Ramakrishna Mission Vivekananda Educational and Research Institute (RKMVERI). Facilities provided under the program by both of these organizations to complete this study are duly acknowledged.
Conflicts of Interest
The authors declare no conflicts of interest. The funders had no role in the design of the study; in the collection, analyses, or interpretation of data; in the writing of the manuscript; or in the decision to publish the results.
References
- Muthayya, S.; Sugimoto, J.D.; Montgomery, S.; Maberly, G.F. An overview of global rice production, supply, trade, and consumption. Ann. N.Y. Acad. Sci. 2014, 1324, 7–14. [Google Scholar] [CrossRef] [PubMed]
- Das, T.K.; Nath, C.P.; Das, S.; Biswas, S.; Bhattacharyya, R.; Sudhishri, S.; Raj, R.; Singh, B.; Kakralia, S.K.; Rathi, N.; et al. Conservation Agriculture in rice-mustard cropping system for five years: Impacts on crop productivity, profitability, water-use efficiency, and soil properties. Field Crops Res. 2020, 250, 107781. [Google Scholar] [CrossRef]
- Shankar, T.; Maitra, S.; Ram, M.S.; Mahapatra, R. Influence of integrated nutrient management on growth and yield attributes of summer rice (Oryza sativa L.). Crop Res. 2020, 55, 1–5. [Google Scholar]
- Ashok, K.; Nishant, K.S.; Pankaj, K.T. Soil microbial, chemical properties and crop productivity as affected by organic manure application in popcorn (Zea mays L. var. everta). Afr. J. Microbiol. Res. 2015, 9, 1402–1408. [Google Scholar]
- Meena, B.P.; Biswas, A.K.; Singh, M.; Chaudhary, R.S.; Singh, A.B.; Das, H.; Patra, A.K. Long-term sustaining crop productivity and soil health in maize–chickpea system through integrated nutrient management practices in Vertisols of central India. Field Crops Res. 2019, 232, 62–76. [Google Scholar] [CrossRef]
- Pingali, P.L. Green revolution: Impacts, limits, and the path ahead. Proc. Natl. Acad. Sci. USA 2012, 109, 12302–12308. [Google Scholar] [CrossRef]
- Meena, B.P.; Kumar, A.; Meena, S.R.; Dhar, S.; Rana, D.S.; Rana, K.S. Effect of sources and levels of nutrients on growth and yield behaviour of pop corn (Zea mays) and potato (Solanum tuberosum) sequence. Indian J. Agron. 2013, 58, 474–479. [Google Scholar] [CrossRef]
- Nagavani, A.V.; Subbian, P. Effect of organics and inorganics on soil microbial population and enzymatic activity in maize-maize cropping system. Progress. Agric. 2015, 15, 9–14. [Google Scholar]
- Palekar, S. Zero Budget Natural Farming: Five Layers Palekar’s Model (Part 1) Zero Budget Amravati; Natural Farming Research, Development and Extension Movement: Maharashtra, India, 2006. [Google Scholar]
- Mukherjee, S.; Sain, S.; Ali, M.N.; Goswami, R.; Chakraborty, A.; Ray, K.; Bhattacharjee, R.; Pradhan, B.; Ravisankar, N.; Chatterjee, G. Microbiological properties of Beejamrit, an ancient Indian traditional knowledge, uncover a dynamic plant beneficial microbial network. World J. Microbiol. Biotechnol. 2022, 38, 111. [Google Scholar] [CrossRef]
- Choudhary, R.; Sharma, R.P.; Rana, N.; Dev, P.; Sharma, G.D.; Kumar, R. Effect of natural farming on yield performances, soil health, and nutrient uptake in wheat+ gram intercropping system in sub-temperate regions of Himachal Pradesh. J. Crop Weed 2022, 18, 1–8. [Google Scholar] [CrossRef]
- Rautela, S.; Bains, G.; Singh, D.K.; Jahan, S.; Thi, T. Effect of organic, inorganic and integrated nutrient amendments on growth parameters of basmati rice (Oryza sativa L.). Agric. Ecosyst. Environ. 2022, 140, 339–353. [Google Scholar]
- Darjee, S.; Pooja, L.R.; Khandelwal, A.; Dhar, S.; Shrivastava, M.; Singh, R. Integrated application of inorganic and bio-fertilizers affects nitrogen losses and yield of wheat (Triticum aestivum L.). Ann. Agric. Res. 2022, 43, 127–133. [Google Scholar]
- Killham, K. Integrated soil management–moving towards globally sustainable agriculture. J. Agric. Sci. 2011, 149 (Suppl. S1), 29–36. [Google Scholar] [CrossRef]
- Teja, K.C.; Duary, B. Weed management and rapeseed mustard productivity in conservation agriculture-based rice-yellow mustard-green gram cropping system in lateritic belt of West Bengal. Indian J. Weed Sci. 2018, 50, 340–344. [Google Scholar] [CrossRef]
- Thierfelder, C.; Cheesman, S.; Rusinamhodzi, L. A comparative analysis of conservation agriculture systems: Benefits and challenges of rotations and intercropping in Zimbabwe. Field Crops Res. 2012, 137, 237–250. [Google Scholar] [CrossRef]
- Chaudhry, H.; Vasava, H.B.; Chen, S.; Saurette, D.; Beri, A.; Gillespie, A.; Biswas, A. Evaluating the Soil Quality Index Using Three Methods to Assess Soil Fertility. Sensors 2024, 24, 864. [Google Scholar] [CrossRef]
- Mukherjee, A.; Lal, R. Comparison of soil quality index using three methods. PLoS ONE 2014, 9, e105981. [Google Scholar] [CrossRef]
- Gelaw, A.M.; Singh, B.R.; Lal, R. Soil quality indices for evaluating smallholder agricultural land uses in northern Ethiopia. Sustainability 2015, 7, 2322–2337. [Google Scholar] [CrossRef]
- Directorate of Agriculture. Estimates of Area, Yield Rate & Production of Principal Crops in West Bengal; Evaluation Wing, Government of West Bengal: Kolkata, West Bengal, India, 2022; p. 81. [Google Scholar]
- Subbiah, B.V.; Asija, G.L. A rapid procedure for assessment of available nitrogen in soils. Curr. Sci. 1956, 31, 196–260. [Google Scholar]
- Olsen, S.R.; Cole, C.V.; Watanale, F.S.; Dean, L.A. Estimation of Available Phosphorus in Phosphorus in Soils by Extraction with Sodium Bicarbonate; United States Department of Agriculture: Washington, DC, USA, 1954. [Google Scholar]
- Brown, A.J.; Warncke, D. Recommended Chemical Soil Test Procedures for the North Carolina Region; Bullet number 499; Dahnke, W.C., Ed.; North Dakota Agricultural Experimental Station: Fargo, ND, USA, 1988; pp. 15–16. [Google Scholar]
- Jackson, M.L. Soil Chemical Analysis; Prentice Hall of India Pvt. Ltd.: New Delhi, India, 1973; pp. 183–347, 387–408. [Google Scholar]
- Walkley, A.; Black, I.A. An examination of the Deggareff method for determining soil organic matter and a proposed modification of the chronic acid titration method. Soil Sci. 1934, 37, 29–38. [Google Scholar] [CrossRef]
- Blake, G.R.; Hartge, K.H.; Peterson, R.G.; Calvin, L.D. Methods of Soil Analysis, Part 1. In Bulk Density; Klute, A., Ed.; American Society of Agronomy: Madison, WI, USA, 1986; Chapter 13; pp. 363–376. [Google Scholar]
- Alexander, M. Introduction to soil microbiology. Soil Sci. 1978, 125, 331. [Google Scholar] [CrossRef]
- Das, K.; Tiwari, R.K.S.; Shrivastaava, D.K. Techniques for evaluation of medicinal plant products as antimicrobial agent: Current methods and future trends. J. Med. Plants Res. 2010, 4, 104–111. [Google Scholar]
- Tabatabai, M.A. Soil Enzymes. In Methods of Soil Analysis. Part 2. Chemical and Microbiological Properties; Academic Press: New York, NY, USA, 1982; pp. 903–947. [Google Scholar]
- Bouyoucos, G.J. Hydrometer method improved for making particle size analysis of soils. Agron. J. 1962, 54, 464–465. [Google Scholar] [CrossRef]
- Brady, N.C.; Weil, R.R. The Nature and Properties of Soils, 11th ed.; Prentice Hall: Upper Saddle River, NJ, USA, 1996. [Google Scholar]
- Vasu, D.; Singh, S.K.; Ray, S.K.; Duraisami, V.P.; Tiwary, P.; Chandran, P.; Nimkar, A.M.; Anantwar, S.G. Soil quality index (SQI) as a tool to evaluate crop productivity in semi-arid Deccan plateau, India. Geoderma 2016, 282, 70–79. [Google Scholar] [CrossRef]
- Kumar, M.; Singh, S.K.; Patra, A. Effect of different nutrient sources on yield and biochemical properties of soil under rice–wheat cropping sequence in middle Gangetic alluvial plain. J. Plant Nutr. 2021, 44, 2310–2330. [Google Scholar] [CrossRef]
- Andrews, S.S.; Karlen, D.L.; Mitchell, J.P. A comparison of soil quality indexing methods for vegetable production systems in northern California. Agric. Ecosyst. Environ. 2002, 90, 25–45. [Google Scholar] [CrossRef]
- Waswa, B.S.; Vlek, P.L.G.; Tamene, L.D.; Okoth, P.; Mbakaya, D.; Aingore, S. Evaluating indicators of land degradation in smallholder farming systems of western Kenya. Geoderma 2013, 195, 192–200. [Google Scholar] [CrossRef]
- Kumar, M.; Mitra, S.; Mazumdar, S.P.; Majumdar, B.; Saha, A.R.; Singh, S.R.; Pramanick, B.; Gaber, A.; Alasnie, W.F.; Hossain, A. Improvement of soil health and system productivity through crop diversification and residue incorporation under jute-based different cropping systems. Agronomy 2021, 11, 1622. [Google Scholar] [CrossRef]
- Gangaiah, B.; Kundu, A.; Abirami, K.; Swain, S.; Subramani, T.; Ahmed, S.Z. Organic Farming in Tropical Islands of India; First Printed in: November, 2017 Number of Copies; ICAR-Central Island Agricultural Research Institute: Port Blair, India, 2017; Volume 150, pp. 1–250. [Google Scholar]
- Damiba, W.A.F.; Gathenya, J.M.; Raude, J.M.; Home, P.G. Soil quality index (SQI) for evaluating the sustainability status of Kakia-Esamburmbur catchment under three different land use types in Narok County, Kenya. Heliyon 2024, 10, e25611. [Google Scholar] [CrossRef]
- Sarkar, S.; Brahmachari, K.; Gaydon, D.S.; Dhar, A.; Dey, S.; Mainuddin, M. Options for Intensification of Cropping System in Coastal Saline Ecosystem: Inclusion of Grain Legumes in Rice-Based Cropping System. Soil Syst. 2024, 8, 90. [Google Scholar] [CrossRef]
- Sharma, P.; Roy, M.; Roy, B. Determining the Effect of Storage, Moisture and Temperature on Vigour and Viability of Rapeseed and Mustard. Curr. Top. Agric. Sci. 2021, 5, 39–51. [Google Scholar]
- Gomez, K.A.; Gomez, A.A. Statistical Procedures for Agricultural Research; John Wiley & Sons. Inc.: New York, NY, USA, 1984. [Google Scholar]
- Pant, P.K.; Ram, S. Long-term manuring and fertilization effects on soil physical properties after forty two cycles under rice-wheat system in North Indian Mollisols. Int. J. Curr. Microbiol. Appl. Sci. 2018, 7, 232–240. [Google Scholar] [CrossRef]
- Castellini, M.; Bondì, C.; Giglio, L.; Iovino, M. Impact of vermicompost addition on water availability of differently textured soils. Heliyon 2024, 10, e35699. [Google Scholar] [CrossRef] [PubMed]
- Gurjar, R.P.S.; Bhati, D.; Singh, S.K. Impact of Jeevamrut formulations and biofertilizers on soil microbial and chemical attributes during potato cultivation. J. Appl. Biol. Biotechnol. 2024, 12, 158–171. [Google Scholar] [CrossRef]
- Robinson, D.A.; Thomas, A.; Reinsch, S.; Lebron, I.; Feeney, C.J.; Maskell, L.C.; Wood, C.M.; Seaton, F.M.; Emmett, B.A.; Cosby, B.J. Analytical modelling of soil porosity and bulk density across the soil organic matter and land-use continuum. Sci. Rep. 2022, 12, 7085. [Google Scholar] [CrossRef]
- Debska, B.; Kotwica, K.; Banach-Szott, M.; Spychaj-Fabisiak, E.; Tobiašová, E. Soil fertility improvement and carbon sequestration through exogenous organic matter and biostimulant application. Agriculture 2022, 12, 1478. [Google Scholar] [CrossRef]
- Farooqi, Z.U.R.; Qadir, A.A.; Khalid, S.; Murtaza, G.; Ashraf, M.N.; Javed, W.; Waqas, M.A.; Xu, M. Greenhouse gas emissions, carbon stocks and wheat productivity following biochar, compost and vermicompost amendments: Comparison of non-saline and salt-affected soils. Sci. Rep. 2024, 14, 7752. [Google Scholar]
- Gorde, N.B.; Zade, S.P.; Bodke, V.S.; Nakhate, P.S. Effect of organic farming on enzymatic activity and microbial populations of soybean. Pharma Innov. J. 2022, 11, 2182–2186. [Google Scholar]
- Ingle, A.P.; Duran, N.; Rai, M. Bioactivity, mechanism of action, and cytotoxicity of copper-based nanoparticles: A review. Appl. Microbiol. Biotechnol. 2014, 98, 1001–1009. [Google Scholar] [CrossRef]
- Furtak, K.; Gałązka, A. Effect of organic farming on soil microbiological parameters. Pol. J. Soil Sci. 2019, 52, 259. [Google Scholar] [CrossRef]
- Aulakh, C.S.; Singh, H.; Walia, S.S.; Phutela, R.P.; Singh, G. Evaluation of microbial culture (Jeevamrit) preparation and its effect on productivity of field crops. Indian J. Agron. 2013, 58, 182–186. [Google Scholar] [CrossRef]
- Devakumar, N.; Shubha, S.; Gowder, S.B.; Rao, G.G. Microbial analytical studies of traditional organic preparations Beejamrutha and Jeevamrutha. Build. Org. Bridges 2014, 2, 639–642. [Google Scholar]
- Adak, T.; Singha, A.; Kumar, K.; Shukla, S.K.; Singh, A.; Kumar Singh, V. Soil organic carbon, dehydrogenase activity, nutrient availability and leaf nutrient content as affected by organic and inorganic source of nutrient in mango orchard soil. J. Soil Sci. Plant Nutr. 2024, 14, 394–406. [Google Scholar] [CrossRef]
- Toor, M.D.; Anwar, A.; Koleva, L.; Eldesoky, G.E. Effects of vermicompost on soil microbiological properties in lettuce rhizosphere: An environmentally friendly approach for sustainable green future. Environ. Res. 2024, 243, 117737. [Google Scholar] [CrossRef] [PubMed]
- Wu, H.; Jiang, Y.; Chen, X.; Qin, M.; Guo, D. Vermicompost application enhances soil microbial biomass and activity in a wheat–corn rotation system. J. Soil. Sci. Plant Nutr. 2019, 19, 69–79. [Google Scholar]
- Basak, N.; Datta, A.; Biswas, S.; Mitran, T.; Mandal, B. Organic amendment influences soil quality in farmers’ field under rice-based cropping systems in Indo-Gangetic Plains of India. J. Indian Soc. Soil. Sci. 2016, 64, 138–147. [Google Scholar] [CrossRef]
- Shahid, M.; Nayak, A.K.; Shukla, A.K.; Tripathi, R.; Kumar, A.; Mohanty, S.; Bhattacharyya, P.; Raja, R.; Panda, B.B. Long-term effects of fertilizer and manure applications on soil quality and yields in a sub-humid tropical rice-rice system. Soil Use Manag. 2013, 29, 322–332. [Google Scholar] [CrossRef]
- Ghoshal, S.K. Studies on Biological Attributes of Soil Quality for a few Long-Term Fertility Experiments with Rice Base Cropping Systems. Ph.D. Thesis, Bidhan Chandra Krishi Viswavidyalaya, West Bengal, India, 2004. [Google Scholar]
- Biswas, S.; Hazra, G.C.; Purakayastha, T.J.; Saha, N.; Mitran, T.; Roy, S.S.; Basak, N.; Mandal, B. Establishment of critical limits of indicators and indices of soil quality in rice-rice cropping systems under different soil orders. Geoderma 2017, 292, 34–48. [Google Scholar] [CrossRef]
- Sharma, K.L.; Grace, J.K.; Mandal, U.K.; Gajbhiye, P.N.; Srinivas, K.; Korwar, G.R.; Bindu, V.H.; Ramesh, V.; Ramachandran, K.; Yadav, S.K. Evaluation of long-term soil management practices using key indicators and soil quality indices in a semi-arid tropical Alfisol. Soil Res. 2008, 46, 368–377. [Google Scholar] [CrossRef]
- Bhatti, A.A.; Haq, S.; Bhat, R.A. Actinomycetes benefaction role in soil and plant health. Microb. Pathog. 2017, 111, 458–467. [Google Scholar] [CrossRef]
- Logsdon, S.D.; Karlen, D.L. Bulk density as a soil quality indicator during conversion to no-tillage. Soil Tillage Res. 2004, 78, 143–149. [Google Scholar] [CrossRef]
- Dewangan, S.K.; Kumari, L.; Minj, P.; Kumari, J.; Sahu, R. The Effects of Soil ph on Soil Health and Environmental Sustainability: A Review; JETIR: Mumbai, India, 2023. [Google Scholar]
- Liptzin, D.; Norris, C.E.; Cappellazzi, S.B.; Mac Bean, G.; Cope, M.; Greub, K.L.; Rieke, E.L.; Tracy, P.W.; Aberle, E.; Ashworth, A.; et al. An evaluation of carbon indicators of soil health in long-term agricultural experiments. Soil Biol. Biochem. 2022, 172, 108708. [Google Scholar] [CrossRef]
- Sathiyabama, N.; Aruna, L.; Illakia, K.; Dhayanithi, C.; Naresh, V.S.V.G.; Jayaraghavi, R.; Mageshen, V.R. Effect of Organic Manure on Growth and Yield of Transplanted Rice (Oryza sativa L.) under Coastal Cauvery Deltaic Region. Int. J. Curr. Microbiol. App. Sci. 2021, 10, 715–728. [Google Scholar]
- Gupta, V.; Sharma, R.S.; Vishwakarma, S.K. Long-term effect of integrated nutrient management on yield sustainability and soil fertility of rice (Oryza sativa)–wheat (Triticum aestivum) cropping system. Indian J. Agron. 2006, 51, 160–164. [Google Scholar] [CrossRef]
- Yeptho, K.V.; Gohain, T.; Dkhar, K.; Kithan, L. Effect of different organic inputs on growth and yield of rice under upland rainfed condition of Nagaland. Res. J. Agric. Sci. 2023, 14, 1214–1217. [Google Scholar]
- Mishra, S.K.; Gangwar, B.; Patel, M.; Kumar, Y.; Sahu, M.M.P. Effect of organic nutrient management on mustard (Brassica juncea L.) growth and yield in semi-arid region. Pharma Innov. 2023, 12, 76–79. [Google Scholar]
- Kumar, A.; Kumar, A.; Yogesh Yadav, L.K.; Kumar, R. Effect of organic management practices on growth, yield attributes and grain yield in mustard (Brassica juncea (L.) Czern. & Cosson). Int. J. Curr. Microbiol. Appl. Sci. 2018, 7, 3–585. [Google Scholar]
- Yashi, D.; Nyori, T.; Bhuyan, T.; Devadas, V.S.; Monlai, S. Effect of different organic manures on growth and yield of mustard (Brassica juncea L.). Pharma Innov. J. 2023, 12, 2290–2293. [Google Scholar]
- Thakare, U.E.; Chavan, A.P.; Bodake, P.S.; Mahadkar, U.V.; Sawardekar, S.V.; Salvi, V.G. Influence of organic manures and organic sprays on growth and yield of rice (Oryza sativa L.). Pharma Innov. J. 2023, 12, 2568–2571. [Google Scholar]
- Kumar, P.; Kumar, R.; Kumar, N.; Rajput, A.; Yadav, D.N.; Baheliya, A.K. Organic source based nutrient management practices on growth and yield of Indian mustard. Ann. Plant Soil Res. 2023, 25, 193–196. [Google Scholar] [CrossRef]
- Shariff, A.F.; Sajjan, A.S.; Babalad, H.B.; Nagaraj, L.B.; Palankar, S.G. Effect of organics on seed yield and quality of green gram (Vigna radiata L.). Legume Res.-Int. J. 2017, 40, 388–392. [Google Scholar]
- Gadi, P.A.R.V.A.T.I.; Dawson, J.; Shankar, M. Effect of different organic manures, inorganic fertilizers and growth regulator on yield attributes and yield of greengram (Vigna radiata L.). Int. J. Curr. Res. 2017, 12, 1567–1572. [Google Scholar]
- Patel, M.; Gangwar, B. Effect of organic nutrient management on growth and yield of Green Gram (Vigna radiata L.,) under Semi-arid Region. Int. J. Plant Soil Sci. 2023, 35, 514–523. [Google Scholar] [CrossRef]
- Chaudhari, S.N.; Patel, P.H.; Chaudhari, P.R. Effect of organic formulations on growth and yield of summer greengram (Vigna radiata L.). Int. J. Res. Agron. 2024, 7, 404–408. [Google Scholar] [CrossRef]
- Singh, S.; Singh, A.B.; Mandal, A.; Thakur, J.K.; Das, A.; Rajput, P.S.; Sharma, G.K. Chemical and Microbial characterization of organic supplements and compost used in agriculture. Emergent Life Sci. Res. 2023, 9, 234–244. [Google Scholar] [CrossRef]
Disclaimer/Publisher’s Note: The statements, opinions and data contained in all publications are solely those of the individual author(s) and contributor(s) and not of MDPI and/or the editor(s). MDPI and/or the editor(s) disclaim responsibility for any injury to people or property resulting from any ideas, methods, instructions or products referred to in the content. |
© 2024 by the authors. Licensee MDPI, Basel, Switzerland. This article is an open access article distributed under the terms and conditions of the Creative Commons Attribution (CC BY) license (https://creativecommons.org/licenses/by/4.0/).