Article

A Multi-Objective Optimization Framework for Coupled Grey–Green Infrastructure of Areas with Contamination-Induced Water Shortages Under Future Multi-Dimensional Scenarios

1
The College of Landscape Architecture, Nanjing Forestry University, Nanjing 210037, China
2
China Railway 22nd Bureau Group Real Estate Development Co., Ltd., Beijing 100043, China
*
Author to whom correspondence should be addressed.
These authors contributed equally to this work and should be considered co-first authors.
Land 2024, 13(11), 1932; https://doi.org/10.3390/land13111932
Submission received: 14 October 2024 / Revised: 12 November 2024 / Accepted: 15 November 2024 / Published: 16 November 2024

Abstract

:
Stormwater resource utilization is an important function of coupled grey–green infrastructure (CGGI) that has received little research focus, especially in multi-objective optimization studies. Given the complex water problems in areas with contamination-induced water shortages, it is important to incorporate more objectives into optimization systems. Therefore, this study integrated economic performance, hydrological recovery, water quality protection, and stormwater resource utilization into an optimization framework based on the non-dominant sorting genetic algorithm III (NSGA-III). A sponge city pilot area with contamination-induced water shortages in the Yangtze River Delta was considered, optimizing four objectives under different future multi-dimensional scenarios. The results showed a time series and scenarios composed of shared socioeconomic pathways and representative concentration pathways (SSP-RCP scenarios) which, together, affected future climate change and the benefits of a CGGI. In the near and middle periods, the SSP126 scenario had the greatest influence on stormwater management, whereas, in the far period, the SSP585 scenario had the greatest influence. The far period had the greatest influence under three SSP-RCP scenarios. Under the combined influence of SSP-RCP scenarios and a time series, the SSP585-F scenario had the greatest impact. Specific costs could be used to achieve different and no stormwater-resource utilization effects through different configurations of the CGGI. This provided various construction ideas regarding CGGIs for areas with contamination-induced water shortages.

1. Introduction

In recent decades, because of the dual impacts of urbanization and climate change, water-related problems such as urban waterlogging, runoff pollution, and water shortages have become increasingly serious [1,2]. Accelerated urbanization has gradually replaced permeable surfaces with impermeable surfaces, making it difficult for stormwater to infiltrate the ground. As a result, large amounts of surface runoff are generated, leading to waterlogging, water pollution, and the loss of water resources [3,4]. Furthermore, increased precipitation and drought events caused by climate change have intensified the frequency and severity of urban water problems [5,6]. Therefore, it is crucial to develop effective stormwater management strategies [7].
The complexity of urban water problems means that stormwater management must solve multi-objective problems. Therefore, researchers have developed various strategies such as green infrastructure (GI) [8], grey infrastructure (GREI) [9], and the coupled grey–green infrastructure (CGGI) [10] based on site characteristics and stormwater management demands [11,12]. GI is a type of natural system that handles stormwater runoff [8], consisting of small-scale bioretention facilities, green roofs, permeable pavements, and large-scale natural spaces (such as forests, rivers, and parks). GI, emphasizing source and decentralization control, can restore the natural hydrological state of cities by effectively promoting stormwater infiltration, removing runoff pollutants, and recharging more groundwater [13]. GREI is a type of artificial measure used for urban drainage and flood control, including pipe networks, deep tunnels, storage tanks, and pump stations [9]. GREI is the main stormwater engineering measure in cities and can play roles of rapid drainage and flood storage when stormwater becomes an issue. GI and GREI have their own advantages and disadvantages; for example, GI is more ecologically friendly and sustainable than GREI [14] and GREI has a more powerful drainage capacity and better reliability and stability than GI [15]. CGGI refers to the system that couples GI and GREI in order to achieve complementary advantages [10]. CGGI combines the strengths of both infrastuctures, effectively enhancing diversity and maximization of stormwater management benefits [16]. Among these strategies, CGGI has become a mainstream trend [17] and has been widely used in the practises of low-impact development, best management practises, and sponge cities [15].
Given that the coupling advantages of CGGI can solve multi-objective problems, policymakers are increasingly concerned with configuration schemes that can achieve the maximum benefits at minimal cost and effective trade-offs between multiple objectives [18]. Intelligent optimization algorithms can automatically determine the optimum schemes to effectively solve multi-objective optimization problems by setting explicit optimization objectives, decision variables, and constraints [19]. Common intelligent optimization algorithms include simulated annealing, ant colony optimization, particle swarm optimization, the genetic algorithm, and so on [20]. Researchers have developed various multi-objective optimization frameworks that combined intelligent optimization algorithms with stormwater management models to explore the optimal CGGI [21,22,23]. Currently, the most widely applied optimization algorithm is the non-dominant sorting genetic algorithm II (NSGA-II) [24]. The non-dominant sorting genetic algorithm (NSGA) [25] is an algorithm that effectively deals with complex, multivariate, and nonlinear optimization problems by simulating selection, variation, and genetic mechanisms in the process of biological evolution. Based on the NSGA, Deb et al. [24] developed NSGA-II, which can use fast non-dominant sorting and crowding comparisons to realize the efficient selection of excellent populations by analyzing the dominance relationship and distribution density among individuals. Dong et al. [26] incorporated carbon emission reduction benefits into a multi-objective optimization framework to explore the best trade-off between hydrology, environment, and economy of the CGGI in a sponge city pilot area in Nanchang, China. Wang et al. [27] used life cycle cost, technological resilience, and operational resilience as optimization objectives to conduct a contrastive study on the multi-objective optimization of CGGI in two areas with different development intensities in Guangzhou, China. Liu et al. [28] proposed a multi-objective optimization methodology for CGGI, adapting the spatial heterogeneity of natural endowment and urban development, and then explored the trade-off between runoff control benefits, capital investment, and ecological return on investment, using Wuhan, China, as the research area. Currently, economic performance, hydrological recovery, and water quality protection are the most studied optimization objectives because cost, hydrology, and water quality are the three most important aspects for decision makers to consider [6,17]. However, few studies have included stormwater resource utilization in multi-objective optimizations. In the context of climate change, the long duration of high temperatures and frequent extreme drought events in summer will also cause serious water shortages [29,30]; therefore, stormwater resource utilization is an important aspect that cannot be ignored in urban stormwater management. In particular, in areas with contamination-induced water shortages, the stormwater resource utilization potential of CGGI should be given more attention. Water resources are abundant in areas with contamination-induced water shortages, but few such water resources are available due to pollution [31,32]. Areas with contamination-induced water shortages have great potential for using stormwater resources to relieve the pressure of water shortages, due to the natural characteristic advantages of abundant rainfall and rich water systems. However, studies on stormwater management in this type of area rarely consider the inclusion of stormwater resource utilization in multi-objective optimization frameworks.
The Yangtze River Delta is one of the most typical areas with contamination-induced water shortages in China [33]. From one perspective, although there are many rivers and lakes, most of them feature transit water [34]. The development and utilization of water resources here largely depends on transit water, but the transit water quality is very poor as it is affected by upstream industrial pollution and flood pollution. From another perspective, the Yangtze River Delta is one of the regions with the fastest processing of industrialization and urbanization in China; therefore, urban development and economic development in recent decades have led to severe pollution of rivers and lakes. For example, the Huangpu River, the main drinking water source for citizens of Shanghai, was seriously polluted by random sewage discharge such as heavy metals [35], microplastics [36], and exhaust emissions from ships [37]. Taihu Lake, which is an important water source for Changzhou, experienced eutrophication due to agricultural nonpoint source pollution, industrial wastewater discharge, and frequent floodings [38,39]. Therefore, available water resources in the Yangtze River Delta are scarce. In recent years, with the introduction of some environmental protection policies [40], the comprehensive treatment of the water environment has witnessed certain achievements; however, because the region is an important gathering area for printing and dyeing, the chemical industry, electroplating, paper making, and other industries, the total amount of pollutants discharged is still far higher than the environmental capacity. In the long run, there is still a long way to go to reduce pollution emissions fundamentally. Since the cost of purifying stormwater is lower [41], stormwater management is a good option to save costs and increase water resources. In addition, under the influence of a subtropical monsoon climate [42], the climate characteristics of high temperatures and frequent rain in summer always lead to frequent droughts and floods, and more surface runoff carries more surface pollutants into water bodies, further aggravating water pollution and water shortages. Therefore, various water problems in the Yangtze River Delta are very complex and closely linked, which makes establishing a multi-objective optimization framework covering economic performance, hydrological recovery, water quality protection, and stormwater resource utilization to explore the links and trade-offs between various optimization objectives a high priority. Therefore, a sponge city pilot area with contamination-induced water shortages in the Yangtze River Delta was selected as a case study.
However, previous studies usually optimized no more than three objectives [17,43], because NSGA-II can only deal with three optimization objectives at most, which is insufficient for simultaneously optimizing economic performance, hydrological recovery, water quality protection, and stormwater resource utilization. The non-dominant sorting genetic algorithm III (NSGA-III), proposed by Deb [44], is an upgraded version of NSGA-II. NSGA-III can further improve the concentration and convergence of the solution set distribution and has demonstrated better applicability than NSGA-II in dealing with complex multi-objective optimization problems in three or more dimensions [44,45]. Currently, the applicability of NSGA-III to stormwater management is limited. To solve more optimization objectives in areas with contamination-induced water shortages and to further understand the applicability of NSGA-III in stormwater management studies, it is necessary to integrate stormwater resource utilization into multi-objective optimization frameworks based on NSGA-III to advance new research.
Climate change has been the focus of stormwater management research, and, in recent years, precipitation change caused by climate change has largely affected the performance of CGGI [46]; therefore, research on and the practises of current stormwater management must be considered from the perspective of future weather patterns [17,43]. The Coupled Model Intercomparison Project (CMIP) [47] is a project of the World Climate Research Program that organizes and coordinates different research institutions to use their respective global climate models to conduct climate simulations [48,49], which provides the basis for researchers to simulate future climates. The Coupled Model Intercomparison Project 6 (CMIP 6) is the sixth version of the CMIP [50] and combines shared socioeconomic paths (SSPs) and representative concentration paths (RCP) to create SSP-RCP scenarios. SSP-RCP scenarios are combined scenarios coupled by SSPs and RCPs [50]. SSPs describe future possible social development paths without the influence of climate change or policy [50,51,52], including SSP1s (sustainable development paths), SSP2s (moderate development paths), SSP3s (regional competition paths), SSP4s (uneven development paths) and SSP5s (fossil-fueled development paths) [50], whereas RCPs describe future possible radiative forcing in 2100 under the influence of anthropogenic greenhouse gas emissions [50,53], including RCP1.9 (1.9 W/m2), RCP2.6 (2.6 W/m2), RCP3.4 (3.4 W/m2), RCP4.5 (4.5 W/m2), RCP6.0 (6.0 W/m2), RCP7.0 (7.0 W/m2), and RCP8.5 (8.5 W/m2) [50]. SSP-RCP scenarios consider the interaction between future socioeconomic development and radiative forcing levels, thus contributing to a more comprehensive and accurate estimation of future climates [54,55,56]. CMIP 6 has been widely used in future rainfall simulations. According to some studies [5,57,58], rainfall caused by future climate change showed uncertain volatility during the long-term time series; therefore, it is also uncertain whether the future performance of CGGI is stable during the long-term time series [59]. Thus, it is necessary to couple SSP-RCP scenarios and long-term time series into detailed multi-dimensional combination scenarios to enhance the credibility of the simulation results and the feasibility of the research for practice.
In order to solve the complicated water problems of areas with contamination-induced water shortages in the Yangtze River Delta, this research constructed a multi-objective optimization framework for CGGI under future multi-dimensional scenarios. Economic performance, hydrological recovery, water quality protection, and stormwater resource utilization were included in the multi-objective optimization framework based NSGA-III to achieve the automatic optimization of schemes, finally providing suggestions for climate suitability planning and management of CGGI in the future. The research framework can also provide a reference for the research and construction of sponge cities in other water-deficient areas, and it is of great significance in terms of alleviating the urban water crisis, protecting the urban ecological environment, and promoting the green and sustainable development of urban areas.

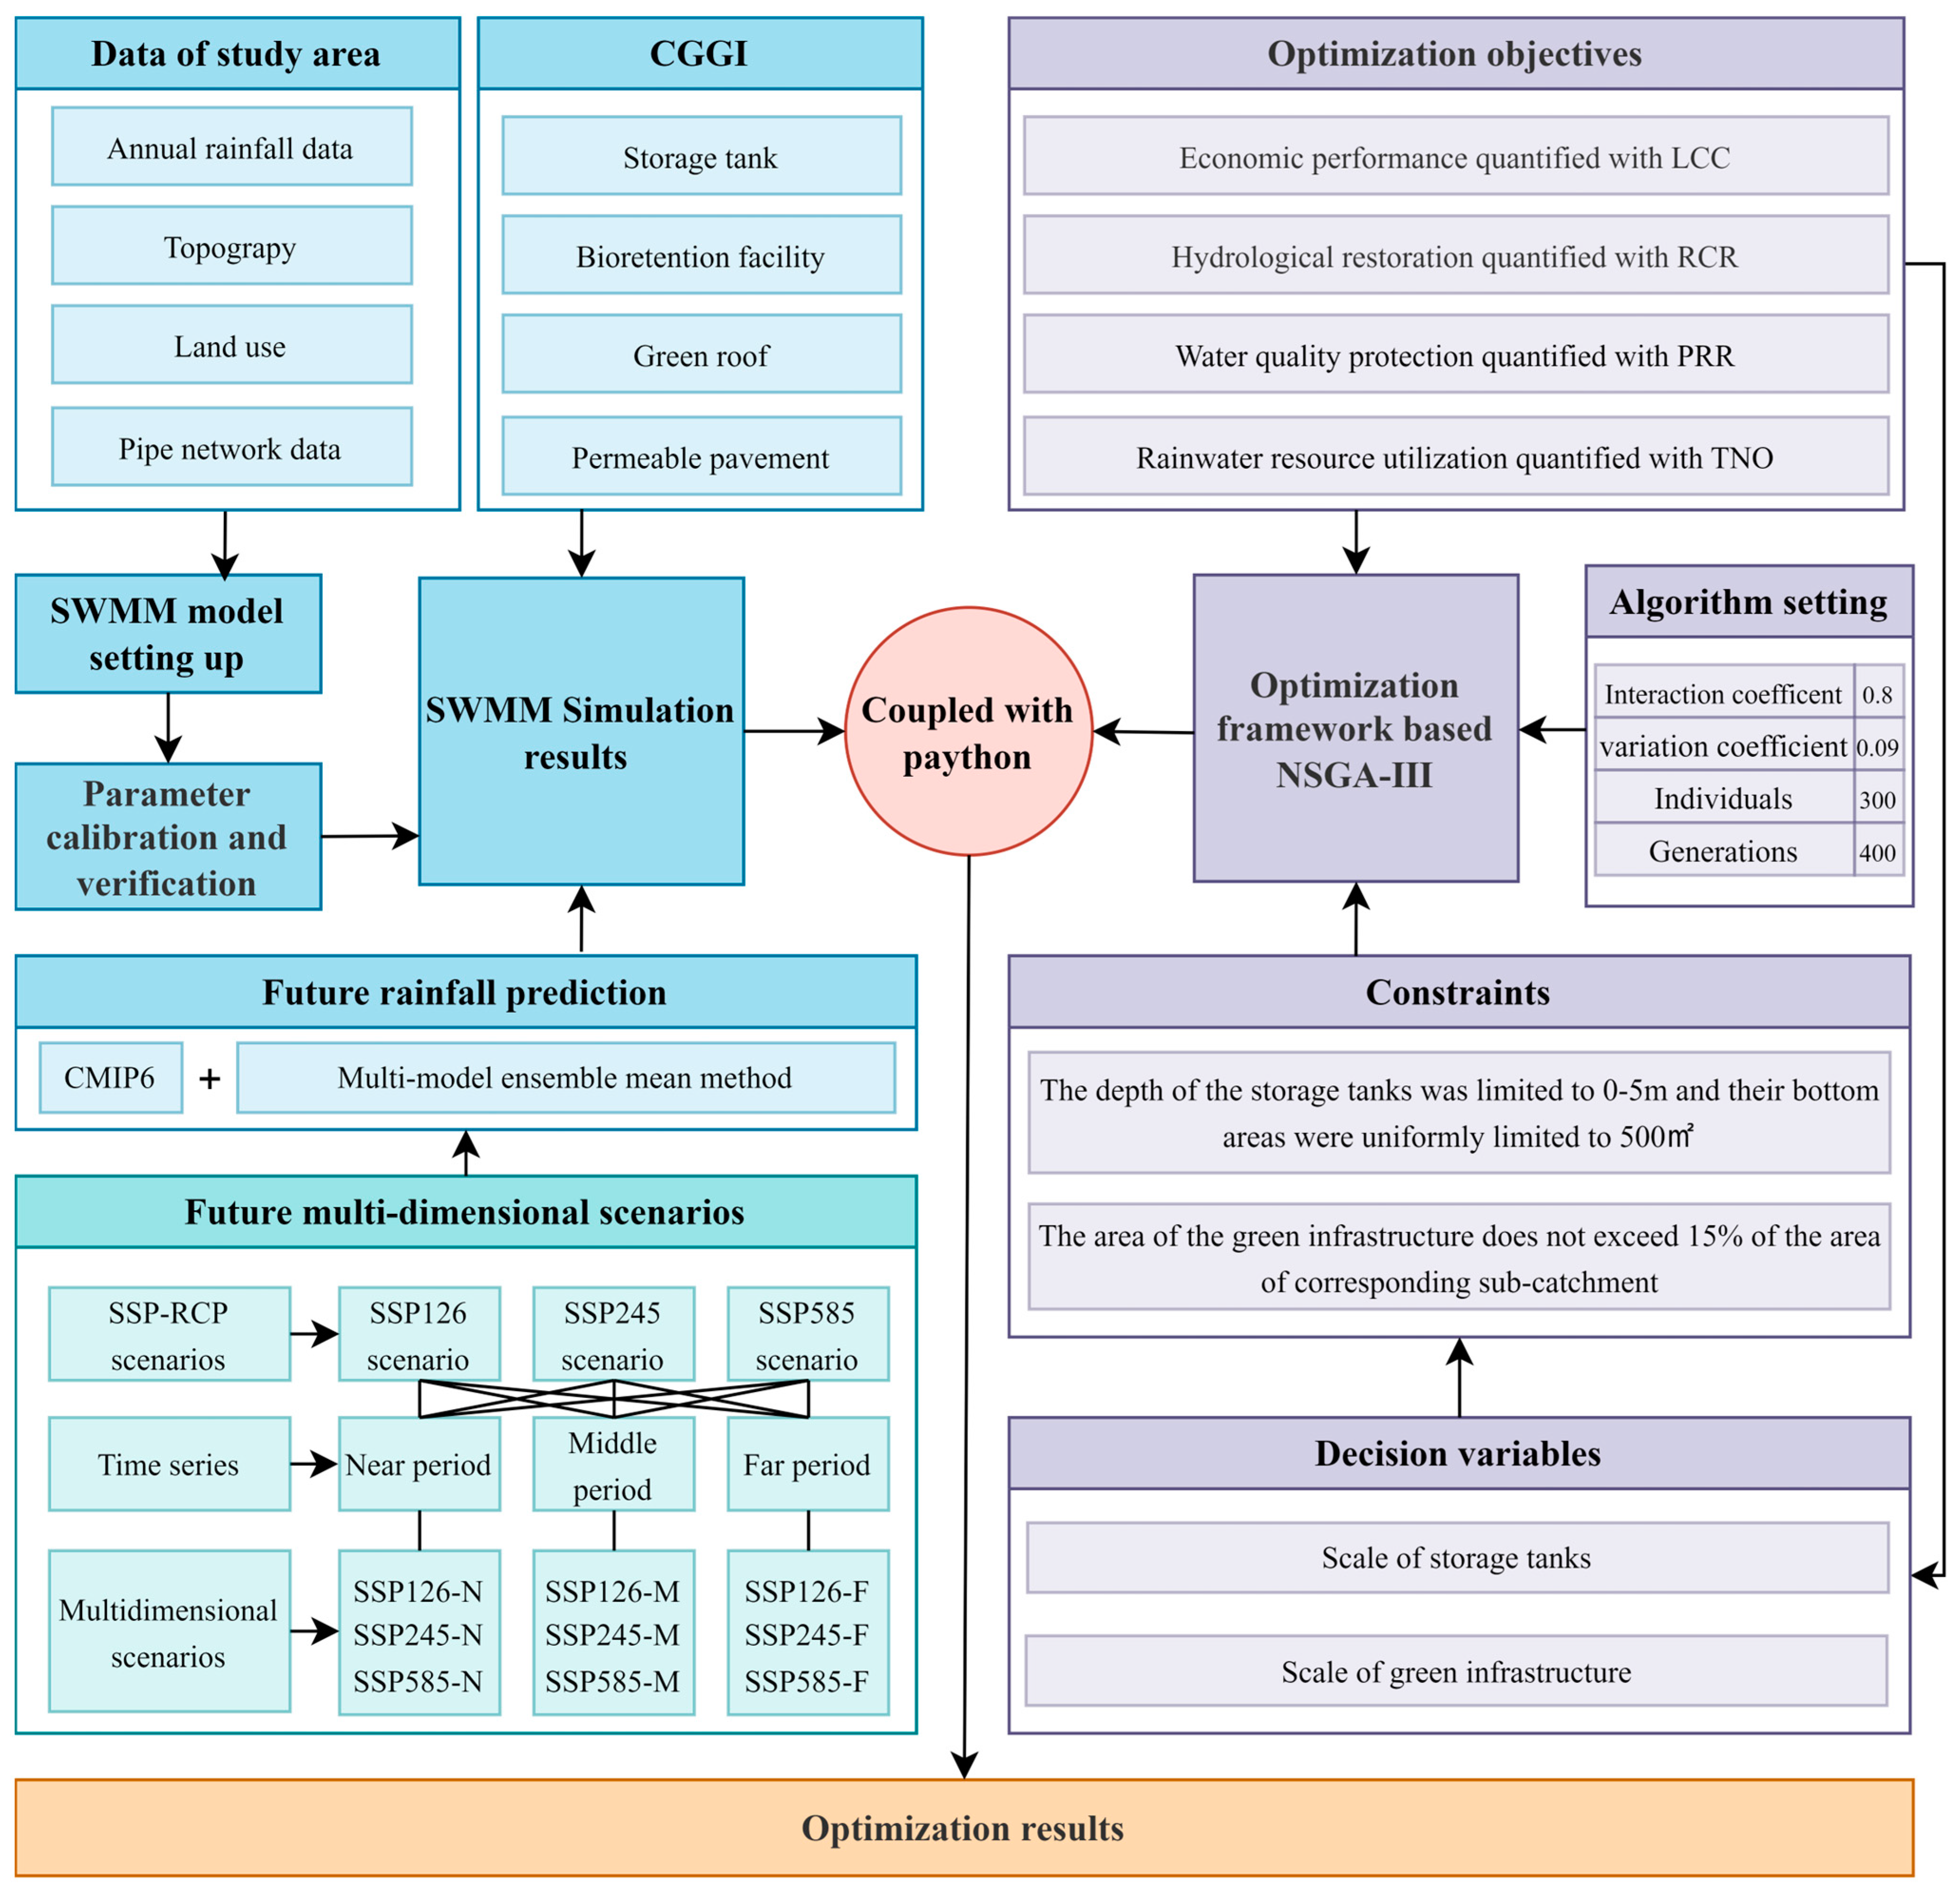
2. Research Framework

The flow and main steps of this study are illustrated in Figure 1. The first step was future scenario settings and rainfall simulations. After nine multi-dimensional scenarios were divided by coupling the SSP-RCP scenarios and time series, rainfall data under various multi-dimensional scenarios were obtained by referring to CMIP 6 and drawing support from the multi-model ensemble mean method. The second step was the development of the stormwater management model and stormwater simulation. The stormwater management model of the site was established based on the site status and drainage network data, and the parameters were calibrated and verified. Then, the appropriate CGGI (storage tanks, bioretention facilities, permeable pavements, and green roofs) and future rainfall data were added to the model for stormwater simulation. The final step was the establishment of a multi-objective optimization framework based on NSGA-III. The four optimization objectives were economic performance, hydrological recovery, water quality protection, and stormwater resource utilization, which were quantified by life cycle cost, runoff control rate, pollutant reduction rate, and total node overflow, respectively. After setting the decision variables, constraints, and algorithm parameters, the Python programming language was edited on the JupyterLab platform [60] to couple the stormwater management model and NSGA-III to realize automatic optimization of the CGGI.

3. Materials and Methods

3.1. Study Area

The study area is the Administrative Centre of Wujin District, Changzhou City, a provincial sponge-city pilot area, covering an area of 1.13 km2. As shown in Figure 2a. Changzhou is located in the Yangtze River Delta and the Taihu Lake Basin, with many rivers and lakes, but is a typical city with contamination-induced water shortages. As shown in Figure 2b,c, with a high building density and a high proportion of impervious underlying surfaces, water problems such as urban waterlogging, runoff pollution, and water shortages are very serious in this area. In summer, stormwater and droughts under the influence of a subtropical monsoon climate pose severe challenges to urban stormwater management [42]. In addition, rainfall changes caused by climate change can aggravate the challenges of stormwater management [30]. As a provincial sponge-city pilot area, there is an urgent need to explore new modes of stormwater management adapted to multiple risks.

3.2. Future Scenarios

3.2.1. Multi-Dimensional Scenarios Setting

The setting of future multi-dimensional scenarios referred to CMIP 6. In this study, SSP1, SSP2 and SSP5 were selected in the SSPs, RCP2.6, RCP4.5, and RCP8.5 were selected in the RCPs, and they were coupled into three SSP-RCP scenarios [61,62]: SSP126 scenario (SSP1 + RCP2.6), SSP245 scenario (SSP2 + RCP4.5), and SSP585 scenario (SSP5 + RCP8.5) [50]. The SSP126 scenario focuses on ecological protection, with low radiative forcing and social vulnerability [63], while the SSP245 scenario assumes that economic development and ecological protection maintain the current trend, with moderate radiative forcing and social vulnerability [64], while the SSP585 scenario focuses on rapid economic development and features the largest amount of carbon emissions, the highest radiative forcing levels, and social vulnerability [65,66]. The future time series was divided into three stages: the near period (2023–2040), middle period (2040–2070), and far period (2070–2100). Then, the three SSP-RCP scenarios and three stages were coupled into nine multi-dimensional scenarios: the SSP126-N scenario (near period under SSP126 scenario), SSP126-M scenario (middle period under SSP126 scenario), SSP126-F scenario (far period under SSP126 scenario), SSP245-N scenario (near period under SSP245 scenario), SSP245-M scenario (middle period under SSP245 scenario), SSP245-F scenario (far period under SSP245 scenario), SSP585-N scenario (near period under SSP585 scenario), SSP585-M scenario (middle period under SSP585 scenario), and SSP585-F scenario (far period under SSP585 scenario). The coupling process of the nine multi-dimensional scenarios is shown in Figure 1.

3.2.2. Rainfall Forecast

Raw data for future rainfall predictions were derived from eight single climate models of CMIP 6 [67] (Table 1) and the multi-model ensemble mean method (MME) was used to reduce prediction deviation. The MME method is a commonly used statistical method in climate research, and some studies have shown that the predicted rainfall data obtained by the MME method are more accurate than those obtained by a single model [68]. The formula used is as follows:
S M M E = 1 N i = 1 N F i
where S M M E is the simulation result of the MME method, N is 8 and F i is the simulation result of a single model.
The delta downscaling method was then used for deviation calibration of the rainfall data [69]. This method assumes that future prediction deviation of climate models is similar to historical performance and calibrates future prediction data by determining the difference between simulated data and actual observed data. Many studies have confirmed the applicability of the delta downscaling method for deviation calibration [70,71,72]. The formula used is as follows:
P r e f = P r e G C M s _ f × P r e o b s _ r e f P r e G C M s _ r e f
where P r e f is the precipitation data after deviation correction, P r e G C M s _ f is the predicted simulated precipitation data, and P r e o b s _ r e f and P r e G C M s _ r e f are the observed and simulated precipitation data for the calibration period, respectively.
The prediction period was determined to be 2015–2100 and the observation period was determined to be 1961–2014, where 1961–1994 was the calibration period and 1995–2014 was the verification period. The data for the observation period were obtained from the precipitation data of the CN05.1 data set [73]. The specific steps are as follows: first, the data of each single climate model were downscaled to 0.25° × 0.25°, matching the scale of the CN05.1 data set; second, the data of each single climate model were calibrated with the observed data of the calibration period; then, the simulation data of S M M E were obtained using the multi-model ensemble mean method.
In addition, the deviation calibration effects for different climate models were assessed by comparing the observed and calibrated data from the verification period. The deviation calibration effects are shown by Taylor plots [74,75] in Figure 3; the closer to the observation point, the better the simulation effects. The Taylor plots show that deviation calibration can significantly improve the accuracy of each model, and the MME method has higher accuracy than most single climate models.

3.3. SWMM Development

3.3.1. Construction of the SWMM of the Site

The stormwater management model (SWMM) [76] has been widely used in studies of stormwater management [77,78] and was used to carry out the stormwater simulation in this study. According to the site status and drainage network data, the study area was divided into 90 sub-catchments using the Tyson polygon tool. A generalized model of the site is shown in Figure 2d. The dynamic wave model was used to simulate flow routing [79], and the Horton equation was used to simulate infiltration [80,81]. Pollutant accumulation and scouring were simulated by using saturation functions and exponential functions, respectively [82]. The duration of each rainfall event was 2 h. The Chicago hyetograph and rainfall intensity formula for Changzhou were used to generate the rainfall processes for different return periods.

3.3.2. Parameters Calibration and Verification

A comprehensive runoff coefficient comparison method [83] was used for the parameter calibration in this study. The comprehensive runoff coefficient of the study area was approximately 0.553. The simulated comprehensive runoff coefficients for a return period of 1 year were compared with 0.553, and the calibration value was obtained after several adjustments. The calibration value was verified using the variation coefficient ( C v ) as follows:
C v = Ψ Ψ ¯
where Ψ is the difference between the actual value and analogue value and Ψ ¯ is the mean of the actual value and analogue value. If C v was <5%, the calibrated parameters were considered reliable.
The calibration procedures for these parameters are listed in Table 2. Through comparison, it was found that the simulated runoff coefficient of the seventh group was closest to the target runoff coefficient; therefore, the parameter of the seventh group was chosen as the final parameter. Rainfall data for the return periods of the 2 years and 3 years were selected for verification, and the verification results are shown in Table 3. According to the verification results, the C v values were 1.83% and 3.03%, respectively, which were all less than 5%, indicating that the SWMM, established by using the selected parameters, accurately reflected the hydrologic characteristics of the study area.

3.3.3. Types of CGGI

Based on the actual situation of the site and the practical requirements of stormwater management, storage tanks, bioretention facilities, permeable pavements, and green roofs were selected for this study. The study area is an urban built-up area. The reconstruction of roads, pipelines, and other facilities caused by the transformation of the pipe network can bring huge additional costs. Therefore, from an economic perspective, this research selected storage tanks as the grey infrastructure. Storage tanks are a type of stormwater collection facility that can temporarily store the peak flow of stormwater runoff and receive stormwater overflow from pipelines to reduce runoff pollution and recycle the collected stormwater. This plays a role in promoting economic performance, hydrology recovery, water quality protection, and stormwater resource utilization simultaneously [82]. Rainfall data for a return period of 5 years were used for the waterlogging simulation of the study area to obtain the locations of the waterlogging points, and storage tanks were arranged at the waterlogging points to reduce the flood risk to a greater extent. Bioretention facilities, green roofs, and permeable pavements, common types of green infrastructure, were arranged in the green spaces on top of buildings and roads, respectively. The parameter values of CGGI referred to relevant studies [83,84] and complex [76].

3.4. Multi-Objective Optimization Framework Based on NSGA-III

3.4.1. Optimization Objectives

  • Economic performance.
Life cycle cost (LCC) was used as an indicator of economic performance [85]. LCC refers to the cost of the entire product life cycle, including the cost of initial construction, future operation, and future maintenance [86]. The cost of initial construction includes material and labour cost, which are based on the local market price; the cost of future operation and maintenance was calculated using the Discounted Cash Flow model [26,87]. The LCC was calculated as follows:
F 1 = C 1 + C 2
where F 1 is the sum of the LCC of CGGI, C 1 is the sum of the LCC of grey infrastructure and C 2 is the sum of the LCC of green infrastructure.
C 1 = I g r e y · 1 + t = 1 T g r e y r g r e y 1 + v t · N g r e y
C 2 = i = 1 3 I g r e e n · 1 + t = 1 T g r e e n r g r e e n 1 + v t · N g r e e n
where I g r e y and I g r e e n are the initial construction cost of CGGI; T g r e y and T g r e e n are the service lives of CGGI; r g r e y and r g r e e n are the percentages of the operation and maintenance cost of CGGI in the initial construction cost; v is the discount rate; and N g r e y and N g r e e n are the scales of CGGI. The specific cost parameter values are listed in Table 4.
2.
Hydrological recovery.
The runoff control rate (RCR) was taken as an indicator of hydrological recovery. The RCR refers to the ratio of runoff controlled by CGGI to the total precipitation, which is the core index for measuring the hydrological benefits of the CGGI [79]. The formula used is as follows:
F 2 = r u n o f f _ c t r l P r e c i p i t a t i o n · 100 %
where F 2 is the RCR and r u n o f f _ c t r l is the runoff controlled by CGGI.
3.
Water quality protection.
The pollutant reduction rate (PRR) was used as an indicator of water quality protection. The PRR refers to the proportion of the total amount of pollutants in the runoff reduced by the CGGI to the total amount of pollutants in the entire study area. It is an important indicator for evaluating the effectiveness of CGGI in improving water quality [59]. Suspended solids were selected as the pollutant type studied in this research. The calculation formula is as follows:
F 3 = S S _ r d c t S S _ w a s h · 100 %
where F 3 is PRR, S S _ r d c t is the amount of pollutants reduced by CGGI, and S S _ w a s h is the amount of pollutants produced by wash during rainfall.
4.
Stormwater resource utilization.
Total node overflow (TNO) was used as an indicator reflecting potential stormwater resource utilization. Overflow stormwater collected in the storage tanks can be reused after purification, which plays an important role in alleviating the urban water resource crisis [82]. The formula is as follows:
F 4 = i = 1 7 Q i
where F 4 is the TNO of the study area and Q i is the stormwater overflow of the i th node.

3.4.2. Decision Variables and Constraints

The bottom area of the storage tanks was unified at 500 m2, and the depth of the storage tanks and scale of the green infrastructure were considered as decision variables. To ensure the rationality and effectiveness of the values of the decision variables and improve the efficiency of the optimization process, the depth of the storage tanks and the scale of the green infrastructure were constrained. The depth of the storage tanks was limited to 0–5 m, and the area of the green infrastructure did not exceed 15% of the area of the corresponding sub-catchment.

3.4.3. Algorithm Setting

The selection of the algorithm parameters referred to related studies [17,20,22]. The interaction coefficient and variation coefficient were determined as 0.8 and 0.09, respectively. To ensure that the algorithm could effectively explore the space and converge to the optimized solution set, a population of 300 individuals was set, and an iterative operation was performed for 400 generations. A flowchart of the NSGA-III algorithm is shown in Figure 4.

4. Results

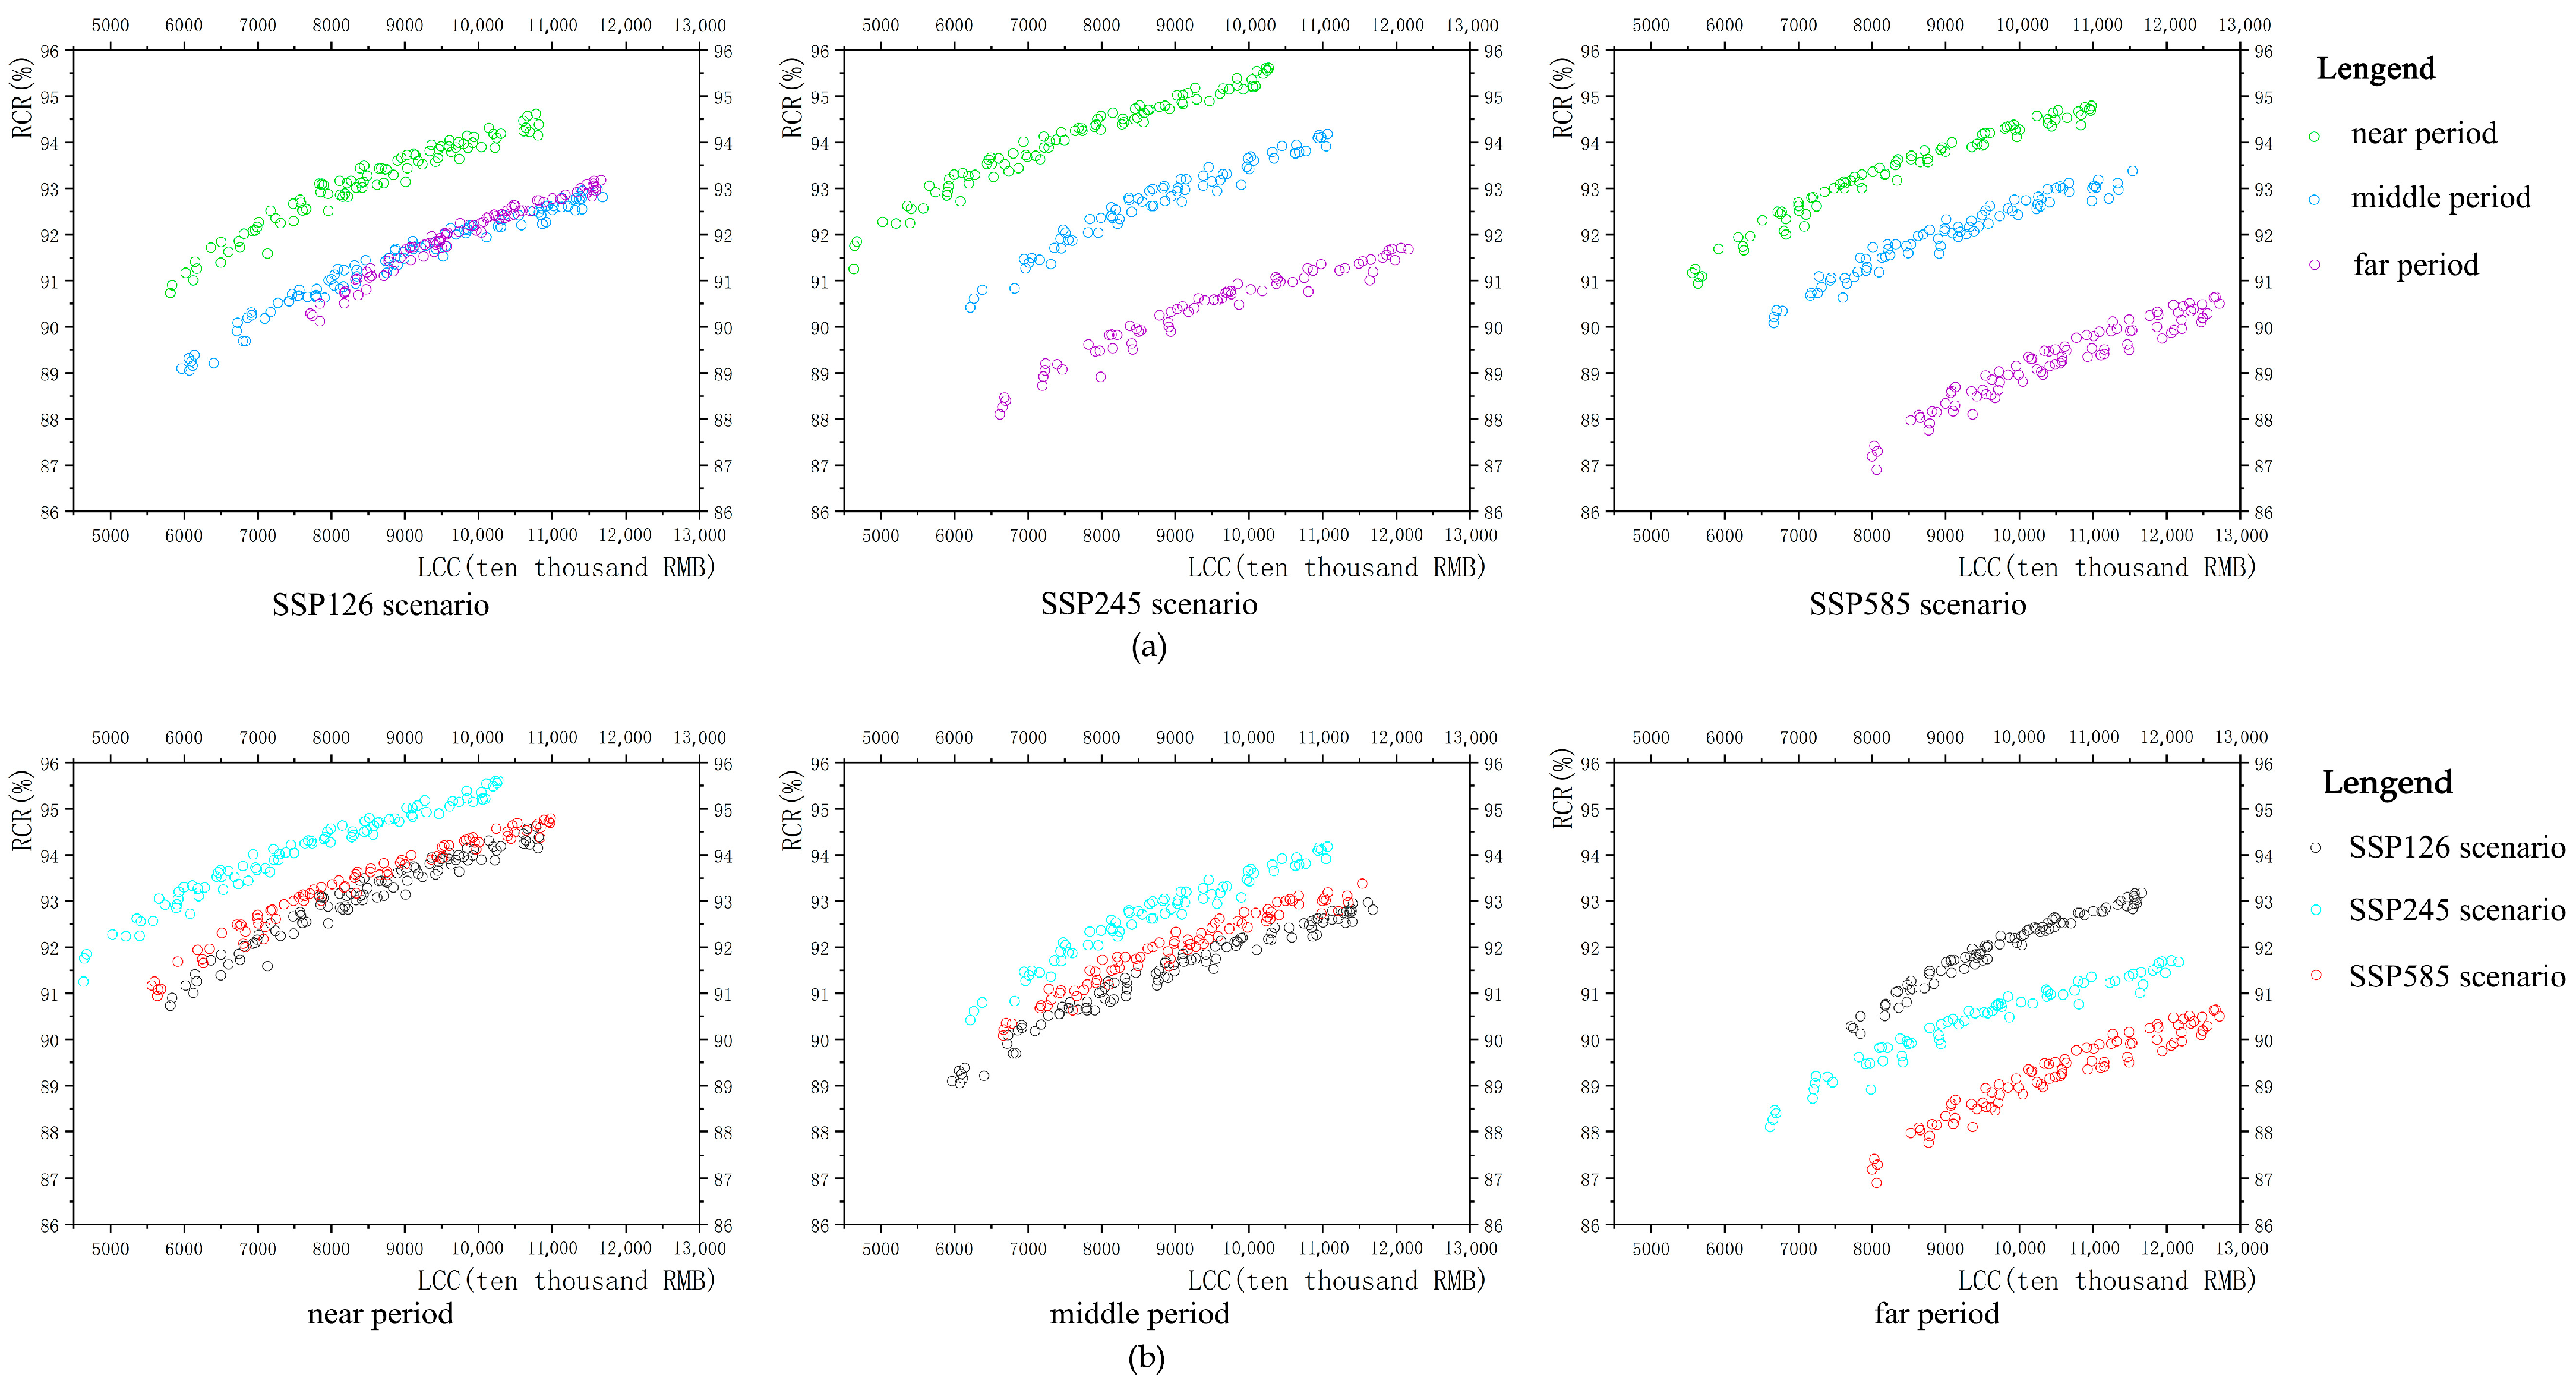
4.1. Optimization of Hydrological Recovery

As shown in Figure 5, overall, under either scenario, the RCR always maintained an upward trend with increasing LCCs; that is, LCCs were positively correlated with the RCR, which also means that the investment in CGGI should be increased to obtain a better runoff control effect. However, the RCR did not grow steadily, and that the growth rate decreases with an increase in LCC calls for consideration of the trade-off between investment in CGGI and the hydrological recovery effects.

4.1.1. Analysis of Optimization of Hydrological Recovery from SSP-RCP Scenarios Dimension

The hydrological recovery optimization effects of the SSP-RCP scenario dimension are shown in Figure 5a. Under the SSP126 scenario, the optimization schemes of the near period were always at the top, and the optimization schemes of the middle and far period were always at the bottom, indicating that the near period can achieve the maximum RCR and best hydrological recovery effects while the middle and far period can achieve smaller RCR and general hydrological recovery effects. Initially, the optimization schemes of the middle period were located above those of the far period, and when the CGGI increased to a certain scale, the optimization schemes of the far period began to be located above those of the middle period. It can be seen that the hydrological recovery effects of the SSP126-M scenario were greater than those of SSP126-F scenario when cost was lower, and the hydrological recovery effects of SSP126-M scenario were weaker than those of the SSP126-F scenario when the cost was higher. However, there was little difference between the runoff control effects of the SSP126-M and SSP126-F scenario. Under both the SSP245 and SSP585 scenarios, the best RCR appeared in the near period. In contrast to the SSP126 scenario, the difference in the RCR in the middle and far period under the SSP245 and SSP585 scenarios was more obvious, and the runoff control effects in the middle period were significantly greater than those in the far period. In summary, runoff control effects in the near period were best under all three SSP-RCP scenarios. Over time, the RCR gradually decreased in the middle and far period, the hydrological recovery effects of the SSP245-F and SSP585-F scenarios were minimized, and the hydrological recovery effects of the SSP126-F scenario were minimized at low-cost inputs.

4.1.2. Analysis of Optimization of Hydrological Recovery from Time Series Dimension

The hydrological recovery optimization effects of the time-series dimension are shown in Figure 5b. In the near and middle period, the optimization schemes of the SSP126 scenario were always at the top, those of the SSP585 scenario were always at the bottom, and those of the SSP245 scenario were always in the middle. Overall, the SSP245 scenario had the best runoff control effect in the near and middle period and the SSP126 scenario had the worst. Numerically speaking, in the near period, the ranges of available RCR for the SSP126-N, SSP245-N, and SSP585-N scenarios were 90.73–94.62%, 91.25–95.61% and 90.94–94.79%, respectively, and, in the middle period, the ranges of available RCR for the SSP126-M, SSP245-M, and SSP585-M scenarios were 89.05–92.97%, 90.42–94.18%, and 90.08–93.38%, respectively, also indicating that, in the near and middle period, the best runoff control effect could be achieved under the SSP245 scenario and the SSP126 scenario could achieve the worst runoff control effect. In the far period, the optimization schemes of the SSP245-F scenario remained located below those of the SSP585-F scenario; therefore, the runoff control effects of the SSP245 scenario were better than those of the SSP585 scenario at any stage. However, over time, the optimization schemes of the SSP126-F scenario rose from the bottom to top; therefore, in the far period, the SSP126-F scenario had better runoff control effects than the SSP245-F and SSP585-F scenarios. Numerically, in the far period, the RCR ranges of the SSP126-F, SSP245-F, and SSP585-F scenarios were 90.12–93.18%, 88.1–91.71%, and 86.9–90.65%, respectively, and it can also be seen that the runoff control effect of the SSP126-F scenario was the best, that of the SSSP245-F scenario was second, and that of the SSP585-F scenario was the worst. In short, the optimization effects of hydrological recovery in the near period and middle period presented as SSP245 scenario > SSP585 scenario > SSP126 scenario, and, in the far period, the optimization effects of the hydrological recovery presented as SSP126 scenario > SSP245 scenario > SSP585 scenario.

4.2. Optimization of Water Quality Protection

As shown in Figure 6, overall, PRRs increased with LCCs, which also indicates that LCCs were positively correlated with PRR, meaning that an increase in CGGI reduced more pollutants. Moreover, as with the RCR, the growth rate of PRR decreased with the input of LCC, which also required consideration of the trade-off between investment in CGGI and the water quality protection effects.

4.2.1. Analysis of Optimization of Water Quality Protection from SSP-RCP Scenarios Dimension

The water quality optimization effects of the SSP-RCP scenario dimensions are shown in Figure 6a. In general, under all three SSP-RCP scenarios, the optimization schemes of the near period were almost always at the top and the optimization schemes of the middle and far period were almost always at the middle and bottom, respectively. It can be seen that the PRR of the near period was almost always greater than that of middle and far period, which also means that the best water quality protection effect was most likely in the near period. Under the SSP126 scenario, with gradual investment in LCCs, the difference in the achievable PRR in the three stages was not large. Under the SSP245 scenario, the difference in the achievable PRR in the three stages was more evident, and the optimization schemes of the near period were significantly higher than those of the middle and far period, indicating that the water quality protection effects of the near period were significantly greater than that of the middle and far period. In terms of specific values, the maximum PRR of the SSP245-N, SSP245-M, and SSP245-F scenarios were 92.79%, 91.28%, and 89.71%, respectively, indicating that the SSP245-N scenario had the best water quality protection potential. When the cost was lower, the difference in the PRR between the middle and far period was not large. With gradual investment in LCCs, the difference in the PRR between the middle and far period gradually widened. Under the SSP585 scenario, the difference in PRR among the three stages was the most obvious, and the optimization schemes of the far period were significantly lower than those of the near and middle period, indicating that the water quality protection effects of the far period were significantly worse than those of the near and middle period. In terms of specific values, the maximum PRR values of the SSP585-N, SSP585-M, and SSP585-F scenario were 91.56%, 90.13%, and 88.23%, respectively, indicating that the SSP585-N scenario had the best water quality protection effects. In short, the influence of time series on water quality protection presented as near period > middle period > far period.

4.2.2. Analysis of Optimization of Water Quality Protection from Time Series Dimension

The water quality optimization effects of the time series dimension are shown in Figure 6b. In general, in the near, middle and far period, the optimization schemes under three SSP-RCP scenarios were relatively clustered, and different stages showed different distribution patterns. In the near period, the optimization schemes of the SSP245-N scenario were clearly above those of the SSP126-N and SSP585-N scenario. There were many overlaps between the optimization schemes of the SSP126-N and SSP585-N scenario, but the outermost optimization schemes of the SSP126-N scenario were clearly located above those of the SSP585-N scenario. The PRR ranges of the SSP126-N, SSP245-N, and SSP585-N scenario were 80.26–91.21%, 80.42–92.79%, and 80.81–91.56%, respectively. Overall, SSP126-N scenario achieved the worst PRR and the SSP245-N scenario achieved the best PRR. Therefore, the SSP245-N scenario had the best water quality protection effect, whereas the SSP126-N scenario had the worst water protection effect. In the middle period, the three SSP-RCP scenarios had the greatest scheme overlaps and the difference in water quality protection effect was minimal compared to the other two stages. In terms of distribution states, the optimization schemes of the SSP126-M and SSP245-M scenario were more widely distributed, and those of the SSP585-M scenario were more narrowly distributed. The ranges of achievable PRR under the SSP126-M, SSP245-M, and SSP585-M scenarios were 77.95–91.32%, 78.4–91.28%, and 81.34–90.13%, respectively, which also echoes the distribution status of the optimization schemes of the three SSP-RCP scenarios in this stage. From the maximum potential of the values, the SSP126-M and SSP245-M scenario could obtain a better PRR. In the far period, it is obvious that the optimization schemes of the SSP585-F scenario were at the bottom; therefore, the water quality protection effect of the SSP585-F scenario was the worst. When the cost was lower, the optimization schemes of the SSP245-F scenario were above those of the SSP126-F scenario, and when the cost was gradually increased, the optimization schemes of the SSP245-F scenario began to proceed below those of the SSP126-F scenario; therefore, the water quality protection effects of the SSP245-F scenario were better than those of the SSP126-F scenario in the low-cost zone, and the water quality protection effects of the SSP245-F scenario were worse than those of the SSP126-F scenario in the high-cost zone. The PRR ranges of the SSP126-F, SSP245-F, and SSP585-F scenario were 80.27–90.81%, 79.4–89.71%, and 77.92–88.23%, respectively. The water quality protection effects of the SSP585-F scenario were the worst, whereas those of the SSP126-F and SSP245-F scenario were relatively better.

4.3. Optimization of Stormwater Resource Utilization

As shown in Figure 7, under all SSP-RCP scenarios, the schemes distribution of stormwater resource utilization optimization was more dispersed than that of hydrologic recovery optimization and water quality protection optimization. It is clear that LCC and TNO were not obviously correlated, which means that an increase in LCCs did not necessarily reduce node overflow. It is evident that low-cost investment and high-cost investment could achieve similar stormwater resource utilization effects to a certain extent, and there was no obvious correlation between the scale of CGGI and stormwater resource utilization, showing that there is a complicated constraint relationship between economic performance and stormwater resource utilization. Thus, it is necessary for decision makers focusing on stormwater resource utilization to choose appropriate optimization schemes rather than blindly increasing investment in CGGI, which contributes to achieving the ideal stormwater utilization objective at minimal costs. Furthermore, the optimization schemes in the lower-right corner are dense, whereas those in the upper-left corner are scattered. Therefore, optimization schemes that produced a larger TNO are primarily distributed in low-cost areas, whereas optimization schemes that produced a smaller TNO are mainly distributed in high-cost areas. It can be seen that, with an increase in the scale of CGGI, the probability of reducing node overflow could be improved to some extent.
It is worth noting that a large number of schemes generating no node overflow all appeared under the nine multi-dimensional scenarios, indicating that CGGI plays a powerful role in runoff control so that there is no overflow phenomenon. Generally speaking, stormwater management with runoff control as the main objective does not want overflow; on the contrary, in water-deficient areas, the multi-objective optimization covering stormwater resource utilization hopes to produce some overflow, then uses storage tanks to collect overflow stormwater for the recycling of stormwater resources. However, larger overflow is undesirable because it may cause waterlogging, flooding, and other risks. These schemes that do not produce TNO were distributed in both low-cost and high-cost areas; therefore, neither stormwater management that considers potential stormwater resource utilization nor stormwater management that does not consider potential stormwater resource utilization should blindly increase investment in CGGI. In summary, according to the optimization results of the stormwater resource utilization, low cost and high cost can both achieve no stormwater resource utilization effects and moderate stormwater resource utilization effects, and the likelihood of obtaining a larger such effect at low cost was greater than at high cost, which gives stormwater management decision makers many different choices. This also embodies the value of multi-objective optimization research that considers stormwater resource utilization.

4.3.1. Analysis of Optimization of Stormwater Resource Utilization from SSP-RCP Scenario Dimension

The stormwater resource utilization optimization effects of the SSP-RCP scenario dimension are shown in Figure 7a. Overall, under the three SSP-RCP scenarios, the optimization schemes in the near, middle, and far period were relatively on the left, centre, and right, showing that the maximum cost of achieving the same stormwater resource utilization effect was most possible in the far period and almost impossible in the near period. Moreover, in each graph, optimization schemes generating a larger TNO were primarily from the far period, with fewer coming from the near period; additionally, under three SSP-RCP scenarios, the optimization effect of stormwater resource utilization was expressed as far period > middle period > near period. The maximum TNO achievable under the SSP126-N, SSP126-M, and SSP126-F scenarios were 162 m3, 189 m3, and 186 m3, respectively; the maximum TNO achievable under the SSP245-N, SSP245-M, and SSP245-F scenarios were 150 m3, 173 m3, and 199 m3, respectively; and the maximum TNO achievable under the SSP585-N, SSP585-M, and SSP585-F scenarios were 162 m3, 180 m3, and 224 m3, respectively. In general, in terms of stormwater resource utilization, the potential of the far period was the greatest, while the near period had the worst stormwater resource utilization potential.

4.3.2. Analysis of Optimization of Stormwater Resource Utilization from Time Series Dimension

The stormwater resource utilization optimization effects of the time series dimension are shown in Figure 7b. In the near period, the optimization schemes of the SSP245, SSP585, and SSP126 scenario were relatively on the left, centre, and right, respectively, indicating that the maximum cost of achieving the same stormwater resource utilization effect appeared most likely under the SSP126-N scenario. The optimization schemes generating a larger TNO were primarily from the SSP126 and SSP585 scenarios. The maximum TNO of the SSP126-N, SSP245-N, and SSP585-N scenarios were 162 m3, 150 m3, and 162 m3, respectively. In the near period, the maximum stormwater resource utilization effects were achieved under the SSP126 and SSP585 scenario, and the worst stormwater resource utilization effects were achieved under the SSP245 scenario. In the high-cost area of the middle period, the optimization schemes of the SSP245, SSP585, and SSP126 scenario remained relatively on the left, centre, and right, respectively, whereas, in the low-cost area of the middle period, the optimization schemes of the SSP126 scenario were on the left, meaning that a similar stormwater resource utilization effect could be achieved both at the extremely low-cost and extremely high-cost areas under the SSP126-M scenario. The maximum TNO achievable under the SSP126-M, SSP245-M, and SSP585-M scenarios were 189 m3, 173 m3 and 180 m3, respectively. Based on the maximum value, the SSP126-M scenario had the greatest potential for stormwater resource utilization. In the far period, the SSP126 and SSP585 scenario produced no schemes, with a cost of less than 75 million. Among the schemes with a cost of more than 75 million, the schemes of the SSP126-F, SSP245-F, and SSP585-F scenario were relatively on the left, centre, and right, respectively. Moreover, from the maximum value, the maximum TNO of the SSP126-F, SSP245-F, and SSP585-F scenarios were 186 m3, 199 m3, and 224 m3 respectively; therefore, overall, the SSP585-F scenario had the best stormwater resource utilization potential.

5. Discussion

5.1. Impact of Climate Change from a Multi-Dimensional Perspective

Differences in the optimization effects under different multi-dimensional scenarios also reflect the coupled impacts of the SSP-RCP scenarios and time series on the benefits of CGGI. In the SSP-RCP scenarios dimension, from the near period through the middle period to the far period, the effects of hydrological recovery and water quality protection approximated an ordering of near period > middle period > far period. The effects of stormwater resource utilization approximated an opposite ordering. It can be seen that the far period had a negative effect on hydrological recovery and water quality protection and a positive effect on stormwater resource utilization. In terms of the time series dimension, in the near and middle period, with increasing carbon emissions and levels of economic development, the optimization effects of hydrological recovery and water quality protection generally presented the ordering of SSP245 scenario > SSP585 scenario > SSP126 scenario, and the optimization effects of stormwater resource utilization presented the ordering of SSP126 scenario > SSP585 scenario > SSP245 scenario. In the far period, the ordering of the optimization effects of hydrological recovery and water quality protection changed to SSP126 scenario > SSP245 scenario > SSP585 scenario, and the ordering of the optimization effect of stormwater resource utilization changed to be SSP585 scenario > SSP245 scenario > SSP126 scenario. Therefore, in general, the SSP-RCP scenarios did not have stable influences on hydrological recovery, water quality protection, or stormwater resource utilization. However, from the near to middle period, the SSP126 scenario had the greatest impact on the performance of CGGI, and, in the far period, the SSP585 scenario had the greatest impact on the performance of CGG. From the perspective of multi-dimensional coupled scenarios, the worst hydrological recovery effect, worst water quality protection effect, and best stormwater recycling effect all appeared under the SSP585-F scenario. The maximum RCR, maximum PRR, and maximum TNO under the SSP585-F scenario were 90.65%, 88.23%, and 224 m3 respectively; therefore, the SSP585-F scenario had the greatest influence on stormwater management under the support of carbon emissions, economic development, and time, which holds equally true in related studies [17,88,89].
The difference in the optimization effects under the multi-dimensional scenarios lie in the difference in precipitation. Many studies have shown that the larger the return period, the worse the benefits of CGGI [57,90]. The different return periods reflect different precipitation, which can directly affect the effectiveness of CGGI. Therefore, different optimization effects appeared under nine multi-dimensional scenarios with different average annual precipitations. Figure 8 simultaneously shows the average annual precipitation and optimization effects of CGGI under various multi-dimensional scenarios. Generally speaking, the change trend of optimization effects of stormwater resource utilization was consistent with the change trend of average annual precipitation, and the change trends of optimization effects of hydrological recovery and water quality protection were contrary to the change trend of average annual precipitation. Under the three SSP-RCP scenarios, the average annual precipitation gradually increased from the near period to the far period. Therefore, under the influences of different shared socioeconomic paths and carbon emissions levels, the far period suffers the most precipitation. Therefore, the hydrological recovery effects and water quality protection effects in this stage are the worst, but the potential for stormwater resource utilization is the greatest. In the near and middle period, the amount of average annual precipitation exhibited the ordering of SSP126 scenario > SSP585 scenario > SSP245 scenario, and the optimization effects of these two stages also showed the same change trend as indicated for average annual precipitation. In the far period, the amount of average annual precipitation presented as SSP585 scenario > SSP245 scenario > SSP126 scenario, which is also consistent with the change trends of the optimization effects in this stage.

5.2. Enlightenments of Stormwater Management for Areas with Contamination-Induced Water Shortages

The differences in the precipitation of the multi-dimensional scenarios indicates the uncertainty of the future climate, and their different optimization effects also indicate the uncertain performance of CGGI in the future. Therefore, the planning and management of CGGI must focus on carbon emissions, socioeconomic development, and time. During the near and middle period, the SSP126-N and SSP126-M scenarios had the highest precipitation. Although the SSP126 scenario had lower carbon emissions, its better ecological environment also resulted in more precipitation in the initial stage. Under the influence of the time series, from the near period to the middle period, the precipitation of the SSP126 scenario continued to increase; therefore, the SSP126 scenario had the greatest impacts on stormwater management in these two stages. As such, in the near and middle period, stormwater management workers must focus on climate change caused by the SSP126 scenario. Under the influences of high carbon emissions, rapid socioeconomic development, and time, the largest precipitation occurred under the SSP585 scenario, which led to the worst hydrological recovery effect, worst water quality protection effect, and greatest stormwater resource utilization potential. Therefore, in the far period, it is necessary to focus on the climate change brought about by the SSP585 scenario. In addition, regardless of the levels of carbon emissions and shared socioeconomic paths, the far period has a significant impact on urban stormwater management. It is necessary for relevant personnel to make good contingency plans for the far period with respect to planning and management of CGGI. While stormwater management is a direct measure for promoting stormwater resource utilization, it must be made clear that the fundamental measure for increasing stormwater resource utilization is to reduce pollution. As the Yangtze River Delta region suffers from both upstream and local pollution risks, it should actively respond to environmental protection policies and call for multi-party cooperations to carry out green development.
Generally, urban stormwater management does not require the production of TNO because it needs to primarily focus on hydrological recovery benefits; however, areas with contamination-induced water shortages require the recycling of water resources to a certain extent. According to the research results of multi-objective optimization based on NSGA-III, both low cost and high cost can produce a similar TNO and no TNO, which is caused by the different configurations and scales of the CGGI under the premise of fixed cost. This promotes two ideas for stormwater management of areas with contamination-induced water shortages. Stormwater management that considers stormwater resources utilization can select schemes that achieve a certain hydrological recovery effect, water quality protection effect, stormwater resource utilization effect, and appropriate cost; in contrast, stormwater management that does not consider stormwater resources utilization can select schemes that do not produce TNO, and these schemes can also achieve a better hydrological recovery effect, better water quality protection effect, and an appropriate cost.

5.3. Comparison of NSGA-III and NSGA-II

Previous studies based on NSGA-II primarily considered hydrological recovery and water quality protection as the main optimization objectives [17,91]. In this study based on NSGA-III, these two optimization objectives were retained. According to the results, the runoff control rates under the nine multi-dimensional scenarios were all above 85% and the pollutant removal rates under the nine multi-dimensional scenarios were all above 75%, which all reached the construction standards of the sponge city of Changzhou. By comparison, it was found that both the distributions of the optimized Pareto solution sets and the specific values showed some similarities in the previous studies and this study. Therefore, multi-objective optimization based on NSGA-III can also be utilized in the same roles of multi-objective optimization based on NSGA-II. Moreover, multi-objective optimization studies based on NSGA-III can effectively solve more than three optimization objectives. This study incorporated stormwater resource utilization into a multi-objective optimization system, optimized the economic performance, hydrological recovery, water quality protection, and stormwater resource utilization simultaneously, and finally optimized the ideal results. This novel optimization framework expands the number of optimization objectives, improves the research value of multi-objective optimization in the field of stormwater management, and helps to solve more water problems for cities. Given the interconnected, intertwined, diverse, and complex urban stormwater problems, it is necessary to use NSGA-III to solve more optimization objectives.

6. Conclusions

To solve the diverse and severe water problems in areas with contamination-induced water shortages, this study developed a multi-objective optimization framework based on NSGA-III for grey–green infrastructure under future multi-dimensional scenarios. This research creatively integrated stormwater resource utilization into the multi-objective optimization system and applied NSGA-III to the field of stormwater management to optimize four objectives simultaneously. In addition, multi-dimensional scenarios were considered to simulate multiple risks under future climate conditions. The main conclusions of the study are as follows:
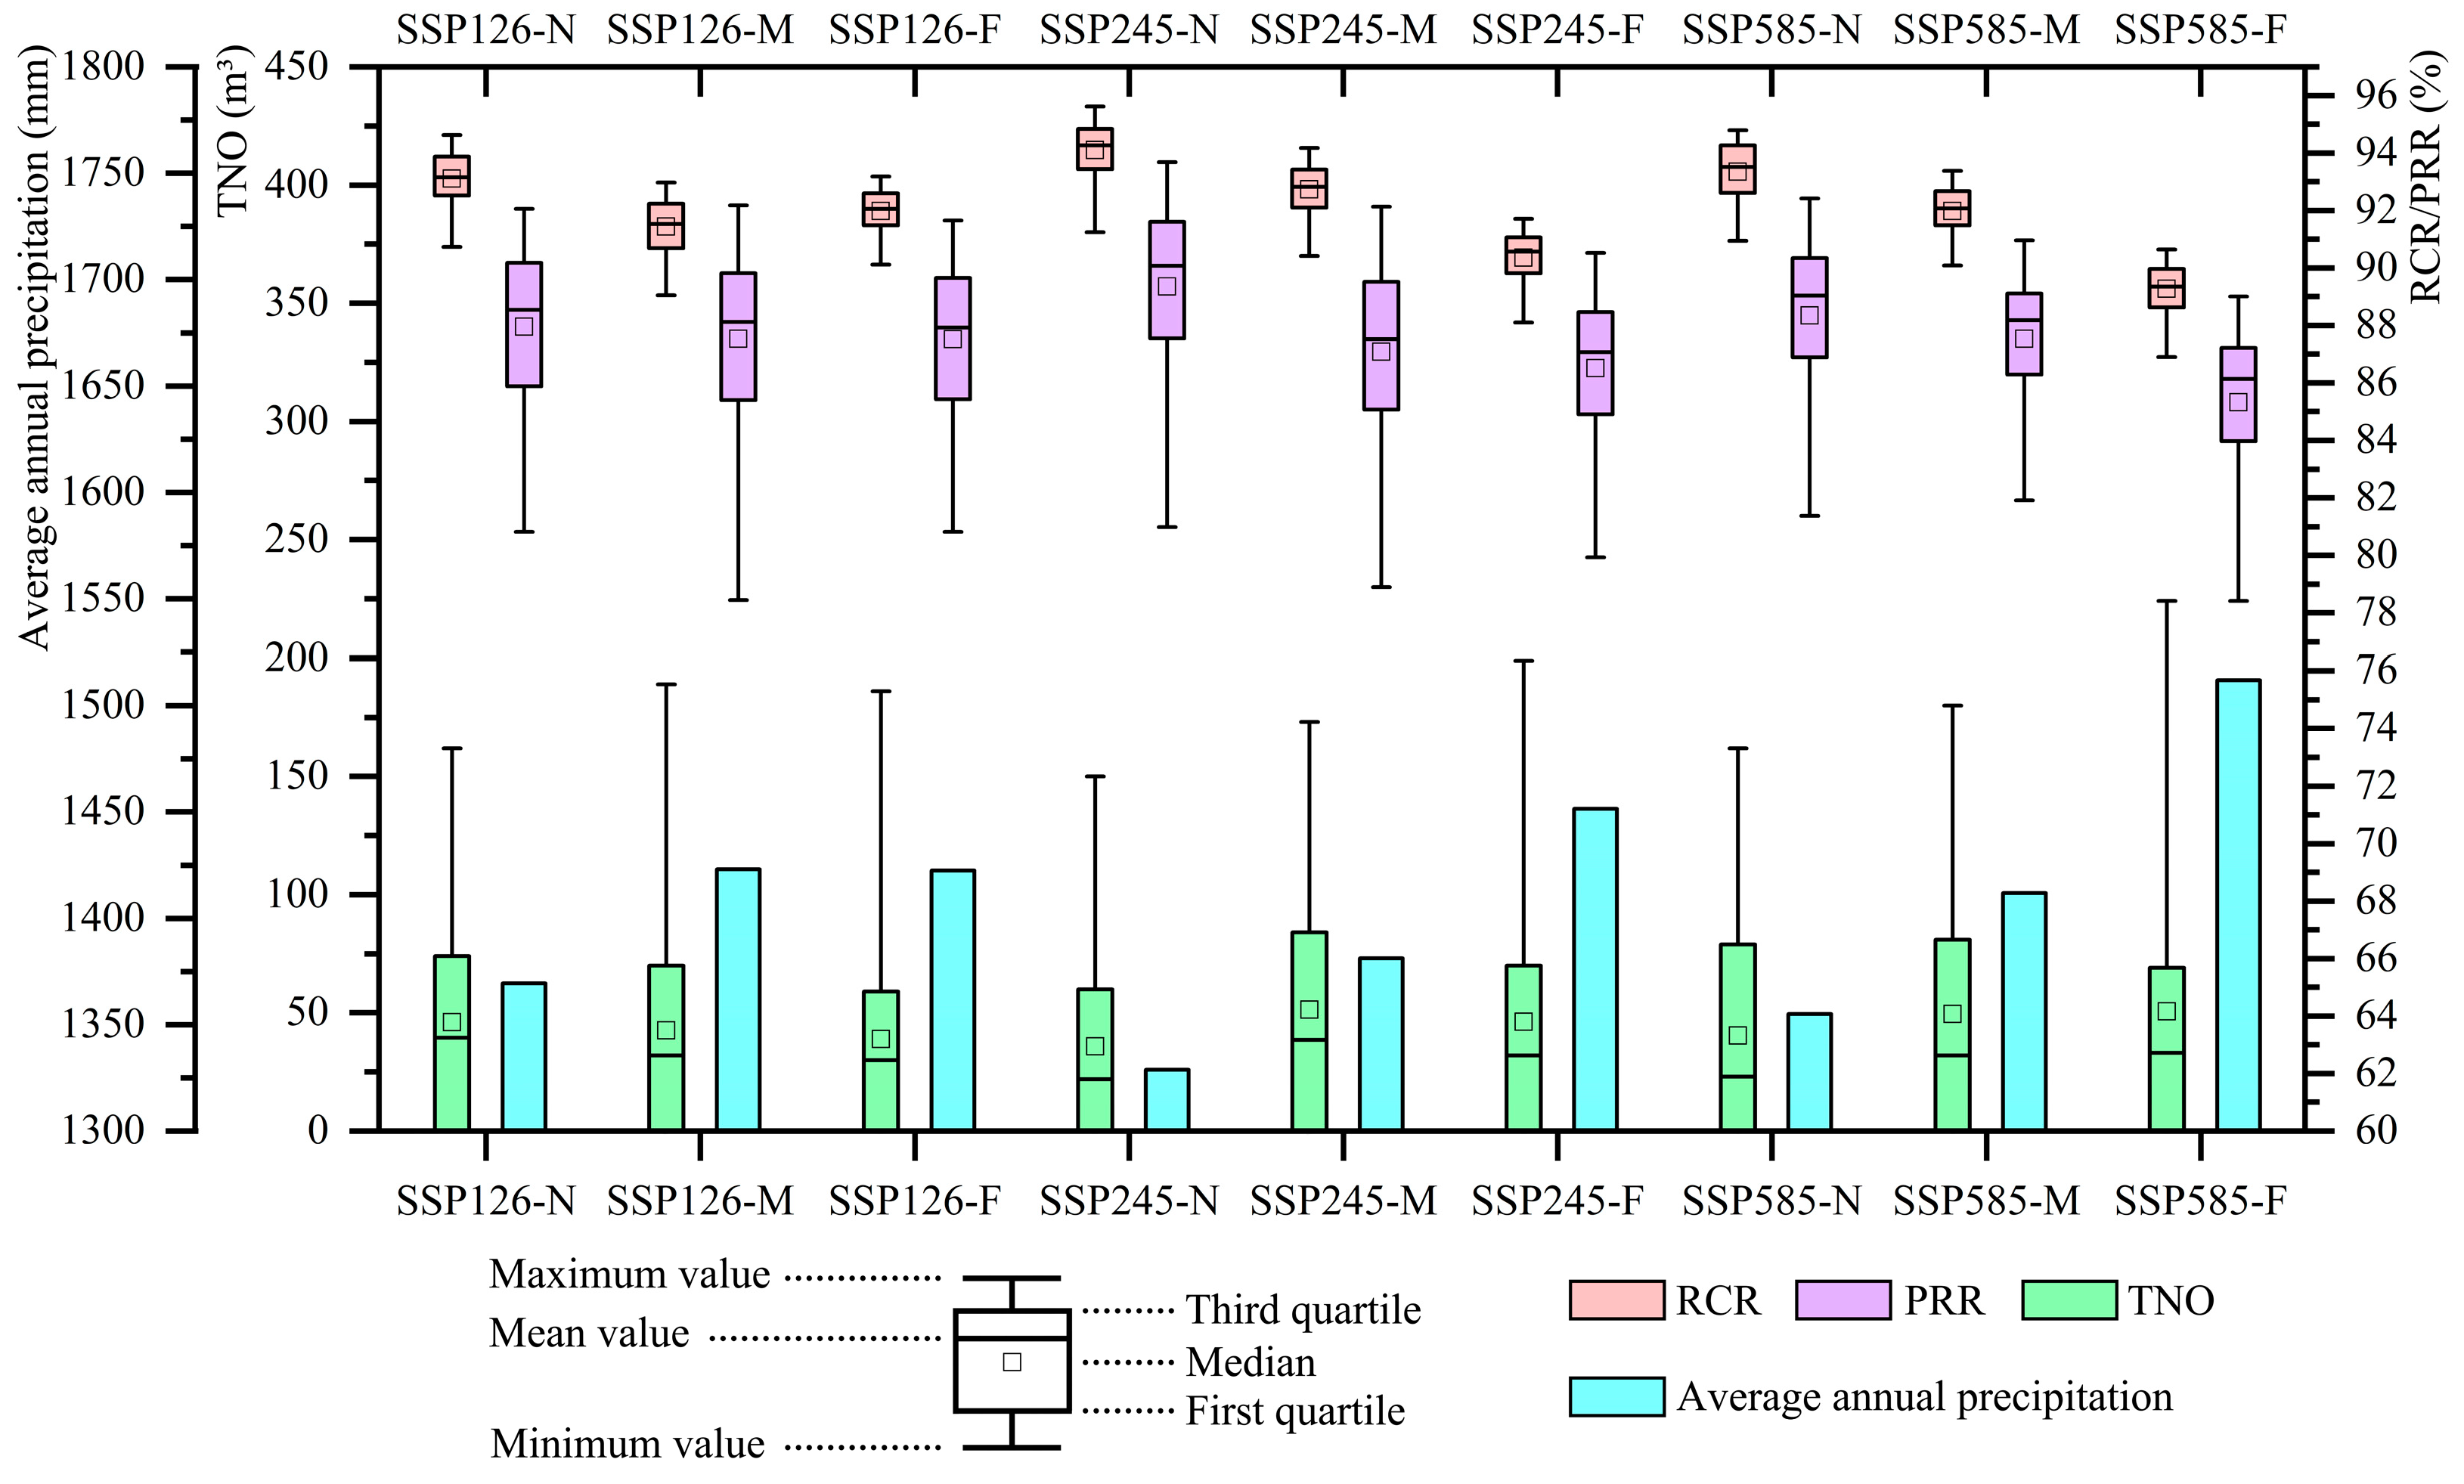
  • The optimization effect of CGGI was different under different multi-dimensional scenarios. The optimization effects of hydrological recovery and water quality protection were almost opposite to those of stormwater resource utilization. Among nine multi-dimensional scenarios, the SSP245-N scenario that assumes that economic development and ecological protection maintain the current trend, with moderate radiative forcing and social vulnerability, had the best hydrological recovery effect, the best water quality protection effect, and the worst stormwater resource utilization potential. In contrast, the SSP585-F scenario that focuses on rapid economic development, with the largest carbon emissions, highest radiative forcing level and social vulnerability, had the worst hydrological recovery effect, the worst water quality protection effect, and the greatest stormwater resource utilization potential.
  • Precipitation was a determinant of optimization effects, and the SSP-RCP scenarios and time series jointly influenced precipitation. In terms of the SSP-RCP scenarios, the SSP126 scenario that focuses on ecological protection, with low radiative forcing and social vulnerability, had the greatest influence on the precipitation and efficacy of CGGI in the near and middle period, and the SSP585 scenario that focuses on rapid economic development, with the largest carbon emissions, highest radiative forcing level, and social vulnerability, had the greatest influence on the precipitation and efficacy of CGGI in the far period. In terms of the time series, the far period had the greatest influence on the precipitation and efficacy of CGGI under the three SSP-RCP scenarios.
  • Stormwater resource utilization was not significantly correlated with the CGGI scale. High and low costs can not only achieve a similar stormwater recycling effect but also do not produce stormwater overflow. This finding is applicable to stormwater management considering stormwater resource utilization in areas of the Yangtze River Delta with water shortages due to contamination, as well as stormwater management in this region where the water shortages will be effectively alleviated.
This study enriches the research content of multi-objective optimization in the field of stormwater management and can provide references and suggestions for future stormwater management in areas of the Yangtze River Delta with contamination-induced water shortages.

Author Contributions

Conceptualization, Z.X. and J.C.; methodology, Z.X.; software, J.C.; validation, Z.X., J.C. and H.X.; formal analysis, Z.X. and J.C.; investigation, H.X.; resources, J.L.; data curation, J.C. and J.L.; writing—original draft preparation, Z.X.; writing—review and editing, Z.X. and J.C.; visualization, Z.X.; supervision, H.X.; project administration, J.C. and H.X.; funding acquisition, J.L. All authors have read and agreed to the published version of the manuscript.

Funding

This research was funded by the Priority Academic Program Development of Jiangsu Higher Education Institutions (PAPD).

Data Availability Statement

The data that were used in this study are confidential.

Conflicts of Interest

Author Jining Li was employed by China Railway 22nd Bureau Group Real Estate Development Co., Ltd. The remaining authors declare that the research was conducted in the absence of any commercial or financial relationships that could be construed as a potential conflict of interest.

References

  1. Geng, T.; Jia, F.; Cai, W.J.; Wu, L.X.; Gan, B.L.; Jing, Z.; Li, S.J.; McPhaden, M.J. Increased occurrences of consecutive La Nina events under global warming. Nature 2023, 619, 774–781. [Google Scholar] [CrossRef] [PubMed]
  2. Shao, Y.S.; Xu, Y.J. Challenges and countermeasures of urban water systems against climate change: A perspective from China. Front. Environ. Sci. Eng. 2023, 17, 156. [Google Scholar] [CrossRef]
  3. Jenkins, K.; Surminski, S.; Hall, J.; Crick, F. Assessing surface water flood risk and management strategies under future climate change: Insights from an Agent-Based Model. Sci. Total Environ. 2017, 595, 159–168. [Google Scholar] [CrossRef] [PubMed]
  4. Baek, S.S.; Ligaray, M.; Pyo, J.; Park, J.P.; Kang, J.H.; Pachepsky, Y.; Chun, J.A.; Cho, K.H. A novel water quality module of the SWMM model for assessing low impact development (LID) in urban watersheds. J. Hydrol. 2020, 586, 124886. [Google Scholar] [CrossRef]
  5. Peng, L.; Li, Z.H. Ensemble Flood Risk Assessment in the Yangtze River Economic Belt under CMIP6 SSP-RCP Scenarios. Sustainability 2021, 13, 12097. [Google Scholar] [CrossRef]
  6. Abduljaleel, Y.; Salem, A.; Haq, F.; Awad, A.; Amiri, M. Improving detention ponds for effective stormwater management and water quality enhancement under future climate change: A simulation study using the PCSWMM model. Sci. Rep. 2023, 13, 5555. [Google Scholar] [CrossRef]
  7. Rosenberger, L.; Leandro, J.; Pauleit, S.; Erlwein, S. Sustainable stormwater management under the impact of climate change and urban densification. J. Hydrol. 2021, 596, 126137. [Google Scholar] [CrossRef]
  8. Kim, S. A Study on the Reduction Strategy for Stormwater Runoff in Cities through Green Infrastructure—Focused on the Green Infrastructure Plan of New York City. J. Land Plan. 2012, 47, 283–292. [Google Scholar]
  9. Chen, W.J.; Wang, W.Q.; Huang, G.R.; Wang, Z.L.; Lai, C.G.; Yang, Z.Y. The capacity of grey infrastructure in urban flood management: A comprehensive analysis of grey infrastructure and the green-grey approach. Int. J. Disaster Risk Reduct. 2021, 54, 102045. [Google Scholar] [CrossRef]
  10. Kawabata, Y.; Takimoto, K.; Nishida, T.; Koshikawa, Y.; Aizawa, A. Integration of Green and Gray Infrastructures—Conceptualization from the Perspective of Gray Engineers. Struct. Eng. Int. 2024. [Google Scholar] [CrossRef]
  11. Andimuthu, R.; Kandasamy, P.; Mudgal, B.V.; Jeganathan, A.; Balu, A.; Sankar, G. Performance of urban storm drainage network under changing climate scenarios: Flood mitigation in Indian coastal city. Sci. Rep. 2019, 9, 7783. [Google Scholar] [CrossRef] [PubMed]
  12. Islam, A.; Hassini, S.; El-Dakhakhni, W. A systematic bibliometric review of optimization and resilience within low impact development stormwater management practices. J. Hydrol. 2021, 599, 126457. [Google Scholar] [CrossRef]
  13. Gulshad, K.; Szydlowski, M.; Yaseen, A.; Aslam, R.W. A comparative analysis of methods and tools for low impact development (LID) site selection. J. Environ. Manag. 2024, 354, 120212. [Google Scholar] [CrossRef] [PubMed]
  14. Feng, M.Y.; Jung, K.; Li, F.P.; Li, H.Y.; Kim, J.C. Evaluation of the Main Function of Low Impact Development Based on Rainfall Events. Water 2020, 12, 2231. [Google Scholar] [CrossRef]
  15. Yang, W.Y.; Zhang, J. Assessing the performance of gray and green strategies for sustainable urban drainage system development: A multi-criteria decision-making analysis. J. Clean. Prod. 2021, 293, 126191. [Google Scholar] [CrossRef]
  16. Casal-Campos, A.; Sadr, S.M.K.; Fu, G.T.; Butler, D. Reliable, Resilient and Sustainable Urban Drainage Systems: An Analysis of Robustness under Deep Uncertainty. Environ. Sci. Technol. 2018, 52, 9008–9021. [Google Scholar] [CrossRef]
  17. Leng, L.Y.; Jia, H.F.; Chen, A.S.; Zhu, D.Z.; Xu, T.; Yu, S. Multi-objective optimization for green-grey infrastructures in response to external uncertainties. Sci. Total Environ. 2021, 775, 145831. [Google Scholar] [CrossRef]
  18. Men, H.; Lu, H.; Jiang, W.J.; Xu, D. Mathematical Optimization Method of Low-Impact Development Layout in the Sponge City. Math. Probl. Eng. 2020, 2020, 734081. [Google Scholar] [CrossRef]
  19. Wang, Z.T.; Pei, Y.; Li, J.Q. A Survey on Search Strategy of Evolutionary Multi-Objective Optimization Algorithms. Appl. Sci. 2023, 13, 4643. [Google Scholar] [CrossRef]
  20. Yang, B.Y.; Zhang, T.; Li, J.Z.; Feng, P.; Miao, Y.J.J. Optimal designs of LID based on LID experiments and SWMM for a small-scale community in Tianjin, north China. J. Environ. Manag. 2023, 334, 117442. [Google Scholar] [CrossRef]
  21. She, L.; Wei, M.; You, X.Y. Multi-objective layout optimization for sponge city by annealing algorithm and its environmental benefits analysis. Sustain. Cities Soc. 2021, 66, 102706. [Google Scholar] [CrossRef]
  22. Hou, J.W.; Ho, B.; Sun, S.Q. Spatial Optimization of Low-Impact Development Facilities Based on a Median Model and an Ant Colony Optimization. J. Hydrol. Eng. 2019, 24, 04019055. [Google Scholar] [CrossRef]
  23. Hou, J.W.; Zhu, M.Y.; Wang, Y.J.; Sun, S.Q. Optimal spatial priority scheme of urban LID-BMPs under different investment periods. Landsc. Urban Plan. 2020, 202, 103858. [Google Scholar] [CrossRef]
  24. Rahimi, I.; Gandomi, A.H.; Deb, K.; Chen, F.; Nikoo, M.R. Scheduling by NSGA-II: Review and Bibliometric Analysis. Processes 2022, 10, 98. [Google Scholar] [CrossRef]
  25. Karaoglan, A.D.; Yaman, R. Using response surface design to determine the optimal parameters of genetic algorithm and a case study. Int. J. Prod. Res. 2013, 51, 5039–5054. [Google Scholar]
  26. Dong, X.; Yi, W.; Yuan, P.; Song, Y. Optimization and trade-off framework for coupled green-grey infrastructure considering environmental performance. J. Environ. Manag. 2023, 329, 117041. [Google Scholar] [CrossRef]
  27. Wang, M.; Jiang, Z.Y.; Zhang, D.Q.; Zhang, Y.; Liu, M.; Rao, Q.Y.; Li, J.J.; Tan, S.K. Optimization of integrating life cycle cost and systematic resilience for grey-green stormwater infrastructure. Sustain. Cities Soc. 2023, 90, 104379. [Google Scholar] [CrossRef]
  28. Liu, Z.J.; Han, Z.X.; Shi, X.Y.; Liao, X.Y.; Leng, L.Y.; Jia, H.F. Multi-objective optimization methodology for green-gray coupled runoff control infrastructure adapting spatial heterogeneity of natural endowment and urban development. Water Res. 2023, 233, 119759. [Google Scholar] [CrossRef]
  29. Wang, Q.; Zhang, Q.H.; Wang, X.C.; Huang, J.G.; Ge, Y. Impacts of key factors on heavy metal accumulation in urban road-deposited sediments (RDS): Implications for RDS management. Chemosphere 2020, 261, 127786. [Google Scholar] [CrossRef]
  30. Zhou, Y. Exploring multidecadal changes in climate and reservoir storage for assessing nonstationarity in flood peaks and risks worldwide by an integrated frequency analysis approach. Water Res. 2020, 185, 116265. [Google Scholar] [CrossRef]
  31. Lai, Q.; Ma, J.; He, F.; Wei, G. Response Model for Urban Area Source Pollution and Water Environmental Quality in a River Network Region. Int. J. Environ. Res. Public Health 2022, 19, 10546. [Google Scholar] [CrossRef] [PubMed]
  32. Wu, J.; Zeng, H.; Yu, H.; Ma, L.; Xu, L.; Qin, B. Water and Sediment Quality in Lakes along the Middle and Lower Reaches of the Yangtze River, China. Water Resour. Manag. 2012, 26, 3601–3618. [Google Scholar] [CrossRef]
  33. Li, X.; Mander, U.; Ma, Z.; Jia, Y. Water Quality Problems and Potential for Wetlands as Treatment Systems in The Yangtze River Delta, China. Wetlands 2009, 29, 1125–1132. [Google Scholar] [CrossRef]
  34. Wang, X.; Wang, Y.; Pang, Y.; Wang, K.; Yu, J. Pollution Load Coordination and Eco-Compensation for Trans-Boundary Water Pollution Control: The Case of the Tri-Border Region of the Yangtze Delta. Sustainability 2024, 16, 1151. [Google Scholar] [CrossRef]
  35. Li, Y.L.; Tu, Y.J.; Li, G.J.; Pu, Y.L.; Chien, M.C.; Duan, Y.P. Chemical fractionation of heavy metals and zinc isotope source identification in sediments of the Huangpu River, Shanghai, China. Environ. Sci. Eur. 2024, 36, 137. [Google Scholar] [CrossRef]
  36. Yuan, P.K.; Wang, Y.; Chen, X.Q.; Gao, P. An overview of microplastic pollution in the environment over the megacity of Shanghai during 2013–2022. Sci. Total Environ. 2024, 912, 168986. [Google Scholar] [CrossRef]
  37. Wang, H.Y.; Hu, Q.Y.; Huang, C.; Lu, K.F.; He, H.D.; Peng, Z.R. Quantification of Gaseous and Particulate Emission Factors from a Cargo Ship on the Huangpu River. J. Mar. Sci. Eng. 2023, 11, 1580. [Google Scholar] [CrossRef]
  38. Yang, S.; Liu, P. Strategy of water pollution prevention in Taihu Lake and its effects analysis. J. Great Lakes Res. 2010, 36, 150–158. [Google Scholar] [CrossRef]
  39. Zhang, J.; Chen, S.; Gao, C. Does environmental regulation promote enterprise environmental protection investments? A quasi-natural experiment from river chief system in the Yangtze river delta of China. Heliyon 2024, 10, e34867. [Google Scholar] [CrossRef]
  40. The State Council’s Opinions on Comprehensively Strengthening Ecological Environmental Protection and Resolutely Fighting the Tough Battle of Pollution Prevention and Control. Available online: https://www.huzhou.gov.cn/art/2018/6/18/art_1229213553_54846271.html (accessed on 10 May 2024).
  41. Feng, W.J.; Liu, Y.; Gao, L. Stormwater treatment for reuse: Current practice and future development—A review. J. Environ. Manag. 2022, 301, 113830. [Google Scholar] [CrossRef]
  42. Yin, H.; Kong, F.; Dronova, I. Hydrological performance of extensive green roofs in response to different rain events in a subtropical monsoon climate. Landsc. Ecol. Eng. 2019, 15, 297–313. [Google Scholar] [CrossRef]
  43. Abduljaleel, Y.; Demissie, Y. Identifying Cost-Effective Low-Impact Development (LID) under Climate Change: A Multi-Objective Optimization Approach. Water 2022, 14, 3017. [Google Scholar] [CrossRef]
  44. Deb, K.; Jain, H. An evolutionary many-objective optimization algorithm using referencepoint-based nondominated sorting approach, part I: Solving problems with box constraints. IEEE Trans. Evol. Comput. 2013, 18, 577–601. [Google Scholar] [CrossRef]
  45. Leng, L.; Xu, C.; Jia, H.; Jia, Q. Incorporating receiving waters responses into the framework of spatial optimization of LID-BMPs in plain river network region. Water Res. 2022, 224, 119036. [Google Scholar] [CrossRef]
  46. Tansar, H.; Duan, H.F.; Mark, O. A multi-objective decision-making framework for implementing green-grey infrastructures to enhance urban drainage system resilience. J. Hydrol. 2023, 620, 129381. [Google Scholar] [CrossRef]
  47. Eyring, V.; Bony, S.; Meehl, G.A.; Senior, C.A.; Stevens, B.; Stouffer, R.J.; Taylor, K.E. Overview of the Coupled Model Intercomparison Project Phase 6 (CMIP6) experimental design and organization. Geosci. Model. Dev. 2016, 9, 1937–1958. [Google Scholar] [CrossRef]
  48. Piao, J.; Chen, W.; Wang, L.; Chen, S. Future projections of precipitation, surface temperatures and drought events over the monsoon transitional zone in China from bias-corrected CMIP6 models. Int. J. Climatol. 2022, 42, 1203–1219. [Google Scholar] [CrossRef]
  49. Das, J.; Manikanta, V.; Umamahesh, N.V. Population exposure to compound extreme events in India under different emission and population scenarios. Sci. Total Environ. 2022, 806, 150424. [Google Scholar] [CrossRef]
  50. O’Neill, B.C.; Tebaldi, C.; van Vuuren, D.P.; Eyring, V.; Friedlingstein, P.; Hurtt, G.; Knutti, R.; Kriegler, E.; Lamarque, J.F.; Lowe, J.; et al. The Scenario Model Intercomparison Project (ScenarioMIP) for CMIP6. Geosci. Model Dev. 2016, 9, 3461–3482. [Google Scholar] [CrossRef]
  51. Vuuren, D.P.; Riahi, K.; Moss, R.; Edmonds, J.; Thomson, A.; Nakicenovic, N.; Kram, T.; Berkhout, F.; Swart, R.; Janetos, A.; et al. A proposal for a new scenario framework to support research and assessment in different climate research communities. Glob. Environ. Chang. 2012, 22, 21–35. [Google Scholar] [CrossRef]
  52. O’Neill, B.C.; Kriegler, E.; Riahi, K.; Ebi, K.L.; Hallegatte, S.; Carter, T.R.; Mathur, R.; Vuuren, D.P. A new scenario framework for climate change research: The concept of shared socioeconomic pathways. Clim. Chang. 2014, 122, 387–400. [Google Scholar] [CrossRef]
  53. Grose, M.R.; Narsey, S.; Delage, F.P.; Dowdy, A.J.; Bador, M.; Boschat, G.; Chung, C.; Kajtar, J.B.; Rauniyar, S.; Freund, M.B.; et al. Insight From CMIP6 for Australia’s Future Climate. Earth’s Future 2020, 8, e2019EF001469. [Google Scholar] [CrossRef]
  54. Li, C.; Zwiers, F.; Zhang, X.B.; Li, G.L.; Sun, Y.; Wehner, M. Changes in Annual Extremes of Daily Temperature and Precipitation in CMIP6 Models. J. Clim. 2021, 34, 3441–3460. [Google Scholar] [CrossRef]
  55. Ridder, N.N.; Pitman, A.J.; Ukkola, A.M. Do CMIP6 Climate Models Simulate Global or Regional Compound Events Skillfully? Geophys. Res. Lett. 2021, 48, e2020GL091152. [Google Scholar] [CrossRef]
  56. Jiang, D.B.; Hu, D.; Tian, Z.P.; Lang, X.M. Differences between CMIP6 and CMIP5 Models in Simulating Climate over China and the East Asian Monsoon. Adv. Atmos. Sci. 2020, 37, 1102–1118. [Google Scholar] [CrossRef]
  57. Gao, Z.; Zhang, Q.H.; Xie, Y.D.; Wang, Q.; Dzakpasu, M.; Xiong, J.Q.; Wang, X.C. A novel multi-objective optimization framework for urban green-gray infrastructure implementation under impacts of climate change. Sci. Total Environ. 2022, 825, 153954. [Google Scholar] [CrossRef]
  58. Wang, Y.W.; Zhang, Z.M.; Zhao, Z.Y.; Sagris, T.; Wang, Y. Prediction of Future Urban Rainfall and Waterlogging Scenarios Based on CMIP6: A Case Study of Beijing Urban Area. Water 2023, 15, 2045. [Google Scholar] [CrossRef]
  59. Xu, H.S.; Zhong, T.X.; Chen, Y.G.; Zhang, J.G. How to simulate future scenarios of urban stormwater management? A novel framework coupling climate change, urbanization, and green stormwater infrastructure development. Sci. Total Environ. 2023, 874, 162399. [Google Scholar] [CrossRef]
  60. Jupyter. Available online: https://jupyter.org/ (accessed on 10 May 2024).
  61. Li, J.X.; Zhang, G.J.; Zhang, P.T.; Jing, S.Y.; Dong, J. Simulation and Zoning Research on the Ecosystem Service in the Beijing-Tianjin-Hebei Region Based on SSP-RCP Scenarios. Land 2023, 12, 1536. [Google Scholar] [CrossRef]
  62. Bai, T.Q.; Fan, L.K.; Song, G.X.; Song, H.Q.; Ru, X.T.; Wang, Y.B.; Zhang, H.P.; Min, R.Q.; Wang, W.J. Effects of Land Use/Cover and Meteorological Changes on Regional Climate under Different SSP-RCP Scenarios: A Case Study in Zhengzhou, China. Remote Sens. 2023, 15, 2601. [Google Scholar] [CrossRef]
  63. Li, S.Y.; Miao, L.J.; Jiang, Z.H.; Wang, G.J.; Gnyawali, K.R.; Zhang, J.; Zhang, H.; Fang, K.; He, Y.; Li, C. Projected drought conditions in Northwest China with CMIP6 models under combined SSPs and RCPs for 2015–2099. Adv. Clim. Chang. Res. 2020, 11, 210–217. [Google Scholar] [CrossRef]
  64. Su, B.D.; Huang, J.L.; Mondal, S.K.; Zhai, J.Q.; Wang, Y.J.; Wen, S.S.; Gao, M.N.; Lv, Y.R.; Jiang, S.; Jiang, T.; et al. Insight from CMIP6 SSP-RCP scenarios for future drought characteristics in China. Atmos. Res. 2021, 250, 105375. [Google Scholar] [CrossRef]
  65. Niu, J.Y.; Wu, J.Y.; Qin, W.M.; Wang, L.C.; Yang, C.; Zhang, M.; Zhang, Y.J.; Qi, Q.H. Projection of future carbon benefits by photovoltaic power potential in China using CMIP6 statistical downscaling data. Environ. Res. Lett. 2023, 18, 094013. [Google Scholar] [CrossRef]
  66. Sun, P.; Zou, Y.F.; Yao, R.; Ma, Z.C.; Bian, Y.J.; Ge, C.H.; Lv, Y.F. Compound and successive events of extreme precipitation and extreme runoff under heatwaves based on CMIP6 models. Sci. Total Environ. 2023, 878, 162980. [Google Scholar] [CrossRef] [PubMed]
  67. Dai, J.; Hu, H.; Mao, X. Projected Alterations in Snowmelt Streamflow with Climate Change in Shiyang River Basin of Northwest China Using Modified Swat Model; SSRN. 2023. Available online: https://ssrn.com/abstract=4652847 (accessed on 15 October 2023).
  68. Ma, Z.C.; Sun, P.; Zhang, Q.; Zou, Y.F.; Lv, Y.F.; Li, H.; Chen, D.H. The Characteristics and Evaluation of Future Droughts across China through the CMIP6 Multi-Model Ensemble. Remote Sens. 2022, 14, 1097. [Google Scholar] [CrossRef]
  69. Peng, S.Z.; Ding, Y.X.; Wen, Z.M.; Chen, Y.M.; Cao, Y.; Ren, J.Y. Spatiotemporal change and trend analysis of potential evapotranspiration over the Loess Plateau of China during 2011–2100. Agr. For. Meteorol. 2017, 233, 183–194. [Google Scholar] [CrossRef]
  70. Jian, S.Q.; Shi, S.J.; Cui, J.K.; Zhu, T.S.; Hu, C.H. Study on fractional vegetation cover dynamic in the Yellow River Basin, China from 1901 to 2100. Front. For. Glob. Chang. 2023, 6, 1157285. [Google Scholar] [CrossRef]
  71. Chen, C.Z.; Gan, R.; Feng, D.M.; Yang, F.; Zuo, Q.T. Quantifying the contribution of SWAT modelling and CMIP6 inputting to streamflow prediction uncertainty under climate change. J. Clean. Prod. 2022, 364, 132675. [Google Scholar] [CrossRef]
  72. Li, J.D.; Strong, C.; Wang, J.; Burian, S. An Event-Based Resilience Index to Assess the Impacts of Land Imperviousness and Climate Changes on Flooding Risks in Urban Drainage Systems. Water 2023, 15, 2663. [Google Scholar] [CrossRef]
  73. Climate Change Research Center. Available online: https://ccrc.iap.ac.cn (accessed on 15 December 2023).
  74. Cui, T.; Li, C.; Tian, F.Q. Evaluation of Temperature and Precipitation Simulations in CMIP6 Models Over the Tibetan Plateau. Earth Space Sci. 2021, 8, e2020EA001620. [Google Scholar] [CrossRef]
  75. Zamani, Y.; Monfared, S.A.H.; Moghaddam, M.A.; Hamidianpour, M. A comparison of CMIP6 and CMIP5 projections for precipitation to observational data: The case of Northeastern Iran. Theor. Appl. Climatol. 2020, 142, 1613–1623. [Google Scholar] [CrossRef]
  76. Rossman, L.A. Storm Water Management Model User’s Manual Version 5.1. EPA/600/R-05/040; US Environmental Protection Agency: Cincinnati, OH, USA, 2015.
  77. Ahiablame, L.M.; Engel, B.A.; Chaubey, I. Effectiveness of Low Impact Development Practices: Literature Review and Suggestions for Future Research. Water Air Soil Pollut. 2012, 223, 4253–4273. [Google Scholar] [CrossRef]
  78. Dell, T.; Razzaghmanesh, M.; Sharvelle, S.; Arabi, M. Development and Application of a SWMM-Based Simulation Model for Municipal Scale Hydrologic Assessments. Water 2021, 13, 1644. [Google Scholar] [CrossRef]
  79. Hua, P.; Yang, W.Y.; Qi, X.C.; Jiang, S.S.; Xie, J.Q.; Gu, X.Y.; Li, H.H.; Zhang, J.; Krebs, P. Evaluating the effect of urban flooding reduction strategies in response to design rainfall and low impact development. J. Clean. Prod. 2020, 242, 118515. [Google Scholar] [CrossRef]
  80. Wang, N.; Chu, X.F. Revised Horton model for event and continuous simulations of infiltration. J. Hydrol. 2020, 589, 125215. [Google Scholar] [CrossRef]
  81. Yang, W.Y.; Zhang, J.; Mei, S.B.; Krebs, P. Impact of antecedent dry-weather period and rainfall magnitude on the performance of low impact development practices in urban flooding and non-point pollution mitigation. J. Clean. Prod. 2021, 320, 128946. [Google Scholar] [CrossRef]
  82. Duan, H.F.; Li, F.; Yan, H.X. Multi-Objective Optimal Design of Detention Tanks in the Urban Stormwater Drainage System: LID Implementation and Analysis. Water Resour. Manag. 2016, 30, 4635–4648. [Google Scholar] [CrossRef]
  83. Dong, X.Y.; Yuan, P.; Song, Y.H.; Yi, W.X. Optimizing Green-Gray Infrastructure for Non-Point Source Pollution Control under Future Uncertainties. Int. J. Environ. Res. Public Health 2021, 18, 7586. [Google Scholar] [CrossRef]
  84. Liu, Z.J.; Xu, C.Q.; Xu, T.; Jia, H.F.; Zhang, X.; Chen, Z.X.; Yin, D.K. Integrating socioecological indexes in multiobjective intelligent optimization of green-grey coupled infrastructures. Resour. Conserv. Recycl. 2021, 174, 105801. [Google Scholar] [CrossRef]
  85. Bakhshipour, A.E.; Dittmer, U.; Haghighi, A.; Nowak, W. Hybrid green-blue-gray decentralized urban drainage systems design, a simulation-optimization framework. J. Environ. Manag. 2019, 249, 109364. [Google Scholar] [CrossRef]
  86. Wang, Z.L.; Zhou, S.Q.; Wang, M.; Zhang, D.Q. Cost-benefit analysis of low-impact development at hectare scale for urban stormwater source control in response to anticipated climatic change. J. Environ. Manag. 2020, 264, 110483. [Google Scholar] [CrossRef] [PubMed]
  87. Eckart, K.; McPhee, Z.; Bolisetti, T. Multiobjective optimization of low impact development stormwater controls. J. Hydrol. 2018, 562, 564–576. [Google Scholar] [CrossRef]
  88. Wang, M.; Liu, M.; Zhang, D.Q.; Zhang, Y.; Su, J.; Zhou, S.Q.; Bakhshipour, A.E.; Tan, S.K. Assessing hydrological performance for optimized integrated grey-green infrastructure in response to climate change based on shared socio-economic pathways. Sustain. Cities Soc. 2023, 91, 104436. [Google Scholar] [CrossRef]
  89. Wang, M.; Liu, M.; Zhang, D.Q.; Qi, J.D.; Fu, W.C.; Zhang, Y.; Rao, Q.Y.; Bakhshipour, A.E.; Tan, S.K. Assessing and optimizing the hydrological performance of Grey-Green infrastructure systems in response to climate change and non-stationary time series. Water Res. 2023, 232, 119720. [Google Scholar] [CrossRef] [PubMed]
  90. Fan, Y.Y.; Yu, H.J.; He, S.J.; Lai, C.G.; Li, X.Y.; Jiang, X.T. The Mitigating Efficacy of Multi-Functional Storage Spaces in Alleviating Urban Floods across Diverse Rainfall Scenarios. Sustainability 2024, 16, 6417. [Google Scholar] [CrossRef]
  91. Zhu, Y.F.; Xu, C.Q.; Liu, Z.J.; Yin, D.K.; Jia, H.F.; Guan, Y.T. Spatial layout optimization of green infrastructure based on life cycle multi-objective optimization algorithm and SWMM model. Resour. Conserv. Recycl. 2023, 191, 106906. [Google Scholar] [CrossRef]
Figure 1. Research framework.
Land 13 01932 g001
Figure 2. Overview map of the study area, including (a) a distribution map of water systems of the Yangtze River Delta and the location of the study area in the Yangtze River Delta, Changzhou, and Wujin; (b) a satellite map of the study area; (c) a distribution map of the underlying surfaces of the study area; (d) a generalized SWMM of the study area.
Land 13 01932 g002
Figure 3. Taylor plots of different climate models during the verification period. (a) Before calibration. (b) After calibration.
Land 13 01932 g003
Figure 4. The NSGA-III algorithm flow.
Land 13 01932 g004
Figure 5. Optimization schemes distributions of hydrological recovery. (a) SSP-RCP scenario dimension. (b) Time series dimension.
Land 13 01932 g005
Figure 6. Optimization scheme distributions of water quality protection. (a) SSP-RCP scenarios dimension. (b) Time series dimension.
Land 13 01932 g006
Figure 7. Optimization Schemes distributions of stormwater resource utilization. (a) SSP-RCP scenarios dimension. (b) Time series dimension.
Land 13 01932 g007
Figure 8. Average annual precipitation and optimization values of various objectives under nine multi-dimensional scenarios.
Land 13 01932 g008
Table 1. Basic information of eight climate models in CMIP6.
Serial NumberModel NameInstitutionCountryAtmospheric Model Resolution
1CanESM5CCCMACanada2.81° × 2.79°
2CMCC-ESM2CMCCItaly1.25° × 0.94°
3GFDL-ESM4NOAA-GFDLAmerica1.25° × 1°
4IPSL-CM6A-LRIPSLFrance2.5° × 1.27°
5MIROC6JAMSTECJapan1.41° × 1.4°
6MRI-ESM2-0MRIJapan1.13° × 1.12°
7NorESM2-LMNCCNorway2.5° × 1.89°
8NESM3NUISTChina1.88° × 1.86°
Table 2. Calibration process of model parameters.
Parameter NameInitial ValueG1G2G3G4G5G6G7G8
N-Imperv0.0130.0120.0130.0140.0140.0150.0150.0150.015
N-Perv0.150.20.250.250.250.20.250.250.2
D-Imperv222.252.252.42.32.42.42.3
D-Perv5558.598.58.59.58.5
MaxRate606565657065707065
MinRate3.183.23.23.253.33.253.33.33.25
Decay222222222
Simulated runoff coefficient0.60760.59000.58330.56480.55780.56500.55830.55720.5650
Target runoff coefficient0.55300.55300.55300.55300.55300.55300.55300.55300.5530
D-value0.05460.03700.03030.01180.00480.01200.00530.00420.0120
Table 3. Results of model parameter verification.
Return PeriodPrecipitation (mm)Runoff (mm)Simulated Value of the Runoff CoefficientSimulation D-Value C v
2a45.65326.2460.57490.02191.83%
3a49.01428.9770.59120.03823.03%
Table 4. Cost parameters of CGGI.
CGGIConstruction Cost (RMB/m2)Percentage of the Operation and Maintenance Cost (%)Service Life (Years)Discount Rate (%)
Bioretention facility536.765306
Green roof477.755306
Permeable pavement315.425306
Storage tank2335.058256
Disclaimer/Publisher’s Note: The statements, opinions and data contained in all publications are solely those of the individual author(s) and contributor(s) and not of MDPI and/or the editor(s). MDPI and/or the editor(s) disclaim responsibility for any injury to people or property resulting from any ideas, methods, instructions or products referred to in the content.

