Article

Evaluation of Effectiveness and Multi-Scenario Analysis of Land Use Development Strategies and Ecological Protection Redlines on Carbon Storage in the Great Bay Area of China Using the PLUS-InVEST-PSM Model

1
College of Water Conservancy and Civil Engineering, South China Agricultural University, Guangzhou 510642, China
2
Chongqing Institute of East China Normal University, Chongqing 401123, China
3
Shanghai Real-Estate Science Research Institute, Shanghai 200031, China
4
Key Lab of Geographic Information Science of the Ministry of Education, School of Geographic Sciences, East China Normal University, Shanghai 200241, China
5
School of Tourism and Historical Culture, Southwest Minzu University, Chengdu 610041, China
*
Author to whom correspondence should be addressed.
Land 2024, 13(11), 1918; https://doi.org/10.3390/land13111918
Submission received: 9 October 2024 / Revised: 11 November 2024 / Accepted: 13 November 2024 / Published: 15 November 2024
(This article belongs to the Section Land Innovations – Data and Machine Learning)

Abstract

:
Land use change is a key factor affecting the carbon storage of terrestrial ecosystems. Most studies focus on formulating different land development strategies to mitigate the adverse impacts of land development, while fewer discuss the effectiveness of these strategies. In the context of varying socio-economic development and limited budgets for ecological conservation, evaluating effectiveness is essential for selecting the most suitable land development strategy. This research proposed a Patch-Generating Land Use Simulation-Integrated Valuation of Ecosystem Services and Tradeoffs–Propensity Score Matching (PLUS-InVEST-PSM) model to evaluate the effectiveness of different land use development strategies in the Greater Bay Area of China as a case study. Specifically, this study analyzed the historical land use changes from 2000 to 2020 and mapped the multi-scenario patterns of land use and carbon storage with the PLUS and the InVEST models from 2030 to 2050. Then, this study employed the PSM model, along with a series of criteria (i.e., similar ecological backgrounds and parallel historical trends), to evaluate the effectiveness of the ecological development strategy and ecological protection redlines on carbon storage compared with the natural development strategy. The results indicate that the ecological development strategy and the ecological protection redline can prevent the decline in carbon storage. However, in the ecological development strategy, implementing the ecological redline policy may hinder the growth of carbon storage within the ecological redline area. Compared with the PLUS-InVEST-PSM model, the comparison between the subregions could underestimate the efficiencies of evaluation, partly due to underestimating the negative impact of urban development on carbon storage. These findings will help governments develop comprehensive and systematic land use policies to achieve carbon peaking and carbon neutrality goals. Also, the approach would help to further explore the broader impacts of land use development strategies on the overall regional ecological environment, such as biodiversity and ecosystem services.

1. Introduction

Terrestrial ecosystems exhibit a vital role in maintaining the global carbon cycle and balance equilibrium [1,2,3]. While many natural environmental factors and anthropogenic activities affect the carbon storage capacity of terrestrial ecosystems [2,4,5], land use and land cover (LULC) changes have a particularly significant impact on the carbon storage capacity of terrestrial ecosystems [6,7]. The Intergovernmental Panel on Climate Change (IPCC) reported that LULC changes result in carbon being released into the atmosphere at a rate of 1.5 Pg/a [8]. With the globally rapid urban expansion, many newly developed urban areas in several Asian countries are emerging on cropland and ecological land [9]. The conversion of significant amounts of ecological land, such as water and forest, into urban has seriously affected the carbon storage capacity of terrestrial ecosystems and has also led to increasing conflicts between urban development and ecological protection [10,11]. Therefore, analyzing the impact of LULC changes on carbon storage is crucial to realizing sustainable land management and achieving net-zero carbon emissions. A rich body of literature has discussed the impact of LULC changes on carbon storage. Many studies focused on protected areas (e.g., the ecological protection redline) to mitigate the negative impacts of LULC changes on carbon storage. For instance, Gizachew et al. [12] evaluated the impact of protected areas on the prevalence of local leakage in terms of forest carbon in Uganda. In recent years, some scholars have begun to pay attention to the impact of future land use changes on carbon storage. Most of them applied land use simulations to assess the effects of different land use scenarios on carbon storage, referred to as the land use development strategy in this study. For instance, Liu et al. [13], L. Yang et al. [14], and Gong et al. [15] simulated the distribution characteristics of regional land use and carbon storage under different development priorities, such as ecological priority and economic priority. In terms of land use simulation, the PLUS model can integrate the impacts of natural and human activities to explore the interaction between policies and land use patterns at the pixel-neighborhood-patch level. Compared with CA-Markov, FLUS, and other models used in existing studies, the PLUS model can better support policy planning and has been widely used [16,17]. The InVEST model, which enables the quantitative assessment of changes in carbon stocks due to land-use change using land-use data as well as relevant economic and biophysical data, has been widely used. For example, Zhang et al. [18] and Hwang et al. [19] used the InVEST model to quantitatively analyze the regional changes in carbon storage. Nonetheless, current studies have mainly focused on the setting of different land use development strategies and the calculation of carbon storages, without sufficiently examining the context of comparison and the effectiveness of the assessment. Different land use development strategies are not merely variations in methods and regulations; they indeed represent a tradeoff between economic development and ecological protection. Implementing an ecological development strategy would reduce the space required for economic development, and also establishing protected areas would incur additional management costs [20,21]. Therefore, in the context of varying socio-economic development and limited budgets for ecological conservation, evaluating the effectiveness of different land use development strategies is as important as establishing those strategies [20]. While many researchers attempted to directly compare the average changes of carbon storage across subregions under different scenarios [19,22,23,24,25], different regions are influenced by various drivers of land use change and exhibit differentiated trends. Taking forest degradation as an example, protected areas are often established in ecologically sensitive regions or areas with limited development potential (e.g., steep terrain with low agricultural suitability) [26,27,28], which are less susceptible to disturbances from human activities (i.e., logging), compared to non-protected areas. Therefore, the comparison between the subregions overlooks the differences in ecological backgrounds and historical trends among regions/subregions that would lead to biased evaluations for different land use development strategies. Recently, some other studies attempted to use the Propensity Score Matching (PSM) model to eliminate the selection deviation. The PSM model is widely used in fields such as medicine [29], social sciences [30], economics [31], and geographical sciences [32]. Different from the comparison between the subregions, the PSM model could control for the non-random selection of samples/regions by using a series of control variables to keep the same trend and characteristics of the treated group and the control group, without losing a large number of observations. Ribas et al. [21] demonstrated that the PSM model could offer more accurate estimations of the avoided deforestation due to the establishment of protected areas. Shi et al. [33] found that the carbon sequestration capacity of protection areas could be underestimated in the absence of the PSM model. However, there is still limited discussion on the differences in effectiveness between land use development strategies and protected areas.
As one of China’s most open and vibrant regions, the Greater Bay Area (GBA) faces the dual challenges of rapid urbanization and ecological protection. In the last two decades, the urbanization process of the GBA has accelerated significantly, and the population has increased rapidly. The population concentration in China’s major city clusters has increased from 2010 to 2020, with the population of the GBA City Cluster growing by 35% (the National Bureau of Statistics of China https://www.stats.gov.cn/, accessed on 20 August 2024), and it is expected that the population could reach 140 million by 2050 (HKTDC Research https://research.hktdc.com/, accessed on 20 August 2024). To effectively address the conflict between human activities and ecological protection, the government also proposed the ecological protection redline [34,35,36] to provide mandatory and strict protection for areas with particularly important ecological functions within the ecological space. Therefore, the GBA can be regarded as the typical case study reflecting the impacts of land use development strategies on carbon storage, especially in the context of carbon neutrality and peak carbon goals.
To fill the gaps of the previous investigations, this study promoted an innovation model by integrating the PLUS, the InVEST, and the PSM models to evaluate the effectiveness of the land use development strategies and the ecological protection redline. Firstly, we employed the PLUS and the InVEST models to simulate land use changes and carbon storage changes from 2030 to 2050 under different scenarios. Secondly, we utilized the PSM model, along with a series of criteria, to evaluate the effectiveness of land use development strategies and ecological protection redline on carbon storage in the general ecological area, the ecological redline area, and the general control area.

2. Materials and Methods
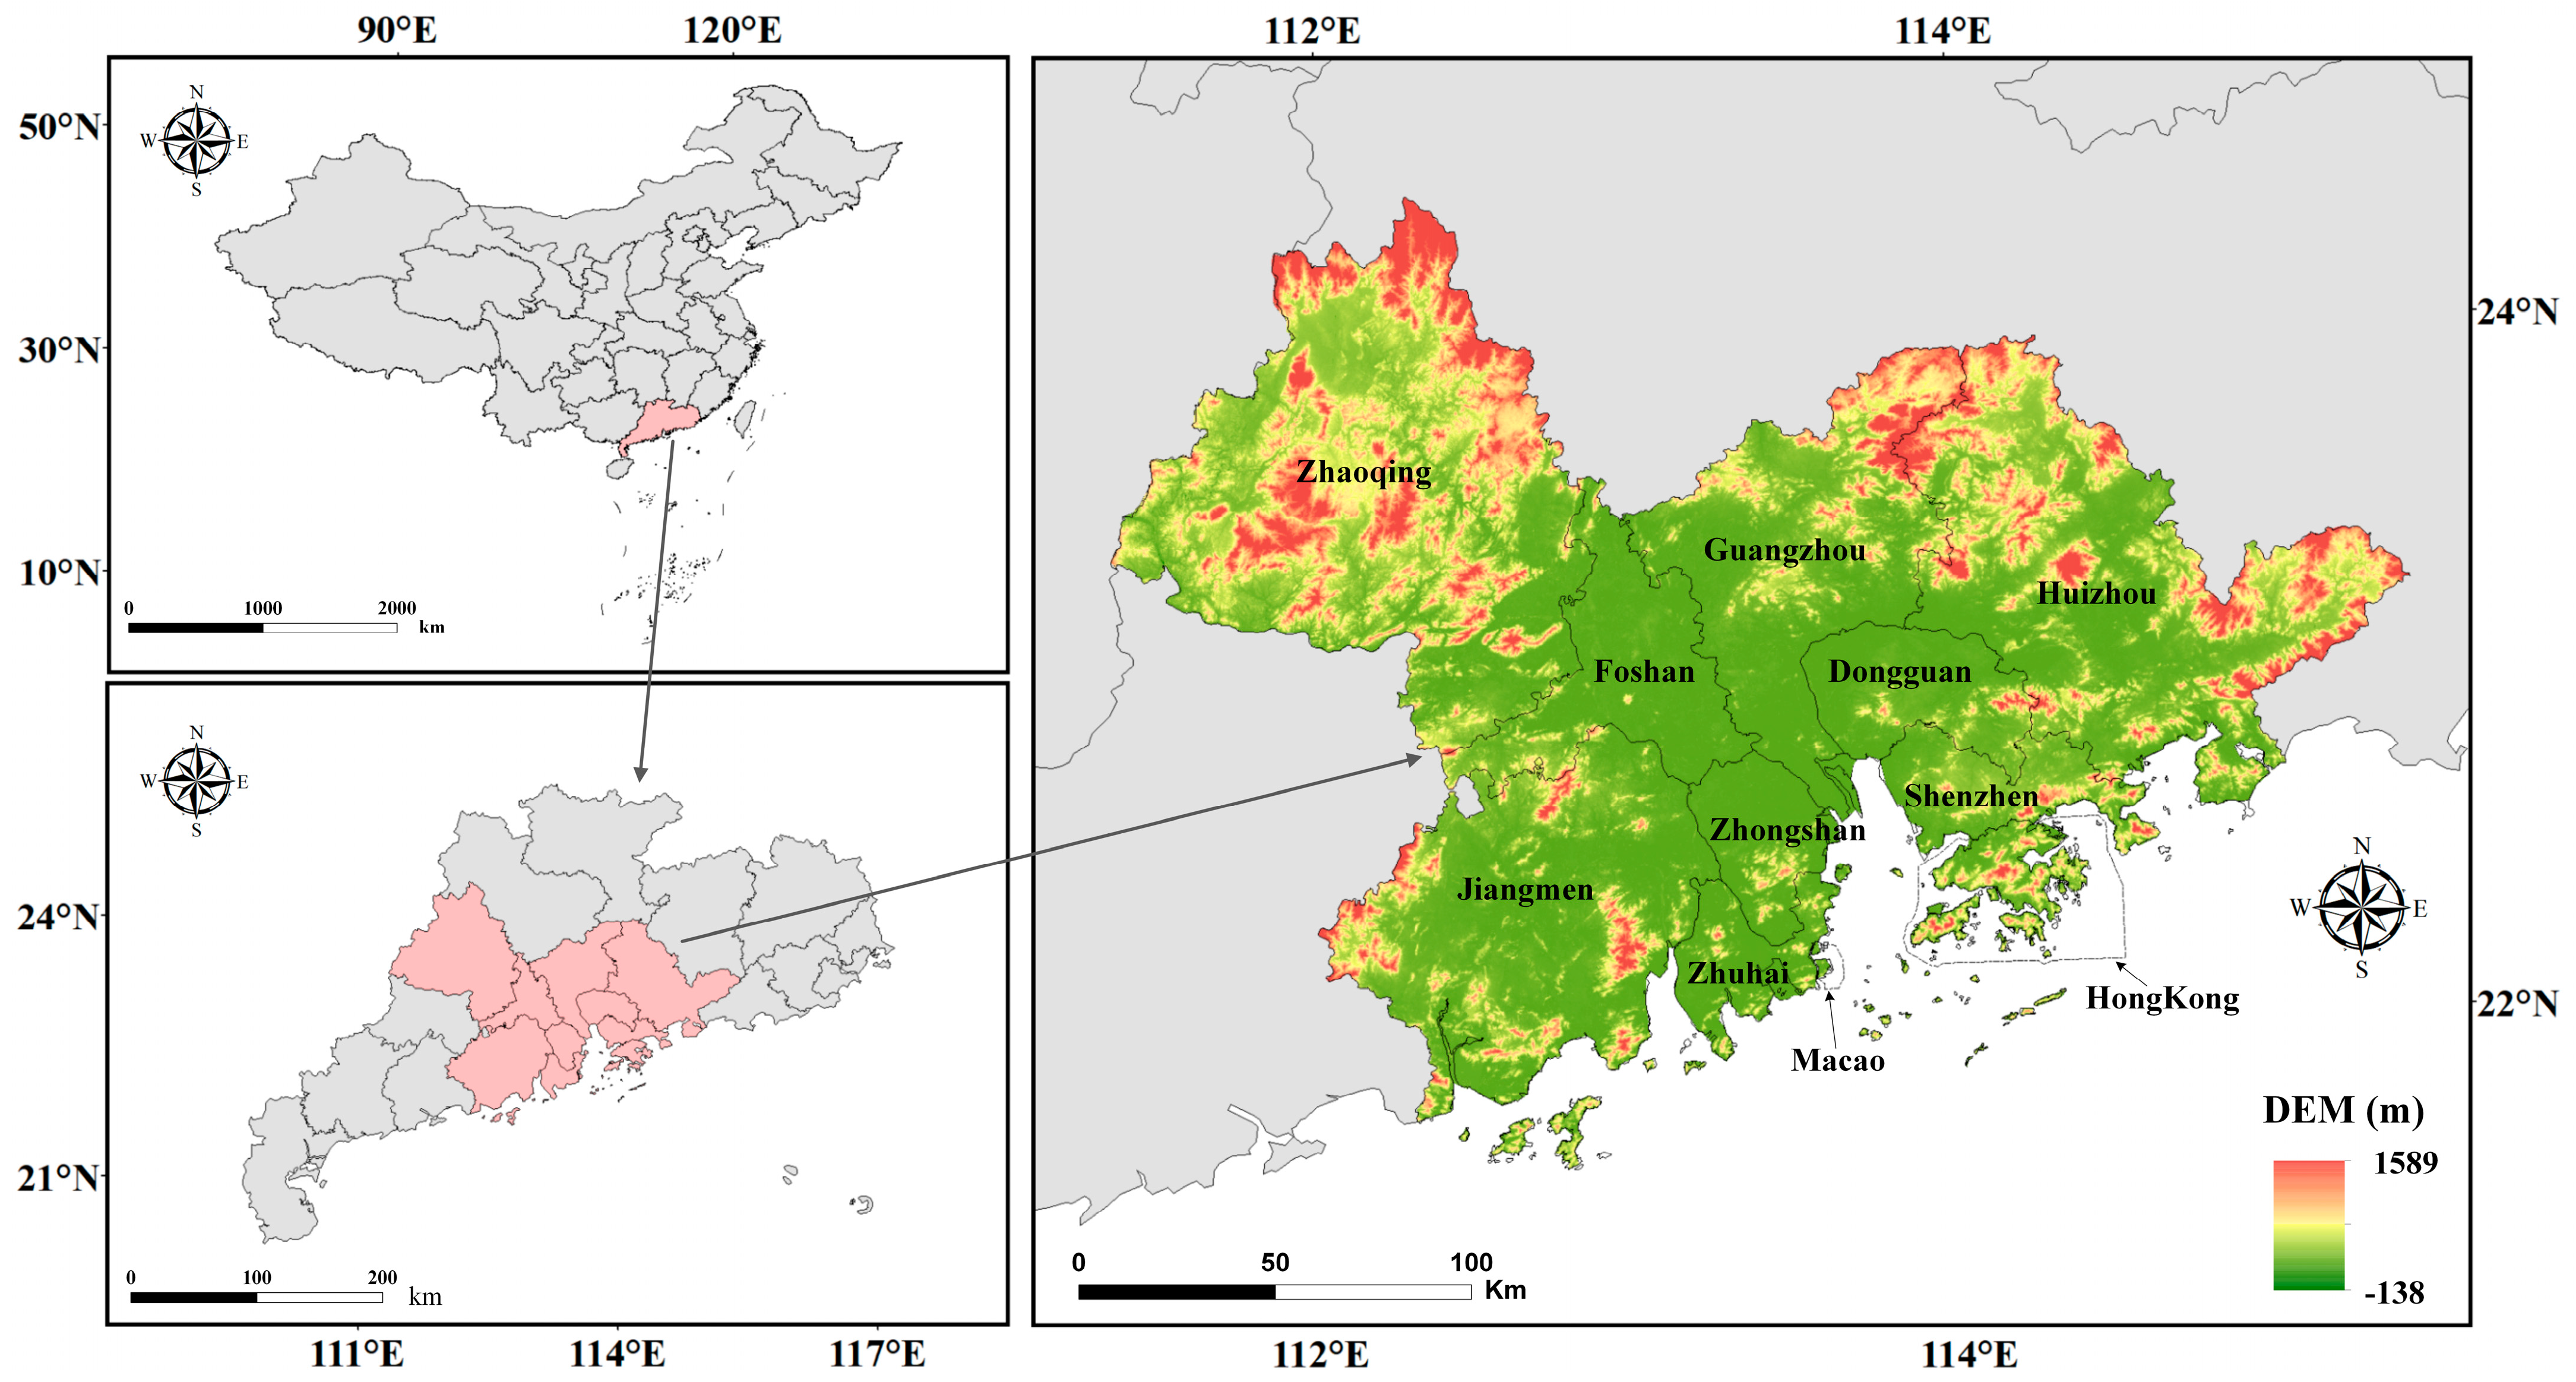
This study assessed the impacts of land use development strategies and the ecological protection redline on carbon storage in the GBA using a multi-model coupling approach integrating the PLUS, the InVEST, and the PSM models. First, this study utilized the PLUS model to simulate the multi-scenario land use patterns from 2030 to 2050 by inputting historical land use data and the socio-economic driving factors. Second, this study employed the InVEST model to calculate the historical and the multi-scenario carbon storage by inputting the carbon density table and the land use data. Finally, this study combined the PSM model to analyze the impacts of different land use development strategies and the ecological protection redline on carbon storage with two criteria (i.e., similar ecological context and parallel historical trend). The detailed process is shown in Figure 1.

2.1. Study Area

The Guangdong-Hong Kong-Macao Greater Bay Area is situated in the south of Guangdong Province (111.5° E–115.5° E, 21.5° N–25° N), bordering the South China Sea (Figure 2). It spans a total area of 55,900 square kilometers, incorporating nine prefecture-level cities—Guangzhou, Shenzhen, Zhuhai, Foshan, Huizhou, Dongguan, Zhongshan, Jiangmen, and Zhaoqing—along with the two Special Administrative Regions of Hong Kong and Macao. The GBA experiences a subtropical monsoon climate, characterized by high temperatures and abundant rainfall year-round. According to the data of the Seventh Population Census of China, the degree of population concentration in the Guangdong-Hong Kong-Macao Greater Bay Area has been increasing, with three cities, namely Guangzhou, Shenzhen, and Dongguan, having a population of more than 10 million. The resident populations of Foshan, Huizhou, and Jiangmen are 9,498,700, 6,042,900, and 4,798,100, respectively. Zhuhai has a smaller population but a high population growth rate, ranking second in the region. The imbalance of economic development in the Greater Bay Area is prominent, showing a pattern of “strong in the east and weak in the west”. HKTDC Research (https://research.hktdc.com/, accessed on 1 November 2024) shows that the GDP of Hong Kong, Shenzhen, and Guangzhou in 2023 is much more than the GDP of Zhuhai, Jiangmen, and Zhaoqing.
The GBA is divided into three areas: the ecological redline area, the general ecological area, and the general control area in accordance with the “Guangdong Province Ecological and Environmental Zoning and Control Plan for the three lines and one list”. The ecological redline area refers to areas with critical ecological functions that must be strictly protected within the scope of ecological space. Any development activities inconsistent with the primary functions are strictly forbidden, and alterations to the land’s nature are not allowed in the ecological redline area. The general ecological area encompasses areas beyond the ecological redline zone that possess significant ecological functions and relatively sensitive environments; development activities are strictly controlled in these regions. The general control area refers to areas beyond both the ecological redline area and the general ecological area, including the core urban development areas.

2.2. Data Source

Historical land use data were obtained from China’s multi-period land use and land cover remote sensing monitoring dataset, which was made available by the Resource and Environment Data Cloud Platform [37]. This dataset represents a national-scale, multi-period LULC database of China with a 30 m spatial resolution. In accordance with the study’s requirements, the original 25 second-level land use classifications are reclassified and consolidated into six primary categories: cropland, forest, grassland, water, urban, and other. The data and input parameters selected in this study include natural data (precipitation, temperature, soil type, DEM, slope, aspect) and socio-economic data (GDP, population, road network, distance to railway, distance to buildings, and distance to water). This study resampled all the data using ArcGIS10.7 to ensure a 30 m resolution and consistent row and column sizes (Table 1).
The carbon density data used in this study were derived by applying the relevant conversion coefficients for above-ground and below-ground carbon densities from the global ecological zoning vector data provided by the Food and Agriculture Organization (FAO). This process enabled the calculation of above-ground carbon, below-ground carbon, and soil organic carbon density for different land use types. In addition, this study incorporated Köppen climate zones to determine the carbon storage of various land use types under different climatic conditions [38,39].

2.3. Scenario-Based Carbon Storage Simulation

2.3.1. PLUS Model

The PLUS model is a raster-based cellular automaton (CA) model developed to simulate land use changes at the patch level. This model combines a rule-mining approach derived from land expansion analysis with a CA model that utilizes a multi-type random seed mechanism. It identifies the drivers of land expansion and forecasts patch-scale land use evolution. The PLUS model comprises two key modules: the Land Expansion Analysis Strategy (LEAS) and the CA model utilizing multi-type random patch seeds (CARS) [40].
The LEAS module identifies the expansion areas of different land use types between two historical periods. It selects samples from the expanded areas and applies the Random Forest Classification algorithm to determine the driving factors behind the expansion of each land use type, thus calculating the development probability for each type of land use [41,42].
The CARS module integrates multivariable random seed generation with a threshold reduction mechanism. It simulates land use patterns identified by the LEAS module, incorporating constraints from neighborhood weights and transition matrices. Neighborhood weights reflect the ease of land use conversion and are calculated as follows:
Ω i , k t = c o n ( c i t 1 = k ) n × n 1 × W k
where W k is the weight parameter for cell n × n , and c o n ( c i t 1 = k ) is the total number of grid cells occupied by land use type at the end of the iteration. The instantaneous neighborhood weight for land use type at spatial unit i is denoted as Ω i , k t . The weight range is [0, 1], with higher values indicating greater expansion capacity.
The transition matrix indicates whether conversion between different land types is possible (1) or restricted (0), calculated as follows:
P i , k d = 1 > τ , T M k , c = 1 , c h a n g e P i , k d = 1 τ , T M k , c = 0 ,   N o   c h a n g e ( τ = δ l × R 1 )
where P i , k d = 1 is the suitability probability of land type k at spatial unit i . T M k , c represents elements of the transition matrix. The variable δ varies between 0 and 1 and is the decay coefficient of the threshold τ . The variable R 1 follows a normal distribution with a mean of 1.

2.3.2. InVEST Model

The carbon storage and sequestration module of the InVEST model categorizes ecosystem carbon storage into four primary pools: aboveground biomass carbon (carbon stored in all living vegetation above the soil), belowground biomass carbon (carbon in the root systems of living plants), soil organic carbon (carbon in both mineral and organic soils), and dead organic carbon (carbon in dead wood and litter such as fallen leaves) [43]. This study employs the ecosystem carbon storage module of the InVEST model to assess carbon storage in the GBA. The formula used to calculate carbon storage is as follows:
C i = C i , a b o v e + C i , b e l o w + C i , s o i l + C i , d e a d
C t o t a l = 1 n C i × S i
where C t o t a l represents the total carbon storage of the ecosystem; C i denotes the carbon density of land use type i ; C i , a b o v e , C i , b e l o w , C i , d e a d , and C i , s o i l represent the aboveground biomass carbon density, belowground biomass carbon density, dead organic matter carbon density, and soil organic carbon density for land use type i , respectively; S i represents the area of land use type i ; and n represents the number of land use types.

2.3.3. Land Use Simulation Scenarios

Four scenarios were established in this study: the natural development (ND) scenario, the ecological development (ED) scenario, the natural development with ecological protection redline (ND-EPR) scenario, and the ecological development with ecological protection redline (ED-EPR) scenario.
The ND scenario disregards the influence of policies on land use changes and does not modify the rates of change or conversion rules among different land use types. That is to say, the projected land use from 2030 to 2050 is based on the historical probability of land use transfer.
In the ED scenario, urban expansion and human development activities’ impacts on the ecological environment are strictly regulated according to the principles of Green Development and Ecological Protection specified in the GBA Development Plan. In this scenario, transfer rules and development are restricted, reducing the probability of converting forest, grassland, and water to urban. Additionally, the probability of converting cropland to forest is increased.
The ND-EPR scenario only considers the restrictive impact of the ecological redline policy on future land use changes. According to the delineation results of the ecological protection redline in the GBA, the areas within the ecological protection redline are regarded as restricted development areas. These areas mainly include nature reserves, some scenic spots, key ecological functional areas, soil and water erosion-sensitive areas, and drinking water source protection areas. These data are input into the model as a constraint under the natural development scenario to obtain the projected land use under this scenario.
The ED-EPR scenario considers the impact of the ecological redline policy and other ecological protection policies on land use changes, ensuring that land use types basically remain unchanged in the ecological redline area. In the ecological development scenario, the ecological redline area is input into the model as a constraint to obtain the land use under this scenario. Compared to the ED scenarios, this study assumed that the ED-EPR scenario would have a higher level of protection.

2.4. Effectiveness Evaluation with the PSM Mode

To assess the effectiveness of different land use development strategies, this study employed the PSM model to pair the sampling points in three regions, namely the general control area, the general ecological area, and the ecological redline area, and then compare the average carbon storage of the matched sampling points. The PSM model calculates the propensity score based on the multi-dimensional characteristics and matches the samples according to the similarity propensity score between the treated group and the control group [44]. Propensity scores are calculated for each sample in both the treatment and control groups based on observed characteristics (Equation (5)) [33,45]. By matching samples with similar characteristics across different groups, the influence of other confounding factors is minimized.
P X i = P r ( D i = 1 | X i )
here, P represents the propensity score for samples. P r ( · ) indicates the probability that a sample i receives the treatment given their characteristics or covariates   X i . When a sample belongs to the treated group, D i = 1 ; otherwise, D i = 0 . In this study, X i represents the covariates, which include urban development and ecological environment factors (Table 1). The Matchit package in the R environment was used to match sampling points from different regions [21,46]. One-to-one nearest neighbor covariate matching was chosen, with a caliper of 0.1 standard deviations as the minimum matching criterion. Due to the large number of samples at a 30 m resolution, sampling points in this study were set at 1 km intervals.
For the three regions, this study conducts pairwise comparative analysis and sets two comparison criteria: (1) matched samples must have similar urban development and ecological environment characteristics, determined by the distribution of propensity scores before and after matching; (2) matched samples should exhibit parallel trends without intervention. Parallel trends are fundamental to counterfactual evaluation, assuming that in the absence of changes, the control group and the treated group would have similar development trends [32,47,48]. This study focuses on comparing the trends of average carbon storage from 2000 to 2020.

3. Results

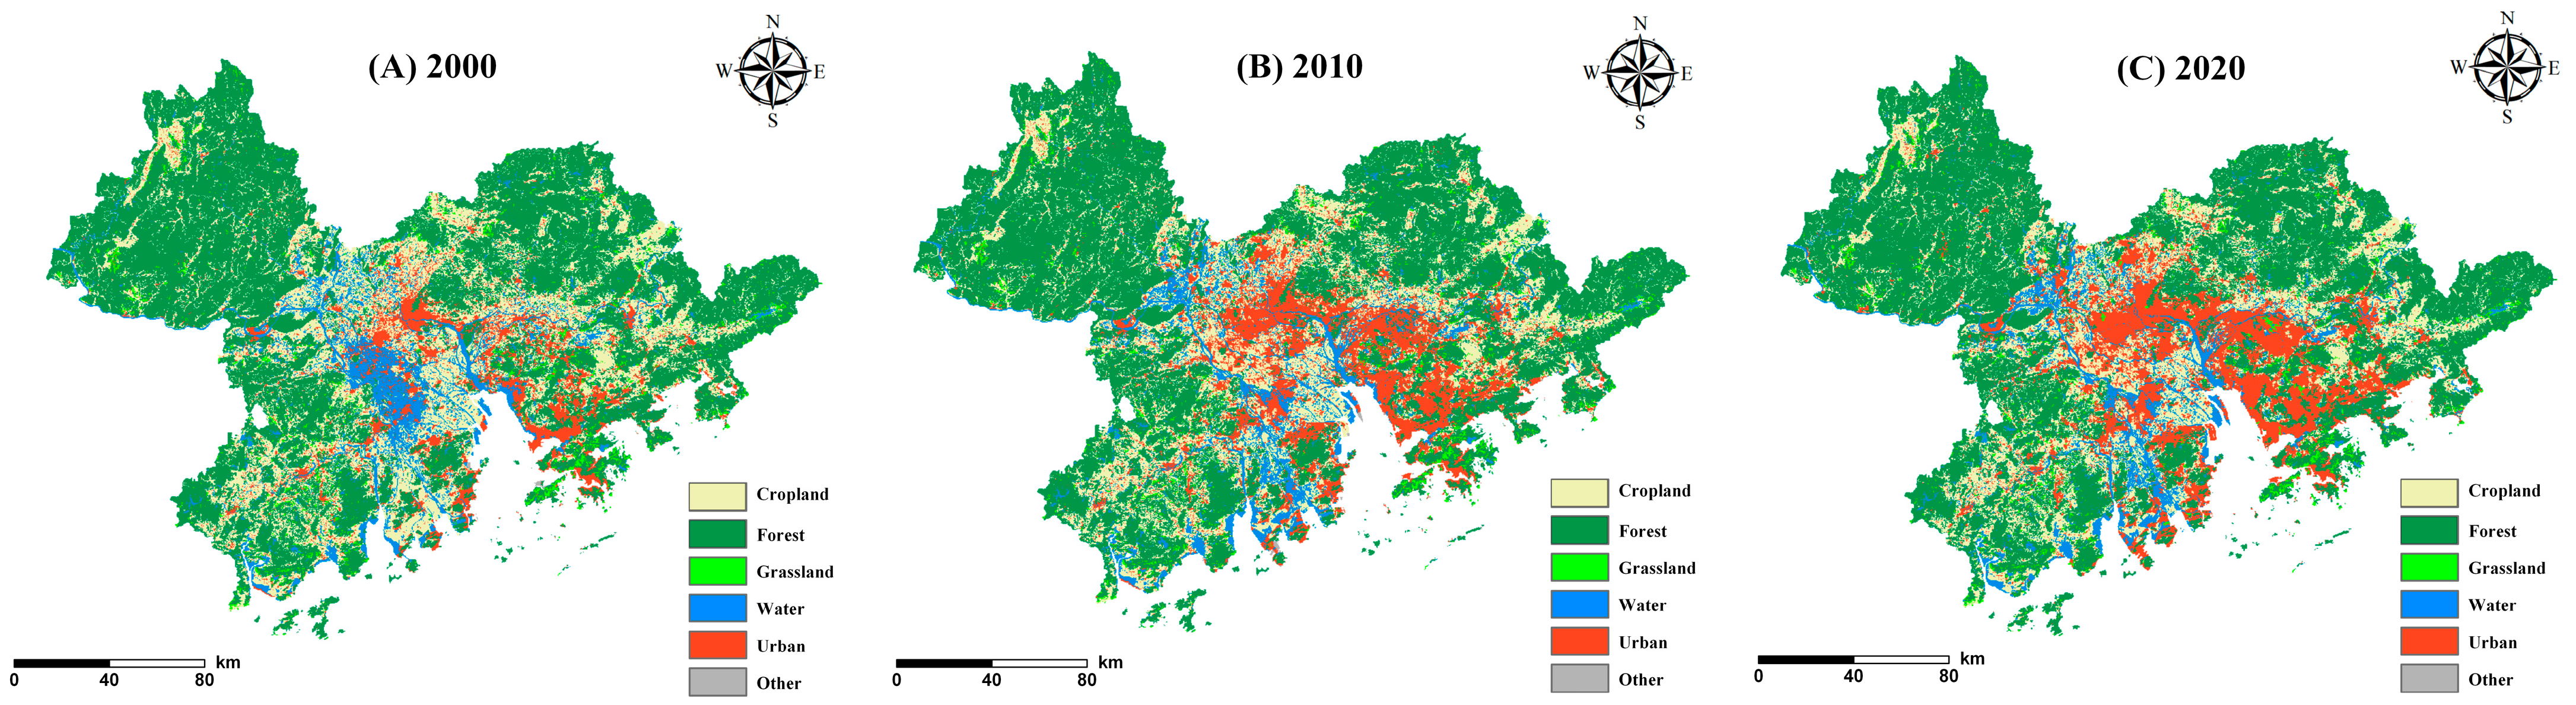
3.1. Multi-Scenario Simulation of LULC

The analysis of historical land use in the GBA shows that the forest cover in 2000, 2010, and 2020 was 55.51%, 54.33%, and 53.64%, respectively, reflecting a downward trend. The forest is primarily distributed in the hilly regions of the east, north, and west (Figure 3). In recent years, rapid economic development and significant population movement have accelerated urbanization in the GBA. Consequently, the proportion of urban has been increasing rapidly, with its proportion rising from 8.09% in 2000 to 15.07% in 2020.
In the ND scenario, urban expansion encroaches significantly on forests and farmland from 2020 to 2050. Forest cover decreases to 50.60%, while urban areas continue to expand, reaching 25.34% of the total area by 2050 (Figure 4A). Meanwhile, the trend of declining forested areas has slowed down in the ND-EPR scenario (Figure 4B). In both the ED and ED-EPR scenarios, the main objectives are to enhance regional carbon storage and improve the ecological environment, thus limiting the conversion of forests to urban or cropland areas. Statistical analysis reveals that land use changes in these scenarios are mainly focused on reforestation. In the ED scenario, forest cover reaches 58.02%, while in the ED-EPR scenario, forest cover increases to 57.96% compared to 2020 (Figure 4C,D). Additionally, among the four scenarios in 2050, the ED scenario has the largest forest area, whereas the ND scenario has the largest urban area and the smallest forest area.

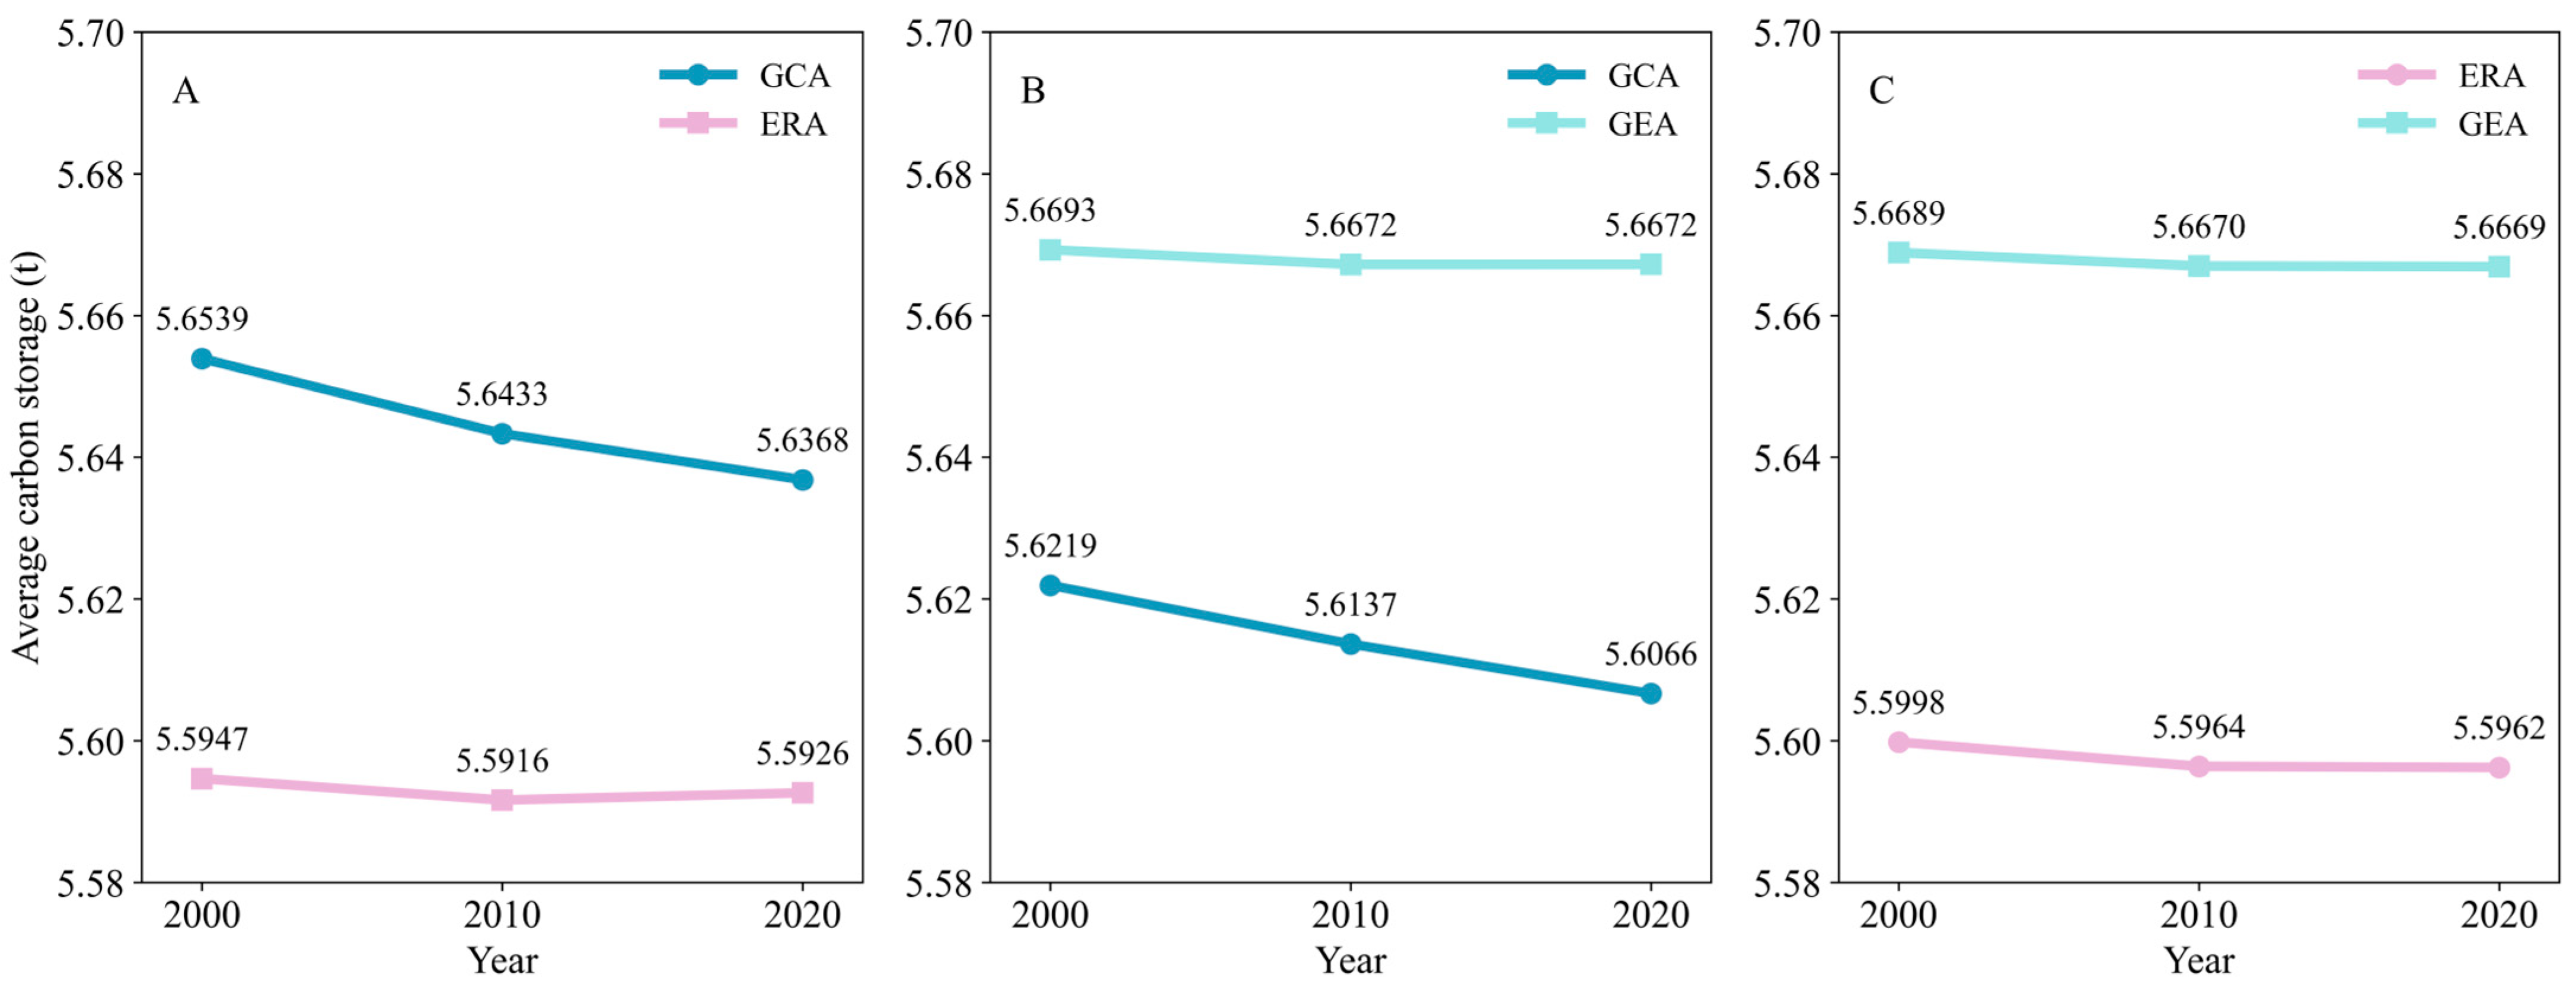
3.2. Dynamic of Carbon Storage Under Multiple Scenarios

The carbon storage in the GBA was 328.56 Tg in 2000, 327.86 Tg in 2010, and 327.51 Tg in 2020, and the carbon storage in the GBA shows a spatial pattern of “high carbon storage in the surrounding mountains and low carbon storage in the central plains”. The surrounding mountains, with forests and other carbon sinks, are the core carbon storage area of the GBA and show significant carbon storage capacity (Figure 5A–C). In contrast, the central part of the GBA has a lower carbon storage capacity, which is largely attributed to intensive economic activities and urbanization. In addition, from 2000 to 2020, the total carbon storage in the GBA decreases year by year, with a cumulative loss of 1.05 Tg, which is mainly concentrated in the central region (Figure 5D). The statistics show that carbon stocks decreased by 0.21% from 2000 to 2010 and by 0.11% from 2010 to 2020.
The projected carbon storage in the GBA for 2050 is 323.83 Tg and 323.96 Tg in the ND and ND-EPR scenarios, respectively, indicating reductions of 1.12% and 1.08%. It indicates a decrease in total carbon storage and a decline in carbon storage capacity compared with 2020. Notably, the central region’s carbon storage rapidly decreases, significantly showing a large-scale reduction trend from the center outward in both scenarios (Figure 6A,B). Similarly, the total carbon storage in the GBA for 2050 was calculated under ED and ED-EPR scenarios and found to be 328.84 Tg and 328.75 Tg, respectively. Compared with 2020, the total carbon storage in these two scenarios has increased, with a decreasing trend in areas of carbon storage loss. The increase in carbon storage is primarily concentrated in the surrounding mountainous areas, while changes in the central region’s carbon storage are not significant (Figure 6C,D). Of the four scenarios projected for 2050, the ED scenario records the highest carbon storage, whereas the ND scenario reports the lowest.

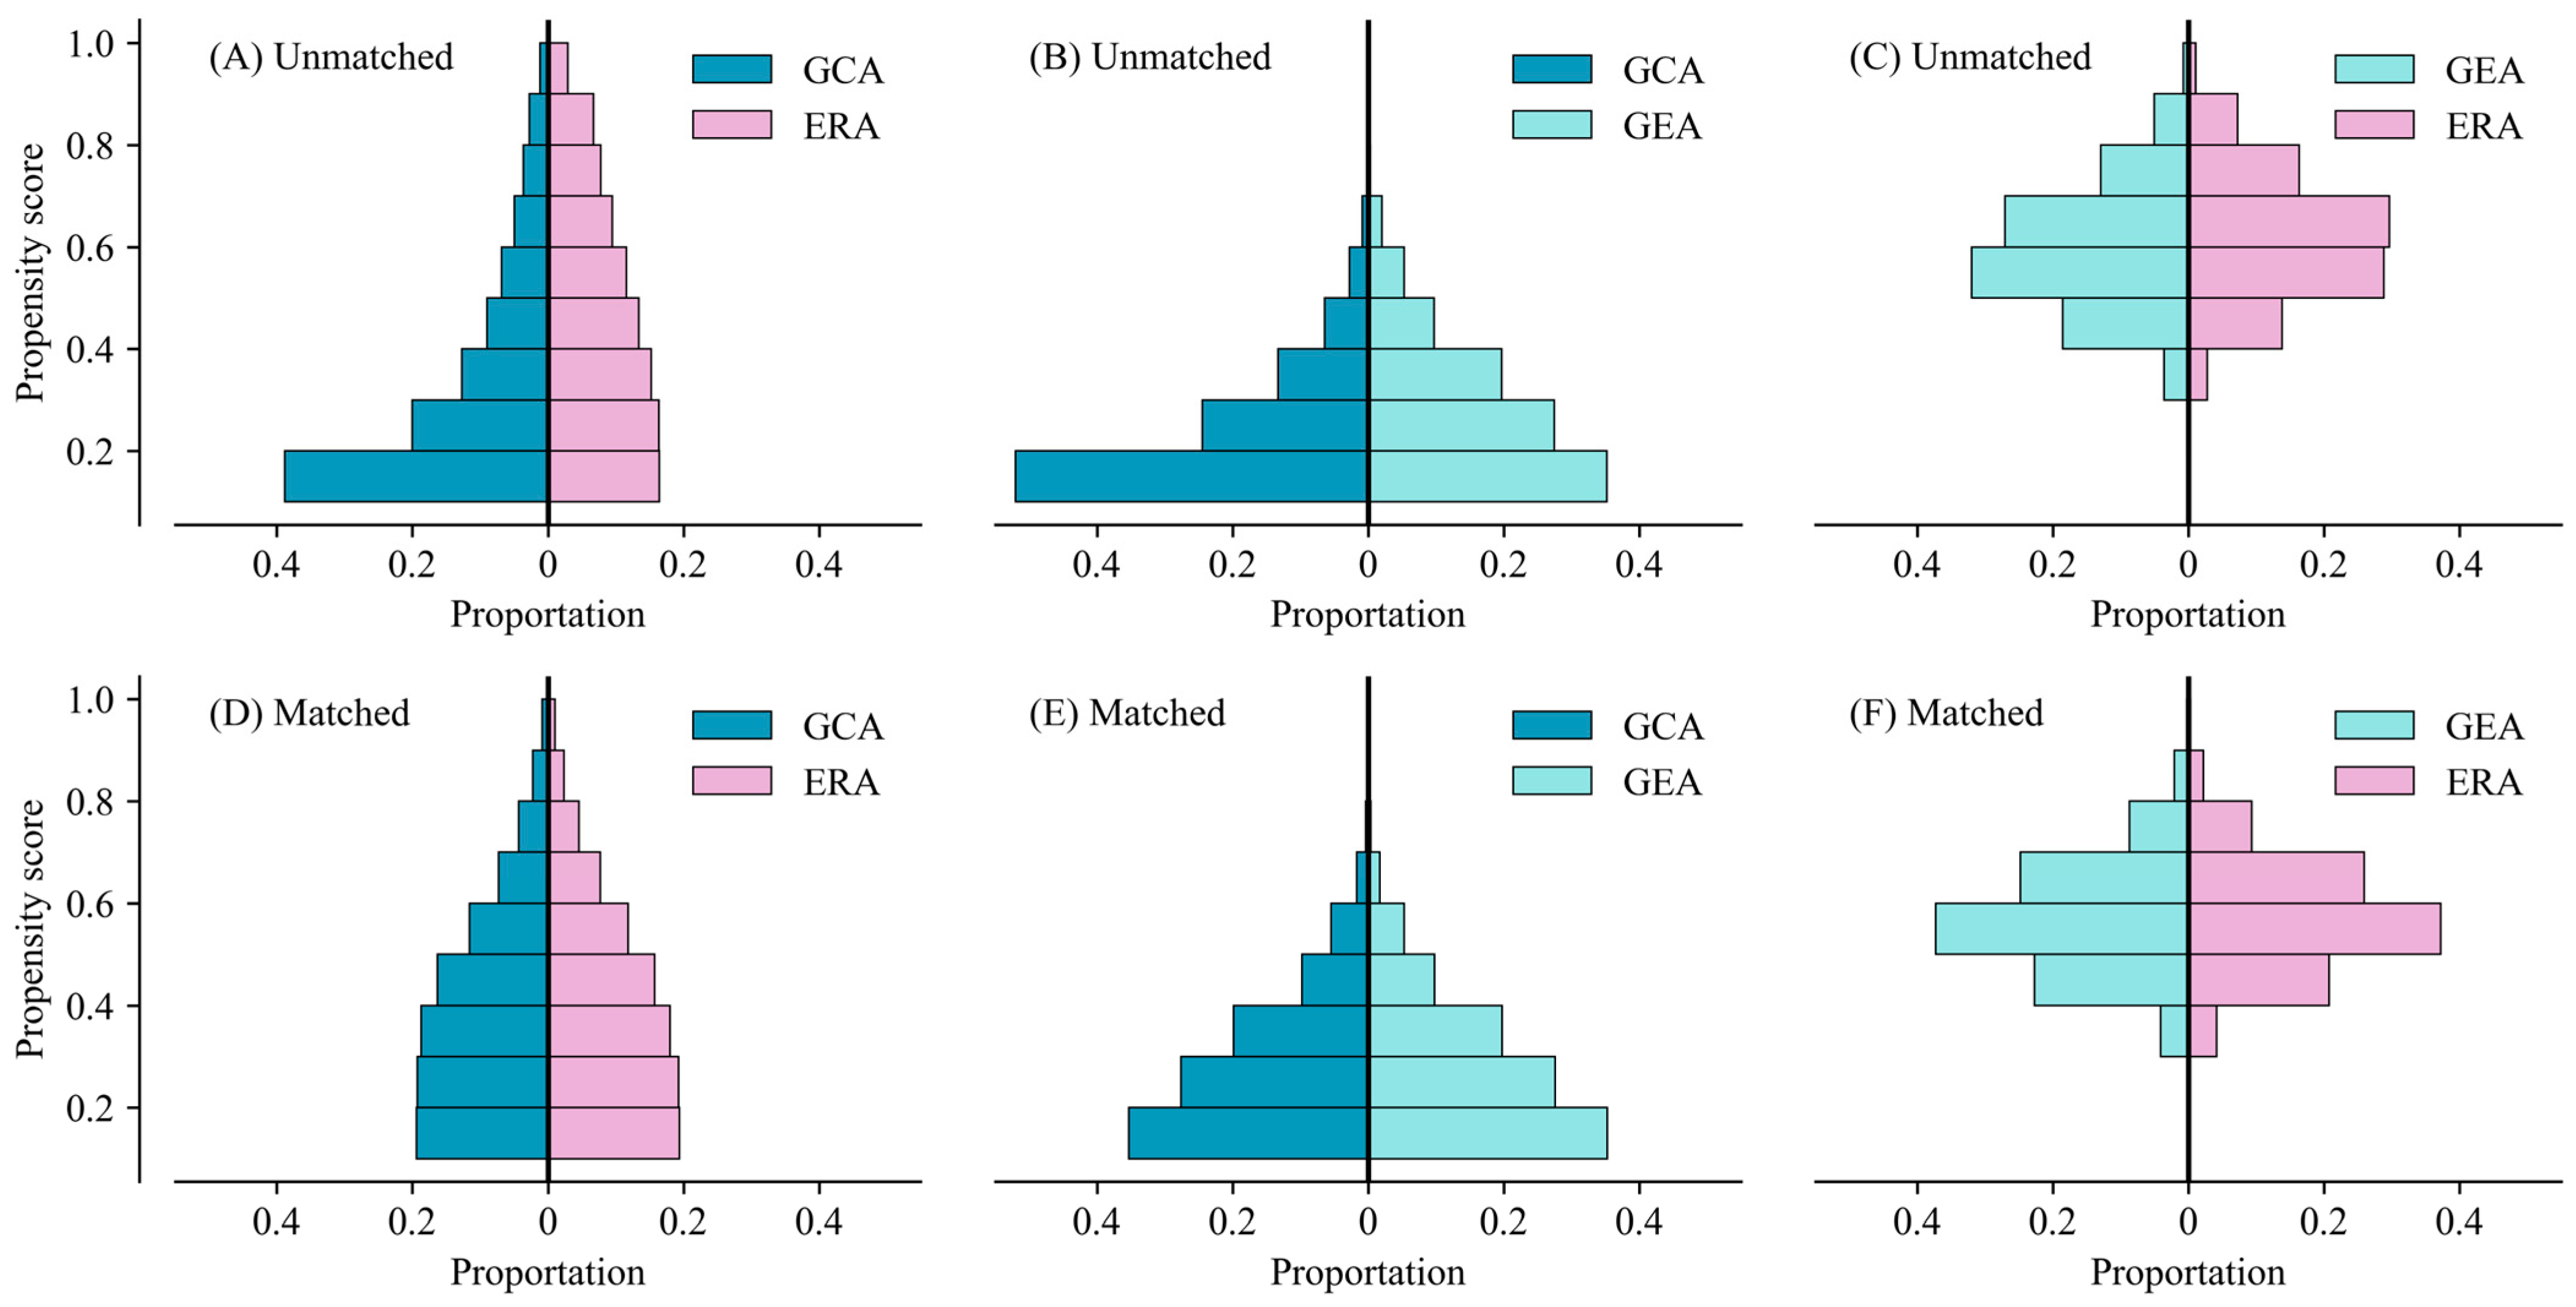
3.3. Matching Results of the PSM Model

The matched samples from various regions exhibit comparable urban development and ecological features, fulfilling the first comparison criterion mentioned earlier in accordance with the results of the PSM model (Figure 7). In contrast, Figure 8 reveals substantial differences concerning the second comparison criterion (the parallel trends). The average carbon storage in the general control area exhibits a declining trend (Figure 8A,B), primarily attributed to the adverse effects of urban development. Consequently, this study concentrated on comparing the general ecological area with the ecological redline area (Figure 8C).

3.4. Effectiveness of Ecological Development Strategy and Ecological Protection Redline

The ecological protection redline effectively mitigates carbon loss within the ecological redline area while having a smaller impact on the general ecological area. As shown in Figure 9A, under the ND scenario, both the general ecological area and the ecological redline area exhibit a similar trend from 2020 to 2050, with the average carbon storage declining by 0.49% and 0.83%, respectively. In the ND-EPR scenario, the average carbon storage in the general ecological area decreases by 0.46%, whereas in the ecological redline area, it declines by just 0.01%. This indicates that the ecological protection redline significantly curtails the reduction in the average carbon storage within the ecological redline area (by 0.82%) and may generate a spillover effect in the general ecological area (0.03%).
The comparison between the subregions would underestimate the effect of the ecological protection redline compared with the PSM model (Figure 9B). In the ND scenario, the average carbon storage in the general ecological area and the ecological redline area decreases by 0.40% and 0.66%, respectively, from 2020 to 2050. However, in the ND-EPR scenario, the average carbon storage in the general ecological area and the ecological redline area declines by 0.43% and 0.00%, respectively. This demonstrates that the ecological protection redline effectively prevented a 0.66% reduction in the ecological redline area, with similar effects observed in the general ecological area, as indicated by the PSM models.
Changes in the ecological development strategy could also drive carbon storage growth. As illustrated in Figure 9C, under the ED scenario, the average carbon storage in the general ecological area and the ecological redline area rises by 0.55% and 0.60%, respectively, from 2020 to 2050. Compared to the ND scenario, the average carbon storage in the general ecological area increases by 1.04% (0.55% + 0.49%), and by 1.43% (0.60% + 0.83%) in the ecological redline area. While the comparison between the subregions aligns with the PSM model, they substantially underestimate the carbon storage growth in the ecological redline area (Figure 9D). Compared to the ND scenario, the average carbon storage rises by 0.96% (0.56% + 0.40%) in the general ecological area and by 1.11% (0.45% + 0.66%) in the ecological redline area.
The carbon storage of the general ecological area and the ecological redline area shows an increasing trend from 2020 to 2050 with the combined influence of the ecological protection redline and the ecological development strategy. In the ED-EPR scenario, the average carbon storage of the general ecological area and the ecological redline area increases by 0.64% and 0.01%, respectively (Figure 9E). Compared with the ND scenario, the average carbon storage increases by 1.13% (0.64% + 0.49%) in the general ecological area and 0.84% (0.01% + 0.83%) in the ecological redline area. The assessments of the comparison between the subregions are lower than those in the PSM model. Compared with the ND scenario, the average carbon storage increases by 1.02% in the general ecological area and by 0.66% in the ecological redline area (Figure 9F).

4. Discussion

4.1. Comparison of the Impacts of Ecological Development Strategy and Ecological Protection Redline on Carbon Storage

The choice of land development strategy has crucial implications for regional carbon storage. This study investigated the differences in the impacts of the ecological development strategy and the ecological protection redline on carbon storage in the general ecological area and the ecological redline area. The former applies the land use development strategy for the entire region, while the latter is similar to the protected areas.
Compared with the ecological development strategy, most countries are inclined to protected areas or the ecological protection redline. It is estimated that 16% to 29% of the global land will be protected by 2030 [49]. Campbell et al. [50] pointed out that protected areas are critical for reducing greenhouse gas emissions from land use changes. Melillo et al. [51] also estimated that protected areas currently sequester 0.6 Pg/a, which is about one-fifth of the carbon sequestered annually by all terrestrial ecosystems. Nevertheless, there is still controversy within the academic community. Some studies have argued that increasing the carbon storage capacity of protected areas should focus on improving forest management capacity rather than expanding the extent of protected areas [19,52,53,54], and demonstrated that insufficient funding jeopardizes the ability of conservation areas to protect biodiversity. More importantly, a global assessment of protected areas also found significant regional differences, with areas of outstanding protection effectiveness often being those with higher risks [55]. Therefore, the ecological protection redline needs to rely on accurate ecological risk assessments.
Consistent with findings from prior research [18,56,57,58], this study found that both the ecological development strategy and the ecological protection redline can promote carbon storage in the ecological redline area. However, importantly, the results also indicate that in the ecological development strategy, implementing the ecological redline policy may hinder the growth of carbon storage within the ecological redline area. The average carbon storage of the ecological redline area in the ED-EPR scenario increased by 0.69%, compared with 0.63% in the ED scenario. This highlights the importance of the balance between protected and non-protected areas, taking into account the objective reality and socio-economic development goals of the entire region. For the ecological development strategy, the effectiveness of the ecological protection redline may be reduced, whereas the management costs of maintaining ecological redline areas remain. Therefore, the overall management costs for the ecological protection of the region will potentially increase. Assessing the benefit−cost of protected areas from a life cycle perspective may benefit the sustainable development of the entire region [59,60].

4.2. The PSM Model vs. The Comparison Between the Subregions

Consistent with previous studies [21,33,61,62], the comparison between the subregions would reduce the effectiveness of the ecological development strategy and the ecological protection redline compared with the PSM model. Going a step further, the study focused on the potential impacts of future carbon storage. Based on the framework of counterfactual assessment, this study selected matched samples through the PSM model and conducted parallel trend tests on carbon storage. This could eliminate the differences in urban development and ecological environment characteristics between the general ecological area and the ecological redline area and have the same development trend without intervention.
Interestingly, the evaluation results differ from existing results. Many studies have demonstrated that the comparison between the subregions could overestimate the impacts of protected areas due to the non-protected areas being more susceptible to anthropogenic disturbances [21]. However, the results are opposite in terms of the ecological protection redline and the ecological development strategy. On the one hand, the comparison between the subregions could underestimate the reduction in carbon storage in both the ND scenario and the ND-EPR scenario. On the other hand, in the ED scenario and the ED-EPR scenario, the comparison between the subregions could underestimate the growth in carbon storage in both the general ecological area and the ecological redline area. This discrepancy may stem from the higher likelihood of urban development in the matched samples. It indicates that compared to the ecological redline area, the general ecological area and the ecological redline area have higher populations and are closer to second- and third-level roads, which is statistically significant (Table A1). Therefore, the comparison between the subregions could underestimate the negative impact of urban development on carbon storage. Consequently, it is necessary to further explore more reliable methods and systematically analyze the interactions between human activities and protected/non-protected areas.

4.3. Policy Implications

Land use changes seriously jeopardize carbon storage in areas undergoing rapid urbanization. To address this challenge effectively, it is essential to develop a comprehensive and systematic LULC framework for regional sustainable development to achieve carbon peaking and carbon neutrality goals.
First, the results suggest that the government should effectively coordinate the ecological development strategy with the ecological protection redline. This requires, on the one hand, improving the accuracy of the ecological protection redline and including areas with high ecological functions [56], and on the other hand, establishing global development indicators, enhancing the cost−benefit assessment of the ecological protection redline, and improving these indicators and policies according to different stages of regional development.
Second, the government should also increase attention to the connectivity of the ecological redline area or protected areas [63]. For instance, in China, the construction of “necessary and unavoidable” linear infrastructure is still allowed within the ecological redline area, according to the “Management Measures for Ecological Protection Redlines (Draft for Comments)” [63]. However, linear infrastructure significantly impacts species migration. Therefore, there is still room for improvement in the management of the ecological redline area, and the gap between the effectiveness of the ecological protection redline and its expectations could be a key focus for future attention.
At last, to mitigate the impact of land use changes on carbon storage, it is essential to improve the efficiency of land use. Whether through the ecological development strategy or the ecological protection redline, the outcome will inevitably be a reduction in available urban and cropland land [58]. This underscores the need for establishing incentive mechanisms to boost economic benefits from urban development and enhance crop yields, thereby balancing socio-economic development with ecological and environmental protection.

5. Conclusions

This study employed a multi-model coupling approach—the PLUS-InVEST-PSM model—to assess the effectiveness of land use development strategies and ecological protection redlines on carbon storage in the GBA. The results demonstrated that from 2020 to 2050, the ecological development strategy could promote an increase in average carbon storage in the ecological redline area and the general ecological area by 1.43% and 1.04%, respectively, and the ecological protection redline can effectively prevent the average carbon storage in the ecological redline area and the general ecological area from declining by 0.82% and 0.03%, respectively. While both the ecological development strategy and the ecological protection redline can promote carbon storage in the ecological redline area and the general ecological area, the ecological protection redline under the ecological development strategy could impede the increase in carbon storage in the ecological redline area. Compared with the PSM model, the comparison between the subregions could underestimate the efficiencies of the ecological development strategy and the ecological protection redline on carbon storage, partly due to an underestimation of the negative impact of urban development on carbon storage.
There still are some limitations. First, the variables incorporated into the PSM model do not encompass all relevant factors, which could potentially undermine the accuracy of the assessment. Second, the effects of the ecological development strategy and the ecological protection redline extend beyond carbon storage alone. Future research could explore the broader impacts of land use development strategies in the shared socio-economic pathways on the overall regional ecological environment, such as biodiversity and ecosystem services.

Author Contributions

Conceptualization, Y.J. and H.Z.; methodology, H.Z., Y.L., and X.L.; formal analysis, Y.L.; data curation, Y.L.; writing—original draft preparation, Y.L. and H.Z.; writing—review and editing, Y.J. and H.S.; visualization, Y.L.; supervision, Y.J. All authors have read and agreed to the published version of the manuscript.

Funding

This work was supported by the National Natural Science Foundation of China (Grant No. 42101422 and 42001339), the Natural Science Foundation of Chongqing, China (Grant No. CSTB2022NSCQ-MSX1450), the Science and Technology Projects in Guangzhou (Grant No. 2024A04J4838), and the Fundamental Research Funds for the Central Universities, Southwest Minzu University (Grant No. 2022llxy001).

Data Availability Statement

Data are contained within the article.

Conflicts of Interest

We declare that we do not have any commercial or associative interest that represents a conflict of interest in connection with the work submitted.

Appendix A

Table A1. The difference in characteristics between the general ecological area and the ecological redline area before and after PSM.
VariablesBefore PSMAfter PSM
General
Ecological
Area
Ecological
Redline
Area
pGeneral
Ecological
Area
Ecological
Redline
Area
p
Population267.21
(−1030.11)
222.66
(−863.64)
0.004 **267.99
(−1037.42)
268.61
(−968.79)
0.609
GDP3,287,607.76
(−26,077,936.3)
2,667,281.04
(−19,800,949.36)
0.0623,323,447.24
(−26,316,168.27)
3,213,624.62
(−23,433,962.34)
0.807
Average annual precipitation1816.31
(−107)
1828.48
(−98.8)
0.001 ***1817.64
(−106.99)
1821.42
(−97.67)
0.039 *
Average annual temperature216.69
(−13.68)
213.83
(−13.64)
0.001 ***216.68
(−13.76)
216.28
(−12.34)
0.104
DEM193.08
(−167.61)
271.38
(−214.72)
0.001 ***196.28
(−168.39)
206.2
(−169.79)
0.001 ***
Slope12.71
(−8.3)
14.94
(−8.78)
0.001 ***12.81
(−8.31)
13.17 (−8.4)0.02 *
Aspect176.77
(−106.06)
178.84
(−104.7)
0.08176.1
(−106.08)
176.78 (−104.73)0.866
Distance to railways24,349.78
(−17,182.82)
24394.21
(−20320.69)
0.8924079.68
(−16974.07)
23,666.81
(−20,220.8)
0.136
Distance to water2798.06
(−2346.63)
3007.21
(−2612.04)
0.001 ***2809.02
(−2339.12)
2847.84
(−2611.16)
0.386
Distance to first-level roads6763.68
(−4397.06)
6764.18
(−4327.96)
0.8866729.64
(−4386.74)
6744.64
(−4447.68)
0.866
Distance to second-level roads6711.89
(−4946.78)
6683.71
(−6409.06)
0.001 ***6762.79
(−4968.94)
6997.61
(−6203.41)
0.012 *
Distance to third-level roads2496.02
(−1906.34)
2663.37
(−2088.01)
0.001 ***2604.76
(−1907.61)
2600.6
(−2078.46)
0.91
Distance to highways8106.23
(−6968.61)
8179.66
(−7438.61)
0.6418094.84
(−6932.27)
8164.79
(−7646.42)
0.604
Soil types209.38
(−18.63)
212.26
(−16.86)
0.001 ***209.71
(−18.14)
210.6
(−17.46)
0.006 **
Obs.69878797 68646864
Notes: Standard errors in parentheses, ***, **, and * indicate significance at the 1%, 5%, and 10% levels, respectively.

References

  1. Chuai, X.; Huang, X.; Wang, W.; Zhao, R.; Zhang, M.; Wu, C. Land use, total carbon emissions change and low carbon land management in Coastal Jiangsu, China. J. Clean. Prod. 2015, 103, 77–86. [Google Scholar] [CrossRef]
  2. Sleeter, B.M.; Marvin, D.C.; Cameron, D.R.; Selmants, P.C.; Westerling, A.L.; Kreitler, J.; Daniel, C.J.; Liu, J.; Wilson, T.S. Effects of 21st-century climate, land use, and disturbances on ecosystem carbon balance in California. Glob. Chang. Biol. 2019, 25, 3334–3353. [Google Scholar] [CrossRef] [PubMed]
  3. Yang, Y.; Shi, Y.; Sun, W.; Chang, J.; Zhu, J.; Chen, L.; Wang, X.; Guo, Y.; Zhang, H.; Yu, L.; et al. Terrestrial carbon sinks in China and around the world and their contribution to carbon neutrality. Sci. China Life Sci. 2022, 65, 861–895. [Google Scholar] [CrossRef] [PubMed]
  4. Li, J.; Guo, X.; Chuai, X.; Xie, F.; Yang, F.; Gao, R.; Ji, X. Reexamine China’s terrestrial ecosystem carbon balance under land use-type and climate change. Land Use Policy 2021, 102, 105275. [Google Scholar] [CrossRef]
  5. Xu, Q.; Yang, R.; Dong, Y.-X.; Liu, Y.-X.; Qiu, L.-R. The influence of rapid urbanization and land use changes on terrestrial carbon sources/sinks in Guangzhou, China. Ecol. Indic. 2016, 70, 304–316. [Google Scholar] [CrossRef]
  6. Quesada, B.; Arneth, A.; Robertson, E.; de Noblet-Ducoudré, N. Potential strong contribution of future anthropogenic land-use and land-cover change to the terrestrial carbon cycle. Environ. Res. Lett. 2018, 13, 064023. [Google Scholar] [CrossRef]
  7. Zafar, Z.; Sajid Mehmood, M.; Shiyan, Z.; Zubair, M.; Sajjad, M.; Yaochen, Q. Fostering deep learning approaches to evaluate the impact of urbanization on vegetation and future prospects. Ecol. Indic. 2023, 146, 109788. [Google Scholar] [CrossRef]
  8. Piao, S.; Wang, X. Biological systems under climate change: What do we learn from the IPCC AR6. Glob. Chang. Biol. 2023, 29, 5120–5121. [Google Scholar] [CrossRef]
  9. Chen, G.; Li, X.; Liu, X.; Chen, Y.; Liang, X.; Leng, J.; Xu, X.; Liao, W.; Qiu, Y.; Wu, Q.; et al. Global projections of future urban land expansion under shared socioeconomic pathways. Nat. Commun. 2020, 11, 537. [Google Scholar] [CrossRef]
  10. Mendoza-Ponce, A.; Corona-Núñez, R.O.; Kraxner, F.; Leduc, S.; Patrizio, P. Identifying effects of land use cover changes and climate change on terrestrial ecosystems and carbon stocks in Mexico. Glob. Environ. Chang. 2018, 53, 12–23. [Google Scholar] [CrossRef]
  11. Zhu, W.; Zhang, J.; Cui, Y.; Zhu, L. Ecosystem carbon storage under different scenarios of land use change in Qihe catchment, China. J. Geogr. Sci. 2020, 30, 1507–1522. [Google Scholar] [CrossRef]
  12. Gizachew, B.; Solberg, S.; Puliti, S. Forest Carbon Gain and Loss in Protected Areas of Uganda: Implications to Carbon Benefits of Conservation. Land 2018, 7, 138. [Google Scholar] [CrossRef]
  13. Liu, X.; Xia, L.; Xun, L.; Hong, S.; Ou, J.P. Simulating the Change of Terrestrial Carbon Storage in China Based on the FLUS-InVEST Model. Trop. Geogr. 2019, 39, 397–409. (In Chinese) [Google Scholar]
  14. Yang, L.; Zhao, J.; Zhu, J.; Liu, L.; Zhang, P. Spatial—Temporal change and prediction of carbon stock in the ecosystem of Xi’an based on PLUS and InVEST models. Remote Sens. Nat. Resour. 2022, 34, 175–182. [Google Scholar] [CrossRef]
  15. Gong, W.; Duan, X.; Sun, Y.; Zhang, Y.; Ji, P.; Tong, X.; Qiu, Z.; Liu, T. Multi-scenario simulation of land use/cover change and carbon storage assessment in Hainan coastal zone from perspective of free trade port construction. J. Clean. Prod. 2023, 385, 135630. [Google Scholar] [CrossRef]
  16. Zou, N.; Wang, C.; Wang, S.; Li, Y. Impact of ecological conservation policies on land use and carbon stock in megacities at different stages of development. Heliyon 2023, 9, e18814. [Google Scholar] [CrossRef]
  17. Yang, S.; Li, L.; Zhu, R.; Luo, C.; Lu, X.; Sun, M.; Xu, B. Assessing land-use changes and carbon storage: A case study of the Jialing River Basin, China. Sci. Rep. 2024, 14, 1–18. [Google Scholar] [CrossRef]
  18. Jia, P. Ecological Protection Redlines’ Positive Impact on Terrestrial Carbon Storage in Hainan Island, China. Land 2024, 13, 1292. [Google Scholar] [CrossRef]
  19. Hwang, J.; Choi, Y.; Kim, Y.; No Ol, L.; Yoo, Y.-J.; Cho, H.J.; Sun, Z.; Jeon, S. Analysis of the effect of environmental protected areas on land-use and carbon storage in a megalopolis. Ecol. Indic. 2021, 133, 108352. [Google Scholar] [CrossRef]
  20. Ferraro, P.J.; Pattanayak, S.K. Money for Nothing? A Call for Empirical Evaluation of Biodiversity Conservation Investments. PLOS Biol. 2006, 4, e105. [Google Scholar] [CrossRef]
  21. Ribas, L.G.D.S.; Pressey, R.L.; Loyola, R.; Bini, L.M. A global comparative analysis of impact evaluation methods in estimating the effectiveness of protected areas. Biol. Conserv. 2020, 246, 108595. [Google Scholar] [CrossRef]
  22. Chen, H.; Dong, N.; Liang, X.; Huang, H. Spatiotemporal Evaluation of Regional Land Use Dynamics and Its Potential Ecosystem Impact under Carbon Neutral Pathways in the Guangdong–Hong Kong–Macao Greater Bay Area. Remote Sens. 2023, 15, 5749. [Google Scholar] [CrossRef]
  23. Gu, Y.; Lin, N.; Ye, X.; Xu, M.; Qiu, J.; Zhang, K.; Zou, C.; Qiao, X.; Xu, D. Assessing the impacts of human disturbance on ecosystem services under multiple scenarios in karst areas of China: Insight from ecological conservation red lines effectiveness. Ecol. Indic. 2022, 142, 109202. [Google Scholar] [CrossRef]
  24. Guo, H.; Du, E.; Terrer, C.; Jackson, R.B. Global distribution of surface soil organic carbon in urban greenspaces. Nat. Commun. 2024, 15, 806. [Google Scholar] [CrossRef] [PubMed]
  25. Pfaff, A.; Robalino, J.; Sandoval, C.; Herrera, D. Protected area types, strategies and impacts in Brazil’s Amazon: Public protected area strategies do not yield a consistent ranking of protected area types by impact. Philos. Trans. R. Soc. B Biol. Sci. 2015, 370, 20140273. [Google Scholar] [CrossRef]
  26. Brooks, T.M.; Mittermeier, R.A.; Da Fonseca, G.A.; Gerlach, J.; Hoffmann, M.; Lamoreux, J.F.; Mittermeier, C.G.; Pilgrim, J.D.; Rodrigues, A.S. Global biodiversity conservation priorities. Science 2006, 313, 58–61. [Google Scholar] [CrossRef]
  27. Hoekstra, J.M.; Boucher, T.M.; Ricketts, T.H.; Roberts, C. Confronting a biome crisis: Global disparities of habitat loss and protection. Ecol. Lett. 2005, 8, 23–29. [Google Scholar] [CrossRef]
  28. Vieira, R.R.; Pressey, R.L.; Loyola, R. The residual nature of protected areas in Brazil. Biol. Conserv. 2019, 233, 152–161. [Google Scholar] [CrossRef]
  29. Granger, E.; Watkins, T.; Sergeant, J.C.; Lunt, M. A review of the use of propensity score diagnostics in papers published in high-ranking medical journals. BMC Med. Res. Methodol. 2020, 20, 1–9. [Google Scholar] [CrossRef]
  30. Thoemmes, F.J.; Kim, E.S. A Systematic Review of Propensity Score Methods in the Social Sciences. Multivar. Behav. Res. 2011, 46, 90–118. [Google Scholar] [CrossRef]
  31. Zhang, Y.; Li, J.; Tao, W. Does energy efficiency affect appliance prices? Empirical analysis of air conditioners in China based on propensity score matching—ScienceDirect. Energy Econ. 2021, 101, 105435. [Google Scholar] [CrossRef]
  32. Zhang, H.; Li, X.; Liu, X.; Chen, Y.; Ou, J.; Niu, N.; Jin, Y.; Shi, H. Will the Development of a High-Speed Railway Have Impacts on Land Use Patterns in China? Ann. Am. Assoc. Geogr. 2019, 109, 1005–1979. [Google Scholar] [CrossRef]
  33. Shi, H.; Li, X.; Liu, X.; Wang, S.; Liu, X.; Zhang, H.; Tang, D.; Li, T. Global protected areas boost the carbon sequestration capacity: Evidences from econometric causal analysis. Sci. Total Environ. 2020, 715, 137001. [Google Scholar] [CrossRef]
  34. Bai, Y.; Jiang, B.; Wang, M.; Li, H.; Alatalo, J.M.; Huang, S. New ecological redline policy (ERP) to secure ecosystem services in China. Land Use Policy 2016, 55, 348–351. [Google Scholar] [CrossRef]
  35. Gao, J.; Zou, C.; Zhang, K.; Xu, M.; Wang, Y. The establishment of Chinese ecological conservation redline and insights into improving international protected areas. J. Environ. Manag. 2020, 264, 110505. [Google Scholar] [CrossRef]
  36. Sang, W.; Axmacher, J. Environment: China draws lines to green future. Nature 2016, 531, 305. [Google Scholar] [CrossRef]
  37. Xu, X.; Liu, J.; Zhang, S.; Li, R.; Yan, C.; Wu, S.J.R. China’s Multi-Period Land Use Land Cover Remote Sensing Monitoring Data Set (CNLUCC); Environment Data Cloud Platform: Beijing, China, 2018. [Google Scholar]
  38. Peel, M.C.; Finlayson, B.L.; McMahon, T.A. Updated world map of the Köppen-Geiger climate classification. Hydrol. Earth Syst. Sci. 2007, 11, 1633–1644. [Google Scholar] [CrossRef]
  39. Wu, B.; Lang, X.; Jiang, D. Köppen Climate Zones in China Over the Last 21,000 Years. J. Geophys. Res. Atmos. 2021, 126, e2020JD034310. [Google Scholar] [CrossRef]
  40. Liang, X.; Guan, Q.; Clarke, K.C.; Liu, S.; Wang, B.; Yao, Y. Understanding the drivers of sustainable land expansion using a patch-generating land use simulation (PLUS) model: A case study in Wuhan, China. Comput. Environ. Urban Syst. 2021, 85, 101569. [Google Scholar] [CrossRef]
  41. Clarke, K.C.; Hoppen, S.; Gaydos, L. A Self-Modifying Cellular Automaton Model of Historical Urbanization in the San Francisco Bay Area. Environ. Plan. B Plan. Des. 1997, 24, 247–261. [Google Scholar] [CrossRef]
  42. Liu, X.; Liang, X.; Li, X.; Xu, X.; Ou, J.; Chen, Y.; Li, S.; Wang, S.; Pei, F. A future land use simulation model (FLUS) for simulating multiple land use scenarios by coupling human and natural effects. Landsc. Urban Plan. 2017, 168, 94–116. [Google Scholar] [CrossRef]
  43. Piyathilake, I.D.U.H.; Udayakumara, E.P.N.; Ranaweera, L.V.; Gunatilake, S.K. Modeling predictive assessment of carbon storage using InVEST model in Uva province, Sri Lanka. Model. Earth Syst. Environ. 2021, 8, 2213–2223. [Google Scholar] [CrossRef]
  44. Rosenbaum, P.R.; Rubin, D.B. The central role of the propensity score in observational studies for causal effects. Biometrika 1983, 70, 41–55. [Google Scholar] [CrossRef]
  45. Abadie, A.; Imbens, G.W. Matching on the Estimated Propensity Score. Econometrica 2016, 84, 781–807. [Google Scholar] [CrossRef]
  46. Cazalis, V.; Prince, K.; Mihoub, J.B.; Kelly, J.; Butchart, S.H.M.; Rodrigues, A.S.L. Effectiveness of protected areas in conserving tropical forest birds. Nat. Commun. 2020, 11, 4461. [Google Scholar] [CrossRef]
  47. Bertrand, M.; Duflo, E.; Mullainathan, S. How Much Should We Trust Differences-In-Differences Estimates? Q. J. Econ. 2004, 119, 249–275. [Google Scholar] [CrossRef]
  48. Shao, S.; Tian, Z.; Yang, L. High speed rail and urban service industry agglomeration: Evidence from China’s Yangtze River Delta region. J. Transp. Geogr. 2017, 64, 174–183. [Google Scholar] [CrossRef]
  49. McDonald, R.I.; Boucher, T.M. Global development and the future of the protected area strategy. Biol. Conserv. 2011, 144, 383–392. [Google Scholar] [CrossRef]
  50. Campbell, A.; Dickson, B.; Gibbs, H.; Hansen, M.; Kapos, V.; Lysenko, I.; Miles, L.; Scharlemann, J. The role of protected areas in storing carbon and reducing emissions. IOP Conf. Ser. Earth Environ. Sci. 2009, 6, 252025. [Google Scholar] [CrossRef]
  51. Melillo, J.M.; Lu, X.; Kicklighter, D.W.; Reilly, J.M.; Cai, Y.; Sokolov, A.P. Protected areas’ role in climate-change mitigation. Ambio 2016, 45, 133–145. [Google Scholar] [CrossRef]
  52. Gundersen, P.; Thybring, E.E.; Nord-Larsen, T.; Vesterdal, L.; Nadelhoffer, K.J.; Johannsen, V.K. Old-growth forest carbon sinks overestimated. Nature 2021, 591, E21–E23. [Google Scholar] [CrossRef]
  53. Kim, M.; Kraxner, F.; Forsell, N.; Song, C.; Lee, W.-K. Enhancing the provisioning of ecosystem services in South Korea under climate change: The benefits and pitfalls of current forest management strategies. Reg. Environ. Change 2021, 21, 1–10. [Google Scholar] [CrossRef]
  54. Bruner, A.G.; Gullison, R.E.; Balmford, A. Financial Costs and Shortfalls of Managing and Expanding Protected-Area Systems in Developing Countries. BioScience 2004, 54, 1119–1126. [Google Scholar] [CrossRef]
  55. Yang, H.; Vina, A.; Winkler, J.A.; Chung, M.G.; Huang, Q.; Dou, Y.; McShea, W.J.; Songer, M.; Zhang, J.; Liu, J. A global assessment of the impact of individual protected areas on preventing forest loss. Sci. Total Environ. 2021, 777, 145995. [Google Scholar] [CrossRef]
  56. Guo, X.; Zhang, Y.; Guo, D.; Lu, W.; Xu, H.F. How does ecological protection redline policy affect regional land use and ecosystem services? Environ. Impact Assess. Rev. 2023, 100, 107062. [Google Scholar] [CrossRef]
  57. Hua, H.; Zhang, X.; Zhou, Y.; Sun, J.; Chen, X. Multi-scenario prediction and attribution analysis of carbon storage of ecological system in the Huaihe River Basin, China. Environ. Monit. Assess. 2024, 196, 1–23. [Google Scholar] [CrossRef]
  58. Wu, Q.; Wang, L.; Wang, T.; Ruan, Z.; Du, P. Spatial–temporal evolution analysis of multi-scenario land use and carbon storage based on PLUS-InVEST model: A case study in Dalian, China. Ecol. Indic. 2024, 166, 112448. [Google Scholar] [CrossRef]
  59. Dewulf, J.; Benini, L.; Mancini, L.; Sala, S.; Blengini, G.A.; Ardente, F.; Recchioni, M.; Maes, J.; Pant, R.; Pennington, D. Rethinking the area of protection “natural resources” in life cycle assessment. Environ. Sci. Technol. 2015, 49, 5310–5317. [Google Scholar] [CrossRef]
  60. Kearney, S.G.; Adams, V.M.; Fuller, R.A.; Possingham, H.P.; Watson, J.E.M. Estimating the benefit of well-managed protected areas for threatened species conservation. Oryx 2018, 54, 276–284. [Google Scholar] [CrossRef]
  61. Wang, N.; Du, Y.; Liang, F.; Yi, J.; Qian, J.; Tu, W.; Huang, S.; Luo, P. Protected areas effectively resisted 33.8% of urban development pressures in China during 2000–2018. Appl. Geogr. 2023, 159, 103079. [Google Scholar] [CrossRef]
  62. Yu, C.; Zhang, Z.; Jeppesen, E.; Gao, Y.; Liu, Y.; Liu, Y.; Lu, Q.; Wang, C.; Sun, X. Assessment of the effectiveness of China’s protected areas in enhancing ecosystem services. Ecosyst. Serv. 2024, 65, 101588. [Google Scholar] [CrossRef]
  63. Wang, X.; Wen, Y.; Liu, X.; Wen, D.; Long, Y.; Zhao, P.; Liu, P.; Zhong, J. Protection Effect and Vacancy of the Ecological Protection Redline: A Case Study in Guangdong–Hong Kong–Macao Greater Bay Area, China. Remote Sens. 2021, 13, 5171. [Google Scholar] [CrossRef]
Figure 1. The framework for effectiveness assessment of land use development strategies and the ecological protection redline on carbon storage based on multi-model coupling.
Land 13 01918 g001
Figure 2. Location of the Guangdong–Hong Kong–Macao Greater Bay Area.
Land 13 01918 g002
Figure 3. LULC patterns for 2000 (A), 2010 (B), 2020 (C) in the GBA.
Land 13 01918 g003
Figure 4. Multi-scenario patterns of LULC in the GBA ((A) LULC patterns under the natural development scenario; (B) LULC patterns under the natural development with ecological protection redline scenario; (C) LULC patterns under the ecological development scenario; (D) LULC patterns under the ecological development with ecological protection redline scenario).
Land 13 01918 g004
Figure 5. The dynamic of carbon storage from 2000 to 2020 ((A) spatial distribution of carbon storage in 2000; (B) spatial distribution of carbon storage in 2010; (C) spatial distribution of carbon storage in 2020; (D) the percentage change in carbon storage from 2000 to 2020, “0–15” and “>15” indicate an increase in carbon storage, “0” indicates carbon storage that remains constant, “−15–0” and “<15” indicate a decrease in carbon storage).
Land 13 01918 g005
Figure 6. The dynamic of carbon storage from 2020 to 2050 under multi-scenarios ((A) the percentage change in carbon storage under the natural development scenario from 2020 to 2050; (B) the percentage change in carbon storage under the natural development with ecological protection redline scenario from 2020 to 2050; (C) the percentage change in carbon storage under the ecological development scenario; (D) the percentage change in carbon storage under the ecological development with ecological protection redline scenario from 2020 to 2050, “0–15” and “>15” indicate an increase in carbon storage, “0” indicates carbon storage that remains constant, “−15–0” and “<15” indicate a decrease in carbon storage).
Land 13 01918 g006
Figure 7. The distributions of propensity scores before and after matching ((A,D) the comparison between the general control area (GCA) and the ecological redline area (ERA); (B,E) the comparison between the GCA and the general ecological area (GEA); (C,F) the comparison between the GEA and the ERA).
Land 13 01918 g007
Figure 8. Trends of average carbon storage in different regions from 2000 to 2020 in the matched samples ((A) the comparison between the general control area (GCA) and the ecological redline area (ERA); (B) the comparison between the GCA and the general ecological area (GEA); (C) the comparison between the ERA and the GEA).
Land 13 01918 g008
Figure 9. Trends of average carbon storage under multi-scenario with the PSM model (A,C,E) and the comparison between the subregions (B,D,F). (A,B) The comparison between the natural development scenario (ND) and the natural development with ecological protection redline scenario (ND-EPR); (C,D) the comparison between the ND and the ecological development scenario (ED); (E,F) the comparison between the ND and the ecological development with ecological protection redline scenario (ED-EPR). ERA: the ecological redline area; GEA: the general ecological area.
Land 13 01918 g009
Table 1. Variables and their descriptions in this study.
VariablesData SourceResolutionYear
Natural data
Average annual temperatureResources and Environment Science Data Platform
(http://www.resdc.cn, accessed on 1 April 2024)
1000 m2020
Average annual precipitation2020
Soil types1995
DEMGeospatial Data Cloud
(https://www.gscloud.cn/, accessed on 1 April 2024)
30 m
Slope
Aspect
Social-economic data
PopulationResources and Environment Science Data Platform
(http://www.resdc.cn, accessed on 1 April 2024)
1000 m2020
Gross Domestic Product2020
Distance to railwaysNational Geomatics Center of China
(https://www.ngcc.cn/, accessed on 1 April 2024)
30 m2024
Distance to motorways2024
Distance to buildings2024
Distance to first-level roads2024
Distance to second-level roads2024
Distance to third-level roads2024
Distance to water2024
Disclaimer/Publisher’s Note: The statements, opinions and data contained in all publications are solely those of the individual author(s) and contributor(s) and not of MDPI and/or the editor(s). MDPI and/or the editor(s) disclaim responsibility for any injury to people or property resulting from any ideas, methods, instructions or products referred to in the content.

