Abstract
Forests are an important component of the natural systems of large cities. Their deficiency limits the proper functioning of these systems and creates a shortage of recreational places for residents needing contact with nature. This can be encountered in Rzeszów, a city in southern Poland with 200,000 inhabitants, which is characterised by the smallest forest area (2.8%) of all province capitals in the country. The natural state of small forest enclaves in this city has not been fully investigated. This has led to incorrect management and nature conservation policies. Therefore, the aim of this research conducted since 2015 was to recognise the potential for conservation and recreational functions using the concept of ecosystem services (ES) and ecosystem disservices (EDS), and to develop recommendations for the optimal use of these areas. This article analyses and compares 14 indicators related to ES and EDS of three out of five larger forest patches in the city. The results of this analysis indicate that the current method for protecting these valuable elements of the natural system does not correspond with their actual conservation potential. The application of the ES and EDS concepts to assess the nature conservation potential allowed us to determine it as high in two forest enclaves where such potential had not been indicated so far, and to identify the highest recreational potential in one of the investigated sites.
1. Introduction
Forest ecosystems are an important component of urban natural systems, contributing to the protective and recreational potentials of these systems [1]. Simultaneously, they provide a variety of ecosystem services (ES) [2,3,4], which may be threatened by excessive urban development [5]. The ecosystem services of urban forests represent all three groups of services specified by the latest CICES classification [6]: provisioning, regulating and maintaining, and cultural. They can also pose threats to humans, especially given the various aspects of plant cover [7,8,9]. In the literature, these threats are regarded as ecosystem disservices (EDS) [10,11,12,13]. The concept of ecosystem services was proposed in the mid-20th century [14], and the contemporary literature on this issue is extremely rich. Ecosystem services are often understood as a set of products and functions of ecosystems, as noted in Costanza et al. [15], or refer to human welfare, as in the CICES classification, where ecosystem services are defined as “the contribution that ecosystems make to human well-being” [6]. They can also be perceived very broadly as the benefits that humans derive from the environment [14]. In turn, the ecosystem services potential can be regarded as the “hypothetical maximum yield” that the ecosystem is able to provide [16]. This definition is similar to the much earlier concept of environmental potential proposed by G. Haase [17], where it referred to the ability to satisfy a certain human need, e.g., recreation. The ability to perform a recreational function is one of the most important potentials of urban forests, which can be classified in the ES concept as the cultural ES (CES) [18,19]. Another important potential of urban forests is their ability to function as a biodiversity refuge [20] or in other aspects related to natural or, more broadly, protective functions, such as regulation of the microclimate or water circulation [3]. In the ES concept, they belong to the regulating and maintaining (RES) category. As highlighted by Jim and Chen [3] and Giedych and Maksymiuk [21], RES and CES are considered the most important services for cities rather than provisioning ones (PES). Therefore, indicators for determination of the potential for RES and CES can be a useful tool for diagnosing urban forest ecosystems in terms of their ability to meet recreational and nature conservation needs. These potentials are complementary but sometimes conflicting; hence, they should be estimated simultaneously. This may help to make optimal decisions in terms of management and conservation of forest ecosystems [22]. In city conditions, this may involve the protection of valuable urban forest enclaves with concurrent residents’ access to the forests. Such recommendations are particularly important in cities with a shortage of forest areas, or their apparent incorrect use or management [23,24]. The assessment of the potential of such forests, especially in terms of their protective and recreational functions, may help to optimise their functioning. Such an assumption was made in our analysis of the ecosystem of Rzeszów, a city in southeastern Poland with a defective natural system [25]. Although it is located on the edge of the Carpathian Mountains [26], the city has the lowest forest area in comparison with all province capitals in the country [27]. Additionally, the natural structure of these forests has not been properly recognised to date, which has impeded the undertaking of appropriate protective measures. Concurrently, there may be strong recreational pressure within the forests, as the residents of Rzeszów believe that the number of recreational forest areas is insufficient [28]. The recreational pressure may conflict with the necessity to protect valuable elements of the natural structure of urban forests.
Therefore, the main aim of the present study was to recognise the potential of three urban forest enclaves to serve nature conservation (NC) and recreational (R) functions using diagnostic indicators related to ES and EDS, and to develop relevant recommendations for further management of these areas.
2. Materials and Methods
2.1. Study Area
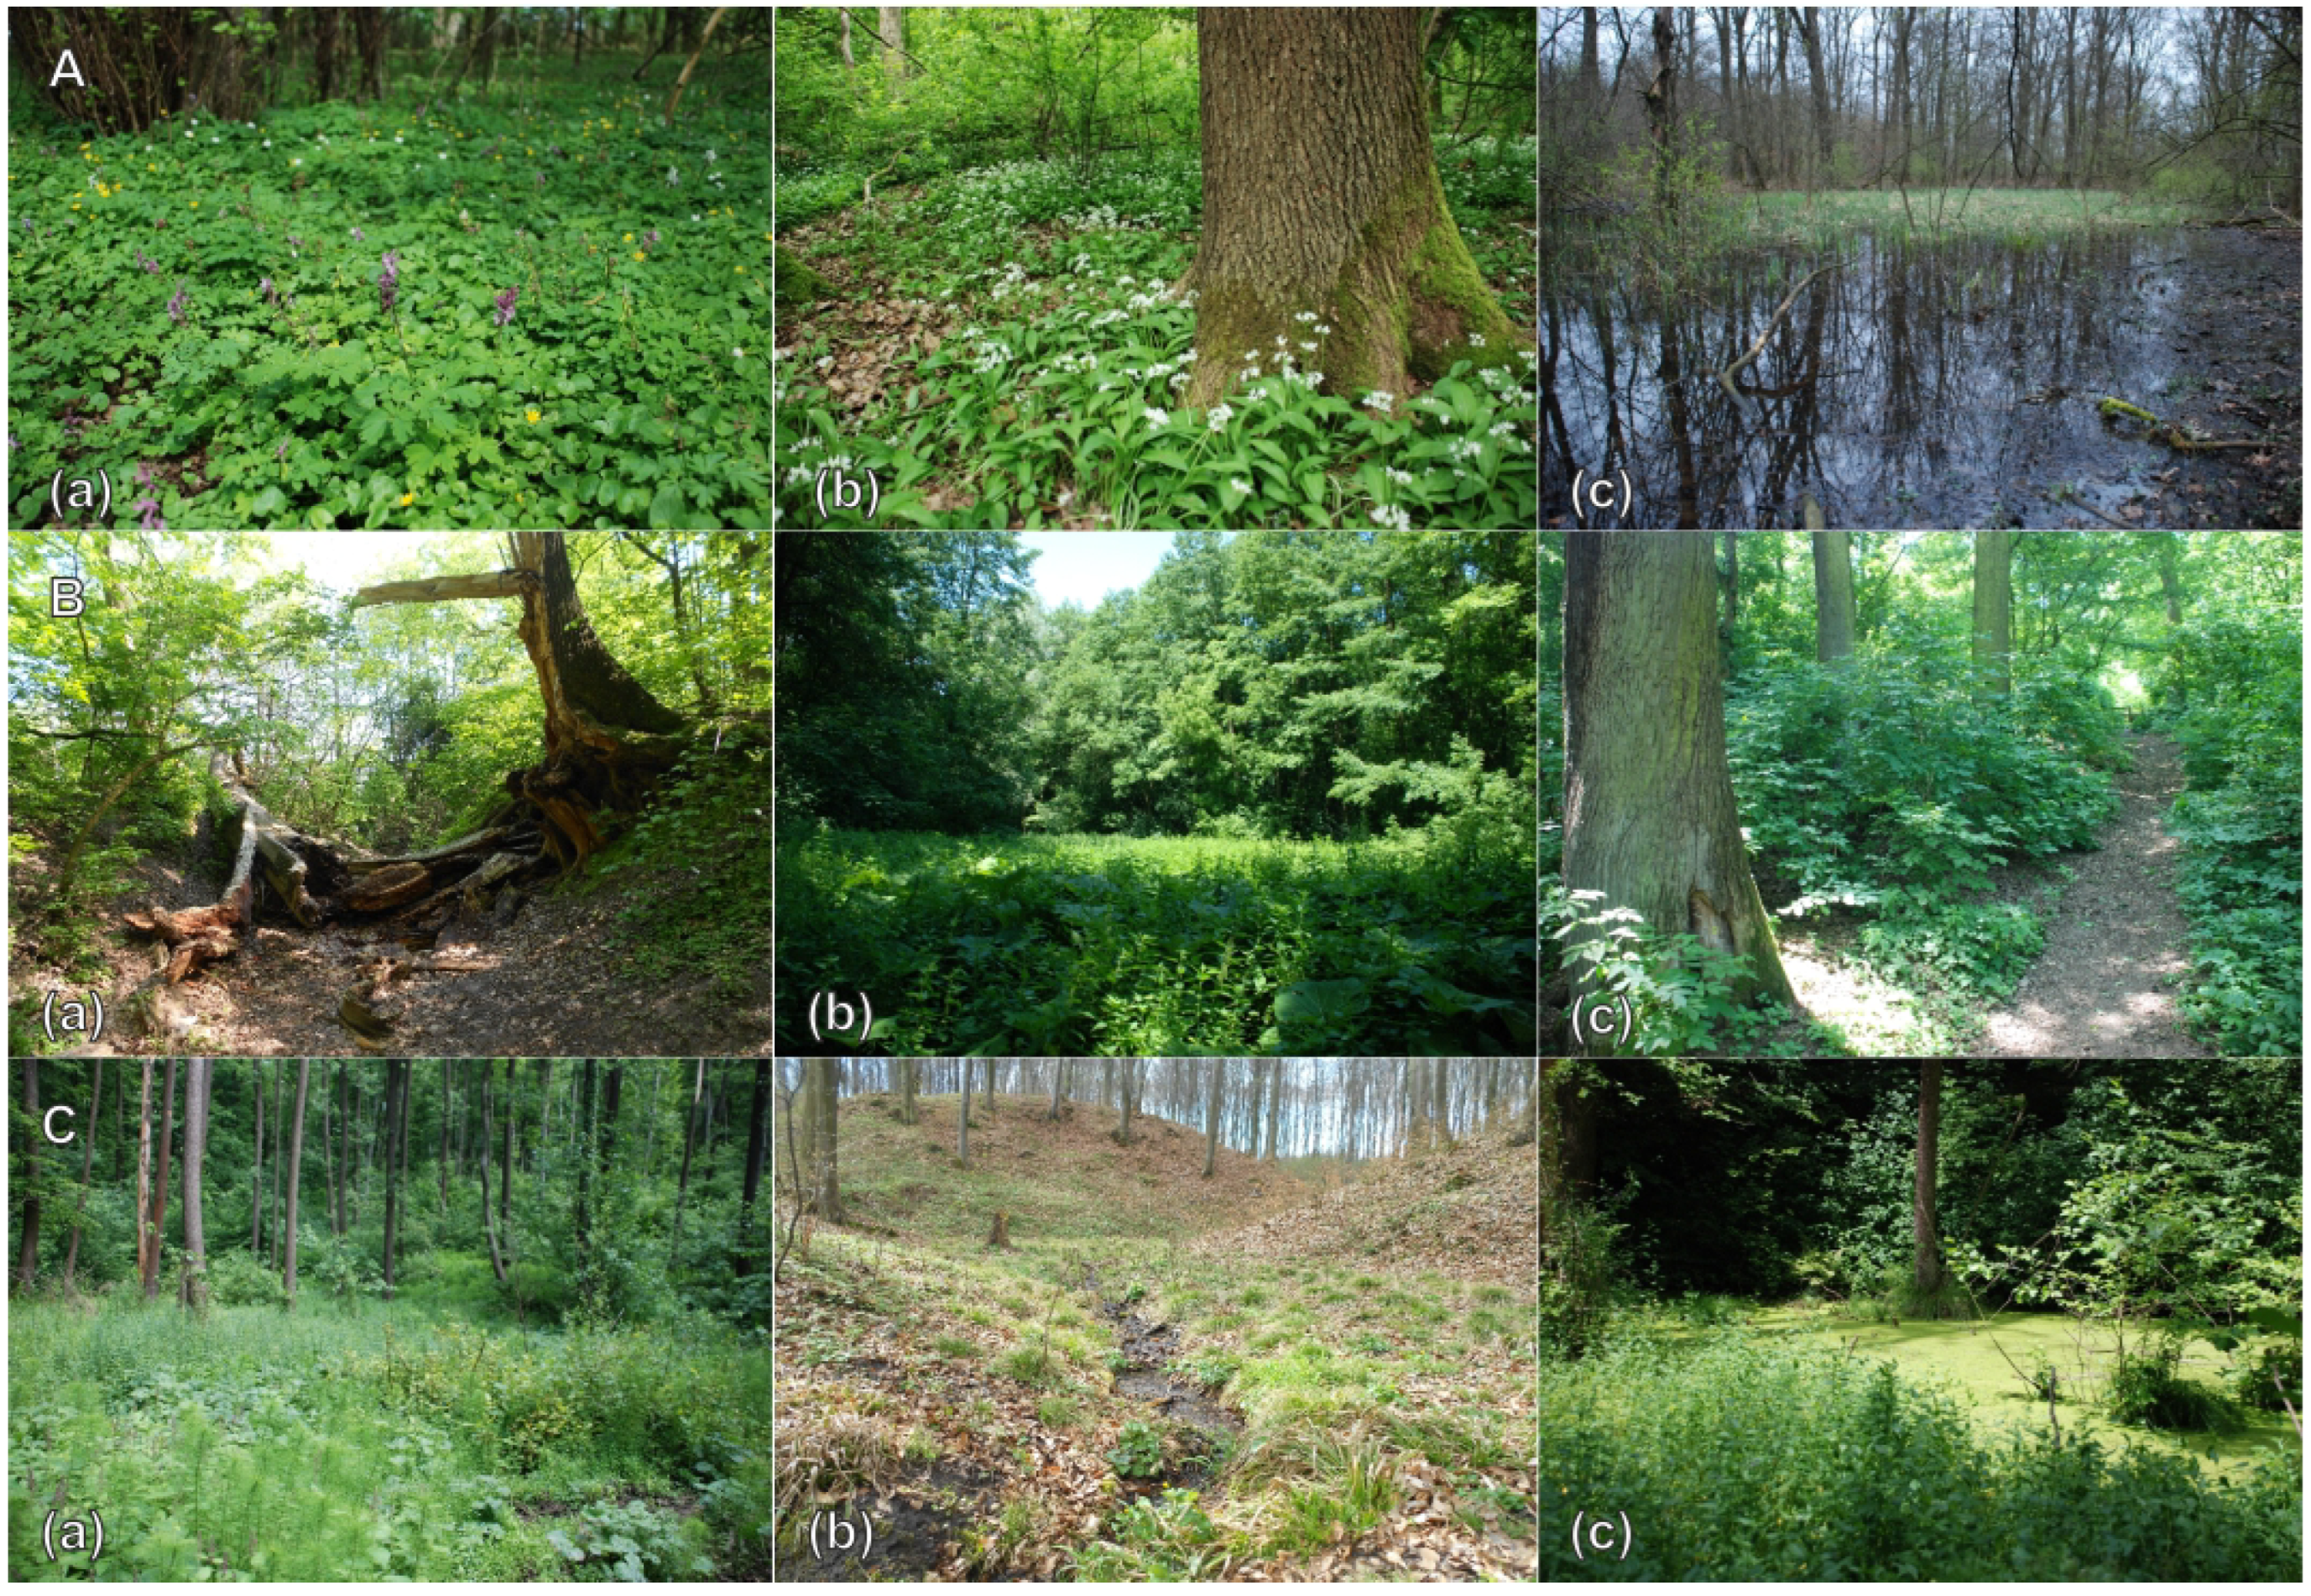
The study area is located in Rzeszów and on its eastern border with the Krasne and Chmielnik municipalities. This city, with 200,000 inhabitants, is the capital of one of Poland’s sixteen provinces—Podkarpackie Province. Therefore, it performs metropolitan functions. Although it has more than doubled its size since 2005 [29], the villages incorporated into the city in recent years have not developed an urban fabric so far [30]. However, this does not favour the proper functioning of the urban natural system, which consists of a network of water features, forests, shrubs, urban parks, and open agricultural areas. This network is dissected by overdeveloped river valleys [25], which have lost their potential for maintenance of ecological connectivity. Such transformations have been observed particularly in the Wisłok River valley, which is the axis of the city (Figure 1). Urban forests constitute only 2.8% of the entire area [27]; additionally, there are no natural connections between the patches of forests.
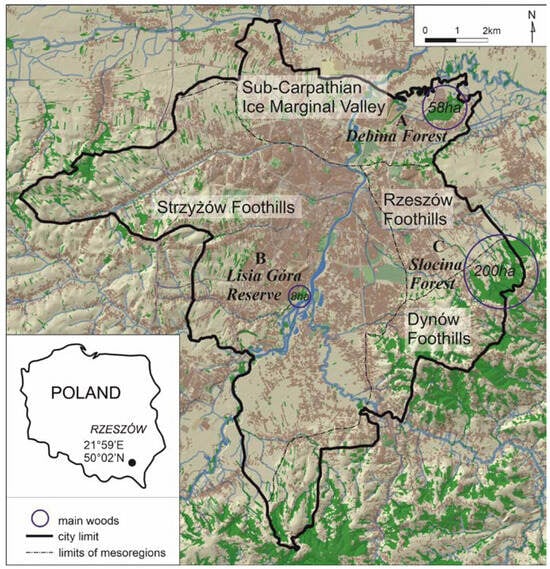
Figure 1.
Study area. The limits of mesoregions by Solon et al. [26].
A detailed study was conducted in three compact forest patches: Dębina Forest (site A), Lisia Góra reserve (site B), and Słocina Forest (site C) (Figure 1). Two of these sites, i.e., A and B, are located within the Wisłok River valley depression, filled with Holocene alluvial deposits (A and B) and with loess cover on a Pleistocene upper terrace (B) [31]. However, they belong to completely different geographical regions (Figure 1). Site C is a forest developed on the threshold of the Carpathians on weathered Carpathian flysch deposits, with a relief intensively shaped by slope and erosion processes (Figure 2). It occupies the largest area (Figure 1). In all three sites, there are interesting hydrological conditions influencing the presence of forest communities associated with wetlands and water-related areas (Figure 2). On site B, which includes a floodplain, a riparian habitat has developed. The groundwater level on site A rises in the spring within oxbow lakes; hence, three aquatic communities have developed here, including Potametea class macrophyte communities, which are not recorded in the other forest patches. In turn, there are two year-round lakes in the landslide niches (Figure 2) on site C, and the other niches are periodically filled with water. Only site B is legally protected since 1998 as the “Lisia Góra (Fox Hill)” forest reserve with an old oak stand [32]. Site A is designated by the forest administration as a protective forest for the city, whereas site C is classified as a protective forest with damage [33].

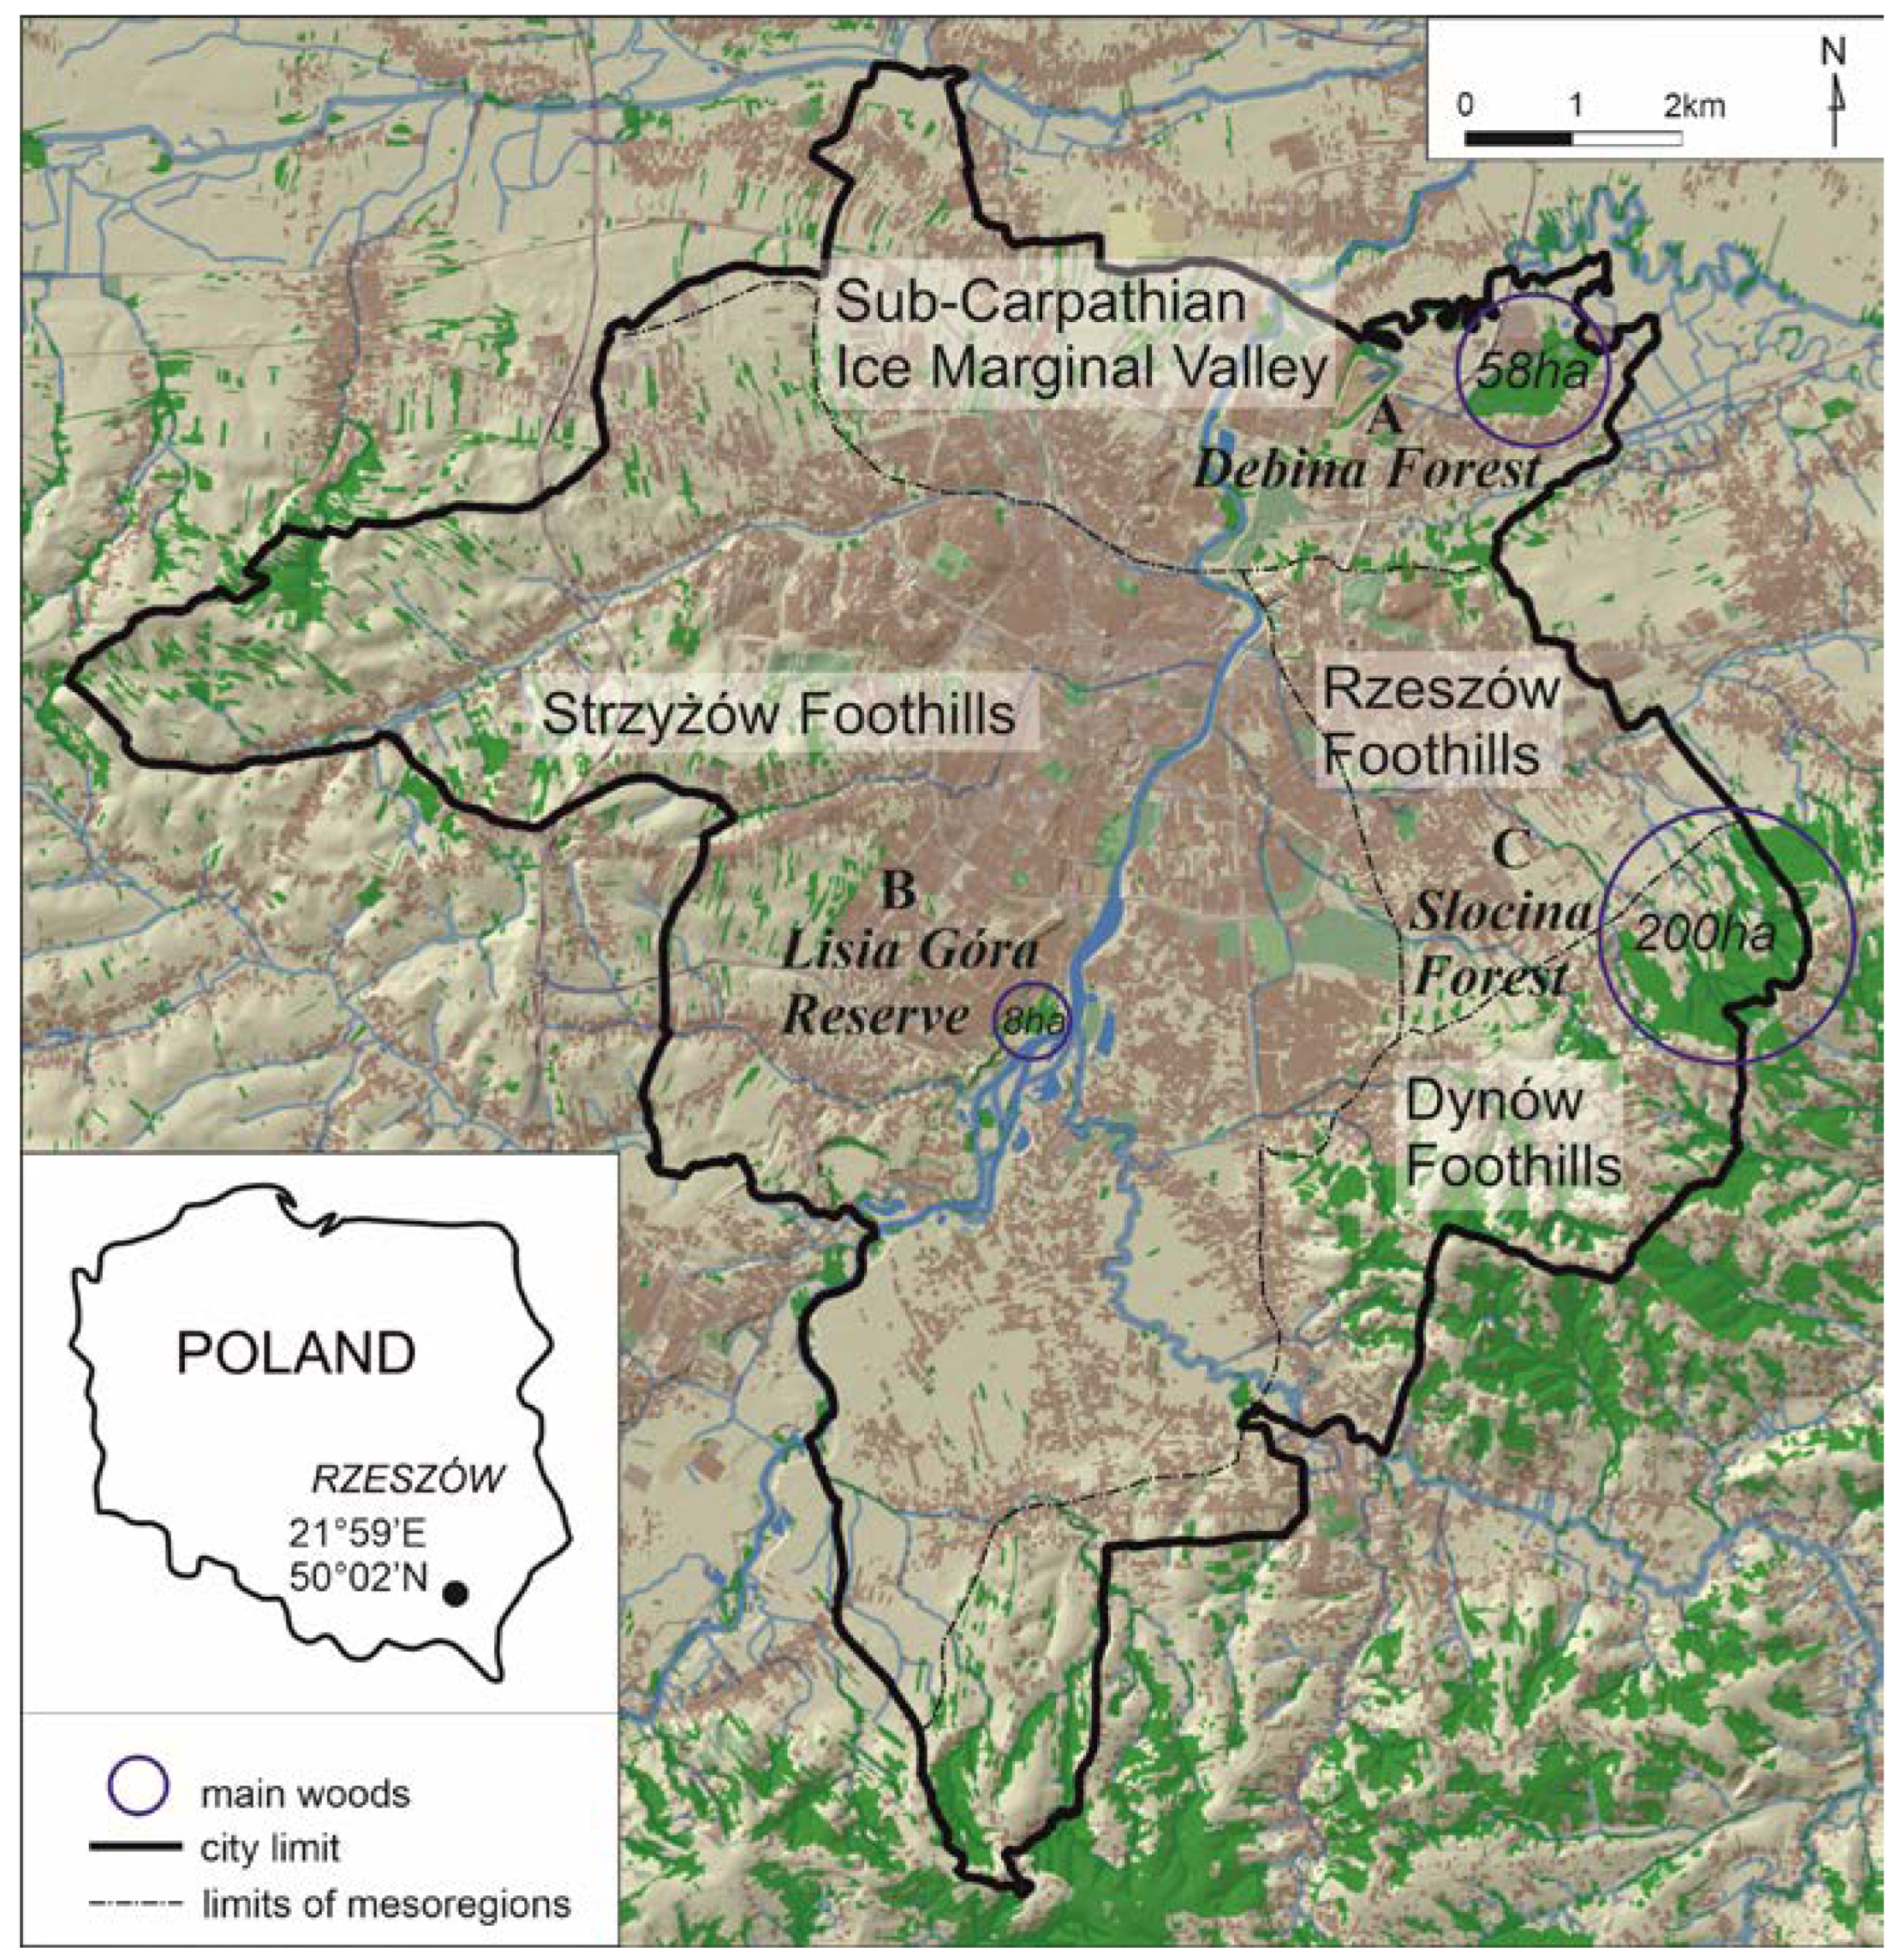
Figure 2.
Habitat diversity of the study areas: (A) Dębina Forest: (a) floristic richness of Tilio cordatae–Carpinetum betuli oak–hornbeam forest, (b) monumental size Quercus robur and protected Allium ursinum, (c) hydrophilic Magnocaricion elatae communities; (B) Lisia Góra reserve: (a) dying Quercus robur, (b) Ficario-Ulmetum minoris riparian forest on the Wisłok River floodplain, (c) Tilio cordatae–Carpinetum betuli oak–hornbeam forest; (C) Słocina Forest: (a) Carici remotae–Fraxinetum riparian forest, (b) slopes of the Carpathian threshold with diversified relief, (c) landslide lake with Lemnetea minoris aquatic vegetation.
2.2. Indicators Related to Ecosystem Services and Ecosystem Disservices
In the present study, as in Solon et al. [14], ES are referred to as broad-sense benefits provided to humans by the environment, whereas EDS are regarded as a harmful impact of the environment on humans [10,11,34]. As part of the research procedure, we developed 14 indicators (Table 1), which refer to ES and EDS and were strictly adapted to the analysed sites. We used them for the assessment of the nature conservation potential (PNC) and the recreational potential (PR) of the area. We assumed that the conservation potential is associated with regulating ES (RES), and the recreational potential is related to cultural ES (CES). Subsequently, as in a study on the potential of forest habitat types for ecosystem services [22], we linked each indicator to one or more of the three subgroups: Cr—culture: recreation, Cse—culture: science and education, and Rhm—regulation: habitat maintenance. Next, we determined whether each indicator has a favourable and/or adverse impact on the nature conservation and/or recreational potential of the forest site. In this manner, we decided whether they are related to ES or to EDS.

Table 1.
Indicators related to ES and EDS and influencing nature conservation and recreational functions.
The qualitative and quantitative data on the indicators adopted in the analysis of the study forest areas were obtained from the literature [35,36,37,38,39]. The other data were collected during field studies conducted since 2015, with mapping and standard methods used in botanical sciences, including phytosociology. The threat of allergenic pollen (indicator no. 11, Table 1) was determined based on the coverage of the study area with the dominant wind-pollinated tree species and the allergenic threat posed by this species, according to the identification key proposed by Frenguelli and Kasprzyk [40]. On site C, we counted visitors using a similar method to that described elsewhere [9,39]. Two counting rounds were carried out: on a working day and at the weekend between 6:00 and 7:00 p.m. in September 2024.
2.3. Assessment of Nature Conservation and Recreational Potentials
We understand the potential of the investigated forest patch to serve a specific function (here, nature conservation (NC) and recreation (R)) as the ability to meet a given need, as in [17]. The term “function” in our research deviates from ecological functions and processes in ecosystems, which are a component of the classical ecosystem service cascade model proposed by Haines-Young and Potschin [41]. The authors of the cascade model point out in a later publication [42] that the word “function” is also used “to indicate some capacity or capability of the ecosystem to do something that is potentially useful to people”. In our research, we follow this meaning of “function”. We have established the value, or qualitatively described each of the 14 indicators that may be linked to NC and R (see Table 2). The total nature conservation (PNC) and recreational (PR) potentials of the investigated forest enclave were calculated on the basis of partial potentials for nature conservation (PPNC) and recreation (PPR). The contribution of indicators related to ES and EDS to PPNC and PPR was estimated as high, moderate, or low, using the expert method. Similarly, the level of PPNC and PPR was estimated as high, moderate, or low. Additionally, each level of PPNC and PPR was associated with points: high (3 points), moderate (2 points), and low (1 point). To calculate the final total PNC and PR of the investigated sites, the following mathematical formulas were used:
Table 2.
Main features of the investigated sites as a basis for ES and EDS.
3. Results and Discussion
3.1. Contribution of ES and EDS to Partial Nature Conservation and Recreational Potentials
The forest habitat type is one of the most important aspects used for assessment of the forest’s potential to provide key ecosystem services: provisioning, regulation, and cultural, and for further decision making about their protection or management methods [22]. Therefore, we adopted it as the first and most important indicator related to ES and EDS (indicator 1). The Forest Data Bank [33] indicates the presence of only riparian forest on site A (Table 2). Our study did not detect optimal conditions for this type of forest. The predominant habitat type is fresh upland forest, although there are periodically wet areas here. This habitat type is present in all the analysed sites, and the combination of the two types (riparian and fresh upland) also occurs at site B. Affek et al. [22] highlight the high value of fresh upland forest in terms of maintenance of habitats (RES) and science with education and recreation aspects (CES). Therefore, the highest PPNC and PPR values in relation to this indicator were attributed to site C (Figure 3), where only fresh upland forest occurs (Table 2). Riparian forests contribute to PPNC and PPR in an opposite manner. Their co-occurrence with the fresh upland forest reduced the values of PPNC and PPR on sites A and B (Figure 3).
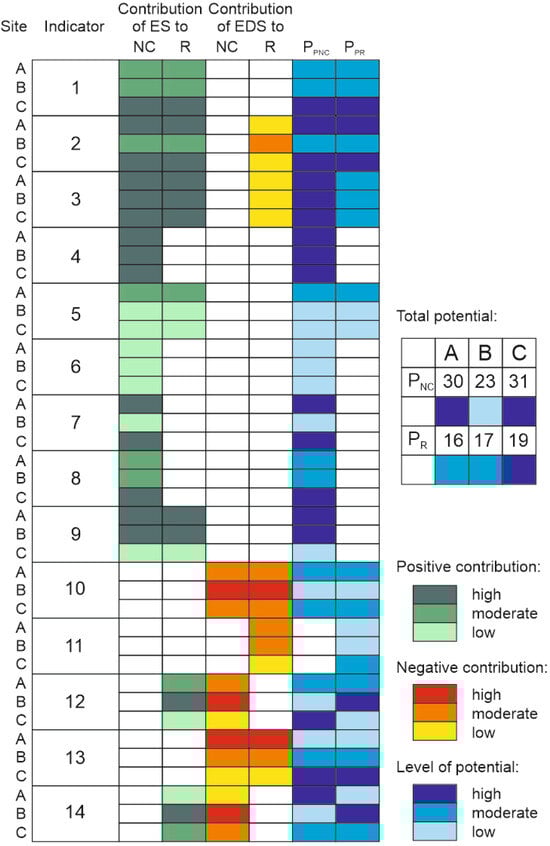
Figure 3.
Matrix of contribution of ecosystem services (ED) and ecosystem disservices (EDS) to the partial nature conservation (PPNC) and recreational (PPR) potentials of the investigated forests (A–C) and the total potentials of forests (PNC and PR). Nos. 1–14: indicators related to ES and EDS (see Table 1).
The plant communities (indicator 2) are similar but not identical to the forest site type. In all the sites, the largest area is occupied by Tilio cordatae–Carpinetum betuli oak–hornbeam forest (Figure 2), which is characterised by moderate vegetation density and thus offers optimal conditions for recreation [43]. In contrast, riparian communities and others covered by hydrophilic vegetation reduce the recreational potential, as they are difficult for visitors to access and are inhabited by a wide range of troublesome parasites (mosquitoes, ticks) and pathogens posing a threat to human health [9,44]. They may also strongly stimulate visitors [45]. Additionally, the dense vegetation in these communities may lower one’s sense of security [43]. Therefore, these communities are one of the features related to EDS (Table 1). These communities are present on all the sites, with a typical riparian forest occurring only on site B, hence being the greatest unfavourable contribution of EDS to the recreational potential in this area (Figure 3). The combination of different communities, on the other hand, contributes to the high values of PPNC. The greatest diversity of plant communities was found on sites A and C, where the oak–hornbeam forest dominates, but there is also a mosaic of small patches of hydrophilic communities associated with wet and humid habitats (Figure 2). Additionally, the fertile beech forest association Dentario glandulosae–Fagetum is present on site C, which gives this area a more mountainous character than the other sites.
The number of vascular plant species and their specificity (indicator 3) is similar on all three sites, although the highest number recorded in the nature reserve on site B (Table 2) is associated with the fact that the area has been best explored [36]. This indicator has a significant positive contribution to PPNC; nevertheless, due to the occurrence of allergenic, toxic, psychoactive, and spikey plants (EDS), it has a somewhat negative effect on PPR (Figure 3). Species acting as EDS are represented by Solanum dulcamara, Sambucus nigra, or Prunus spinosa [9]. The number of native species (indicator 4) has only a positive contribution to PPNC and, except for the value of some species (Genista tinctoria, Hedera helix, Tilia cordata, Urtica dioica) for science and education, has no major importance for PPR (Figure 3). The presence and number of protected species (indicator 5), also representatives of the native flora, can serve as attractants for tourism- and recreation-oriented visitors. This, therefore, has an impact on both PPR and PPNC. Here, site A should be distinguished, where as many as five such species, namely, Allium ursinum, Colchicum autumnale, Primula elatior, Scilla bifolia, and Neottia nidus-avis, were recorded (Table 2); this is reflected in the increased PPR and PPNC of this site, in comparison with sites B and C.
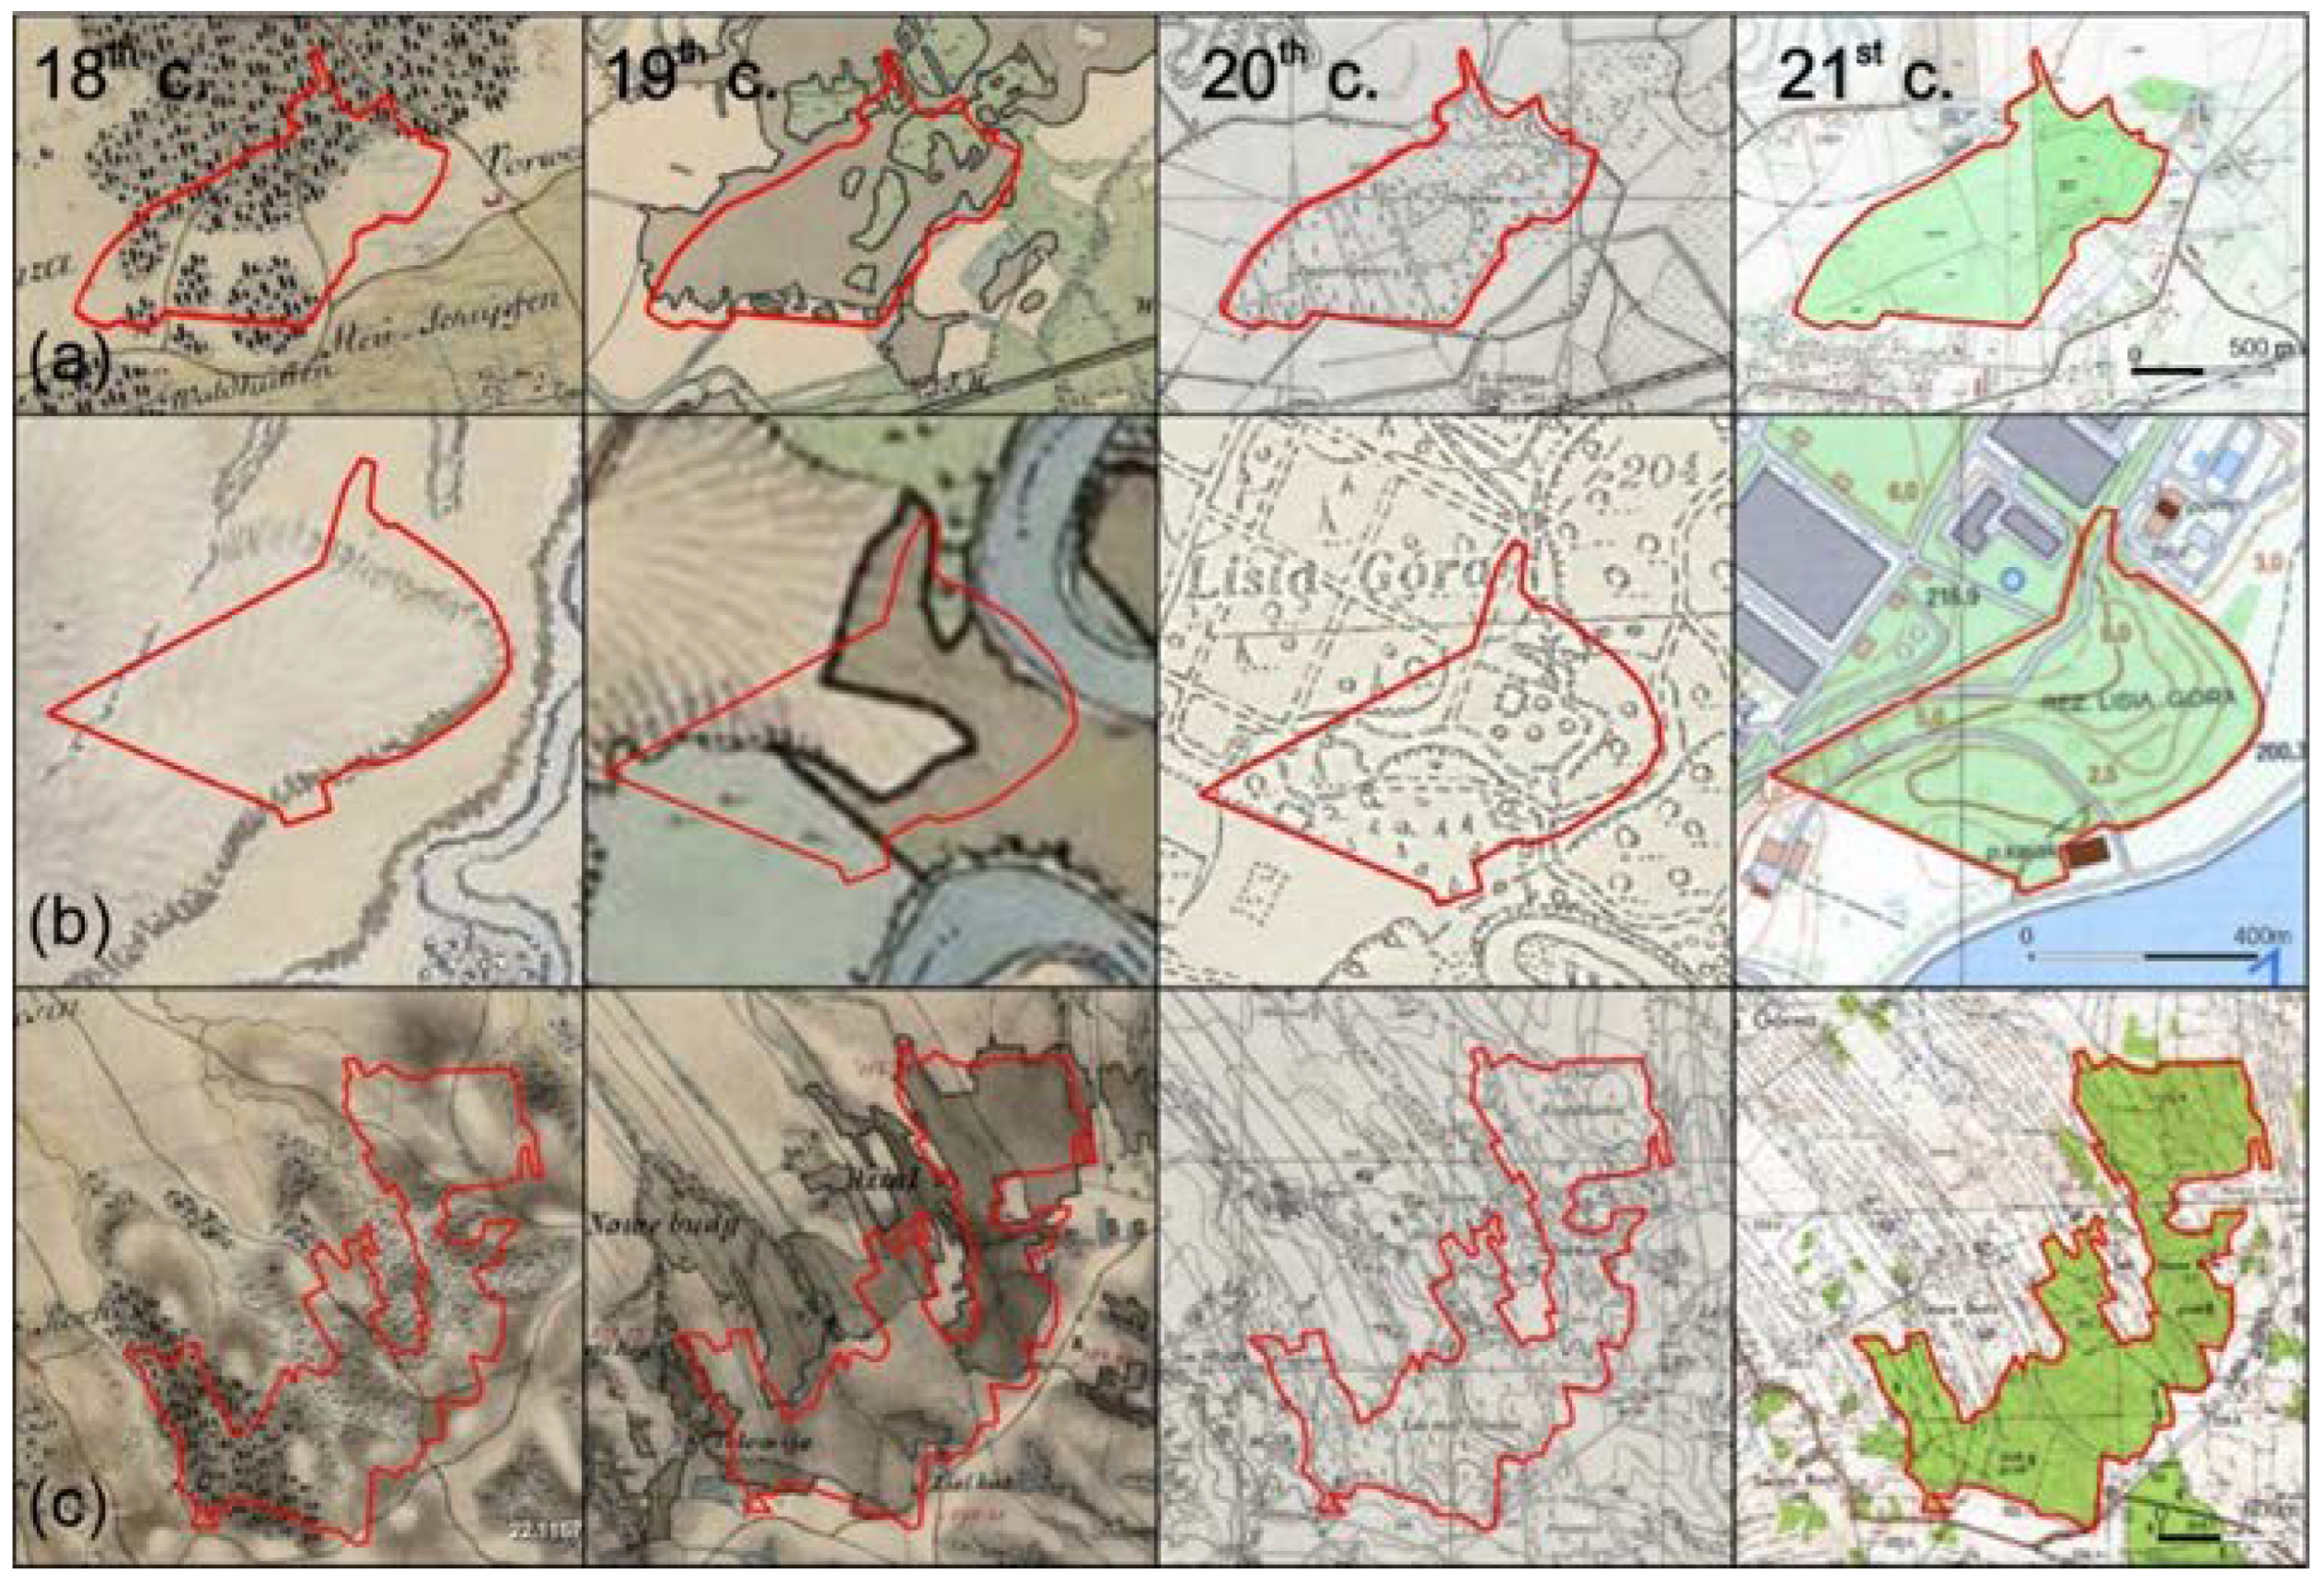
In our expert assessment, we adopted a slightly different approach to the presence of endangered species from the Polish red list of pteridophytes and flowering plants [46] (indicator 6), as we assumed that the presence of such species should not be advertised to prevent the possible threat posed by tourist traffic. Although we found such species on sites A (Pulmonaria mollis), B (Virga pilosa), and C (Carex strigosa), we acknowledged their positive impact only on PPNC (Figure 3). We followed the same approach to ancient woodland indicator species and mountain species (indicators 7 and 8). In the case of the former, sites A and C, with the largest number of these species, were assigned the greatest PPNC (Table 2, Figure 3). It is also worth emphasising that these species achieve high coverage on these sites and form large and compact patches (e.g., Anemone nemorasa, Corydalis cava, Ficaria verna), whereas single clumps and small clusters are formed on site B. This is associated with this area’s history of use. As indicated by cartographic sources illustrating the time scale from the 18th to 21st centuries, most of the area of sites A and C has always been used as forest (Figure 4). Additionally, the forest use at site C was promoted by the diversified relief associated with the location of the area at the Carpathian boundary, which is currently reflected in the greatest abundance of mountain species (indicator 8). The high share of ancient woodland indicator species in the flora shows the long and uninterrupted continuity of the forest habitat [47,48]; hence, these species can be helpful in identification of valuable natural areas predisposed to serve nature conservation functions. Site B was used as pasture and arable field in the 18th and 19th centuries. Only its small lowest part was covered by a riparian forest (Figure 4). The result of this type of land use is the old oak stand protected as a nature reserve; however, the lack of knowledge of the history of this area has led to undertaking inappropriate conservation measures [32]. The reserve protection of natural processes, rather than oaks, conducted at site B has resulted in the poor health of the oak stand (Figure 2) and the risk of its degradation. As many as 75 trees on site B are monumental size Quercus robur oaks (Table 2, indicator 9), contributing highly to the PPNC and PPR. Site C is characterised by an equally large number of monumental size trees, especially Quercus robur (Figure 2), Acer campestre, and Tilia cordata (Table 2), where the values of PPNC and PPR are estimated as high due to this indicator (Figure 3).

Figure 4.
Past and contemporary land use of the investigated forests: (a) Dębina Forest (site A); (b) Lisia Góra Reserve (site B); (c) Słocina Forest (site C). The 18th and 19th centuries: First Military Survey (1779–1783), Second MS (1842–1853), and Third MS (1869–1887) retrieved from [49]; 20th century: Polish military map (1938) retrieved from [50]; 21st century: retrieved from [51]. Red line means investigated sites limits.
The greatest number of alien species (indicator 10), i.e., as many as 20 species, were recorded on the smallest site (B) within the Lisia Góra reserve (Table 2). They contribute only negatively to both PPNC and PPR (Table 1). Hence, the partial nature conservation and recreational potentials in relation to this indicator were ultimately estimated as lower on site B than at sites A and C (Figure 3). Alien species, especially kenophytes with the status of invasive species, pose a substantial threat to the native flora and natural plant communities within cities. They can reproduce and colonise new areas rapidly, leading to the extinction of native species, unfavourable changes in phytocoenoses, and a decrease in the overall biodiversity [52]. This phenomenon was also observed on site B, where the mass occurrence of Impatiens parviflora in the groundcover effectively impairs the growth of other plants [37]. In turn, due to their considerably larger area and peripheral location within the city limits, sites A and C are less exposed to the encroachment of alien species.
An important indicator related to vegetation and influencing PPR is the unfavourable impact of allergenic plant pollen (indicator 11). In the literature, it is often mentioned as one of the EDS [53]. The main allergenic tree species on sites A and B is Quercus robur, but the threat posed is low [40] or moderate. Site C is dominated by Carpinus betulus, which poses a low threat [40] (Table 2); hence, the PPR determined by this factor was estimated to be low on sites A and B and moderate on site C (Figure 3).
Indicator 12 (number of visitors) exerts various effects on the conservation and recreational potentials. We assumed that the number of visitors to a given area indicates its attractiveness and/or accessibility, thus increasing its PPR. Therefore, site B achieved the highest score. Concurrently, the high visitor load limits the possibility of maintenance of habitats; hence, the PPNC value in the case of site B is lower (Figure 3). The high attractiveness of this forest area is evidenced by its protection status (reserve), accessibility, and the recreational management of its surroundings (paths, playgrounds, sports fields, etc.), which attract visitors. Large numbers of visitors were also observed by Dudek [54] in the Bór reserve located in the suburban area of Rzeszów, which has similar features to those of site B.
An anthropopressure-related indicator, which clearly negatively influences both the partial nature conservation and recreation potentials (Table 1), is the degree of littering in the area (indicator 13). This differs between the individual sites. The greatest littering degree was found in the Dębina Forest (site A), which weakens the potential and is responsible for the low values of PPNC and PPR. A moderate degree of littering was observed on the site B reserve and the best, although not ideal, situation was found on site C (Table 2, Figure 3). Although they reduce the nature conservation potential, relief transformations (indicator 14) are induced in the investigated areas by visitors, especially downhill bikers. The intention of these activities is to increase the attractiveness of the area for visitors. It was therefore assumed that they have a positive effect on the PPR and a negative impact on the PPNC.
3.2. Total Nature Conservation and Recreational Potentials of the Investigated Forests
The total nature conservation potential (PNC) of the investigated sites is more diverse than the recreational (PR) one. The PNC was calculated based on 13 results of partial potentials (PPNC). The findings in this respect are surprising. It turned out that the area that is already protected by law as a reserve, which involves a highly protective regime in Poland (site B, 23 points), had the weakest nature conservation potential, whereas the areas that have not been well explored and are not protected to date exhibited the highest conservation potential (sites A, 30 points and site C, 31 points) (Figure 3). This is mostly influenced by the history of sites A and C indicating their permanent use as forest (Figure 4). In turn, site B is a secondary forest (Figure 4). Despite the conservation and protection of the old oak stand in this area, it does not fulfil any significant ES, such as the habitats of old forest species or protected species (Table 2), and these ES contribute largely to the conservation potential, as does the complex of valuable plant communities (indicator 2).
The recreational potential (PR) of the studied sites is similar (Figure 3). The sum of nine results of partial potentials (PPR) in all the sites is similar (Figure 3) and differs by only three points between the extreme values on site A (16 points) and site C (19 points). Given this result, the PR value was defined as moderate on sites A and B and high at site C (Figure 3). The method for calculation of the potential adopted in the study confirms our assumption about the high value of recreation potential on site C, although it has not been frequented by many visitors so far (Table 2); with its peripheral location (Figure 1), residents have the most difficulty in accessing this area, compared with the other sites.
4. Conclusions
The use of the concept of ecosystem services and disservices to assess the nature conservation and recreational potential of the most valuable elements of the natural structure of Rzeszów, i.e., forest patches, allowed us to estimate and compare the actual capability of these enclaves to meet the needs of nature conservation and recreation. The results of the present study indicate that the current state of protection and access to the urban forests does not correspond to their potential in this respect. Although they are characterised by completely different environmental conditions, the two poorly investigated forest areas, namely, Dębina Forest and Słocina Forest, turned out to be the most valuable areas for nature conservation. The most important feature was the continuity of their structure, as their large area has been wooded since at least the 18th century. Given the richness of plant communities, the number and coverage of ancient woodland indicator species, and the number of protected species and monumental size trees, we recommend that Dębina Forest should be protected as a forest reserve. In turn, Słocina Forest has the highest recreational potential. Our main recommendation is therefore to delegate the management of this forest to the city authorities and make it available to residents as an urban forest. The most valuable elements of its natural structure, e.g., the landslide lakes with well-developed aquatic communities, should be covered by one of the lower forms of protection, e.g., as an ecological site. In order to maintain its high nature conservation and recreational potentials, it would be necessary to abandon the economic use of this forest and treat it as a water- and soil-protecting forest with a protective function for the city.
The analysis of the nature conservation and recreational potentials of the only forest under reserve protection (Lisia Góra) indicates that neither of these potentials are high, with relatively higher values of recreational than conservation potential. The most valuable element of the natural structure influencing the nature conservation potential of Lisia Góra is the old oak stand. Taking this fact into account and the capability of this area to fulfil recreational functions, we recommend changing its protection from a forest reserve protecting natural processes into a landscape reserve, where broader active protection is possible. This type of protection can also facilitate the use of the recreational potential of this area. The contemporary method of protection of the Lisia Góra reserve, in relation to the IUNC classification [55], can be assigned to category Ia (area managed mainly for science or wilderness protection). However, as suggested by Bobiec et al. [32], the most optimal method for this reserve would be a combination of categories IV (area managed mainly for conservation through management intervention and V (area managed mainly for landscape conservation or recreation). Such an approach would allow one to preserve the subject (old-growth oak) requiring active protection. In the case of Dębina Forest, the appropriate approach seems to be to adopt a combination of categories Ia and IV, due to the presence of both well-preserved and significantly transformed forest habitats requiring intervention. In turn, in Słocina Forest, the level of protection should be established in two categories: II (area managed mainly for ecosystem protection and recreation) and III (area managed mainly for conservation of specific natural features), because in comparison to the other sites, this forest is distinguished by a great diversity of ecosystems and interesting forms of relief.
The proposed method for assessment of the potential based on indicators related to ecosystem services and ecosystem disservices can be universal and may be applied for evaluation and comparison of the potential of forests in the temperate climate zone, especially urban forests, where nature conservation and recreational functions intertwine.
Author Contributions
Conceptualisation, A.Ć.; methodology, A.Ć.; validation, A.Ć. and T.W.; formal analysis, A.Ć., T.W., and G.P.; investigation, A.Ć., T.W., and G.P.; resources, A.Ć., T.W., and G.P.; data curation, T.W.; writing—original draft preparation, A.Ć.; writing—review and editing, A.Ć. and T.W.; visualisation, A.Ć.; supervision, A.Ć.; funding acquisition, A.Ć. and T.W. All authors have read and agreed to the published version of the manuscript.
Funding
This research was supported by the Minister of Science of the Republic of Poland under the Programme “Regional initiative of excellence”. Agreement No. RID/SP/0010/2024/1.
Data Availability Statement
Data are contained within the article. Additional data are available for the request.
Conflicts of Interest
The authors declare no conflicts of interest.
References
- Hájek, M.; Lípa, J. Evaluation of ecosystem services from urban forests in the City of Prague. Cent. Eur. For. J. 2015, 61, 52–57. [Google Scholar]
- Chen, W.Y.; Jim, C.Y. Assessment and valuation of the ecosystem services provided by urban forests. In Ecology Planning and Management of Urban Forests; Carreiro, M.M., Song, Y.C., Wu, J.G., Eds.; Springer: New York, NY, USA, 2008; pp. 53–83. [Google Scholar]
- Jim, C.Y.; Chen, W.Y. Ecosystem services and valuation of urban forests in China. Cities 2009, 26, 187–194. [Google Scholar] [CrossRef]
- Jenkins, M.; Schaap, B.; Forest Ecosystem Services. Background Analytical Study 1. Available online: https://www.un.org/esa/forests/wp-content/uploads/2018/05/UNFF13_BkgdStudy_ForestsEcoServices.pdf (accessed on 20 September 2024).
- Zhang, J.; Lu, X.; Qin, Y.; Zhang, Y.; Yang, D. Can Urbanization-Driven Land-Use and Land-Cover Change Reduce Ecosystem Services? A Case of Coupling Coordination Relationship for Contiguous Poverty Areas in China. Land 2024, 13, 82. [Google Scholar] [CrossRef]
- Haines-Young, R.H.; Potschin, M.P. Common International Classification of Ecosystem Services (CICES) V5.1 and Guidance on the Application of the Revised Structure 2018. Available online: https://cices.eu/content/uploads/sites/8/2018/01/Guidance-V51-01012018.pdf (accessed on 20 September 2024).
- Escobedo, F.J.; Kroeger, T.; Wagner, J.E. Urban forests and pollution mitigation: Analyzing ecosystem services and disservices. Environ. Pollut. 2011, 159, 2078–2087. [Google Scholar] [CrossRef]
- Dudek, T.; Kasprzyk, I.; Dulska-Jeż, A. Forest as a place for recreation but also the source of allergenic plant pollen: To come or avoid? Eur. J. For. Res. 2018, 137, 849–862. [Google Scholar] [CrossRef]
- Ćwik, A.; Wójcik, T.; Ziaja, M.; Wójcik, M.; Kluska, K.; Kasprzyk, I. Ecosystem Services and Disservices of Vegetation in Recreational Urban Blue-Green Spaces—Some Recommendations for Greenery Shaping. Forests 2021, 12, 1077. [Google Scholar] [CrossRef]
- Wu, S.; Li, B.V.; Li, S. Classifying ecosystem disservices and valuating their effects—A case study of Beijing, China. Ecol. Indic. 2021, 129, 107977. [Google Scholar] [CrossRef]
- Guo, R.-Z.; Song, Y.-B.; Dong, M. Progress and Prospects of Ecosystem Disservices: An Updated Literature Review. Sustainability 2022, 14, 10396. [Google Scholar] [CrossRef]
- Lyytimäki, J.; Petersen, L.K.; Normander, B.; Bezák, P. Nature as a nuisance? Ecosystem services and disservices to urban lifestyle. Environ. Sci. 2008, 5, 161–172. [Google Scholar] [CrossRef]
- Shackleton, C.M.; Ruwanza, S.; Sinasson Sanni, G.K.; Bennett, S.; De Lacy, P.; Modipa, R.; Mtati, N.; Sachikonye, M.; Thondhlana, G. Unpacking Pandora’s Box: Understanding and Categorising Ecosystem Disservices for Environmental Management and Human Wellbeing. Ecosystems 2016, 19, 587–600. [Google Scholar] [CrossRef]
- Solon, J.; Roo-Zielińska, E.; Affek, A.; Kowalska, A.; Kruczkowska, B.; Wolski, J.; Degórski, M.; Grabińska, B.; Kołaczkowska, E.; Regulska, E.; et al. Świadczenia Ekosystemowe w Krajobrazie Młodoglacjalnym. Ocena Potencjału i Wykorzystania; IGiPZ PAN, Wydawnictwo Akademickie SEDNO: Warsaw, Poland, 2017; p. 469. [Google Scholar]
- Costanza, R.; d’Arge, R.; de Groot, R.; Farber, S.; Grasso, M.; Hannon, B.; Limburg, K.; Naeem, S.; O’Neill, R.V.; Paruelo, J.; et al. The value of the world’s ecosystem services and natural capital. Nature 1997, 387, 253–260. [Google Scholar] [CrossRef]
- Burkhard, B.; Kroll, F.; Nedkov, S.; Müller, F. Mapping ecosystem service supply, demand and budgets. Ecol. Indic. 2012, 21, 17–29. [Google Scholar] [CrossRef]
- Haase, G. Zur Ableitung und Kennzeichnung von Naturraumpotentialen. Petermanns Geogr. Mitteilungen 1978, 122, 113–125. [Google Scholar]
- de Groot, R.S.; Wilson, M.A.; Boumans, R.M.J. A typology for the classification, description and valuation of ecosystem functions, goods and services. Ecol. Econ. 2002, 41, 393–408. [Google Scholar] [CrossRef]
- Hernández-Morcillo, M.; Plieninger, T.; Bieling, C. An empirical review of cultural ecosystem service indicators. Ecol. Indic. 2013, 29, 434–444. [Google Scholar] [CrossRef]
- Pirnat, J.; Hladnik, D. Connectivity as a tool in the prioritization and protection of sub-urban forest patches in landscape conservation planning. Landsc. Urban Plan. 2016, 153, 129–139. [Google Scholar] [CrossRef]
- Giedych, R.; Maksymiuk, G. Specific features of parks and their impact on regulation and cultural ecosystem services provision in Warsaw, Poland. Sustainability 2017, 9, 792. [Google Scholar] [CrossRef]
- Affek, A.; Kołaczkowska, E.; Kowalska, A.; Regulska, E.; Wolski, J.; Solon, J. Usługi Ekosystemowe Polskich Lasów. Ocena Potencjału; Fundacja WWF Polska: Warsaw, Poland, 2023; p. 69. [Google Scholar]
- Seeland, K.; Moser, K.; Scheuthle, H.; Kaiser, F.G. Public acceptance of restrictions imposed on recreational activities in the peri-urban Nature Reserve Sihlwald, Switzerland. Urban For. Urban Green. 2002, 1, 49–57. [Google Scholar] [CrossRef]
- de Vries, S.; Goossen, M. Modelling recreational visits to forests and nature areas. Urban For. Urban Green. 2002, 1, 5–14. [Google Scholar] [CrossRef]
- Gajdek, A.; Wójcik, A. Green public spaces in the structure of developing city on example of Rzeszów, opportunities and threats. Przestrz. Forma 2017, 30, 243–258. [Google Scholar] [CrossRef]
- Solon, J.; Borzyszkowski, J.; Bidłasik, M.; Richling, A.; Badora, K.; Balon, J.; Brzezińska-Wójcik, T.; Chabudziński, Ł.; Dobrowolski, R.; Grzegorczyk, I.; et al. Physico-geographical mesoregions of Poland: Verification and adjustment of boundaries on the basis of contemporary spatial data. Geogr. Pol. 2018, 91, 143–170. [Google Scholar] [CrossRef]
- Statistics Poland. Local Data Base. 2023. Available online: https://bdl.stat.gov.pl/ (accessed on 18 September 2024).
- Dudek, T.; Hajdo, D. Demand for green areas meant for recreation in Rzeszow. Przestrz. Forma 2017, 32, 127–140. [Google Scholar] [CrossRef]
- Serwis Informacyjny Urzędu Miasta Rzeszowa. How Our City Grew. Available online: https://www.erzeszow.pl/pl/692-polozenie/13520-jak-roslo-nasze-miasto.html (accessed on 30 September 2024).
- Sikora, A. Rzeszów as an example of a ‘new town’ tailored for the modern era. Tech. Trans. 2021, 118, e2021006. [Google Scholar] [CrossRef] [PubMed]
- Zimnal, Z.; Malata, T. Szczegółowa Mapa Geologiczna Polski 1:50 000, Objaśnienia do Arkusza Rzeszów (982); Państwowy Instytut Geologiczny Państwowy Instytut Badawczy: Warsaw, Poland, 2014. [Google Scholar]
- Bobiec, A.; Ćwik, A.; Gajdek, A.; Wójcik, T.; Ziaja, M. Between Pocket Forest Wilderness and Restored Rural Arcadia: Optimizing the Use of a Feral Woodland Enclave in Urban Environment. Forests 2021, 12, 1173. [Google Scholar] [CrossRef]
- The Forest Databank. Bank Danych o Lasach. Available online: https://www.bdl.lasy.gov.pl/portal/mapy (accessed on 15 September 2024).
- Blanco, J.; Dendoncker, N.; Barnaud, C.; Sirami, C. Ecosystem disservices matter: Towards their systematic integration within ecosystem service research and policy. Ecosyst. Serv. 2019, 36, 100913. [Google Scholar] [CrossRef]
- Wójcik, T.; Rogus, A.; Ćwik, A. Plant communities in the “Św. Roch” forest in Rzeszów (Dynowskie Foothills). Fragm. Florist. Geobot. Pol. 2016, 23, 101–120. [Google Scholar]
- Wójcik, T.; Ziaja, M.; Makuch, I.; Ćwik, A.; Kotańska, M. Vegetation of the Lisia Góra Reserve in Rzeszów. Fragm. Florist. Geobot. Pol. 2018, 25, 21–43. [Google Scholar]
- Wójcik, T.; Makuch-Pietraś, I.; Ćwik, A.; Ziaja, M. Anthropogenic changes in selected elements of the natural environment in the Lisia Góra forest nature reserve in Rzeszów. Sylwan 2020, 164, 246–253. [Google Scholar]
- Przydział, G. Usługi Ekosystemowe Lasu Dębina w Rzeszowie. Master’s Thesis, University of Rzeszów, Rzeszów, Poland, 2023. [Google Scholar]
- Ćwik, A.; Lachowski, T.; Rycerz, M. (Eds.) Dokumentacja z Inwentaryzacji Potencjalnych Pomników Przyrody w Lesie Dębina na Załężu w Rzeszowie; Koło Naukowe Przyrodników Uniwersytetu Rzeszowskiego: Rzeszów, Poland, 2022; unpublished data. [Google Scholar]
- Frenguelli, G.; Kasprzyk, I. Description of Pollen Grains. In Proceedings of the Manual for Aerobiology: 12th European Course on Basic Aerobiology, Rzeszów, Poland, 20–26 June 2015. [Google Scholar]
- Haines-Young, R.H.; Potschin, M. The links between biodiversity, ecosystem services and human well-being. In Ecosystem Ecology: A New Synthesis; Raffaelli, D., Frid, C., Eds.; BES Ecological Reviews Series; CUP Cambridge University Press: Cambridge, UK, 2010; pp. 110–139. [Google Scholar]
- Potschin, M.B.; Haines-Young, R.H. Ecosystem services: Exploring a geographical perspective. Prog. Phys. Geogr. Earth Environ. 2011, 35, 575–594. [Google Scholar] [CrossRef]
- Bjerke, T.; Østdahl, T.; Thrane, C.; Strumse, E. Vegetation density of urban parks and perceived appropriateness for recreation. Urban For. Urban Green. 2006, 5, 35–44. [Google Scholar] [CrossRef]
- Dunn, R. Global mapping of ecosystem disservices: The unspoken reality that nature sometimes kills us. Biotropica 2010, 42, 555–557. [Google Scholar] [CrossRef]
- Krzymowska-Kostrowicka, A. Geoekologia Turystyki i Wypoczynku; Wydawnictwo Naukowe PWN: Warsaw, Poland, 1997; p. 239. [Google Scholar]
- Kaźmierczakowa, R.; Bloch-Orłowska, J.; Celka, Z.; Cwener, A.; Dajdok, Z.; Michalska-Hejduk, D.; Pawlikowski, P.; Szczęśniak, E.; Ziarnek, K. Polish Red List of Pteridophytes and Flowering Plants; Institute of Nature Conservation, Polish Academy of Sciences: Krakow, Poland, 2016; p. 38. [Google Scholar]
- Orczewska, A. Age and Origin of Forests in South-western Poland and their Importance for Ecological Studies in Man-dominated Landscapes. Landsc. Res. 2009, 34, 599–617. [Google Scholar] [CrossRef]
- Jabs-Sobocińnska, Z.; Affek, A.N.; Matuszkiewicz, J.M. The list of ancient-forest plant species revisited—Field verification in the Carpathian ancient and recent forests. For. Ecol. Manag. 2022, 512, 120152. [Google Scholar] [CrossRef]
- Arcanum. The Historical Map Portal. Available online: https://maps.arcanum.com/ (accessed on 10 July 2024).
- MAPSTER. Mapy Archiwalne Polski i Europy Środkowej. Available online: http://igrek.amzp.pl/maplist.php?cat=WIG25 (accessed on 10 July 2024).
- Geoportal. Available online: https://mapy.geoportal.gov.pl/imap/Imgp_2.html?gpmap=gp0 (accessed on 10 July 2024).
- Boscutti, F.; Lami, F.; Pellegrini, E.; Buccheri, M.; Busato, F.; Martini, F.; Sibella, R.; Sigura, M.; Marini, L. Urban sprawl facilitates invasions of exotic plants across multiple spatial scales. Biol. Invasions 2022, 24, 1497–1510. [Google Scholar] [CrossRef]
- Cariñanos, P.; Adinolfi, C.; de la Guardia, C.D.; De Linares, C.; Casares-Porcel, M. Characterization of Allergen Emission Sources in Urban Areas. J. Environ. Qual. 2016, 45, 244–252. [Google Scholar] [CrossRef]
- Dudek, T. Recreation in suburban forests—Monitoring the distribution of visits using the example of Rzeszów. Ann. For. Res. 2024, 67, 131–141. [Google Scholar] [CrossRef]
- Dudley, N.; Phillips, A. Forests and Protected Areas: Guidance on the Use of the IUCN Protected Area Management Categories; IUCN: Gland, Switzerland, 2006; Volume 12, p. 58. [Google Scholar]

Disclaimer/Publisher’s Note: The statements, opinions and data contained in all publications are solely those of the individual author(s) and contributor(s) and not of MDPI and/or the editor(s). MDPI and/or the editor(s) disclaim responsibility for any injury to people or property resulting from any ideas, methods, instructions or products referred to in the content. |
© 2024 by the authors. Licensee MDPI, Basel, Switzerland. This article is an open access article distributed under the terms and conditions of the Creative Commons Attribution (CC BY) license (https://creativecommons.org/licenses/by/4.0/).