Article

Multi-Scale Analysis of Water Purification Ecosystem Service Flow in Taihu Basin for Land Management and Ecological Compensation

1
The Center for Modern Chinese City Studies & Institute of Urban Development, East China Normal University, Shanghai 200062, China
2
School of Geographic Science, East China Normal University, Shanghai 200241, China
3
The Digital Engineering Technology Innovation Center for Ecological Governance of Land and Space under the Ministry of Natural Resources, Shanghai Jiao Tong University, Shanghai 200240, China
*
Author to whom correspondence should be addressed.
Land 2024, 13(10), 1694; https://doi.org/10.3390/land13101694
Submission received: 22 September 2024 / Revised: 9 October 2024 / Accepted: 14 October 2024 / Published: 16 October 2024

Abstract

:
This study investigates the spatial correlation and service flow of supply and demand for water purification ecosystem services at multiple scales (i.e., the Taihu Lake Basin, sub-basin, and county) by quantitatively assessing the supply–demand relationship of nitrogen and phosphorus and introducing the SPANS algorithm to characterize the service flow paths. Through quantitative analysis, the supply–demand relationship between nitrogen and phosphorus was evaluated, and the SPANS algorithm was introduced to characterize the service flow paths. The results show that the water purification ecosystem services in the southwestern region and around Taihu Lake exhibit a good supply–demand balance, while a significant supply–demand deficit is observed in the northern and southeastern regions. Service flow analysis indicates that surplus areas are primarily concentrated in hilly and urbanized central regions, whereas deficit areas are mainly located in non-urban centers. Based on these findings, ecological compensation suggestions are proposed, including dynamic adjustment, differentiated compensation, cross-city collaboration, and guidance of social capital participation, to promote continuous improvement in water quality and sustainable development within the basin.

1. Introduction

Ecosystem services (ES), especially freshwater ecosystem services (FESs), are crucial for sustaining the health and stability of ecosystems and are essential for the sustainable development of human societies [1,2]. Among the various FES, the water purification ecosystem service (WPES) stands out because of its significant economic and environmental value [3,4,5]. WPESs, facilitated by natural ecosystems through processes involving vegetation, microorganisms, and aquatic life, filters and removes pollutants such as nitrogen and phosphorus from water bodies, thereby contributing to both environmental quality and public health [6,7].
Rapid industrialization and urbanization, combined with pollution and the overexploitation of natural resources, severely threaten freshwater ecosystems and their capacity to deliver WPESs [8,9]. These ecosystems are also increasingly vulnerable to the effects of climate warming and drastic land use changes [10,11,12,13]. In response to these challenges, it is crucial to accurately assess the supply–demand dynamics of WPESs to mitigate ecological risks and promote sustainable regional development.
In recent decades, research on FES, particularly WPESs, has proliferated, particularly in Asia and Europe, where studies are concentrated [14]. Advanced methodologies, such as multi-criteria decision-making frameworks (e.g., AHP and TOPSIS) [3] and quantitative spatial models (e.g., SWAT, InVEST, ARIES, and VIC) [15,16,17], have been adopted to better quantify and evaluate FES supply–demand relationships [18]. Despite progress in these areas, many existing models and tools still exhibit limitations, particularly in their ability to fully capture the complexity of FES flows and the multi-scale spatial correlations involved [19,20,21].
A significant challenge in FES research is understanding the spatiotemporal dynamics that characterize the flow of ecosystem services. Ecosystem services supplied in one region are frequently consumed in another, highlighting the need for a deeper understanding of the demand flow across both space and time [22,23]. Innovative methods such as the SPANS algorithm [24] have been developed to optimize the match between ecosystem service supply and demand. However, the practical application of these methods in real-world settings remains limited, highlighting the need for further development and refinement [25].
Alongside the technical analysis of FES flows, there is increasing acknowledgment of the necessity of incorporating ecological compensation mechanisms into management strategies. Ecological compensation, commonly referred to as Payment for Ecosystem Services (PES), serves as a policy instrument designed to balance the costs and benefits linked to ecosystem protection by compensating stakeholders for their conservation efforts [26]. PES schemes play a critical role in aligning ecological protection efforts with economic incentives and facilitating ecosystem stewardship through both government- and market-driven approaches [27,28,29,30]. Broadly speaking, ecological compensation includes not only financial rewards for those who contribute to ecosystem protection, but also penalties for those responsible for environmental degradation [31,32]. While Western countries have developed sophisticated PES systems [33,34], China’s ecological compensation frameworks are still evolving and face challenges such as inconsistent policies and over-dependence on governmental interventions [35,36].
This study focuses on the Taihu Basin, seeking to investigate the multi-scale spatial correlations and service flows of WPESs at different sub-basin and county levels. By applying advanced quantitative methods and utilizing the SPANS algorithm, this study evaluates the supply–demand relationship for nitrogen and phosphorus purification and maps the flow paths of these services. This study aims to address existing gaps in the current research concerning the supply–demand dynamics of WPESs within the Taihu Basin, while also proposing more effective mechanisms for ecological compensation. Ultimately, this research aims to contribute to the optimal allocation of water resources in the basin, thereby promoting the achievement of ecological civilization and sustainability goals in the region, aligning with the broader objectives of sustainable development.

2. Materials and Methods
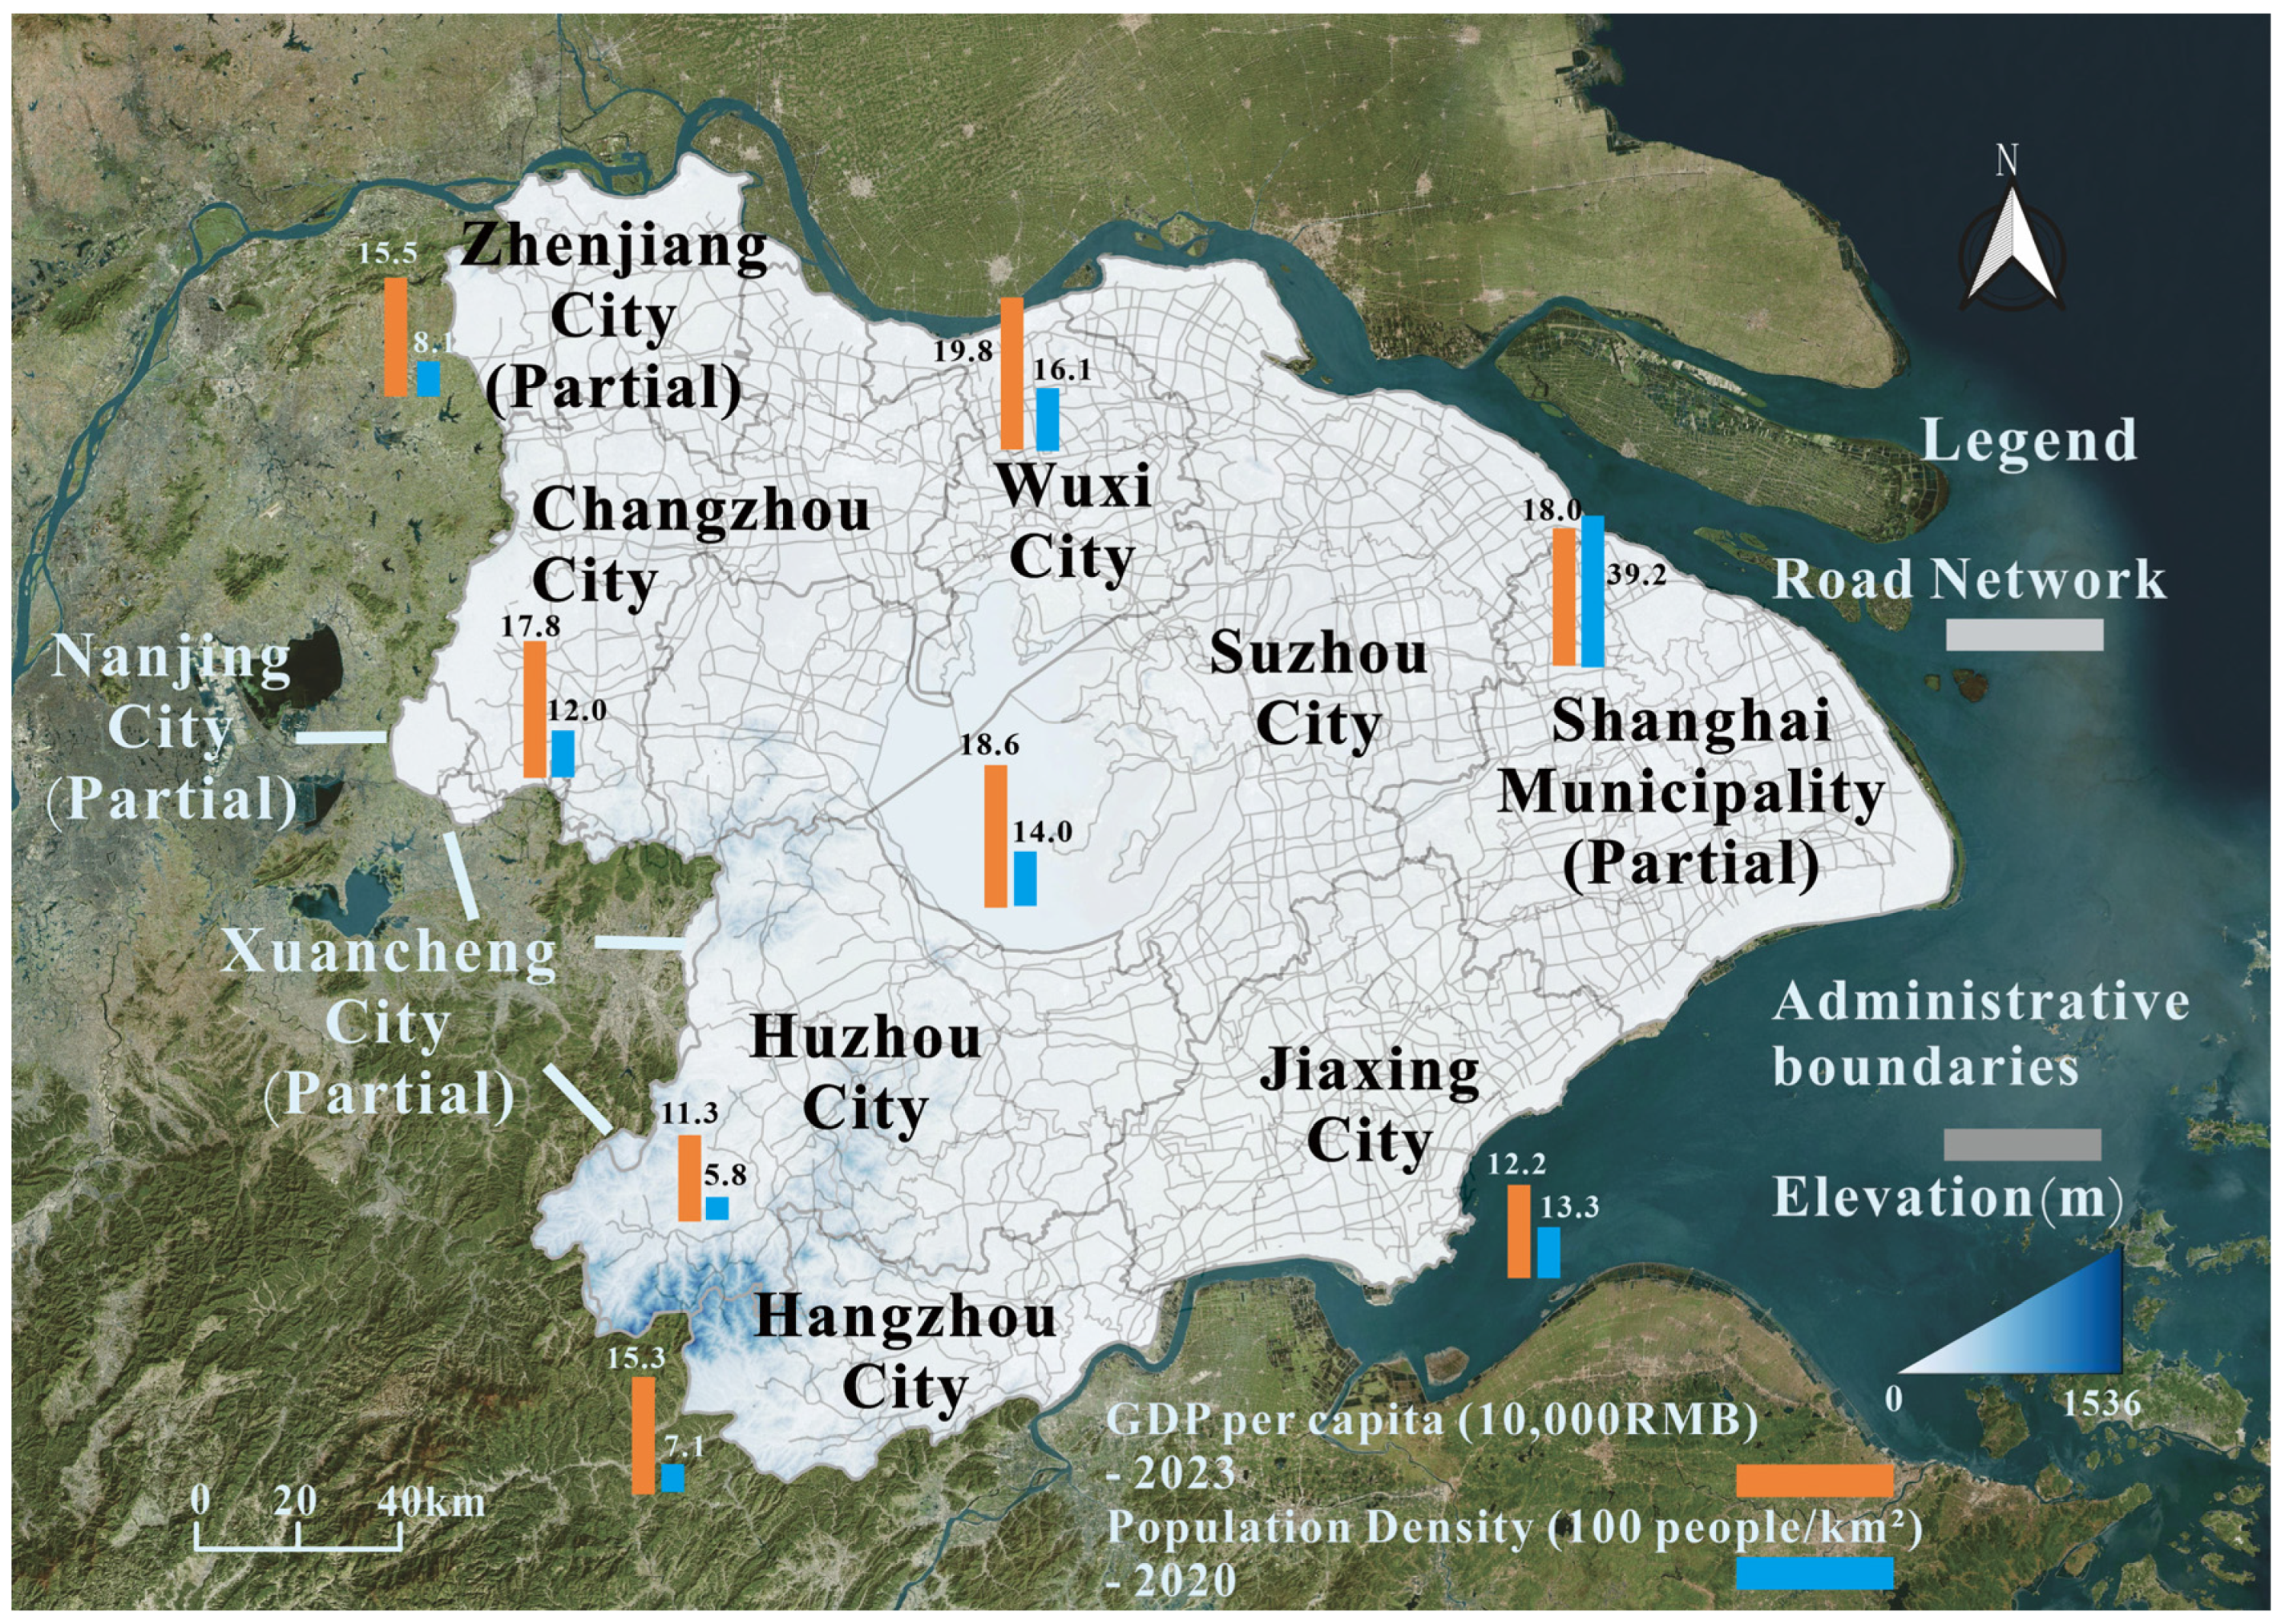
2.1. Study Area

Located in southeastern China on the southern edge of the Yangtze River Delta, Taihu Basin spans approximately 36,900 square kilometers (Figure 1). Within the basin, Jiangsu Province accounts for 53% of the area, Zhejiang Province (33.4%), and Shanghai (13.5%). Situated in the mid-latitude region, Taihu Basin falls within the humid northern subtropical climate zone, characterized by distinct seasons and ample precipitation. The average annual temperature of the basin ranges from 15 to 17 °C. Owing to variations in monsoon intensity, there is significant inter-annual variability in precipitation and uneven distribution throughout the year.
Taihu is the third largest freshwater lake in China and is located in a typical plain water network region. The lake is centered in the basin’s river network, featuring a dense system of rivers and channels. The lake itself is shallow, with a length of 68.5 km from north to south, a width of 34 km from east to west, an average depth of 1.9 m, and 224 connected river ports, with a total length of 120,000 km.
As the core area of the Yangtze River Delta, Taihu Basin is one of the most rapidly urbanizing, densely populated, and economically developed regions in China. As of 2022, the basin’s total population has reached 68.25 million, which constitutes 4.8% of the national population. Its regional GDP was 11.8173 trillion yuan, equivalent to 9.8% of the national GDP, while its per capita GDP stood at 173,000 yuan, which is 2.0 times higher than the national average. In the Taihu Basin, water for both production and daily life comes primarily from local supplies, with additional resources drawn from the Yangtze River. The region has abundant water resources because of its numerous river systems and ample precipitation. In 2022, surface water resources in the Taihu Basin amounted to 14.16 billion cubic meters, and groundwater resources were 4.20 billion cubic meters, totaling 15.71 billion cubic meters. Nevertheless, non-point source pollution continues to pose a significant concern, exacerbated by various factors, including precipitation over the years. With rapid economic development and population growth, pollutant emissions increase annually. Point source pollution, managed by advancements in urban wastewater control technologies, has been relatively well controlled. However, non-point source pollution remains a concern due to factors such as previous years’ precipitation. Despite the water resource richness of the basin, rapid economic development and population growth have led to increased pollutant emissions each year. Advancements in pollution control technologies, particularly those related to urban sewage systems, have partially alleviated point source pollution.

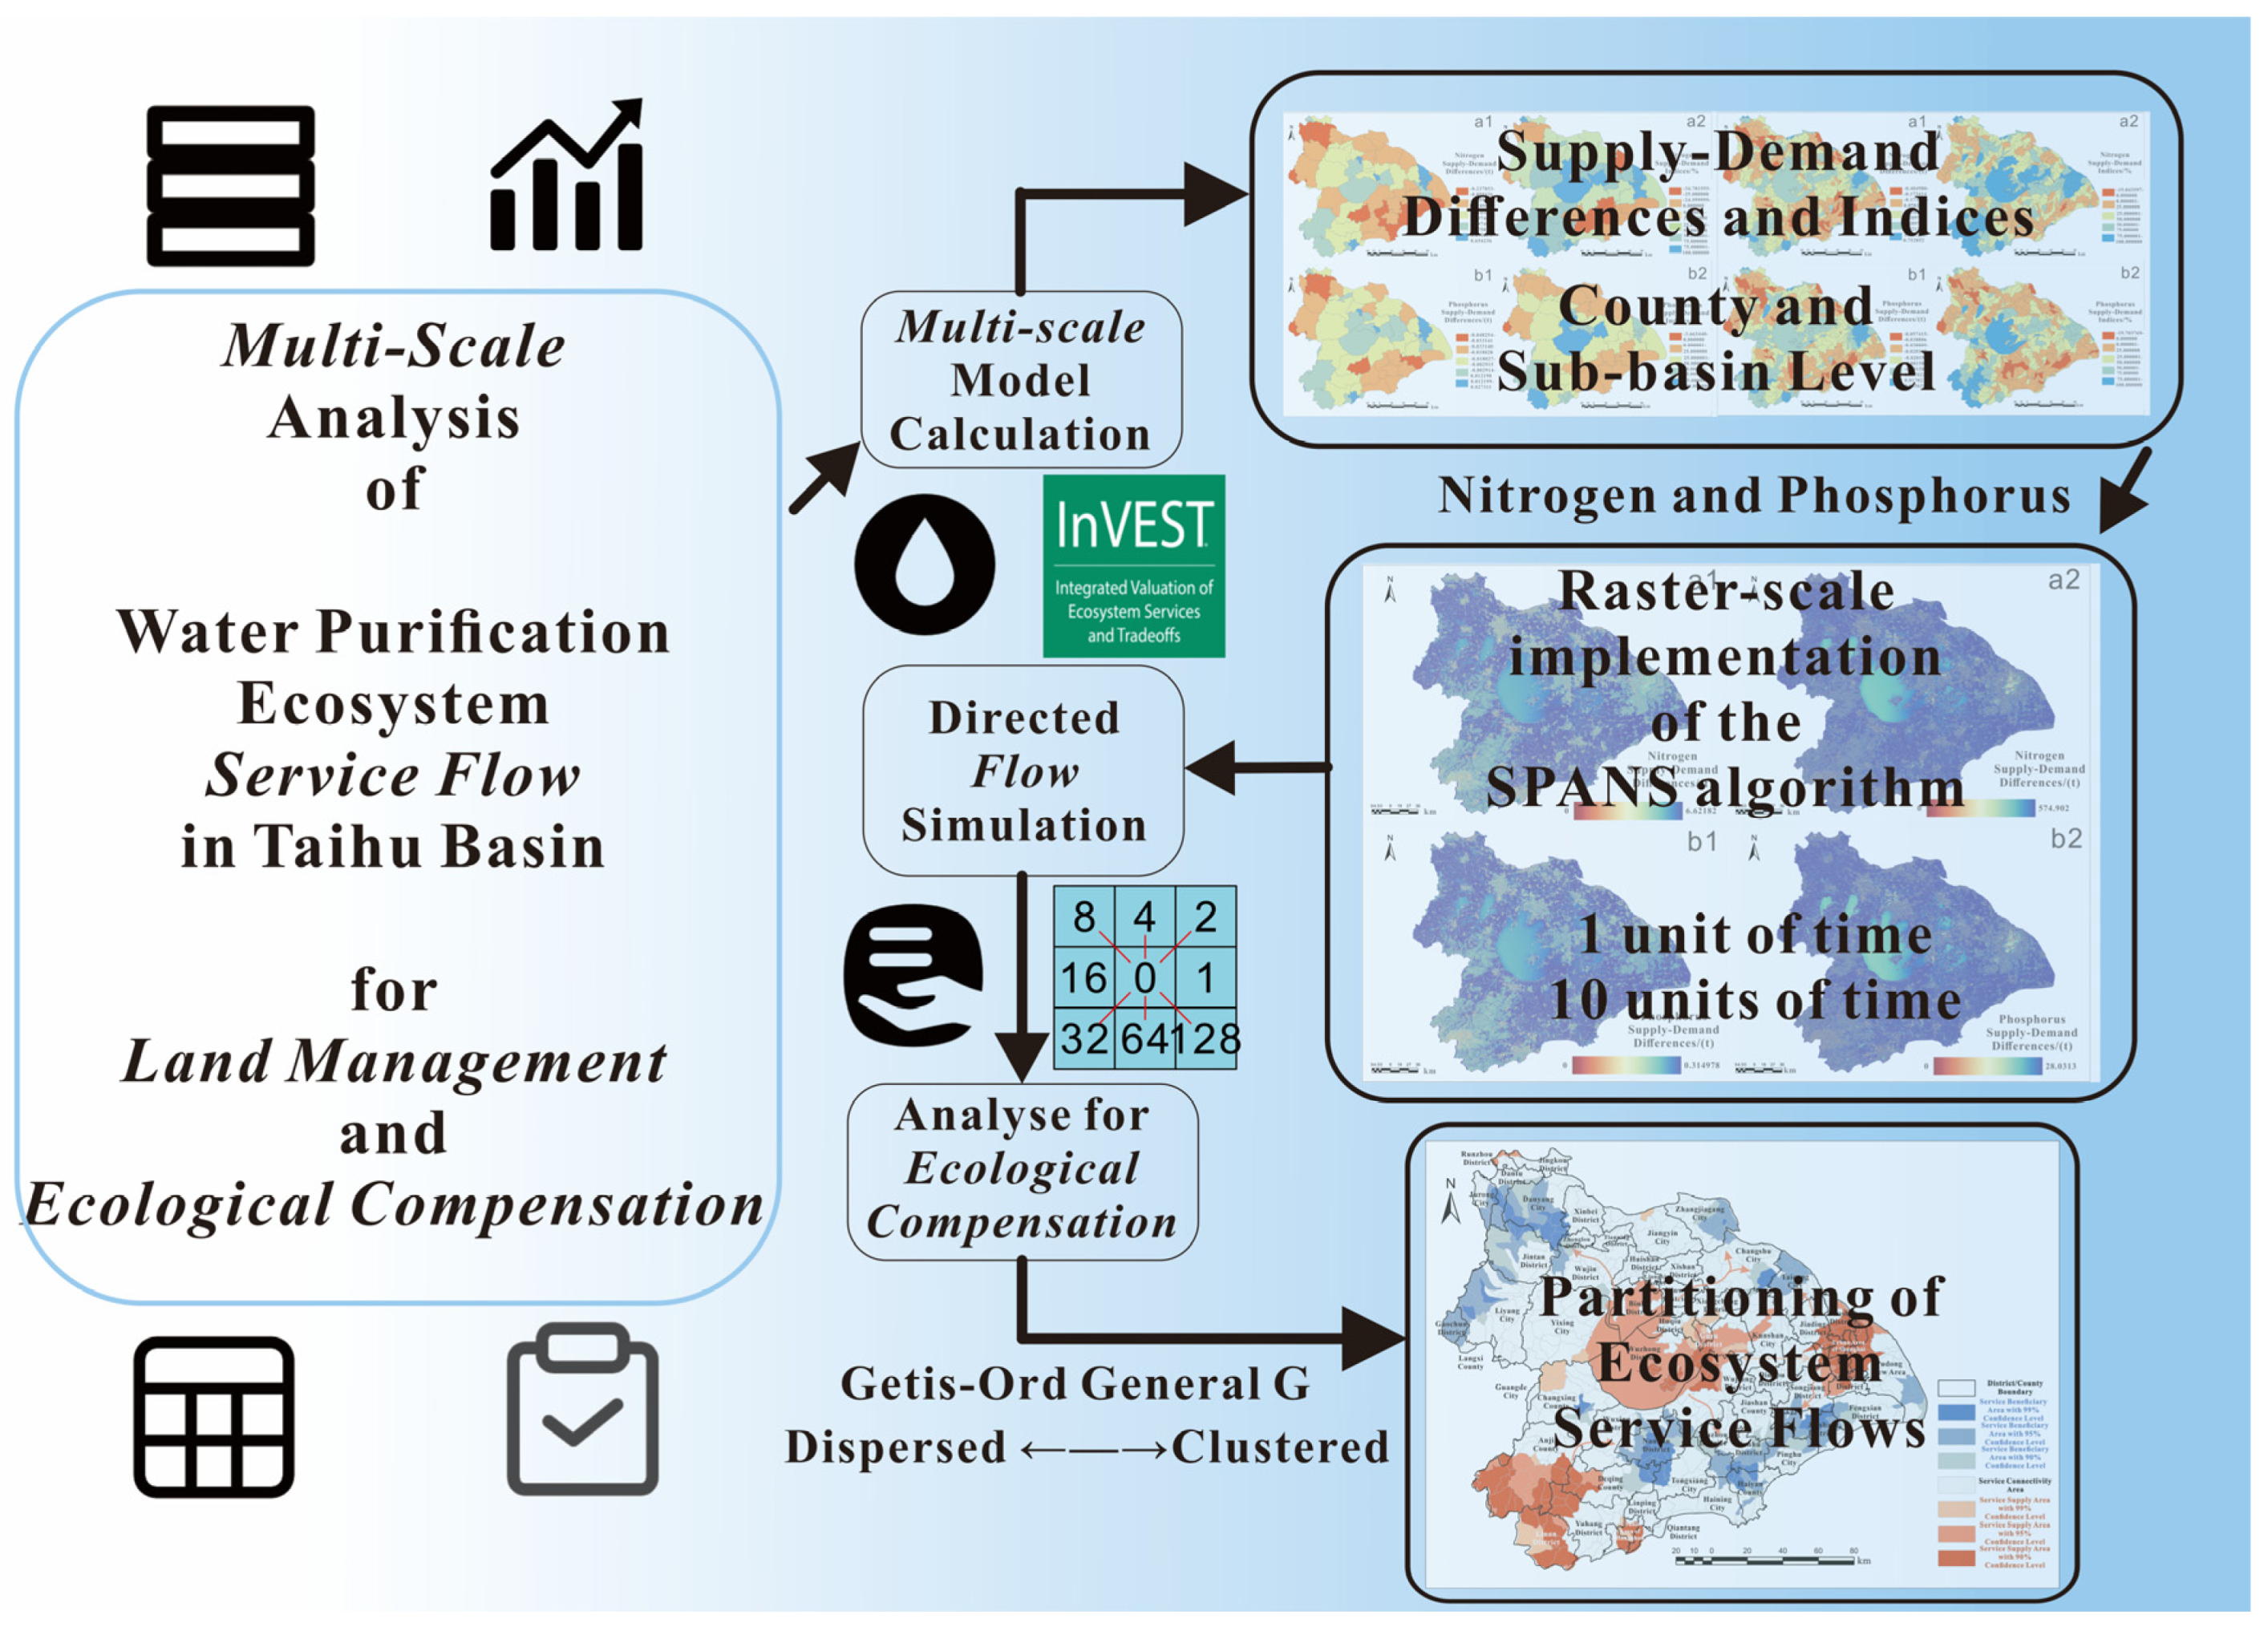
2.2. Multi-Step Ecosystem-Based Approach

The study adopts a multi-step approach (Figure 2):
Data acquisition and preparation encompass the systematic collection of relevant geographic information, followed by preprocessing with GIS platforms such as ArcGIS Pro 3.0 and QGIS 3.28.6 to ensure both data integrity and compatibility. The SPANS algorithm was then implemented using Python 3.10, to quantify ecosystem service flows.
To perform a quantitative assessment, the Annual Water Yield and Nutrient Delivery Ratio modules of the InVEST model were utilized to evaluate the supply and demand of WPESs at a spatial resolution of 30 m. GIS-driven analysis involves calculating key parameters, including demand, supply, supply–demand discrepancy, and their ratios, in compliance with regional regulations and standards.
Segmented statistical analysis was employed to investigate WPES supply and demand patterns across different administrative and ecological units, yielding a comprehensive understanding of the current status. Flow dynamics modeling integrates raster data within the SPANS algorithm, utilizing GIS methods to simulate WPES flows, and proposes ecological compensation mechanisms aligned with observed flow patterns.

2.3. Data Collection

In this study, we used various high-resolution geospatial datasets to perform hydrological and environmental analyses (Table 1). The data sources ranged from elevation and land use information to hydrological boundaries and soil properties, ensuring comprehensive input for evaluating the supply–demand dynamics of WPESs, as well as for understanding the spatial distribution of these services. Sub-watershed boundaries, essential for both hydrological analysis and water purification assessments, were derived from hydrologic analysis based on the China Tertiary Water System dataset, following the methods described in a previous study (Yu et al., 2022) [37]. To ensure alignment with hydrological and geographic conditions, the sub-watershed boundaries were adjusted through the Soil and Water Assessment Tool (SWAT) model using DEM and soil data, enhancing the accuracy of water flow and pollutant transport simulations.

2.4. Ecosystem Services Assessment

2.4.1. Supply and Demand of Water Purification Ecosystem Service

The InVEST Water Purification Model (NDR: Nutrient Delivery Ratio) operates on grid data, and is primarily used to simulate the sources of surface nutrients and their flow processes in surface runoff. The model establishes a supply–demand relationship based on the principle of mass balance, meaning that the total nutrient output is equal to the sum of the nutrients retained by vegetation/soil and those transported via surface or subsurface flow.
The amount of pollutants retained by each land use type, as output by the InVEST Water Purification Model, is considered the supply of water purification services (WPESs), denoted as Retention. This represents the capacity of the vegetation and soil within the basin to retain pollutants, highlighting its practical geographic significance in the demonstration area. The sum of the Retention and Export amounts on each grid cell output by the InVEST Water Purification Module was taken as the total pollution load in the demonstration area. The product of the allowable water pollution concentration in the demonstration area and the water resource volume (water yield) on each grid cell is considered the allowable pollutant discharge amount for that grid cell (according to the ‘Environmental Quality Standards for Surface Water GB3838-2002 [38], the Class III water quality standard limit is used as the allowable water pollution concentration in the demonstration area). The difference between the total pollution load and the allowable pollutant discharge amount represents the amount of pollutants that need to be retained by the vegetation and soil in the demonstration area, which is taken as the demand for WPESs, denoted as Export.
This approach has been validated in other studies that employ the InVEST model to quantify water purification services [39,40], which adopts a similar supply–demand framework, demonstrating the robustness and global applicability of this method in evaluating ecosystem services.
The spatial resolution used for the analysis was 30 m × 30 m, and the quantities of the WPES supply and demand are expressed in tons. The precision of the model outputs is maintained to five decimal places, meaning the results on each 30 m × 30 m grid cell are accurate up to 10−5 tons. This level of precision ensures detailed outputs suitable for fine-scale environmental assessments.
InVEST model outputs have been validated against results from the Event Mean Concentration (EMC) method, which is commonly used to estimate pollutant concentrations in surface runoff from different land uses during storm events [41]. Studies in various regions have employed EMC methods to verify the accuracy of InVEST model results, demonstrating a strong correlation between the two approaches [39,42]. Furthermore, a similar study conducted in the Taihu Basin applied EMC to evaluate non-point source pollution, suggesting that the InVEST model’s simulations of nitrogen and phosphorus in this region can serve as a useful reference and demonstrate a reasonable degree of reliability [43].

2.4.2. Matching Supply and Demand of Water Purification Ecosystem Service

The difference in the supply and demand ratio, R, was calculated using the following formula:
R = R e t e n t i o n E x p o r t
where R represents the index of the supply–demand difference for WPESs; Retention represents the amount of pollutants that can be retained, that is, the supply of WPESs; and Export represents the amount of pollutants exported, which need to be retained, that is, the demand for WPESs. R < 0 indicates a supply–demand deficit, meaning the water quality does not meet the standard; R = 0 indicates a balance between supply and demand; and R > 0 indicates a surplus in supply and demand, meaning that the water quality meets the standard.
Based on the ‘supply–demand difference’, the quantitative relationship and spatial distribution of the supply–demand balance of WPESs in the demonstration area in 2020 are analyzed at different spatial scales (sub-basins, grids).
If the water quality does not meet the standard, that is, if there is a supply–demand deficit (R < 0), the degree of non-compliance with water quality standards in the area can be calculated using the following formula:
S u b s t a n d a r d = E x p o r t R e t e n t i o n E x p o r t × 100 %
where Substandard represents the degree of non-compliance with water quality standards in the area; Retention represents the amount of pollutants that can be retained, that is, the supply of WPESs; and Export represents the amount of pollutants exported, which need to be retained, that is, the demand for WPESs. A higher Substandard value indicates poorer water quality in the area and a greater need for water quality control.
If the water quality meets the standard, that is, if there is a surplus in supply and demand (R > 0), the degree of compliance with water quality standards in the area can be calculated using the following formula:
S t a n d a r d = R e t e n t i o n E x p o r t R e t e n t i o n × 100 %
where Standard represents the degree of compliance with water quality standards in the area; Retention represents the amount of pollutants that can be retained, that is, the supply of WPESs; and Export represents the amount of pollutants exported, which need to be retained, that is, the demand for WPESs. A higher Standard value indicates better water quality in the area.
For ease of presentation and distinction, for grid cells with a negative supply–demand difference, the calculated percentage is multiplied by (−1) to obtain a negative value. This means that a percentage value closer to 100% indicates better water quality compliance, whereas a percentage value closer to −100% indicates poorer water quality compliance.

2.4.3. Flow of Water Purification Service

After conducting a quantitative analysis of the supply and demand of WPESs in freshwater ecosystems, the spatiotemporal dynamic analysis of ecosystem service flows (ESF) for these services presents a new challenge. This study utilized the SPANS algorithm [24] implemented at the grid scale. Because the direction of WPES flow is largely influenced by hydrological processes, the traditional D8 algorithm from ArcGIS hydrological analysis was utilized to derive flow directions at each grid cell, which allows for eight possible flow directions. This ensured that the WPES followed realistic water-flow pathways in the study area.
The SPANS algorithm, executed in Python using libraries such as Rasterio, accommodates both free and directed flow patterns. The flow simulation occurs in iterative units of time, with each iteration representing one unit of the WPES flow. During each time unit, the WPES flows from one grid cell to one of its eight neighboring cells based on the defined flow directions. In this approach, we assume that the WPES begins to flow simultaneously across all the grid cells. One unit of time corresponds to the WPES moving from one cell to an adjacent cell in a defined direction. The number of iterations specifies the total time span over which the WPES flow is analyzed, and the results are saved in new .tif grid files.
The main steps in the SPANS implementation are as follows: (1) define the flow direction offsets: a dictionary specifies the eight flow directions based on the flow direction data obtained from GIS processing; (2) utilize rasterio to read the supply and demand grid data and flow direction data; (3) initialize a result matrix to track flow directions and the supply–demand status of each pixel during each iteration; (4) perform iterative calculations, adjusting the pixel values according to flow directions at each time step; (5) output the flow results and save them as new .tif grid files.
This approach ensures that the WPES flow is consistent with the underlying hydrological flow of the region and accurately reflects how ecosystem services propagate through the landscape.
For free flow, during each iteration, the difference between each surplus pixel and its eight adjacent pixels is calculated. The direction with the largest difference is selected as the flow direction, and the matrix is updated accordingly, while the remaining directions remain unchanged.

3. Results

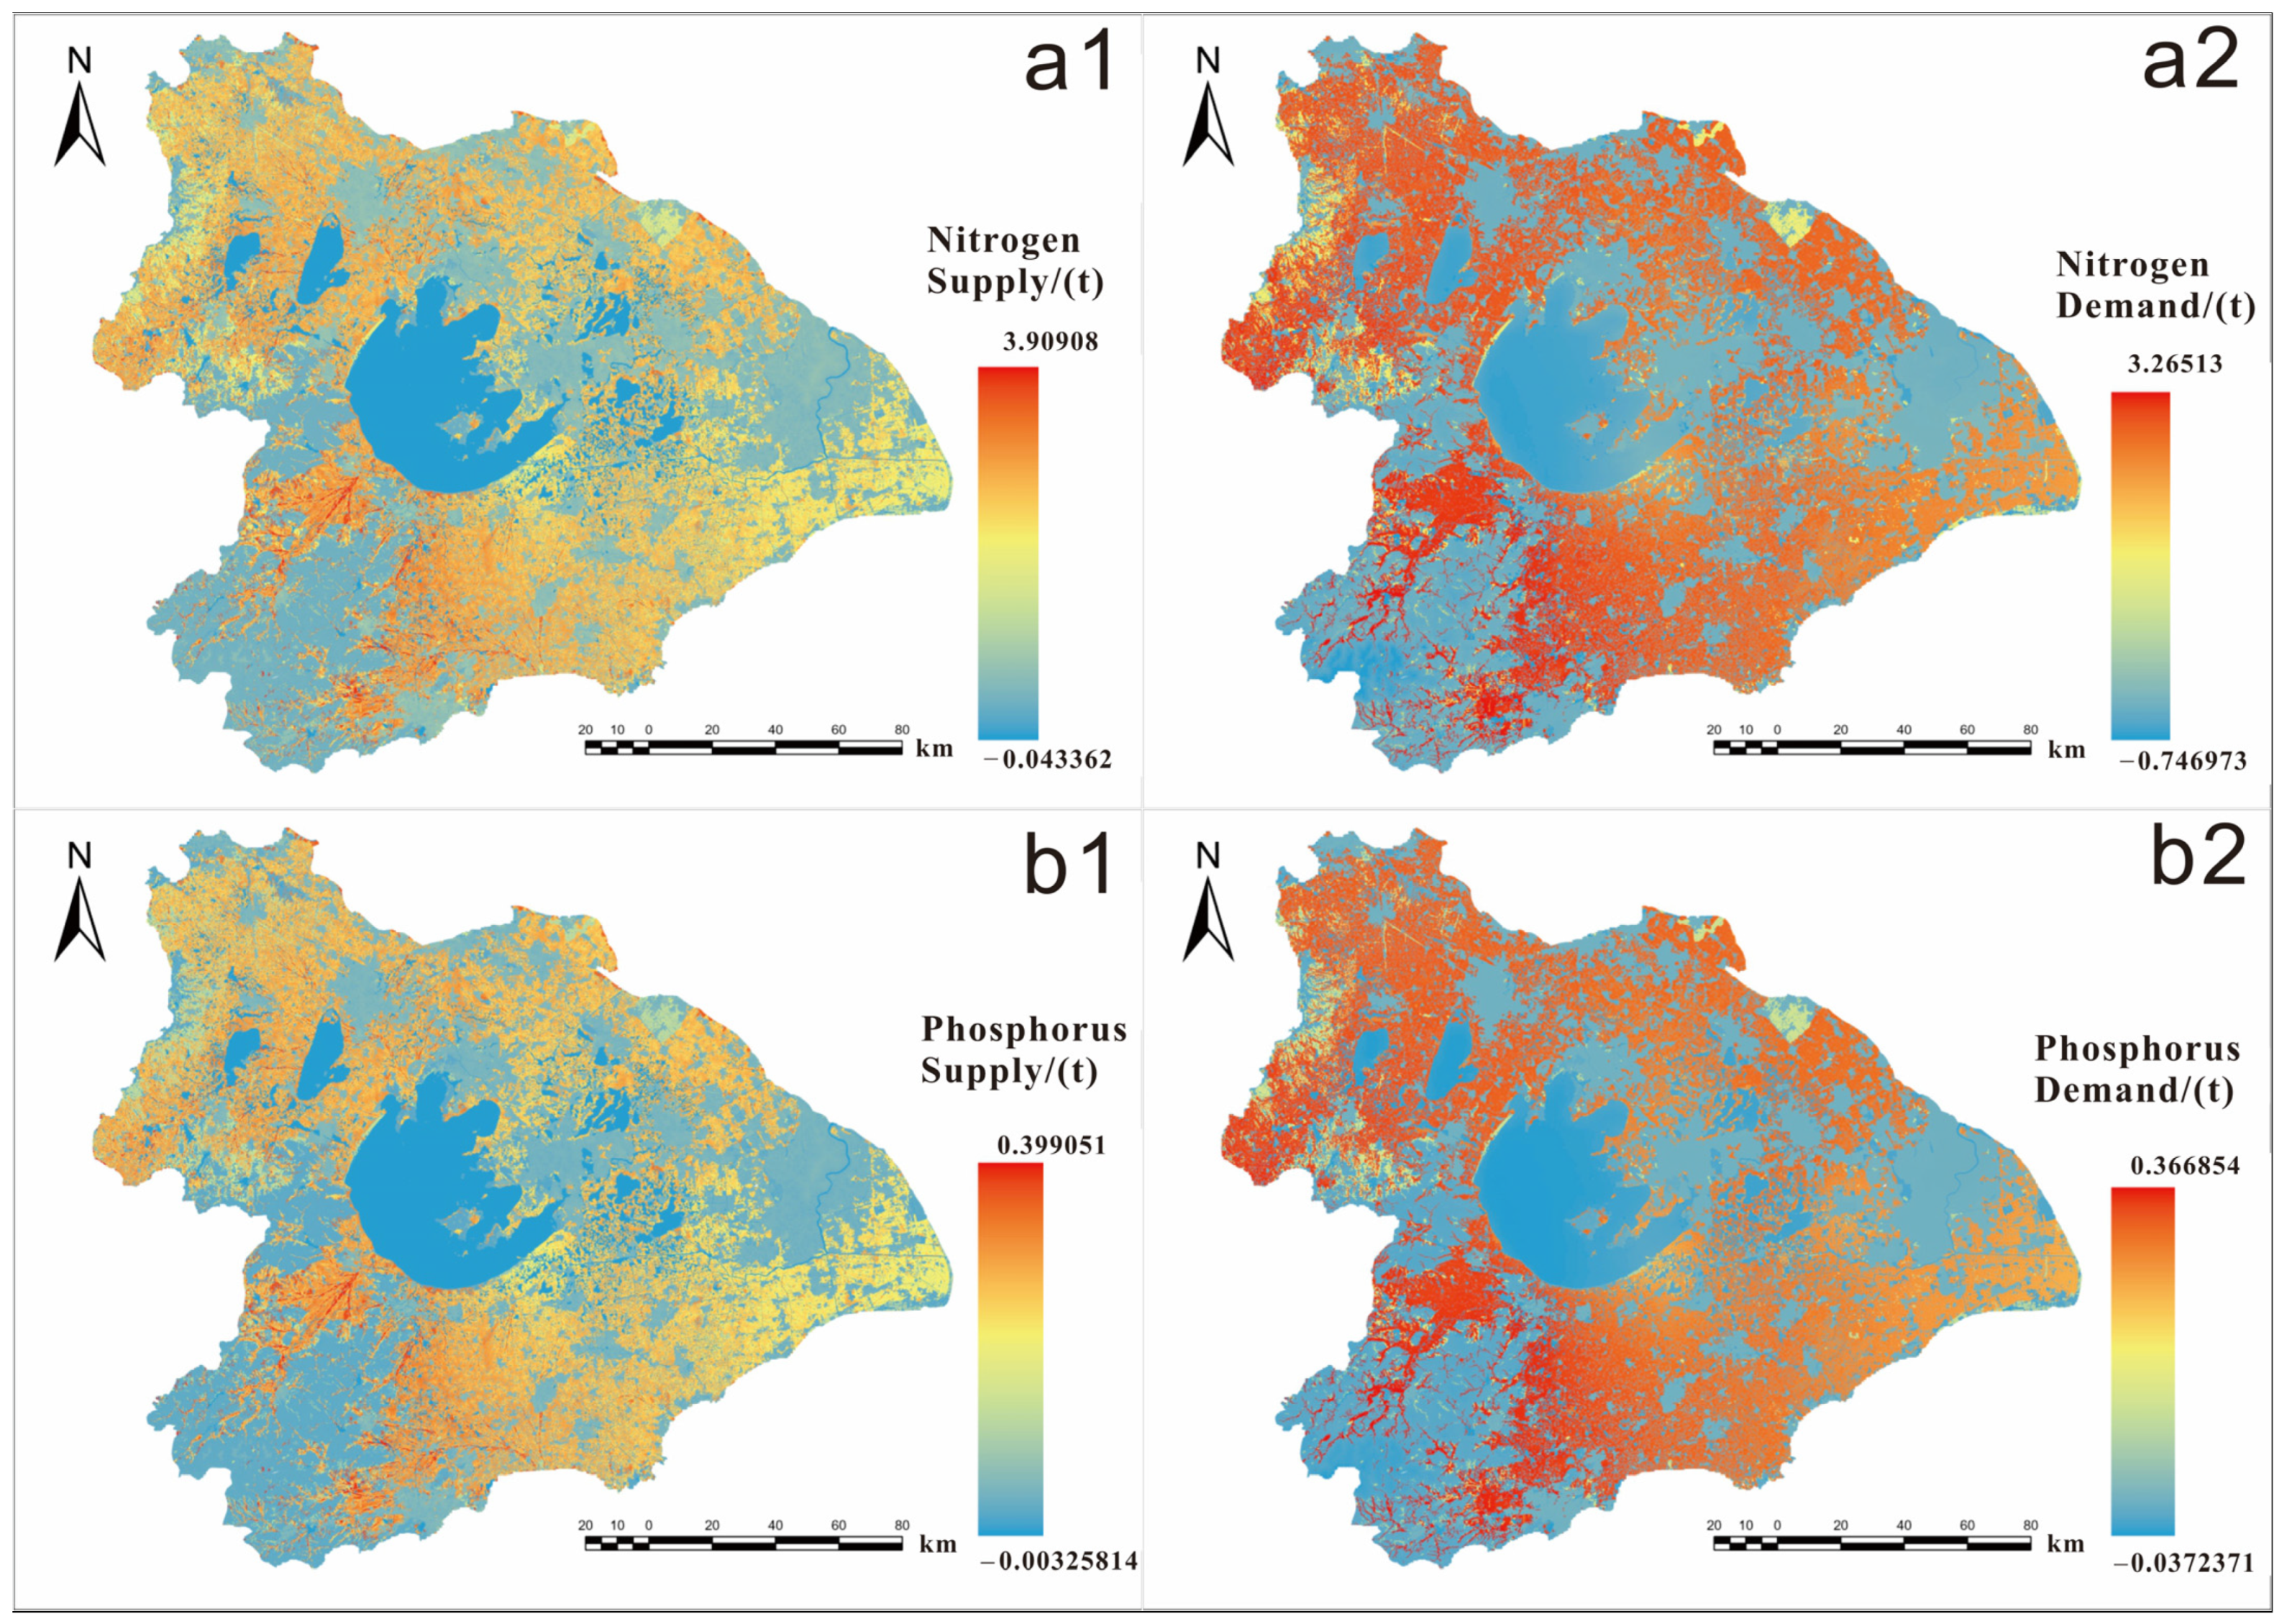
3.1. An Analysis of Supply and Demand at the Basin Scale

In the Taihu Basin, the total output of nitrogen and phosphorus has been decreasing annually, leading to a reduced demand for WPESs; however, the supply has also gradually diminished. The reduction rate for nitrogen was relatively slow, while phosphorus levels fluctuated. In 2020, the nitrogen supply–demand ratio was 110.9%, indicating a stable and favorable situation. Conversely, the phosphorus supply–demand ratio was 90.7%, below 100%, reflecting a deficit where demand exceeds supply, necessitating attention to water quality issues (see Figure 3, Table 2 and Table 3).
To provide a historical context, nitrogen and phosphorus supply–demand data from 1995, 2005, and 2015 were incorporated from previous studies (Liu 2019) [44]. These years were selected to illustrate the long-term trends in water purification services in the Taihu Basin, as they offer consistent and comprehensive data. Ecological and socioeconomic data related to the basin are published at varying intervals, typically every five or ten years. Data prior to 2010 were more difficult to obtain in a standardized form, while data from 2010 onwards were published more consistently and regularly. As a result, the period between 2000 and 2010 lacks the necessary consistent data for a thorough analysis. Therefore, the primary focus is on 2020, which provides a comprehensive dataset for detailed analysis using the latest high-resolution data.
Spatially, the southwestern hilly areas of the basin and regions near the lake exhibit low supply and demand. The northern and southeastern parts of the basin display higher levels of both supply and demand, with particularly pronounced demand. In areas with high urbanization rates, the nitrogen supply was relatively high, whereas other indicators were generally low. Consequently, the water quality in areas near the lake, the southwestern part of the basin, and the urban districts of Shanghai and Suzhou was relatively good.

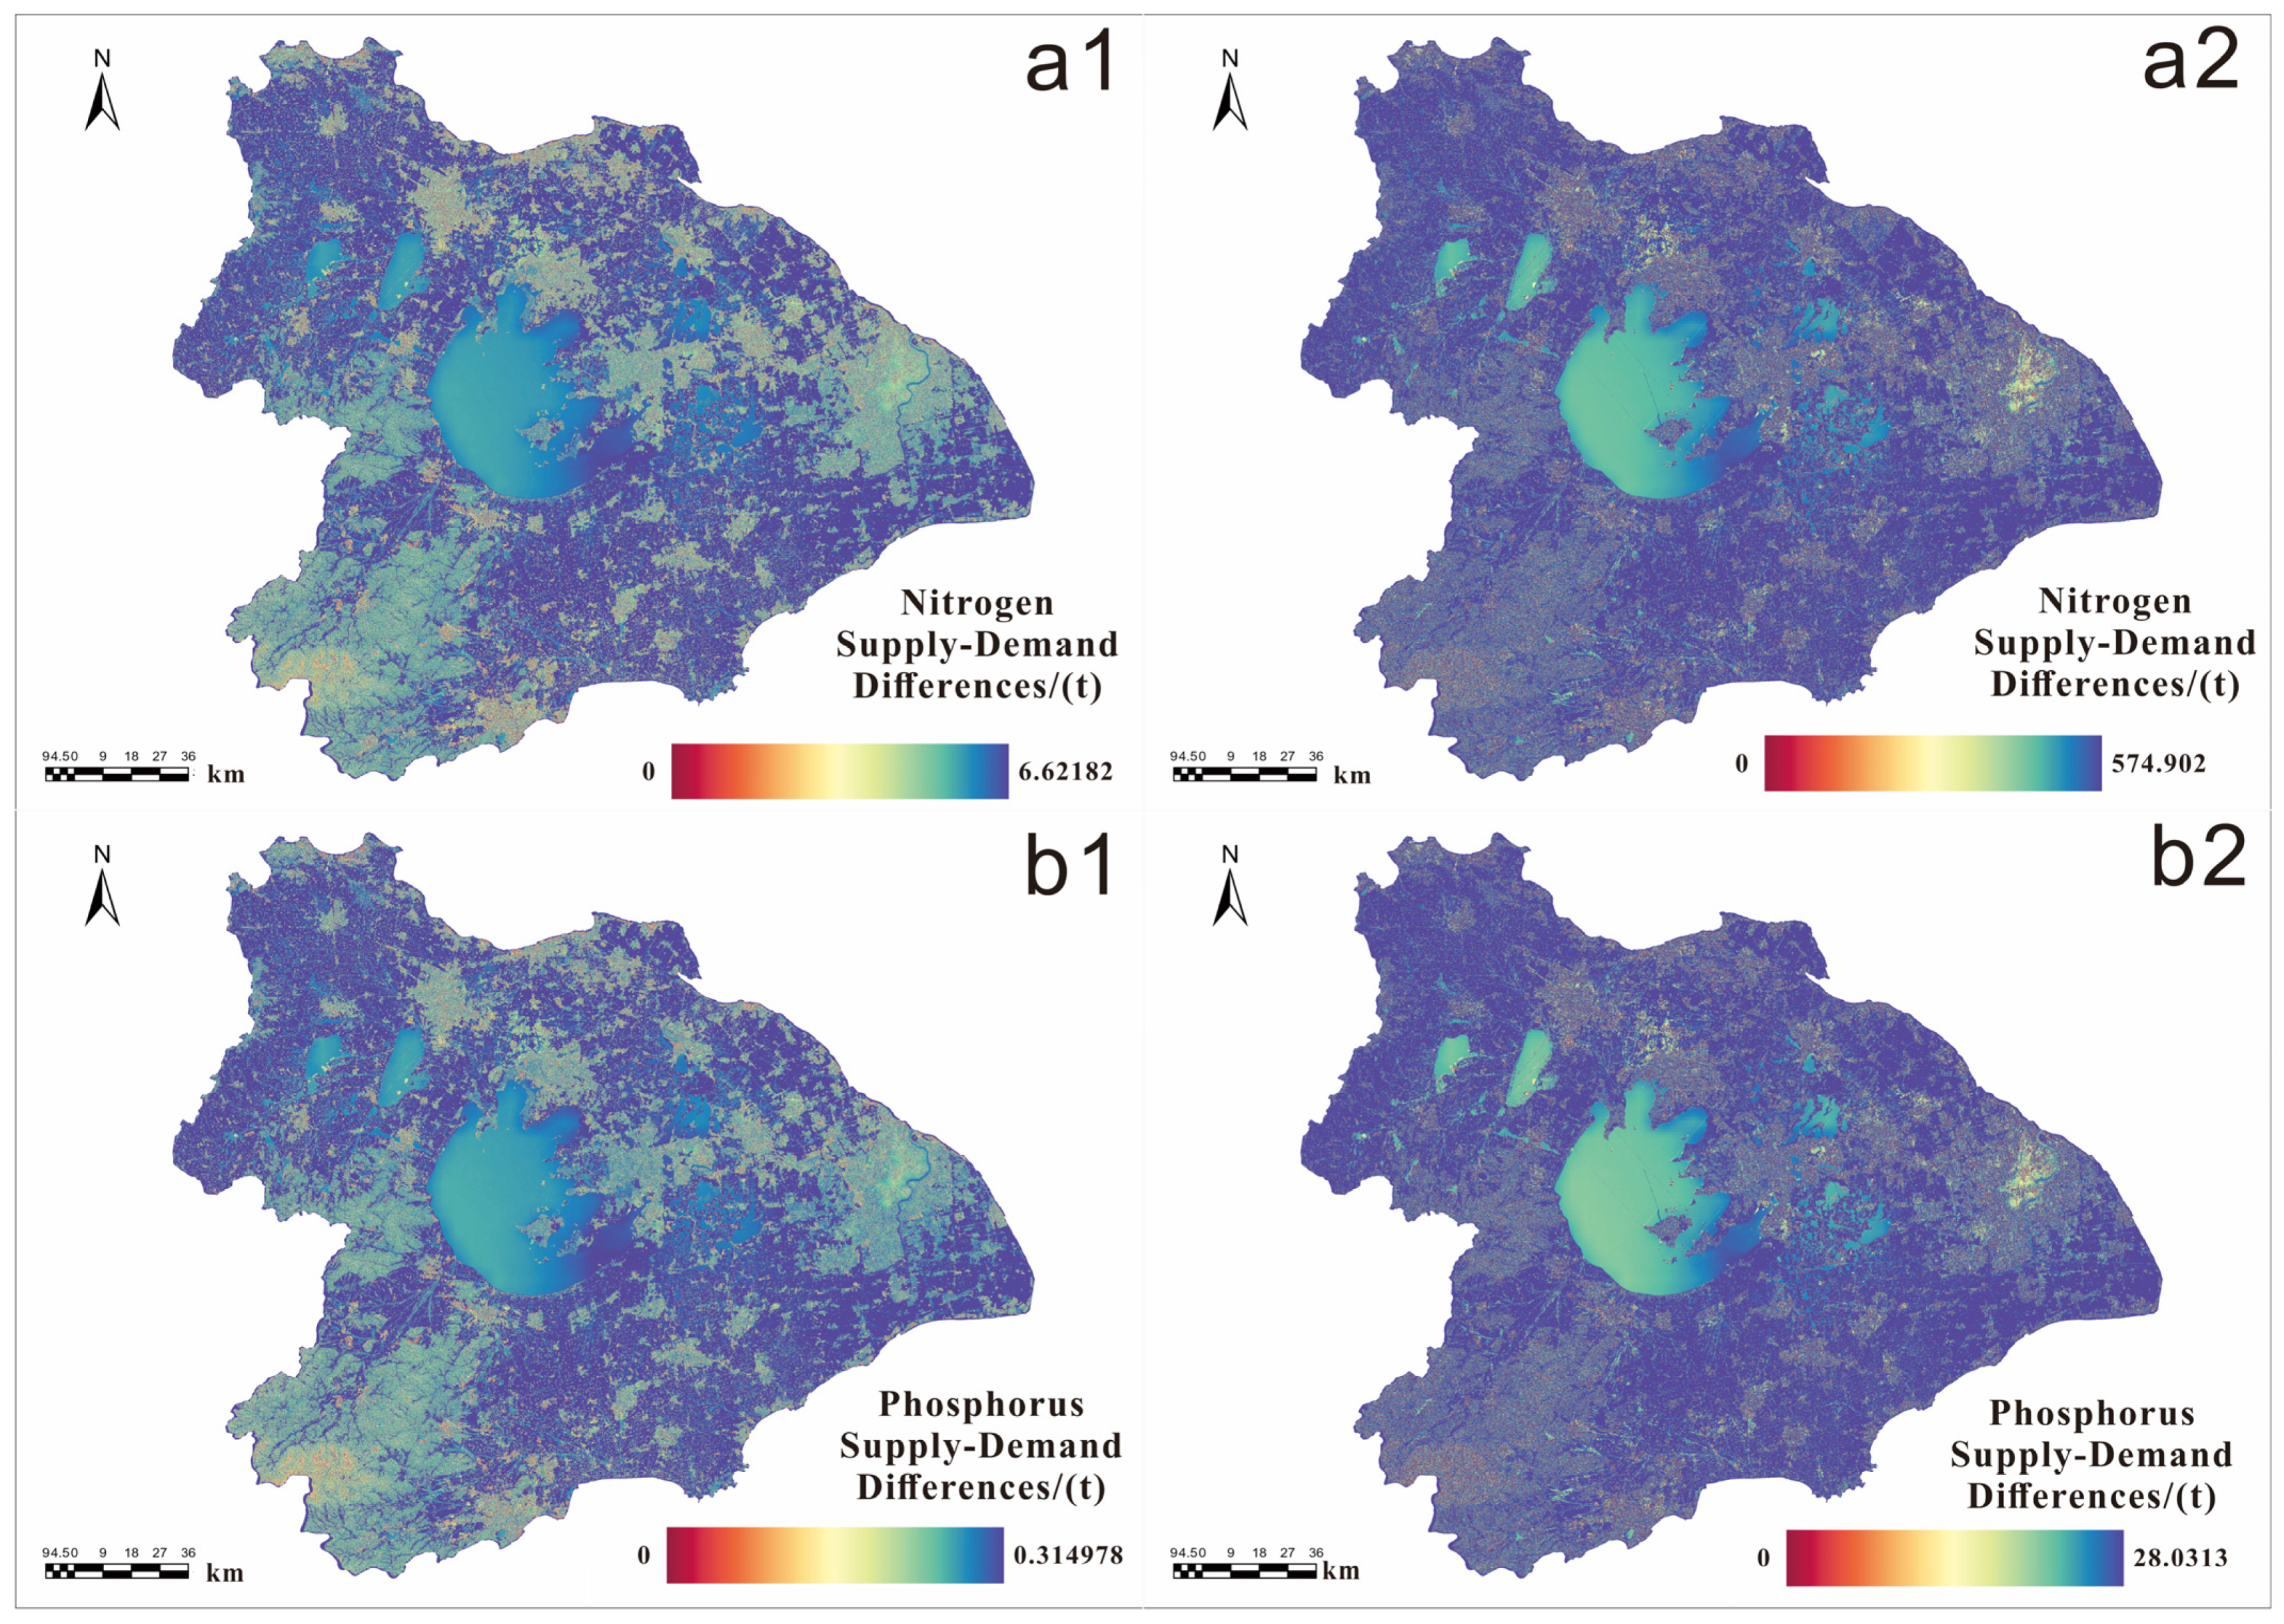
3.2. An Analysis of Supply and Demand at the County Level

Among the 65 counties, 15 (23.1%) exhibited a deficit in nitrogen WPESs and failed to meet water quality standards, with Jiaxing County showing the most severe noncompliance index of 35.8%. Seventeen counties had water quality compliance rates between 25% and 50%, 15 between 50% and 75%, and 18 exceeding 75%.
Regarding phosphorus, 43 counties (66.2%) showed a supply–demand deficit, with most having an average supply–demand difference of approximately 0.001 tons. Twenty-two counties had a water quality compliance rate between 0% and 25%, 21 between 25% and 50%, 17 between 50% and 75%, and 4 exceeding 75% (see Figure 4).

3.3. Spatial Analysis of Supply and Demand in Sub-Basins

Supply and Demand Relationships in Different Sub-Basins

Among the 528 sub-basins, 197 (37.3%) showed a deficit in nitrogen WPESs, and four (0.8%) had a negative supply–demand index, with the most severe non-compliance rate exceeding 15%. The nitrogen water quality compliance rate was between 0% and 25% in 140 sub-basins, between 25% and 50% in 169 sub-basins, between 50% and 75% in 105 sub-basins, and over 75% in 110 sub-basins. In sub-basins where the nitrogen supply–demand difference is negative, most deficits are small, but stricter nitrogen water quality standards necessitate further improvement.
For phosphorus, 378 sub-basins (71.6%) exhibited a supply–demand deficit, and 41 (7.8%) had a negative supply–demand index, with the most severe non-compliance rate reaching 19.7%. The phosphorus water quality compliance rate was between 0% and 25% in 201 sub-basins, between 25% and 50% in 150 sub-basins, between 50% and 75% in 87 sub-basins, and over 75% in 49 sub-basins. Many sub-basins are near the equilibrium point under the phosphorus purification service standard of 0.05 g/m3, indicating that, given the stringent phosphorus water quality standards, most sub-basins maintain a fragile balance in their WPES (see Figure 5).

3.4. Water Purification Service Flows and Ecological Compensation Mechanisms

The results derived from nitrogen and phosphorus flows at different unit times (see Figure 6) indicate that after one unit time of flow, where water purification ecosystem services (WPESs) flow from one grid cell to one of its eight neighboring cells based on hydrological flow directions, the deficit pixels for WPESs essentially disappear with no significant change in spatial distribution. This one-unit time represents the simultaneous flow initiation of the WPESs across all grid cells, with each flow iteration corresponding to movement to adjacent cells. After ten unit times of flow, which allows WPESs to propagate further across the landscape, the spatial distribution shows a further concentration towards the original surplus areas, particularly in urban centers.
Although the phosphorus-deficit areas essentially disappear after one unit time of flow, the surplus remains fragile. The supply–demand situation approaches the nitrogen level only after ten unit times of flow, with no surplus concentration, except in the southwestern part of the Taihu Basin and downtown Shanghai.
Based on the multi-scale results of water purification service supply–demand, the general flow direction and different spatial units can be identified (see Figure 7). The Taihu Basin has three main supply areas for WPESs: (1) the southwestern hilly regions (Anji, Deqing, Lin’an, etc.); (2) central urban areas and some suburbs of Shanghai; and (3) the lake and areas to the north and east (such as Suzhou and Wuxi urban areas). Correspondingly, there are three main beneficiary areas: (1) the northwest region (from Nanjing Gaochun to Zhenjiang, Changzhou, etc.); (2) the southeast region (from Huzhou to Shanghai Jinshan, Fengxian), forming an east–west axis; and (3) the northeast region (Zhangjiagang, Changshu, Taicang, etc.).
Based on the analysis of different spatial units of WPESs in the Taihu Basin, the primary flow directions of services within the basin can be clarified by matching supply and beneficiary areas, and the key areas within the existing service connections can be further identified.
The directions of service flows in the Taihu Basin are as follows: (see Figure 7) (1) from the southwestern hilly supply area to the northeast, with a single flow direction from west to east (from Changxing and Nanxun to the central and southern parts of the Taihu Basin); (2) in the Shanghai urban area, there is a flow westward towards the northwest (towards Taicang and Changshu) and a southwest flow (from Fengxian to Pinghu and Jiashan in Jiaxing City) from east to west; (3) Taihu flows northwest (towards Zhenjiang and Changzhou), southeast (towards Jiaxing), and northeast (towards Zhangjiagang), with the northwest direction being the only service flow supplying the beneficiary area of Danyang and Jurong, and the southeast direction mainly supplies the central part of the beneficiary area, Xiuzhou and Nanhu.
From this perspective, the service connection areas that need to be strengthened in terms of ecological management are as follows: (1) the Kunshan, Qingpu, and Jiashan regions, located between the two major supply areas and connected on both sides to the two major beneficiary areas of Jiashan, Songjiang, Taicang, and Changshu, currently recognized as a demonstration area for integrated ecological and green development in the Yangtze River Delta; and (2) the Huzhou Changxing and Wuxing areas, which connect the two major supply areas of the southwestern hills and the lake. In the short term, they can supply severely deficient beneficiary areas, such as Nanxun and Tongxiang, and in the long term, they may alleviate deficits in areas such as Danyang.
Building on this, an ecological compensation mechanism can be adopted, where compensation responsibilities are determined based on both the quantity and quality of water purification services. Compensation was calculated by defining the supply and demand relationships through the flow of the WPES. Areas characterized by high pollution loads that depend on upstream WPESs were identified as responsible parties because of their non-compliance with water quality standards. Conversely, regions that significantly contribute to pollution reduction services are classified as supply zones.
The total ecological compensation funding available within the watershed was distributed according to the relative water demand and supply of each county. Counties exhibiting a higher water demand relative to the total demand of the watershed are obligated to contribute a greater share of compensation. Conversely, counties that play a significant role in providing water purification services receive financial support proportional to their capacity for water supply.
This approach ensures that counties dependent on external water purification ecosystem services shoulder a larger portion of compensation costs, while those that substantially enhance water quality are incentivized through financial support. By dynamically adjusting these relationships in response to changes in land use and water quality requirements, ecological compensation mechanisms can effectively promote regional cooperation in ecological management.

4. Discussion

In the context of applying an ecosystem-based approach to the Taihu Basin, the southwestern regions, characterized by low urbanization levels, minimal pollution sources, and strong self-purification capacities, demonstrated a surplus of Water Purification Ecosystem Services (WPESs) for nitrogen and phosphorus, resulting in relatively good water quality. Conversely, the northern and southeastern areas, marked by moderate urbanization and industrial concentration, face significant pollution loads and considerable WPES demand, resulting in low water quality compliance rates. Many sub-basins in these regions report nitrogen and phosphorus compliance levels ranging from 0 to 25%, with only a handful exceeding 50%; phosphorus deficits are particularly notable. However, in key urban centers, such as Shanghai and Suzhou, water quality compliance rates remain high despite significant pollution owing to advanced wastewater treatment technologies and industrial relocation. This highlights the importance of an ecosystem-based approach that considers multi-scale analysis, as county-level assessments offer management convenience, while sub-basin analyses depict the spatial distribution of WPES supply and demand more precisely.
Considering the marked regional disparities and multi-scale dynamics of WPES supply and demand flows, it is essential to incorporate dynamic changes and interregional movements of ecological services into the design of compensation policies. Regional differences play a pivotal role in shaping compensation policies [45,46], particularly in addressing imbalances between high supply in the southwest and high demand in urban and agricultural zones through refined management and differentiated compensation mechanisms. As land use changes, especially with the decline of agricultural land and rapid urbanization, the WPES supply–demand relationship requires dynamic adjustments [47,48,49]. Thus, incorporating a multi-scale analysis framework into ecological compensation, leveraging the dynamic monitoring of supply and demand shifts, ensures that policies remain timely and responsive to ecological service changes and maintain their efficacy.
To achieve this goal, it is recommended to establish a dynamic adjustment mechanism that periodically revises compensation standards in response to basin-wide changes in water quality purification services, thereby ensuring policy flexibility and adaptability [37,50]. Implementing differentiated compensation policies for various counties is also crucial, incentivizing local governments and stakeholders to engage in ecological protection [51,52]. Underdeveloped non-urban core areas should receive higher compensation, whereas areas with high water purification demands should ensure that ecological needs are met. Economically developed regions such as Shanghai and Suzhou should bear greater political and economic responsibilities. Furthermore, a cross-regional compensation cooperation mechanism should be established to delineate each region’s responsibilities and rights in ecological protection [53], encompassing aspects such as information sharing and fund management, harmonizing basin resource allocation, and enhancing overall policy effectiveness.
This study provides an initial exploration of WPES supply and demand in the Taihu Basin, and examines their application in ecological compensation through an ecosystem-based approach. Future research should deepen the understanding of spatial heterogeneity and temporal dynamics in supply and demand flows, and integrate these insights into ecological compensation policy formulation. Employing remote sensing data for real-time monitoring of supply and demand fluctuations, along with analyzing the relationships between WPESs, urbanization, and land use changes, can reveal the impacts of these activities on the balance of ecosystem service supply and demand [54,55,56]. Combining multivariate self-organizing mapping techniques with spatiotemporal analysis to simulate the dynamic impacts of urbanization processes will provide comprehensive scientific support for ecological compensation policies [57,58,59], ensuring their effectiveness and sustainability within an ecosystem-based framework.

5. Conclusions

This study employed an ecosystem-based approach and conducted a comprehensive multiscale analysis of the spatial relationships and service flows of water quality purification ecosystem services in the Taihu Basin. This holistic examination not only explored the application and optimization of ecological compensation mechanisms but also emphasized the interconnectedness of various scales and components within the system. Through detailed scrutiny of nitrogen and phosphorus water quality purification service supply and demand relationships at diverse scales, significant spatial heterogeneity was evident, highlighting the necessity to consider both basin- and sub-basin-scale dynamics. Specifically, in the southwestern part of the basin and areas around the lake, a relative balance between supply and demand with high water quality compliance rates was observed, whereas urban non-central regions of the northern and southeastern parts of the basin exhibited severe supply–demand deficits.
These findings underscore the critical role of ecological compensation mechanisms in ensuring the sustainability of regional water quality purification services. However, they also reveal that current ecological compensation policies need further refinement, especially when considering the complexity introduced by spatial heterogeneity and dynamic changes in multiscale supply and demand flows. An ecosystem-based approach emphasizes the importance of understanding these interdependencies and their implications in policy formulation.
Future research should deepen the understanding of the intricate relationships between urbanization processes, land use changes, and water quality purification services within the framework of an ecosystem-based approach. By integrating these insights into the formulation of ecological compensation policies, it will be possible to contribute to achieving ecological environmental protection and sustainable development goals in the Taihu Basin and Yangtze River Delta region. This systems-oriented perspective fosters a more comprehensive and integrated approach for managing and protecting water quality purification ecosystem services.

Author Contributions

Conceptualization, W.C.; methodology, H.C.; formal analysis, W.C.; investigation, H.C.; writing—original draft preparation, writing—review and editing, W.C.; supervision, W.C.; project administration, W.C.; funding acquisition, W.C. All authors have read and agreed to the published version of the manuscript.

Funding

This research was funded by the National Natural Science Foundation of China (Grant No. 72104232) and ‘Research on Renaturalization and Enhancement of Ecological Value in Rural and Suburban Areas of Shanghai Based on BEC Multidimensional Methods’, a soft science research project (Grant No. 24692116500) under the 2024 ‘Science and Technology Innovation Action Plan’ of Shanghai.

Data Availability Statement

The data are contained within the article.

Conflicts of Interest

The authors declare no conflicts of interest.

References

  1. Costanza, R.; d’Arge, R.; De Groot, R.; Farber, S.; Grasso, M.; Hannon, B.; Limburg, K.; Naeem, S.; O’neill, R.V.; Paruelo, J. The value of the world’s ecosystem services and natural capital. Nature 1997, 387, 253–260. [Google Scholar] [CrossRef]
  2. Yi, Y.; Liu, H.; Xu, Q.; Yang, Z. The relationship between ecosystem service supply and demand in plain areas undergoing urbanization: A case study of China’s Baiyangdian Basin. J. Environ. Manag. 2021, 289, 112492. [Google Scholar]
  3. de Castro-Pardo, M.; Fernández Martínez, P.; Pérez Zabaleta, A.; Azevedo, J.C. Dealing with Water Conflicts: A Comprehensive Review of MCDM Approaches to Manage Freshwater Ecosystem Services. Land 2021, 10, 469. [Google Scholar] [CrossRef]
  4. Deeksha; Shukla, A.K. Ecosystem Services: A Systematic Literature Review and Future Dimension in Freshwater Ecosystems. Appl. Sci. 2022, 12, 8518. [Google Scholar] [CrossRef]
  5. Nelson, E.; Mendoza, G.; Regetz, J.; Polasky, S.; Tallis, H.; Cameron, D.; Chan, K.M.A.; Daily, G.C.; Goldstein, J.; Kareiva, P.M.; et al. Modeling multiple ecosystem services, biodiversity conservation, commodity production, and tradeoffs at landscape scales. Front. Ecol. Environ. 2009, 7, 4–11. [Google Scholar] [CrossRef]
  6. Mach, M.E.; Martone, R.G.; Chan, K.M.A. Human impacts and ecosystem services: Insufficient research for trade-off evaluation. Ecosyst. Serv. 2015, 16, 112–120. [Google Scholar] [CrossRef]
  7. Müller, A.; Österlund, H.; Marsalek, J.; Viklander, M. The pollution conveyed by urban runoff: A review of sources. Sci. Total Environ. 2020, 709, 136125. [Google Scholar] [CrossRef]
  8. Kuhn, R.; Bryant, I.M.; Jensch, R.; Böllmann, J. Applications of environmental nanotechnologies in remediation, wastewater treatment, drinking water treatment, and agriculture. Appl. Nano 2022, 3, 54–90. [Google Scholar] [CrossRef]
  9. Pan, Z.; He, J.; Liu, D.; Wang, J.; Guo, X. Ecosystem health assessment based on ecological integrity and ecosystem services demand in the Middle Reaches of the Yangtze River Economic Belt, China. Sci. Total Environ. 2021, 774, 144837. [Google Scholar] [CrossRef]
  10. Vincent, J.R.; Ahmad, I.; Adnan, N.; Burwell, W.B.; Pattanayak, S.K.; Tan-Soo, J.-S.; Thomas, K. Valuing Water Purification by Forests: An Analysis of Malaysian Panel Data. Environ. Resour. Econ. 2015, 64, 59–80. [Google Scholar] [CrossRef]
  11. Liang, J.; Li, S.; Li, X.; Li, X.; Liu, Q.; Meng, Q.; Lin, A.; Li, J. Trade-off analyses and optimization of water-related ecosystem services (WRESs) based on land use change in a typical agricultural watershed, southern China. J. Clean. Prod. 2021, 279, 123851. [Google Scholar] [CrossRef]
  12. Sun, L.; Yu, H.; Sun, M.; Wang, Y. Coupled impacts of climate and land use changes on regional ecosystem services. J. Environ. Manag. 2023, 326, 116753. [Google Scholar] [CrossRef] [PubMed]
  13. Lin, J.; Huang, J.; Prell, C.; Bryan, B.A. Changes in supply and demand mediate the effects of land-use change on freshwater ecosystem services flows. Sci. Total Environ. 2021, 763, 143012. [Google Scholar] [CrossRef] [PubMed]
  14. Liu, C.; Li, W.; Xu, J.; Zhou, H.; Li, C.; Wang, W. Global trends and characteristics of ecological security research in the early 21st century: A literature review and bibliometric analysis. Ecol. Indic. 2022, 137, 108734. [Google Scholar] [CrossRef]
  15. Vigerstol, K.L.; Aukema, J.E. A comparison of tools for modeling freshwater ecosystem services. J. Environ. Manag. 2011, 92, 2403–2409. [Google Scholar] [CrossRef]
  16. Dennedy-Frank, P.J.; Muenich, R.L.; Chaubey, I.; Ziv, G. Comparing two tools for ecosystem service assessments regarding water resources decisions. J. Environ. Manag. 2016, 177, 331–340. [Google Scholar] [CrossRef]
  17. Lüke, A.; Hack, J. Comparing the applicability of commonly used hydrological ecosystem services models for integrated decision-support. Sustainability 2018, 10, 346. [Google Scholar] [CrossRef]
  18. Le Provost, G.; Schenk, N.V.; Penone, C.; Thiele, J.; Westphal, C.; Allan, E.; Ayasse, M.; Blüthgen, N.; Boeddinghaus, R.S.; Boesing, A.L.; et al. The supply of multiple ecosystem services requires biodiversity across spatial scales. Nat. Ecol. Evol. 2022, 7, 236–249. [Google Scholar] [CrossRef]
  19. Huang, Y.; Cao, Y.; Wu, J. Evaluating the spatiotemporal dynamics of ecosystem service supply-demand risk from the perspective of service flow to support regional ecosystem management: A case study of yangtze river delta urban agglomeration. J. Clean. Prod. 2024, 460, 142598. [Google Scholar] [CrossRef]
  20. Ha, L.T.; Bastiaanssen, W.G. Determination of spatially-distributed Hydrological Ecosystem Services (HESS) in the Red River Delta using a calibrated SWAT model. Sustainability 2023, 15, 6247. [Google Scholar] [CrossRef]
  21. Xia, P.; Chen, B.; Gong, B.; Liu, Z.; He, C.; Wang, Y. The supply and demand of water purification service in an urbanizing basin on the Tibetan Plateau. Landsc. Ecol. 2022, 37, 1937–1955. [Google Scholar] [CrossRef]
  22. Scandurra, G.; Smulko, J.; Kish, L.B. Fluctuation-enhanced sensing (FES): A promising sensing technique. Appl. Sci. 2020, 10, 5818. [Google Scholar] [CrossRef]
  23. Wang, Y.n.; Yang, G.; Li, B.; Wang, C.; Su, W. Measuring the zonal responses of nitrogen output to landscape pattern in a flatland with river network: A case study in Taihu Lake Basin, China. Environ. Sci. Pollut. Res. 2022, 29, 34624–34636. [Google Scholar] [CrossRef] [PubMed]
  24. Johnson, G.W.; Bagstad, K.J.; Snapp, R.R.; Villa, F. Service Path Attribution Networks (SPANs). Int. J. Agric. Environ. Inf. Syst. 2012, 3, 54–71. [Google Scholar] [CrossRef]
  25. Yu, B.; Xu, L. Review of ecological compensation in hydropower development. Renew. Sustain. Energy Rev. 2016, 55, 729–738. [Google Scholar] [CrossRef]
  26. Ju, F.; Zhou, J.; Jiang, K. Evolution of stakeholders’ behavioral strategies in the ecological compensation mechanism for poverty alleviation. Resour. Conserv. Recycl. 2022, 176, 105915. [Google Scholar] [CrossRef]
  27. Zbinden, S.; Lee, D.R. Paying for environmental services: An analysis of participation in Costa Rica’s PSA program. World Dev. 2005, 33, 255–272. [Google Scholar] [CrossRef]
  28. Pagiola, S. Payments for environmental services in Costa Rica. Ecol. Econ. 2008, 65, 712–724. [Google Scholar] [CrossRef]
  29. Ojelel, B.E.; Okello-Okello, F.; Barakagira, A. Implementing Payments for Ecosystem Services and its Impact on Community Livelihoods: A Case of Nyamwamba Sub-Catchment, Kasese District, Uganda. J. Agric. Ecol. Res. Int. 2024, 25, 23–36. [Google Scholar] [CrossRef]
  30. Chen, C.; Matzdorf, B.; Davis, M. Companies preferences and willingness to pay for ecosystem services credits through an online-marketplace. Ecosyst. Serv. 2024, 69, 101653. [Google Scholar] [CrossRef]
  31. Faria, L.D.d.; Matricardi, E.A.T.; Marimon, B.S.; Miguel, E.P.; Junior, B.H.M.; Oliveira, E.A.d.; Prestes, N.C.C.d.S.; Carvalho, O.L.F.d. Biomass Prediction Using Sentinel-2 Imagery and an Artificial Neural Network in the Amazon/Cerrado Transition Region. Forests 2024, 15, 1599. [Google Scholar] [CrossRef]
  32. Udugama, M.; Alotaibi, B.A.; Navoda, M.; Najim, M.M.; Udayanga, L.; Traore, A. Willingness-to-Pay for Blue Ecosystem Services of Natural Pools in Sri Lanka: A Discrete Choice Experiment. Water 2024, 16, 2437. [Google Scholar] [CrossRef]
  33. Anitha, V.; Soman, D.; Sandeep, S.; Sreejith, K.; Sreekumar, V. The Nexus of Ecosystem Services and Human Wellbeing: Case Study from the Forests of Western Ghats, Kerala, India. In Ecosystem Services Valuation for Sustainable Development; Springer: Berlin/Heidelberg, Germany, 2024; pp. 77–120. [Google Scholar]
  34. Salzman, J.; Bennett, G.; Carroll, N.; Goldstein, A.; Jenkins, M. The global status and trends of Payments for Ecosystem Services. Nat. Sustain. 2018, 1, 136–144. [Google Scholar] [CrossRef]
  35. Saeed, U. Climate Change Vulnerability and Ecosystem Services of Snow Leopard Habitat in Pakistan. In Book Climate Change Vulnerability and Ecosystem Services of Snow Leopard Habitat in Pakistan; Quaid I Azam University Islamabad: Islamabad, Pakistan, 2024. [Google Scholar]
  36. Liu, B.; Xu, L.; Long, Y.; Wei, Y.; Ao, C. Public Willingness to Pay for Farmland Eco-Compensation and Allocation to Farmers: An Empirical Study from Northeast China. Agriculture 2024, 14, 1166. [Google Scholar] [CrossRef]
  37. Tao, Y.; Li, Z.; Sun, X.; Qiu, J.; Pueppke, S.G.; Ou, W.; Guo, J.; Tao, Q.; Wang, F. Supply and demand dynamics of hydrologic ecosystem services in the rapidly urbanizing Taihu Lake Basin of China. Appl. Geogr. 2023, 151, 102853. [Google Scholar] [CrossRef]
  38. General Administration of Quality Supervision, Inspection and Quarantine of the People’s Republic of China. Environmental Quality Standards for Surface Water. 2002. Available online: https://www.mee.gov.cn/ywgz/fgbz/bz/bzwb/shjbh/shjzlbz/200206/t20020601_66497.htm (accessed on 1 January 2024).
  39. Gianuca, K.; Silva, T.; Asmus, M. Ecosystem-based spatial modeling: Assessing the supply of hydrological services in a watershed in Southern Brazil. Ecol. Model. 2024, 492, 110723. [Google Scholar] [CrossRef]
  40. Valladares-Castellanos, M.; de Jesús Crespo, R.; Xu, Y.J.; Douthat, T.H. A framework for validating watershed ecosystem service models in the United States using long-term water quality data: Applications with the InVEST Nutrient Delivery (NDR) model in Puerto Rico. Sci. Total Environ. 2024, 949, 175111. [Google Scholar] [CrossRef]
  41. Wambecq, T.; Kroll, S.; Van Assel, J.; Delgado, R. CSO Generator—A Parsimonious Wastewater Quality Model for Combined Sewer Overflows. Water 2023, 15, 3424. [Google Scholar] [CrossRef]
  42. Costa, M.E.L.; Carvalho, D.J.; Koide, S. Assessment of pollutants from diffuse pollution through the correlation between rainfall and runoff characteristics using EMC and first flush analysis. Water 2021, 13, 2552. [Google Scholar] [CrossRef]
  43. Xue, Q.; Kong, M.; Xie, L.; Li, T.; Liao, M.; Yan, Z.; Zhao, Y. Temporal dynamics of microcystins in two reservoirs with different trophic status during the early growth stage of cyanobacteria. Environ. Sci. Pollut. Res. 2022, 29, 87132–87143. [Google Scholar] [CrossRef]
  44. Liu, C. Spatial-temporal Evolution of Supply-demand of Water Supply and Water Purifcation Service in Taihu Basin. Spatial-Temporal Evolution of Supply-Demand of Water Supply and Water Purifcation Service in Taihu Basin. Master’s Thesis, Nanjing Agricultural University: Nanjing, China, 2019. (In Chinese). [Google Scholar]
  45. Chen, W.; Gu, T.; Zeng, J. Urbanisation and ecosystem health in the Middle Reaches of the Yangtze River urban agglomerations, China: A U-curve relationship. J. Environ. Manag. 2022, 318, 115565. [Google Scholar] [CrossRef] [PubMed]
  46. Li, K.; Hou, Y.; Andersen, P.S.; Xin, R.; Rong, Y.; Skov-Petersen, H. An ecological perspective for understanding regional integration based on ecosystem service budgets, bundles, and flows: A case study of the Jinan metropolitan area in China. J. Environ. Manag. 2022, 305, 114371. [Google Scholar] [CrossRef] [PubMed]
  47. Banik, P.; Bera, K. Multi-criteria decision analysis (MCDA) for surface water management plan, a case study of Kansachara sub-watershed, West Bengal, India. Water Supply 2019, 19, 2156–2162. [Google Scholar] [CrossRef]
  48. Liu, W.; Zhan, J.; Zhao, F.; Zhang, F.; Teng, Y.; Wang, C.; Chu, X.; Kumi, M.A. The tradeoffs between food supply and demand from the perspective of ecosystem service flows: A case study in the Pearl River Delta, China. J. Environ. Manag. 2022, 301, 113814. [Google Scholar] [CrossRef]
  49. Ni, Y.; Wei, J.; Wu, T.; Guo, M.; Han, Q.; Zhang, M. Mapping and assessing ecosystem service supply–demand to identify critical areas: A case study of a waterside area in Shanghai metropolitan area. Front. Earth Sci. 2022, 10, 943910. [Google Scholar] [CrossRef]
  50. Ren, E.; Lin, W.; Li, B.; Jiang, Y.; Zhang, Y.; Yu, Y. Regional Ecological Security Assessment Based on the Pressure–State–Response Framework: The Demonstration Zone of Yangtze River Delta as an Example. Land 2024, 13, 96. [Google Scholar] [CrossRef]
  51. Sokołowski, J. Assessing individual environmental capital and pro-climate behaviour: A residential sector choice experiment on heating investment preferences. J. Clean. Prod. 2024, 447, 141123. [Google Scholar] [CrossRef]
  52. Li, S.; Ma, S. A Quantitative Analysis on the Coordination of Regional Ecological and Economic Development Based on the Ecosystem Service Evaluation. Land 2024, 13, 207. [Google Scholar] [CrossRef]
  53. Yang, H.; Gou, X.; Xue, B.; Xu, J.; Wei, Y.; Ma, W. Measuring the cross-border spillover effects and telecoupling processes of ecosystem services in Western China. Environ. Res. 2023, 239, 117291. [Google Scholar] [CrossRef]
  54. Navarrete-Molina, C.; de los Ángeles Sariñana-Navarrete, M.; Meza-Herrera, C.A.; Valenzuela-Nuñez, L.M.; Marin-Tinoco, R.I. Comparative water footprint analysis of rural and urban areas. In Current Directions in Water Scarcity Research; Elsevier: Amsterdam, The Netherlands, 2024; pp. 29–47. [Google Scholar]
  55. Çelik, R. Evaluation of Groundwater Potential by GIS-Based Multicriteria Decision Making as a Spatial Prediction Tool: Case Study in the Tigris River Batman-Hasankeyf Sub-Basin, Turkey. Water 2019, 11, 2630. [Google Scholar] [CrossRef]
  56. Huang, C.; Zhao, D.; Liao, Q.; Xiao, M. Linking landscape dynamics to the relationship between water purification and soil retention. Ecosyst. Serv. 2023, 59, 101498. [Google Scholar] [CrossRef]
  57. Qiao, W.; Huang, X. The impact of land urbanization on ecosystem health in the Yangtze River Delta urban agglomerations, China. Cities 2022, 130, 103981. [Google Scholar] [CrossRef]
  58. Sang, S.; Wu, T.; Wang, S.; Yang, Y.; Liu, Y.; Li, M.; Zhao, Y. Ecological Safety Assessment and Analysis of Regional Spatiotemporal Differences Based on Earth Observation Satellite Data in Support of SDGs: The Case of the Huaihe River Basin. Remote Sens. 2021, 13, 3942. [Google Scholar] [CrossRef]
  59. Yan, N.; Liu, G.; Casazza, M.; Yang, Z. A new multiscale collection and allocation framework for national ecological compensation funds based on ecosystem service supply and demand dynamics. J. Clean. Prod. 2024, 452, 142118. [Google Scholar] [CrossRef]
Figure 1. Study area.
Land 13 01694 g001
Figure 2. Multi-step ecosystem-based approach.
Land 13 01694 g002
Figure 3. Nitrogen supply (a1) and demand (a2)/phosphorus supply (b1) and demand (b2) in the Taihu Basin in 2020.
Land 13 01694 g003
Figure 4. Nitrogen supply–demand differences (a1) and indices (a2)/phosphorus supply–demand differences (b1) and indices (b2) at the county level in the Taihu Basin in 2020.
Land 13 01694 g004
Figure 5. Nitrogen supply–demand differences (a1) and indices (a2)/phosphorus supply–demand differences (b1) and indices (b2) at the sub-basin level in the Taihu Basin in 2020.
Land 13 01694 g005
Figure 6. The supply and demand of nitrogen water purification ecosystem services after one (a1) and ten (a2) unit time flows. The supply and demand of phosphorus water purification ecosystem services after one (b1) and ten (b2) unit time flows.
Land 13 01694 g006
Figure 7. The flow path and spatial distribution of water purification services in the Taihu Basin in 2020.
Land 13 01694 g007
Table 1. Data Collection.
DatasetSourceWebsiteDescription
Digital Elevation Model (DEM)Geospatial Data Cloud (ASTER GDEMV3, 30 m resolution)(https://www.gscloud.cn), accessed on 1 January 2024Used for hydrological analysis to generate flow direction and delineate sub-watershed boundaries, crucial for identifying water flow paths and assessing water purification service distribution.
Precipitation and Evapotranspiration DataNational Tibetan Plateau Data Center (1 km resolution)(https://data.tpdc.ac.cn), accessed on 1 January 2024Essential for estimating water budgets and flow dynamics, helping to understand the temporal variation in water demand and supply within the sub-watersheds.
Land Use/Cover (LUCC) DataNational Cryosphere Desert Data Center (30 m resolution)(http://www.ncdc.ac.cn/portal/), accessed on 1 January 2024Reclassified to model nutrient load (nitrogen and phosphorus) and filtration capacities of different land types, key for assessing the supply side of water purification services.
Watershed BoundariesNational Tibetan Plateau Data Center
(1:250,000)
(http://www.ncdc.ac.cn/portal/), accessed on 1 January 2024Used to delineate sub-watersheds, serving as analytical units for modeling nutrient flows and assessing supply–demand dynamics in water purification services.
Soil DataNational Tibetan Plateau Data Center (China Soil Dataset v1.1, HWSD)(http://www.ncdc.ac.cn/portal/), accessed on 1 January 2024Provides root depth and available water content, crucial for estimating water retention capacity and the filtration of pollutants in hydrological modeling.
Biophysical Table//Contains parameters for nutrient loading and retention efficiencies, essential for quantifying the supply and demand of water purification services in the InVEST model.
Table 2. Supply–demand relationship of water purification ecosystem services (total nitrogen) in the Taihu Basin.
YearTotal Output (t)Allowable Load to Water Bodies (t)Demand (t)Supply (t)Supply–Demand Indices (%)
199590,03125,88864,14375,012116.9
200588,44726,80161,64773,233118.8
201579,74128,07751,66465,895127.5
202063,67820,18343,49948,258110.9
Table 3. Supply–demand relationship of water purification ecosystem services (total phosphorus) in the Taihu Basin.
YearTotal Output (t)Allowable Load to Water Bodies (t)Demand (t)Supply (t)Supply–Demand Indices (%)
1995894912947655745397.4
2005865313407313716498.0
20157693140462896358101.1
2020611610095107463490.7
Disclaimer/Publisher’s Note: The statements, opinions and data contained in all publications are solely those of the individual author(s) and contributor(s) and not of MDPI and/or the editor(s). MDPI and/or the editor(s) disclaim responsibility for any injury to people or property resulting from any ideas, methods, instructions or products referred to in the content.

