
Nature’s Neighborhood: The Housing Premium of Urban Parks in Dense Cities


Abstract
1. Introduction
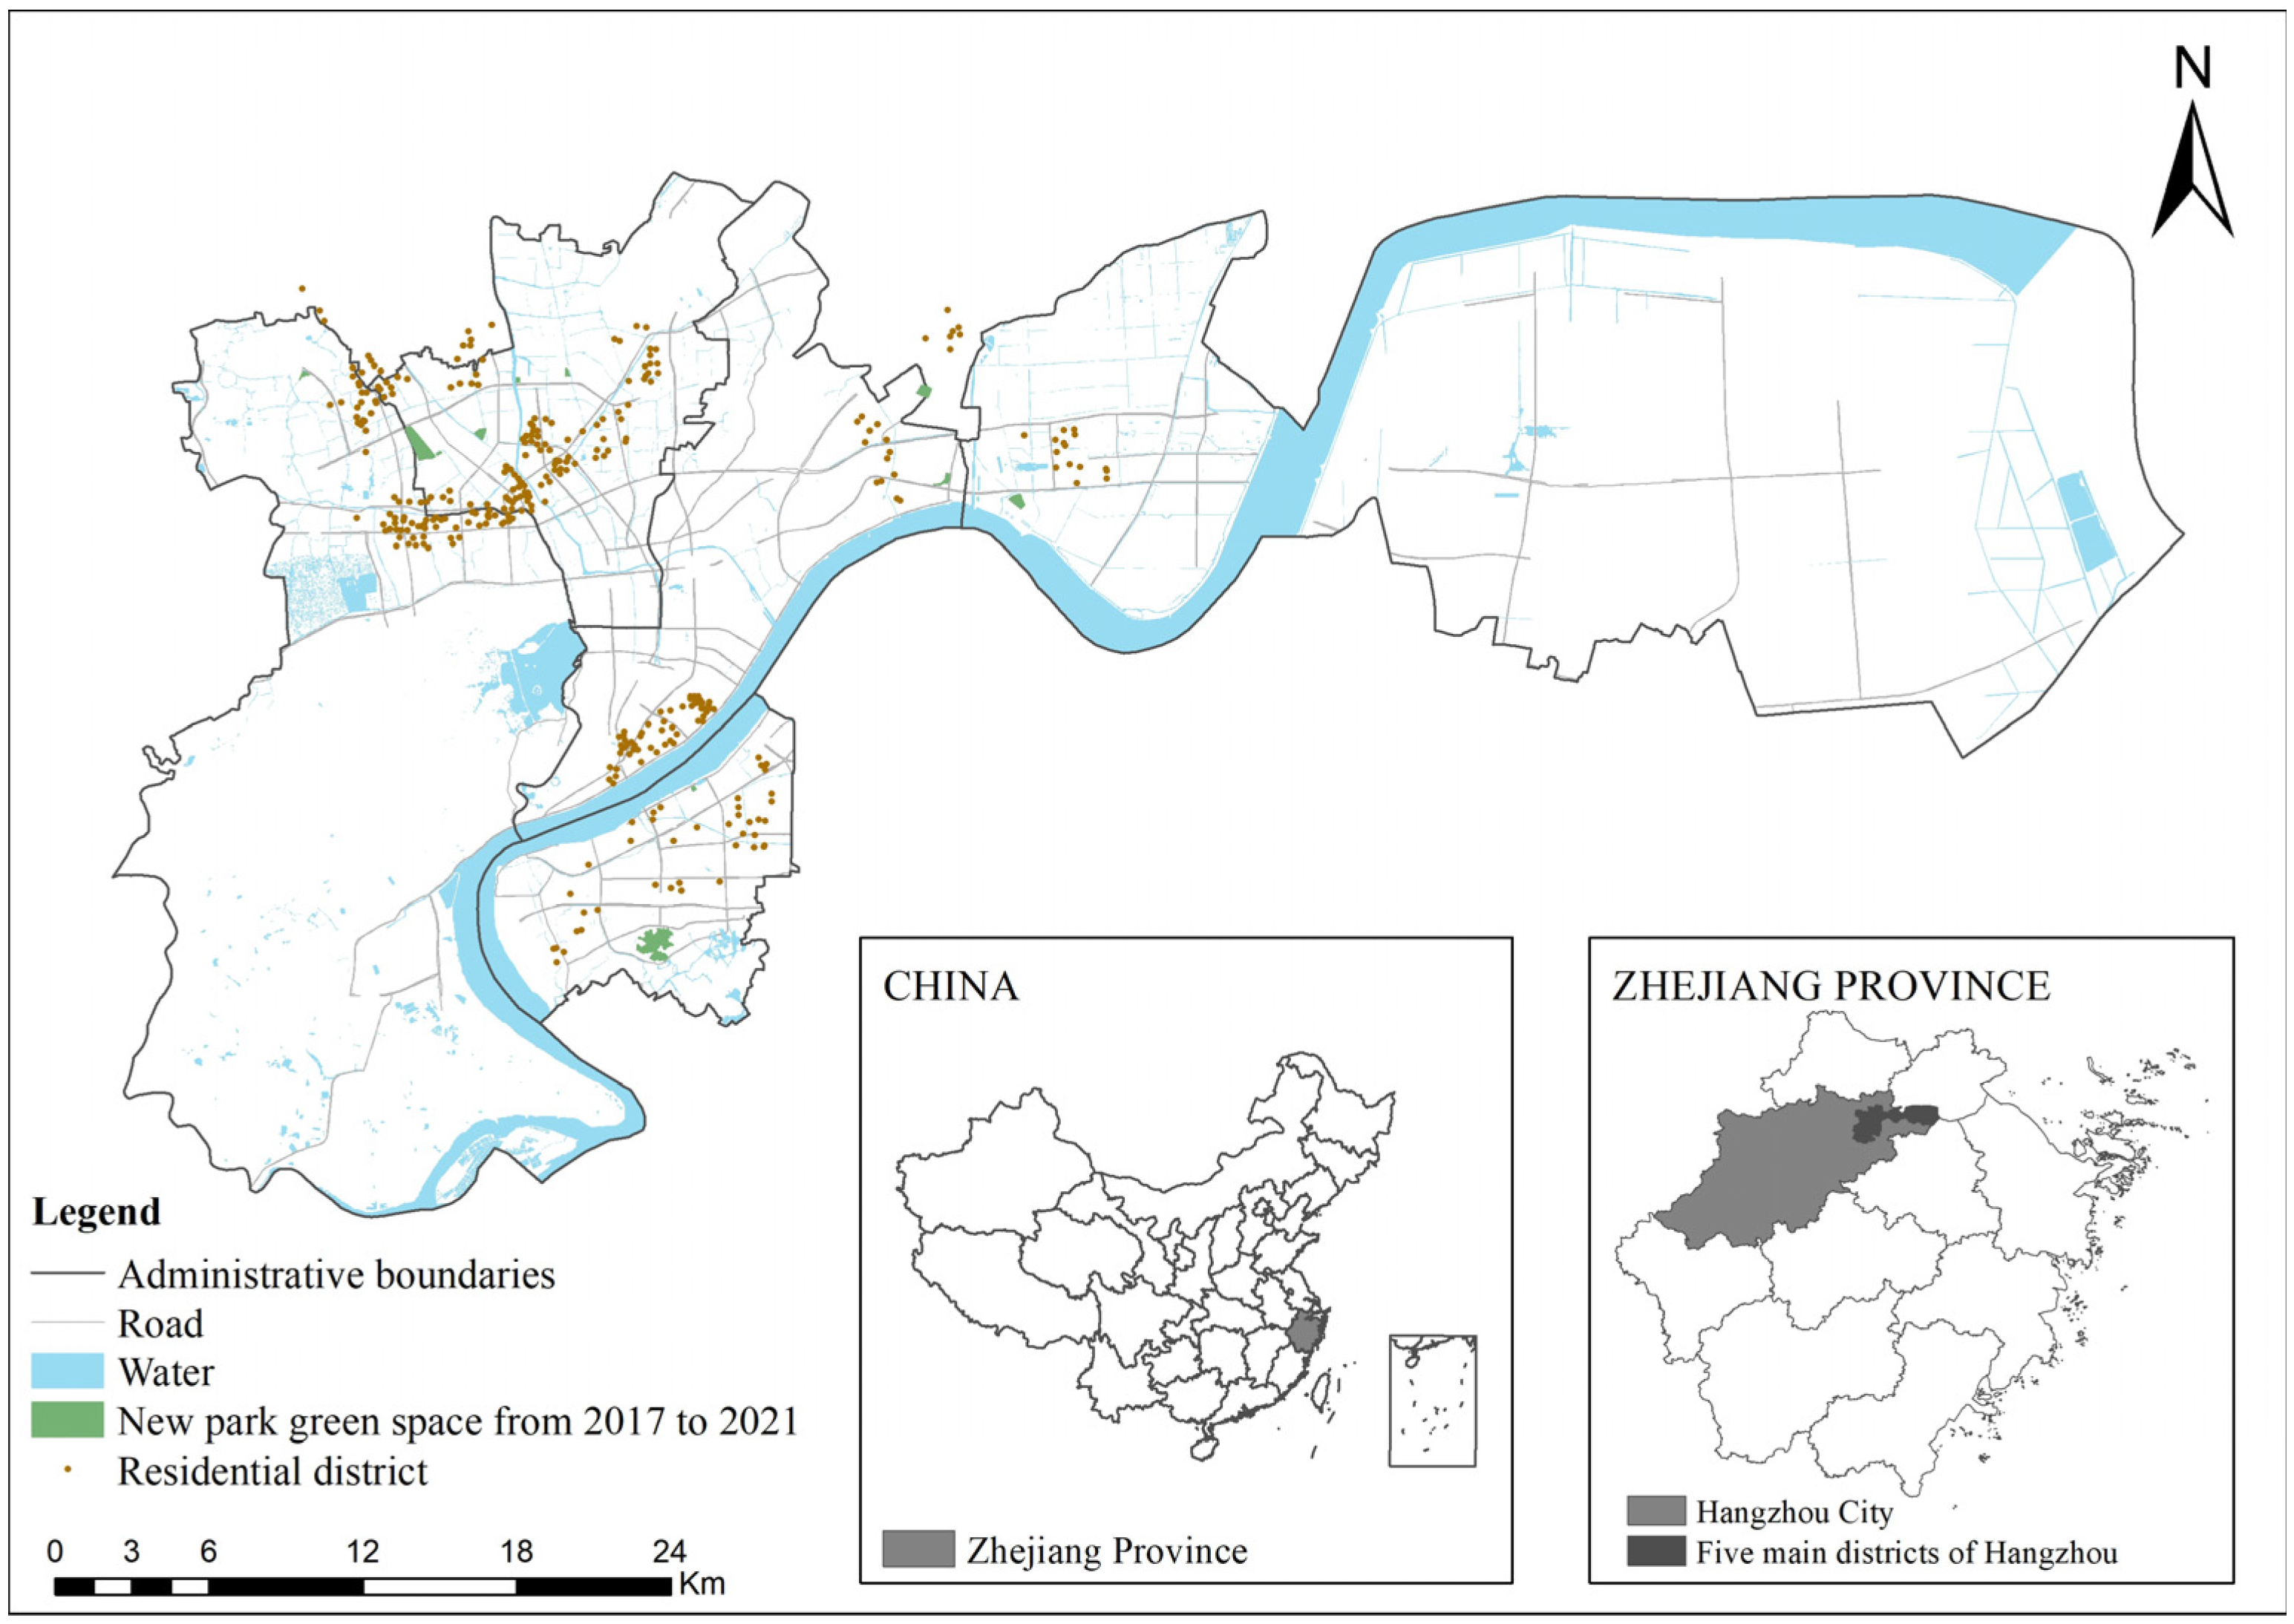
2. Study Area
3. Methodology and Data
3.1. A Hedonic Pricing Model with a Difference-in-Differences Estimator
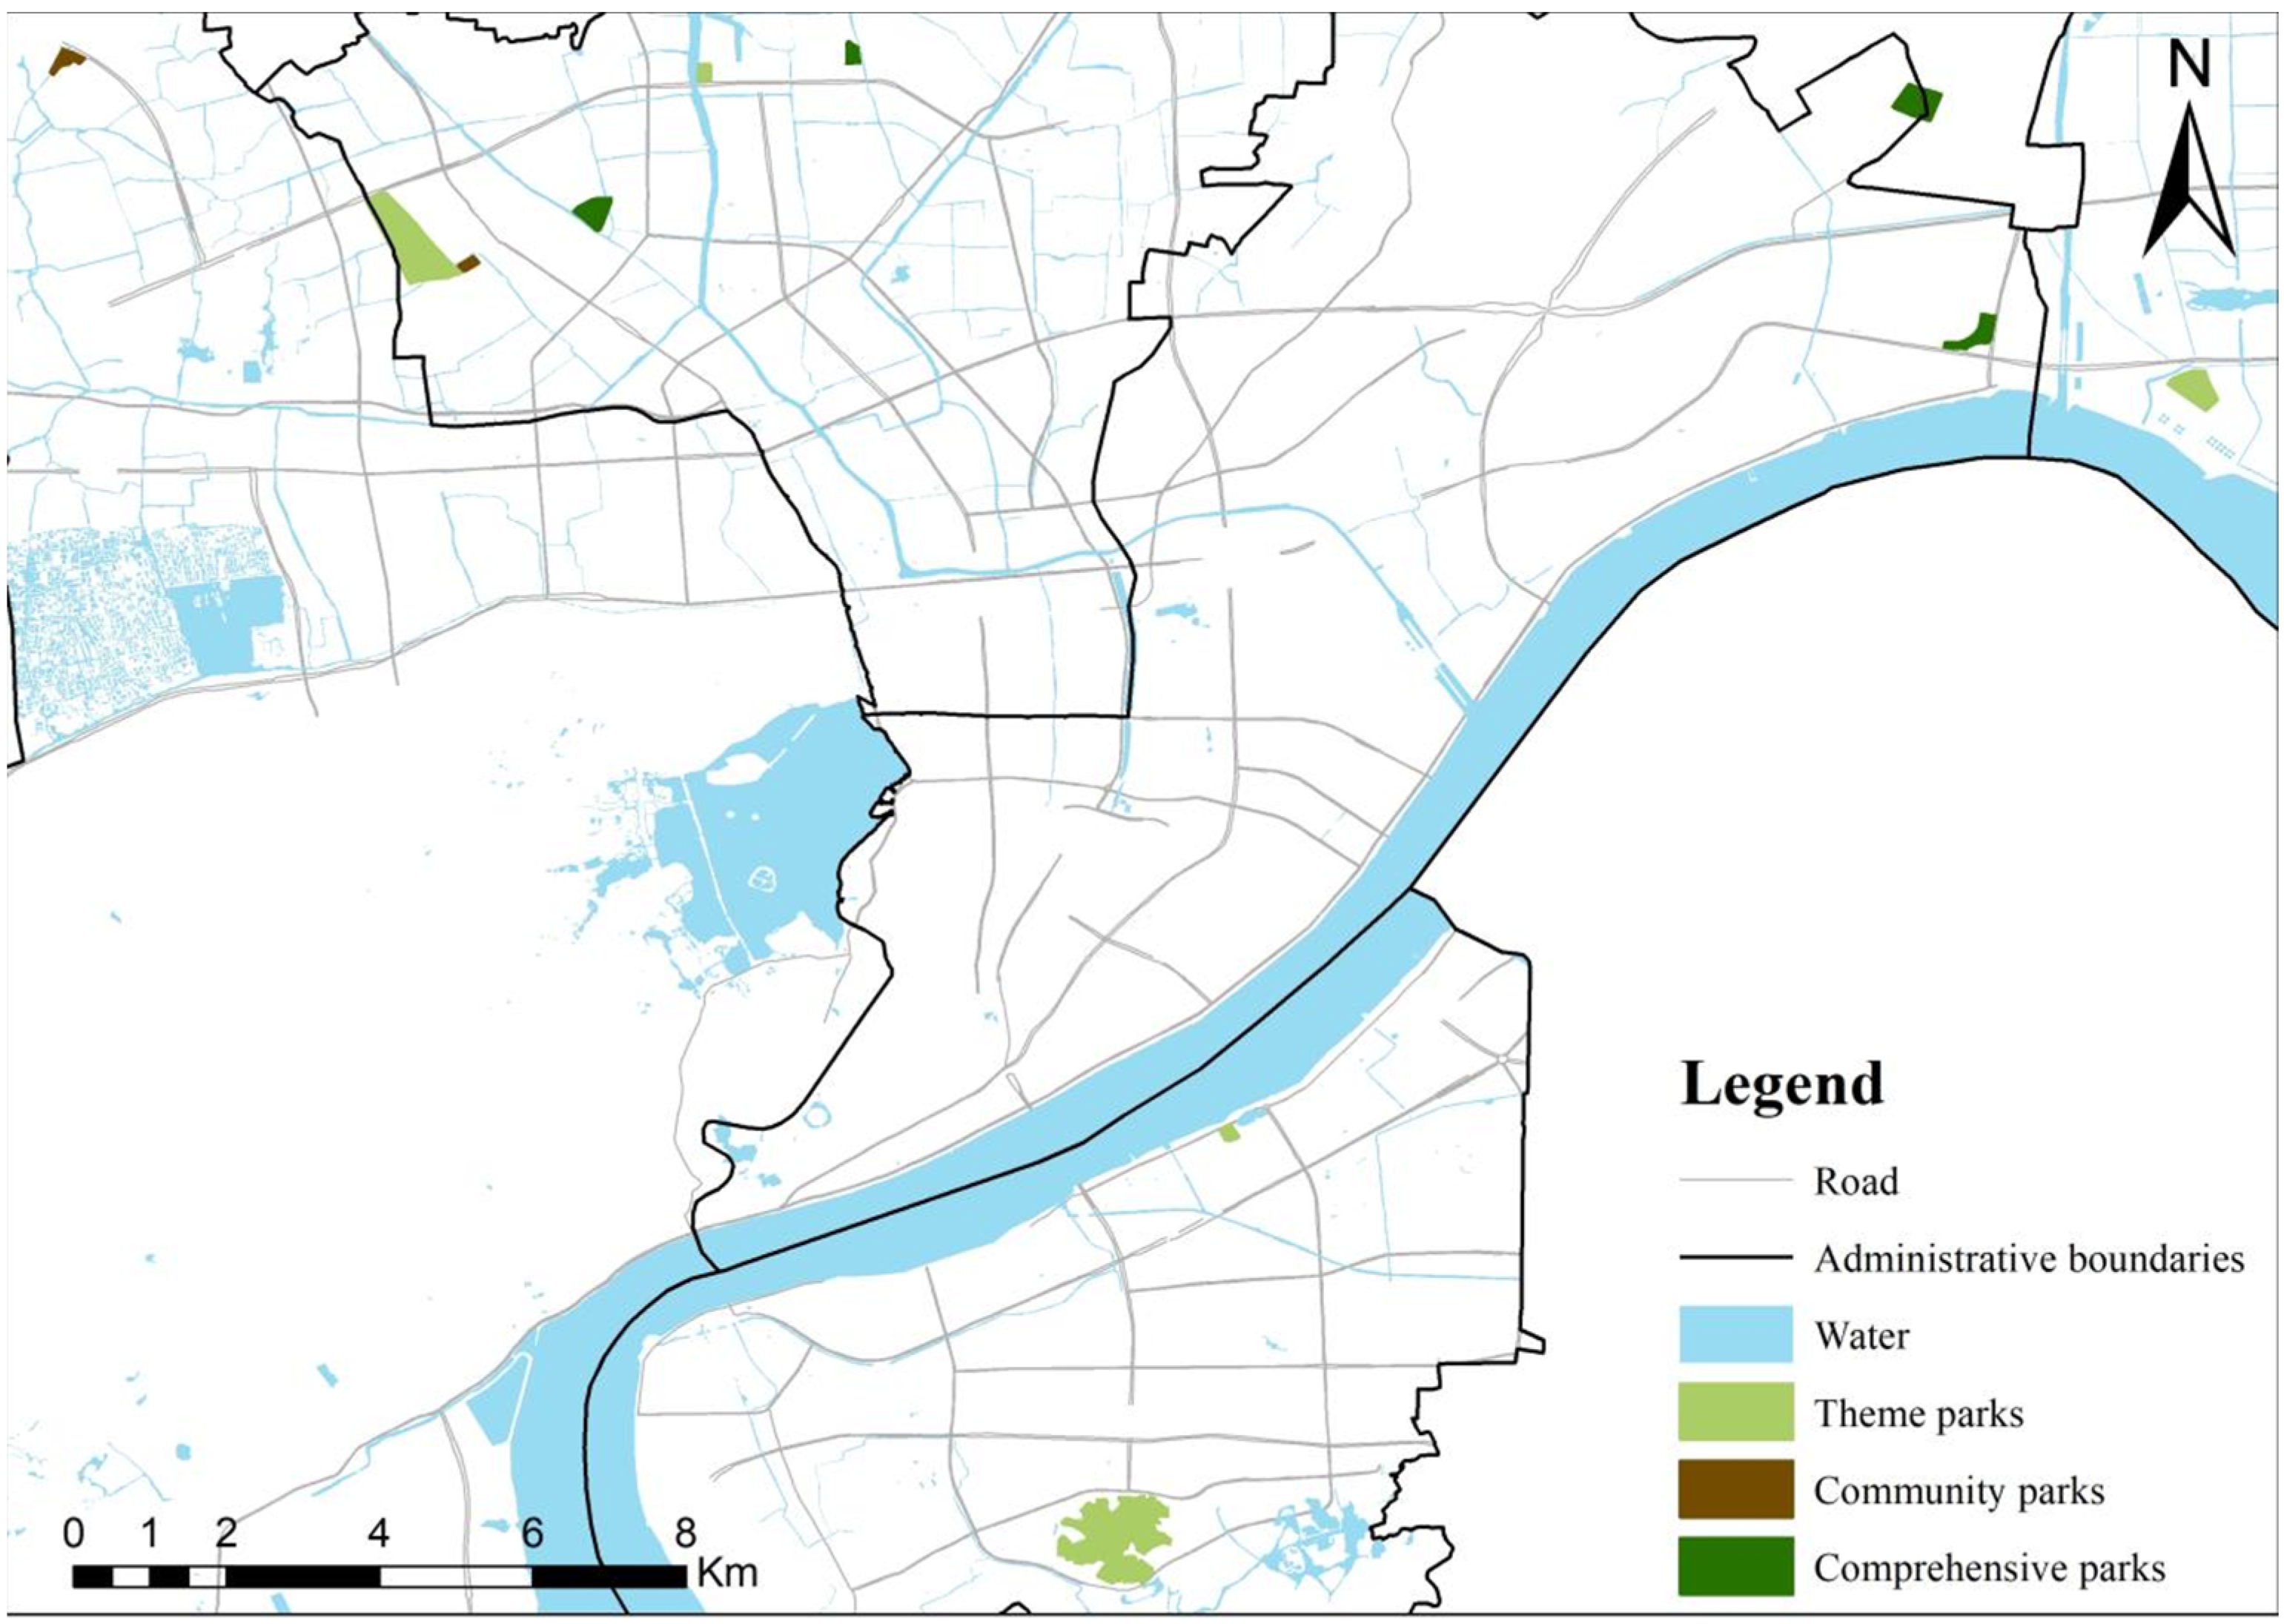
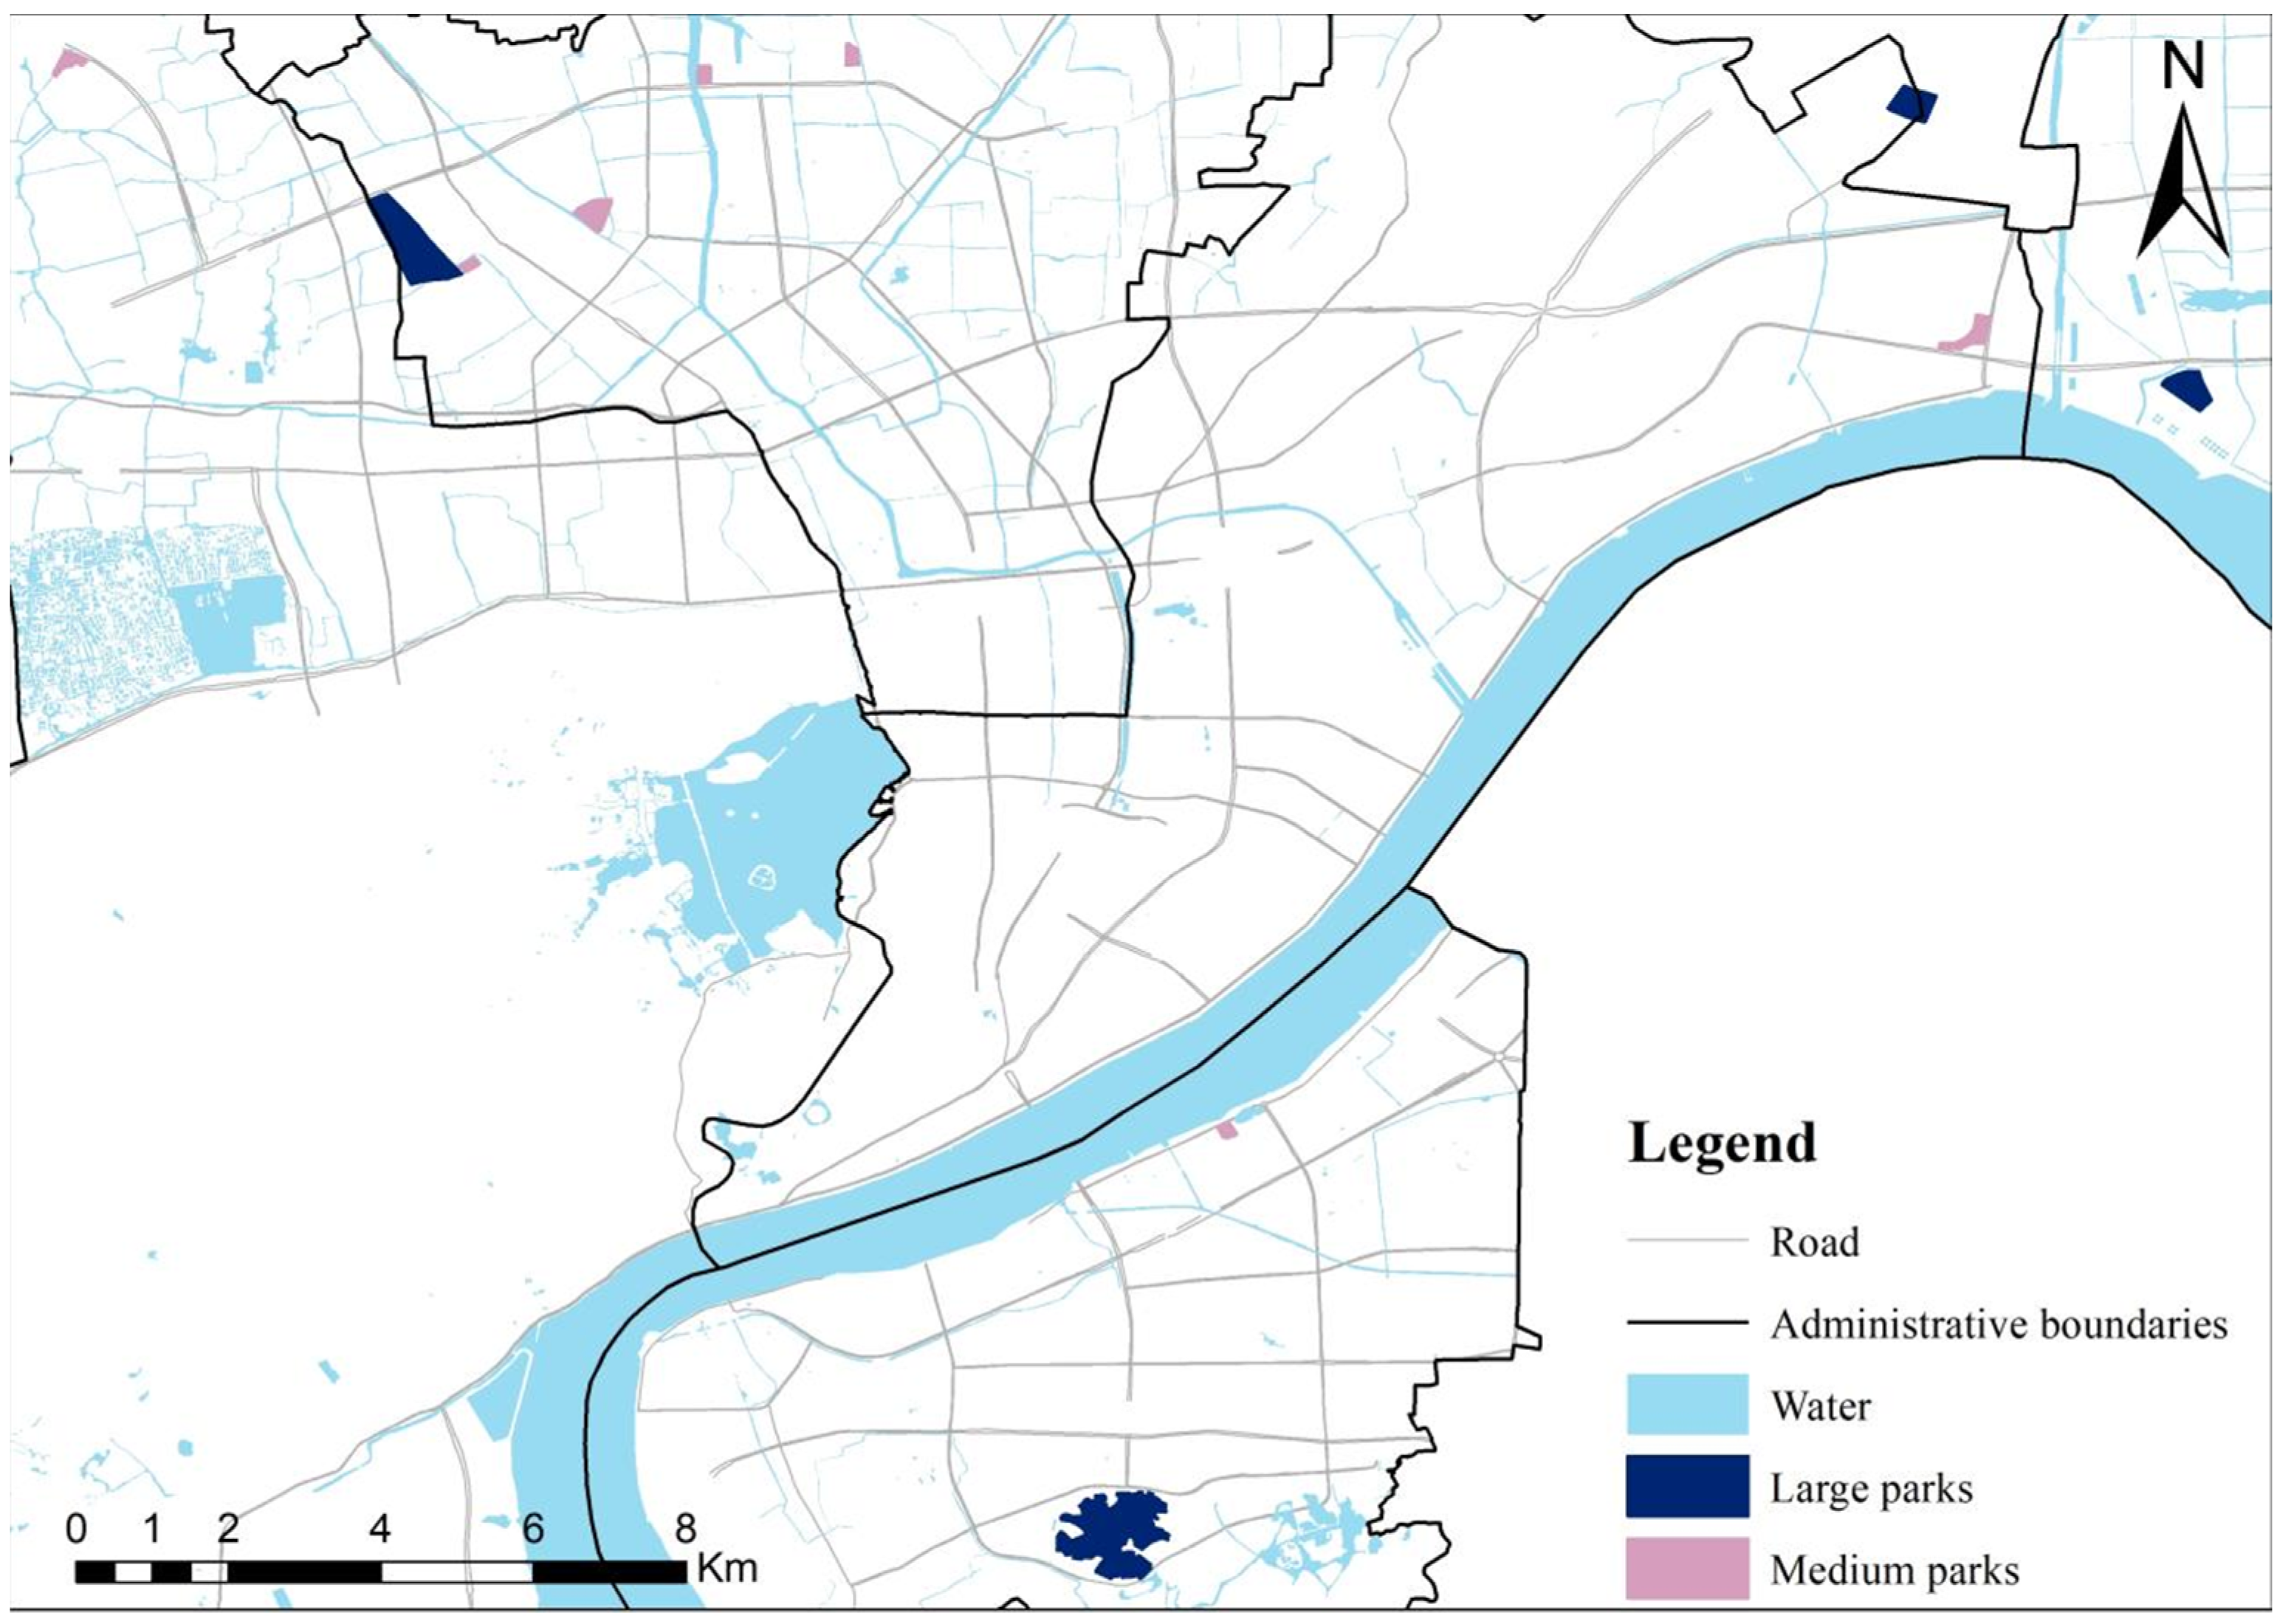
3.2. Classification of Urban Parks
3.3. Data
3.3.1. Apartment-Level Variables
3.3.2. District-Level Variables
4. Results
4.1. Impact of Newly Built Urban Parks on Housing Prices
4.2. Impact of Different Types of Newly Built Urban Parks on Housing Prices
4.3. Robustness
4.3.1. Parallel Trend Test
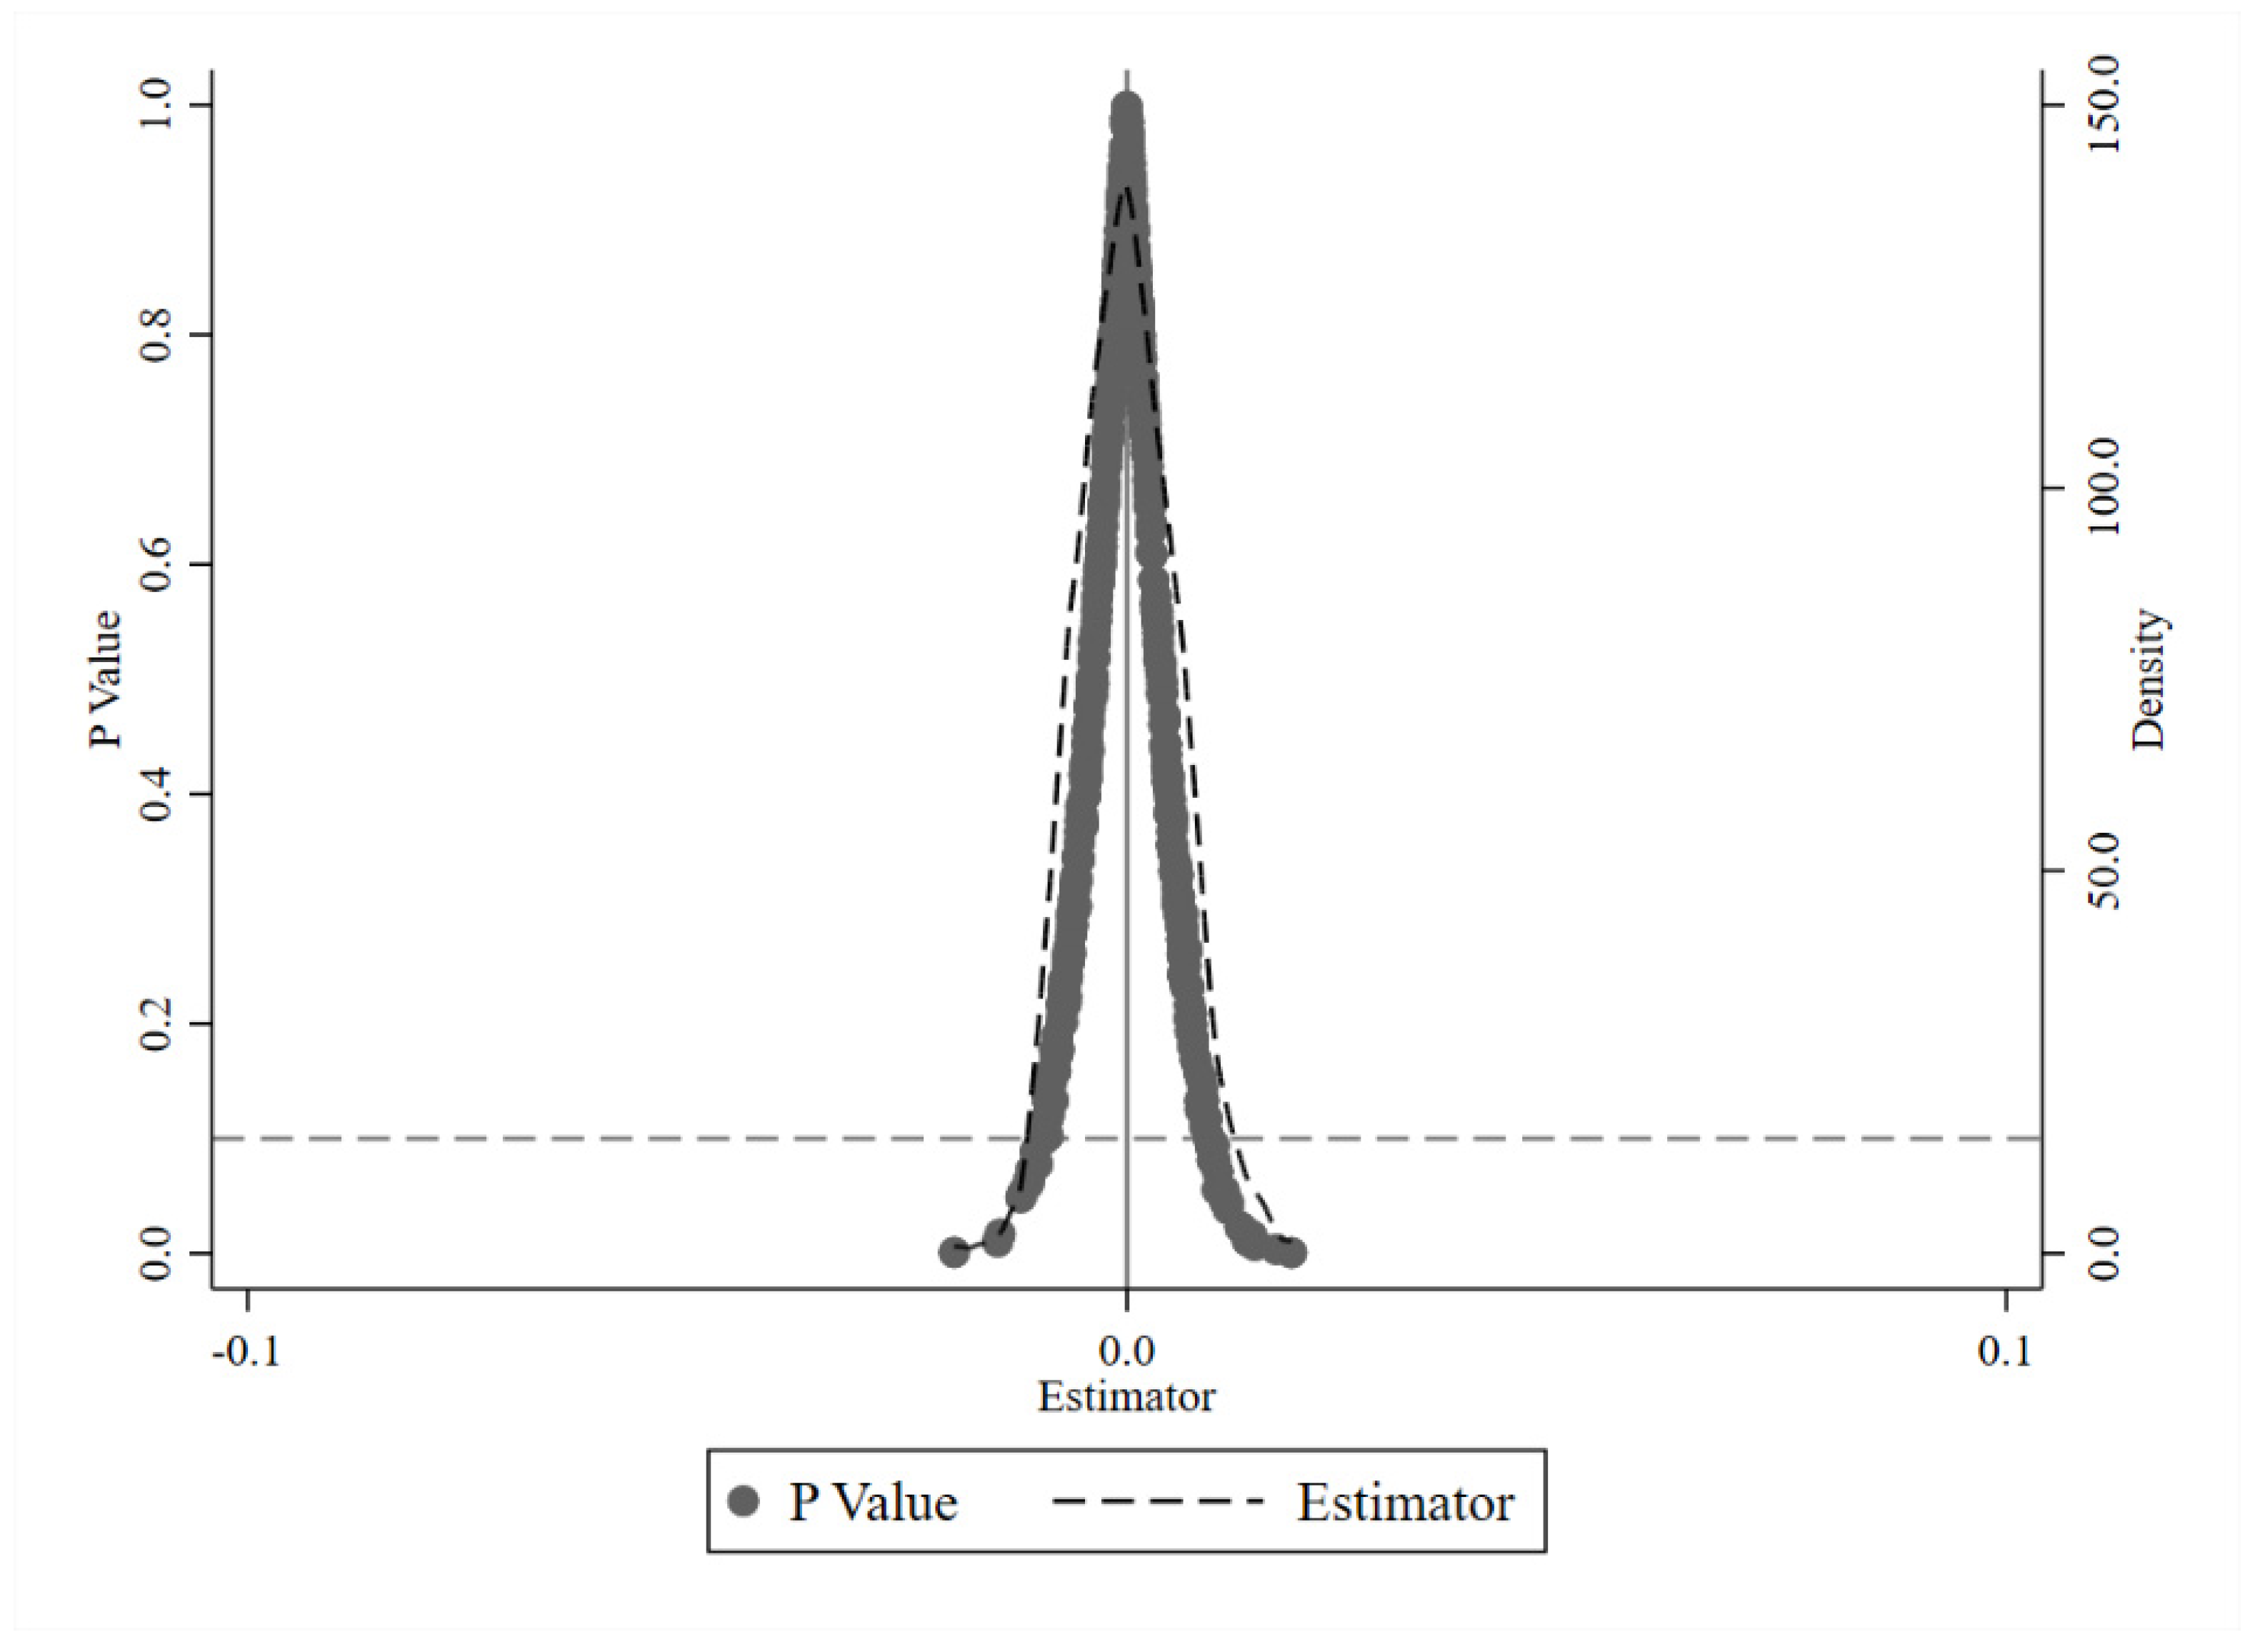
4.3.2. Placebo Test
5. Discussion and Conclusions
5.1. Key Findings
5.2. Potential Policy Implication
5.3. Research Limitations
Author Contributions
Funding
Data Availability Statement
Acknowledgments
Conflicts of Interest
Appendix A

| Model 4 Comprehensive Park | Model 5 Theme Park | Model 6 Community Park | Model 7 Medium Park | Model 8 Large Park | |
|---|---|---|---|---|---|
| DIN_PARK×AFTER×TYPE1 | 0.0950 *** | ||||
| (0.0121) | |||||
| DIN_PARK×AFTER×TYPE2 | 0.0046 | ||||
| (0.0100) | |||||
| DIN_PARK×AFTER×TYPE3 | 0.0031 | ||||
| (0.0084) | |||||
| DIN_PARK×AFTER×TYPE4 | 0.0176 * | ||||
| (0.0092) | |||||
| DIN_PARK×AFTER×TYPE5 | 0.0848 *** | ||||
| (0.0070) | |||||
| DIN_PARK×AFTER | 0.0689 *** | 0.0852 *** | 0.0869 *** | 0.0776 *** | 0.0256 *** |
| (0.0046) | (0.0095) | (0.0051) | (0.0085) | (0.0053) | |
| Xh1 | 0.7632 *** | 0.7686 *** | 0.7678 *** | 0.7726 *** | 0.7770 *** |
| (0.0674) | (0.0702) | (0.0701) | (0.0717) | (0.0693) | |
| Xh2 | −2.2648 *** | −2.1364 *** | −2.1235 *** | −2.2391 *** | −2.2038 *** |
| (0.3631) | (0.3627) | (0.3745) | (0.3608) | (0.3708) | |
| Xh3 | −0.0657 ** | −0.0565 * | −0.0567 * | −0.0631 ** | −0.0572 * |
| (0.0282) | (0.0299) | (0.0306) | (0.0301) | (0.0294) | |
| Xh4 | 0.0059 * | 0.0051 | 0.0050 | 0.0054 | 0.0055 |
| (0.0033) | (0.0033) | (0.0034) | (0.0033) | (0.0033) | |
| Xa1 | 0.0167 *** | 0.0191 *** | 0.0191 *** | 0.0180 *** | 0.0192 *** |
| (0.0050) | (0.0052) | (0.0053) | (0.0052) | (0.0052) | |
| Xa2 | 0.4285 *** | 0.4280 *** | 0.4261 *** | 0.4302 *** | 0.4314 *** |
| (0.0839) | (0.0905) | (0.0908) | (0.0903) | (0.0889) | |
| Xa3 | −0.1656 *** | −0.1338 *** | −0.1326 *** | −0.1501 *** | −0.1403 *** |
| (0.0360) | (0.0353) | (0.0370) | (0.0363) | (0.0349) | |
| Xa4 | −0.0876 *** | −0.0866 *** | −0.0860 *** | −0.0865 *** | −0.0914 *** |
| (0.0273) | (0.0290) | (0.0290) | (0.0283) | (0.0302) | |
| Xa5 | 0.4307 *** | 0.3874 *** | 0.3842 *** | 0.4068 *** | 0.3852 *** |
| (0.1165) | (0.1191) | (0.1203) | (0.1187) | (0.1178) | |
| Xa6 | −0.1154 *** | −0.0932 *** | −0.0916 ** | −0.1083 *** | −0.1000 *** |
| (0.0369) | (0.0356) | (0.0376) | (0.0367) | (0.0353) | |
| Xz1 | −0.0317 | −0.0446 ** | −0.0453 ** | −0.0352 | −0.0382 * |
| (0.0223) | (0.0211) | (0.0226) | (0.0217) | (0.0209) | |
| Xz2 | 0.0307 | 0.0098 | 0.0090 | 0.0178 | 0.0105 |
| (0.0284) | (0.0286) | (0.0290) | (0.0296) | (0.0279) | |
| POP | 0.0333 *** | 0.0300 *** | 0.0295 *** | 0.0295 *** | 0.0264 *** |
| (0.0041) | (0.0043) | (0.0041) | (0.0042) | (0.0041) | |
| E | 0.1687 *** | 0.1638 *** | 0.1626 *** | 0.1643 *** | 0.1660 *** |
| (0.0109) | (0.0111) | (0.0111) | (0.0109) | (0.0109) | |
| LS | −0.0076 *** | −0.0101 *** | −0.0105 *** | −0.0092 *** | −0.0094 *** |
| (0.0023) | (0.0023) | (0.0023) | (0.0023) | (0.0022) | |
| POL | −0.1362 *** | −0.1350 *** | −0.1346 *** | −0.1369 *** | −0.1342 *** |
| (0.0164) | (0.0183) | (0.0184) | (0.0181) | (0.0177) | |
| Constant | 7.0959 *** | 7.4029 *** | 7.4393 *** | 7.2304 *** | 7.4859 *** |
| (0.3636) | (0.3546) | (0.3514) | (0.3604) | (0.3484) | |
| Dist FE | YES | YES | YES | YES | YES |
| Year FE | YES | YES | YES | YES | YES |
| Observations | 43,650 | 43,650 | 43,650 | 43,650 | 43,650 |
| R−squared | 0.810 | 0.810 | 0.810 | 0.810 | 0.810 |
References
- United Nations. World Urbanization Prospects: The 2014 Revision-Highlights; United Nations: New York, NY, USA, 2014. [Google Scholar]
- Cohen, P.; Potchter, O.; Schnell, I. The Impact of an Urban Park on Air Pollution and Noise Levels in the Mediterranean City of Tel-Aviv, Israel. Environ. Pollut. 2014, 195, 73–83. [Google Scholar] [CrossRef] [PubMed]
- Sun, R.; Chen, L. Effects of Green Space Dynamics on Urban Heat Islands: Mitigation and Diversification. Ecosyst. Serv. 2017, 23, 38–46. [Google Scholar] [CrossRef]
- Lee, A.C.K.; Maheswaran, R. The Health Benefits of Urban Green Spaces: A Review of the Evidence. J. Public Health 2011, 33, 212–222. [Google Scholar] [CrossRef] [PubMed]
- Gidlow, C.J.; Jones, M.V.; Hurst, G.; Masterson, D.; Clark-Carter, D.; Tarvainen, M.P.; Smith, G.; Nieuwenhuijsen, M. Where to Put Your Best Foot Forward: Psycho-Physiological Responses to Walking in Natural and Urban Environments. J. Environ. Psychol. 2016, 45, 22–29. [Google Scholar] [CrossRef]
- Zhu, X.; Gao, M.; Zhang, R.; Zhang, B. Quantifying Emotional Differences in Urban Green Spaces Extracted from Photos on Social Networking Sites: A Study of 34 Parks in Three Cities in Northern China. Urban For. Urban Green. 2021, 62, 127133. [Google Scholar] [CrossRef]
- Liu, H.; Li, F.; Xu, L.; Han, B. The Impact of Socio-Demographic, Environmental, and Individual Factors on Urban Park Visitation in Beijing, China. J. Clean. Prod. 2017, 163, S181–S188. [Google Scholar] [CrossRef]
- Bark, R.H.; Osgood, D.E.; Colby, B.G.; Katz, G.; Stromberg, J. Habitat Preservation and Restoration: Do Homebuyers Have Preferences for Quality Habitat? Ecol. Econ. 2009, 68, 1465–1475. [Google Scholar] [CrossRef]
- Engström, G.; Gren, A. Capturing the value of green space in urban parks in a sustainable urban planning and design context: Pros and cons of hedonic pricing. Ecol. Soc. 2017, 22, 21. [Google Scholar] [CrossRef]
- Dell’Anna, F.; Bravi, M.; Bottero, M. Urban Green Infrastructures: How Much Did They Affect Property Prices in Singapore? Urban For. Urban Green. 2022, 68, 127475. [Google Scholar] [CrossRef]
- Bark, R.H.; Osgood, D.E.; Colby, B.G.; Halper, E.B. How do homebuyers value different types of green space? J. Agric. Resour. Econ. 2011, 36, 395–415. [Google Scholar]
- Setiowati, R.; Koestoer, R.H.; Andajani, R.D. Valuation of urban green open space using the Hedonic price model. Glob. J. Environ. Sci. Manag.-GJESMGlob 2024, 10, 451–472. [Google Scholar] [CrossRef]
- Rosen, S. Hedonic prices and implicit markets: Product differentiation in pure competition. J. Political Econ. 1974, 82, 34–55. [Google Scholar] [CrossRef]
- Zaki, J.; Nayyar, A.; Dalal, S.; Ali, Z.H. House price prediction using hedonic pricing model and machine learning techniques. Concurr. Comput.-Pract. Exp. 2022, 34, e7342. [Google Scholar] [CrossRef]
- Zambrano-Monserrate, M.A.; Ruano, M.A.; Yoong-Parraga, C.; Silva, C.A. Urban Green Spaces and Housing Prices in Developing Countries: A Two-Stage Quantile Spatial Regression Analysis. For. Policy Econ. 2021, 125, 102420. [Google Scholar] [CrossRef]
- Zheng, S.; Kahn, M.E. Does government investment in local public goods spurgentrification? Evidence from Beijing. Real Estate Econ. 2013, 41, 1–28. [Google Scholar] [CrossRef]
- Wu, F. State dominance in urban redevelopment. Urban Aff. Rev. 2016, 52, 631–658. [Google Scholar] [CrossRef]
- Chen, G.; Zhu, D.; Su, Y.; Zhang, L. The effects of large-scale urban park green spaces on residential prices exemplified by Olympic Forest Park in Beijing. Resourc. Sci. 2015, 37, 2202–2210. [Google Scholar]
- Mueller, J.M.; Loomis, J.B.; Richardson, L.; Fitch, R.A. Valuing impacts of proximity to Saguaro National Park on house prices. Appl. Econ. Perspect. Policy 2022, 44, 1359–1372. [Google Scholar] [CrossRef]
- Jiao, L.; Liu, Y. Geographic Field Model Based Hedonic Valuation of Urban Open Spaces in Wuhan, China. Landsc. Urban Plan. 2010, 98, 47–55. [Google Scholar] [CrossRef]
- Aziz, A.; Anwar, M.M. Assessing land values and proximity using hedonic model-a case study of green town gujrat, pakistan. Eur. J. Geogr. 2019, 10, 149–164. [Google Scholar]
- Aziz, A.; Anwar, M.M.; Dawood, M. The impact of neighborhood services on land values: An estimation through the hedonic pricing model. Geol. J. 2021, 86, 1915–1925. [Google Scholar] [CrossRef]
- Bottero, M.; Caprioli, C.; Foth, M.; Mitchell, P.; Rittenbruch, M.; Santangelo, M. Urban Parks, Value Uplift and Green Gentrification: An Application of the Spatial Hedonic Model in the City of Brisbane. Urban For. Urban Green. 2022, 74, 127618. [Google Scholar] [CrossRef]
- Panduro, T.E.; Veie, K.L. Classification and Valuation of Urban Green Spaces—A Hedonic House Price Valuation. Landsc. Urban Plan. 2013, 120, 119–128. [Google Scholar] [CrossRef]
- Melichar, J.; Kaprová, K. Revealing Preferences of Prague’s Homebuyers toward Greenery Amenities: The Empirical Evidence of Distance–Size Effect. Landsc. Urban Plan. 2013, 109, 56–66. [Google Scholar] [CrossRef]
- Crompton, J.L. The impact of parks on property values: Empirical evidence from the past two decades in the United States. Manag. Leis. 2005, 10, 203–218. [Google Scholar] [CrossRef]
- Czembrowski, P.; Kronenberg, J. Hedonic Pricing and Different Urban Green Space Types and Sizes: Insights into the Discussion on Valuing Ecosystem Services. Landsc. Urban Plan. 2016, 146, 11–19. [Google Scholar] [CrossRef]
- Kong, F.; Yin, H.; Nakagoshi, N. Using GIS and Landscape Metrics in the Hedonic Price Modeling of the Amenity Value of Urban Green Space: A Case Study in Jinan City, China. Landsc. Urban Plan. 2007, 79, 240–252. [Google Scholar] [CrossRef]
- Cohen, D.A.; McKenzie, T.L.; Sehgal, A.; Williamson, S.; Golinelli, D.; Lurie, N. Contribution of Public Parks to Physical Activity. Am. J. Public Health 2007, 97, 509–514. [Google Scholar] [CrossRef]
- Kabisch, N.; Qureshi, S.; Haase, D. Human–Environment Interactions in Urban Green Spaces—A Systematic Review of Contemporary Issues and Prospects for Future Research. Environ. Impact Assess. Rev. 2015, 50, 25–34. [Google Scholar] [CrossRef]
- Van Den Berg, M.; Wendel-Vos, W.; Van Poppel, M.; Kemper, H.; Van Mechelen, W.; Maas, J. Health Benefits of Green Spaces in the Living Environment: A Systematic Review of Epidemiological Studies. Urban For. Urban Green. 2015, 14, 806–816. [Google Scholar] [CrossRef]
- Zhou, Q.; Konijnendijk Van Den Bosch, C.C.; Chen, Z.; Wang, X.; Zhu, L.; Chen, J.; Lin, Y.; Dong, J. China’s Green Space System Planning: Development, Experiences, and Characteristics. Urban For. Urban Green. 2021, 60, 127017. [Google Scholar] [CrossRef]
- Jim, C.Y.; Chen, W.Y. Ecosystem Services and Valuation of Urban Forests in China. Cities 2009, 26, 187–194. [Google Scholar] [CrossRef]
- Schipperijn, J.; Ekholm, O.; Stigsdotter, U.K.; Toftager, M.; Bentsen, P.; Kamper-Jørgensen, F.; Randrup, T.B. Factors Influencing the Use of Green Space: Results from a Danish National Representative Survey. Landsc. Urban Plan. 2010, 95, 130–137. [Google Scholar] [CrossRef]
- Kong, L.; Liu, Z.; Pan, X.; Wang, Y.; Guo, X.; Wu, J. How Do Different Types and Landscape Attributes of Urban Parks Affect Visitors’ Positive Emotions? Landsc. Urban Plan. 2022, 226, 104482. [Google Scholar] [CrossRef]
- Jennings, V.; Larson, L.; Yun, J. Advancing Sustainability through Urban Green Space: Cultural Ecosystem Services, Equity, and Social Determinants of Health. Int. J. Environ. Res. Public Health 2016, 13, 196. [Google Scholar] [CrossRef]
- Lancaster, K.J. A new approach to consumer theory. J. Polit. Econ. 1966, 74, 132–157. [Google Scholar] [CrossRef]
- Hangzhou Municipal Bureau of Statistics. Hangzhou Statistical Yearbook (2022); China Statistics Press: Beijing, China, 2023. [Google Scholar]
- Hangzhou Municipal Bureau of Statistics. Hangzhou Statistical Yearbook (2023); China Statistics Press: Beijing, China, 2024. [Google Scholar]
- Qin-Tong, D. The Expanded Utilizations of Urban Waterfront Green Spaces- Three Cases in Hangzhou. In Proceedings of the 2011 International Conference on Multimedia Technology, Hangzhou, China, 26–28 July 2011; pp. 4190–4193. [Google Scholar] [CrossRef]
- Wu, W.T.; Zhao, H.Y.; Ren, Y.; Tian, M.M.; Shen, D. Investigation on shading effect of urban green space in summer in Hangzhou. Adv. Mater. Res. 2012, 424, 916–919. [Google Scholar] [CrossRef]
- GB/T 50280-98; Standard for Basic Terminology of Urban Planning. Ministry of Housing and Urban-Rural Development of the People’s Republic of China: Beijing, China, 1998.
- CJJ/T85-2017; Standard for Classification of Urban Green Space. Ministry of Housing and Urban-Rural Development of the People’s Republic of China: Beijing, China, 2017.
- Loomis, J.; Bockstael, N.; McConnell, K. Environmental and Resource Valuation with Revealed Preferences: A Theoretical Guide to Empirical Models. Environ. Resour. Econ. 2009, 42, 133–135. [Google Scholar] [CrossRef]
- Pope, D.G.; Pope, J.C. When Walmart Comes to Town: Always Low Housing Prices? Always? J. Urban Econ. 2015, 87, 1–13. [Google Scholar] [CrossRef]
- Basu, S.; Thibodeau, T. Analysis of Spatial Autocorrelation in House Prices. J. Real Estate Financ. Econ. 1998, 17, 61–85. [Google Scholar] [CrossRef]
- Wan, J.; Sun, H.; Fan, X.; Phillips, A.; Zhao, Y.; Chen, Y.; Wang, Z.; Xiao, H.; Dong, X.; Zhu, W. Refining the 15-Minute Community Living Circle: An Innovative Evaluation Method for Medical Facility Allocation in Chengdu. Land Use Policy 2024, 145, 107286. [Google Scholar] [CrossRef]
- Saphores, J.-D.; Li, W. Estimating the Value of Urban Green Areas: A Hedonic Pricing Analysis of the Single Family Housing Market in Los Angeles, CA. Landsc. Urban Plan. 2012, 104, 373–387. [Google Scholar] [CrossRef]
- Peschardt, K.K.; Schipperijn, J.; Stigsdotter, U.K. Use of small public urban green spaces (SPUGS). Urban For. Urban Green. 2012, 11, 235–244. [Google Scholar] [CrossRef]
- Ministry of the Interior Construction Agency. Park Green Space Management and Facility Maintenance Manual; Industry standard of the People’s Republic of China; Ministry of the Interior Construction Agency: Beijing, China, 1999.
- Chen, Y.; Liu, X.; Li, X.; Liu, Y.; Xu, X. Mapping the Fine-Scale Spatial Pattern of Housing Rent in the Metropolitan Area by Using Online Rental Listings and Ensemble Learning. Appl. Geogr. 2016, 75, 200–212. [Google Scholar] [CrossRef]
- Jim, C.Y.; Chen, W.Y. Impacts of Urban Environmental Elements on Residential Housing Prices in Guangzhou (China). Landsc. Urban Plan. 2006, 78, 422–434. [Google Scholar] [CrossRef]
- Xiao, Y.; Li, Z.; Webster, C. Estimating the Mediating Effect of Privately-Supplied Green Space on the Relationship between Urban Public Green Space and Property Value: Evidence from Shanghai, China. Land Use Policy 2016, 54, 439–447. [Google Scholar] [CrossRef]
- Peng, R.; Wheaton, W.C. Effects of Restrictive Land Supply on Housing in HongKong: An Econometric Analysis. J. Hous. Res. 1994, 5, 263–291. [Google Scholar]
- Hangzhou Municipal Planning and Natural Resources Bureau. 2023 State Owned Construction Land Supply Plan for Hangzhou City; Hangzhou Municipal Planning and Natural Resources Bureau: Hangzhou, China, 2023. [Google Scholar]
- Renaud B, M. The 1985-94 global real estate cycle:an overview. J. Real Estate Lit. 1997, 5, 13–44. [Google Scholar] [CrossRef]
- Li, P.; Lu, Y.; Wang, J. Does Flattening Government Improve Economic Performance? Evidence from China. J. Dev. Econ. 2016, 123, 18–37. [Google Scholar] [CrossRef]
- Trojanek, R. The impact of green areas on dwelling prices: The case of Pozna’n city. Entrep. Bus. Econ. Rev. 2016, 4, 27–35. [Google Scholar] [CrossRef]
- Liu, Y.; Chen, T. Impact of urban park green space on the price of peripheral housing in Urumqi. J. Arid. Land Resour. Environ. 2020, 11, 36–43. (In Chinese) [Google Scholar]
- De Vries, S.; Nieuwenhuizen, W.; Farjon, H.; Van Hinsberg, A.; Dirkx, J. In Which Natural Environments Are People Happiest? Large-Scale Experience Sampling in the Netherlands. Landsc. Urban Plan. 2021, 205, 103972. [Google Scholar] [CrossRef]
- Collins, R.M.; Spake, R.; Brown, K.A.; Ogutu, B.O.; Smith, D.; Eigenbrod, F. A Systematic Map of Research Exploring the Effect of Greenspace on Mental Health. Landsc. Urban Plan. 2020, 201, 103823. [Google Scholar] [CrossRef]
- Van Berkel, D.B.; Tabrizian, P.; Dorning, M.A.; Smart, L.; Newcomb, D.; Mehaffey, M.; Neale, A.; Meentemeyer, R.K. Quantifying the Visual-Sensory Landscape Qualities That Contribute to Cultural Ecosystem Services Using Social Media and LiDAR. Ecosyst. Serv. 2018, 31, 326–335. [Google Scholar] [CrossRef] [PubMed]
- Espey, M.; Owusu-Edusei, K. Neighborhood parks and residential property values in Greenville, South Carolina. J. Agric. Appl. Econ. 2001, 33, 487–492. [Google Scholar] [CrossRef]
- Hobden, D.W.; Laughton, G.E.; Morgan, K.E. Green space borders—A tangible benefit? Evidence from four neighborhoods in Surrey, British Columbia, 1980–2001. Land Use Policy 2004, 21, 129–138. [Google Scholar] [CrossRef]
- Tan, W.; Chen, T.; Wang, Q.; Lin, F.; Huang, Y.; Cui, Y. Effects of urban park green space accessibility on house price:a case study of central district of Fuzhou City. J. China Urban Forest 2021, 1, 66–71. (In Chinese) [Google Scholar]
- Mansfield, C.; Pattanayak, S.K.; McDow, W.; McDonald, R.; Halpin, P. Shades of Green: Measuring the value of urban forests in the housing market. J. For. Econ. 2005, 11, 177–199. [Google Scholar] [CrossRef]
- Yang, S. A Study on the Influence of Urban Park Location upon Housing Prices based on the Tiebout Choice Theory. Master’s Thesis, Ming Chuan University, Taipei, Taiwan, 2007. [Google Scholar]
- Immergluck, D. Large Redevelopment Initiatives, Housing Values and Gentrification: The Case of the Atlanta Beltline. Urban Stud. 2009, 46, 1723–1745. [Google Scholar] [CrossRef]
- Curran, W.; Hamilton, T. Just green enough: Contesting environmental gentrification in Greenpoint, Brooklyn. Local Environ. 2012, 17, 1027–1042. [Google Scholar] [CrossRef]
- Rigolon, A.; Németh, J. Green gentrification or ‘just green enough’: Do park location, size and function affect whether a place gentrifies or not? Urban Stud. 2020, 57, 402–420. [Google Scholar] [CrossRef]
- Baran, P.K.; Smith, W.R.; Moore, R.C.; Floyd, M.F.; Bocarro, J.N.; Cosco, N.G.; Danninger, T.M. Park Use Among Youth and Adults: Examination of Individual, Social, and Urban Form Factors. Environ. Behav. 2014, 46, 768–800. [Google Scholar] [CrossRef]
- Hangzhou Urban and Rural Construction Committee. Four-Year Action Plan for Comprehensive Transformation and Upgrading of Hangzhou Old Neighborhoods (2019–2022); Hangzhou Urban and Rural Construction Committee: Hangzhou, China, 2019.
- Hangzhou Municipal People’s Government. Official Data. 2023. Available online: https://www.hangzhou.gov.cn/art/2023/5/17/art_812262_59080303.html (accessed on 20 June 2024).
- Hangzhou Municipal Planning and Natural Resources Bureau. Special Plan for Green Space System in Hangzhou City (2021–2035); Hangzhou Municipal Planning and Natural Resources Bureau: Hangzhou, China, 2024.
- Pearsall, H.; Eller, J.K. Locating the Green Space Paradox: A Study of Gentrification and Public Green Space Accessibility in Philadelphia, Pennsylvania. Landsc. Urban Plan. 2020, 195, 103708. [Google Scholar] [CrossRef]
- Cohen, D.A.; Marsh, T.; Williamson, S. The Potential for Pocket Parks to Increase Physical Activity. Am. J. Health Promot. 2014, 28, 19–26. [Google Scholar] [CrossRef] [PubMed]
- Zhang, H.; Han, M. Pocket Parks in English and Chinese Literature: A Review. Urban For. Urban Green. 2021, 61, 127080. [Google Scholar] [CrossRef]
- Ding, W. Five major changes in Hangzhou after the G20 summit. Zhejiang Econ. 2019, 19, 55. (In Chinese) [Google Scholar]
- Kassens-Noor, E. Sustaining the Momentum: Olympics as Potential Catalyst for Enhancing Urban Transport. Transp. Res. Rec. 2010, 2187, 106–113. [Google Scholar] [CrossRef]
- Roche, M. Mega-Events and Modernity: Olympics and Expos in the Growth of Global Culture; Routledge: London, UK, 2000; pp. 276–277. [Google Scholar]
- Tziralis, G.; Tolis, A.; Tatsiopoulos, I. Economic aspects and the sustainability impact of the Athens 2004 Olympic Games. WIT Trans. Ecol. Environ. 2006, 98, 21–33. [Google Scholar]

| No. of Observations: 43,650 | |||||
|---|---|---|---|---|---|
| Variables | Descriptions | Mean | Min | Max | S.D. |
| Dependent variable | |||||
| Log of housing price | 10.429 | 8.332 | 11.513 | 0.444 | |
| Urban park variable | |||||
| DIN_PARK×AFTER | The additional housing price changes in the experimental group relative to the control group before and after the construction of the urban park (dummy) | 0.124 | 0 | 1 | 0.329 |
| DIN_PARK×AFTER×TYPEn | The additional housing price changes in the experimental group relative to the control group before and after the construction of a certain type of urban park (dummy) | ||||
| TYPE1 | Comprehensive park | 0.032 | 0 | 1 | 0.176 |
| TYPE2 | Theme park | 0.073 | 0 | 1 | 0.260 |
| TYPE3 | Community park | 0.055 | 0 | 1 | 0.227 |
| TYPE4 | Medium park | 0.067 | 0 | 1 | 0.250 |
| TYPE5 | Large park | 0.095 | 0 | 1 | 0.293 |
| Apartment-level variables | |||||
| Structure characteristics (Xh) | |||||
| Xh1 | Parking ratio | 1.031 | 0.02 | 93.8 | 4.506 |
| Xh2 | Green rate | 0.307 | 0.1 | 0.7 | 0.071 |
| Xh3 | Plot ratio | 2.137 | 0.4 | 4.8 | 0.664 |
| Xh4 | Building age | 14.306 | 1 | 48 | 7.442 |
| Neighborhood characteristics (Xa) | |||||
| Xa1 | No. of bus stops within 1.2 km | 29.724 | 8 | 61 | 8.357 |
| Xa2 | Distance to the closest subway (km) | 0.689 | 0.036 | 3.479 | 0.408 |
| Xa3 | No. of key primary schools | 0.689 | 0 | 1 | 0.367 |
| Xa4 | No. of hospitals | 0.753 | 0 | 3 | 0.879 |
| Xa5 | Is there a shopping center within 1.2 km (dummy: 1 = yes) | 0.889 | 0 | 1 | 0.314 |
| Xa6 | Are there any scenic spots within 1.2 km (dummy: 1 = yes) | 0.691 | 0 | 1 | 0.462 |
| Location characteristics (Xz) | |||||
| Xz1 | Distance to West Lake (km) | 6.77 | 0.215 | 21.148 | 4.494 |
| Xz2 | Distance to Qianjiang New City (km) | 11.162 | 0.495 | 21.927 | 4.559 |
| District-level variables | |||||
| POP | Log of population density | 8.925 | 7.76 | 9.514 | 0.395 |
| E | Log of per capita GDP | 12.002 | 11.154 | 13.052 | 0.557 |
| LS | Log of land supply | 4.928 | 3.745 | 6.151 | 0.659 |
| POL | Has the housing purchase restriction policy been restarted (dummy: 1 = yes) | 0.887 | 0 | 1 | 0.317 |
| Urban Park | Characteristics and Typical Use | Quantity |
|---|---|---|
| Community park | The land is independent and has basic recreational and service facilities, mainly green spaces for residents within a certain community to carry out daily leisure activities and services nearby. | 2 |
| Theme park | Green spaces with a specific content or form, with corresponding recreational and service facilities, mainly including zoos, botanical gardens, historic gardens, heritage parks, and amusement parks, as well as children’s parks, sports and fitness parks, waterfront parks, commemorative parks, sculpture parks, scenic beauty parks, urban wetland parks, and forest parks. | 5 |
| Comprehensive park | A green space with rich content, suitable for various outdoor activities, and complete recreational and supporting management service facilities. | 4 |
| Medium park | Parks with an area of 2–20 ha, including 20 ha. | 7 |
| Large park | Parks with an area of over 20 ha. | 4 |
| Model 1 | Model 2 Controlled for Apartment-Level Variables | Model 3 Controlled for District-Level Variables | |
|---|---|---|---|
| DIN_PARK×AFTER | 0.0970 *** | 0.0955 *** | 0.0881 *** |
| (0.0045) | (0.0044) | (0.0044) | |
| Xh1 | 0.7850 *** | 0.7674 *** | |
| (0.0718) | (0.0702) | ||
| Xh2 | −2.3381 *** | −2.1252 *** | |
| (0.3577) | (0.3612) | ||
| Xh3 | −0.0448 | −0.0567 * | |
| (0.0304) | (0.0300) | ||
| Xh4 | 0.0077 ** | 0.0050 | |
| (0.0034) | (0.0033) | ||
| Xa1 | 0.0198 *** | 0.0191 *** | |
| (0.0053) | (0.0052) | ||
| Xa2 | 0.4723 *** | 0.4264 *** | |
| (0.0910) | (0.0905) | ||
| Xa3 | −0.1374 *** | −0.1331 *** | |
| (0.0360) | (0.0353) | ||
| Xa4 | −0.0962 *** | −0.0859 *** | |
| (0.0284) | (0.0289) | ||
| Xa5 | 0.4412 *** | 0.3863 *** | |
| (0.1210) | (0.1192) | ||
| Xa6 | −0.1118 *** | −0.0921 *** | |
| (0.0358) | (0.0356) | ||
| Xz1 | −0.0381 * | −0.0453 ** | |
| (0.0212) | (0.0211) | ||
| Xz2 | 0.0141 | 0.0096 | |
| (0.0294) | (0.0287) | ||
| POP | 0.0297 *** | ||
| (0.0042) | |||
| E | 0.1631 *** | ||
| (0.0109) | |||
| LS | −0.0104 *** | ||
| (0.0022) | |||
| POL | −0.1349 *** | ||
| (0.0183) | |||
| Constant | 10.4172 *** | 9.2775 *** | 7.4229 *** |
| (0.0011) | (0.3299) | (0.3504) | |
| Dist FE | YES | YES | YES |
| Year FE | YES | YES | YES |
| Observations | 43,650 | 43,650 | 43,650 |
| R−squared | 0.806 | 0.807 | 0.810 |
| Model 4 Comprehensive Park | Model 5 Theme Park | Model 6 Community Park | Model 7 Medium Park | Model 8 Large Park | |
|---|---|---|---|---|---|
| DIN_PARK×AFTER×TYPE1 | 0.0950 *** | ||||
| (0.0121) | |||||
| DIN_PARK×AFTER×TYPE2 | 0.0046 | ||||
| (0.0100) | |||||
| DIN_PARK×AFTER×TYPE3 | 0.0031 | ||||
| (0.0084) | |||||
| DIN_PARK×AFTER×TYPE4 | 0.0176 * | ||||
| (0.0092) | |||||
| DIN_PARK×AFTER×TYPE5 | 0.0848 *** | ||||
| (0.0070) | |||||
| DIN_PARK×AFTER | 0.0689 *** | 0.0852 *** | 0.0869 *** | 0.0776 *** | 0.0256 *** |
| (0.0046) | (0.0095) | (0.0051) | (0.0085) | (0.0053) | |
| Constant | 7.0959 *** | 7.4029 *** | 7.4393 *** | 7.2304 *** | 7.4859 *** |
| (0.3636) | (0.3546) | (0.3514) | (0.3604) | (0.3484) | |
| Dist FE | YES | YES | YES | YES | YES |
| Year FE | YES | YES | YES | YES | YES |
| Observations | 43,650 | 43,650 | 43,650 | 43,650 | 43,650 |
| R−squared | 0.810 | 0.810 | 0.810 | 0.810 | 0.810 |
Disclaimer/Publisher’s Note: The statements, opinions and data contained in all publications are solely those of the individual author(s) and contributor(s) and not of MDPI and/or the editor(s). MDPI and/or the editor(s) disclaim responsibility for any injury to people or property resulting from any ideas, methods, instructions or products referred to in the content. |
© 2024 by the authors. Licensee MDPI, Basel, Switzerland. This article is an open access article distributed under the terms and conditions of the Creative Commons Attribution (CC BY) license (https://creativecommons.org/licenses/by/4.0/).
Share and Cite
Feng, S.; Zhuo, Y.; Xu, Z.; Chen, Y.; Li, G.; Wang, X. Nature’s Neighborhood: The Housing Premium of Urban Parks in Dense Cities. Land 2024, 13, 1686. https://doi.org/10.3390/land13101686
Feng S, Zhuo Y, Xu Z, Chen Y, Li G, Wang X. Nature’s Neighborhood: The Housing Premium of Urban Parks in Dense Cities. Land. 2024; 13(10):1686. https://doi.org/10.3390/land13101686
Chicago/Turabian StyleFeng, Siqi, Yuefei Zhuo, Zhongguo Xu, Yang Chen, Guan Li, and Xueqi Wang. 2024. "Nature’s Neighborhood: The Housing Premium of Urban Parks in Dense Cities" Land 13, no. 10: 1686. https://doi.org/10.3390/land13101686
APA StyleFeng, S., Zhuo, Y., Xu, Z., Chen, Y., Li, G., & Wang, X. (2024). Nature’s Neighborhood: The Housing Premium of Urban Parks in Dense Cities. Land, 13(10), 1686. https://doi.org/10.3390/land13101686