Article

Mapping Ecological Security Patterns Based on Ecosystem Service Valuation in the Qinling-Daba Mountain Area, China: A Multi-Scenario Study for Development and Conservation Tradeoffs

College of Public Administration, Central China Normal University, Wuhan 430079, China
*
Author to whom correspondence should be addressed.
Land 2024, 13(10), 1629; https://doi.org/10.3390/land13101629
Submission received: 8 September 2024 / Revised: 3 October 2024 / Accepted: 4 October 2024 / Published: 7 October 2024

Abstract

:
When focusing on biodiversity maintenance, ecological security pattern (ESP) planning gradually becomes a multi-objective planning strategy for sustainable development; wildlife conservation and ecosystem health maintenance should be balanced with local economic development and people’s livelihood enhancement goals. This study focuses on ESP mapping in the Qinling-Daba Mountain area, which is an ecologically significant and socioeconomically underdeveloped area. The tradeoff between conservation and development is made by varying the area of ecological sources and incorporating ecosystem service tradeoffs into ecological source identification through multi-scenario designation. ESPs under six scenarios were generated based on the minimum resistance model, and the important ecological corridors and strategic points in each scenario were identified and compared. The results show the following: (1) The scenario that sets around 30 percent of the study area as ecological sources maintains the integrity of natural ecosystems and leaves space for food and material supply to residents. (2) In this scenario, the ecological sources are connected by 60 corridors that cross 137 townships with high population densities (>100 people/km2) and intersect with major traffic lines at 71 points. Engineering, management, or education strategies must be taken in these townships or intersections to avoid human–wildlife conflicts. (3) The study area needs to construct both short (north–south) corridors linking proximate ecological sources for species’ daily movement and long (west–east) corridors connecting large and distant sources for species’ seasonal migration and gene flow. (4) The multi-scenario approach turns out to be an effective strategy for ESP planning with considerations for development–conservation tradeoffs.

1. Introduction

The Aichi Biodiversity Target 11 and the 30 × 30 Biodiversity Goal at COP28 proposed the construction of well-connected conservation systems to achieve global biodiversity conservation goals. The construction of connected conservation areas is also the focus of a few environmental and spatial planning approaches for sustainable development, such as greenways, green infrastructure, and ecological security patterns. Although taking care of biodiversity maintenance, these planning approaches are multifunctional. Greenways are corridors of land conserved for recreation, environmental protection, or both objectives. They emphasize the aesthetic and recreational services of ecosystems [1,2]. Green infrastructure is a strategically planned network of natural and semi-natural areas and other environmental features designed and managed to deliver a wide range of ecosystem services (ES) [3]. It recognizes the need to plan land use for specific purposes, such as farming, nature protection, and development, but also provides the tools and methods to identify needs and opportunities to enhance the environment and its functions [4]. Ecological security pattern (ESP) is similar to GI in regards to the connected conservation system and multifunctionality, but it emphasizes the landscape pattern–process interactions [5,6]. ESP is widely implemented by Chinese scholars and practitioners to ensure urban ecological security and achieve sustainability at different spatial scales [7,8,9,10]. In addition, ecological networks are also relevant to biodiversity conservation, representing the interactions between species within a community [11]. Simulating and understanding ecological networks will support environmental and spatial planning for biodiversity conservation. This study focuses on mapping ecological security patterns in the Qinling-Daba Mountain (QLDAM) area in China.
ESP is composed of ecological sources, ecological corridors, and strategic points [9,12]. Ecological sources are habitats for target species or areas that provide a wide range of ecosystem services (ESs) for human well-being [13,14]. Ecological corridors connect ecological sources, allowing for species migration or matter and energy delivery among them [14,15]. The least cost path analysis (minimum cumulative resistance model), connectivity analysis, and circuit theory have been used for identifying the potential corridors [6,16,17]. Strategic points are sites that are critical for ecological process maintenance and species dispersal or vulnerable to risks [18], including stepping stones and possible barriers. Possible barriers are sections of ecological corridors in which human activities are frequent, while stepping stones are locations that provide resting spots for species during long-distance migrations and therefore require particular attention [19] (Figure 1).
Early ESP construction usually focuses on biodiversity conservation, focusing on established protected areas (PAs) and creating their linkages [8,20]. Many documents, including Aichi Target 11 and the 30 × 30 Biodiversity Goal at COP28, propose incorporating the areas of particular importance for ecosystem services into the connected conservation system. As a result, ecosystem services gradually become an integral part of ESP planning [6,21]. Ecosystem services (ESs) are the benefits people obtain from ecosystems, which are categorized into provisioning, regulating, supporting, and cultural services in the MA framework [15]. Under many circumstances, the different categories of ESs are not in synergy in an area; ecosystem governance that aims to maintain and improve regulating services or biodiversity for distant stakeholders and future generations often leads to short-term losses of provisioning services for food, fuel, and other basic needs to local populations [22,23]. Under such circumstances, ESP becomes a multi-objective planning problem that needs to be made a tradeoff between conservation for biodiversity and ecosystem safety maintenance and development for local livelihood maintenance and improvement [24]. The tradeoffs were often made through multi-scenario designation by varying the weights or ranking of different categories of ES in ecological source identification [25,26,27]. As a result, the number, area, and spatial distribution of ecological sources, as well as the spread of ecological corridors, differ in different scenarios, which provide decision-makers alternatives to compare.
So far, most research has concentrated on the urban scale, taking specific administrative boundaries as the scope [28,29,30]. However, many protected areas cover multiple administrative units, and the corridors that connect them also cross the administrative boundaries. Moreover, most ecological processes, such as species dispersal and hydrological and climatic processes, are impacted by natural barriers instead of administrative boundaries. Therefore, ESP study in a physical geographical region is necessary. Except for the above reason, the physical and socioeconomic specificity of the Qinling-Daba Mountain area also highlights the significance of this study. This area is one of China’s National Key Ecological function areas for biodiversity conservation. Many endemic species are disturbed in this area, including the Sichuan golden monkey, crested ibis, giant panda, and takin. Meanwhile, it used to be a spatial contiguous poverty-stricken area, where people’s livelihoods depended significantly on the products provided by forests and slope farmlands. Setting a high percentage of conservation areas and restricting slope farming will promote supporting, regulating, and cultural (especially aesthetic and scientific value) services of ecosystems but possibly harm the livelihoods of the local residents. Therefore, setting an appropriate proportion of core conservation areas and making tradeoffs between provisioning services and other services are challenging but of vital importance in ESP planning in the study area. Multi-scenario designation is a feasible approach for solving both problems.
This study focuses on ESP in the Qinling-Daba Mountain area based on ecosystem service valuation. Multiple scenarios were designed by varying the total area of core conservation areas (ecological sources) and making tradeoffs between provisioning services and other services. This study will provide multiple alternatives for decision-makers to balance ecosystem conservation and socioeconomic development goals.

2. Materials and Methods

2.1. Study Area

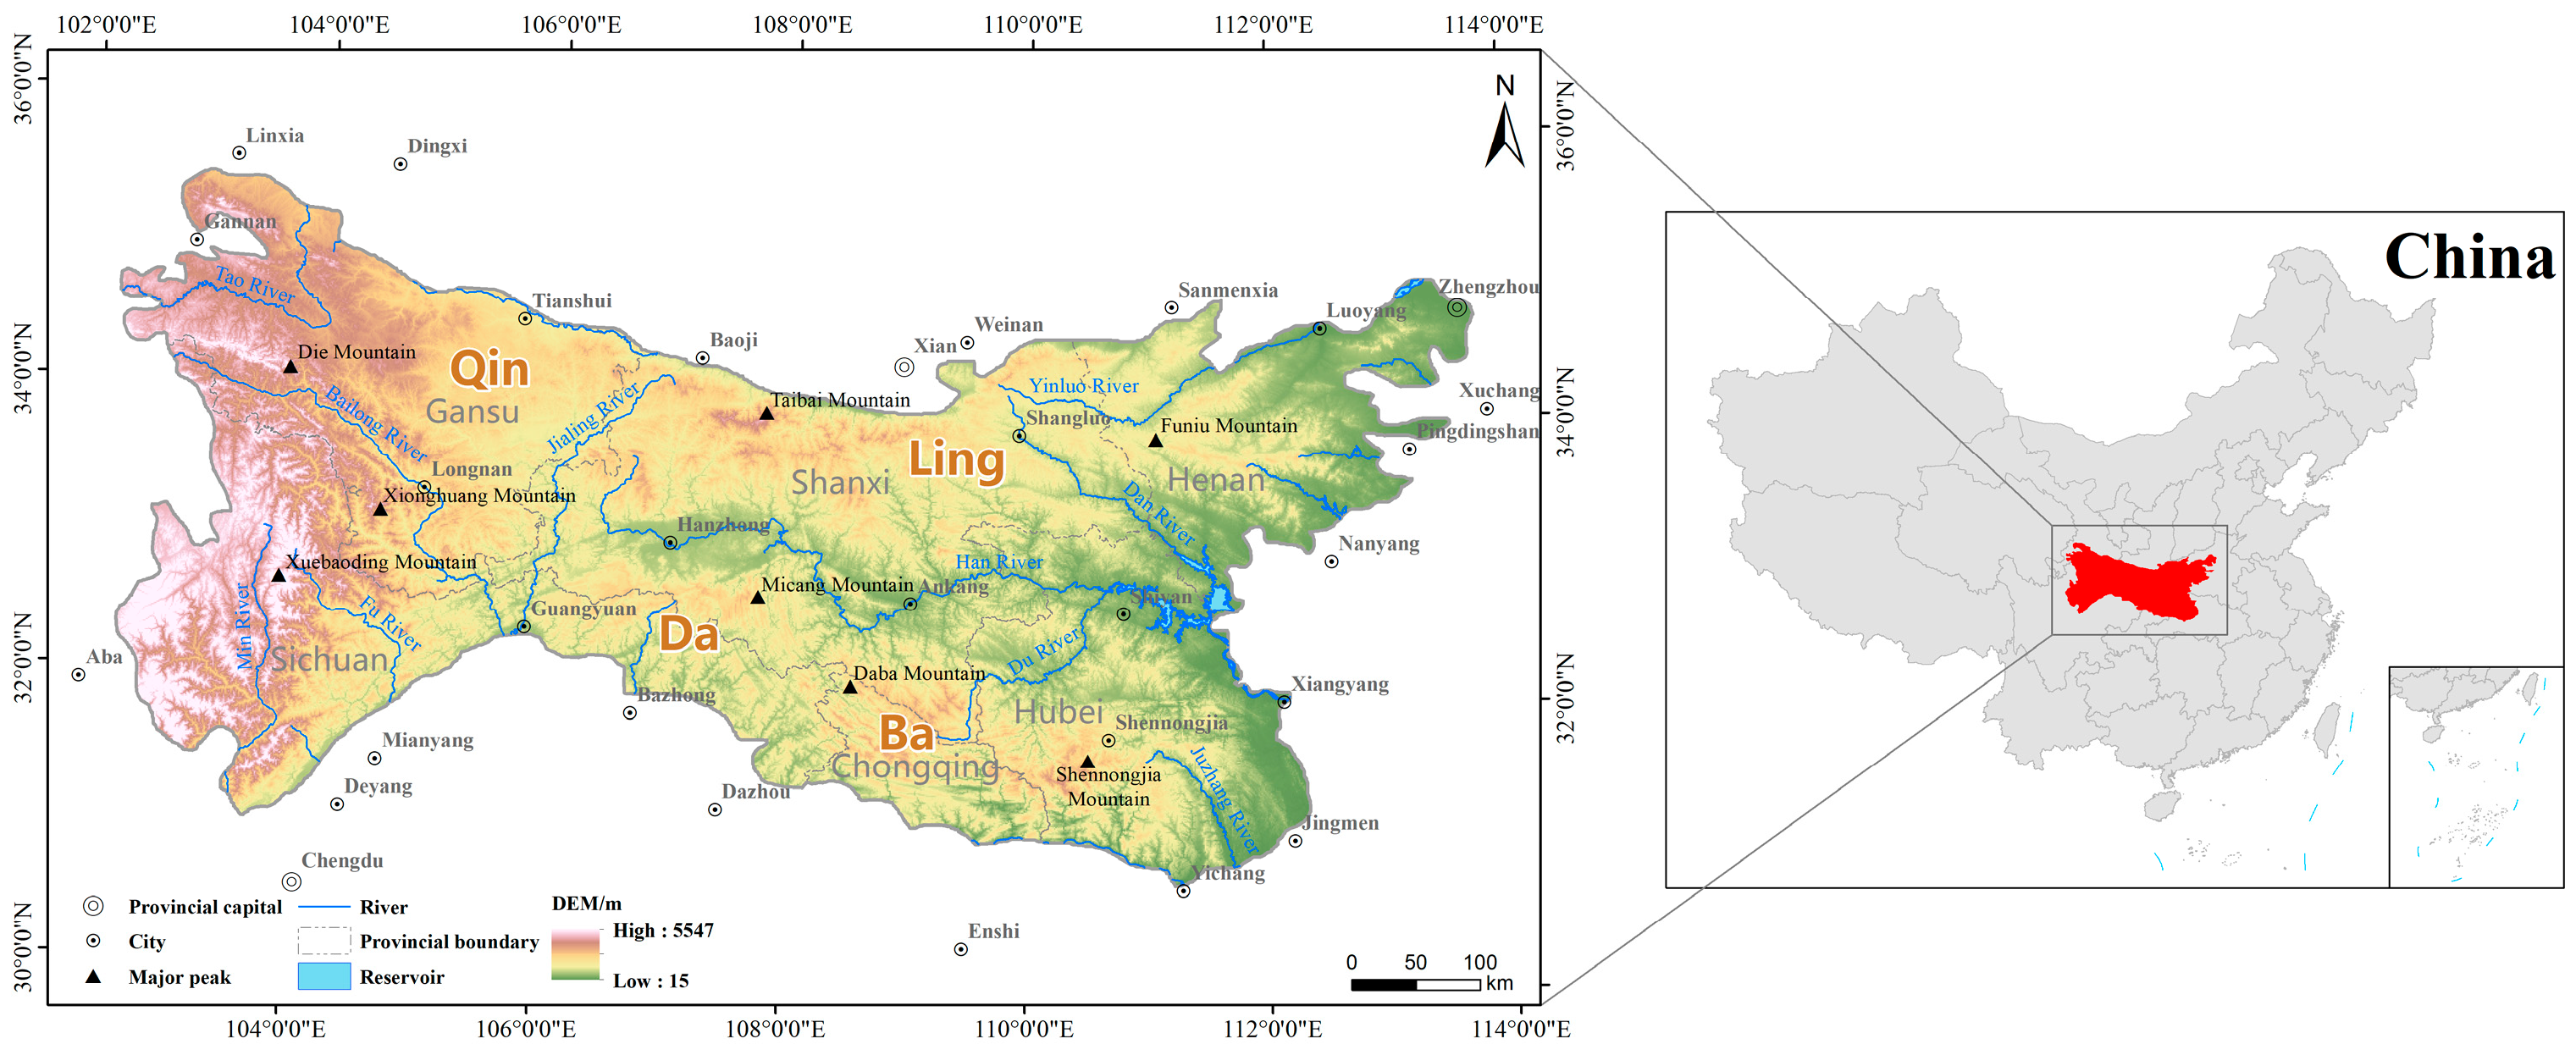
The Qinling-Daba Mountain area in central China spans the following six provinces and cities: Gansu, Shaanxi, Henan, Hubei, Chongqing, and Sichuan. Covering an area of about 300,000 km2, it extends from the eastern edge of the Qinghai-Tibet Plateau to the southwestern part of the North China Plain (Figure 2). This area includes the Qinling Mountain, Hanjiang River Valley Basin, and Daba Mountain. The Qinling Mountain marks its northern boundary, while the Micang-Daba Mountain forms the southern boundary. The area is characterized mainly by mountainous and hilly landforms interspersed with basins like Hanzhong, Ankang, Shangdan, and Huicheng. This region serves as China’s north–south transitional zone, delineating the boundaries between China’s northern and southern regions, the subtropical and warm temperate zones, and the Yangtze River and Yellow River basins. Recognized as one of China’s biodiversity hotspots, the Qinling-Daba Mountain area is rich in the distribution of endemic species, including the Sichuan golden monkey, crested ibis, giant panda, and takin. Furthermore, it is a large-scale ecological corridor linking the Qinghai-Tibet Plateau with plains in east China, affecting the nation’s biodiversity. Spanning the Yangtze, Yellow, and Huai River basins, this area is the source of several rivers, including the Huai, Hanjiang, Danjiang, and Luo rivers. The Qinling-Daba Mountain area was once an area of concentrated and contiguous poverty. Although it has been lifted out of poverty, it still faces critical economic and social development tasks. It is necessary to weigh conservation and development objectives in the ESP planning.

2.2. Data Sources

The datasets used in this study include vector, raster, and statistical data, as shown in Table 1. All datasets were resampled to 1000 m × 1000 m to maintain data consistency, and the projected coordinate system was standardized to WGS_1984_UTM_Zone_49N.

2.3. Methodology

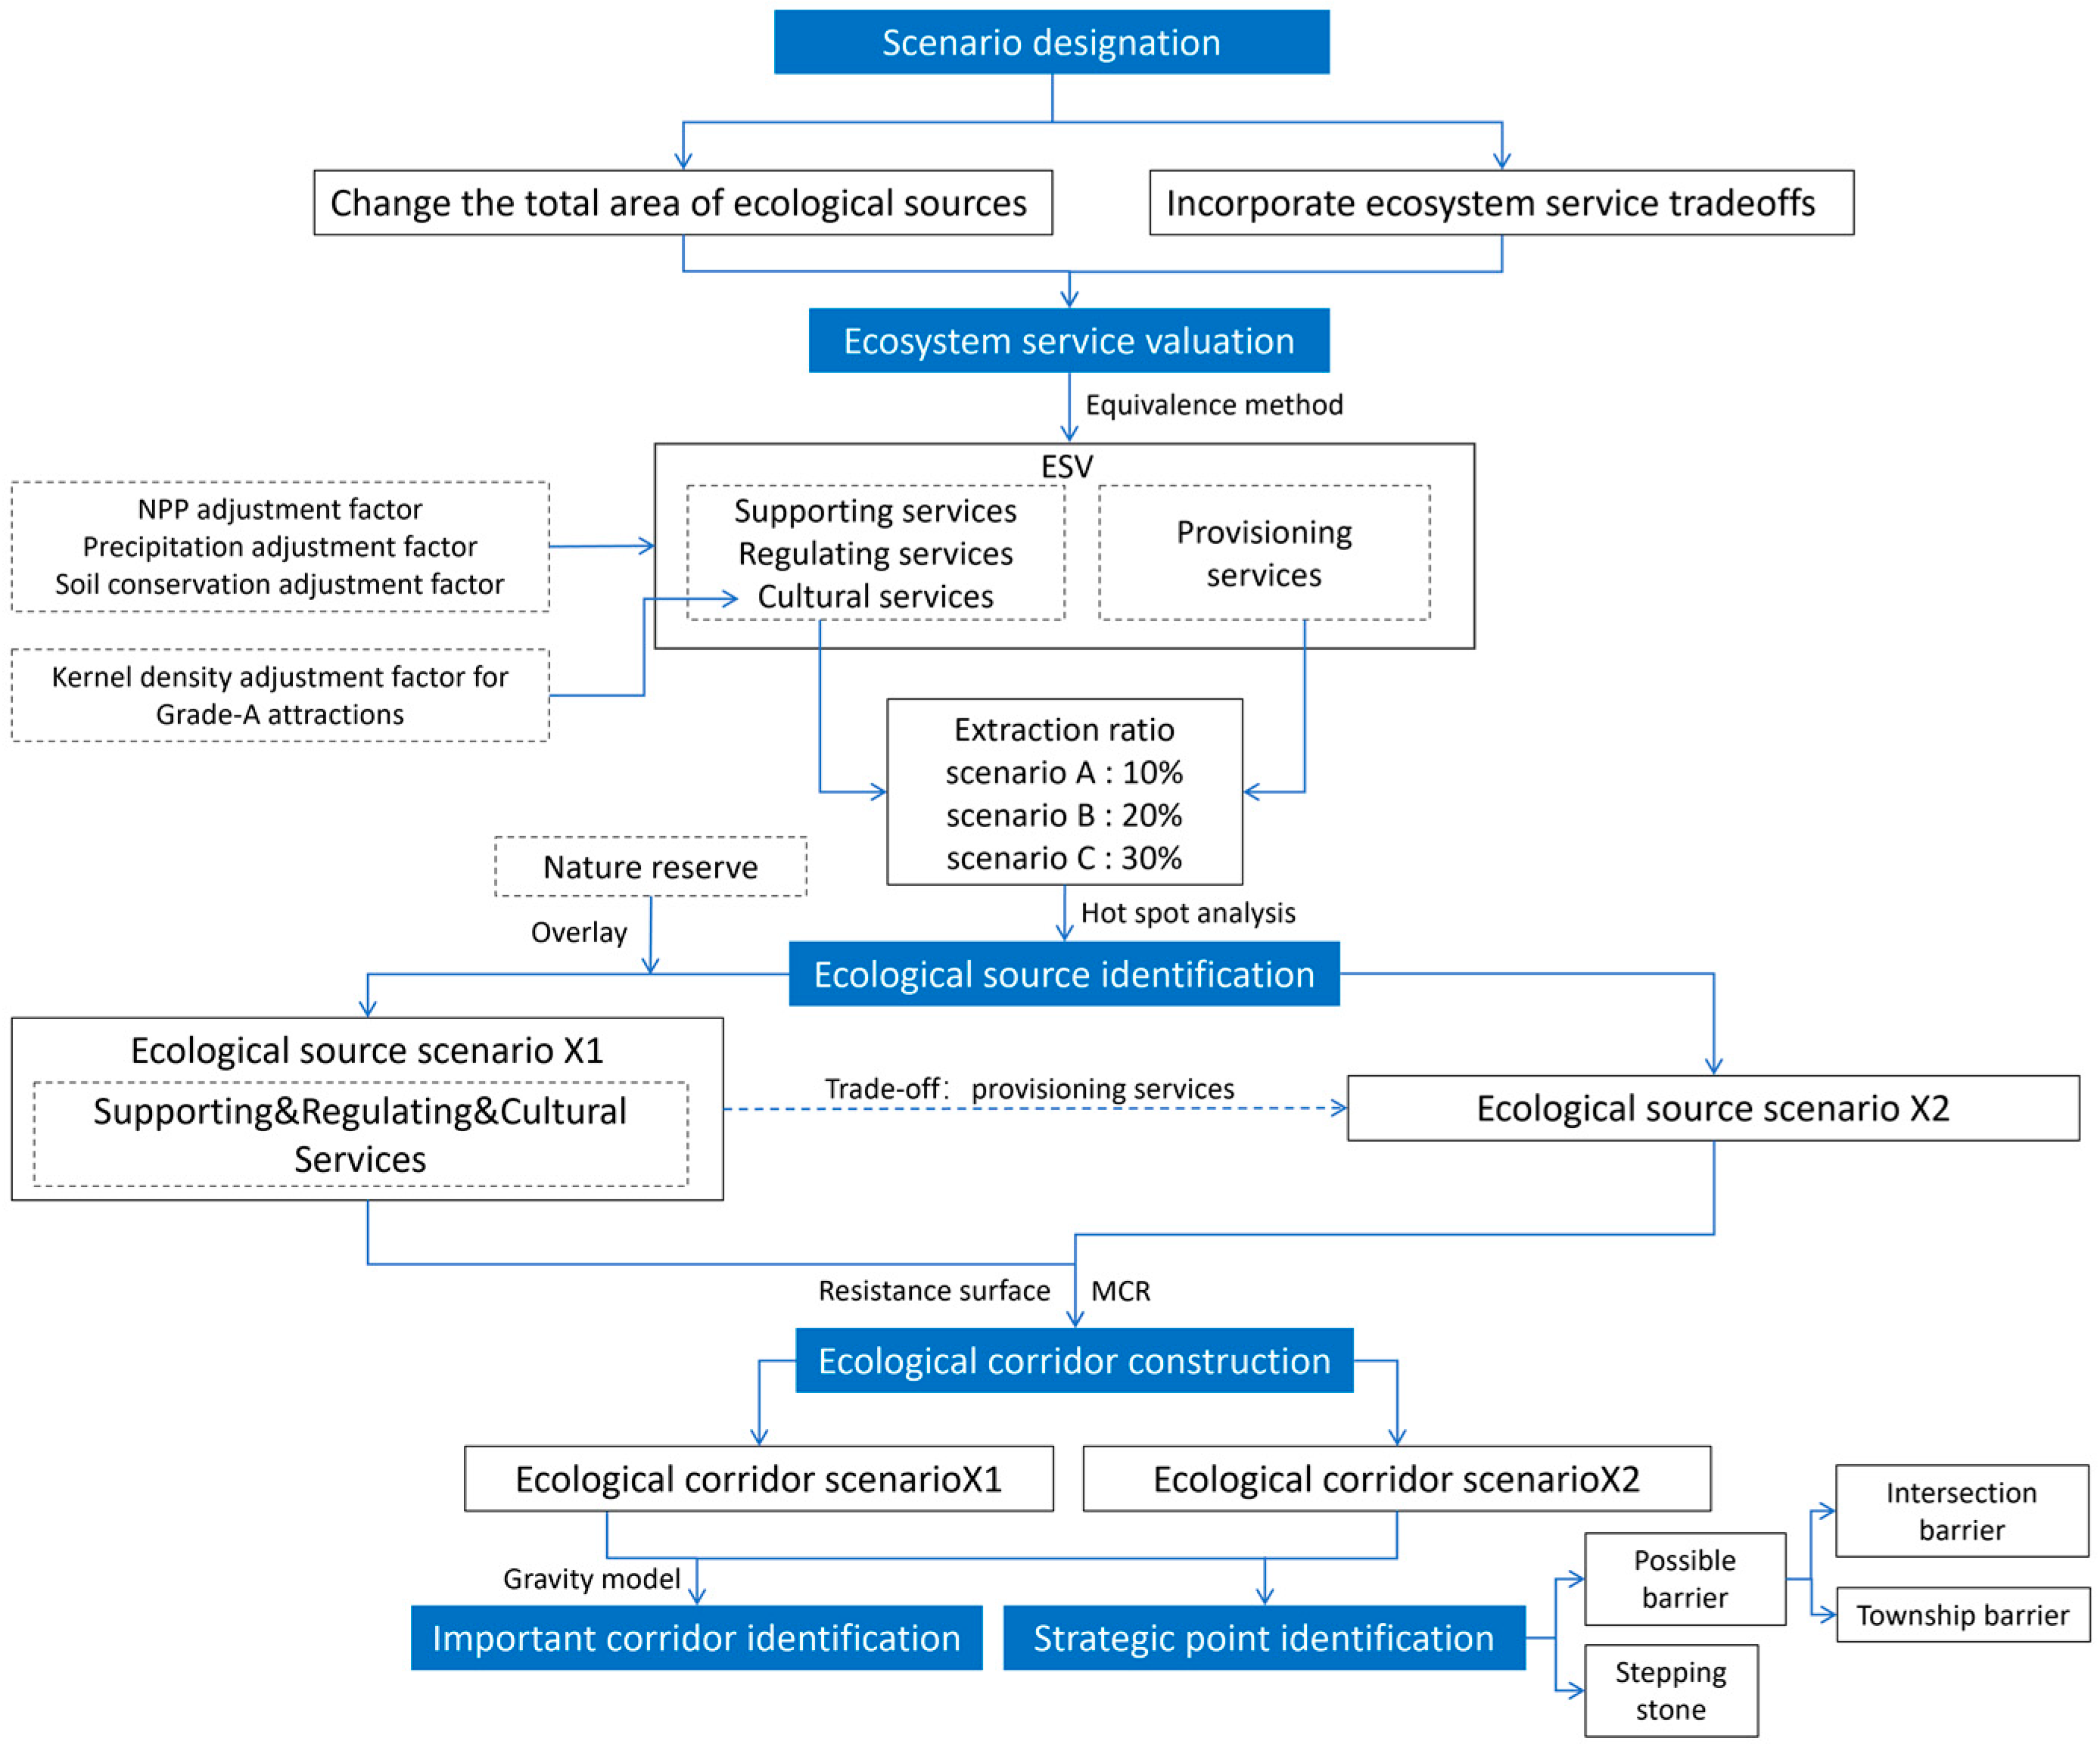
We started the empirical study with the scenario design and followed the “source-corridor” framework for ESP mapping that comprised the following four main procedures: identifying ecological source identification, constructing ecological resistance surfaces, simulating ecological corridors, and identifying strategic points [14,33]. The workflow of this study is shown in Figure 3. The methods for each procedure are explained in detail below.

2.3.1. Scenario Designation

We handled the conservation–development tradeoff problem by mapping the ecological security patterns in multiple scenarios. Since the area and spatial distribution of ecological sources shape the structure and function of ESPs, we designed six scenarios by modifying the area and spatial distribution of ecological sources (Table 2). Referring to many studies on ESP, we regarded the areas with high regulating, supporting, and cultural service values as ecological sources [14,34,35].
On the one hand, the total area of ecological sources impacts the tradeoff between conservation and development. More and larger areas of ecological sources set for conservation will limit the space for human development. Many ESP mapping and planning studies extract the top 20 percent of areas for ES values and set them as ecological sources [36,37,38,39]. We use the 10%, 20%, and 30% extraction ratios for the following three reasons: (1) The area of established nature reserves (NRs) accounts for about 12 percent of the study area. (2) The area of protected areas (PAs) (including NRs, forest parks, geological parks, and wetland parks) accounts for about 21% of the study area [40]. (3) According to the Blue Book of China’s Ecological Protection Red Line (2023) [41], the Chinese government set around 30 percent of the terrestrial area as the ecological redline area (core conservation area). In the scenario designation, the total area of ecological sources increases with the rise in the extraction ratio from Scenario A to C.
On the other hand, the tradeoff between provisioning services and other services is also relevant to the development–conservation tradeoff. Food and raw materials supplied by ecosystems support local people’s livelihoods and provide them with development opportunities. However, establishing protected areas to maintain support, regulation, and cultural services may hinder the acquisition of these resources, thereby adversely affecting local communities’ livelihoods and potentially slowing economic development. In the scenario designation, the tradeoff between provisioning services and other services is made in Scenarios A2, B2, and C2, which impacts both the area and spatial distribution of ecological sources.

2.3.2. Methods for Ecosystem Service Valuation

The unit-based method was implemented to assess ES value in the study area, by which ESV was estimated based on the ecosystem types and adjusted with the biophysical and socioeconomic characteristics of a specific unit. The ESV evaluation comprises the following four main steps: (1) establishing an equivalent coefficient table, (2) estimating the value of a standard equivalent factor, (3) estimating the ecosystem-based ES value, and (4) amending ecosystem-based ES values by applying spatial adjustment factors. The methods for each step are illustrated below.
(1) Equivalent coefficient table establishment
The equivalent coefficient table provides the relative value of ES provided by different ecosystems [42]. Based on Costanza et al.’s worldwide study, Xie et al. established the equivalent coefficient table for the 11 ESs of 14 ecosystems in China (Appendix B) [42]. We applied this table for this study. The coefficient for each service indicates its relative value to the standard equivalent factor.
(2) Standard equivalent factor (SEF) valuation
The value of the SEF is estimated based on the food production service value of farmland, which is relatively easier to estimate with the available market data. Xie et al. estimated the SEF value as the net profits obtained through cultivating 1 hm2 of farmland for grains. However, since the profit data are hard to obtain at the national level and vary significantly among different regions, Xie et al. also proposed to set the SEF value as 1/7 of the national average market value of grains yielded by 1 hm2 of farmland [43].
We referred to Xie et al.’s research but estimated SEF value based on the market value of grains in the QLDBM area rather than that in the whole country [43]. The value of SEF in the QLDAM area was calculated based on the grain yield, planting, and market data with Formula (1). The data of three major grain crops (rice, wheat, corn) in the 31 prefecture-level cities in the QLDAM area were used for the calculation. The value of the SEF is estimated as CNY 1794.31/hm2.
E a = 1 7 i = 1 n m i p i q i M , i = 1,2 , , n
In the formula, E a is the economic value of food production services per unit area of farmland ecosystem; i is the variety of food crop; n is the number of grain crop varieties; m i is the planting area with i t h grain crop variety; p i is the average national price of i t h grain crop variety; q i is the yield per unit area of i t h grain crop variety; and M is the total planting area with all varieties of grain crops.
(3) Ecosystem-based ES value estimation
Based on the equivalent coefficient table (Appendix B), ecosystem map (Appendix A), and SEF value in the QLDBM area, the ecosystem-based ES values were estimated using Formulas (2) and (3), and the results are shown in Table 3.
V C i j = e i j E a
In the formula, V C i j is the value coefficient of the j t h ES for the i t h ecosystem type; e i j is the equivalent factor of the j t h ES in the i t h ecosystem type; i is the ecosystem type; and j is the type of individual ES function.
E S V j = A i × V C i j
In the formula, E S V j is the value of each unit’s j t h ES, and A i is the area of the i t h ecosystem type within each unit.
(4) Ecosystem-based ES value adjustment
The ecosystem-based ES values overlook the spatial heterogeneity of other biophysical and socioeconomic factors, except for the ecosystem type. Xie et al. proposed adjustment methods based on some natural factors, such as biomass (NPP), precipitation, and soil conservation [42]. However, they failed to consider the impact of socioeconomic factors on ES values, particularly cultural service values.
This study considers the spatial heterogeneity of cultural services within the study area. We use the kernel density value of A-level scenic spots to adjust the cultural service value (Formula (4)). An A-level scenic spot is certified by the Chinese government, indicating that the area has high aesthetic, recreational, or educational value for developing tourism. The kernel density map of A-level scenic spots was produced in ArcGIS, and the scenic spot adjustment factor (Cij) was calculated based on Formula (4).
C i j = A i j / A ¯
In the formula, C i j is the adjustment factors of A-level scenic spots in the j t h year in the i t h region of the ecosystem type; A i j is the value of kernel density of A-level scenic spots in the j t h year in the i t h region of the ecosystem type; and A ¯ denotes the national annual average kernel density of A-level scenic spots per unit area in the j t h year.
Then the NPP, precipitation, soil conservation, and scenic spot adjustment factors were applied to adjust the ecosystem-based ES values based on Formula (5).
E S V n i j = P i j × E S V n 1                       or R i j × E S V n 2                       or S i j × E S V n 3                         or P i j × C i j × E S V n 4          
In the formula, E S V n i j is the ES value of the n t h type of ES function in the j t h year of the i t h region; E S V n is the n t h type of ES value of that ecosystem type; P i j is the NPP adjustment factor in the j t h year of the i t h region of that ecosystem type; R i j is the precipitation adjustment factor in the j t h year of the i t h region of that ecosystem type; S i j is the soil conservation adjustment factor in the j t h year of the i t h region of that ecosystem type, and the formula for calculating the three adjustment factors is described in the study by Xie et al. [42]; n 1 denotes the service of food production, raw material production, gas regulation, climate regulation, environment decontamination, and maintenance of nutrient cycling; n 2 denotes the service of hydrological regulation; n 3 denotes the service of soil conservation; and n 4 denotes the service of aesthetic landscapes.

2.3.3. Method for Ecological Corridor Construction: Minimum Cumulative Resistance Model

The minimum cumulative resistance model (MCR) [44] is used to simulate the ecological corridors linking ecological sources. The formula is as follows:
M C R = f m i n j = n i = m D i j × R i
In the formula, M C R is the minimum cumulative resistance value; D i j is the spatial distance of the species from the source j to the landscape unit i ; R i is the resistance value to the migration of the species at the landscape unit i ; and f m i n is a positive function, indicating that the MCR value is positively correlated to the value of D i j and R i .
The resistance value is obtained from the comprehensive resistance surface. The topography, water systems, and vegetation of the QLDAM area are the most important ecological attributes, with human activities posing ecological stress and soil erosion representing ecological risk [44]. Therefore, this study uses land use types, elevation, slope, vegetation coverage, and distances to major roads, railways, water systems, and built-up areas as indicators to construct a comprehensive resistance surface based on the review and reflection of the following related studies [10,45,46,47,48]. Referring to previous research results [44,49,50], resistance coefficients and weights were assigned (Table 4), and a raster calculator was used to perform weighted summation to obtain the comprehensive resistance surface of the QLDAM area.

2.3.4. Method for Important Ecological Corridor and Strategic Point Identification

Gravity models quantitatively evaluate the interaction strength between ecological sources to assess the importance of ecological corridors. The stronger the interaction, the more important the ecological corridor [51]. When using the gravity model to select important ecological corridors, corridors that link authentic, neighboring, or large-scale ecological sources are more likely to be selected as important corridors. This selection strategy is based on several considerations. First, ecological sources with lower ecological resistance typically reflect better environmental integrity and naturalness, presenting fewer barriers to species migration and dispersal. Second, species prefer paths that minimize distance and migration costs during migration, enhancing the path’s prominence in the EN. Third, large-scale ecological sources often support diverse ecosystems and richer biological communities. Corridors linking large-scale sources are therefore evaluated as more important. Additionally, the area of ecological sources is logarithmically transformed to increase the model’s sensitivity to small-area sources.
In this study, the gravity model was utilized to classify the ecological corridors into important ecological corridors and general ecological corridors. The formula is as follows:
G a b = N a N b D a b 2 = 1 P a × l n S a 1 P b × l n S b L a b L m a x 2 = L m a x 2 l n S a l n S b L a b 2 P a P b
In the formula, G a b is the interaction strength between ecological sources a and b ; N a and N b are the weight values of ecological sources a and b , respectively; D a b is the standard value of ecological corridor resistance; P a ( P b ) and S a ( S b ) denote the average value of resistance and area of ecological sources a ( b ) , respectively; L a b is the cumulative value of the corridor resistance between the two sources; and L m a x is the maximum value of corridor resistance in the study area. The threshold value was set to 5; the corridor with the G a b value higher than 5 is regarded as important ecological corridors.
As for strategic point identification, this study identifies the intersections of two ecological corridors or those of ecological corridors and waterbodies as “stepping stones” facilitating species migration [52]. In contrast, the intersections between ecological corridors and the sites with intensive human activity are taken as “possible barriers”, which hinder species movement and increase migration challenges between different ecological sources. Specifically, this study sets the intersections of ecological corridors and transportation lines (mainly highways and railways) as “intersection barriers” [53] and identifies townships on ecological corridors and with high population density (population density > 100 people/km2) as “township barriers”.

3. Results

3.1. Ecosystem Service Values

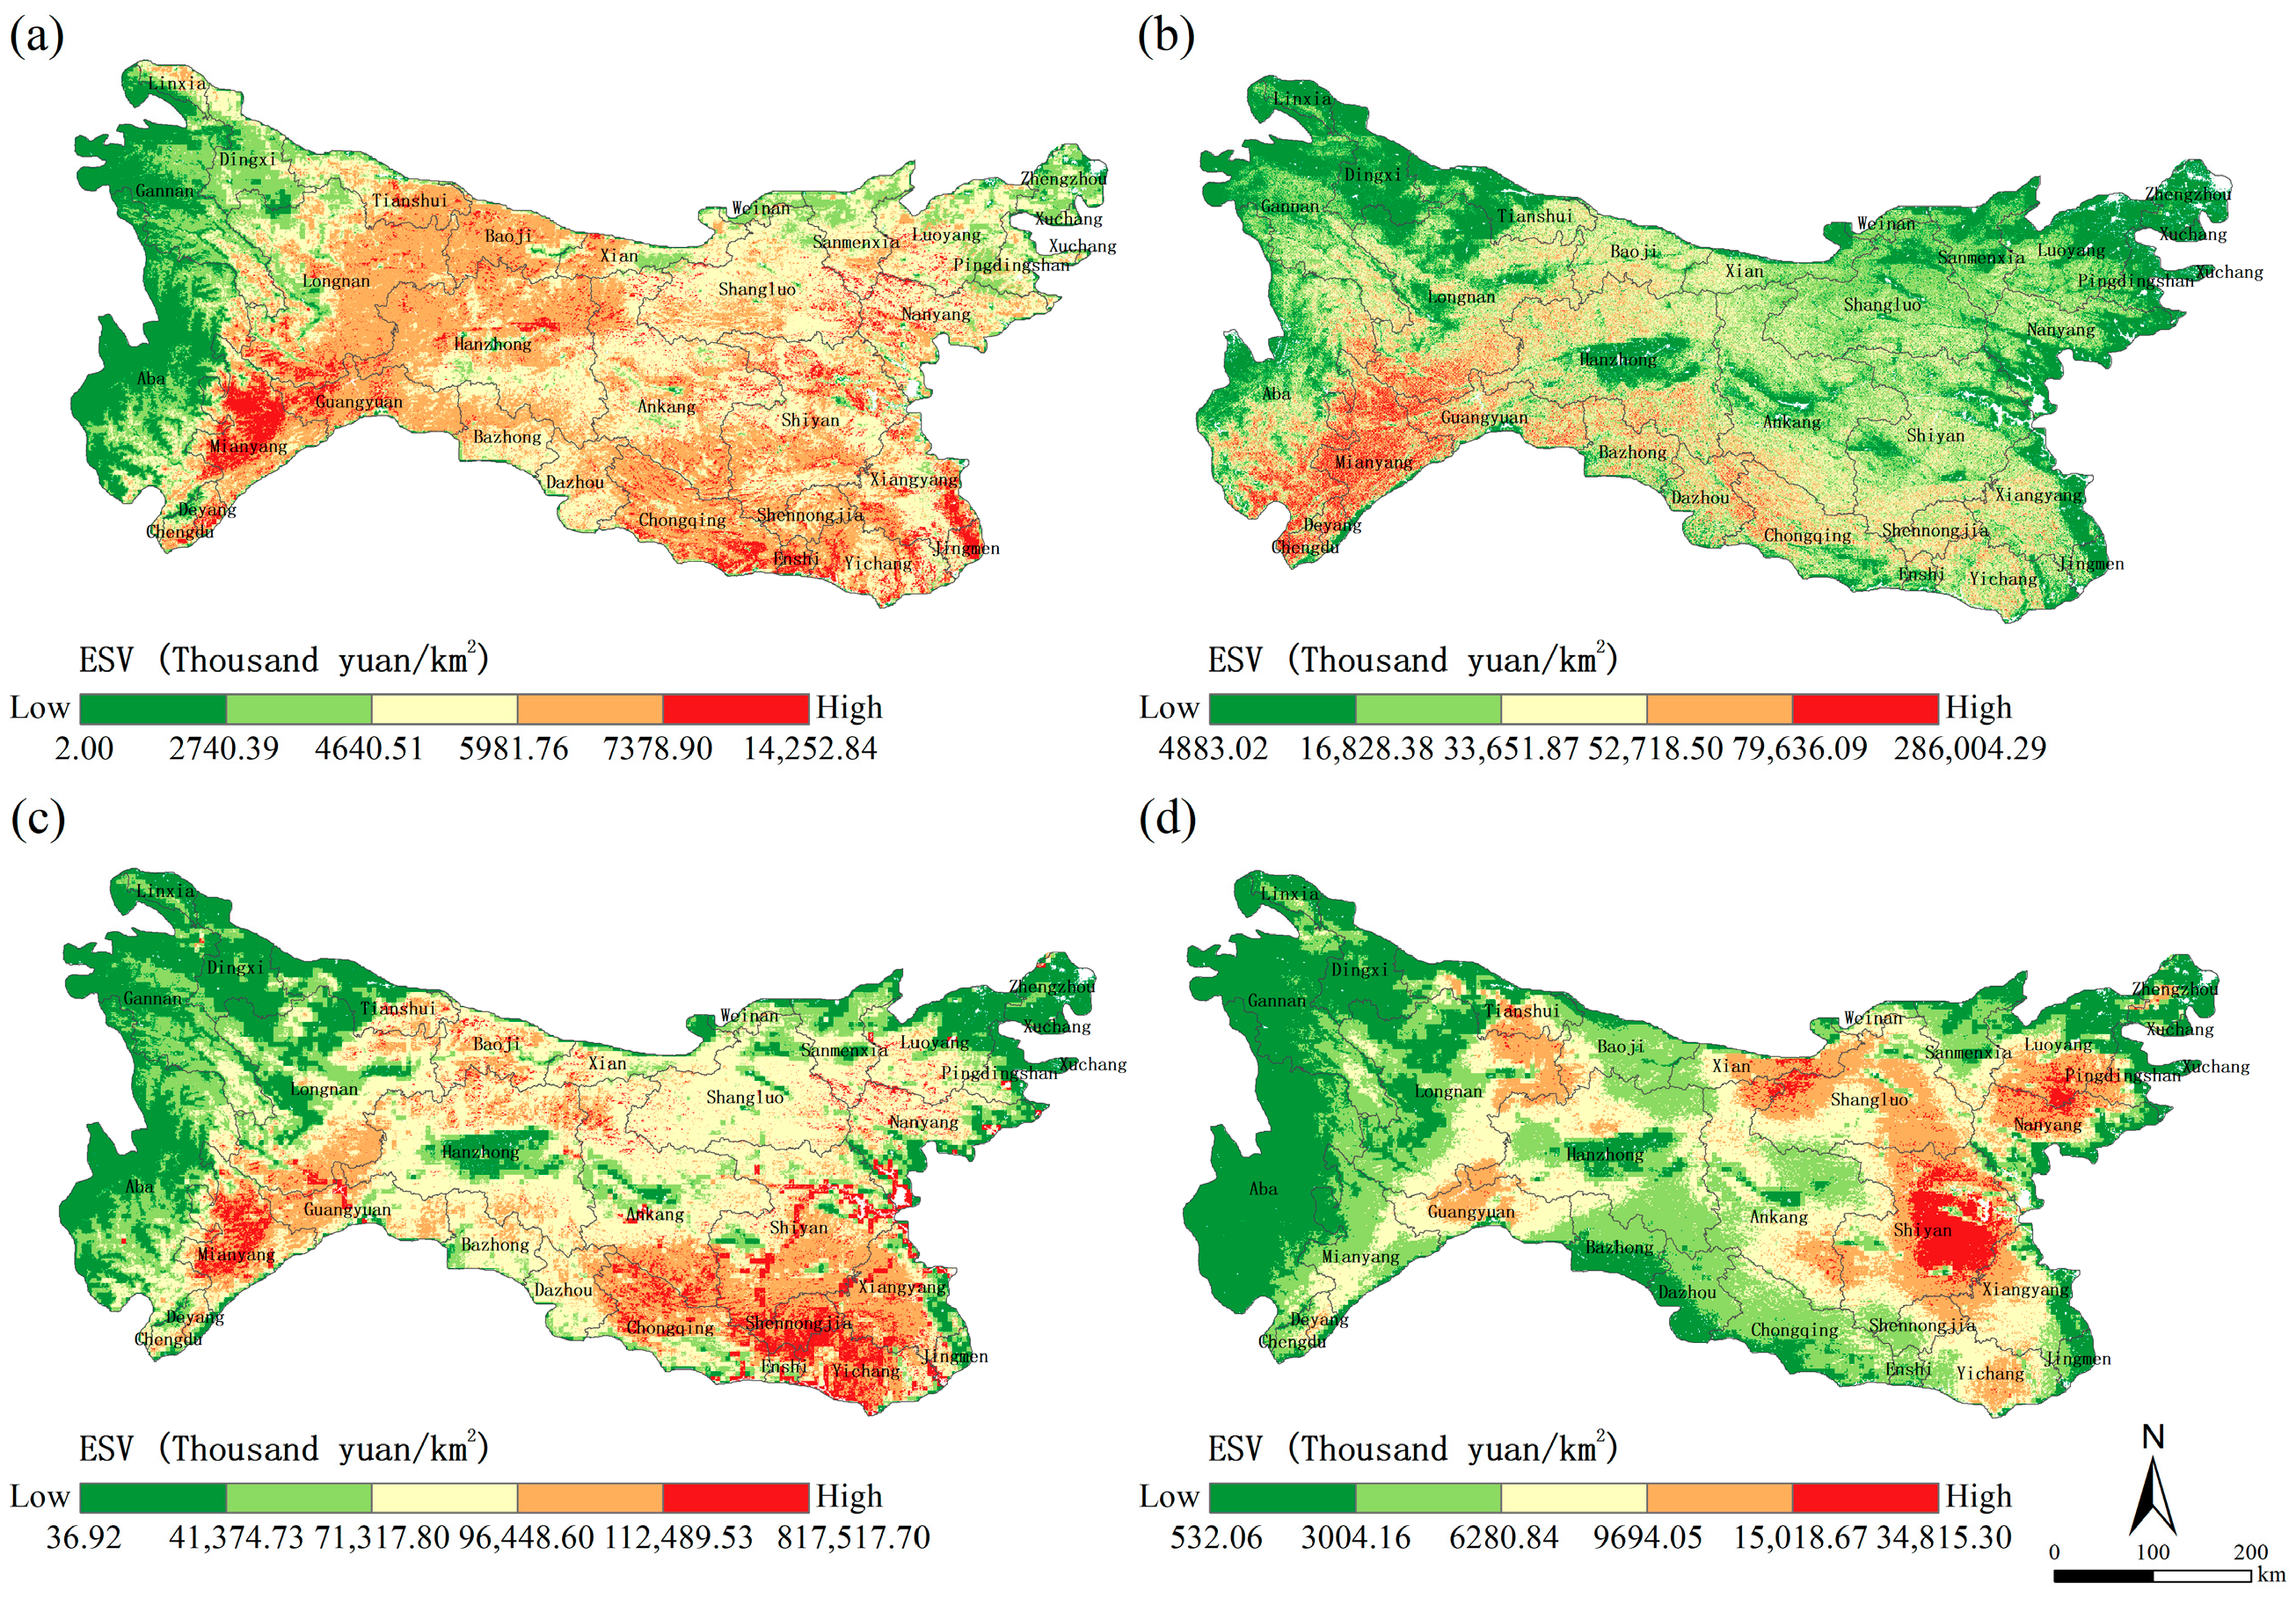
This study uses the equivalence factor method and relevant factor adjustments to calculate the value of various ESs. Based on the natural breakpoint grading method, these ESs are divided into five levels. As shown in Figure 4, in 2020, the value of four types of ESs in the QLDAM area exhibited significant spatial heterogeneity. High-value areas for provisioning services are mainly distributed in Mianyang City of Sichuan, eastern and southwestern Hubei, and southern Chongqing. In Mianyang City, the primary land use type is forest, which is dominated by raw material supply, while other high-value regions are primarily farmland in plains with high food supply service value. High-value areas for supporting services are mainly located in the southwestern QLDAM area, Micang Mountain, and western Daba Mountain. These areas have rich forest resources, high vegetation coverage, higher altitudes, and minimal human disturbance, which better support soil conservation, nutrient cycling, and biodiversity maintenance functions. High-value areas for regulating services are mainly in Mianyang City of Sichuan, Daba Mountain, Shennongjia, Funiu Mountain, and the northern part of the Hanzhong Basin. These areas have high NPP, significant terrain undulation, dense vegetation, and favorable hydrothermal conditions, which enhance the ecosystem’s gas regulation, climate regulation, environment purification, and hydrological regulation functions. High-value areas for cultural services are mainly in Funiu Mountain, Shiyan City of Hubei, western Zuoshui County of Shaanxi, and northeastern Ningshan County. These areas have a high density of national A-level scenic spots, with diverse natural and cultural landscapes, providing higher value for ecological tourism and scientific research.
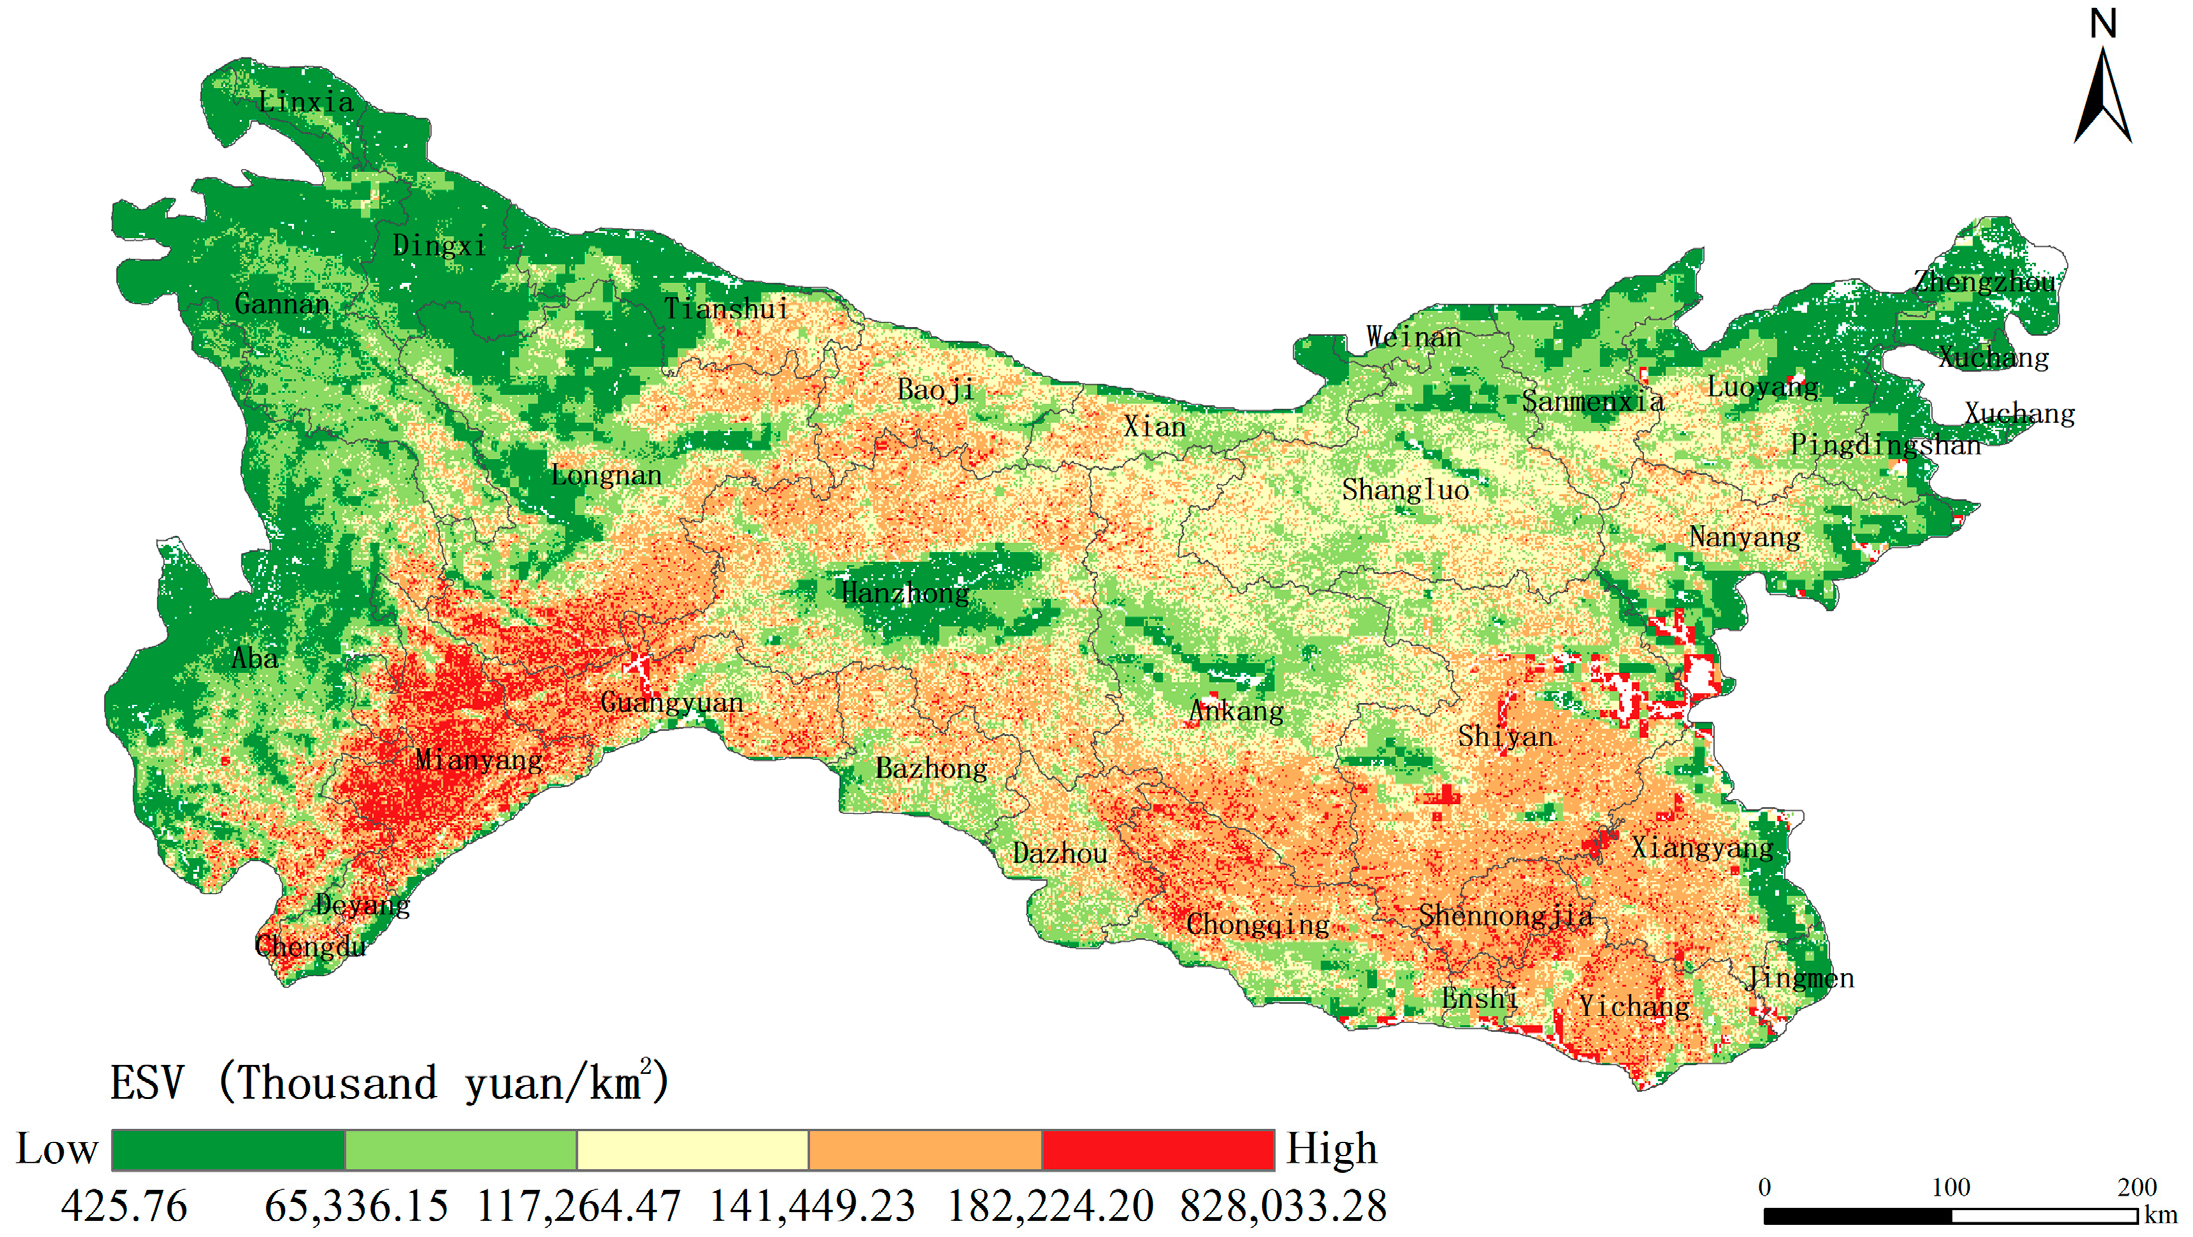
The spatial distribution of the aggregated values of ecosystem support, regulation, and cultural services is illustrated in Figure 5. Overall, the ES values exhibit a trend of being higher in the south and lower in the north. High-value regions are primarily concentrated in the northern part of the Hanzhong Basin, near the Taibai Mountain, the southeastern Daba Mountains and Shennongjia forest area, the southern Micang Mountain, and the southwestern Mianyang area. Low-value regions are mainly located in the Hanzhong Basin, the northeastern areas around Zhengzhou, Xuchang, and Luoyang, the eastern edge regions, the northwestern areas along the Tao River, and the regions west of the Min River.

3.2. Distribution of Ecological Sources in Different Scenarios

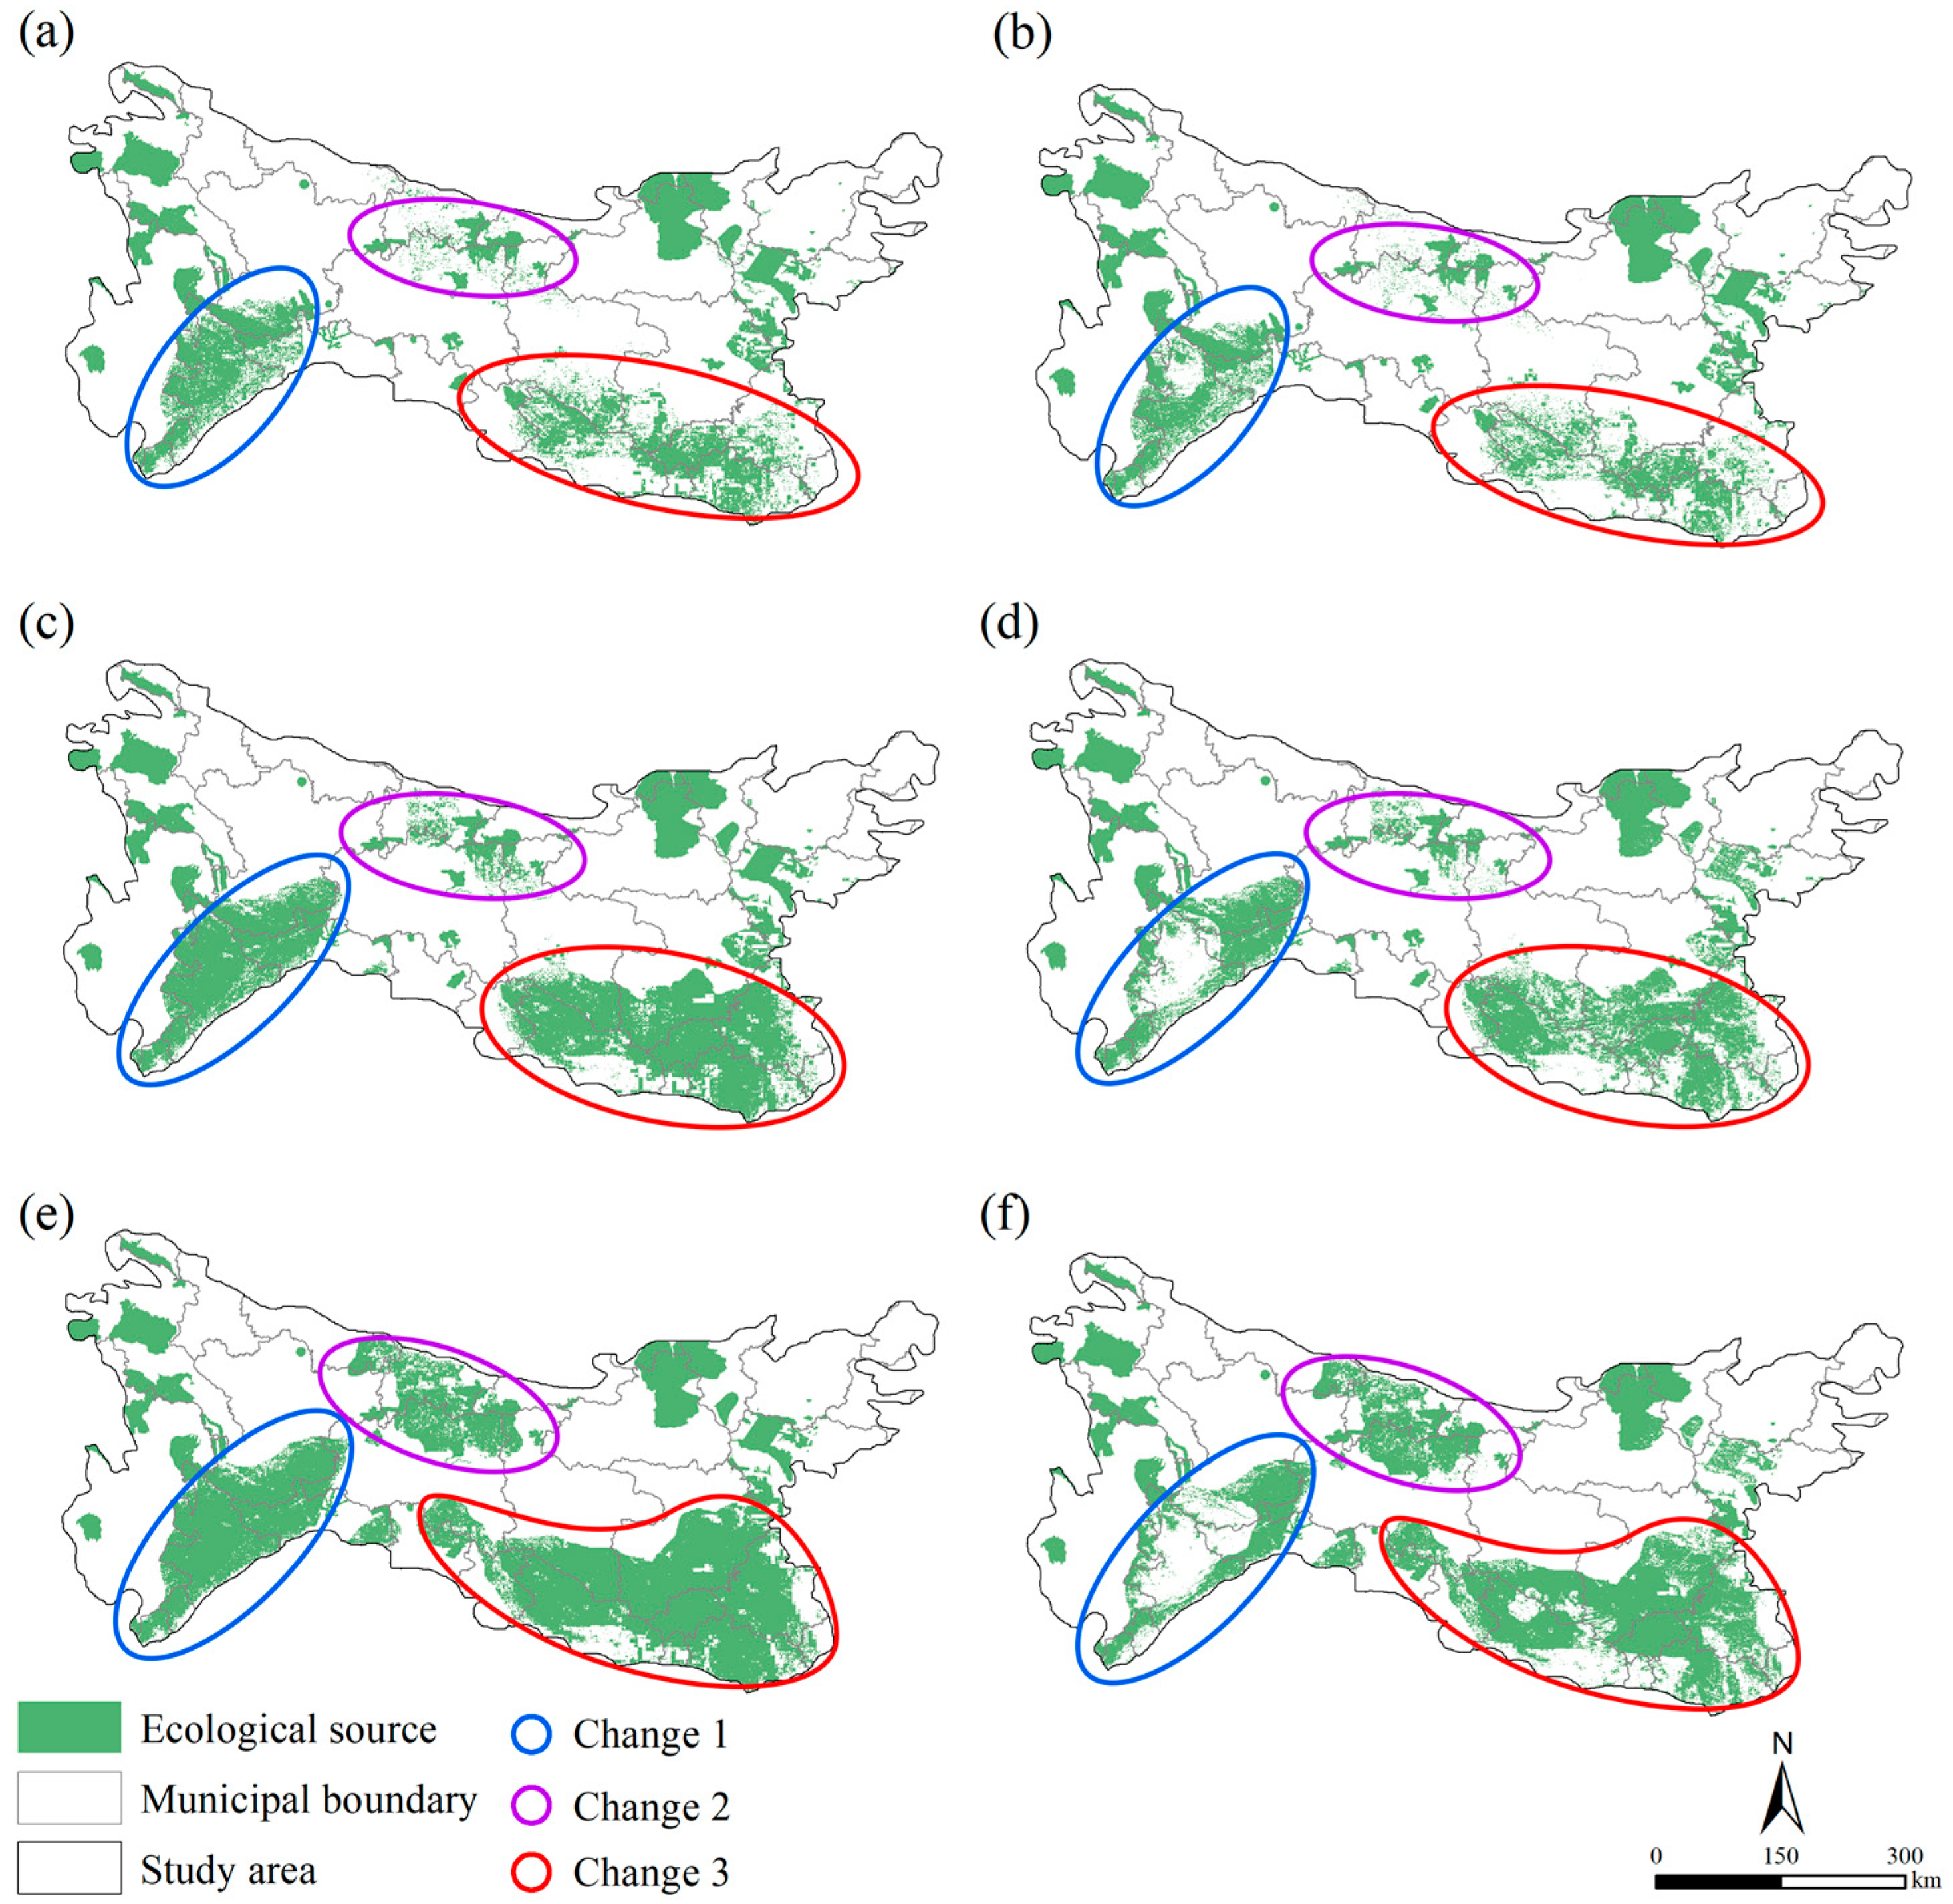
Based on the results of ES valuation, we identified the ecological sources in six scenarios and mapped them in Figure 6. The statistics of the ecological sources in each scenario are summarized in Table 5.
In terms of spatial distribution (Figure 6), the ecological sources were mainly located in the areas of the Die, Min, Qinling, Micang-Daba-Shennongjia, and Furniu mountains. According to the data in Table 4, from the perspective of land use types of ecological sources, forest is the main component of the ecological sources, accounting for more than 80% of the total source area, and the percentage increases from Scenario A to C. The percentage of grassland and farmland follows that of the forest, accounting for 5%~9% and 7%~8% of the total source area in the study area, respectively. However, their percentages decrease from Scenario A to C.
The total area of ecological sources impacts their spatial patterns. In Scenario A1, ecological sources are fragmented and scattered; some patches with high ecosystem values are not included in ecological sources. In Scenario B1, more scattering patches are included in ecological sources. In Scenario C1, ecological sources become spatial contiguous; the number of ecological sources decreases, but their average area increases, and fragmentation decreases. This trend can be easily observed in the Min Mountain area (blue circle), the Qinling Mountain area (purple circle), and the Micang-Daba-Shennongjia Mountain area (red circle). Large-scale ecological sources provide diverse ecosystems and are more resilient to natural and human disturbance, and their ecological values are higher than those of small-scale ecological sources. Therefore, the ecological sources in Scenario C1 are preferable to those in Scenarios A1 and B1.
ES tradeoffs also affect the patterns of ecological sources. When Scenarios A1, B1, and C1 are compared to Scenarios A2, B2, and C2, the spatial pattern of the ecological sources mainly differs in the Min Mountain and Daba Mountain areas. These two areas feature diverse terrains and ecosystems. Some farmlands and forests in valleys or basins provide local residents with food and raw materials. These areas are unsuitable as ecological sources when considering their provisioning service values. In contrast, the spatial pattern of ecological sources in the Qinling Mountain area remains similar, indicating that these areas’ provisioning service values are not high. This area is more suitable to be conserved for biodiversity and ecological safety.

3.3. Distribution of Ecological Corridors in Different Scenarios

Considering the undesirable pattern and function of ecological sources in Scenarios A1 and A2, we only constructed ecological corridors for ecological sources in Scenarios B1, B2, C1, and C2 based on the cumulative resistance surface (Figure 7) and MCR model.
The spatial pattern of ecological sources significantly impacts the number and distribution of ecological corridors. In Scenario B1, the corridors are densely distributed because of the small-scale and scattered ecological sources. Their construction cost will be very high. With the decreasing number of ecological sources, there are 16 fewer corridors in Scenario C1 than in Scenario B1; the total length of corridors is also 1451.40 km shorter (Table 6). This implies that the cost of their construction is much lower. Similar changes also happen from Scenario B2 to C2. The abovementioned change in ecological corridors can be observed in the Min Mountain, Qinling-Micang Mountain, Funiu Mountain, and Micang-Daba-Shennongjia Mountain areas (Figure 8).
When Scenarios B2 and C2 are compared to Scenarios B1 and C1, the main differences in the ecological corridors are distributed in the Min Mountain (blue circle), Qinling Mountain (purple circle), Micang Mountain (purple circle), Daba-Shennongjia Mountain (red circle), and Funiu Mountain (cyan circle). When the large-scale ecological sources are divided into a few small-scale ones, corridors are constructed to link them.

3.4. Important Ecological Corridors and Strategic Points

The important ecological corridors were identified with the gravity model. As shown in Table 7, the average length of important ecological corridors is much shorter than that of all corridors in all scenarios.
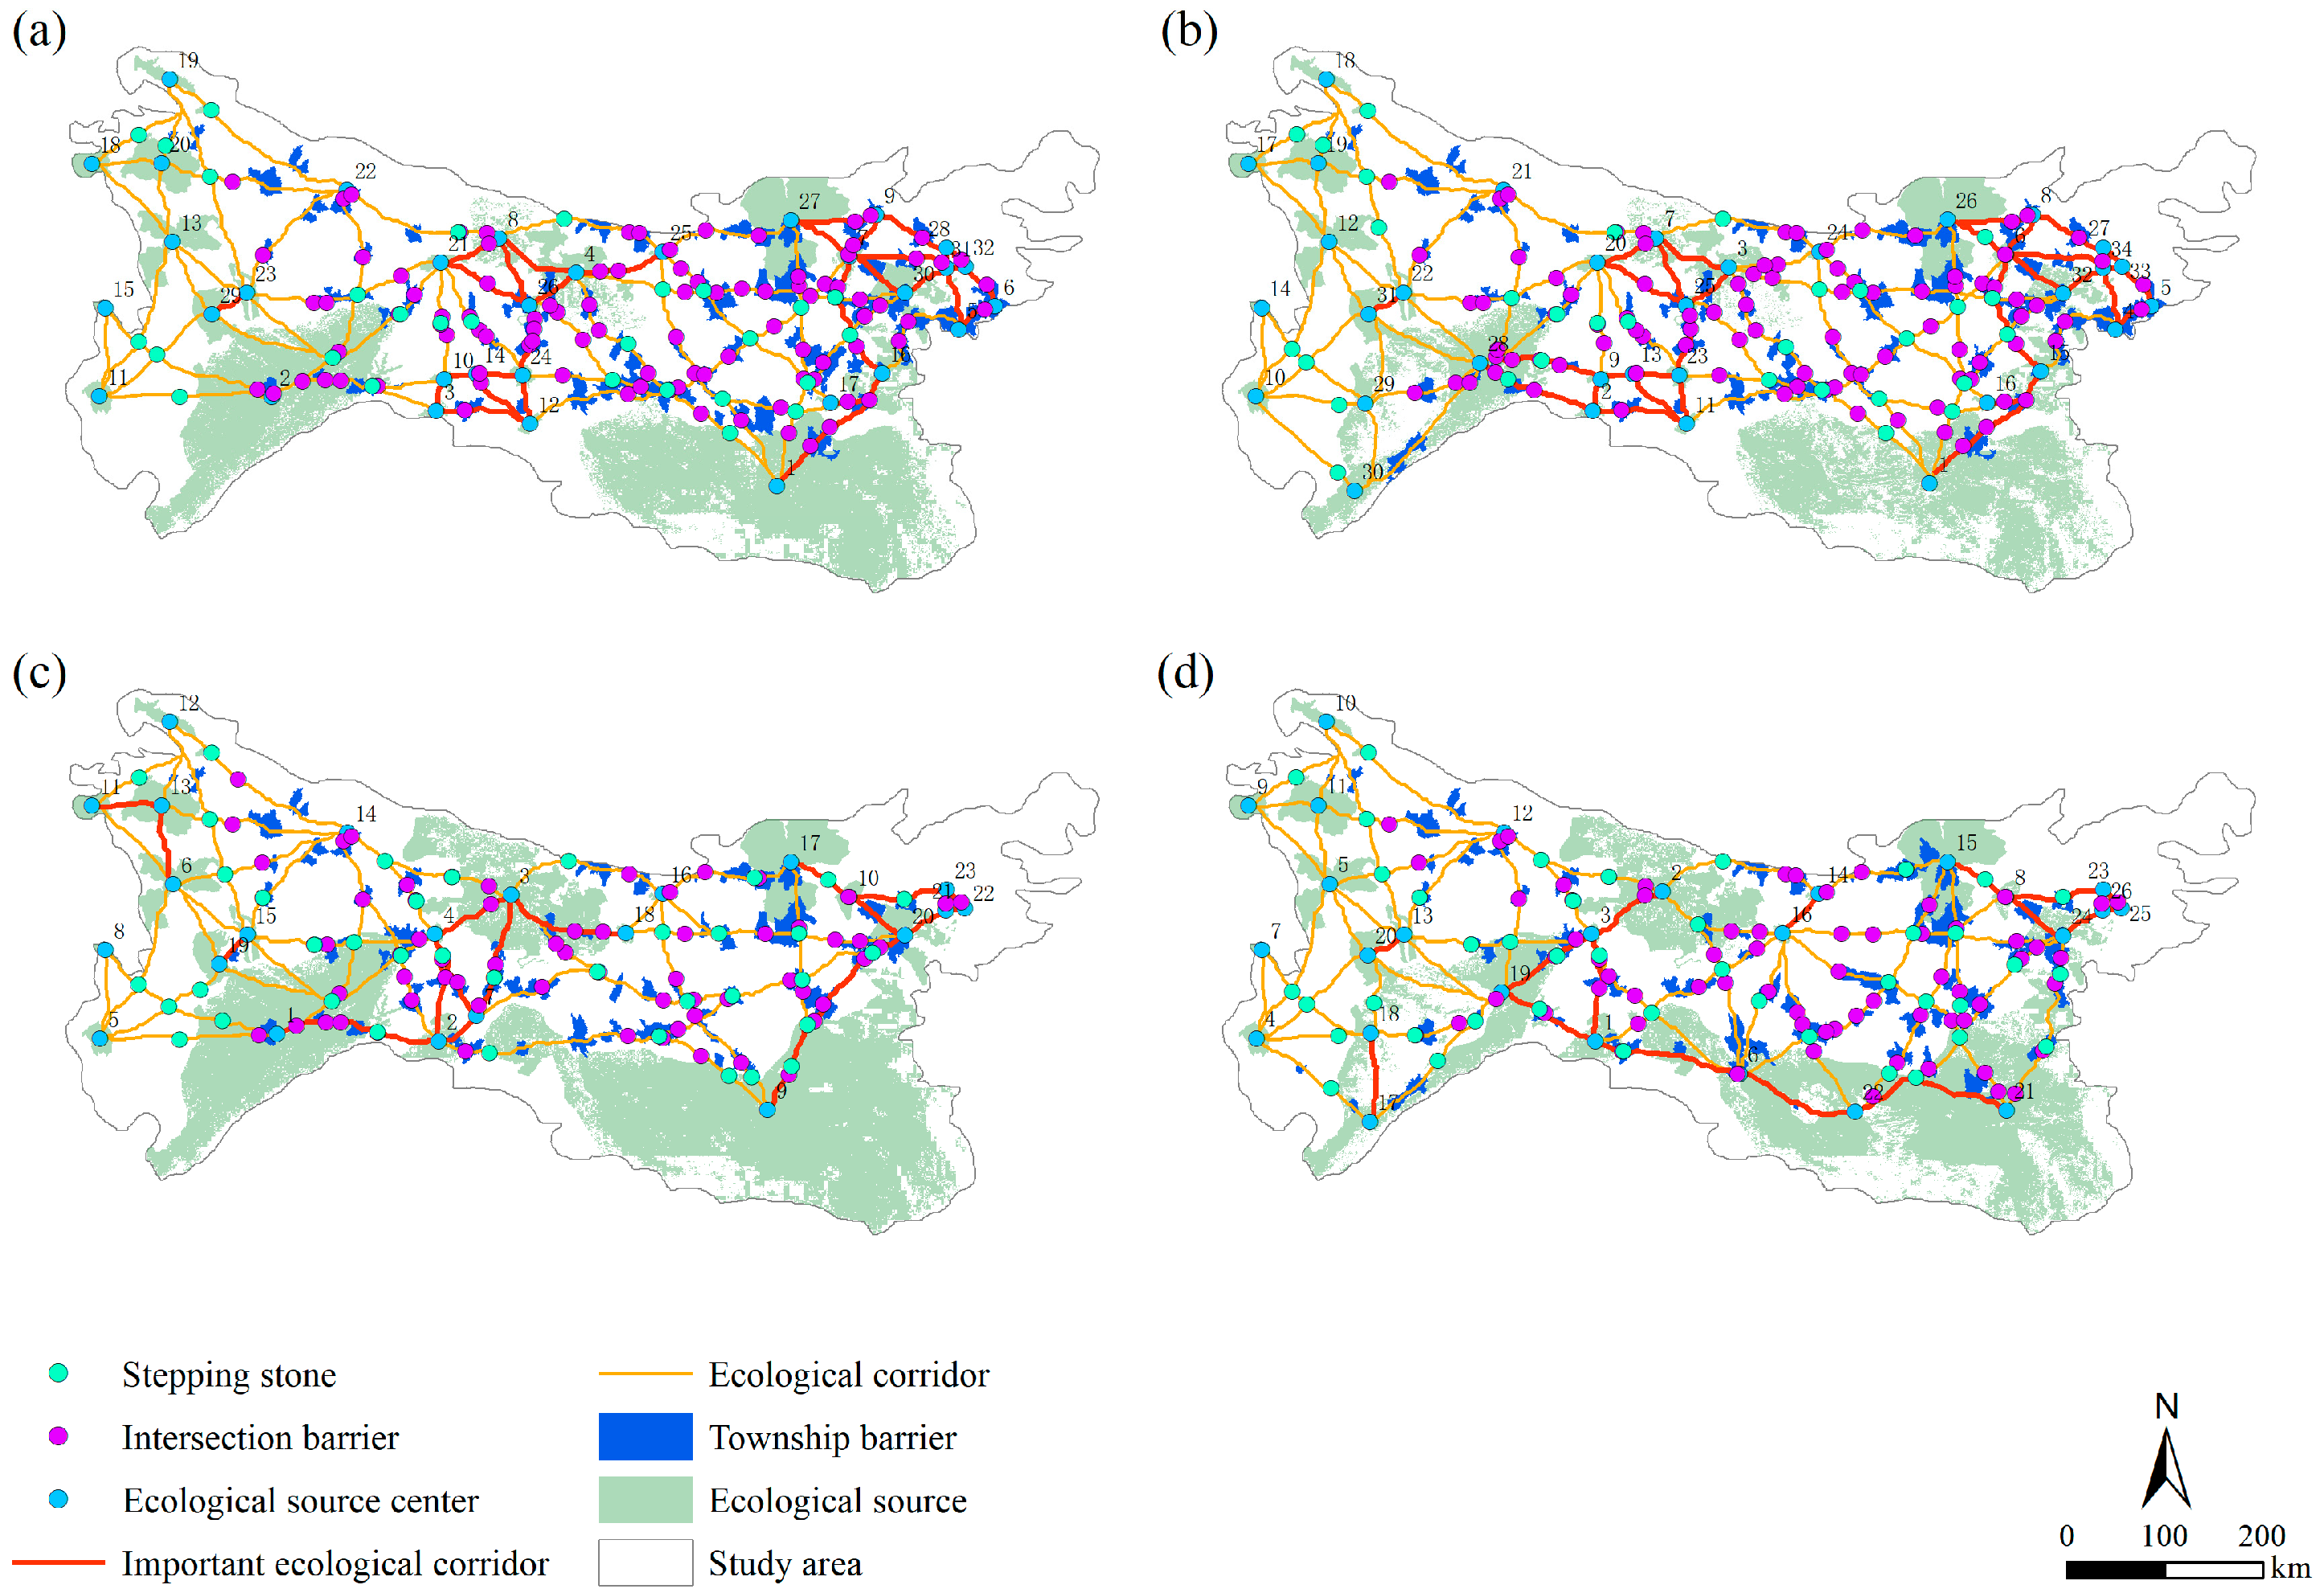
The spatial distribution (Figure 9) of important ecological corridors in Scenarios B1 and B2 is similar; they are mainly distributed in the central Qinling and Micang Mountain areas and the eastern Funiu Mountain, Shennongjia, and Daba Mountain areas. The direction of most corridors is north–south, and their lengths are shorter, connecting smaller-scale and proximate ecological sources. In Scenarios C1 and C2, the spatial distribution of important ecological corridors notably differs. In Scenario C1, they are mainly distributed in the northwestern Die Mountain, central Qinling and Micang Mountain, and eastern Funiu Mountain, Shennongjia, and Daba Mountain areas, mainly forming north–south connections. In Scenario C2, they are mainly distributed in the southwestern Min Mountain, southern Micang-Daba-Shennongjia Mountain, and northeastern Funiu Mountain areas, forming both north–south and east–west connections. Many of these corridors link large-scale ecological sources that are far away.
The following two types of strategic points were identified: possible barriers and stepping stones. The possible barriers include the intersection barriers and the township barriers. The statistics of strategic points in different scenarios are summarized in Table 7. The number of intersection barriers and township barriers in Scenario C is much less than that in Scenario B, especially in Scenario C1. Meanwhile, the number of stepping stones in Scenario C is higher than that in Scenario B. More barriers in Scenario B indicate more human interference in the ecological corridors, resulting in a higher cost for corridor construction and management. In contrast, Scenario C’s fewer barriers and more widely distributed stepping stones indicate better ecological connectivity and lower ecological maintenance costs. The location of the strategic points is provided in the Appendix C, Appendix D and Appendix E.

4. Discussion

4.1. Tradeoffs between Conservation and Development in Ecological Security Pattern

With the challenging tasks of conserving biodiversity and promoting people’s livelihoods, the tradeoff between conservation and development has to be cautiously handled in ESP planning in the QLDBM area.
Ecological sources, as the core elements of ESP, can be regarded as protected areas or core conservation areas. Setting an appropriate percentage of ecological sources is vitally important and challenging in ESP planning. At the global scale, The Aichi Target 11 set the goal of conserving at least 17% of terrestrial and inland areas. The 30 × 30 Biodiversity Goal at COP28 calls for conserving 30% of Earth’s land and seas for global biodiversity conservation. In our study, the percentage of ecological sources ranges from 10 to 30%. With the increasing percentage, the integrity and connectivity of ecological sources improve. It will benefit biodiversity. However, the increase in the area of ecological sources also reduces the land available for human development and utilization. In areas dominated by forests, grasslands, and farmlands, setting large areas of ecological sources may restrict forestry, animal husbandry, and agricultural development and, therefore, negatively impact people’s incomes and livelihoods. Nonetheless, the construction of ecological infrastructure creates opportunities for developing tourism, thereby providing new prospects for local economic development and the transformation of farmers’ livelihoods [54]. Setting different types of ecological sources might be a feasible measure to balance protection and development; core ecological sources prohibit human activities, while supplementary sources allow for the development of ecotourism and eco-agriculture.
The length and density of ecological corridors are also relevant to conservation and development tradeoffs. Densely distributed ecological corridors will support wild animal migration and species dispersal. However, constructing and maintaining ecological corridors require a large financial investment. It might reduce the funds for other public services and infrastructure, weakening the local government’s ability to improve public welfare [55,56]. Therefore, it is advisable to use natural forests, grasslands, and rivers as ecological corridors to minimize the cost of ecological corridor construction. Meanwhile, it is of vital importance to identify risk points in the corridors.

4.2. Strategic Points Identification and Management

Strategic points play an essential role in ensuring the connectivity of ESPs. Identifying the locations of significant strategic points is necessary for implementing preventive measures. In addition, management measures should be given priority and supplemented with engineering measures to avoid or mitigate the risks.
Previous studies have mainly focused on the intersections of corridors with major transportation lines or water sources, considering the former as possible barriers and the latter as stepping stones. In addition to these two types of strategic points, this paper identifies the intersections of ecological corridors with townships where the population density exceeds 100 people/km2 and regards them as possible barriers to ecological processes, especially for terrestrial animal migration. Aside from directly implementing ecosystem restoration and management programs in these townships, the local government is suggested to provide ecological education to the public, making them realize the importance and the suitable approaches for biodiversity and ecosystem conservation.

4.3. Limitations of This Study and Future Directions

Traditional ESP planning often regards established nature reserves as ecological sources, overlooking other areas with significant ecological functions. Applying ES evaluation to identify ecological sources has become a research trend, with significant supporting, regulating, and cultural services being regarded as ecological sources. However, practical applications face challenges in determining appropriate proportions or thresholds for high-value ES areas. If the thresholds are too small, they result in fragmented ecological sources; if they are too large, they lead to excessively expansive sources, thereby increasing construction and protection costs.
This study proposes a solution by setting different proportions and mapping ESPs in multiple scenarios. The scenario that maintains the integrity of ecosystems and takes care of residents’ dependency on the provisioning services of ecosystems is preferred. However, such an approach also has limitations.
Firstly, this study chose a resolution of 1 km2 for research based on the following two considerations: limitations of the data and feasibility of data analysis and network construction. On the one hand, the precipitation, population, and other data are only available with a resolution of 1 km2. On the other hand, the research area involved in this project is very large. Using higher-resolution data would increase the complexity and processing time of the network construction and make it challenging to apply the results to support ecosystem management at the regional level. In the future, we will consider partitioning the research area into some subzones, simulating the ecological security pattern in each zone, and discussing scale effects.
Secondly, in this study, the tradeoff between ecological conservation and people’s livelihoods was made by varying the area and number of ecological sources and considering the tradeoff between provisioning and other services. This study did not explicitly incorporate socioeconomic indicators (e.g., income, employment dependency on land). Incorporating these data into ESP will provide a clear understanding of the tradeoffs between ecological and social benefits. However, it is feasible to include these factors in ESP mapping at smaller scales (such as the city level) rather than in large-scale studies since such data often need to be collected through surveys.
Thirdly, one scenario has a fixed percentage, while the optimal percentage might be a range rather than a fixed value. In addition, the method assumes a competitive relationship between provisioning services and other services. However, in actual ecosystems, the relationships between various services may be more complex than synergistic or competitive. Future research could consider using multi-objective optimization methods to produce a few Pareto optimal alternatives for ESPs instead of a single solution so that decision-makers can compare the strengths and shortcomings of each solution to make a final selection.
Finally, this study uses a spatial planning perspective to map the ecological security pattern. Lacking knowledge in ecology and zoology, we did not consider and handle migration differences among terrestrial animals, birds, and aquatic animals or those between large and small animals in the ecological corridors. This is a common limitation of most ESP studies, which can only be overcome through collaboration among researchers and practitioners from multiple scientific fields.

5. Conclusions

This study maps ESPs in the Qinling-Daba Mountain area based on the valuation of ESs. The tradeoff between conservation and development was handled through multi-scenario designation and ES tradeoffs. The main conclusions are as follows:
First, about 30 percent of the study area is suitable for being set as ecological sources based on their values for provisioning, regulating, supporting, and cultural ESs. Such planning helps maintain the integrity of natural ecosystems and leaves space for human living and development, thereby balancing ecological protection and livelihood needs in the Qinling-Daba Mountains Area.
Second, development and conservation tradeoffs need to be made, especially in the Min Mountain and Daba Mountain areas. Establishing large-scale and spatial contiguous ecological sources in these regions may impact the livelihoods of local residents. The tradeoff can be made by setting sources with smaller sizes but constructing corridors to connect them to support species migration and other ecological processes.
Third, both shorter corridors in the north–south direction and longer corridors in the west–east direction need to be constructed in the study area to better maintain biodiversity and regional ecological security. The former connects proximate ecological sources for the daily movements of biological populations; the latter links large-scale and distant ecological sources to facilitate the seasonal migration of species, gene flow, and large-scale ecological processes.
Fourth, possible barriers in ecological corridors include both the intersections of corridors and major traffic lines and townships with high population density (>100 people/km2). Engineering, management, and education measures should be integrated to address these possible barriers and reduce human interference with wildlife dispersal or other ecological processes.
In conclusion, referring to the control measures proposed by previous studies [57], we offer the following recommendations for consideration:
  • Governments should make policies and take action to encourage farmers to adopt sustainable agricultural practices. For example, they could provide financial subsidies to offset the initial costs, offer tax incentives to reward environmentally friendly farming methods, and organize technical training programs to educate farmers on sustainable techniques. These measures would encourage more farmers to transition to eco-friendly practices, ultimately benefiting both the environment and agricultural productivity.
  • Establish a robust implementation mechanism for managing ecological corridors. Detailed planning for ecological corridors should be developed and endorsed by local governments and relevant departments. A cross-departmental coordination mechanism is crucial; departments responsible for environmental protection, transportation planning and management, and agricultural development and management should be involved in the decision-making process for ESP planning and construction.

Author Contributions

Conceptualization, M.S., P.Z. and Q.L.; methodology, M.S., P.Z. and Q.L.; software, P.Z. and Q.L.; validation, P.Z. and Q.L.; formal analysis, M.S., P.Z. and Q.L.; data curation, P.Z. and Q.L.; writing—original draft preparation, M.S., P.Z. and Q.L.; writing—review and editing, M.S. and P.Z.; visualization, P.Z.; supervision, M.S.; project administration, M.S.; funding acquisition, M.S. All authors have read and agreed to the published version of the manuscript.

Funding

This research was funded by the Research Project of Humanities and Social Sciences of the Ministry of Education, China (grant number 23YJA630046), and the National Natural Science Foundation of China (grant number 42001229). We acknowledge the founders for their support.

Data Availability Statement

No new data were created or analyzed in this study. Data sharing is not applicable to this article.

Conflicts of Interest

The authors declare no conflicts of interest.

Appendix A

Figure A1. Classification of ecosystem.
Land 13 01629 g0a1

Appendix B. The Equivalent Coefficient Table for This Study

EcosystemsProvisioning ServicesRegulating ServicesSupporting ServicesCultural Services
CategorySubcategoryFood
Production
Raw
Material Production
Gas
Regulation
Climate RegulationDecontaminate EnvironmentHydrological RegulationSoil
Maintenance
Maintaining Nutrient
Cycling
Biodiversity ProtectionAesthetic Landscape
farmlanddry land0.850.400.670.360.100.271.030.120.130.06
paddy field1.360.091.110.570.172.720.010.190.210.09
forestconiferous forest0.220.521.705.071.493.342.060.161.880.82
broadleaved forest0.290.662.176.501.934.742.650.202.411.06
bush0.190.431.414.231.283.351.720.131.570.69
grasslandprairie0.100.140.511.340.440.980.620.050.560.25
shrubs0.380.561.975.211.723.822.400.182.180.96
wetlandwetland0.510.501.903.603.6024.232.310.187.874.73
bare landbare land0.000.000.020.000.100.030.020.000.020.01
water areawaterbody0.800.230.772.295.55102.240.930.072.551.89
glacier and snow0.000.000.180.540.167.130.000.000.010.09
construction areaconstruction area0.000.000.000.000.000.000.000.000.000.00

Appendix C. Specific Distribution of Intersection Barriers

Province/CityScenario B1Scenario B2Scenario C1Scenario C2
Gansu ProvinceDingxi City Dacaotan Township
Longnan CityAwu Township, Jugan Township, Changdao Township, Yanguan Township, Paosha Township
Yuhuang TownshipYuhuang Township, Zhongmiao TownshipLinjiangpu Township, Jialing Township, Chengguan Township (Hui County), Yuhuang TownshipLinjiangpu Township, Chengguan Township (Hui County), Jialing Township, Zhongmiao Township
Henan ProvinceNanyang CityXiping Township, Chongyang Township, Xihuang Township
Shangji Township, Danshui Township, Nanhedian Township, Cuizhuang TownshipNanhedian Township, Cuizhuang Township, Danshui Township, Shangji Township, Huiche Township, Shangji Township
Sanmenxia CityShuanghuaishu Township
Dongming Township, Fanli Township, Hengjian TownshipDongming Township, Fanli Township
Luoyang CityChecun Township
Tantou Township, Miaozi TownshipTantou Township
Hubei ProvinceShiyan CityChengguan Township (Utopia County), Qingqu Township of Wudang Mountain Special Zone
Shuiping Township, Shuangtai Township, Wenfeng Township, Hualongyan Township, Guanshan Township, Baisangguan Township, Shangjin Township, Huanglong Township, Bolin TownshipGuanshan Township, Yaohuai Township of Wudang Mountain Special Zone, Shangjin Township, Baisangguan Township, Huanglong Township, Bolin Township, Shuangtai Township, Wenfeng Township, Shuiping TownshipBolin Township, Wenfeng Township, Shuiping TownshipTuguanya Township, Qingfeng Township, Yinjifu Township, Xiangkou Township, Baoxia Township, Huanglong Township, Yishui Township, Shuiping Township
Xiangyang City Xiaohe Township
Shaanxi ProvinceAnkang CityXianhe Township, Chengguan Township (Ziyang County), Chengguan Township (Pingli County), Lvhe Township, Zongxi Township
Hongshan Township, Hengkou Township, Jihe Township, Meizi Township, Huangguan Township, Yunwushan Township, Tongmu Township, Shenhe TownshipHengkou Township, Hongshan Township, Jihe Township, Meizi Township, Huangguan Township, Simudi Township, Yunwushan Township, Tongmu Township, Shenhe TownshipTanba Township, Yanba Township, Tongchewan Township, Yunwushan Township, Tongmu Township, Ganxi TownshipGoupa Township, Jihe Township, Hengkou Township, Pingliang Township, Zuolong Township, Tongchewan Township
Shaanxi ProvinceBaoji CityPingkan Township, Fengzhou Township
Hanzhong CityXingzhou Street Office, Jinshui Township
Wuguanyi Township, Matiwan Township, Lesuhe Township, Chadian Township, Xinjiezi Township, Yuandun Township, Xinpu Township, Liangshan Township, Dahekan Township, Tea Township, Moziqiao Township, Jinshui Township, Longting Township, Yangjiahe TownshipYuanjiazhuang Street Office, Wuguanyi Township, Matiwan Township, Lesuhe Township, Xinjiezi Township, Xinpu Township, Qishuba Township, Dahekan Township, Liangshan Township, Guangping Township, Tea Township, Moziqiao Township, Qi’s Street Office, Yangjiahe TownshipYuanjiazhuang Street Office, Xuwang Township, Baiquesi Township, Chadian Township, Yuandun Township, Fuchuan Township, Shengshui Township, Xiaonanhai Township, Hanyuan Street Office, Daijiba Township, Huishuguan TownYuanjiazhuang Street Office, Yuhuangmiao Township, Lesuhe Township, Chadian Township, Yuandun Township, Qishuba Township, Hongmiao Township, Yankou Township
Shangluo CityZhulinguan Township, Gaobadian Township, Yingpan Township, Huilong Township
Longjuzhai Street Office, Sehepu Township, Jinshixia Township, Guofenglou Township, Qingyouhe Township, Chengguan Street Office, Qianyou Street Office, Xiaoling Township, Xingping TownshipLongjuzhai Street Office, Guofenglou Township, Qingyouhe Township, Chengguan Street Office, Qianyou Street Office, Xiaoling Township, Xingping TownshipGuofenglou TownshipDajing Township, Yicun Township, Xingping Township
Xi’an CityShijing Township, Wangchuan Township
Sichuan ProvinceAba Prefecture Tumen Township
Bazhong CityDongyu Township, Lianghekou Township
Guanba Township, Xinchang TownshipGuanba Township, Xinchang Township Guanba Township
Dazhou CityHekou TownshipHekou Township Lishu Township
Deyang CityBanqiao TownshipBanqiao TownshipBanqiao Township
Guangyuan CityShahe Township, Sanguo Township
Gongnong Township, Yaodu Township, Wali Township, Guanyindian TownshipDouzhuan Township, Datan Township, Gongnong Township, Daba Township, Muyu Township, Yaodu TownshipGongnong Township, Wali Township, Guanyindian Township, Yaodu TownshipXuanhe Township
Mianyang CityLongan Township, Gaocun TownshipLongan TownshipLongan TownshipLongan Township
ChongqingChongqingTucheng TownshipTucheng Township, Jiangkou TownshipJiangkou TownshipTucheng Township
Major highwaysLanzhou-Haikou Highway, Wuhan-Jiujiang Highway, Shiyan–Tianshui Highway, Huhhot–Beihai Highway, Shanghai–Xi’an Highway, Zhengzhou-Yaoshan Highway, Macheng–Ankang Highway, Fuzhou–Yinchuan Highway, Ankang-Langao Highway, Beijing–Kunming Highway, Ankang–Laifeng Highway, Ningshan-Shiquan Highway, Yinchuan–Kunming Highway, Highway Tunnel of Qinling Zhongnan Mountain, Wudu-Guanzigou Highway, Guangyuan-Pingwu Highway, Pingliang-Mianyang Highway
Mianchi-Xichuan Highway, Erenhot–Guangzhou Highway, Yunxi-Wuxi Highway, Baoji-Hanzhong Highway, Zuoshui-Shanyang HighwayMianchi-Xichuan Highway, Erenhot–Guangzhou Highway, Yunxi-Wuxi Highway, Baoji-Hanzhong Highway, Xixiang-Zhenba Highway, Zuoshui-Shanyang Highway, Liandang-Huixian Highway, Meixian-Fengxiang HighwayMianchi-Xichuan Highway, Zuoshui-Shanyang Highway, Liandang-Huixian Highway, Meixian-Fengxiang Highway
Major railwaysXiangyang-Chongqing Railway, Baoji-Chengdu Railway, Xi’an-Chengdu High-Speed Railway
Haolebaoji-Ji’an Raiway, Yangpingguan-Ankang Railway, Nanjing-Xi’an RailwayHaolebaoji-Ji’an Railway, Yangpingguan-Ankang Railway, Lanzhou-Chongqing Railway, Nanjing-Xi’an Railway, Xi’an-Ankang RailwayLanzhou-Chongqing Railway, Yangpingguan-Ankang Railway, Xi’an-Ankang Railway

Appendix D. Specific Distribution of Township Barriers

Province/CityScenario B1Scenario B2Scenario C1Scenario C2
Gansu ProvinceDingxi CityLujing Township, Shendu Township
Gannan Prefecture Changchuan Township, Dianzi Township, Shimen Township
Longnan CityXiaochuan Township, Chenyuan Township, Lianghekou Township, Shawan Township, Liulin Township, Nianba Township, Lianghe Township, Zhongba Township, Qishan Township, Shiqiao Township, Jugan Township, Sanhe Township, Shibao Township, Changdao Township
Paosha Township, Wangba Township, Yongxing Township, Yanguan Township, Huangping TownshipWangba Township, Huangping TownshipPaosha Township, Nanyang Township, Ginkgo Tree Township, Yanguan Township, Pipa TownshipNanyang Township, Ginkgo Township, Yanguan Township, Pipa Township,
Tianshui CityYan’an Township, Tange Township
Henan ProvinceLuoyang CityLuanchuan Township, Shimiao Township
Tantou Township, Guxian Township, Old County TownshipTantou Township, Guxian Township, Old County Township
Nanyang CityChongyang Township, Shuanglong Township, Sangping Township, Wuliqiao Township, Jingziguan Township
Nanhedian Township, Taishanmiao Township, Liushan Township, Chengjiao Township, Sikushu Township, Huangludian Township, Shimen Township, Chimei Township, Mashankou Township, Yangcheng Township, Danshui Township, Shangji Township, Madeng Township, Laozhuang Township, Gaoqiu TownshipNanhedian Township, Taishanmiao Township, Liushan Township, Sikeshu Township, Huangludian Township, Shimen Township, Chimei Township, Mashankou Township, Yangcheng Township, Danshui Township, Shangji Township, Madeng Township, Laozhuang Township, Gaoqiu Township Huiche Township, Shangji Township, Madeng Township
Sanmenxia CityZhuyangguan Township
Shahe Township, Hengjian Township, Dongming TownshipShahe Township, Hengjian Township, Dongming Township
Hubei ProvinceShiyan CityQingqu Township, Utopia Chengguan Township, Liubei Township, Huanglong Township
Wudang Mountain Special Zone, Haoping Township, Hongta Township, Jundian Township, Hualongyan Township, Hejia Township, Tumen Township, Anyang Township, Tanjiawan Township, Bolin Township, Huaguo Street Office, Baofeng Township, Majiadu Township, Qingu Township, Yishui Township, Shuiping Township, Xianhe Township, Jiangjiayan TownshipWudang Mountain Special Zone, Haoping Township, Hongta Township, Jundian Township, Hualongyan TownshipHejia Township, Tumen Township, Shuping Township, Xianhe Township, Jiangjiayan TownshipSanguandian Street Office, Langhe Township, Hongta Township, Jundian Township, Hualongyan Township, Hejia Township, Tumen Township, Hujiaying Township, Leigu Township, Pankou Township, Qingu Township, Yishui Township, Shuiping Township
Shaanxi ProvinceAnkang CityYinghu Township, Xianhe Township, Yanba Township, Jihe Township, Dazhuyuan Township, Liushui Township, Pingliang Township, Lvhe Township, Shuhe Township
Hongshan Township, Shuanglong Township, Jianchi Township, Shuangru Township, Puxi Township, Laoxian Township, Lianghe Township, Maping Township, Shimen Township, Xianhe Township, Haoping Township, Huangu Township, Hongchun Township, Shuang’an Township, and Dongmu Township.Hongshan Township, Jianchi Township, Puxi Township, Lianghe Township, Maping Township, Shimen Township, Xianhe Township, Haoping Township, Huangu Township, Hongchun Township, Shuang’an TownshipDahe Township, Maping Township, Shimen Township, Huangu Township, Hongchun TownshipKazi Township, Maoping Township, Jianchi Township, Shuangru Township, Puxi Township, Chihe Township, Lianghe Township, Hongjun Township, Shuanghe Township, Xiaohe Township, Xianhe Township, Gaotan Township
Hanzhong CityXingzhou Street Office, Chenjiaba Township, Sidu Township, Shahe Township, Maoping Township, Xiaoyang Township
Juyuan Township, Jinquan Township, Xinjiezi Township, Dahekan Township, Liangshan Township, Hujiaying Township, Xiangshui Township, Yangchun Township, Yishui Township, Qi’s Street Office, Longting Township, Moziqiao Township, Xinglong Township, Guanyin TownshipJuyuan Township, Jinquan Township, Xinjiezi Township, Dahekan Township, Liangshan Township, Hujiaying Township, Xiangshui Township, Yangchun Township, Bashan Township, Yishui Township, Qi’s Street Office, Longting Township, Moziqiao Township, Xinglong Township, Guanyin TownshipTianming Township, Laozhuang Township, Pu Township, Qili Street Office, Hanwang Township, Xuwang Township, Xujiaping Township, Hengxianhe Street Office, Fuchuan Township, Shengshui Township, Mujiaba Township, Hujiaying Township, Xiangshui Township, Lianghe Township, Hujiaba Township, Bashan Township, Hanyuan Street Office, Liushu Township, Chengbei Street Office, Xinglong Township, Guanyin TownshipTianming Township, Chenjiaba Township, Hengxianhe Street Office, Fuchuan Township, Lianghe Township, Hujiaba Township, Chengbei Street Office, Yancang Township, Bashan Township, Xinglong Township, Guanyin Township
Shaanxi ProvinceShangluo CityLongjuzai Street Office, Shiping Township, Tumen Township, Tiyupu Township, Baiyu Temple Township, Jingcun Township, Gucheng Township, Zhongcun Township, Shilipu Street Office, Yinhua Township, Gaobadian Township, Qingshan Township, Muhuguan Township, Dajing Township
Sihao Street Office, Hujiayuan Township, Shima Township, Banqiao Township, Fenghuang Township, Daping Township, Miliang TownshipSihao Street Office, Hujiayuan Township, Shima Township, Banqiao Township, Majie Township, Fenghuang Township, Daping Township, Miliang TownshipSihao Street Office, Hujiayuan Township, Banqiao Township, Fenghuang TownshipMaping Township, Yongfeng Township, Shimen Township, Yaoshi Township, Yecun Township
Xi’an CityPangguang Township, Caotang Township, Jiaodai Township, Louguan Township, Guangji Township, Mazhao Township, Zhuyu Township, Cuifeng Township
Yucan Township Yucan TownshipYucan Township
Sichuan ProvinceAba Prefecture Shuanghe Township, Jin’an Township Longba Township, Guangming Township
Bazhong CityDongyu Township, Nanjiang Township, Catchfield Township, Lianghekou Township
Pinghe TownshipPinghe Township
Guangyuan CityQiaozhuang Township
Maliu Township, Sandui Township, Hexi Street Office, Dade TownshipQiaodou Township, Sandui Township, Hexi Street Office, Muyu Township, Dade TownshipSandui Township, Hexi Street Office, Dahe TownshipXuanhe Township, Chaotian Township, Zengjia Township, Dahe Township
Mianyang CityGaocun Township, Gucheng Township
Sangzao Township, Qushan Township, Chenjiaba Township, Yong’an Township, Leigu Township, Guixi Township Qushan Township, Chenjiaba Township, Leigu Township, Guixi Township
ChongqingChongqing city Fuxing Street Office

Appendix E. Specific Distribution of Stepping Stones

Province/CityScenario B1Scenario B2Scenario C1Scenario C2
Gansu ProvinceDingxi CityQinXu Township
Gannan PrefectureLexiu Township,
Kaerqin TownshipLijie Township, Kaerqin TownshipLijie TownshipLijie Township
Linxia PrefectureLianlu Township
Longnan CityChengguan Township (Kang County), Zhongmiao TownshipNianba TownshipJialing Township, Mayanhe Township, Nianba Township, Zhongmiao Township, Waina TownshipJialing Township, Mayanhe Township, Nianba Township, Waina Township
Henan ProvinceLuoyang City Luanchuan TownshipChitudian Township
Nanyang City Chongyang TownshipJingziguan Township, Shangji Township
Sanmenxia City Xujiawan TownshipXujiawan TownshipXujiawan Township
Hubei ProvinceShiyan CityEping Township
Dianzi Township, Nanhuatang Township, Huanglong Township, Loutai Township, Zhuping TownshipDianzi Township, Nanhuatang Township, Huanglong Township, Zhuping Township, Loutai TownshipHuanglong Township, Wenfeng Township, Xinzhou Township, Chengguan Township (Utopia County)Tuguanya Township, Jiahe Township, Yeda Township, Wufeng Township, Xinzhou Township
Shaanxi ProvinceAnkang CityJihe Town, Shuanghekou Town, Huangu TownJihe Town, Shuanghekou Town, Huangu TownYanba Township, Shuhe Township, Ganxi Township, Chengguan Township (Shiquan County)Yinghu Township, Xihe Township, Shuanghe Township
Baoji CityFengzhou Township, Tangyu Township
Hanzhong CityBaique Temple Township,
Wuhou Town, Jinquan TownJinquan Town, Wuhou TownChadian Town, Shengshui TownChadian Township, Beiba Township, Bailongtang Township, Huayang Township
Shangluo CityWangyan Township, Guofenglou Township, Yungai Temple TownshipWangyan Township, Guofenglou Township, Yungai Temple TownshipZhulinguan Township, Dajing Township, Xingping Township, Yungai Temple TownshipZhulin Guan Township, Shilipu Street Office, Dajing Township
Sichuan ProvinceAba PrefecturePrairie Township
Zhenjiangguan Township, Muni TownshipFengyi Township, Yanyun Township, Zhenping TownshipQingyun Township, Jiangguan Township, Huanglong TownshipShidaguan Township, Yanyun Township, Jiangguan Township, Shijiaobao Township
Bazhong City Lianghekou Township, Tiechang TownshipNanjiang Township, Lianghekou Township
Dazhou City Nanba Township
Guangyuan CityPujia TownshipDatan Township, Jindong TownshipHexi Street OfficeChaotian Township, Qiaozhuang Township
Mianyang City Crystal TownshipLongan Township
ChongqingChongqing CityFenghuang TownshipFenghuang Township
Major riversBailong River, Du River, Han River, Jialing River, Danjiang River, Minjiang River
Tao RiverTao River, Yiluo RiverYiluo River, Fu RiverTao River, Yiluo River, Nan River, Danjiangkou Reservoir, Fu River

References

  1. Ribeiro, L.; Barão, T. Greenways for recreation and maintenance of landscape quality: Five case studies in Portugal. Landsc. Urban Plan. 2006, 76, 79–97. [Google Scholar] [CrossRef]
  2. Kent, R.L.; Elliott, C.L. Scenic routes linking and protecting natural and cultural landscape features: A greenway skeleton. Landsc. Urban Plan. 1995, 33, 341–355. [Google Scholar] [CrossRef]
  3. Chatzimentor, A.; Apostolopoulou, E.; Mazaris, A.D. A review of green infrastructure research in Europe: Challenges and opportunities. Landsc. Urban Plan. 2020, 198, 103775. [Google Scholar] [CrossRef]
  4. John, H.; Marrs, C.; Neubert, M.; Alberico, S.; Bovo, G.; Ciadamidaro, S.; Danzinger, F.; Erlebach, M.; Freudl, D.; Grasso, S.; et al. Green Infrastructure Handbook—Conceptual & Theoretical Background, Terms and Definitions. 2019. Available online: https://www.researchgate.net/publication/354224061_Green_Infrastructure_Handbook_-_Conceptual_Theoretical_Background_Terms_and_Definitions (accessed on 3 October 2024).
  5. Peng, J.; Pan, Y.; Liu, Y.; Zhao, H.; Wang, Y. Linking ecological degradation risk to identify ecological security patterns in a rapidly urbanizing landscape. Habitat Int. 2018, 71, 110–124. [Google Scholar] [CrossRef]
  6. Peng, J.; Yang, Y.; Liu, Y.; Du, Y.; Meersmans, J.; Qiu, S. Linking ecosystem services and circuit theory to identify ecological security patterns. Sci. Total Environ. 2018, 644, 781–790. [Google Scholar] [CrossRef] [PubMed]
  7. Jiang, H.; Peng, J.; Liu, M.; Dong, J.; Ma, C. Integrating patch stability and network connectivity to optimize ecological security pattern. Landsc. Ecol. 2024, 39, 54. [Google Scholar] [CrossRef]
  8. Wang, J.; Bai, Y.; Huang, Z.; Ashraf, A.; Ali, M.; Fang, Z.; Lu, X. Identifying ecological security patterns to prioritize conservation and restoration: A case study in Xishuangbanna tropical region, China. J. Clean. Prod. 2024, 444, 141222. [Google Scholar] [CrossRef]
  9. Ding, M.; Liu, W.; Xiao, L.; Zhong, F.; Lu, N.; Zhang, J.; Zhang, Z.; Xu, X.; Wang, K. Construction and optimization strategy of ecological security pattern in a rapidly urbanizing region: A case study in central-south China. Ecol. Indic. 2022, 136, 108604. [Google Scholar] [CrossRef]
  10. Wei, H.; Zhu, H.; Chen, J.; Jiao, H.; Li, P.; Xiong, L. Construction and Optimization of Ecological Security Pattern in the Loess Plateau of China Based on the Minimum Cumulative Resistance (MCR) Model. Remote Sens. 2022, 14, 5906. [Google Scholar] [CrossRef]
  11. Huse, B.; Szabo, S.; Deak, B.; Tothmeresz, B. Mapping an ecological network of green habitat patches and their role in maintaining urban biodiversity in and around Debrecen city (Eastern Hungary). Land Use Policy 2016, 57, 574–581. [Google Scholar] [CrossRef]
  12. Yu, K. Security patterns and surface model in landscape ecological planning. Landsc. Urban Plan. 1996, 36, 1–17. [Google Scholar] [CrossRef]
  13. Fu, Y.; Shi, X.; He, J.; Yuan, Y.; Qu, L. Identification and optimization strategy of county ecological security pattern: A case study in the Loess Plateau, China. Ecol. Indic. 2020, 112, 106030. [Google Scholar] [CrossRef]
  14. Wang, Y.; Pan, J. Building ecological security patterns based on ecosystem services value reconstruction in an arid inland basin: A case study in Ganzhou District, NW China. J. Clean. Prod. 2019, 241, 118337. [Google Scholar] [CrossRef]
  15. Assessment, M.E. Ecosystems and Human Well-Being: Synthesis; Island Press: Washington, DC, USA, 2005. [Google Scholar]
  16. Pietsch, M. Contribution of connectivity metrics to the assessment of biodiversity-Some methodological considerations to improve landscape planning. Ecol. Indic. 2018, 94, 116–127. [Google Scholar] [CrossRef]
  17. Liquete, C.; Kleeschulte, S.; Dige, G.; Maes, J.; Grizzetti, B.; Olah, B.; Zulian, G. Mapping green infrastructure based on ecosystem services and ecological networks: A Pan-European case study. Environ. Sci. Policy 2015, 54, 268–280. [Google Scholar] [CrossRef]
  18. Yu, K. Ecological Security Patterns in Landscapes and GIS Application. Geogr. Inf. Sci. 1995, 1, 88–102. [Google Scholar] [CrossRef]
  19. Ma, J.; Li, L.; Jiao, L.; Zhu, H.; Liu, C.; Li, F.; Li, P. Identifying Ecological Security Patterns Considering the Stability of Ecological Sources in Ecologically Fragile Areas. Land 2024, 13, 214. [Google Scholar] [CrossRef]
  20. Xu, J.; Fan, F.; Liu, Y.; Dong, J.; Chen, J. Construction of Ecological Security Patterns in Nature Reserves Based on Ecosystem Services and Circuit Theory: A Case Study in Wenchuan, China. Int. J. Environ. Res. Public Health 2019, 16, 3220. [Google Scholar] [CrossRef]
  21. Jia, Q.; Jiao, L.; Lian, X.; Wang, W. Linking supply-demand balance of ecosystem services to identify ecological security patterns in urban agglomerations. Sustain. Cities Soc. 2023, 92, 104497. [Google Scholar] [CrossRef]
  22. Suich, H.; Howe, C.; Mace, G. Ecosystem services and poverty alleviation: A review of the empirical links. Ecosyst. Serv. 2015, 12, 137–147. [Google Scholar] [CrossRef]
  23. Howe, C.; Suich, H.; Vira, B.; Mace, G.M. Creating win-wins from trade-offs? Ecosystem services for human well-being: A meta-analysis of ecosystem service trade-offs and synergies in the real world. Glob. Environ. Chang. 2014, 28, 263–275. [Google Scholar] [CrossRef]
  24. Kang, J.; Zhang, X.; Zhu, X.; Zhang, B. Ecological security pattern: A new idea for balancing regional development and ecological protection. A case study of the Jiaodong Peninsula, China. Glob. Ecol. Conserv. 2021, 26, e01472. [Google Scholar] [CrossRef]
  25. Jiayu, C.; Jiefu, X.; Kang, G.; Yiwu, W. Balancing urban expansion with ecological integrity: An ESP framework for rapidly urbanizing small and medium-sized cities, with insights from Suizhou, China. Ecol. Inform. 2024, 80, 102508. [Google Scholar] [CrossRef]
  26. Li, C.; Wu, Y.; Gao, B.; Zheng, K.; Wu, Y.; Wang, M. Construction of ecological security pattern of national ecological barriers for ecosystem health maintenance. Ecol. Indic. 2023, 146, 109801. [Google Scholar] [CrossRef]
  27. Zhao, W.; Han, Z.; Yan, X.; Zhong, J. Ecological security pattern construction based on multi-scenario trade-off of ecosystem services: A case study of Wafangdian, Dalian. J. Nat. Resour. 2020, 35, 546–562. [Google Scholar]
  28. Wu, S.; Zhao, C.; Yang, L.; Huang, D.; Wu, Y.; Xiao, P. Spatial and temporal evolution analysis of ecological security pattern in Hubei Province based on ecosystem service supply and demand analysis. Ecol. Indic. 2024, 162, 112051. [Google Scholar] [CrossRef]
  29. Cui, X.; Deng, W.; Yang, J.; Huang, W.; de Vries, W.T. Construction and optimization of ecological security patterns based on social equity perspective: A case study in Wuhan, China. Ecol. Indic. 2022, 136, 108714. [Google Scholar] [CrossRef]
  30. Zhang, L.; Peng, J.; Liu, Y.; Wu, J. Coupling ecosystem services supply and human ecological demand to identify landscape ecological security pattern: A case study in Beijing-Tianjin-Hebei region, China. Urban Ecosyst. 2017, 20, 701–714. [Google Scholar] [CrossRef]
  31. Jialei, L.; Hongbin, H.; Qinghua, Z.; Liding, C.; Ranhao, S. Dataset of Soil Conservation Capacity Preventing Water Erosion in China (1992–2019) [DS/OL]. V1. Science Data Bank. 2023. Available online: https://cstr.cn/31253.11.sciencedb.07135 (accessed on 6 October 2024).
  32. Sun, J.; Sun, Z.; Guo, H.; Jiang, H.; Gao, J.; Wang, J. A Dataset of Built-Up Areas of Chinese Cities in 2020 [DS/OL]. V1. Science Data Bank. 2021. Available online: https://cstr.cn/31253.11.sciencedb.j00001.00332 (accessed on 6 October 2024).
  33. Li, S.; Xiao, W.; Zhao, Y.; Lv, X. Incorporating ecological risk index in the multi-process MCRE model to optimize the ecological security pattern in a semi-arid area with intensive coal mining: A case study in northern China. J. Clean. Prod. 2020, 247, 119143. [Google Scholar] [CrossRef]
  34. Jia, Y.; Wang, B.; Zhang, S. Construction of ecological security pattern of the Chinese section of the “Silk Road Economic Belt” based on the minimum cumulative resistance model. Geojournal 2023, 88, 409–424. [Google Scholar] [CrossRef]
  35. Yang, Y.; Chen, J.; Huang, R.; Feng, Z.; Zhou, G.; You, H.; Han, X. Construction of Ecological Security Pattern Based on the Importance of Ecological Protection-A Case Study of Guangxi, a Karst Region in China. Int. J. Environ. Res. Public Health 2022, 19, 5699. [Google Scholar] [CrossRef] [PubMed]
  36. Guan, H.; Bai, Y.; Tang, Y.; Zhang, C.; Zou, J. Spatial identification and optimization of ecological network in desert-oasis area of Yellow River Basin, China. Ecol. Indic. 2023, 147, 109999. [Google Scholar] [CrossRef]
  37. Sun, F.; Zhang, J.; Wang, P.; Wei, G.; Chu, G.; Cao, Y. Construction and evaluation of urban ecological security pattern: A case study of Suzhou city. Geogr. Res. 2021, 40, 2476–2493. [Google Scholar]
  38. He, J.; Shi, X.; Fu, Y. Optimization of ecological security pattern in the source area of Fenhe River Basin based on ecosystem services. J. Nat. Resour. 2020, 35, 814–825. [Google Scholar]
  39. Liang, F.; Liu, H.; Liu, S.; Qi, X.; Liu, L. Spatial Restructuring Countermeasures of Landscape Ecological Security Network in Southern Fujian: A Case Study of Jimei District in Xiamen. Econ. Geogr. 2018, 38, 231–239. [Google Scholar]
  40. Yu, F.; Zhang, B. Spatial Pattern of Natural Protected Areas in Qinling-Daba Mountains. Nat. Prot. Areas 2023, 3, 34–43. [Google Scholar]
  41. Ministry of Natural Resources of the People’s Republic of China. Blue Book of China’s Ecological Protection Red Line; Ministry of Natural Resources of the People’s Republic of China: Beijing, China, 2023.
  42. Xie, G.; Zhang, C.; Zhang, L.; Chen, W.; Li, S. Improvement of the Evaluation Method for Ecosystem Service Value Based on Per Unit Area. J. Nat. Resour. 2015, 30, 1243–1254. [Google Scholar]
  43. Xie, G.; Lu, C.; Leng, Y.; Zheng, D.; Li, S. Ecological assets valuation of the Tibetan Plateau. J. Nat. Resour. 2003, 18, 189–196. [Google Scholar]
  44. Fu, M.; Luo, J.; Tian, Y.; Zhao, Z.; Li, J. Establishment and fine-tuning of nature reserve networks based on minimum cumulative resistance model: A case study of Mountain Qinling region. Chin. J. Ecol. 2018, 37, 1135–1143. [Google Scholar]
  45. Liu, H.; Wang, Z.; Zhang, L.; Tang, F.; Wang, G.; Li, M. Construction of an ecological security network in the Fenhe River Basin and its temporal and spatial evolution characteristics. J. Clean. Prod. 2023, 417, 137961. [Google Scholar] [CrossRef]
  46. Yu, F.; Zhang, B.; Yao, Y.; Wang, J.; Zhang, X.; Liu, J.; Li, J. Identifying Connectivity Conservation Priorities among Protected Areas in Qinling-Daba Mountains, China. Sustainability 2022, 14, 4377. [Google Scholar] [CrossRef]
  47. Wang, X.; Xie, X.; Wang, Z.; Lin, H.; Liu, Y.; Xie, H.; Liu, X. Construction and Optimization of an Ecological Security Pattern Based on the MCR Model: A Case Study of the Minjiang River Basin in Eastern China. Int. J. Environ. Res. Public Health 2022, 19, 8370. [Google Scholar] [CrossRef] [PubMed]
  48. Ye, H.; Yang, Z.; Xu, X. Ecological Corridors Analysis Based on MSPA and MCR Model-A Case Study of the Tomur World Natural Heritage Region. Sustainability 2020, 12, 959. [Google Scholar] [CrossRef]
  49. Song, T.; Li, D.; Zhang, L.; Wang, G.; Gao, Y.; Yang, C.; Feng, Z.; Ma, H. Importance Evaluation of Ecosystem Services and Construction of Ecological Security Pattern in Qinba Mountain Area. Strateg. Study CAE 2020, 22, 64–72. [Google Scholar] [CrossRef]
  50. Wang, X.; Feng, Z.; Wu, K.; Lin, Q. Ecological conservation and restoration of Life Community Theory based on the construction of ecological security pattern. Acta Ecol. Sin. 2019, 39, 8725–8732. [Google Scholar]
  51. Yin, H.; Kong, F.; Qi, Y.; Wang, H.; Zhou, Y.; Qin, Z. Developing and optimizing ecological networks in urban agglomeration of Hunan Province, China. Acta Ecol. Sin. 2011, 31, 2863–2874. [Google Scholar]
  52. Zheng, Q.; Hu, J.; Shen, M. Construction of Ecological Network in Hunan Province Based on MSPA and MCR Models. J. Nat. Sci. Hunan Norm. Univ. 2021, 44, 1–10. [Google Scholar]
  53. Zhang, Y.; Xu, R.; Li, X.; Zhang, X.; Wang, X.; Wang, S. Construction of ecological corridors and identification of key nodes in the core area of China-Laos transportation corridors. Acta Ecol. Sin. 2020, 40, 1933–1943. [Google Scholar]
  54. Zhang, Z.; Niu, J.; Cheng, Q.; Wang, Z. Construction of Eco-tourism Corridor and Eco-tourism Area in Xinyang Section of Huaihe River Basin. J. Xinyang Norm. Univ. (Nat. Sci. Ed.) 2023, 36, 517–522. [Google Scholar]
  55. Cao, S.; Liu, Z.; Li, W.; Xian, J. Balancing ecological conservation with socioeconomic development. AMBIO 2021, 50, 1117–1122. [Google Scholar] [CrossRef]
  56. Cao, S.; Chen, L.; Zhu, Q. Remembering the Ultimate Goal of Environmental Protection: Including Protection of Impoverished Citizens in China’s Environmental Policy. AMBIO 2010, 39, 439–442. [Google Scholar] [CrossRef] [PubMed]
  57. Zhai, H.; Zhang, Z.; Zhao, X.; Xie, Q.; Cheng, Q.; Hu, Y. Optimization of Green Infrastructure in Xinyang City Based on Network Structure Analysis. J. Xinyang Norm. Univ. (Nat. Sci. Ed.) 2021, 34, 260–266. [Google Scholar]
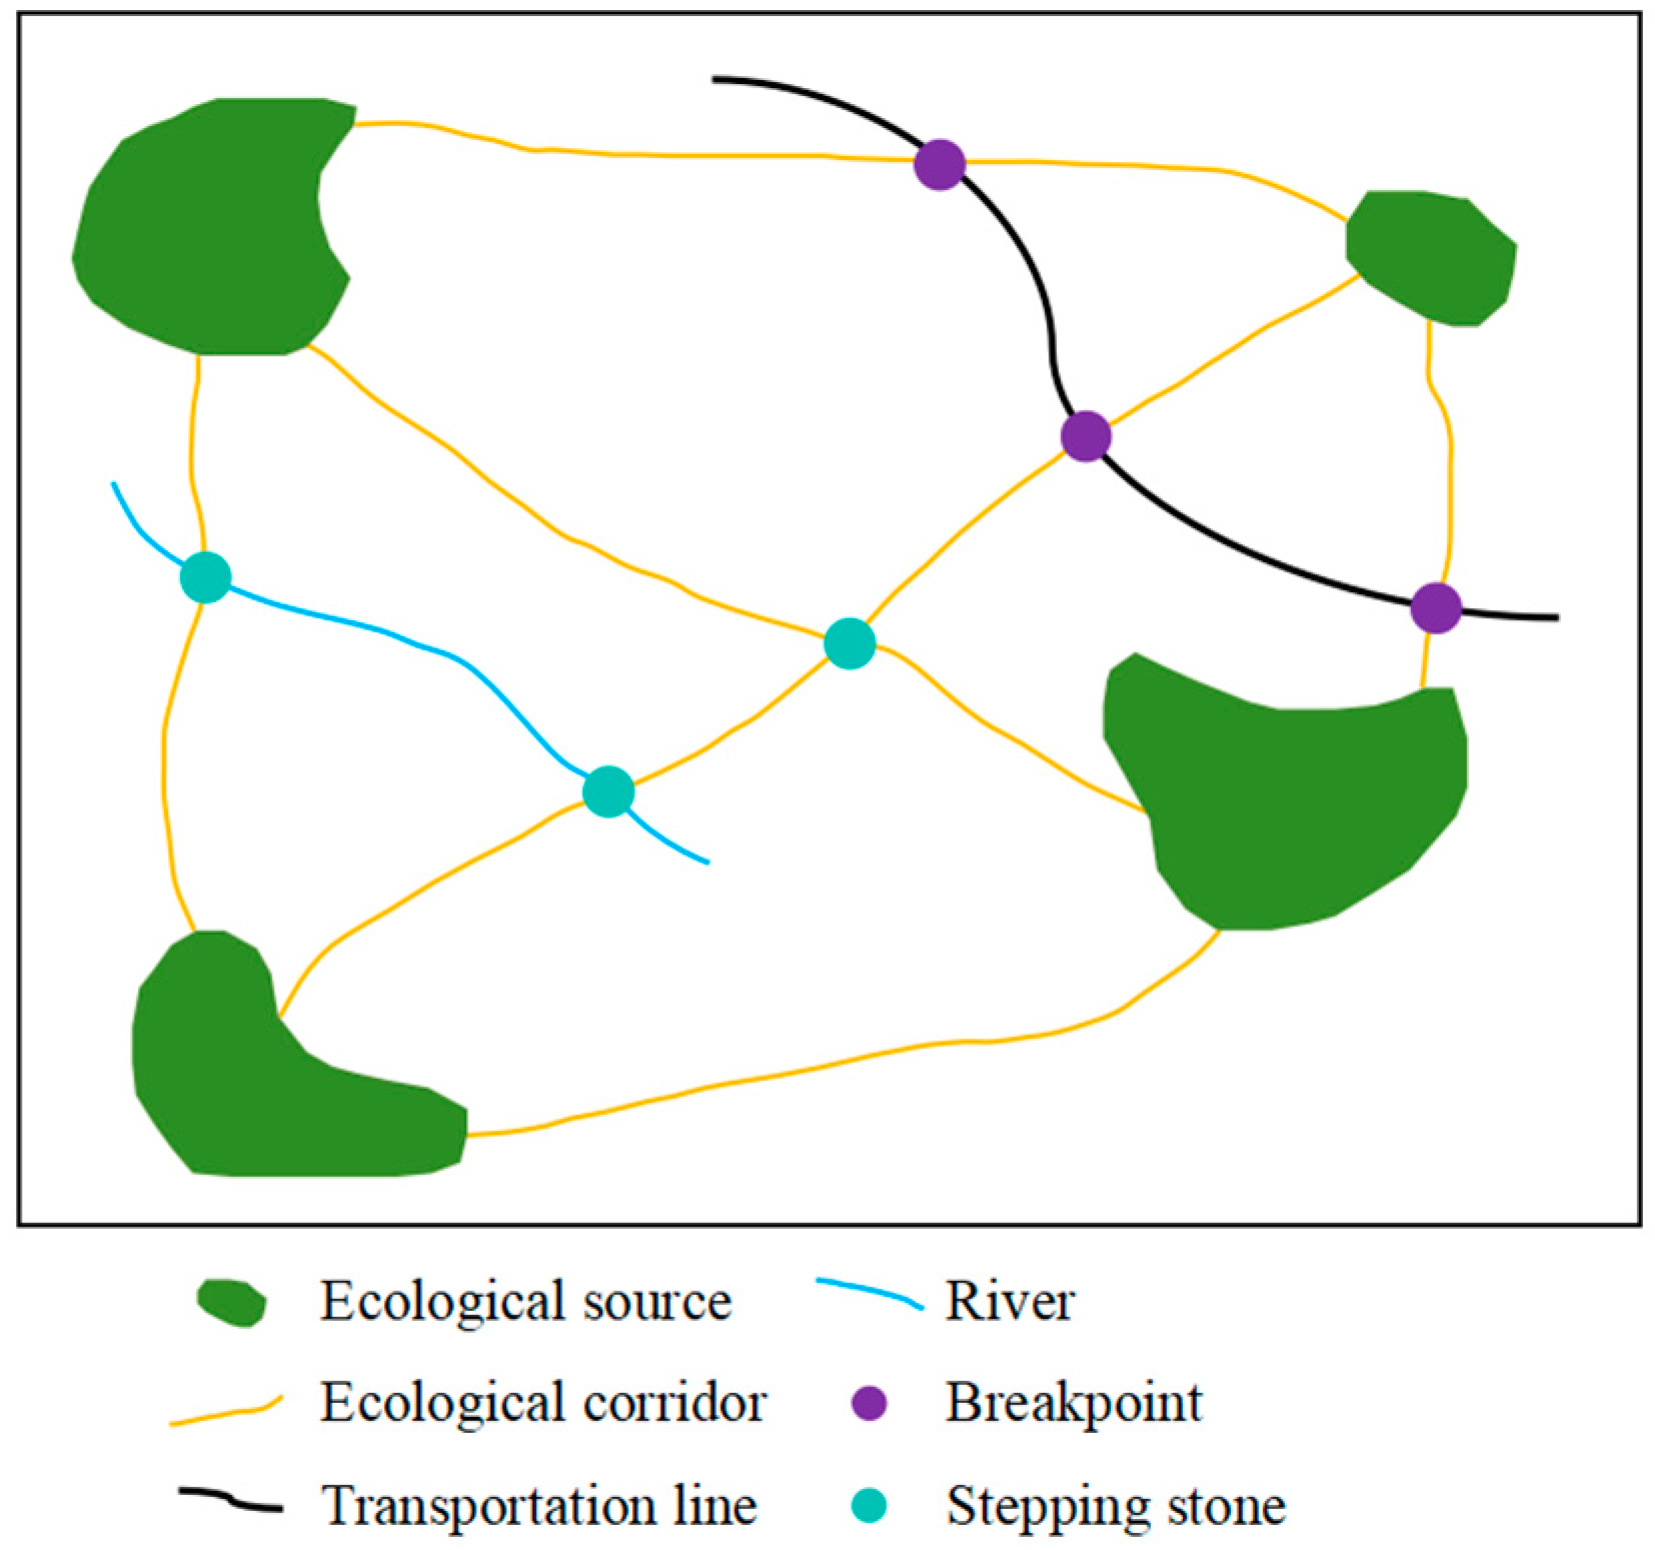
Figure 1. Schematic diagrams of ecological security pattern (ESP).
Land 13 01629 g001
Figure 2. Location of the Qinling-Daba Mountain area, China.
Land 13 01629 g002
Figure 3. Research workflow.
Land 13 01629 g003
Figure 4. Spatial distribution of four ESVs in the Qinling-Daba Mountain area: (a) provisioning service, (b) supporting service, (c) regulating service, (d) cultural service.
Land 13 01629 g004
Figure 5. Spatial distribution of aggregated supporting, regulating, and cultural ecosystem service values in the Qinling-Daba Mountain area.
Land 13 01629 g005
Figure 6. Spatial distribution of ecological sources in different scenarios in the Qinling-Daba Mountain area: (a) Scenario A1, (b) Scenario A2, (c) Scenario B1, (d) Scenario B2, (e) Scenario C1, (f) Scenario C2. Change 1 indicates the change in ecological sources in the Min Mountain area, Change 2 indicates the change in ecological sources in the Qinling-Daba Mountain area, and Change 3 indicates the change in ecological sources in the Micang-Daba-Shennongjia Mountain area.
Land 13 01629 g006
Figure 7. The cumulative resistance surfaces for ecological corridor identification in the Qinling-Daba Mountain area.
Land 13 01629 g007
Figure 8. Ecological corridors in different scenarios in the Qinling-Daba Mountain area: (a) Scenario B1, (b) Scenario B2, (c) Scenario C1, (d) Scenario C2. Change 1 indicates the change in ecological corridors in the Min Mountain region, Change 2 indicates the change in ecological corridors in the Daba-Shennongjia Mountain area, Change 3 indicates the change in ecological corridors in the Qinling Mountain and Micang Mountain, and Change 4 indicates the change in ecological corridors in the Funiu Mountain.
Land 13 01629 g008
Figure 9. Distribution of important ecological corridors and strategic points in the Qinling-Daba Mountain area: (a) Scenario B1, (b) Scenario B2, (c) Scenario C1, (d) Scenario C2.
Land 13 01629 g009
Table 1. Data sources and processing method.
DataResolution/YearSourceProcessing
Digital elevation model (DEM)30 m/2020NASA
https://www.nasa.gov (6 October 2024)
Processed with ArcGIS10.8 to obtain elevation and slope.
Land use and land cover30 m/2020CAS Earth Data Sharing and Service Portal
https://data.casearth.cn (6 October 2024)
Reclassified into 12 ecosystems.
Normalized difference vegetation index (NDVI)30 m/2020Resources and Environmental Science Data Center
https://www.resdc.cn (6 October 2024)
Net primary production (NPP)500 m/2020United States Geological Survey (USGS)
https://www.usgs.gov (6 October 2024)
Precipitation1000 m/2020National Earth System Science Data Centre
http://www.geodata.cn (6 October 2024)
Soil retention data300 m/2020https://www.scidb.cn/en [31] (6 October 2024)
Built-up areas of Chinese cities10 m/2020https://www.scidb.cn/en [32] (6 October 2024)
Rivers and roads/Open Street Map, National Geomatics of China
https://www.openstreetmap.org (6 October 2024)
https://www.webmap.cn (6 October 2024)
Natural reserves (NRs)/Geographic remote sensing ecological network platform
http://www.gisrs.cn/index.html (6 October 2024)
Population1000 m/2019OakRidge National Laboratory
https://landscan.ornl.gov (6 October 2024)
A-level scenic spots/Official website of Culture and Tourism BureauConverted to points with geographic coordinates in ArcGIS
Table 2. Six scenarios for ecological security pattern mapping.
ScenarioScenarioScenario Note
AA1Extract the top 10 percent of the study area regarding the integrated value of supporting, regulating, and cultural services. The extracted regions and natural reserves are set as ecological sources.
A2The top 10 percent of the area for provisioning service values is removed from the ecological sources in Scenario A1, and the remaining regions are set as ecological sources.
BB1Extract the top 20 percent of the study area regarding the integrated value of supporting, regulating, and cultural services. The extracted regions and natural reserves are set as ecological sources.
B2The top 20 percent of the area for provisioning service values is removed from the ecological sources in Scenario B1, and the remaining regions are set as ecological sources.
CC1Extract the top 30 percent of the study area regarding the integrated value of supporting, regulating, and cultural services. The extracted regions and natural reserves are set as ecological sources.
C2The top 30 percent of the area for provisioning service values is removed from the ecological sources in Scenario C1, and the remaining regions are set as ecological sources.
Table 3. Ecosystem service value coefficient per unit area of the QLDAM Area.
EcosystemsProvisioning ServicesRegulating ServicesSupporting ServicesCultural Services
CategorySubcategoryFood
Production
Raw
Material Production
Gas
Regulation
Climate RegulationDecontaminate EnvironmentHydrological RegulationSoil
Conservation
Maintaining Nutrient
Cycling
Biodiversity ProtectionAesthetic Landscape
farmlanddry land1525.17717.731202.19645.95179.43484.461848.14215.32233.26107.66
paddy field2440.27161.491991.691022.76305.034880.5317.94340.92376.81161.49
forestconiferous forest394.75933.043050.339097.172673.535993.013696.28287.093373.311471.34
broadleaved forest520.351184.253893.6611,663.043463.028505.044754.93358.864324.291901.97
bush340.92771.552529.987589.942296.726010.953086.22233.262817.071238.08
grasslandprairie179.43251.20915.102404.38789.501758.431112.4789.721004.82448.58
shrubs681.841004.823534.809348.373086.226854.284306.35322.983911.601722.54
wetlandwetland915.10897.163409.196459.536459.5343,476.214144.86322.9814,121.248487.10
bare landbare land0.000.0035.890.00179.4353.8335.890.0035.8917.94
water areawaterbody1435.45412.691381.624108.989958.44183,450.571668.71125.604575.503391.25
glacier and snow0.000.00322.98968.93287.0912,793.450.000.0017.94161.49
construction areaconstruction area0.000.000.000.000.000.000.000.000.000.00
Table 4. Ecological resistance surface coefficients and weight settings.
Resistance FactorWeightGrading StandardResistance ValueResistance FactorWeightGrading StandardResistance Value
Land Use Type0.4Forest, Wetland1Elevation
(m)
0.15<70010
Grassland, Water20100030
Cropland50150050
Desert70200070
Construction Land90>200090
Distances from Main Roads
(m)
0.03100090Slope
(°)
0.10°–8°10
3000708°–15°30
50005015°–25°50
10,0003025°–35°70
>10,00010>35°90
Distances from Main Railways
(m)
0.03100090Vegetation Cover
(%)
0.210–2090
30007020–4070
50005040–6050
10,0003060–8030
>10,0001080–10010
Distances from Main Water Bodies
(m)
0.05100010Distances from Main Urban Areas
(m)
0.02100090
200030300070
500050500050
10,0007010,00030
>10,00090>10,00010
Table 5. Statistics of source indicators in each scenario.
SightNumber of Source SitesTotal Source Area (km2)Total Area of the Study Area (%)Forested Land in Total Source Area (%)Grassland as a Percentage of Total Source Area (%)Cultivated Land in Total Area of Source Land (%)
A12667,884.6421.7682.658.048.02
A22762,743.8120.1182.218.667.77
B13291,354.4229.2884.886.157.83
B23475,942.1324.3484.017.277.46
C123114,748.1436.7886.405.087.54
C22692,956.3129.7985.836.107.00
Table 6. Statistics of ecological corridors in each scenario.
ScenarioNumber of Corridors Total Length of Corridor (km)Average Length (km)Corridor Density (km/km2)
B1688812.95129.602.82
B2749212.25124.492.95
C1527361.55141.572.36
C2608384.43139.742.69
Table 7. Statistics of key ecological corridors and strategic point indicators for each scenario.
SightNumber of Ecological Corridors of Importance Total Length (km)Average Length (km)Number of Intersection BarriersNumber of Township BarriersNumber of Stepping Stones
B1302122.7270.769816228
B2312200.7670.999414931
C1181588.3688.246612538
C2171461.5985.987113742
Disclaimer/Publisher’s Note: The statements, opinions and data contained in all publications are solely those of the individual author(s) and contributor(s) and not of MDPI and/or the editor(s). MDPI and/or the editor(s) disclaim responsibility for any injury to people or property resulting from any ideas, methods, instructions or products referred to in the content.