
Organic Carbon Storage in Waterlogging Soils in Ávila, Spain: A Traditional Agrosilvopastoral Region


 , ,
, , 

Abstract
1. Introduction
2. Materials and Methods
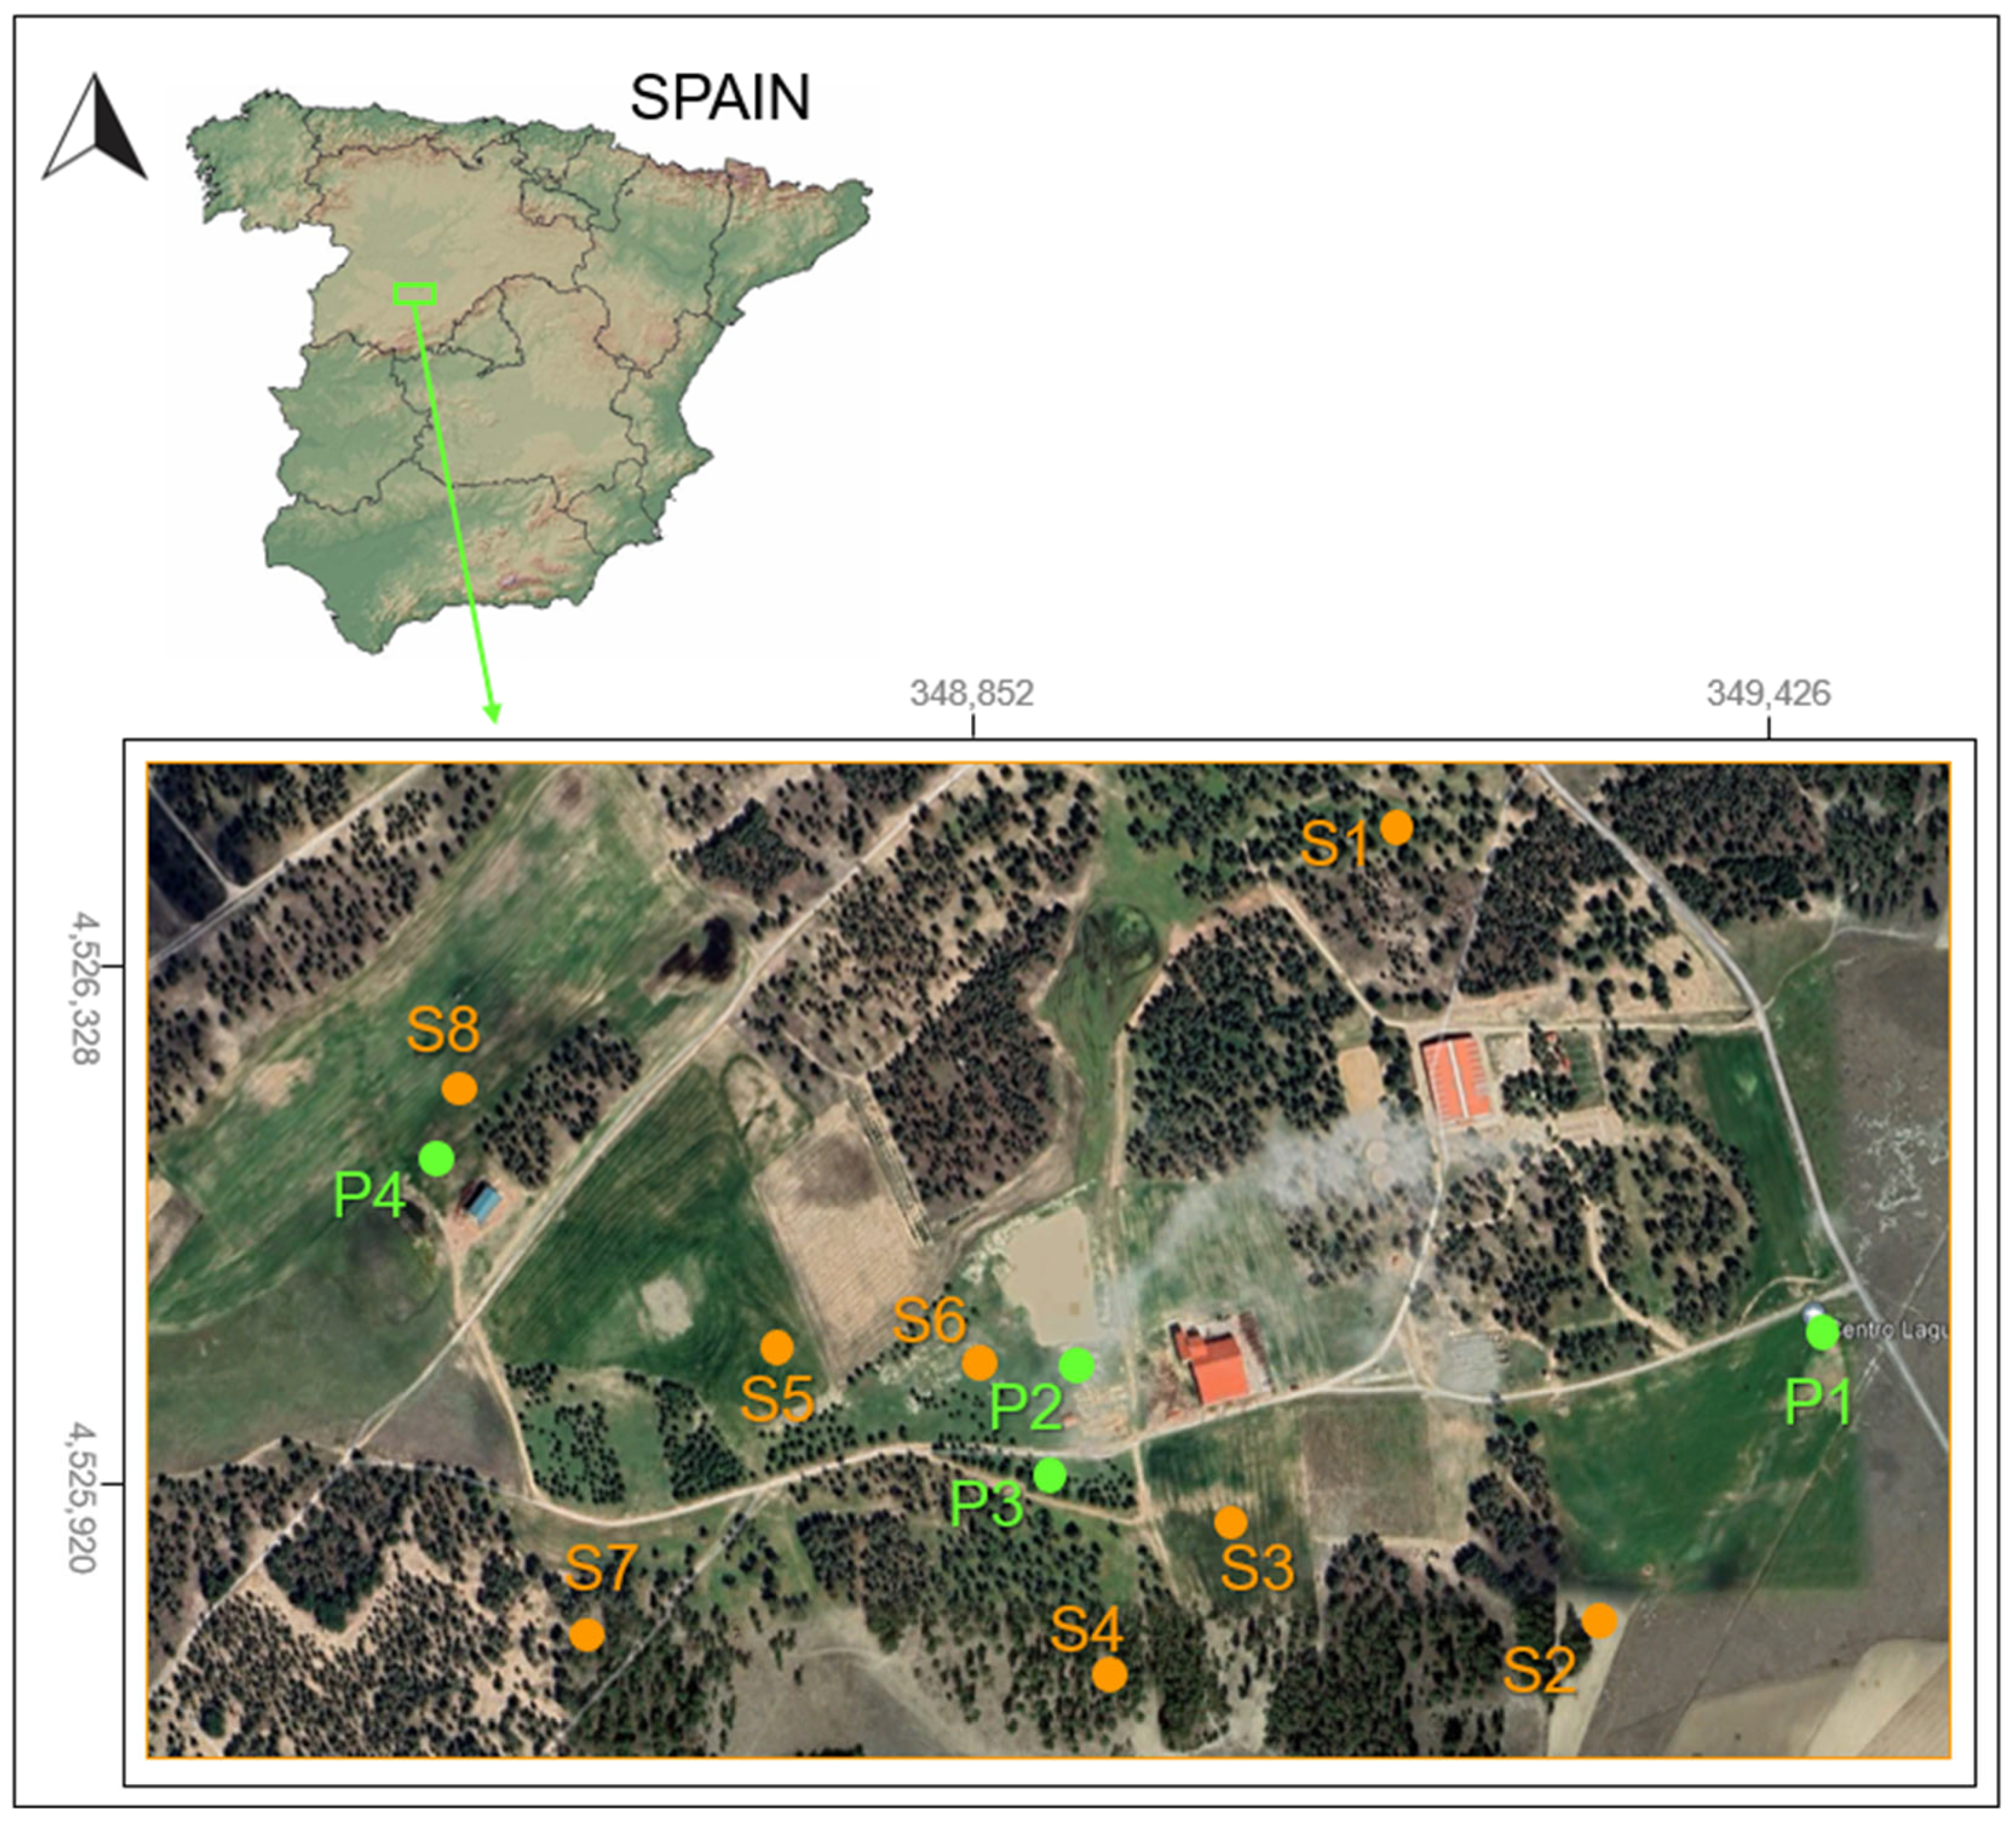
2.1. The Study Area
2.2. Soil Sampling
2.3. Laboratory Methods
2.4. Estimation of the C and N Stocks
3. Results
4. Discussion
5. Conclusions
Author Contributions
Funding
Data Availability Statement
Acknowledgments
Conflicts of Interest
References
- Lal, R. Sequestering carbon in soils of arid ecosystems. Land Degrad. Dev. 2009, 20, 441–454. [Google Scholar] [CrossRef]
- Lorenz, K.; Lal, R. Soil organic carbon sequestration in agroforestry systems. A review. Agron. Sustain. Dev. 2014, 34, 443–454. [Google Scholar] [CrossRef]
- Follet, R.F.; Reed, D.A. Soil carbon sequestration in grazing lands: Societal benefits and policy implications. Rangel. Ecol. Manag. 2010, 63, 4–15. [Google Scholar] [CrossRef]
- Bai, Y.; Cotrufo, M.F. Grassland soil carbon sequestration: Current understanding, challenges, and solutions. Science 2022, 377, 603–608. [Google Scholar] [CrossRef]
- Brewer, K.M.; Muñoz-Araya, M.; Martinez, I.; Marshall, K.M.; Gaudin, A.C.M. Long-term integrated crop-livestock grazing stimulates soil ecosystem carbon flux, increasing subsoil carbon storage in California perennial agroecosystems. Geoderma 2023, 438, 116598. [Google Scholar] [CrossRef]
- Nave, L.E.; Swanston, C.W.; Mishra, U.; Nadelhoffer, K.J. Afforestation effects on soil carbon storage in the United States: A synthesis. Soil Sci. Soc. Am. J. 2013, 77, 1035–1047. [Google Scholar] [CrossRef]
- Aryal, D.R.; Morales-Ruiz, D.E.; López-Cruz, S.; Tondopó-Marroquín, C.N.; Lara-Nucamendi, A.; Jiménez-Trujillo, J.A.; Pérez-Sánchez, E.; Betanzos-Simon, J.E.; Casasola-Coto, F.; Martínez-Salinas, A.; et al. Silvopastoral systems and remnant for ests enhance carbon storage in livestock-dominated landscapes in Mexico. Sci. Rep. 2022, 12, 16769. [Google Scholar] [CrossRef]
- Saha, S.K.; Nair, P.K.R.; Nair, V.D.; Kumar, B.M. Soil carbon stock in relation to plant diversity of homegardens in Kerala, India. Agrofor. Syst. 2009, 76, 53–65. [Google Scholar] [CrossRef]
- Cardinael, R.; Umulisa, V.; Toudert, A.; Olivier, A.; Bockel, L.; Bernoux, M. Revisiting IPCC Tier 1 coefficients for soil organic and biomass carbon storage in agroforestry systems. Environ. Res. Lett. 2018, 13, 124020. [Google Scholar] [CrossRef]
- Feliciano, D.; Ledo, A.; Hillier, J.; Nayak, D.R. Which agroforestry options give the greatest soil and above ground carbon benefits in different world regions? Agric. Ecosyst. Environ. 2018, 254, 117–129. [Google Scholar] [CrossRef]
- Shi, L.; Feng, W.; Xu, J.; Kuzyakov, Y. Agroforestry systems: Meta-analysis of soil carbon stocks, sequestration processes, and future potentials. Land Degrad. Dev. 2018, 29, 3886–3897. [Google Scholar] [CrossRef]
- Rumpel, C.; Chabbi, A. Managing soil organic carbon for mitigating climate change and increasing food security. Agronomy 2021, 11, 1553. [Google Scholar] [CrossRef]
- Fresco, L.O.; Stroosnijder, L.; Bouma, J.; van Keulen, H. (Eds.) The Future of the Land: Mobilising and Integrating Knowledge for Land Use Option; Wiley & Sons: West Sussex, UK, 1994. [Google Scholar]
- Huerta, P.; Inthirat, A.; Carrasco, P.; Armenteros, I.; Recio, C.; Rodríguez-Jiménez, E.; Carrasco-García, J. Hidrogeología del entorno de las lagunas del Oso (Ávila). Geogaceta 2002, 72, 15–18. [Google Scholar] [CrossRef]
- Linkemer, G.; Board, J.E.; Musgrave, M.E. Waterlogging effects on growth and yield components in late-planted soybean. Crop. Sci. 1998, 38, 1576–1584. [Google Scholar] [CrossRef] [PubMed]
- Amendola, D.; Mutema, M.; Rosolen, V.; Chaplot, V. Soil hydromorphy and soil carbon: A global data analysis. Geoderma 2018, 324, 9–17. [Google Scholar] [CrossRef]
- Desir, G.; Gutiérrez Elorza, M.; Gutiérrez Santolalla, F. Origen y evolución de playas en una zona semiárida con arenas eólicas (región de Coca, Cuenca del Duero, España). Bol. Geol. Min. 2003, 114, 395–407. [Google Scholar]
- Sanz Donaire, J.J.; García Rodríguez, M.P. Aeolian origin of some wetlands in the Douro Basin, the High Moraña Region (Ávila, Spain). Obs. Medioambient. 1998, 1, 65–92. [Google Scholar]
- Martín Escorza, C. Distribución de las arenas eólicas de la Cuenca del Duero (Meseta Ibérica). Zona Arqueol. 2004, 4, 84–91. [Google Scholar]
- IGME. Mapa Geológico de España 1:50.000. Hoja 481 (La Nava de Arévalo); Instituto Tecnológico y Geominero de España: Madrid, Spain, 1982. [Google Scholar]
- IGME. Mapa Geológico de España 1:50.000, hoja nº 506 (Cardeñosa) y Memoria; Instituto Tecnológico y Geominero de España: Madrid, Spain, 1982. [Google Scholar]
- Barrera, I.; Carrasco-Salazar, M.A.; Cirujano, S.; Sánchez-Sánchez, J.; Velayos, M. Plantas de la comarca de La Moraña (Ávila, España). Stud. Botánica 1986, 5, 149–153. [Google Scholar]
- Martín García, L.P.; Díaz Fernández, P.M.; López-Almansa, J.C. Flora y vegetación del término municipal de El Oso (Ávila). In Proceedings of the Congreso Nacional de Medio Ambiente CONAMA 10, Madrid, Spain, 24–27 November 2014. [Google Scholar]
- UNEP. United Nations Environment Program—World Atlas of Desertification; UNEP: London, UK, 1992. [Google Scholar]
- FAO. Guidelines for Soil Description, 4th ed.; Food and Agriculture Organization of the United Nations: Rome, Italy, 2006. [Google Scholar]
- Munsell Colour Company. Munsell Soil Colour Charts, Revised ed.; Macbeth Division of Kollmorgen Instruments Corporation: New York, NY, USA, 1990. [Google Scholar]
- Gee, G.W.; Bauder, J.W. Particle-size analysis. In Methods of Soil Analysis: Part 1 Physical and Mineralogical Methods, 2nd ed.; Klute, A., Ed.; American Society of Agronomy: Madison, WI, USA, 1986; pp. 383–411. [Google Scholar]
- Blake, G.R.; Hartge, K.H. Bulk Density. In Methods of Soil Analysis: Part 1 Physical and Mineralogical Methods, 2nd ed.; Klute, A., Ed.; Soil Science Society of America, American Society of Agronomy: Madison, WI, USA, 2018; pp. 363–375. [Google Scholar] [CrossRef]
- Bremner, J.M.; Mulvaney, C.S. Total nitrogen. In Methods of Soil Analysis. Part 2; Page, A.L., Miller, R.H., Keeney, D.R., Eds.; Agronomy Monograph 9; American Society of Agronomy: Madison, WI, USA, 1982; pp. 1149–1170. [Google Scholar]
- Nelson, D.W.; Sommers, L.E. Total carbon, organic carbon and organic matter. In Methods of Soil Analysis, Part 2, Chemical and Mineralogical Properties, 2nd ed.; Page, A.L., Miller, R.H., Keeney, D.R., Eds.; American Society of Agronomy: Madison, WI, USA, 1982; pp. 539–557. [Google Scholar]
- Olsen, S.R.; Cole, C.V.; Watanabe, F.S. Estimation of Available Phosphorus in Soils by Extraction with Sodium Bicarbonate; USDA Circular No. 939; US Government Printing Office: Washington, DC, USA, 1954.
- FAO. Measuring and Modelling Soil Carbon Stocks and Stock Changes in Livestock Production Systems: Guidelines for Assessment (Version 1); Livestock Environmental Assessment and Performance (LEAP) Partnership; FAO: Rome, Italy, 2019. [Google Scholar]
- Veldkamp, E. Organic carbon turnover in three tropical soils under pasture after deforestation. Soil Sci. Soc. Am. J. 1994, 58, 175–180. [Google Scholar] [CrossRef]
- Batjes, N.H. Total carbon and nitrogen in the soils of the world. Eur. J. Soil Sci. 1996, 47, 151–163. [Google Scholar] [CrossRef]
- IUSS Working Group WRB. World Reference Base for Soil Resources 2014 Updates; International Soil Classification System for Naming Soils and Creating Legends for Soil Maps; World Soil Resource Report No. 106; FAO: Rome, Italy, 2015. [Google Scholar]
- Soil Survey Staff. Keys to Soil Taxonomy, 12th ed.; United States Department of Agriculture, Natural Resources Conservation Service: Washington DC, USA, 2014. [Google Scholar]
- Bernáldez, F.G.; Rey Benayas, J.M. Geochemical relationships between groundwater and wetland soils and their effects on vegetation in central Spain. Geoderma 1992, 55, 273–288. [Google Scholar] [CrossRef]
- Jarecki, M.K.; Lal, R.; James, J. Crop management effects on soil carbon sequestration on selected farmers’ fields in northeastern Ohio. Soil Tillage Res. 2005, 81, 265–276. [Google Scholar] [CrossRef]
- Parras-Alcántara, L.; Martín-Carrillo, M.; Lozano-García, B. Impacts of land use change in soil carbon and nitrogen in a Mediterranean agricultural area (Southern Spain). Solid Earth 2013, 4, 167–177. [Google Scholar] [CrossRef]
- Paul, K.I.; Polglase, P.J.; Nyakuengama, J.G.; Khanna, P.K. Change in soil carbon following afforestation. For. Ecol. Manag. 2002, 168, 241–257. [Google Scholar] [CrossRef]
- Frank, A.B.; Tanaka, D.L.; Hofmann, L.; Follett, R.F. Soil carbon and nitrogen of Northern Great Plains grasslands as influenced by long-term grazing. J. Range Manag. 1995, 48, 470–474. [Google Scholar] [CrossRef]
- Forteza, J.; García-Rodríguez, A. Mapa de Suelos de Castilla y Leon; Junta de Castilla y León: Madrid, Spain, 1988. [Google Scholar]
- Dos Santos, U.J.; de Sá Barretto Sampaio, E.V.; de Andrade, E.M.; de Siqueira Pinto, A.; de Oliveira Dias, B.; Nascimento de Jesus, K.; da Silva Santana, M.; Diniz Althoff, T.; Marques Fernandes, M.; Cezar Menezes, R.S. Nitrogen stocks in soil classes under different land uses in the Brazilian semiarid region. J. Soil Sci. Plant Nutr. 2021, 21, 1621–1630. [Google Scholar] [CrossRef]
- Bai, X.; Huang, Y.; Ren, W.; Coyne, M.; Jacinthe, P.A.; Tao, B.; Hui, D.; Yang, J.; Matocha, C. Responses of Soil Carbon Sequestration to Climate-Smart Agriculture Practices: A Meta-Analysis. Glob. Chang. Biol. 2019, 25, 2591–2606. [Google Scholar] [CrossRef]
- Rodríguez Martín, J.A.; Álvaro-Fuentes, J.; Gonzalo, J.; Gil, C.; Ramos-Miras, J.J.; Grau Corbí, J.M.; Boluda, R. Assessment of the soil organic carbon stock in Spain. Geoderma 2016, 264A, 117–125. [Google Scholar] [CrossRef]
- Rabbi, S.M.F.; Tighe, M.; Delgado-Baquerizo, M.; Cowie, A.; Robertson, F.; Dalal, R.; Page, K.; Crawford, D.; Wilson, B.R.; Schwenke, G.; et al. Climate and soil properties limit the positive effects of land use reversion on carbon storage in Eastern Australia. Sci. Rep. 2015, 5, 17866. [Google Scholar] [CrossRef]
- Vigil, R.; García, R.; Rubio, R.; Jiménez Ballesta, R. Soil Alteration processes on granite in the central mountain range (Spain). Z. Geomorph. 1999, 44, 233–248. [Google Scholar]
- Wang, X.; Yoo, K.; Wackett, A.A.; Gutknecht, J.; Amundson, R.; Heimsath, A. Soil organic carbon and mineral interactions on climatically different hillslopes. Geoderma 2018, 322, 71–80. [Google Scholar] [CrossRef]
- Calvo de Anta, R.; Luís, E.; Febrero-Bande, M.; Galiñanes, J.; Macías, F.; Ortíz, R.; Casás, F. Soil organic carbon in peninsular Spain: Influence of environmental factors and spatial distribution. Geoderma 2020, 370, 114365. [Google Scholar] [CrossRef]
- Vepraskas, M.J.; Guertal, W.R. Morphological indicators of soil wetness. In Proceedings of the 8th International Correlation Meeting on Wetland Soils; Kimble, J.M., Ed.; USDA Soil Conservation Service: Washington DC, USA, 1992; pp. 307–312. [Google Scholar]
- Guo, L.B.; Gifford, R.M. Soil carbon stocks and land use change: A meta-analysis. Glob. Chang. Biol. 2002, 8, 345–360. [Google Scholar] [CrossRef]
- Chaplot, V.; Bernoux, M.; Walter, C.; Curmi, P.; Herpin, U. Soil carbon storage prediction in temperate hydromorphic soils by using a morphological index and Digital Elevation Model. Soil Sci. 2001, 166, 48–60. [Google Scholar] [CrossRef]
- Leifeld, J.; Bassin, S.; Fuhrer, J. Carbon stocks in Swiss agricultural soils predicted by land-use. Soil characteristics and altitude. Agric. Ecosyst. Environ. 2005, 105, 255–266. [Google Scholar] [CrossRef]
- San Miguel, A.; Roig, S.; Perea, R. Pastures of Spain. Available online: https://www.researchgate.net/publication/317007469_The_pastures_of_Spain (accessed on 24 June 2024).
- Nair, P.K.; Kumar, B.; Nair, D. Agroforestry as a strategy for carbon sequestration. J. Plant Nutr. Soil Sci. 2009, 172, 10–23. [Google Scholar] [CrossRef]
- Marks, E.A.N.; Barbosa, J.M.; García-Orenes, F.; Mataix-Solera, J.; Arcenegui, V.; Albolafio, S.; Velamazán, M.; García-Carmona, M.; Sánchez-Zapata, J.A. Ungulate herbivores promote contrasting modifications of soil properties and organic carbon stabilization in a grazed grassland versus rewilded woodland environment. Agric. Ecosyst. Environ. 2024, 367, 108983. [Google Scholar] [CrossRef]
- Wang, Y.; Fu, B.; Lü, Y.; Song, C.; Luan, Y. Local-scale spatial variability of soil organic carbon and its stock in the hilly area of the Loess Plateau, China. Quat. Res. 2010, 73, 70–76. [Google Scholar] [CrossRef]
- West, T.O.; Post, W.M. Soil organic carbon sequestration rates by tillage and crop rotation: A global data analysis. Soil Sci. Soc. Am. J. 2002, 66, 1930–1946. [Google Scholar] [CrossRef]
- Puget, P.; Lal, R. Soil organic carbon and nitrogen in a Mollisol in central Ohio as affected by tillage and land use. Soil Tillage Res. 2005, 80, 201–213. [Google Scholar] [CrossRef]
- Blanco-Canqui, H.; Lal, R. Principles of Soil Conservation and Management; Springer: Dordrecht, The Netherlands, 2008. [Google Scholar]
- García-Moreno, J.; Gordillo-Rivero, A.J.; Zavala, L.M.; Jordán, A.; Pereira, P. Mulch application in fruit orchards increases the persistence of soil water repellency during a 15-years period. Soil Tillage Res. 2013, 130, 62–68. [Google Scholar] [CrossRef]
- Kerckhoffs, L.H.J.; Reid, J.B. Carbon Sequestration in the Standing Biomass of Orchard Crops in New Zealand; Report Prepared for Horticulture New Zealand Ltd.; New Zealand Institute for Crop and Food Research Ltd.: Hastings, New Zealand, 2007. [Google Scholar]
- Hu, Y.L.; Zeng, D.H.; Fan, Z.P.; Chen, G.S.; Zhao, Q.; Pepper, D. Changes in ecosystem carbon stocks following grassland afforestation of semiarid sandy soil in the southeastern Keerqin Sandy Lands, China. J. Arid Environ. 2008, 282, 379–386. [Google Scholar] [CrossRef]
- Lal, R. Digging deeper: A holistic perspective of factors affecting soil organic carbon sequestration in agroecosystems. Glob. Chang. Biol. 2018, 24, 3285–3301. [Google Scholar] [CrossRef]
- Plaza, C.; Zaccone, C.; Sawicka, K.; Méndez, A.M.; Tarquis, A.; Gascó, G.; Heuvelink, G.B.M.; Schuur, E.A.G.; Maestre, F.T. Soil resources and element stocks in drylands to face global issues. Sci. Rep. 2018, 8, 13788. [Google Scholar] [CrossRef]
- Oliveira Filho, J.S.; Lopes, R.O.; Araújo, M.O.; Magalhães, M.S.; Vasconcelos, M.D.S.; Lima, A.R.L.; Bastos., F.H.; Pereira, M.G. How does increasing humidity in the environment affect soil carbon and nitrogen stocks and the C/N ratio in tropical drylands? Evidence from Northeastern Brazil. Catena 2022, 213, 106208. [Google Scholar] [CrossRef]
- Rodríguez-Murillo, J.C. Organic carbon content under different types of land use and soil in peninsular Spain. Biol. Fertil. Soils 2001, 33, 53–61. [Google Scholar] [CrossRef]
- Minasny, B.; Malone, B.P.; McBratney, A.B.; Angers, D.A.; Arrouays, D.; Chambers, A.; Chaplot, V.; Chen, Z.-S.; Cheng, K.; Das, B.S.; et al. Soil Carbon 4 per Mille. Geoderma 2017, 292, 59–86. [Google Scholar] [CrossRef]
- Calero, J.; García-Ruiz, R.; Torrús-Castillo, M.; Vicente-Vicente, J.L.; Martín-García, J.M. Role of clay mineralogy in the stabilization of soil organic carbon in olive groves under contrasted soil management. Minerals 2023, 13, 60. [Google Scholar] [CrossRef]
- Wallace, A. Soil organic matter is essential to solving soil and environmental problems. Commun. Soil Sci. Plant Anal. 1994, 25, 15–28. [Google Scholar] [CrossRef]
- Isaac, M.E.; Borden, K.A. Nutrient acquisition strategies in agroforestry systems. Plant Soil 2019, 444, 1–19. [Google Scholar] [CrossRef]
- Stewart, C.E.; Paustian, K.; Conant, R.T.; Plante, A.F.; Six, J. Soil carbon saturation: Concept, evidence and evaluation. Biogeochemistry 2007, 86, 19–31. [Google Scholar] [CrossRef]
- Jandl, R.; Lindner, M.; Vesterdal, L.; Bauwens, B.; Baritz, R.; Hagedorn, F.; Johnson, D.W.; Minkkinen, K.; Byrne, K.A. How strongly can forest management influence soil carbon sequestration? Geoderma 2007, 137, 253–268. [Google Scholar] [CrossRef]
- Pisarcik, M.; Hakl, J.; Toleikiene, M.; Fuksa, P.; Rasmussen, J.; Hood-Nowotny, R. Role of cover crop roots in soil organic carbon accrual—A review. Eur. J. Soil Sci. 2024, 75, e13532. [Google Scholar] [CrossRef]


| Profile | Parent Material | Vegetation/ Use | Soil Name | Horizon Depth (cm) | Color Munsell | ||
|---|---|---|---|---|---|---|---|
| Soil Taxonomy | WRB-FAO | ||||||
| 1 | Eutric Cambisol | Ah1 (0–20) | 10YR5/2 | Yellowish-brown | |||
| 1 | Arkoses | Ryegrass, | Aquic | (Protocalcic, | Ah2 (21–75) | 10YR3/4 | Dark yellowish-brown |
| 1 | grassland | Haploxerept | Oxyaquic | Bw (76–110) | 10YR7/1 | Light gray | |
| 1 | Alkalic) | C > 111 | 10YR5/3 | Pale brown | |||
| 2 | Eutric Cambisol | Ah1 (0–18) | 10YR6/1 | Gray | |||
| 2 | Arkoses | Hydrophilic | Aquic | (Protocalcic, | Ah2 (19–72) | 2.5Y5/2 | Grayish-brown |
| 2 | grassland | Haploxerept | Oxyaquic | Bw (73–120) | 10YR7/1 | Light gray | |
| 2 | Alkalic) | C > 121 | 10YR5/4 | Yellowish-brown | |||
| 3 | Pine forest, grassland, rattle grass | Oxiaquic | Eutric Arenosol | Ah (0–16) | 10YR3/3 | Dark brown | |
| 3 | Aeolian sands | Xeropsamment | (Aeolic, | C1 (17–78) | 10YR6/4 | Light yellowish-brown | |
| 3 | Humic) | C2 > 79 | 10YR5/4 | Yellowish-brown | |||
| 4 | Eutric Arenosol | Ah (0–18) | 10YR6/1 | Gray | |||
| 4 | Aeolian sands | Ryegrass, | Oxiaquic | (Aeolic, | AC (19–42) | 10YR5/4 | Yellowish-brown |
| 4 | magaza | Xeropsamment | Oxyaquic) | Ahb (43–71) | 10YR4/4 | Dark yellowish-brown | |
| 4 | C > 72 | 10YR5/6 | Yellowish-brown | ||||
| Soil Sample | Land Use |
|---|---|
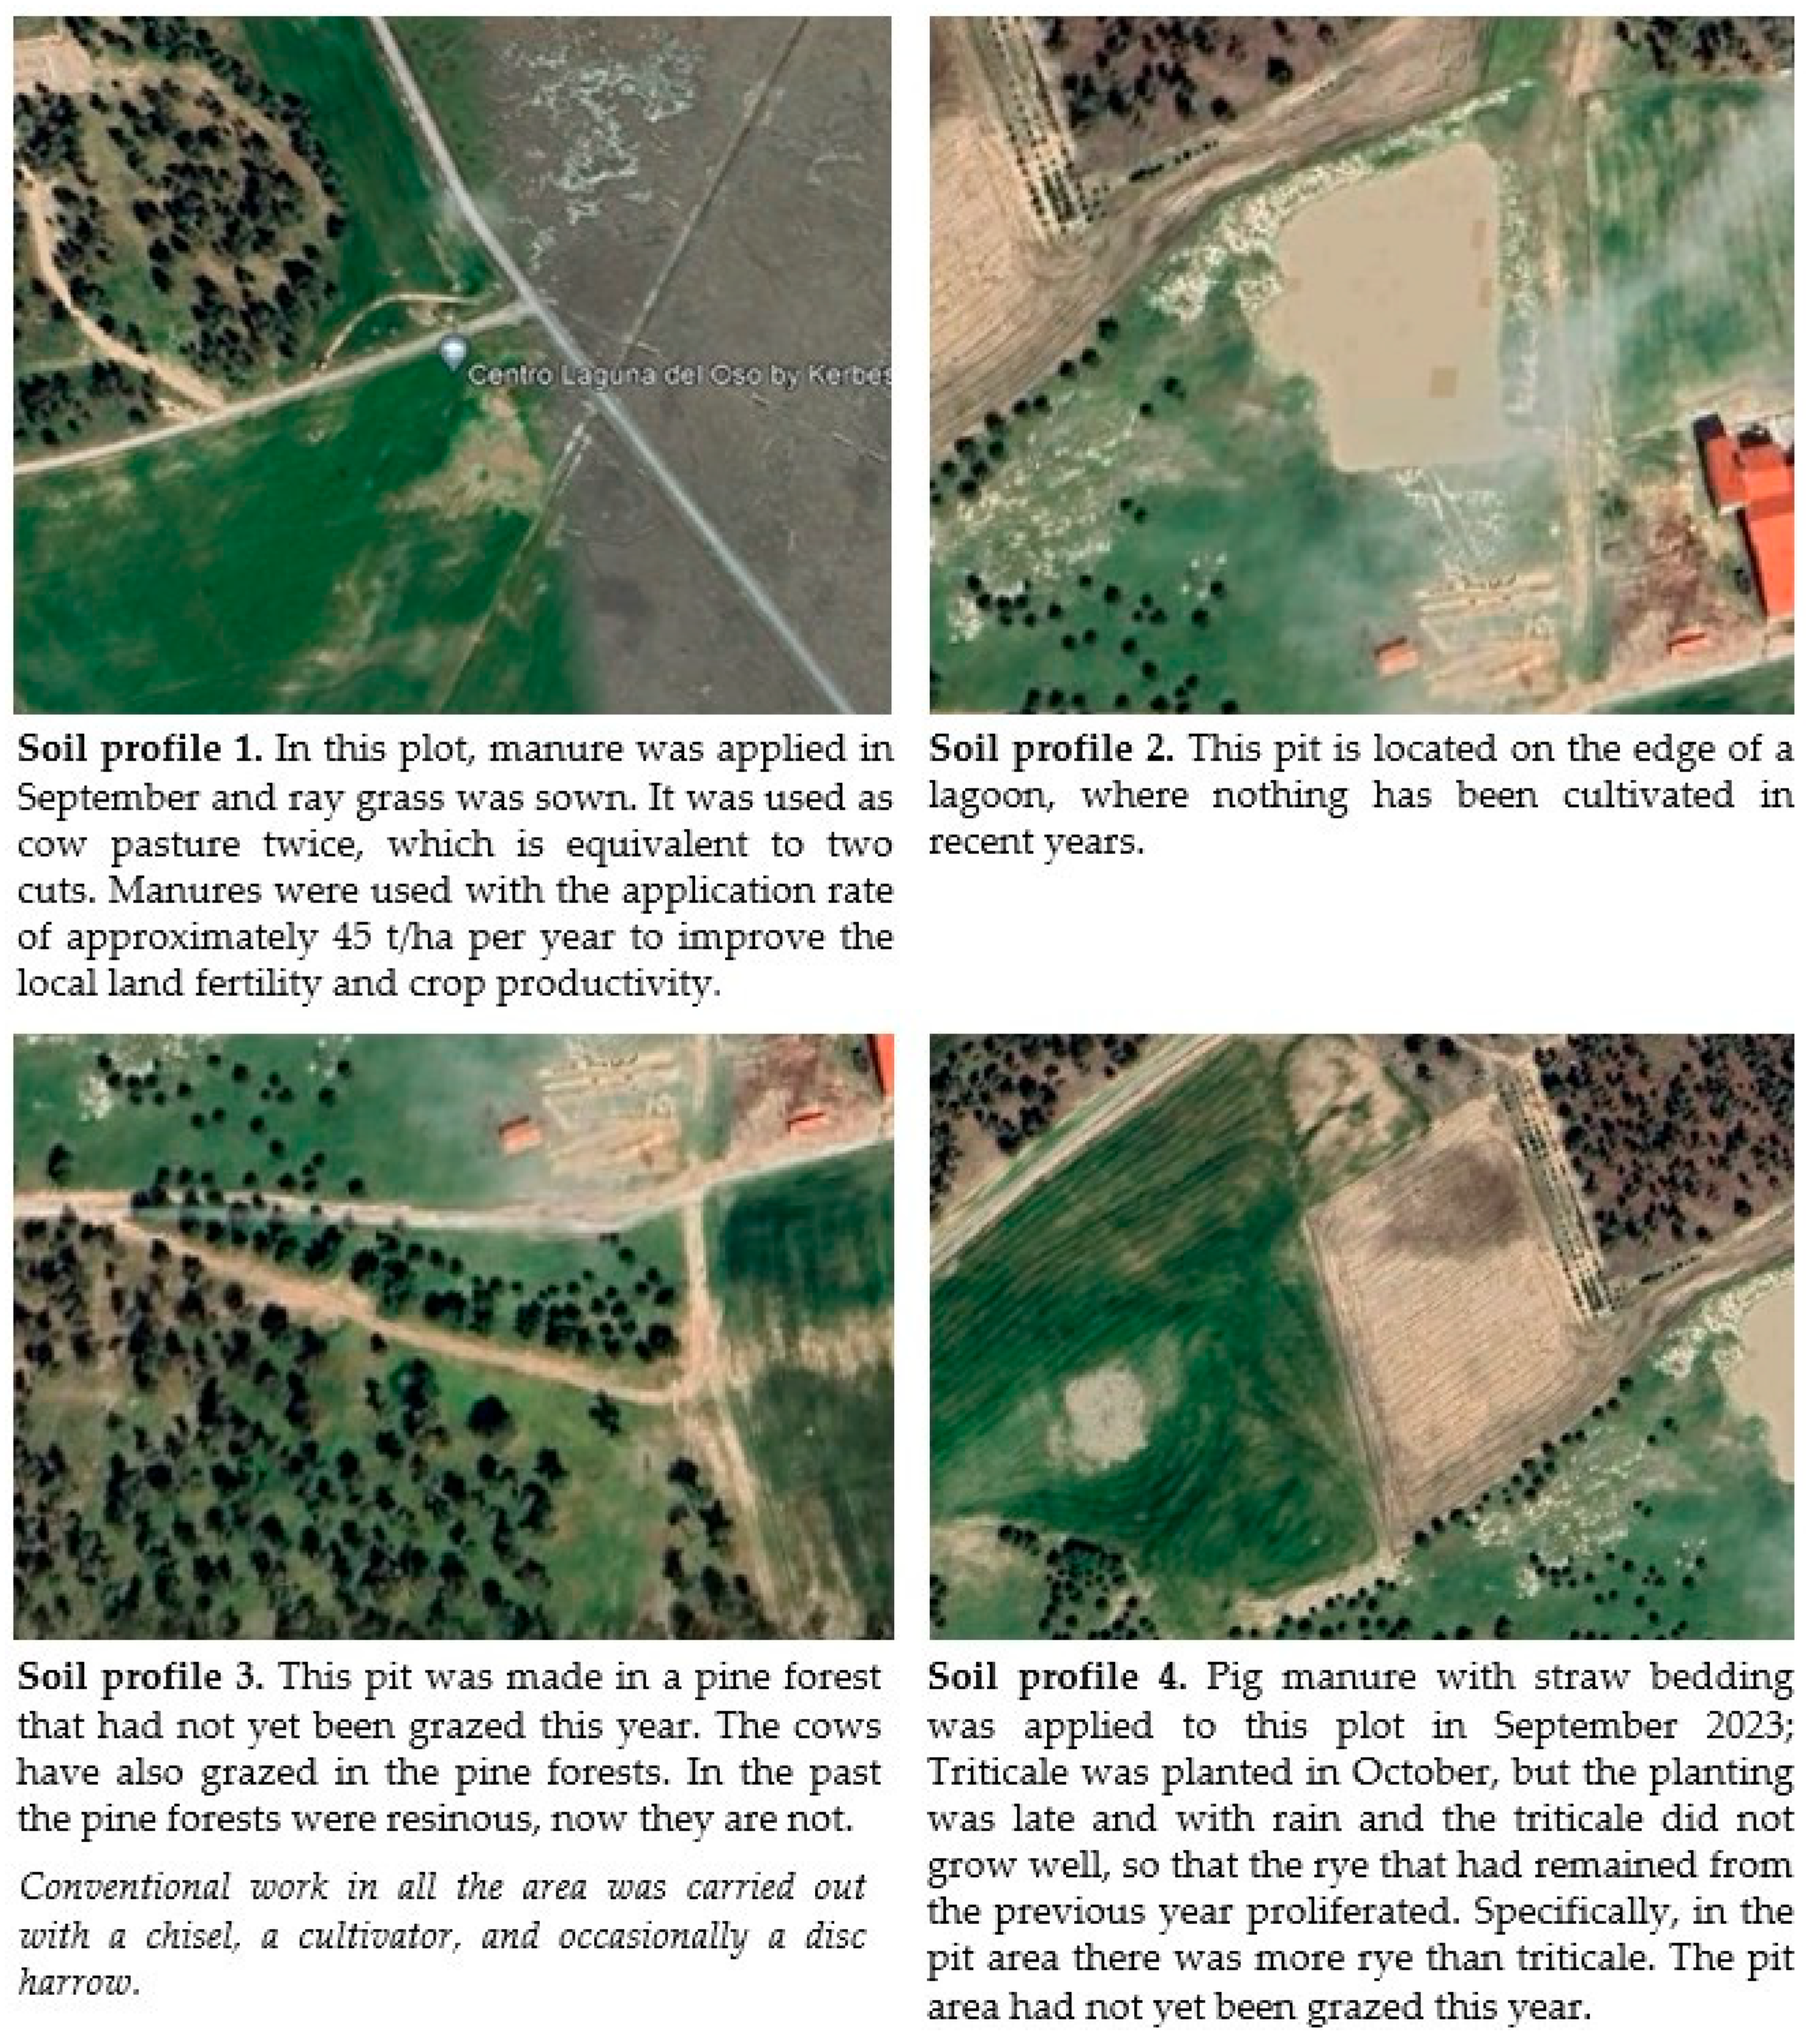
| 1 | Pine forest, grazed with free-range Hereford cows and, currently, horses |
| 2 | Cropland planted with ryegrass, used by Hereford cows with rotational grazing |
| 3 | Cropland that was planted with wheat harvested by Hereford cows with rotational grazing and, currently, goats on that plot |
| 4 | Pine forest grazed with Hereford cows only once, with little impact |
| 5 | Cropland that was planted with triticale, harvested by Hereford cows with rotational grazing |
| 6 | Soil in the immediate vicinity of the lagoon: grey impermeable and bare soil |
| 7 | Ungrazed pine forest |
| 8 | Cropland that was planted with triticale and rye, harvested by free-range Wagyu cows. |
| Soil | Hor. | Depth (cm) | BD (Mg m−3) | SOC (%) | pH | P (ppm) | N (%) | C Stock (Mg ha−1) | N Stock (Mg ha−1) |
|---|---|---|---|---|---|---|---|---|---|
| 1 | Ah1 | 0–20 | 1.23 ±0.07 | 1.16 ±0.04 | 6.32 ±0.11 | 65.9 ±0.21 | 0.152 ±0.01 | 28.5 | 3.7 |
| Ah2 | 20–75 | 1.55 ±0.09 | 0.13 ±0.01 | 8.64 ±0.12 | 37.1 ±0.14 | 0.055 ±0.01 | 28.1 | 4.6 | |
| Bw | 75–110 | 1.41 ±0.07 | 0.07 ±0.01 | 8.75 ±0.10 | 18.4 ±0.19 | 0.028 ±0.02 | 6.3 | 1.3 | |
| 2 | Ah1 | 0–18 | 1.52 ±0.06 | 0.98 ±0.02 | 8.11 ±0.11 | 84.3 ±0.13 | 0.173 ±0.02 | 15.8 | 4.7 |
| Ah2 | 18–72 | 1.689 ±0.09 | 0.53 ±0.01 | 9.03 ±0.09 | 94.8 ±0.17 | 0.066 ±0.01 | 48.3 | 6.0 | |
| Bw | 72–120 | 1.628 ±0.07 | 0.15 ±0.01 | 9.10 ±0.09 | 43.7 ±0.19 | 0.019 ±0.01 | 11.7 | 1.6 | |
| 3 | Ah | 0–16 | 1.173 ±0.07 | 4.60 ±0.09 | 6.61 ±0.10 | 94.2 ±0.15 | 0.179 ±0.03 | 86.3 | 3.3 |
| C | 16–68 | 1.461 ±0.06 | 0.1 ±0.01 | 6.67 ±0.10 | 15.3 ±0.19 | 0.021 ±0.01 | 7.5 | 1.2 | |
| 4 | Ah | 0–18 | 1.079 ±0.07 | 2.49 ±0.09 | 6.92 ±0.09 | 210.3 ±0.13 | 0.368 ±0.03 | 48.3 | 0.7 |
| C | 18–42 | 1.222 ±0.08 | 1.72 ±0.08 | 5.63 ±0.09 | 76.3 ±0.16 | 0.084 ±0.01 | 50.4 | 2.4 |
| Soil Sample | Use | SOC (%) | N (%) | C/N | BD (Mg m−3) | C Stock (Mg ha−1) | N Stock (Mg ha−1) |
|---|---|---|---|---|---|---|---|
| 1 | Pine forest | 1.04 | 0.164 | 6.3 | 1.546 ±0.05 | 32.0 | 5.0 |
| 2 | Cropland | 1.45 | 0.336 | 4.3 | 1.454 ±0.06 | 42.7 | 9.7 |
| 3 | Cropland | 1.25 | 0.259 | 4.8 | 1.437 ±0.07 | 35.9 | 7.4 |
| 4 | Pine forest | 0.56 | 0.184 | 3.0 | 1.609 ±0.08 | 18.0 | 5.9 |
| 5 | Cropland | 0.80 | 0.270 | 2.9 | 1.514 ±0.08 | 24.1 | 8.2 |
| 6 | Lagoon | 0.60 | 0.299 | 2.0 | 1.521 ±0.06 | 18.2 | 9.0 |
| 7 | Pine forest | 0.34 | 0.168 | 2.0 | 1.652 ±0.07 | 11.2 | 5.5 |
| 8 | Cropland | 0.73 | 0.262 | 2.8 | 1.501 ±0.06 | 21.8 | 2.6 |
Disclaimer/Publisher’s Note: The statements, opinions and data contained in all publications are solely those of the individual author(s) and contributor(s) and not of MDPI and/or the editor(s). MDPI and/or the editor(s) disclaim responsibility for any injury to people or property resulting from any ideas, methods, instructions or products referred to in the content. |
© 2024 by the authors. Licensee MDPI, Basel, Switzerland. This article is an open access article distributed under the terms and conditions of the Creative Commons Attribution (CC BY) license (https://creativecommons.org/licenses/by/4.0/).
Share and Cite
Alvarez-Castellanos, M.P.; Escudero-Campos, L.; Mongil-Manso, J.; San Jose, F.J.; Jiménez-Sánchez, A.; Jiménez-Ballesta, R. Organic Carbon Storage in Waterlogging Soils in Ávila, Spain: A Traditional Agrosilvopastoral Region. Land 2024, 13, 1630. https://doi.org/10.3390/land13101630
Alvarez-Castellanos MP, Escudero-Campos L, Mongil-Manso J, San Jose FJ, Jiménez-Sánchez A, Jiménez-Ballesta R. Organic Carbon Storage in Waterlogging Soils in Ávila, Spain: A Traditional Agrosilvopastoral Region. Land. 2024; 13(10):1630. https://doi.org/10.3390/land13101630
Chicago/Turabian StyleAlvarez-Castellanos, María P., Laura Escudero-Campos, Jorge Mongil-Manso, Francisco J. San Jose, Adrián Jiménez-Sánchez, and Raimundo Jiménez-Ballesta. 2024. "Organic Carbon Storage in Waterlogging Soils in Ávila, Spain: A Traditional Agrosilvopastoral Region" Land 13, no. 10: 1630. https://doi.org/10.3390/land13101630
APA StyleAlvarez-Castellanos, M. P., Escudero-Campos, L., Mongil-Manso, J., San Jose, F. J., Jiménez-Sánchez, A., & Jiménez-Ballesta, R. (2024). Organic Carbon Storage in Waterlogging Soils in Ávila, Spain: A Traditional Agrosilvopastoral Region. Land, 13(10), 1630. https://doi.org/10.3390/land13101630