
Delineating Ecological Functional Zones and Grades for Multi-Scale Ecosystem Management

 ,
,  ,
,  and
and 
Abstract
1. Introduction
2. Data and Methods
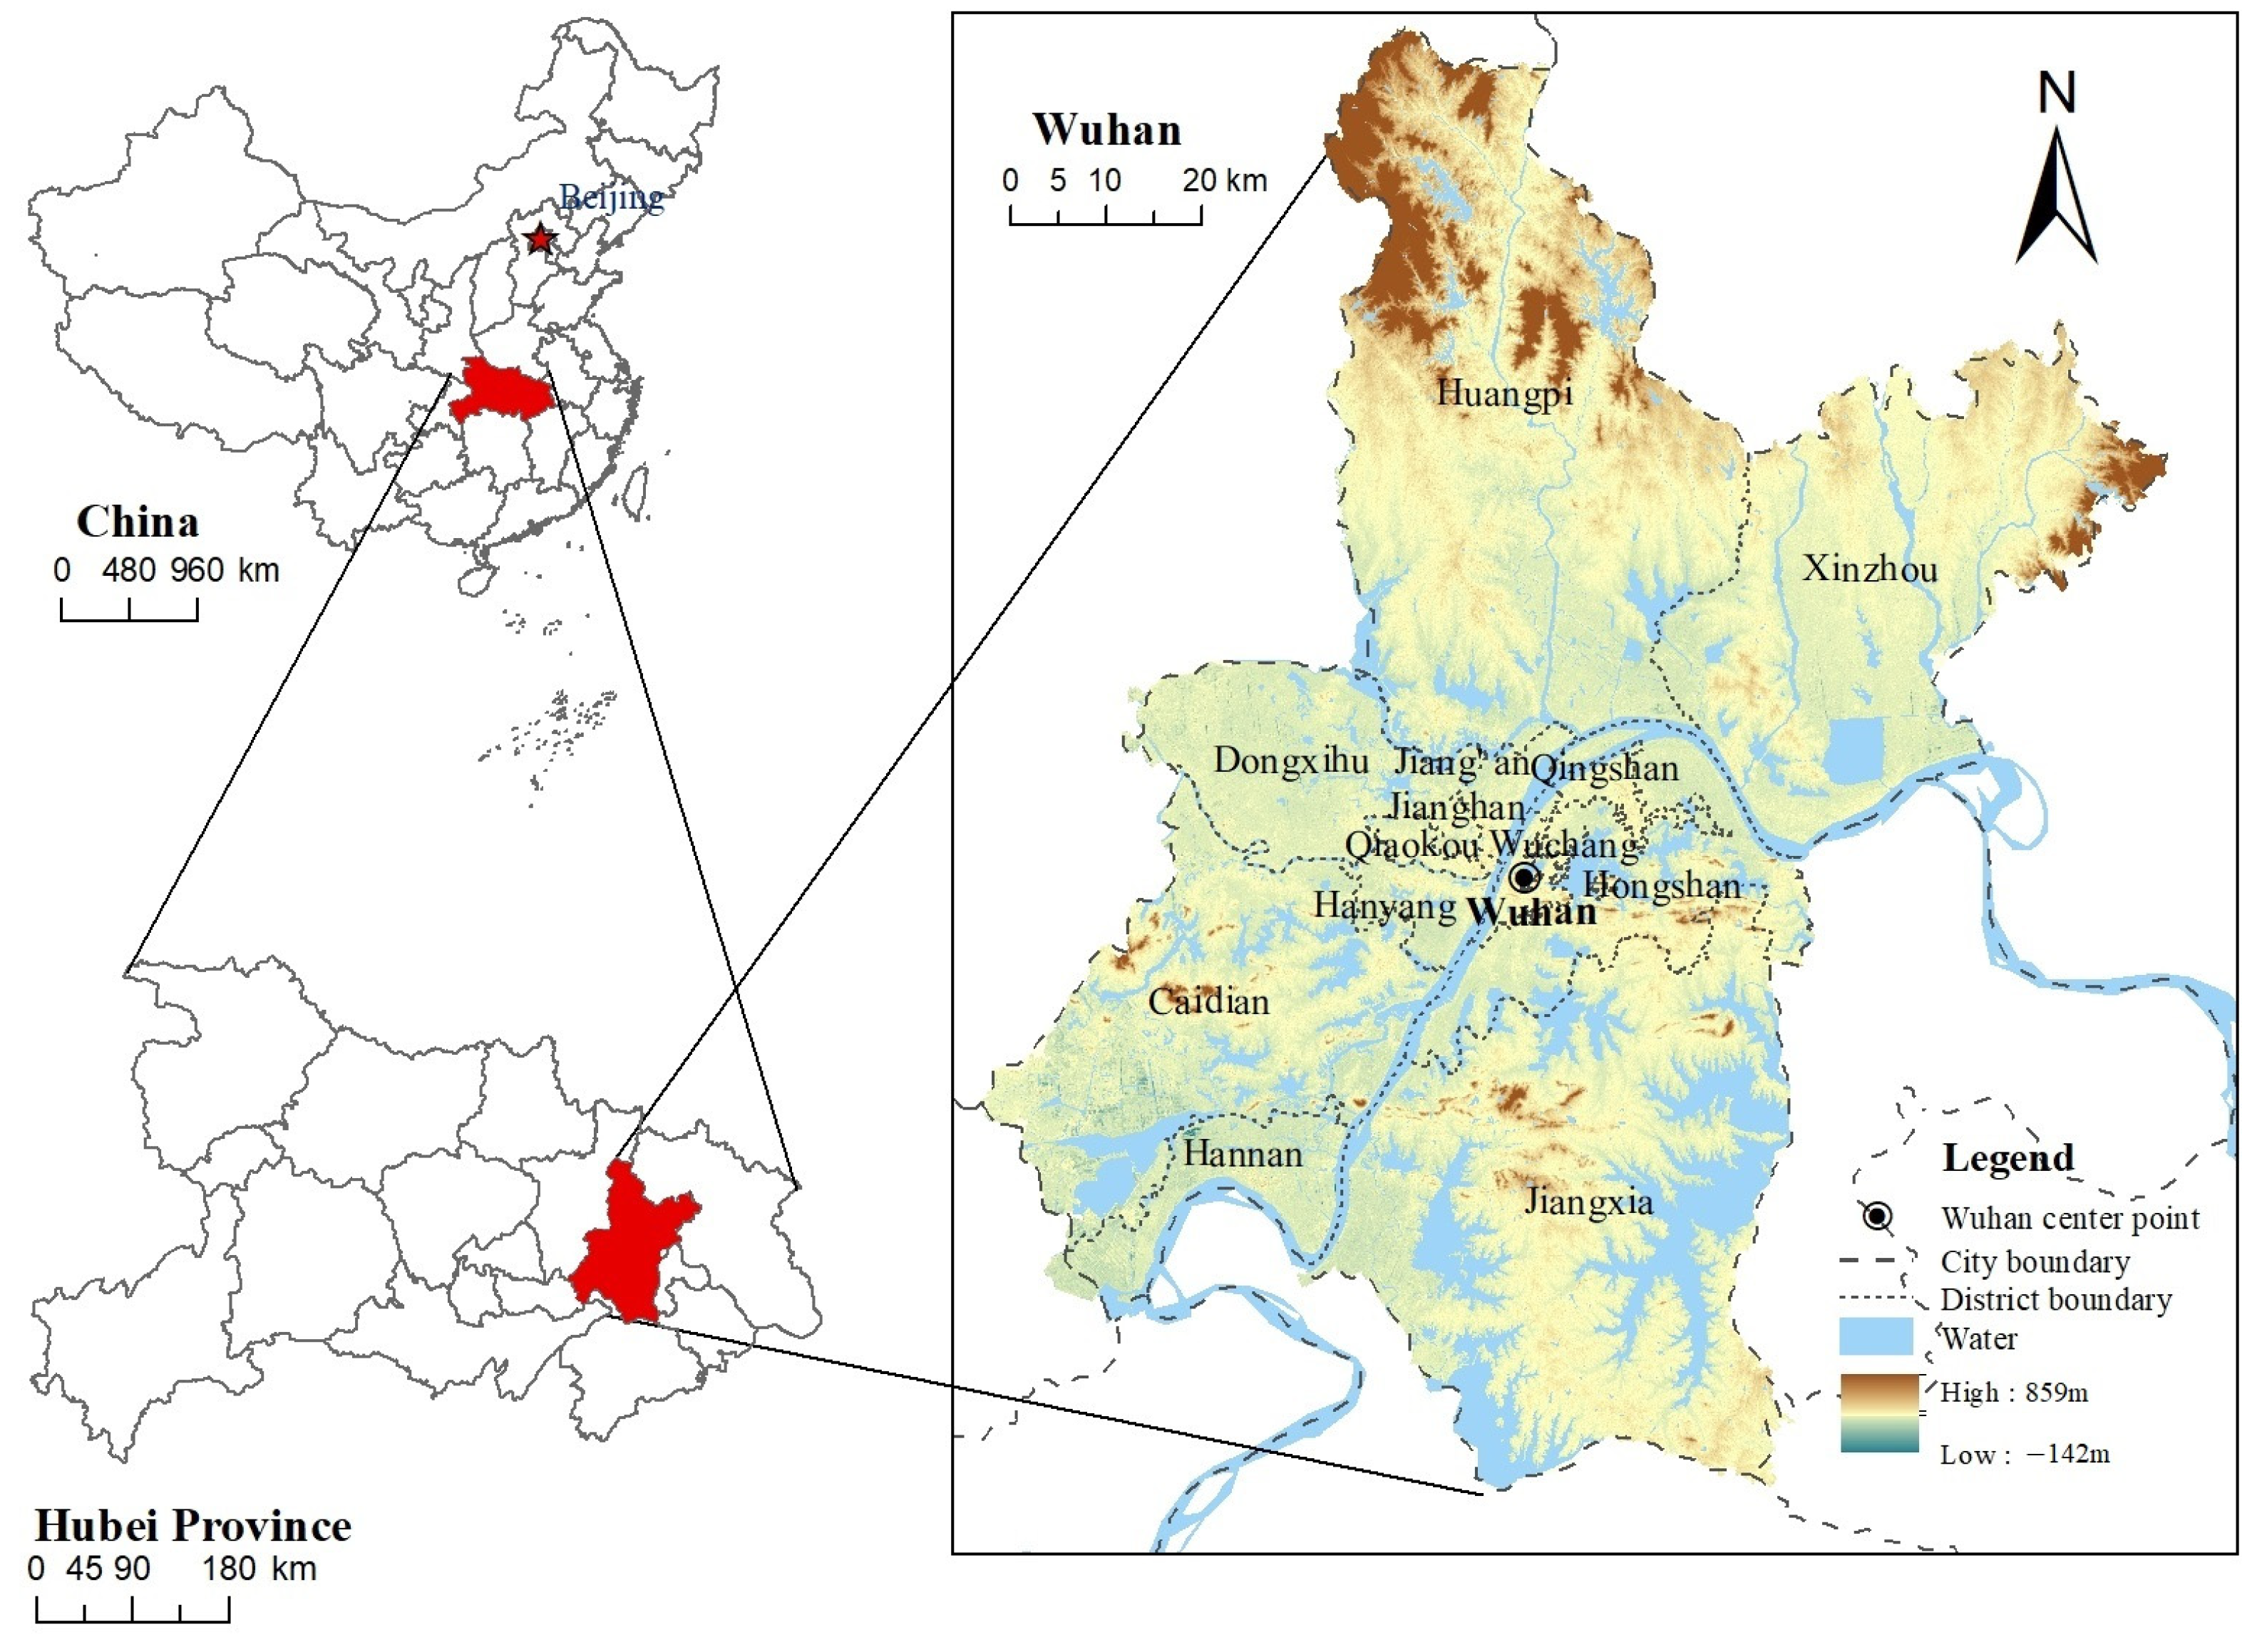
2.1. Study Area
2.2. Data Description
2.3. Methods
2.3.1. Model Framework
2.3.2. Ecosystem Service Selection, Evaluation and Correlation Identification
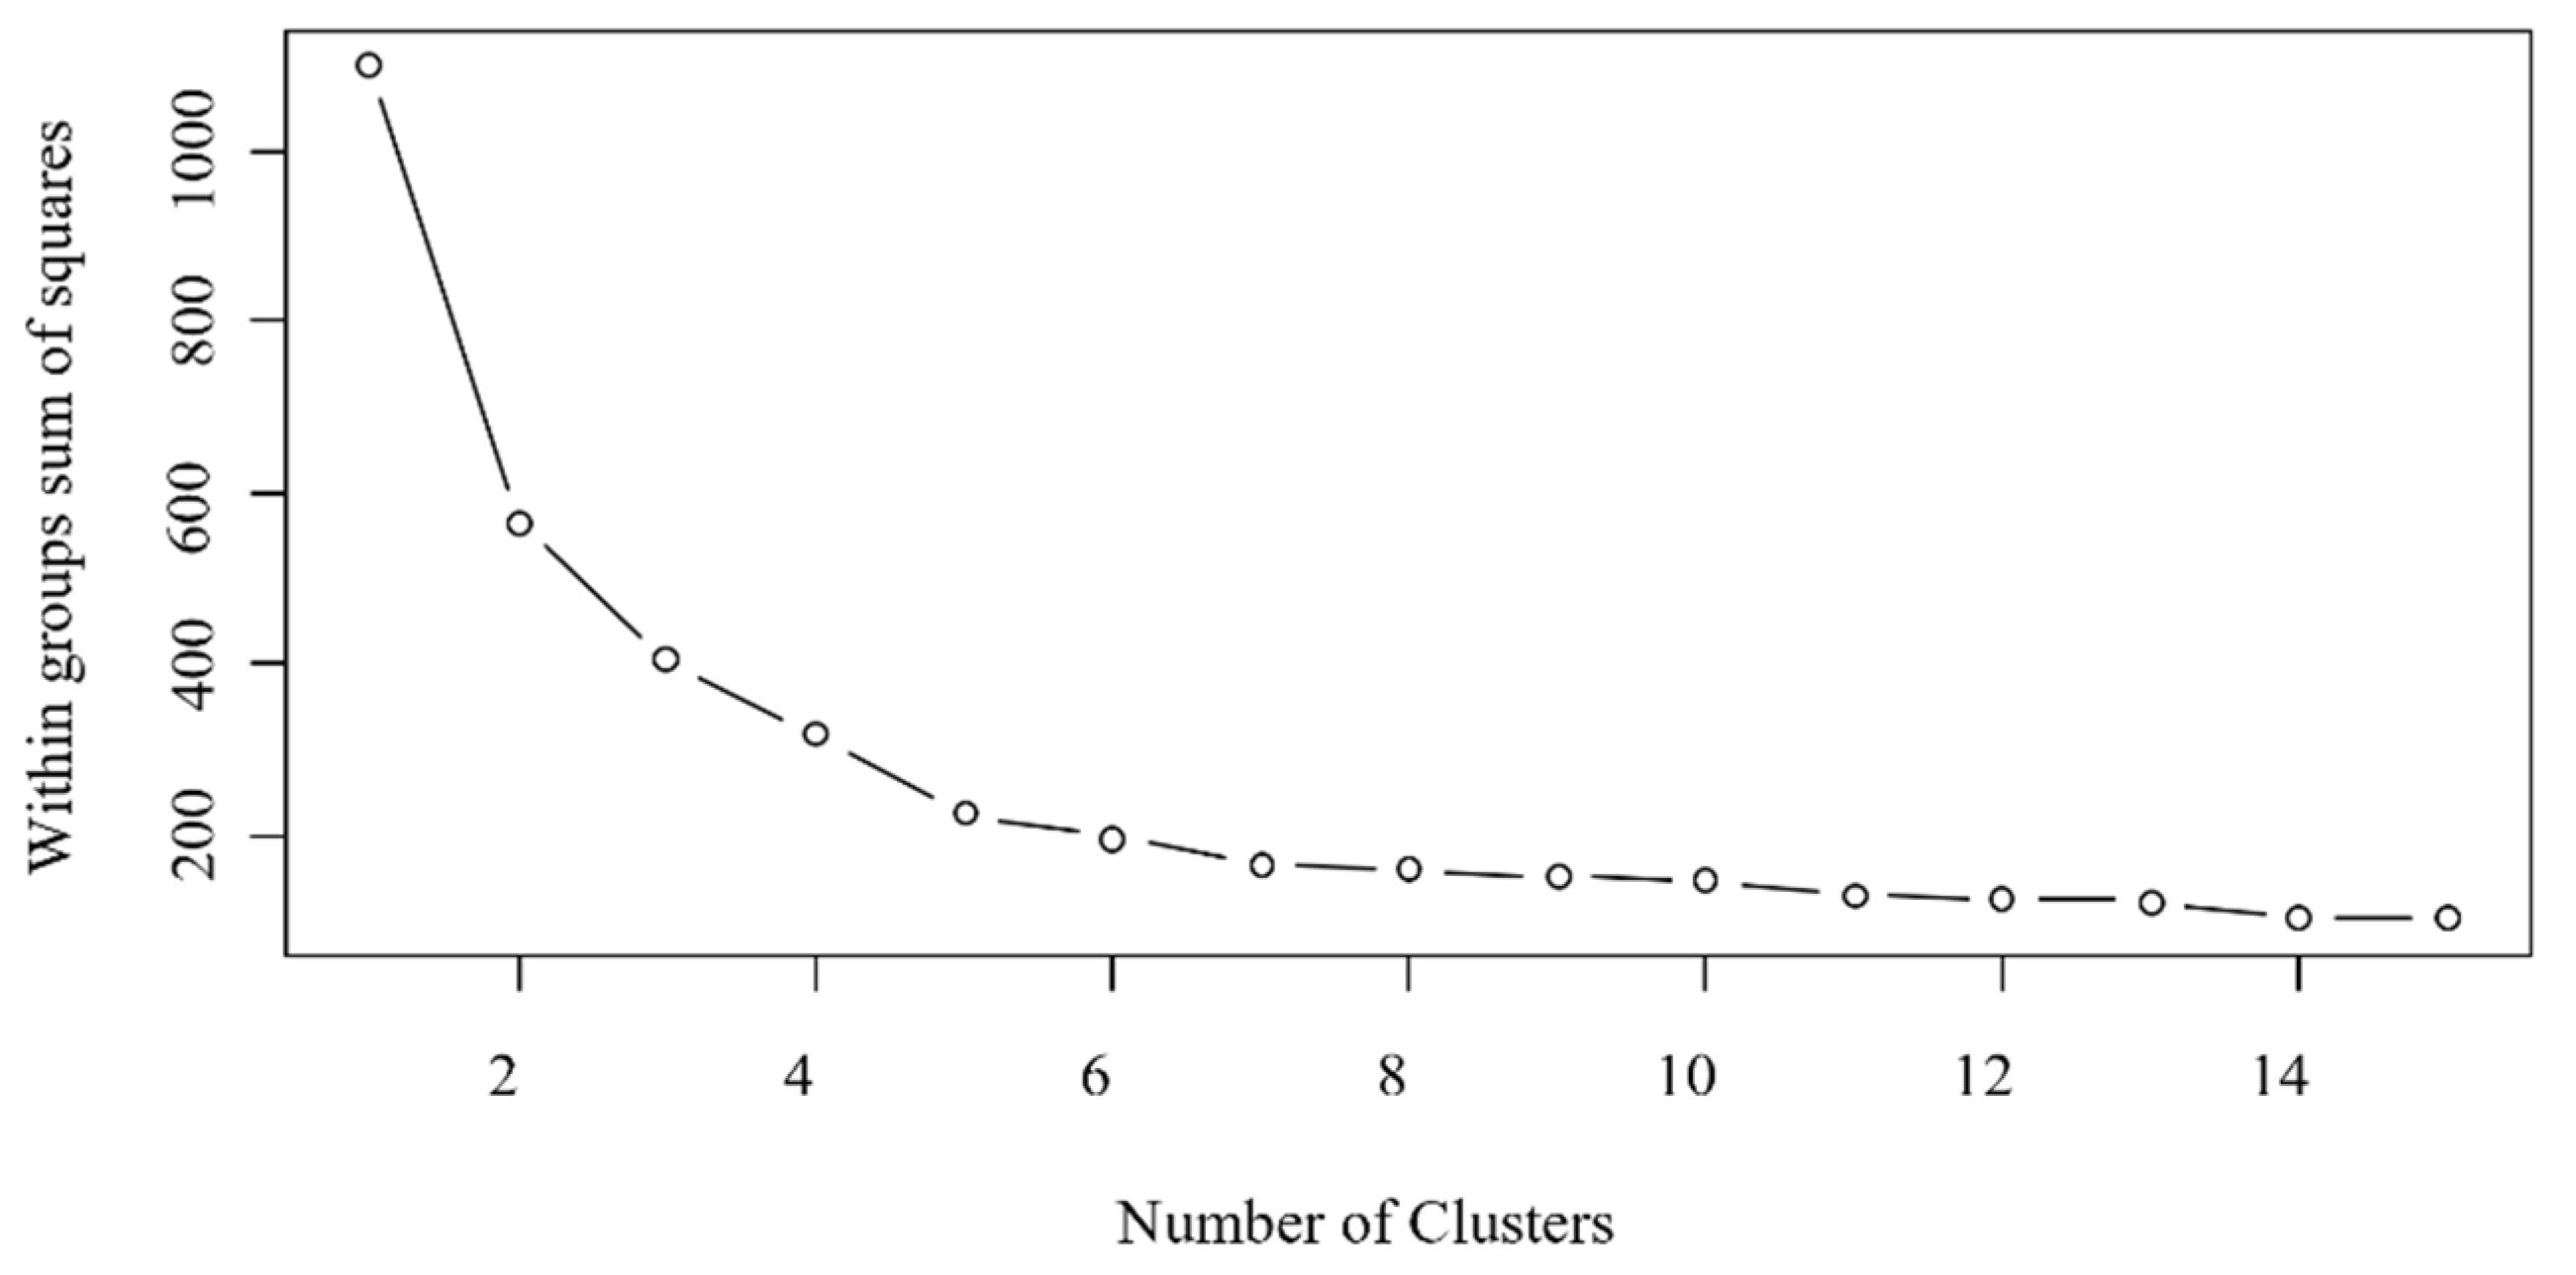
2.3.3. Determination of Ecosystem Service Bundles at Township Level
2.3.4. Identification of Ecosystem Service Hotspots at Village Level
3. Results
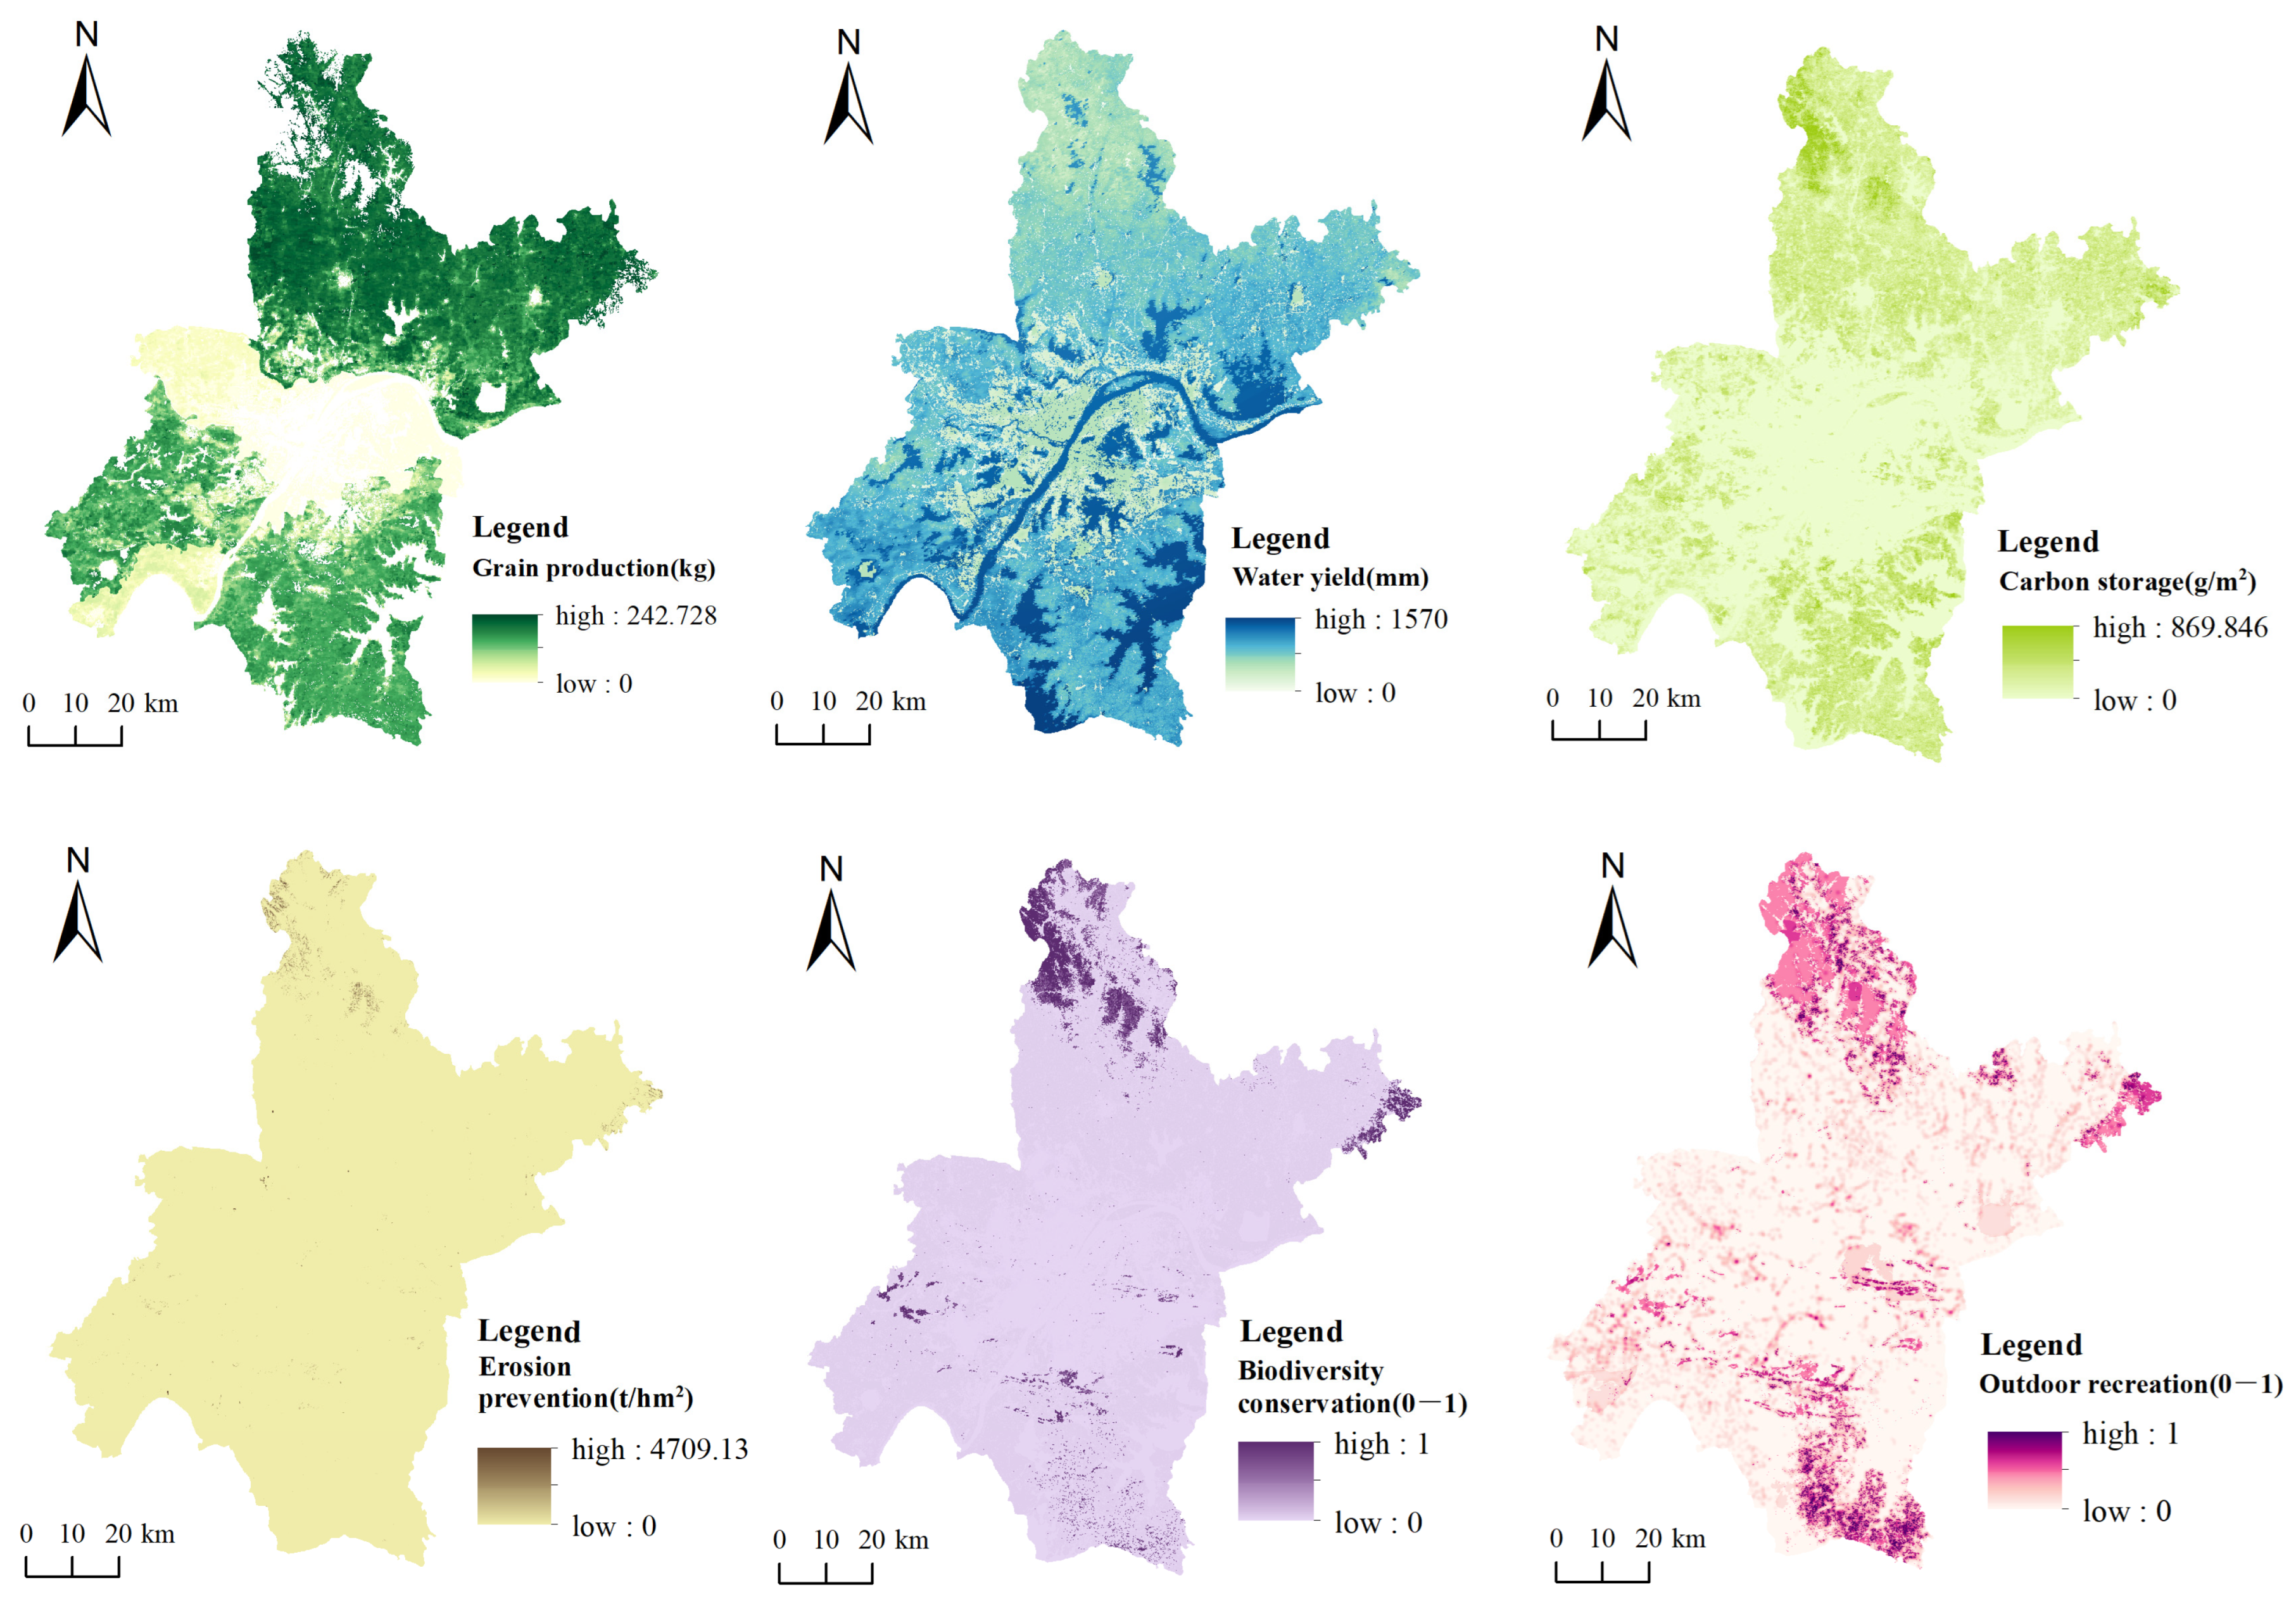
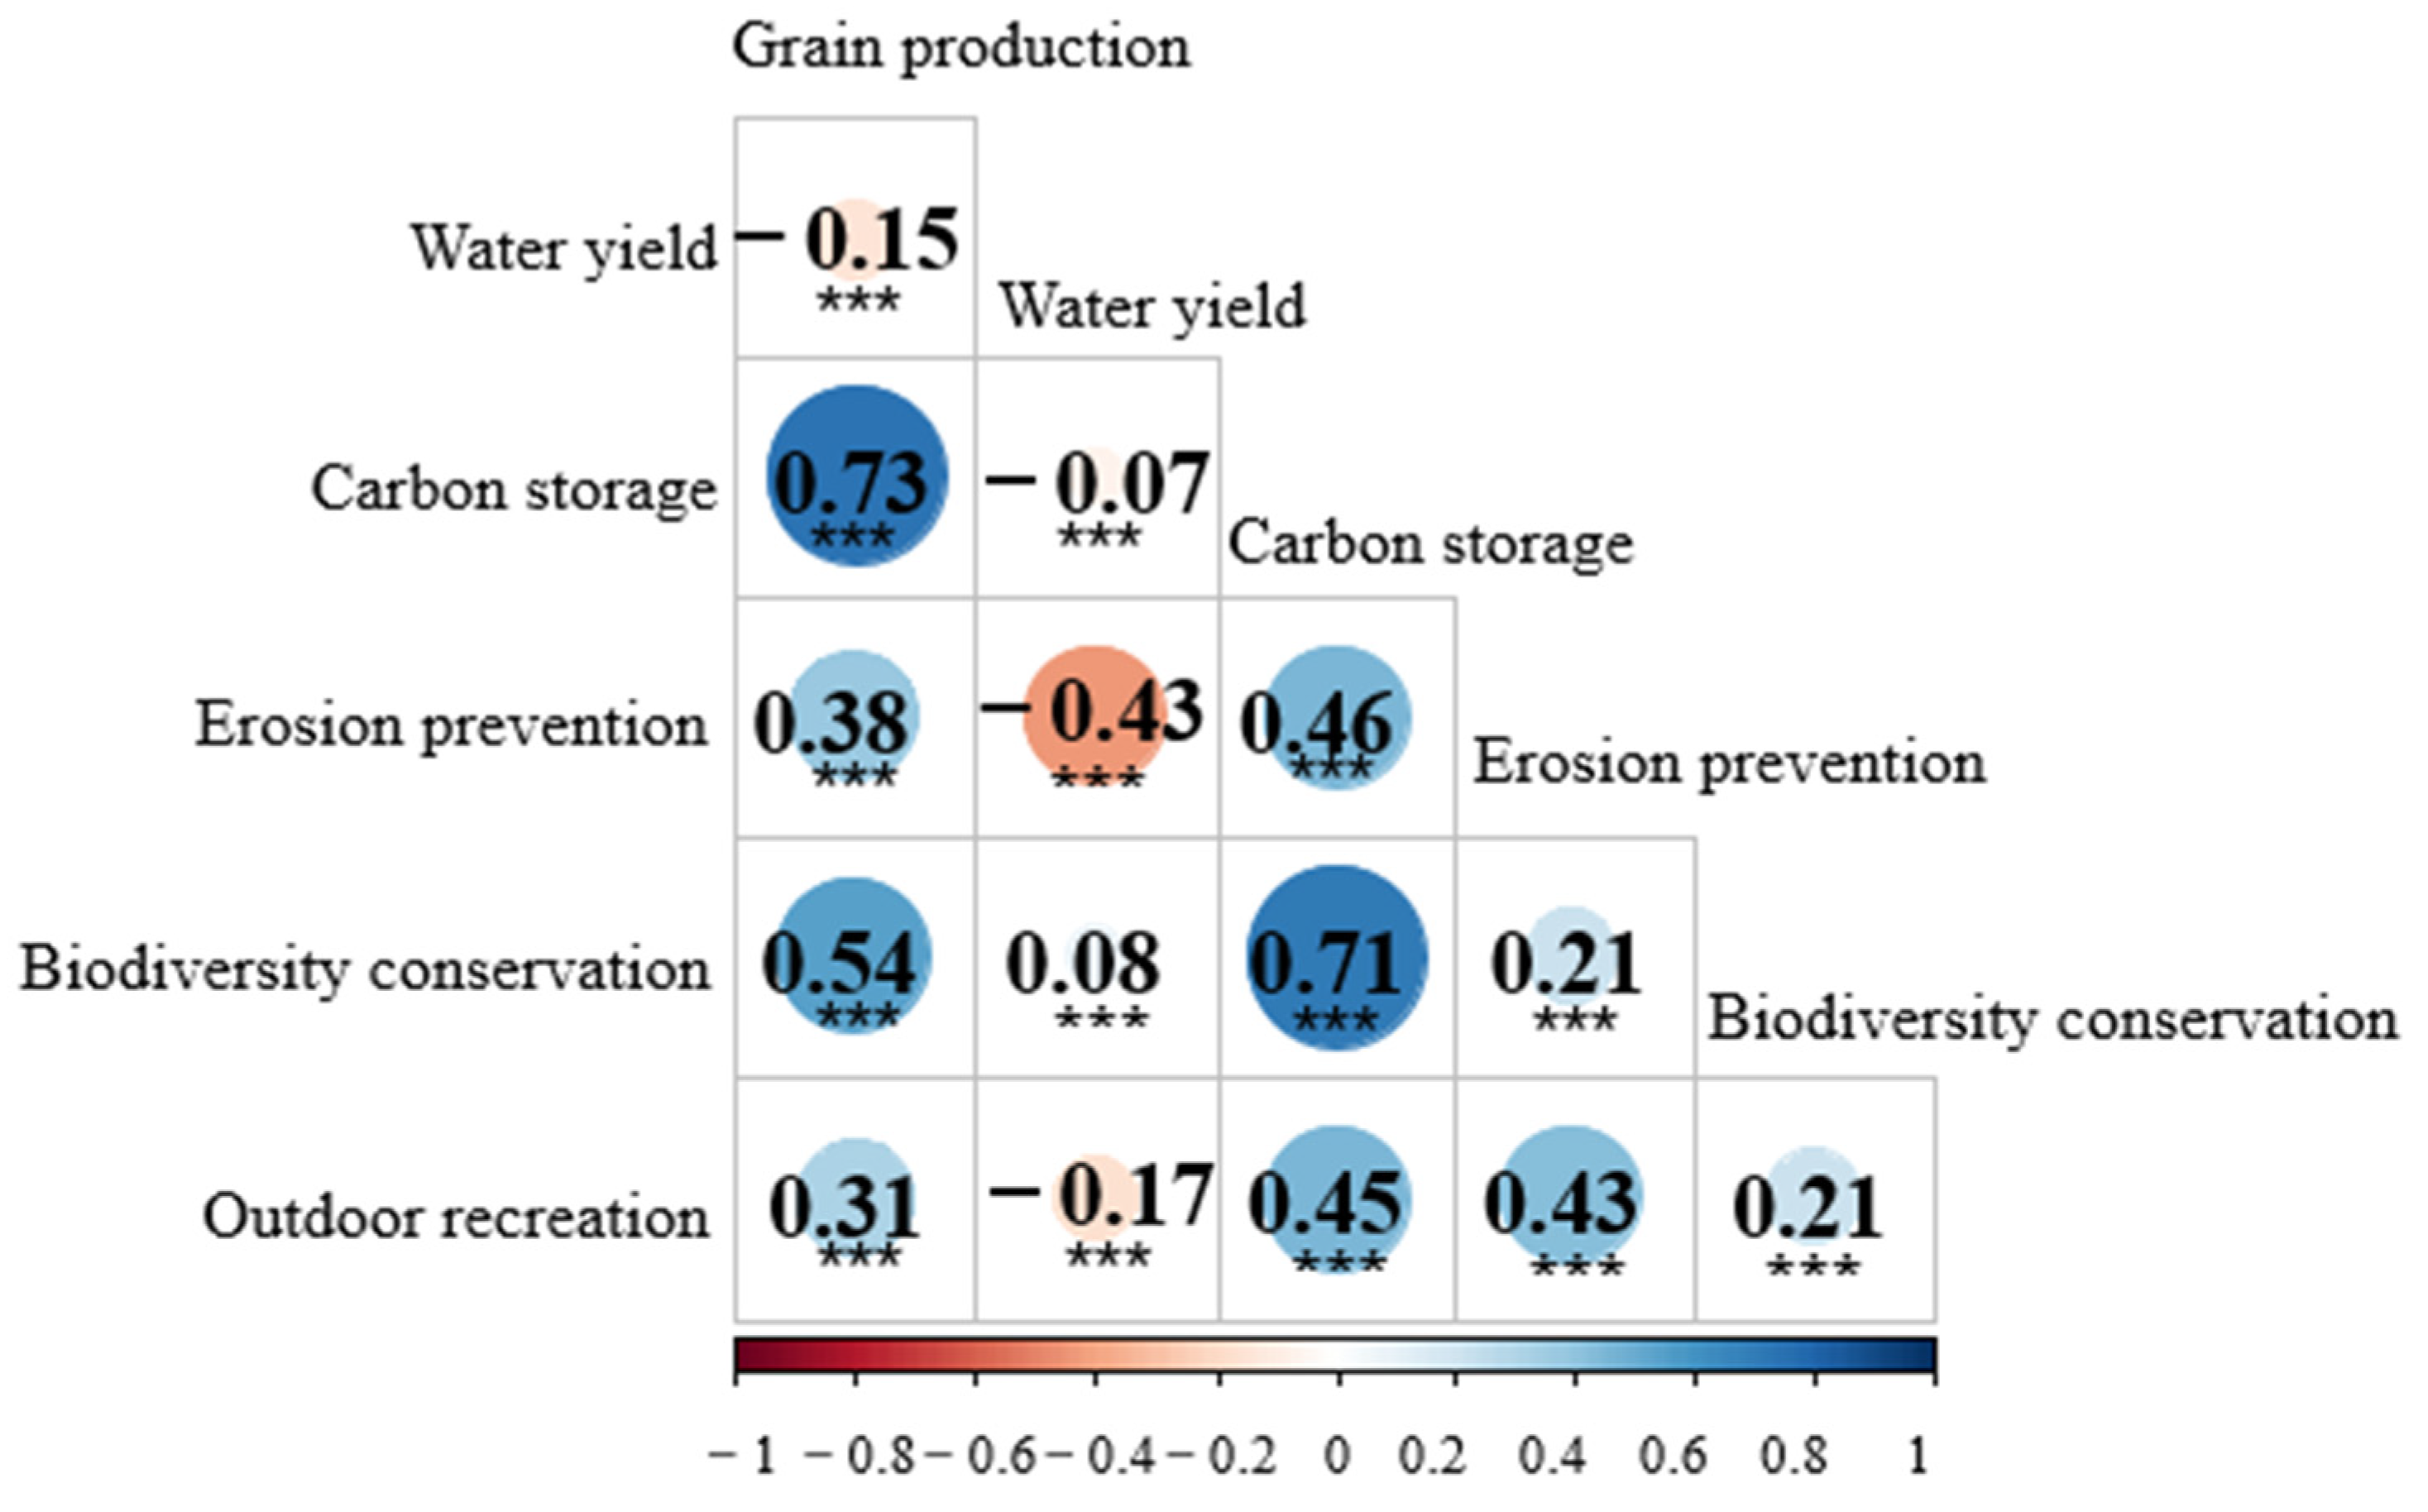
3.1. Spatial Distributions and Correlations of Ecosystem Services
3.2. Ecological Functional Zones at Township Level
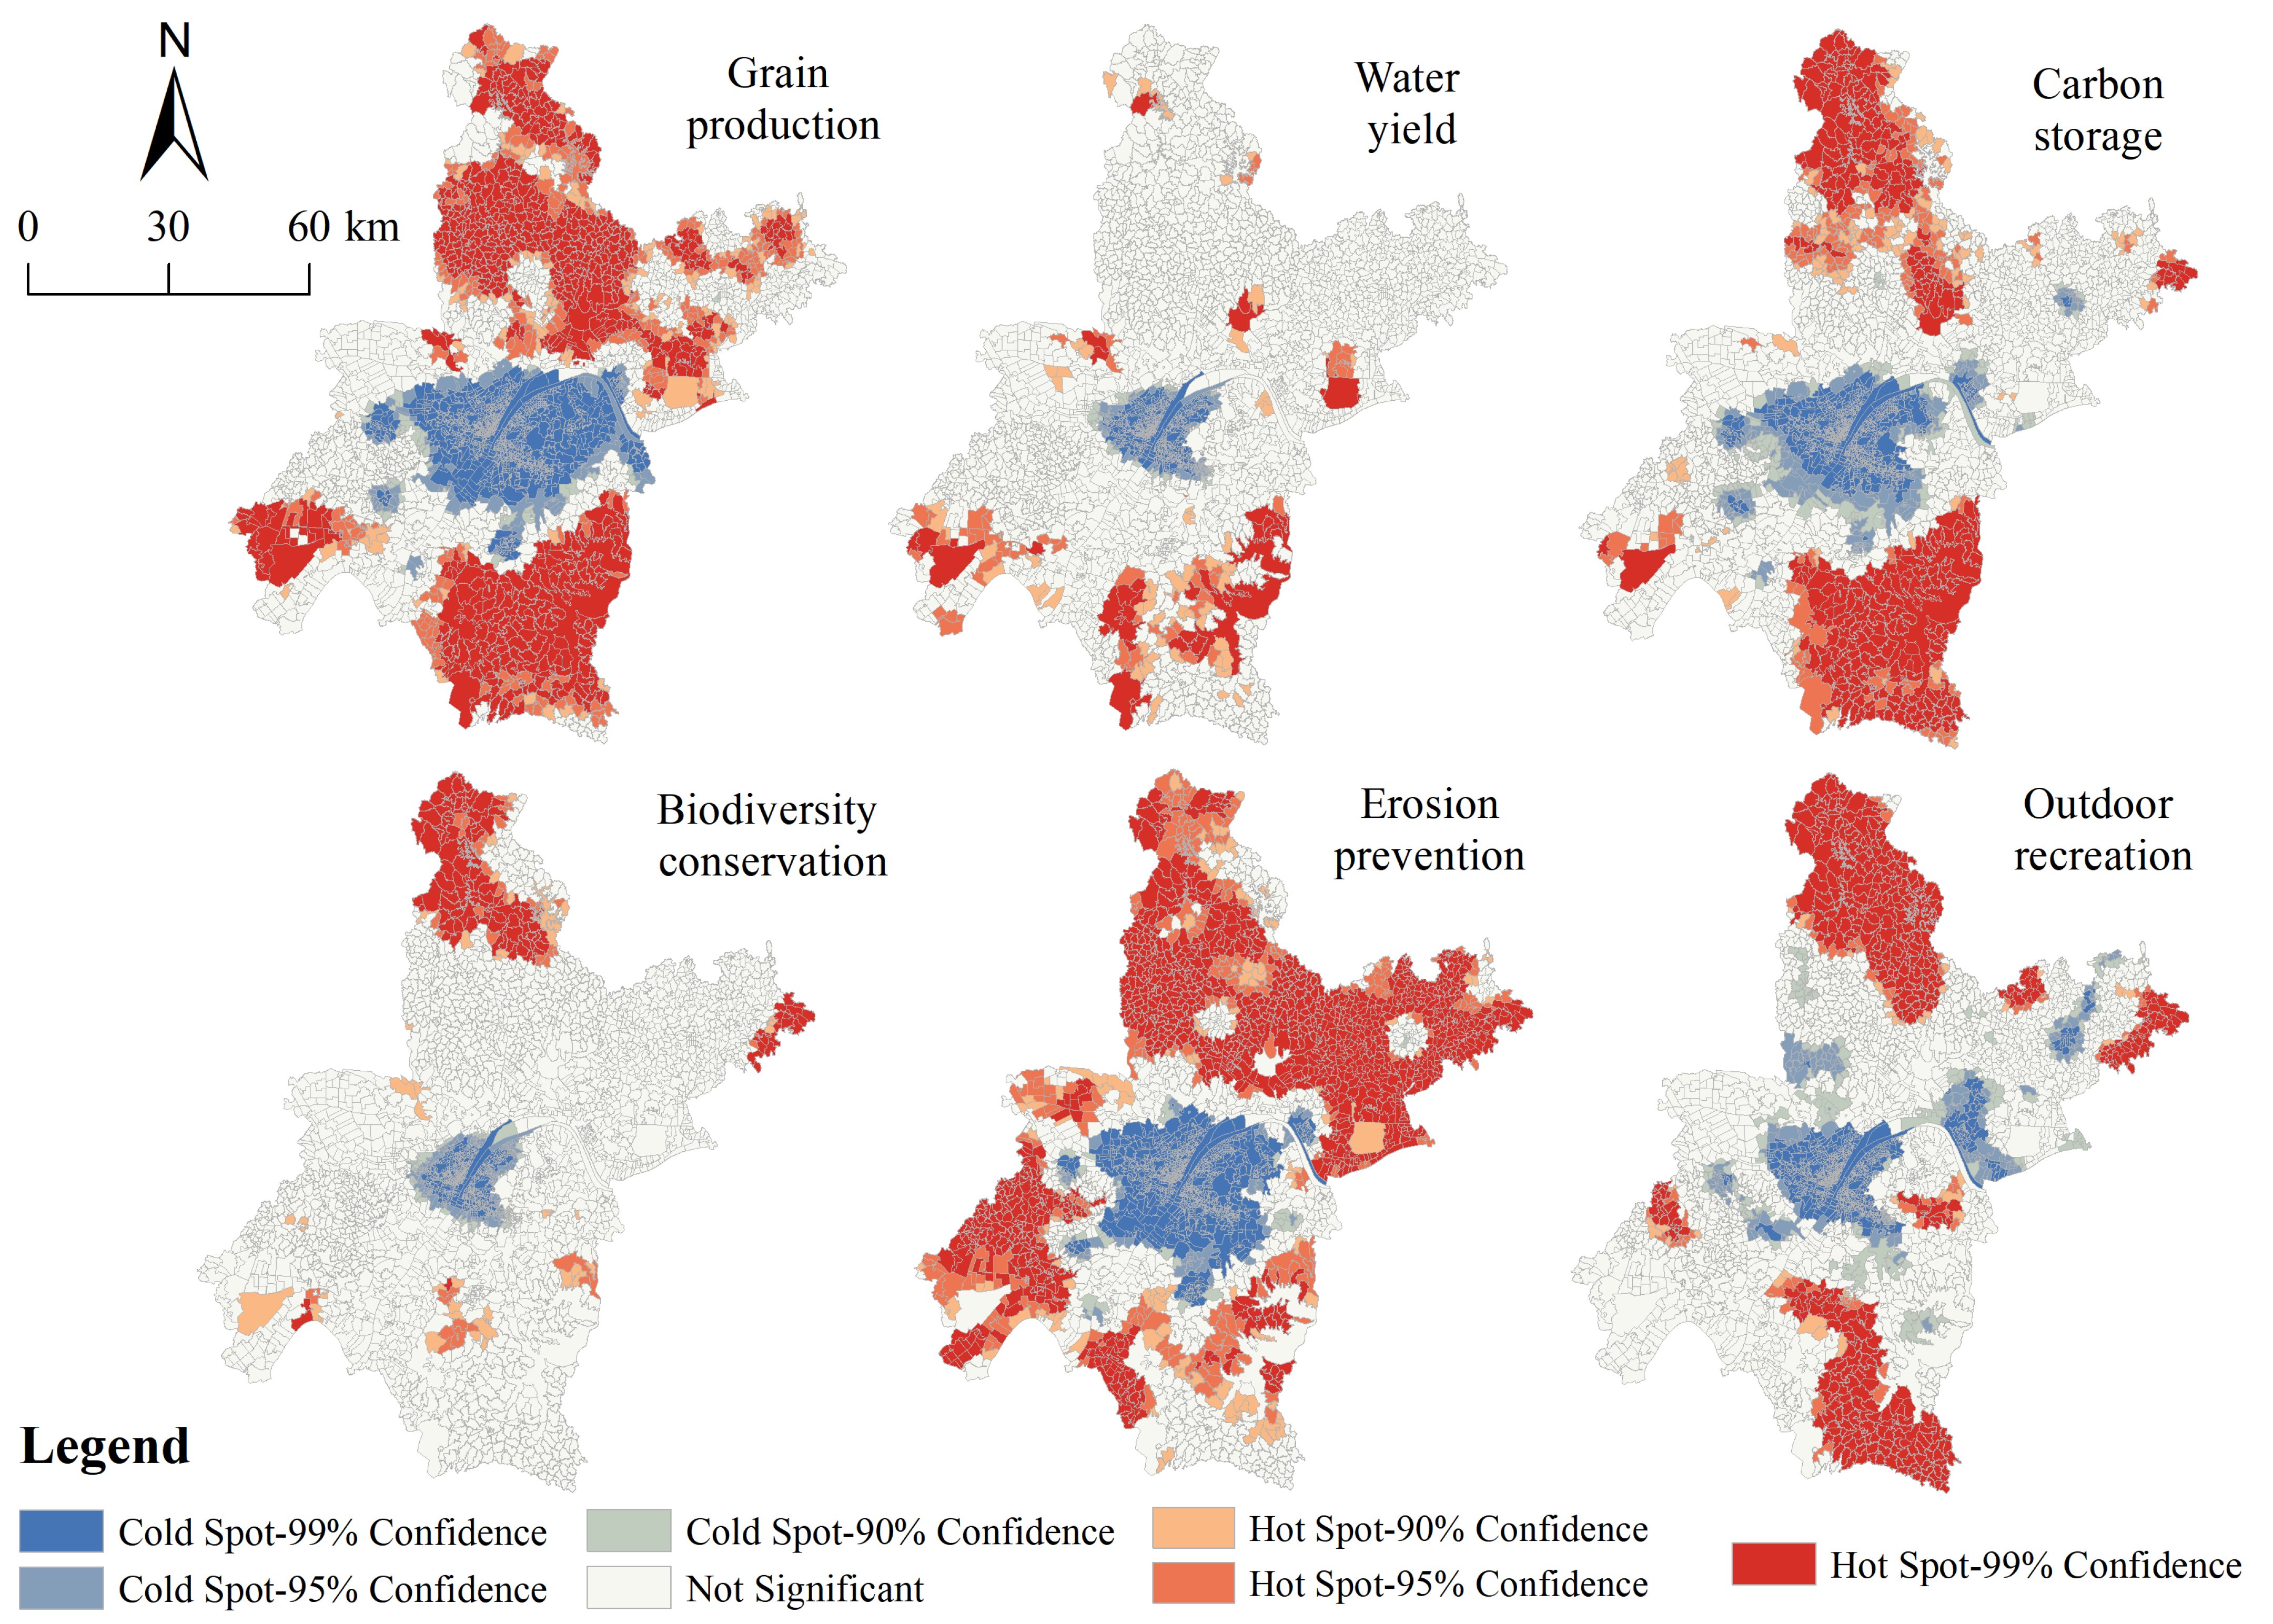
3.3. Ecosystem Service Hotspots at Village Level
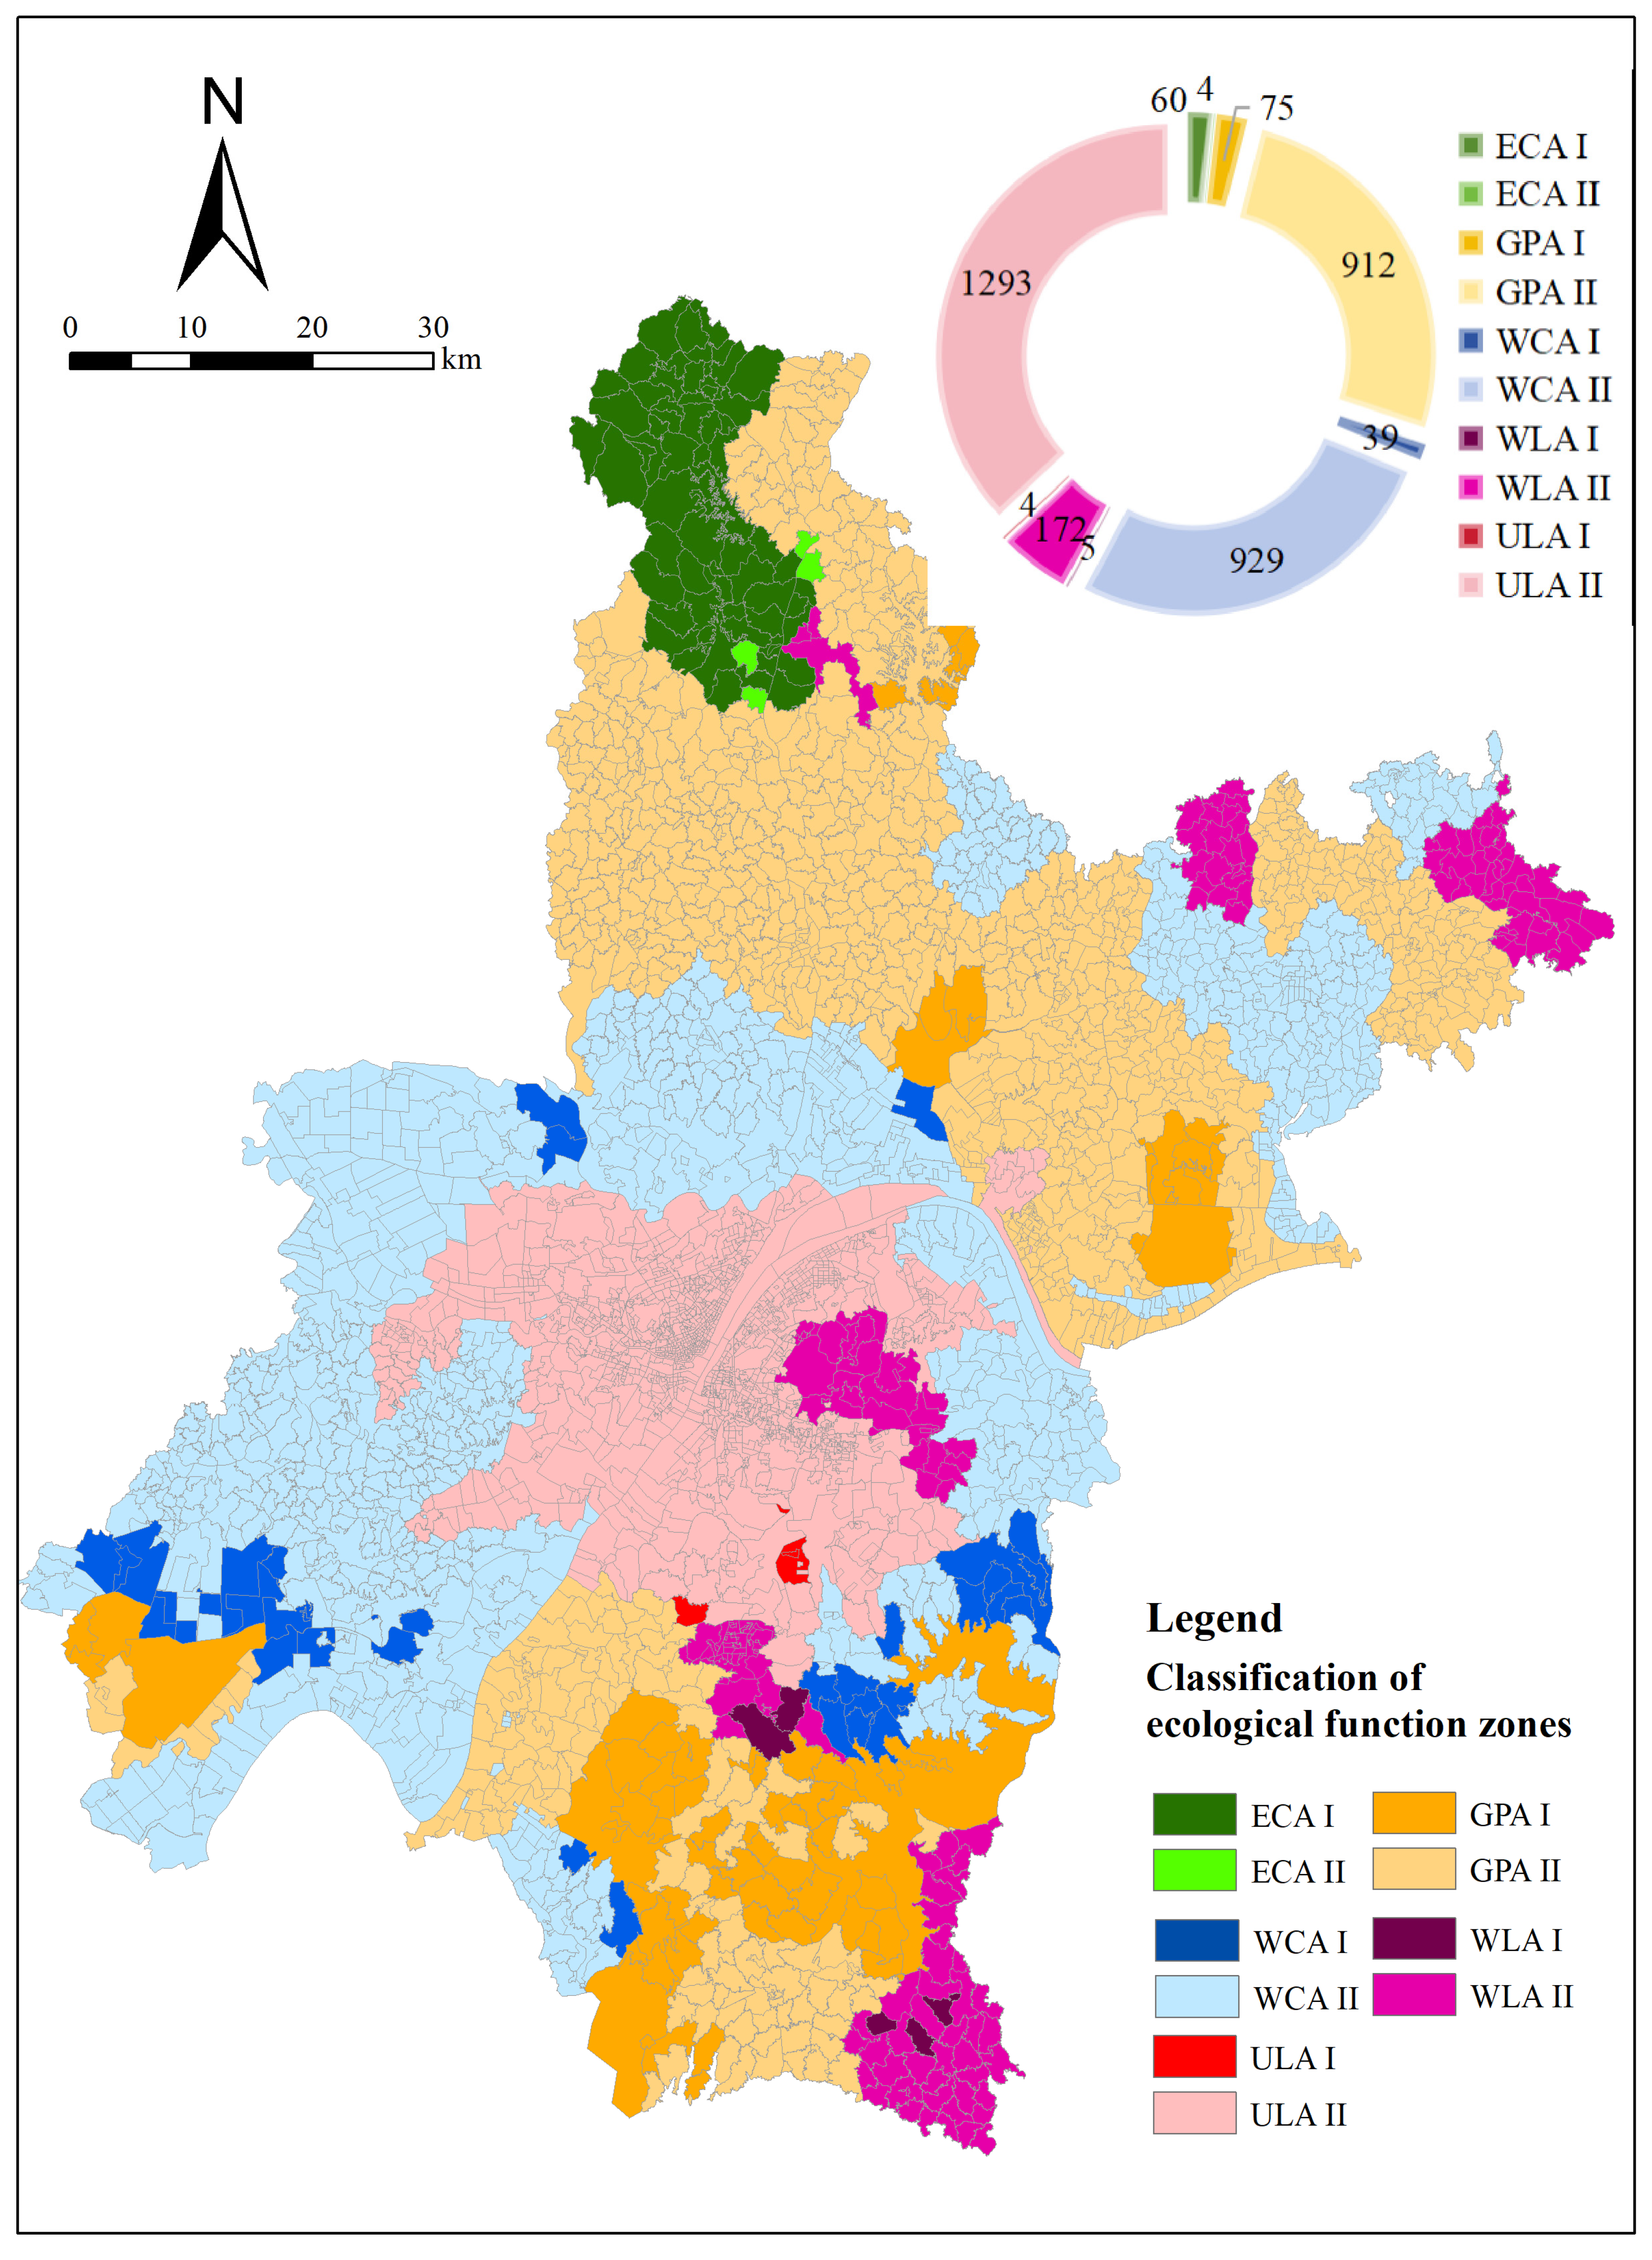
3.4. Ecological Functional Zones and Grades at Two District Levels
4. Discussion
4.1. Understanding the Mechanism of Determining Ecological Functional Zones and Grades Based on Ecosystem Services
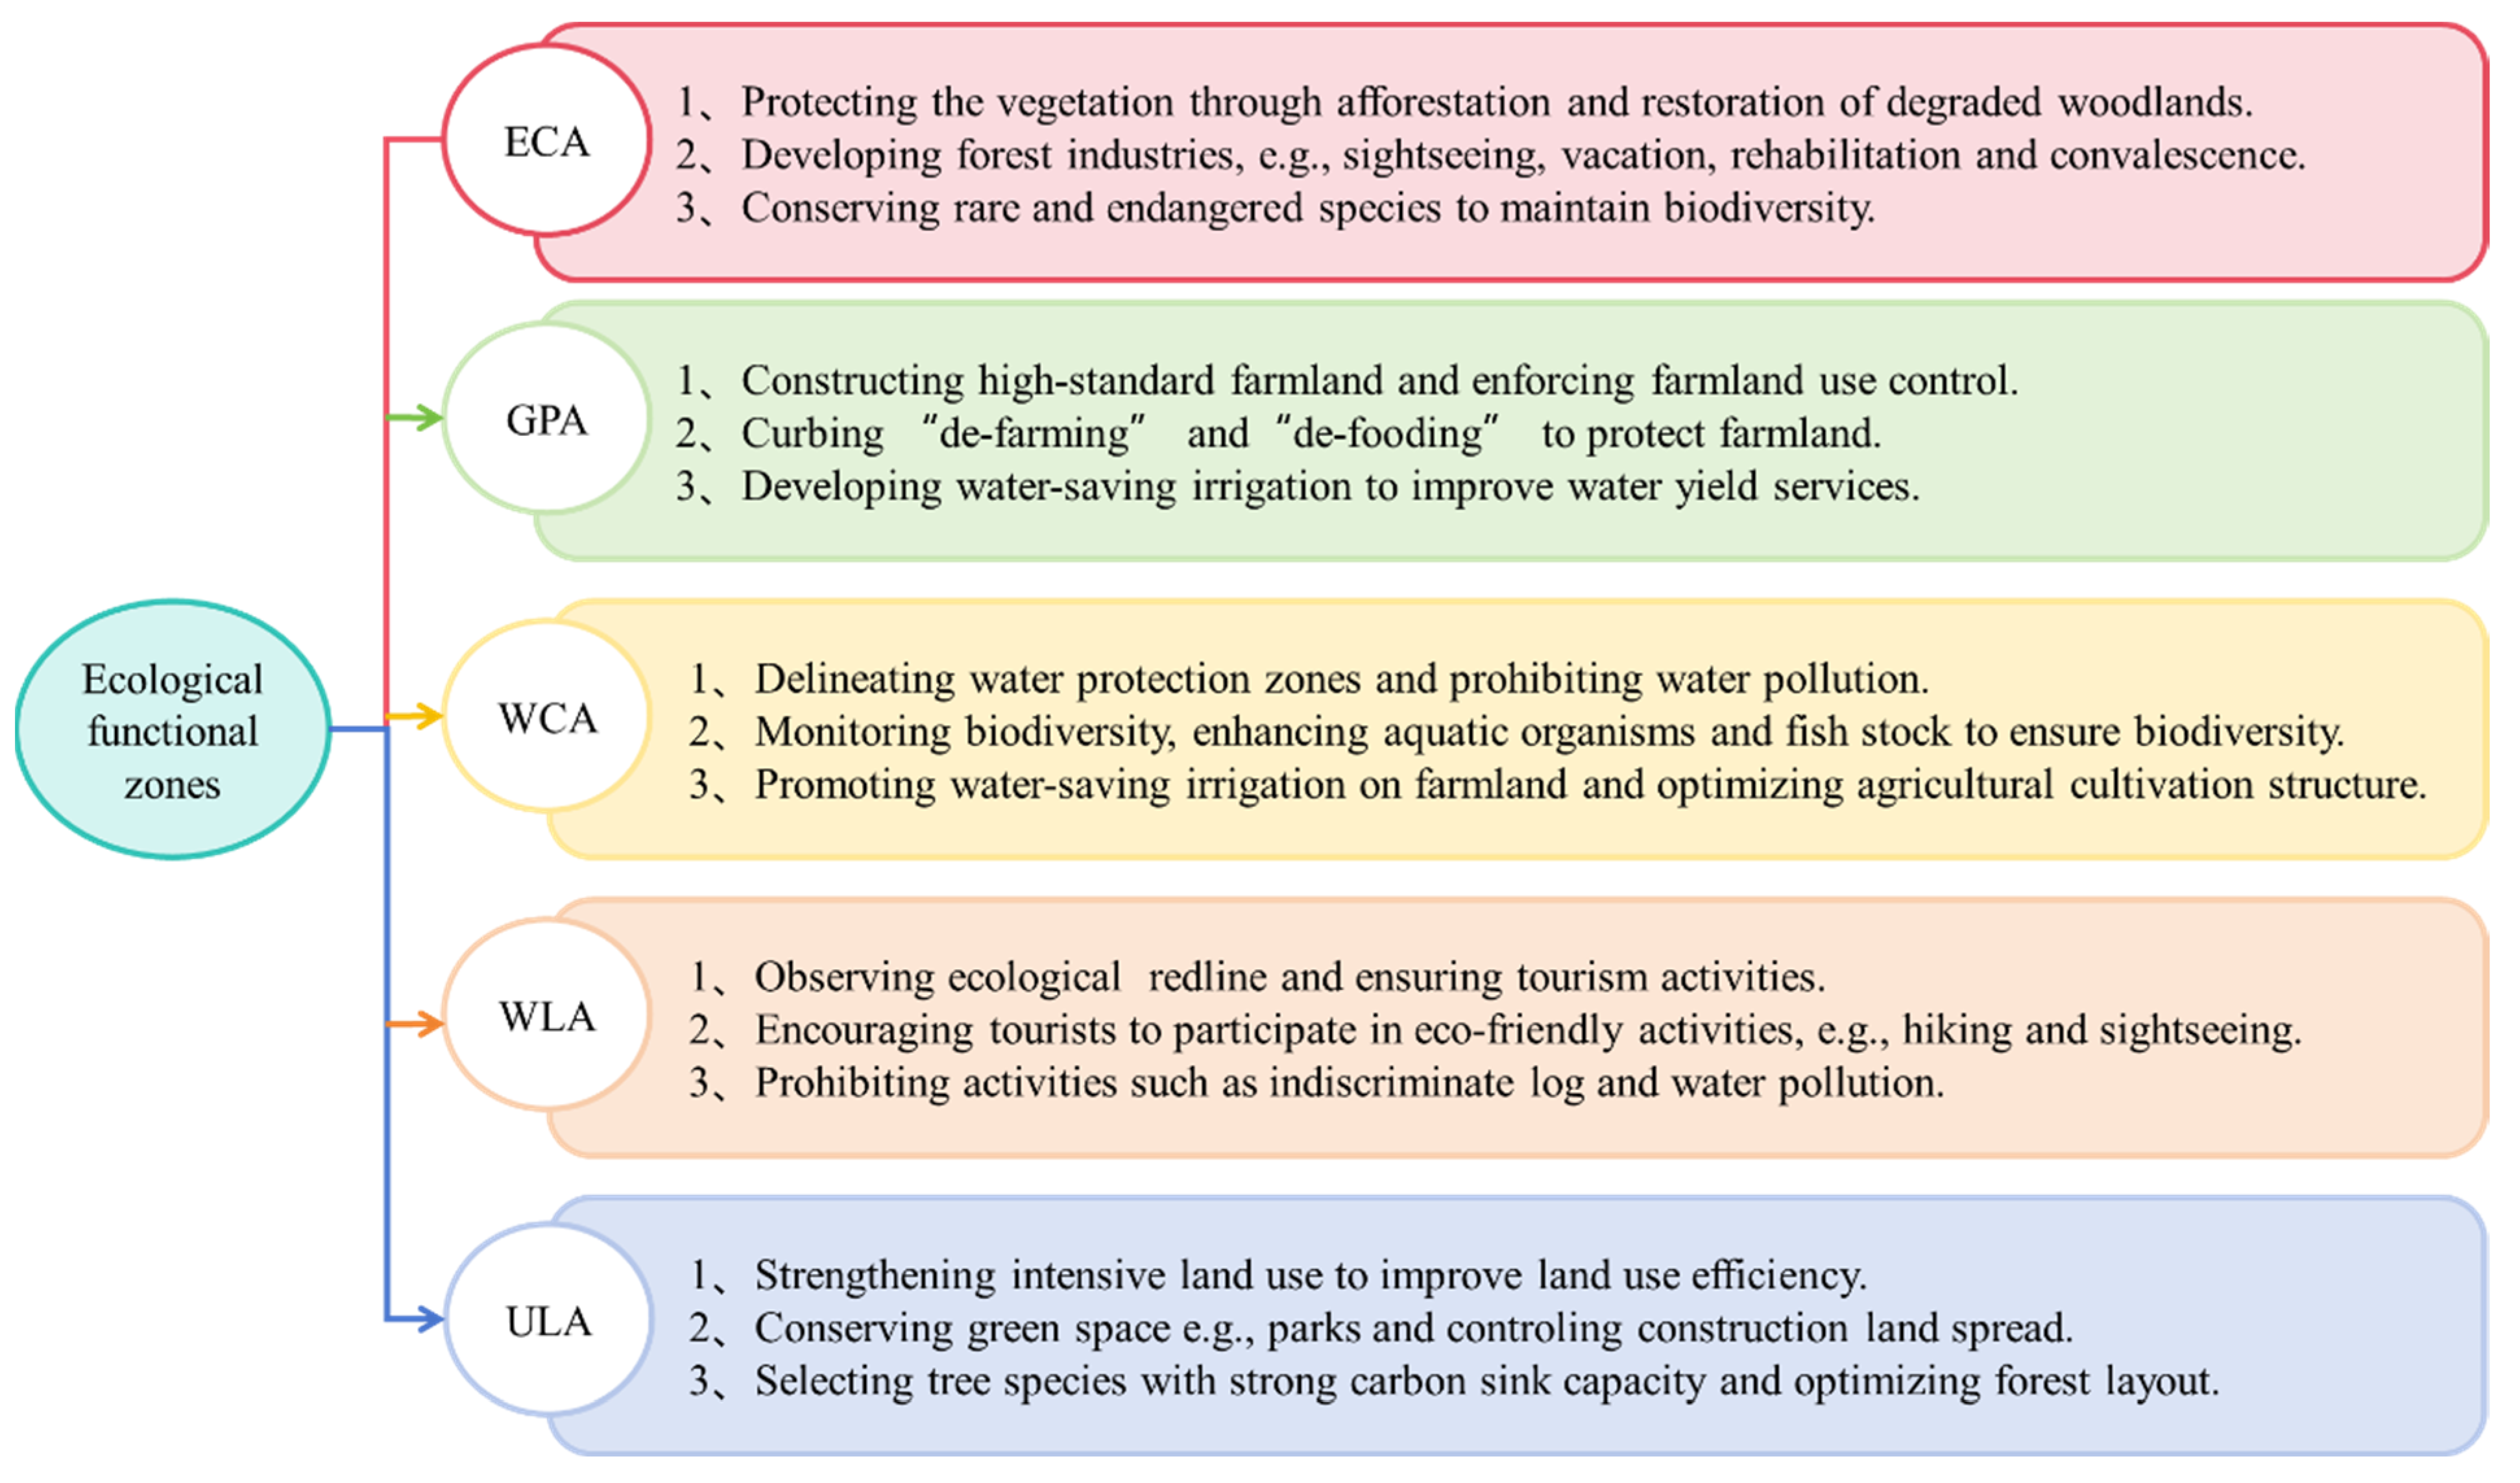
4.2. Implications of Ecological Functional Zones and Grades for Multi-Scale Ecosystem Management
4.3. Advances and Limitations
5. Conclusions
Author Contributions
Funding
Data Availability Statement
Conflicts of Interest
References
- Costanza, R.; d’Arge, R.; de Groot, R.; Farber, S.; Grasso, M.; Hannon, B.; Limburg, K.; Naeem, S.; Oneill, R.V.; Paruelo, J.; et al. The value of the world’s ecosystem services and natural capital. Nature 1997, 387, 253–260. [Google Scholar] [CrossRef]
- Nápoles-Vértiz, S.; Caro-Borrero, A. Conceptual diversity and application of ecosystem services and disservices: A systematic review. Ecosyst. Serv. 2024, 67, 101627. [Google Scholar] [CrossRef]
- Zhai, Y.; Zhai, G.; Yu, Z.; Lu, Z.; Chen, Y.; Liu, J. Coupling coordination between urbanization and ecosystem services value in the Beijing-Tianjin-Hebei urban agglomeration. Sustain. Cities Soc. 2024, 113, 105715. [Google Scholar] [CrossRef]
- Zhang, Y.; Chang, X.; Liu, Y.F.; Lu, Y.C.; Wang, Y.H.; Liu, Y.L. Urban expansion simulation under constraint of multiple ecosystem services (MESs) based on cellular automata (CA)-Markov model: Scenario analysis and policy implications. Land Use Policy 2021, 108, 105667. [Google Scholar] [CrossRef]
- Yuan, Y.J.; Wu, S.H.; Yu, Y.N.; Tong, G.J.; Mo, L.J.; Yan, D.H.; Li, F.F. Spatiotemporal interaction between ecosystem services and urbanization: Case study of Nanjing City, China. Ecol. Indic. 2018, 95, 917–929. [Google Scholar] [CrossRef]
- Sun, Y.; Jiao, L.; Guo, Y.; Xu, Z. Recognizing urban shrinkage and growth patterns from a global perspective. Appl. Geogr. 2024, 166, 103247. [Google Scholar] [CrossRef]
- Halperin, S.; Castro, A.J.; Quintas-Soriano, C.; Brandt, J.S. Assessing high quality agricultural lands through the ecosystem services lens: Insights from a rapidly urbanizing agricultural region in the western United States. Agric. Ecosyst. Environ. 2023, 349, 108435. [Google Scholar] [CrossRef]
- Nyelele, C.; Keske, C.; Chung, M.G.; Guo, H.; Egoh, B.N. Using social media data and machine learning to map recreational ecosystem services. Ecol. Indic. 2023, 154, 110606. [Google Scholar] [CrossRef]
- Luis Valença, P.; Miguel, I.; Katažyna, B.; Marius, K.; Eduardo, G.; Paulo, P. Factors affecting cultural ecosystem services use in Vilnius (Lithuania): A participatory mapping survey approach. Heliyon 2023, 9, e15384. [Google Scholar] [CrossRef]
- Frizzle, C.; Fournier, R.A.; Trudel, M.; Luther, J.E. Towards sustainable forestry: Using a spatial Bayesian belief network to quantify trade-offs among forest-related ecosystem services. J. Environ. Manag. 2022, 301, 113817. [Google Scholar] [CrossRef]
- Molla Sitotaw, T.; Willemen, L.; Tsegaye Meshesha, D.; Nelson, A. Empirical assessments of small-scale ecosystem service flows in rural mosaic landscapes in the Ethiopian highlands. Ecosyst. Serv. 2024, 67, 101622. [Google Scholar] [CrossRef]
- Kim, J.; Song, Y. Integrating ecosystem services and ecological connectivity to prioritize spatial conservation on Jeju Island, South Korea. Landsc. Urban Plan 2023, 239, 104865. [Google Scholar] [CrossRef]
- Zhang, Y.; Liu, Y.F.; Wang, Y.H.; Liu, D.F.; Xia, C.; Wang, Z.Y.; Wang, H.F.; Liu, Y.L. Urban expansion simulation towards low-carbon development: A case study of Wuhan, China. Sustain. Cities Soc. 2020, 63, 102455. [Google Scholar] [CrossRef]
- Cole, S.; Moksnes, P.-O.; Söderqvist, T.; Wikström, S.A.; Sundblad, G.; Hasselström, L.; Bergström, U.; Kraufvelin, P.; Bergström, L. Environmental compensation for biodiversity and ecosystem services: A flexible framework that addresses human wellbeing. Ecosyst. Serv. 2021, 50, 101319. [Google Scholar] [CrossRef]
- Deng, H.; Zhou, X.; Liao, Z. Ecological redline delineation based on the supply and demand of ecosystem services. Land Use Policy 2024, 140, 107109. [Google Scholar] [CrossRef]
- Yu, P.; Wei, Y.; Ma, L.; Wang, B.; Yung, E.H.K.; Chen, Y. Urbanization and the urban critical zone. Earth Crit. Zone 2024, 1, 100011. [Google Scholar] [CrossRef]
- Zhao, H.; He, J.; Liu, D.; Han, Y.; Zhou, Z.; Niu, J. Incorporating ecological connectivity into ecological functional zoning: A case study in the middle reaches of Yangtze River urban agglomeration. Ecol. Inform. 2023, 75, 102098. [Google Scholar] [CrossRef]
- Schneider, A.; Friedl, M.A.; Potere, D. Mapping global urban areas using MODIS 500-m data: New methods and datasets based on ‘urban ecoregions’. Remote Sens. Environ. 2010, 114, 1733–1746. [Google Scholar] [CrossRef]
- Chen, W.; Gu, T.; Xiang, J.; Luo, T.; Zeng, J.; Yuan, Y. Ecological restoration zoning of territorial space in China: An ecosystem health perspective. J. Environ. Manag. 2024, 364, 121371. [Google Scholar] [CrossRef]
- Du, W.; Yan, H.; Feng, Z.; Liu, G.; Li, K.; Peng, L.; Xiang, X.; Yang, Y. Zoning for the sustainable development mode of global social-ecological systems: From the supply-production-demand perspective. Resour. Conserv. Recycl. 2024, 203, 107447. [Google Scholar] [CrossRef]
- Liao, Q.; Li, T.; Wang, Q.; Liu, D. Exploring the ecosystem services bundles and influencing drivers at different scales in southern Jiangxi, China. Ecol. Indic. 2023, 148, 110089. [Google Scholar] [CrossRef]
- Shen, J.; Li, S.; Liu, L.; Liang, Z.; Wang, Y.; Wang, H.; Wu, S. Uncovering the relationships between ecosystem services and social-ecological drivers at different spatial scales in the Beijing-Tianjin-Hebei region. J. Clean. Prod. 2021, 290, 125193. [Google Scholar] [CrossRef]
- He, L.; Xie, Z.; Wu, H.; Liu, Z.; Zheng, B.; Wan, W. Exploring the interrelations and driving factors among typical ecosystem services in the Yangtze river economic Belt, China. J. Environ. Manag. 2024, 351, 119794. [Google Scholar] [CrossRef]
- Sadeghi, S.H.; Chamani, R.; Silabi, M.Z.; Tavosi, M.; Katebikord, A.; Darvishan, A.K.; Moosavi, V.; Sadeghi, P.S.; Vafakhah, M.; Rekabdarkolaei, H.M. Watershed health and ecological security zoning throughout Iran. Sci. Total Environ. 2023, 905, 167123. [Google Scholar] [CrossRef]
- Zhao, X.; Huang, G. Urban watershed ecosystem health assessment and ecological management zoning based on landscape pattern and SWMM simulation: A case study of Yangmei River Basin. Environ. Impact Assess. Rev. 2022, 95, 106794. [Google Scholar] [CrossRef]
- Zeng, J.; Cui, X.; Chen, W.; Yao, X. Ecological management zoning based on the supply-demand relationship of ecosystem services in China. Appl. Geogr. 2023, 155, 102959. [Google Scholar] [CrossRef]
- Sun, X.; Yang, P.; Tao, Y.; Bian, H. Improving ecosystem services supply provides insights for sustainable landscape planning: A case study in Beijing, China. Sci. Total Environ. 2022, 802, 149849. [Google Scholar] [CrossRef]
- Zhang, L.; Shi, L.; Yang, F. Assessing ecosystem service dynamics in China’s coastal shelterbelt: Implications for ecosystem restoration. Environ. Impact Assess. Rev. 2024, 106, 107515. [Google Scholar] [CrossRef]
- Chunye, W.; Delu, P. Zoning of Hangzhou Bay ecological red line using GIS-based multi-criteria decision analysis. Ocean Coast. Manag. 2017, 139, 42–50. [Google Scholar] [CrossRef]
- Bailey, R.G. Delineation of ecosystem regions. Environ. Manag. 1983, 7, 365–373. [Google Scholar] [CrossRef]
- Mamat, K.; Du, P.; Ding, J. Ecological function regionalization of cultural heritage sites in Turpan, China, based on GIS. Arab. J. Geosci. 2017, 10, 1–12. [Google Scholar] [CrossRef]
- Cao, Y.; Li, G.; Tian, Y.; Fang, X.; Li, Y.; Tan, Y. Linking ecosystem services trade-offs, bundles and hotspot identification with cropland management in the coastal Hangzhou Bay area of China. Land Use Policy 2020, 97, 104689. [Google Scholar] [CrossRef]
- Fei, D.Q.; Cheng, Q.; Mao, X.; Liu, F.; Zhou, Q. Land use zoning using a coupled gridding-self-organizing feature maps method: A case study in China. J. Clean. Prod. 2017, 161, 1162–1170. [Google Scholar] [CrossRef]
- Zhu, J.; Ke, X.; Zhou, T.; He, L. Evaluation of ecological security of natural resources in Wuhan based on “contribution-vitality-organization-strength-resilience”. Bull. Soil Water Conserv. 2023, 43, 248–255+306. [Google Scholar]
- Millennium Ecosystem Assessment. Ecosystems and Human Well-Being: General Synthesis; Island Press: Washington, DC, USA, 2005; pp. 77–101. [Google Scholar]
- Zhang, Y.; Liu, Y.F.; Zhang, Y.; Liu, Y.; Zhang, G.X.; Chen, Y.Y. On the spatial relationship between ecosystem services and urbanization: A case study in Wuhan, China. Sci. Total Environ. 2018, 637, 780–790. [Google Scholar] [CrossRef]
- Li, S.; Zhao, Y.; Xiao, W.; Yellishetty, M.; Yang, D. Identifying ecosystem service bundles and the spatiotemporal characteristics of trade-offs and synergies in coal mining areas with a high groundwater table. Sci. Total Environ. 2022, 807, 151036. [Google Scholar] [CrossRef] [PubMed]
- Xu, G.; Xiong, K.; Shu, T.; Shi, Y.; Chen, L.; Zheng, L.; Fan, H.; Zhao, Z.; Yang, Z. Bundling evaluating changes in ecosystem service under karst rocky desertification restoration: Projects a case study of Huajiang-Guanling, Guizhou province, Southwest China. Environ. Earth Sci. 2022, 81, 302. [Google Scholar] [CrossRef]
- Bivand, R.S.; Wong, D.W. Comparing implementations of global and local indicators of spatial association. Test 2018, 27, 716–748. [Google Scholar] [CrossRef]
- Getis, A.; Ord, J.K. The analysis of spatial association by use of distance statistics. Geogr. Anal. 1992, 24, 189–206. [Google Scholar] [CrossRef]
- Roces-Diaz, J.V.; Vayreda, J.; Banque-Casanovas, M.; Diaz-Varela, E.; Bonet, J.A.; Brotons, L.; de-Miguel, S.; Herrando, S.; Martinez-Vilalta, J. The spatial level of analysis affects the patterns of forest ecosystem services supply and their relationships. Sci. Total Environ. 2018, 626, 1270–1283. [Google Scholar] [CrossRef]
- Gong, J.; Jin, T.; Liu, D.; Zhu, Y.; Yan, L. Are ecosystem service bundles useful for mountainous landscape function zoning and management? A case study of Bailongjiang watershed in western China. Ecol. Indic. 2022, 134, 108495. [Google Scholar] [CrossRef]
- Li, J.; Hu, D.; Wang, Y.; Chu, J.; Yin, H.; Ma, M. Study of identification and simulation of ecological zoning through integration of landscape ecological risk and ecosystem service value. Sustain. Cities Soc. 2024, 107, 105442. [Google Scholar] [CrossRef]
- Peng, J.; Wang, A.; Luo, L.; Liu, Y.; Li, H.; Hu, Y.n.; Meersmans, J.; Wu, J. Spatial identification of conservation priority areas for urban ecological land: An approach based on water ecosystem services. Land Degrad. Dev. 2019, 30, 683–694. [Google Scholar] [CrossRef]
- Li, Z.G.; Yang, F.; Zhong, J.L.; Zhao, J.J. Self-Organizing Feature Zoning and Multiple Hotspots Identification of Ecosystem Services: How to Promote Ecological Refined Management of Chengdu-Chongqing Urban Agglomeration. J. Urban Plan. Dev. 2023, 149, 04022049. [Google Scholar] [CrossRef]
- Liu, Y.X.; Li, T.; Zhao, W.W.; Wang, S.; Fu, B.J. Landscape functional zoning at a county level based on ecosystem services bundle: Methods comparison and management indication. J. Environ. Manag. 2019, 249, 109315. [Google Scholar] [CrossRef]
- Zhang, Y.; Yu, P.H.; Tian, Y.S.; Chen, H.T.; Chen, Y.Y. Exploring the impact of integrated spatial function zones on land use dynamics and ecosystem services tradeoffs based on a future land use simulation (FLUS) model. Ecol. Indic. 2023, 150, 110246. [Google Scholar] [CrossRef]
- Turkelboom, F.; Leone, M.; Jacobs, S.; Kelemen, E.; García-Llorente, M.; Baró, F.; Termansen, M.; Barton, D.N.; Berry, P.; Stange, E.; et al. When we cannot have it all: Ecosystem services trade-offs in the context of spatial planning. Ecosyst. Serv. 2018, 29, 566–578. [Google Scholar] [CrossRef]
- Zoderer, B.M.; Tasser, E.; Carver, S.; Tappeiner, U. Stakeholder perspectives on ecosystem service supply and ecosystem service demand bundles. Ecosyst. Serv. 2019, 37, 100938. [Google Scholar] [CrossRef]
- Dittrich, A.; Seppelt, R.; Václavík, T.; Cord, A.F. Integrating ecosystem service bundles and socio-environmental conditions—A national scale analysis from Germany. Ecosyst. Serv. 2017, 28, 273–282. [Google Scholar] [CrossRef]
- Huang, F.X.; Zuo, L.Y.; Gao, J.B.; Jiang, Y.; Du, F.J.; Zhang, Y.B. Exploring the driving factors of trade-offs and synergies among ecological functional zones based on ecosystem service bundles. Ecol. Indic. 2023, 146, 109827. [Google Scholar] [CrossRef]
- Chen, D.D.; Jin, G.; Zhang, Q.; Arowolo, A.O.; Li, Y.F. Water ecological function zoning in Heihe River Basin, Northwest China. Phys. Chem. Earth 2016, 96, 74–83. [Google Scholar] [CrossRef]
- Mo, W.B.; Zhao, Y.L.; Yang, N.; Xu, Z.G. Ecological function zoning based on ecosystem service bundles and trade-offs: A study of Dongjiang Lake Basin, China. Environ. Sci. Pollut. Res. 2023, 30, 40388–40404. [Google Scholar] [CrossRef]
- De Vreesea, R.; Leys, M.; Fontaine, C.M.; Dendoncker, N. Social mapping of perceived ecosystem services supply—The role of social landscape metrics and social hotspots for integrated ecosystem services assessment, landscape planning and management. Ecol. Indic. 2016, 66, 517–533. [Google Scholar] [CrossRef]
- Li, Y.; Zhang, L.; Yan, J.; Wang, P.; Hu, N.; Cheng, W.; Fu, B. Mapping the hotspots and coldspots of ecosystem services in conservation priority setting. J. Geogr. Sci. 2017, 27, 681–696. [Google Scholar] [CrossRef]
- Moilanen, A.; Meller, L.; Leppänen, J.; Montesino Pouzols, F.; Arponen, A.; Kujala, H. Zonation Spatial Conservation Planning Framework and Software V. 3.1: User Manual; Helsingin Yliopisto: Helsinki, Finland, 2012. [Google Scholar]
- Bennett, E.M.; Peterson, G.D.; Gordon, L.J. Understanding relationships among multiple ecosystem services. Ecol. Lett. 2009, 12, 1394–1404. [Google Scholar] [CrossRef]
- Berry, Z.C.; Jones, K.W.; Aguilar, L.R.G.; Congalton, R.G.; Holwerda, F.; Kolka, R.; Looker, N.; Ramirez, S.M.L.; Manson, R.; Mayer, A.; et al. Evaluating ecosystem service trade-offs along a land-use intensification gradient in central Veracruz, Mexico. Ecosyst. Serv. 2020, 45, 101181. [Google Scholar] [CrossRef]
- Feng, Q.; Zhao, W.W.; Hu, X.P.; Liu, Y.; Daryanto, S.; Cherubini, F. Trading-off ecosystem services for better ecological restoration: A case study in the Loess Plateau of China. J. Clean. Prod. 2020, 257, 120469. [Google Scholar] [CrossRef]
- Temirbayeva, R.K.; Akiyanova, F.Z.; Orazbekova, K.S.; Veysov, S.K. Socio-economic aspects of nature management in the kazakhstan’s caspian sea region based on functional zoning of the territory. Ser. Geol. Tech. Sci. 2020, 1, 131–137. [Google Scholar] [CrossRef]


Disclaimer/Publisher’s Note: The statements, opinions and data contained in all publications are solely those of the individual author(s) and contributor(s) and not of MDPI and/or the editor(s). MDPI and/or the editor(s) disclaim responsibility for any injury to people or property resulting from any ideas, methods, instructions or products referred to in the content. |
© 2024 by the authors. Licensee MDPI, Basel, Switzerland. This article is an open access article distributed under the terms and conditions of the Creative Commons Attribution (CC BY) license (https://creativecommons.org/licenses/by/4.0/).
Share and Cite
Zhang, Y.; Liu, S.; Yu, P.; Lu, Y.; Zhang, Y.; Zhang, J.; Chen, Y. Delineating Ecological Functional Zones and Grades for Multi-Scale Ecosystem Management. Land 2024, 13, 1624. https://doi.org/10.3390/land13101624
Zhang Y, Liu S, Yu P, Lu Y, Zhang Y, Zhang J, Chen Y. Delineating Ecological Functional Zones and Grades for Multi-Scale Ecosystem Management. Land. 2024; 13(10):1624. https://doi.org/10.3390/land13101624
Chicago/Turabian StyleZhang, Yan, Shuhan Liu, Peiheng Yu, Yanchi Lu, Yang Zhang, Jinting Zhang, and Yiyun Chen. 2024. "Delineating Ecological Functional Zones and Grades for Multi-Scale Ecosystem Management" Land 13, no. 10: 1624. https://doi.org/10.3390/land13101624
APA StyleZhang, Y., Liu, S., Yu, P., Lu, Y., Zhang, Y., Zhang, J., & Chen, Y. (2024). Delineating Ecological Functional Zones and Grades for Multi-Scale Ecosystem Management. Land, 13(10), 1624. https://doi.org/10.3390/land13101624