Article

Spatial Optimization and Temporal Changes in the Ecological Network: A Case Study of Wanning City, China

1
Department of Land Resource Management, School of Public Administration, China University of Geosciences, Wuhan 430074, China
2
Introduction for School of Physical Education, China University of Geosciences, Wuhan 430074, China
*
Author to whom correspondence should be addressed.
Land 2024, 13(1), 122; https://doi.org/10.3390/land13010122
Submission received: 13 November 2023 / Revised: 10 January 2024 / Accepted: 19 January 2024 / Published: 22 January 2024

Abstract

:
Ecological networks serve as vital tools for safeguarding biodiversity and ensuring regional ecological stability. This study, conducted in Wanning City, employs minimum-area threshold analysis to pinpoint crucial ecological sources while extracting potential ecological corridors using the minimum cumulative resistance model. Our investigation delves into the ecological network’s elements and structural transformations within Wanning City, spanning the period from 2000 to 2020, and assesses the priorities for ecological network preservation. The findings of our research reveal noteworthy spatial disparities in the distribution of ecological sources across Wanning City. Furthermore, the ecological corridors display sparse patterns in the north and denser patterns in the south. Over the two decades from 2000 to 2020, Wanning’s ecological resources exhibited a discernible trend of contraction and fragmentation, accompanied by an uneven spatial distribution. The average path length of the ecological corridors has increased, indicative of reduced biological flow efficiency. Correspondingly, the structural accessibility of the ecological network has decreased, signifying a decline in landscape connectivity. Based on our analysis, we propose an ecological protection and restoration framework denoted as “One Belt, Four Sources, Eight districts, multiple corridors, and multiple points”. Therefore, with the Shangxi–Jianling, Liulianling, Nanlin, and Jiexin nature reserves as the core area, and Houan Town, Damao Town, Changfeng Town, and Liji Town as the key restoration areas, we have proposed an ecological protection and restoration pattern.

1. Introduction

Urbanization and industrialization constitute primary drivers of land use and land cover changes, particularly as rural-to-urban migration escalates. The global urbanization rate has risen from 46.69% to 56.2%, while China’s urbanization rate has surged from 36.22% to 63.89% between 2000 and 2020. Projections indicate that China’s urbanization rate may reach 75% by 2050 [1]. This rapid urbanization has spurred unprecedented expansion of cities, accompanied by intensified human activities that exert substantial pressure on natural ecosystems. Consequently, global landscape patterns have undergone substantial alterations, leading to a surge in ecological and environmental issues, such as the urban heat island effect, environmental pollution, habitat loss, diminished biodiversity, and declining ecological functionality [2,3,4]. As a result, mitigating the adverse impact of urbanization on the environment and ecology, while also addressing the requirements of urban development, enhancing the quality of human habitats, and promoting sustainable development of regional ecological environments, has gained widespread attention [5,6,7].
As a pivotal national strategy, the exploration of ecological security patterns plays a critical role in resolving conflicts between land development and ecological conservation [8]. Ecological networks present a natural approach to address the challenges of habitat loss and declining biodiversity by offering a spatial framework for the conservation and sustainable management of natural ecosystems. They are emerging as a vital means to quantify regional ecological security [9,10]. These networks represent integral regional habitats where landscape units are organically linked to create a comprehensive network comprising regional environmental and landscape elements. An ecological network serves as the fundamental spatial framework required for sustaining ecosystem functions and essential ecological components, effectively coupling landscape structure, ecological processes, and functions [11,12,13].
The use of landscape ecology and graph theory in studying ecological networks has gained popularity. Leveraging landscape ecology, this research approach allows for the spatial measurement of landscapes based on existing data, such as land use changes, thereby overcoming limitations arising from incomplete information on aspects like predation, reproduction, and species migration. Currently, there is growing interest in the application of landscape ecology and graph theory to investigate ecological networks. The research approach, which integrates landscape ecology and ecological network analysis, enables the spatial assessment of landscapes using available data, such as land use change data. This method addresses challenges associated with the limited availability of information on species predation, reproduction, and migration and facilitates the long-term monitoring of habitat changes in terms of both quantity and quality. This technique enables the multi-temporal observation of habitat quantities and qualities [14,15,16,17]. Graph theory simplifies complex landscape systems into network diagrams, with ecological sources as nodes and ecological corridors as edges. This method directly reflects the structural topology and complexity of the ecological network. Most previous ecological network studies have primarily concentrated on constructing and optimizing regional ecological networks, evaluating ecological network structures, and assessing landscape connectivity based on ecological networks [15,18,19,20]. Nevertheless, certain aspects, such as identifying ecological sources and evaluating ecological network structures, have room for improvement. For the identification of ecological source areas, most methods either directly select nature reserves or ecological protection areas as ecological sources or base their choices on morphological spatial pattern analysis, leading to no scientific threshold for selecting ecological sources. As for ecological network structure evaluation, researchers often use landscape pattern indicators to assess the spatial distribution of ecological patches and corridors or to optimize ecological network structures and robustness. However, comprehensive analyses of the overall structure and characteristics remain limited [2]. Existing evaluations of ecological network structure predominantly focus on the current state of ecological networks, with relatively few studies considering structural changes over extended timeframes.
Regarding the evaluation of ecological network structure, researchers often use landscape pattern indicators to evaluate the spatial allocation of ecological patches and corridors or evaluate the robustness and optimize the structure of ecological networks. However, detailed analyses of the overall structure and characteristics remain scarce [2]. Currently, the evaluation of the ecological network structure usually focuses on the current ecological network structure, and, to date, relatively few studies have considered the structural succession of a series of ecological networks over longer timescales. Hence, it is imperative to conduct a thorough examination of the holistic framework and attributes of the ecological network at the municipal and county levels.
Located in the southeast of Hainan Island, Wanning City plays a pivotal role in the “Dongyi Group”, with “Qionghai–Wanning” forming the core of Hainan Province’s territorial spatial planning. It represents a critical nexus for Hainan Province’s future urban development. In recent years, the city’s land use and landscape patterns have undergone significant transformations due to development, construction, and human activities, impacting regional ecosystem functions and stability [21]. In light of future regional coordinated and integrated development, numerous policies and plans are poised to have a profound influence on Wanning City’s land use layout. This study aims to (1) analyze the spatiotemporal evolution of landscape patterns and assess changes in the ecological network structure in Wanning City and (2) present recommendations, thereby providing a scientific foundation for ecological preservation and restoration in the territorial spatial planning of Wanning City.

2. Materials and Methods

2.1. Study Area

Wanning City is situated in the southeastern part of Hainan Island, bordering the South China Sea to the east, Qiongzhong Li and Miao Autonomous County to the west, Lingshui Li Autonomous County to the south, and Qionghai City to the north (18°35′–19°06′ N, 110°00′–110°37′ E). The terrain varies from high in the west to low in the east. Wanning City enjoys a tropical oceanic monsoon climate with ample rainfall, mild temperatures, and minimal temperature fluctuations. Covering a total land area of 1904.17 km2, the city comprises 12 townships, including Wancheng, Changfeng, Houan, Damao, and one Xinglong overseas Chinese farm [21]. As of 2020, the city’s population was approximately 632,700. Blessed with favorable natural geographic conditions, Wanning City boasts rich natural resources and remarkable ecological advantages. It hosts eight nature reserves, a national forest park, and a natural green oxygen zone, which feature numerous mountainous areas, including Dongshanling, Liulianling, and Jianling. However, in recent years, the combined impact of development, construction, and human activities has resulted in significant changes to cultivated, constructed, and forested lands. The landscape has exhibited a fragmentation trend, leading to issues such as habitat degradation and habitat reduction.

2.2. Data

The ecological resistance surface model of Wanning City was developed by utilizing four types of spatial data: land use/land cover (LULC), road network, elevation (DEM), and habitat suitability assessment. Additionally, a regional ecological network was created. (1) LULC data from 2000 and 2020 were sourced from the GlobeLand30 dataset (http://www.globallandcover.com, accessed on 11 November 2023). This dataset, available free of charge, provides data at a 30 m resolution, encompassing ten land types, including cultivated land, forests, grasslands, and artificial surfaces. (2) Route network data were acquired from Beijing University’s 2000 geographic data platform (https://geodata.pku.edu.cn, accessed on 11 November 2023) and the 2020 road network data from OpenStreetMap (https://www.openstreetmap.org, accessed on 11 November 2023). Road networks were categorized into railways and national roads based on traffic conditions. (3) DEM data were derived from the geospatial data cloud (http://www.giscloud.cn, accessed on 11 November 2023). The elevation data were utilized to calculate the slope, and, in combination with the slope, the elevation mobile search window was used to calculate the morphology index (TPI). TPI classified the landscape into valley, low slopes, gentle slopes, steep slopes, and ridges, creating six classes (http://www.jennessent.com/arcview/tpi.htm, accessed on 20 July 2023). All spatial data were converted into a raster format (WGS-84 projection) with a spatial resolution of 30 m.

2.3. Methods

This study focuses on Wanning City, situated in Hainan Province, to identify significant ecological source areas through threshold analysis and analyze the structural changes in the ecological network from the perspective of “ecological source area–ecological corridor–network structure”. Ecological networks were constructed for the years 2000 and 2020, identifying ecological pinch points and obstacles affecting landscape connectivity using landscape graph theory and circuit theory. Circuit theory is the study of the relationship between the current and various resistors within a circuit board. This method or model of circuit theory yields three significant outcomes, ecological corridor (or ecological circulation channel), ecological pinch point, and ecological barrier point, which are collectively referred to as ecological nodes. The study proposes an ecological network space optimization scheme.

2.3.1. Assessment of Habitat Suitability and Identification of Ecological Source Areas

Previous methods typically identified ecological source areas through two approaches. First, nature reserves or areas designated as ecological protection zones were directly chosen as ecological source areas. Second, ecological patches were identified based on references and selected if they exceeded a certain minimum area threshold [14,18]. However, these methods often relied on subjective factors and neglected the scale effect of the landscape. In this study, a comprehensive index system was created to evaluate habitat suitability (ranging from 0 to 1), incorporating factors such as the LULC type, road networks, landform, proximity to water sources, and distance from main traffic arteries (Table 1). Based on this index, a threshold area was set at intervals of 2 ha, ranging from 2 to 40 ha, to analyze changes in the number of ecological patches, total area, and habitat suitability within the threshold. The analysis revealed a rapid decline in both the number and total area of ecological patches as the threshold increased (Figure 1). At a threshold of 32 ha, the decline in the number and total area of ecological patches began to stabilize, while the mean habitat suitability value increased slightly with the rising threshold, consistently reaching approximately 0.9. Therefore, 32 ha was selected as the minimum threshold area for ecological source areas in Wanning City.

2.3.2. Resistance Surface Construction

Ecological resistance signifies the level at which specific landscape features hinder or facilitate species movement between habitat patches. This factor primarily relies on the land cover type and the extent of human disturbance. The construction of the ecological resistance surface model incorporated various factors such as LULC type, roads, topography, distance from water sources, and proximity to major traffic arteries (refer to Table 1) [16,22,23]. The ecological resistance value reflects the presumed relationship between ecological variables and the difficulty of animal movement across pixels and serves as the basis for extracting ecological corridors. The ecological resistance coefficient ranged between 1 and 100, where a coefficient of 1 denotes an ideal environment with minimal movement costs. The coefficient increases as the cost of movement rises, as observed in railways, which act as significant constraints to the migratory movement of terrestrial animals. Consequently, a drag coefficient of 90 was adopted.

2.3.3. Ecological Corridor Identification

Utilizing the minimum cumulative resistance model, this study simulated the biological migration path by computing the minimum cumulative resistance between the source and the other patches (minimum cost) to identify potential ecological corridors [24]. The formula for the minimum cumulative resistance model is as follows:
M C R = f m i n j = n i = m D i j × R i ,  
where M C R is the minimum cumulative resistance value and f m i n represents the relationship between landscape elements and landscape units. D i j represents the Euclidean distance between the species from source j and unit i in the landscape unit. R i   represents the cost of landscape unit i for the species diffusion process [25], which is related to the setting of resistance factors and their coefficients.

2.3.4. Ecological Network Structure

Five landscape indicators, namely, the number of ecological source areas (PN), total area (TA), largest patch index (LPI), area-weighted mean proximity index (AWMPI), and degree of landscape division (DIVISION), were selected to assess the changes in landscape patterns within the habitat patches (refer to Table 2). Sustaining adequate habitat quantity and quality forms the foundation for supporting population reproduction and ecological flow, thereby playing a key role in maintaining biodiversity. The PN and TA indices, which are directly related to habitat loss and fragmentation, were chosen to depict the abundance of ecological source areas. The LPI serves as a measure of the dominance of a particular landscape type, indirectly reflecting the direction and intensity of human activity. The AWMPI gauges the concentration of regional landscape patterns concerning landscape fragmentation. As the AWMPI decreases with increased patch dispersion, the DIVISION focuses on measuring the degree of dispersion of individual distributions of different patches in a specific landscape type. A smaller mean proximity index (MPI) value indicates a higher degree of dispersion among patches of the same type, reflecting an increased level of landscape fragmentation.
The presence of potential ecological corridors connecting distinct habitats may serve as channels for animal migration and diffusion, playing a significant role in enhancing regional landscape connectivity and constituting the fundamental framework for ecological networks. The number of ecological corridors (L) and average path length (MAL) were employed to evaluate changes in the characteristics of the ecological corridors (refer to Table 2). A longer MAL signifies a lower flow efficiency of organisms.
Three indices, namely network closure (α index), line point rate (β index), and network connectivity (γ index), were selected to describe the structure of the ecological networks [26]. The α index serves as a measure of closed loops in a network, occurring when there are more than one connection paths between two nodes. It provides an alternative migration path for organisms needing to evade disturbances or predators. The β and γ indices were used to assess the average number of links and the degree of connectivity of the nodes. Higher values of these three indices signify a greater connectivity of the ecological network, indicating a more comprehensive network structure. The overall connectivity index (OCI) and probability of connectivity (PC) [27] were selected to measure the landscape connectivity of ecological networks.
Table 2. Ecological network elements and structural indices.
FactorIndexFormula (References [23,27,28])
Ecological sourceP
Ta a i j
LPI m a x ( a i j ) A L × 100
AWMPI j = 1 n s = 1 n a i j s h i j s 2 a i j T A P N
DIVISION 1 ( a j T A ) 2
Ecological corridorL
MAL
Network performance analysisNetwork structureα L N + 1 2 N 5
β L N
γ L 3 ( N 2 )
Network connectivityIIC i = 1 n j = 1 n a i a j / ( 1 + n l i j ) A L 2
PC i = 1 n j = 1 n a i a j p i j * A L 2

2.3.5. Ecological Network Space Optimization and Ecological Protection Priority Evaluation

An essential approach in ecological network research involves identifying ecological pinch points and obstacle points, followed by identifying areas for ecological network protection and restoration. The ecological pinch point is a significant regional landscape area that requires protection due to its high population density and environmental susceptibility. Habitat fragmentation and degradation in this area may lead to the discontinuity and disappearance of ecological corridors, thereby reducing connectivity between ecological sources and affecting the movement, predation, and migration of species. The ecological barrier refers to the area where species movement is impeded by ecological sources. During simulation, the potential restoration value of the regional landscape after the barrier point is removed and evaluated. Effective ecological restoration in this area can significantly improve the connectivity of the regional landscape. The identified ecological pinch points serve as the key nodes connecting the regional ecological source areas, playing the role of an ecological network hub for critical protection. Ecological restoration is performed with the restoration of ecological obstacles as the central task to optimize the connectivity of ecological networks, promote the flow of factors, and enhance the stability of regional ecosystem services and functions.
The significance of spatial elements in ecological networks was assessed using landscape diagram theory, leading to the proposal of a multilevel protection scheme for ecological networks. Landscape connectivity serves as a vital indicator of the degree of connection between regional landscape patches. The PC index is commonly employed to evaluate the overall connectivity of regional landscapes, considering habitat attributes and the diffusion ability and probability of species. The dPC indices, based on PC development, are frequently used to assess the relative importance of individual landscape patches:
d P C % = P C a l l P C r e m o v e k P C a l l × 100 ,  
where the more significant the d P C value, the higher the importance of patch k (ecological source k). P C a l l is the PC values of all the patches in the original landscape of the study area, that is, the PC values between all ecological sources. P C r e m o v e k represents the value of PC, in the study area after removing patch k. In this study, the importance of landscape patches was calculated using Conefor software 2.6. Linkage Mapper evaluated the importance of ecological corridors based on current centrality, categorizing the importance of ecological sources and corridors into four levels: very important, relatively important, important, and generally important.

3. Results

3.1. Spatial Distribution of the Ecological Network

3.1.1. Spatial Distribution of Habitat Suitability and the Ecological Resistance Surface

Figure 2a,c illustrate the spatial distribution of habitat suitability values in Wanning City, showcasing higher values in the western region and lower values in the eastern region. In 2000, Sangengluo, Nanqiao, Beidai, and Longjiu in Wanning City exhibited the highest habitat suitability, while Damao, Houan, Hele, and the western area of Wancheng displayed the lowest habitat suitability. By 2020, the western townships, specifically Sangengluo, Nanqiao, and Longwu, continued to exhibit relatively high habitat suitability, while the eastern townships, such as Canning, Changfeng, Damao, Houan, and Hele, experienced a significant decline in habitat suitability, becoming concentrated around the central urban area. When analyzing the spatial distribution of the ecological resistance surface model in Wanning City (Figure 1), we can note that the ecological resistance value exhibited a lower magnitude in the western region and a higher magnitude in the eastern region. This trend displayed a gradual decrease emanating from the central urban area and the main transportation route. From 2000 to 2020, the ecological resistance values of Wancheng, Changfeng, Damao, and Liji towns in the eastern region significantly increased, while the western region experienced varying degrees of increase in the ecological resistance values of Nanqiao, Sangenluo, and Beifang.

3.1.2. Analysis of Spatial Distribution of the Ecological Network

The ecological source areas of Wanning City were predominantly concentrated in the west and south, with relatively fewer ecological source areas in the middle and east (Figure 3). The eastern portion of the city is characterized by a mountainous terrain featuring expansive forests and grassy areas, whereas the central and western areas comprise hilly or flat landscapes with developed and cultivated land. Consequently, the number, size, and distribution of ecological source areas exhibit significant variations. Regarding the spatial distribution of ecological corridors, Wanning’s ecological corridors are primarily situated in the central and eastern parts of the city, with sparse distribution in the north and dense distribution in the south. In 2000, Wanning’s ecological corridor spanned Longgu, Shangen, Houan, Hele, Damao, Wancheng, and Liji. By 2020, ecological corridors in Wanning City were concentrated in Damao, Changfeng, and Wancheng, with reductions in other regions. Over the period from 2000 to 2020, several small ecological sources in Wancheng, Liji, and Dongao disappeared, leading to a reduction in the corridors.

3.2. Analysis of the Change in Ecological Network Structure

3.2.1. Ecological Source Area

Between 2000 and 2020, the number of patches in Wanning City’s ecological source area increased from 49 to 61, while the total area decreased by 61.62 km2 (Table 3). This indicates that the ecological source area in the study area became more fragmented, a trend further substantiated by the change in the AWMPI. The AWMPI for the ecological source area of Wanning City was highest in 2000, suggesting that the patches in the ecological source area were closer and more spatially continuous. However, the decrease in the AWMPI in 2020 indicates a reduction in connectivity between patches, contributing to increased landscape fragmentation. Over the same period, the LPI decreased from 46.92% to 40.03%, indicating a reduction in the dominance of habitat patches in Wanning City, indirectly reflecting increased human activity disturbance within the habitat. An analysis of the DIVISION index reveals that the degree of landscape segmentation in the ecological source area of Wanning City was severe between 2000 and 2020, resulting in increased dispersion of landscape patches.

3.2.2. Ecological Corridor

The number of ecological corridors in Wanning City increased from 94 in 2000 to 114 in 2020 (Table 3). Simultaneously, the MAL in 2020 was higher compared to that in 2000, growing from 1.91 km in 2000 to 2.30 km in 2020. This suggests reduced organism flow efficiency in the study area due to several factors. Firstly, the shrinking and fragmentation of ecological sources, especially the decreasing trend in the number and area of ecological sources in Wancheng, Liji, and Dongao, have led to the severe fragmentation of ecological sources in some areas. Consequently, habitats that could have been directly connected now rely on further habitats for connectivity. As a result, the number and length of corridors have increased. Secondly, the growing urbanization in Wanning City has heightened ecological resilience in the central urban area, resulting in a reduction in the distance between ecological sources.

3.2.3. Network Topology

The α, β, and γ indices in 2000 were significantly higher than those in 2020 (Table 3), indicating that the ecological network structure of Wanning City in 2000 was superior to that in 2020. In 2000, the α index of the ecological network in Wanning City was 0.495, while in 2020, it decreased to 0.462, signifying a reduction in closed loops and a shift toward a more linear network structure in 2020. Changes in the β index reveal that the average number of connections at each network node in 2020 was lower than in 2000, reflecting reduced network accessibility. The γ index of the ecological network in Wanning City decreased from 0.667 in 2000 to 0.664 in 2020, indicating reduced connectivity and network effectiveness. Changes in landscape connectivity indices (PC and IIC) of the ecological network suggest diminished landscape connectivity and habitat accessibility for species in the study area. The loss of ecological source areas in the eastern part of Wanning City directly contributed to a reduction in closed loops and the structural accessibility of the ecological network. The reduction and fragmentation of the habitat patch area led to decreased landscape connectivity. Longer corridor distances between ecological sources, increased ecological resistance due to urbanization and human activities, and a subsequent rise in resistance cost for potential ecological corridors all impacted network connectivity.

3.3. Ecological Network Space Optimization and Restoration Countermeasures

Consistent with established ecological principles, we identified ecological barriers to locate areas of degradation and damage within the broader landscape. The current intensity, symbolized by color, gradually increased from blue to red (Figure 4a). The red areas represent regions with the most significant current intensity and the highest ecological restoration potential. These areas are primarily situated in Damao, Houan, Changfeng, Liji, and Wancheng. Ecological pinch points were determined using the current theory, and we established a 5 km buffer as the foundational component of the ecological corridor. The distribution of current density within the ecological corridor in Wanning City ranged from yellow to red (Figure 4b), indicating a progressive increase in intensity. The red areas signify locations with the most substantial current density, signifying ecological pinch points within Wanning City. Ecological pinch points, with ecological importance, were predominantly concentrated in the southwest and central areas of Wanning City, particularly in Liji, Dongao, Wancheng, and Damao.
Based on the identification of ecological pinch points and obstacles, coupled with the prioritization of ecological network elements, we introduce an ecological network protection and restoration plan known as “One Belt, Four Sources, Eight Districts, Multiple Corridors, and Multiple Points” (Figure 5a). “One Belt” alludes to the coastal ecological landscape belt, safeguarding coastal resources, defense forests, and sandy beaches. “Four sources” pertains to the four primary ecological source areas encompassing Shangxi–Jianling, Liulianling, Nanlin, and Jiaxin nature reserves, national forest parks, mountains, and inland seas. These areas hold great significance for soil and water conservation, biodiversity preservation, and soil and water conservation within Wanning City. The “eight districts” encompass ecological restoration zones concentrated in the towns of Houan, Damao, Changfeng, and Liji. “Multi-corridor and multi-point” refer to the establishment of numerous ecological corridors and crucial ecological nodes, relying on reservoirs, wetlands, islands, and mountains to preserve regional landscape connectivity.
Considering the importance value of ecological source patch dPC and the current centrality value of the ecological corridor, we categorized the significance of ecological network elements into four levels: significant, relatively important, meaningful, and generally important. The most vital ecological sources were situated in Sangengluo and Nanqiao (Figure 5b). The crucial ecological sources were located in the Longgu and Xinglong Overseas Chinese Farm. The highly important ecological sources were primarily found in Liji, while the critical ecological sources were widely distributed in Longgu, Damao, Houan, Wancheng, and other central and eastern regions. The most crucial ecological corridors were found in Liji and Dongao, the highly important ecological corridors were mainly distributed in Wancheng and Changfeng, the highly important ecological corridors were concentrated in Damao and other central and eastern areas, and the highly important ecological corridors were mainly situated in the north of Wanning City.

4. Discussion and Conclusions

Ecological networks play a crucial role in maintaining regional ecological security patterns and are essential for the sustainable development of regional ecological environments. The quality of their structure is of utmost importance in this regard. Understanding the structure of these networks is essential for safeguarding biodiversity and sustaining an ecological equilibrium. This study constructed and analyzed the ecological network of Wanning City for the years 2000 and 2020, with a focus on examining changes in the region’s ecological network in terms of the spatial arrangement of landscape elements, the structure of the landscape, and connectivity. We have devised an ecological network optimization strategy for Wanning City, presenting a regional ecological preservation and restoration blueprint. The main conclusions drawn from this study are as follows.
(1)
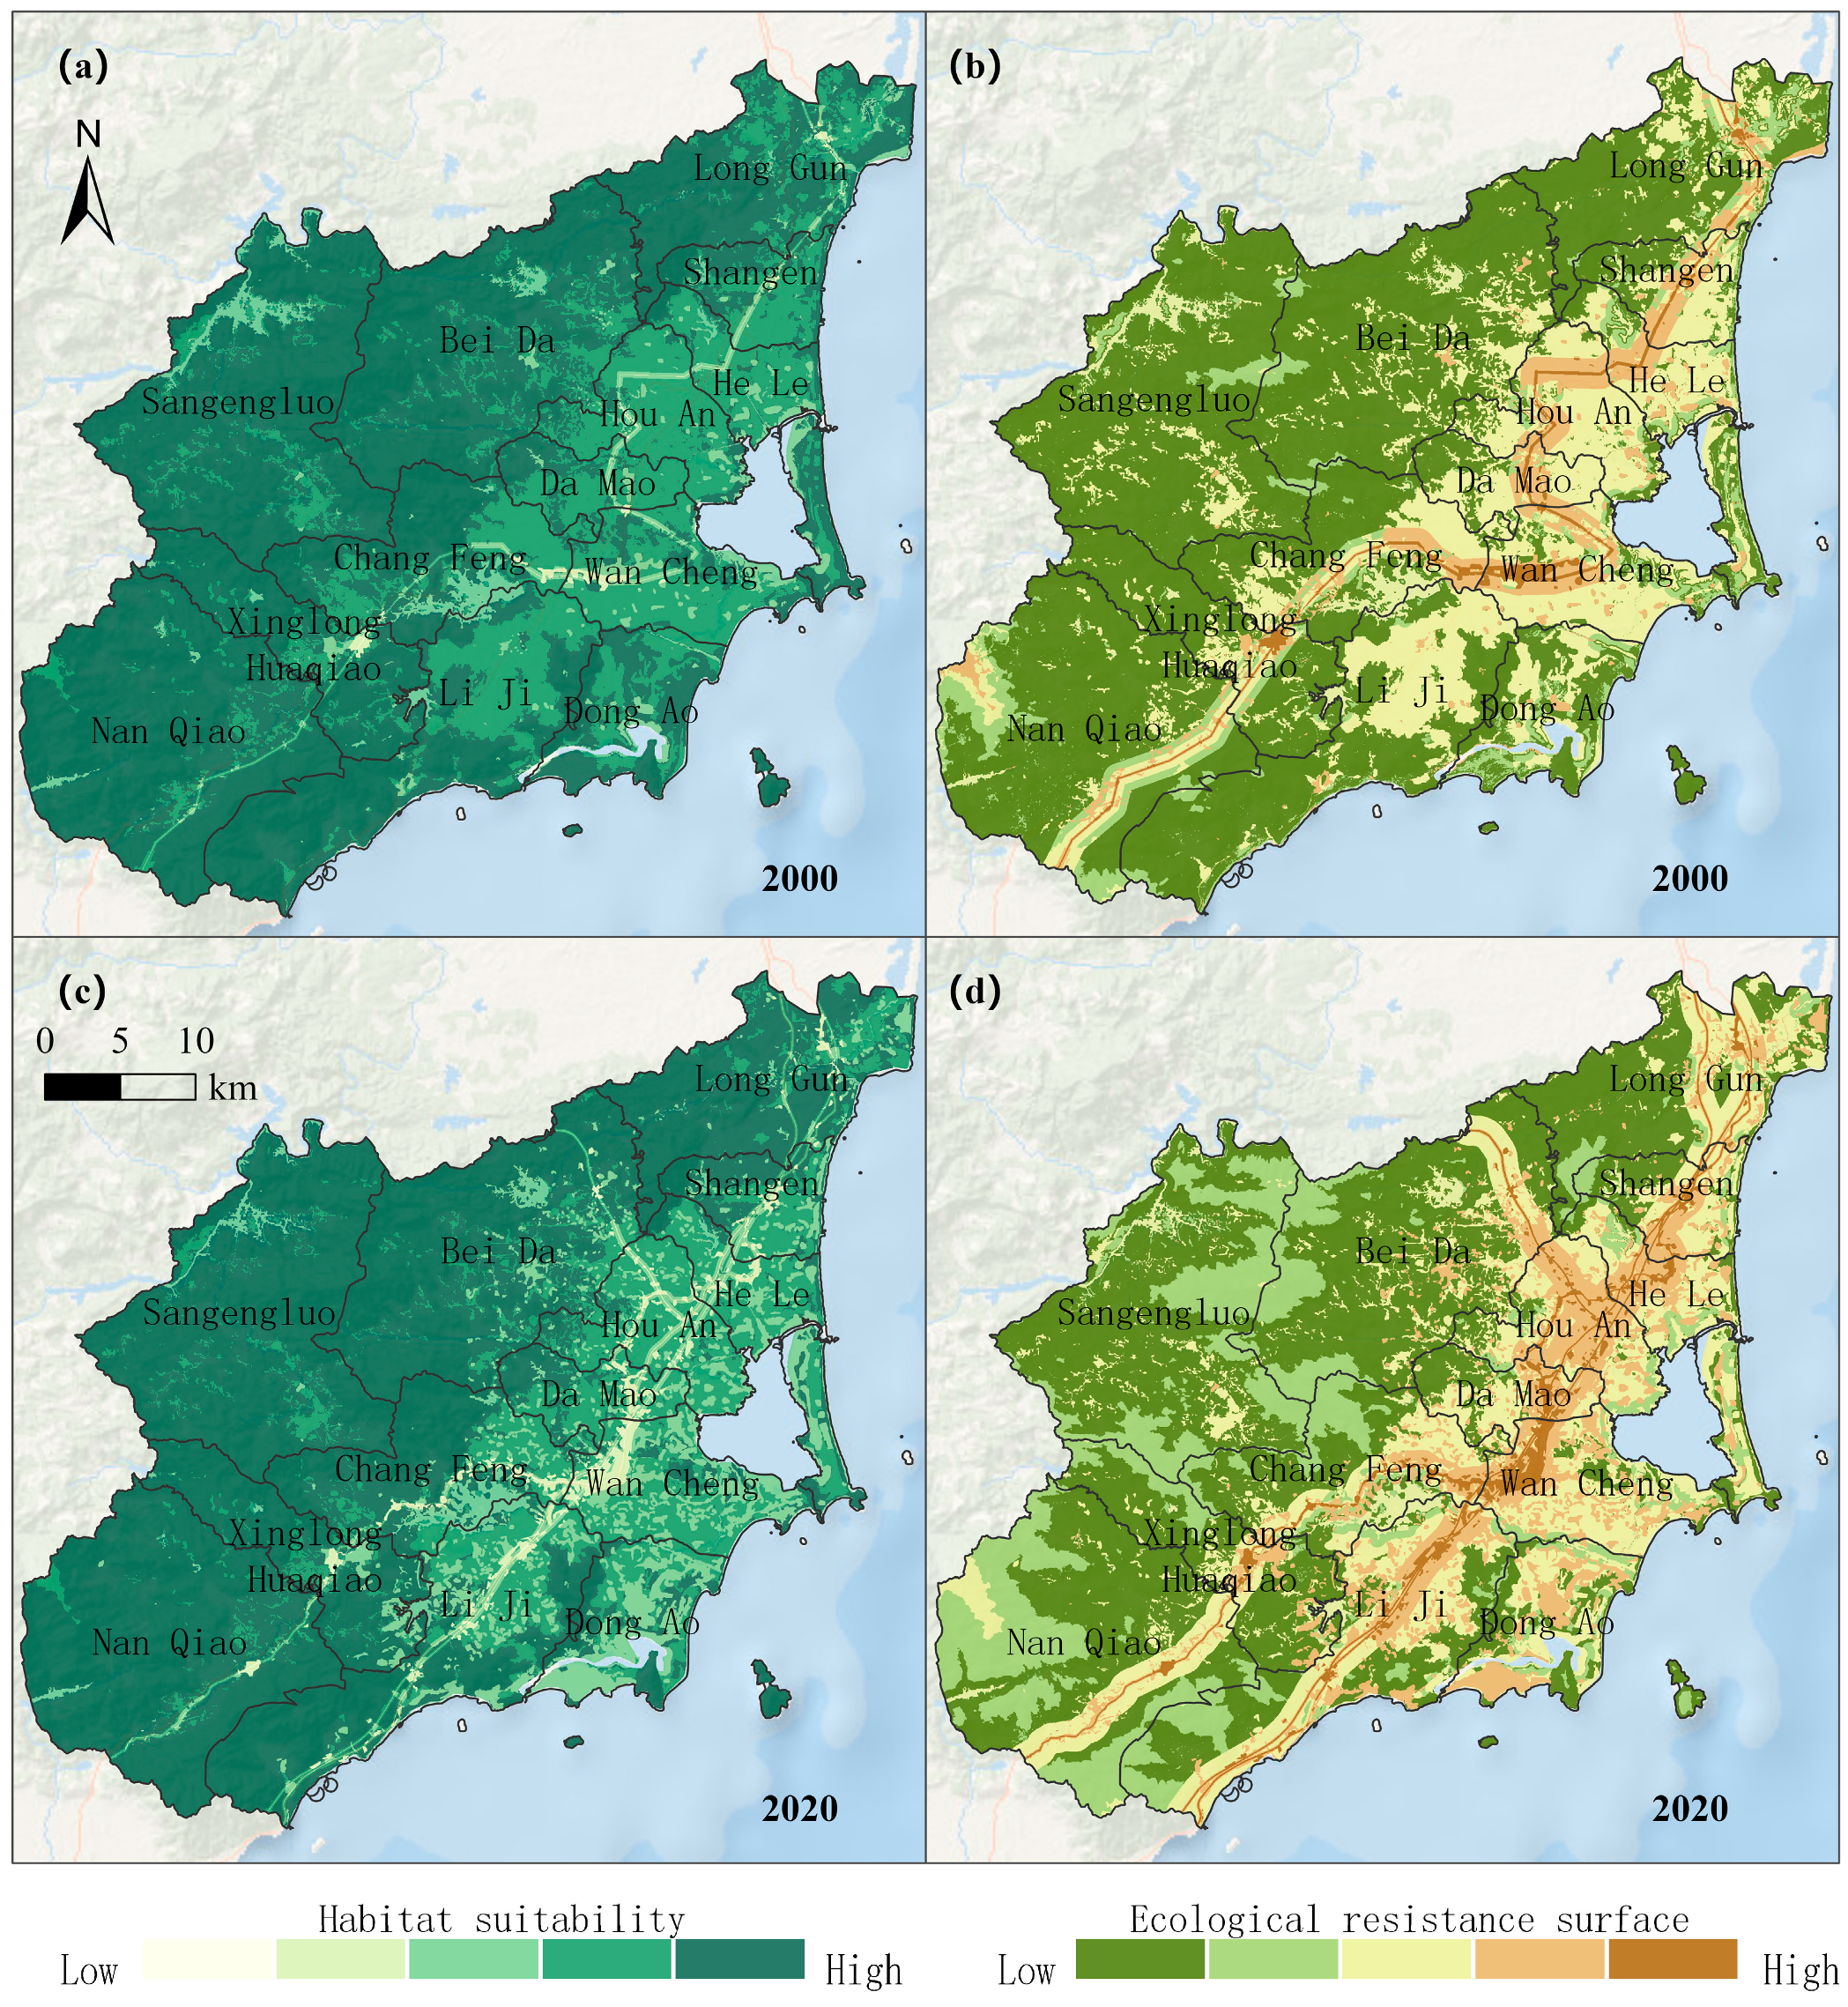
The study reveals a distinct pattern of habitat suitability across Wanning City, with higher suitability in the west and lower suitability in the east. Notably, between 2000 and 2020, the habitat suitability of regions such as Wancheng, Changfeng, Damao, Houan, and Le, to the east of Wanning City, experienced significant decreases. The areas exhibiting lower habitat suitability expanded outward from the center at Wancheng. Concurrently, the ecological resistance in Wanning City displayed a similar spatial trend, with lower values in the west and higher values in the east. Notably, Wancheng, Changfeng, Damao, and Liji emerged as high-resistance areas. Over the same period, an increase in ecological resistance was observed in the eastern region, accompanied by varying degrees of increases in Nanqiao, Sangengluo, and Beiduo in the western region, signifying heightened resistance to species movement.
(2)
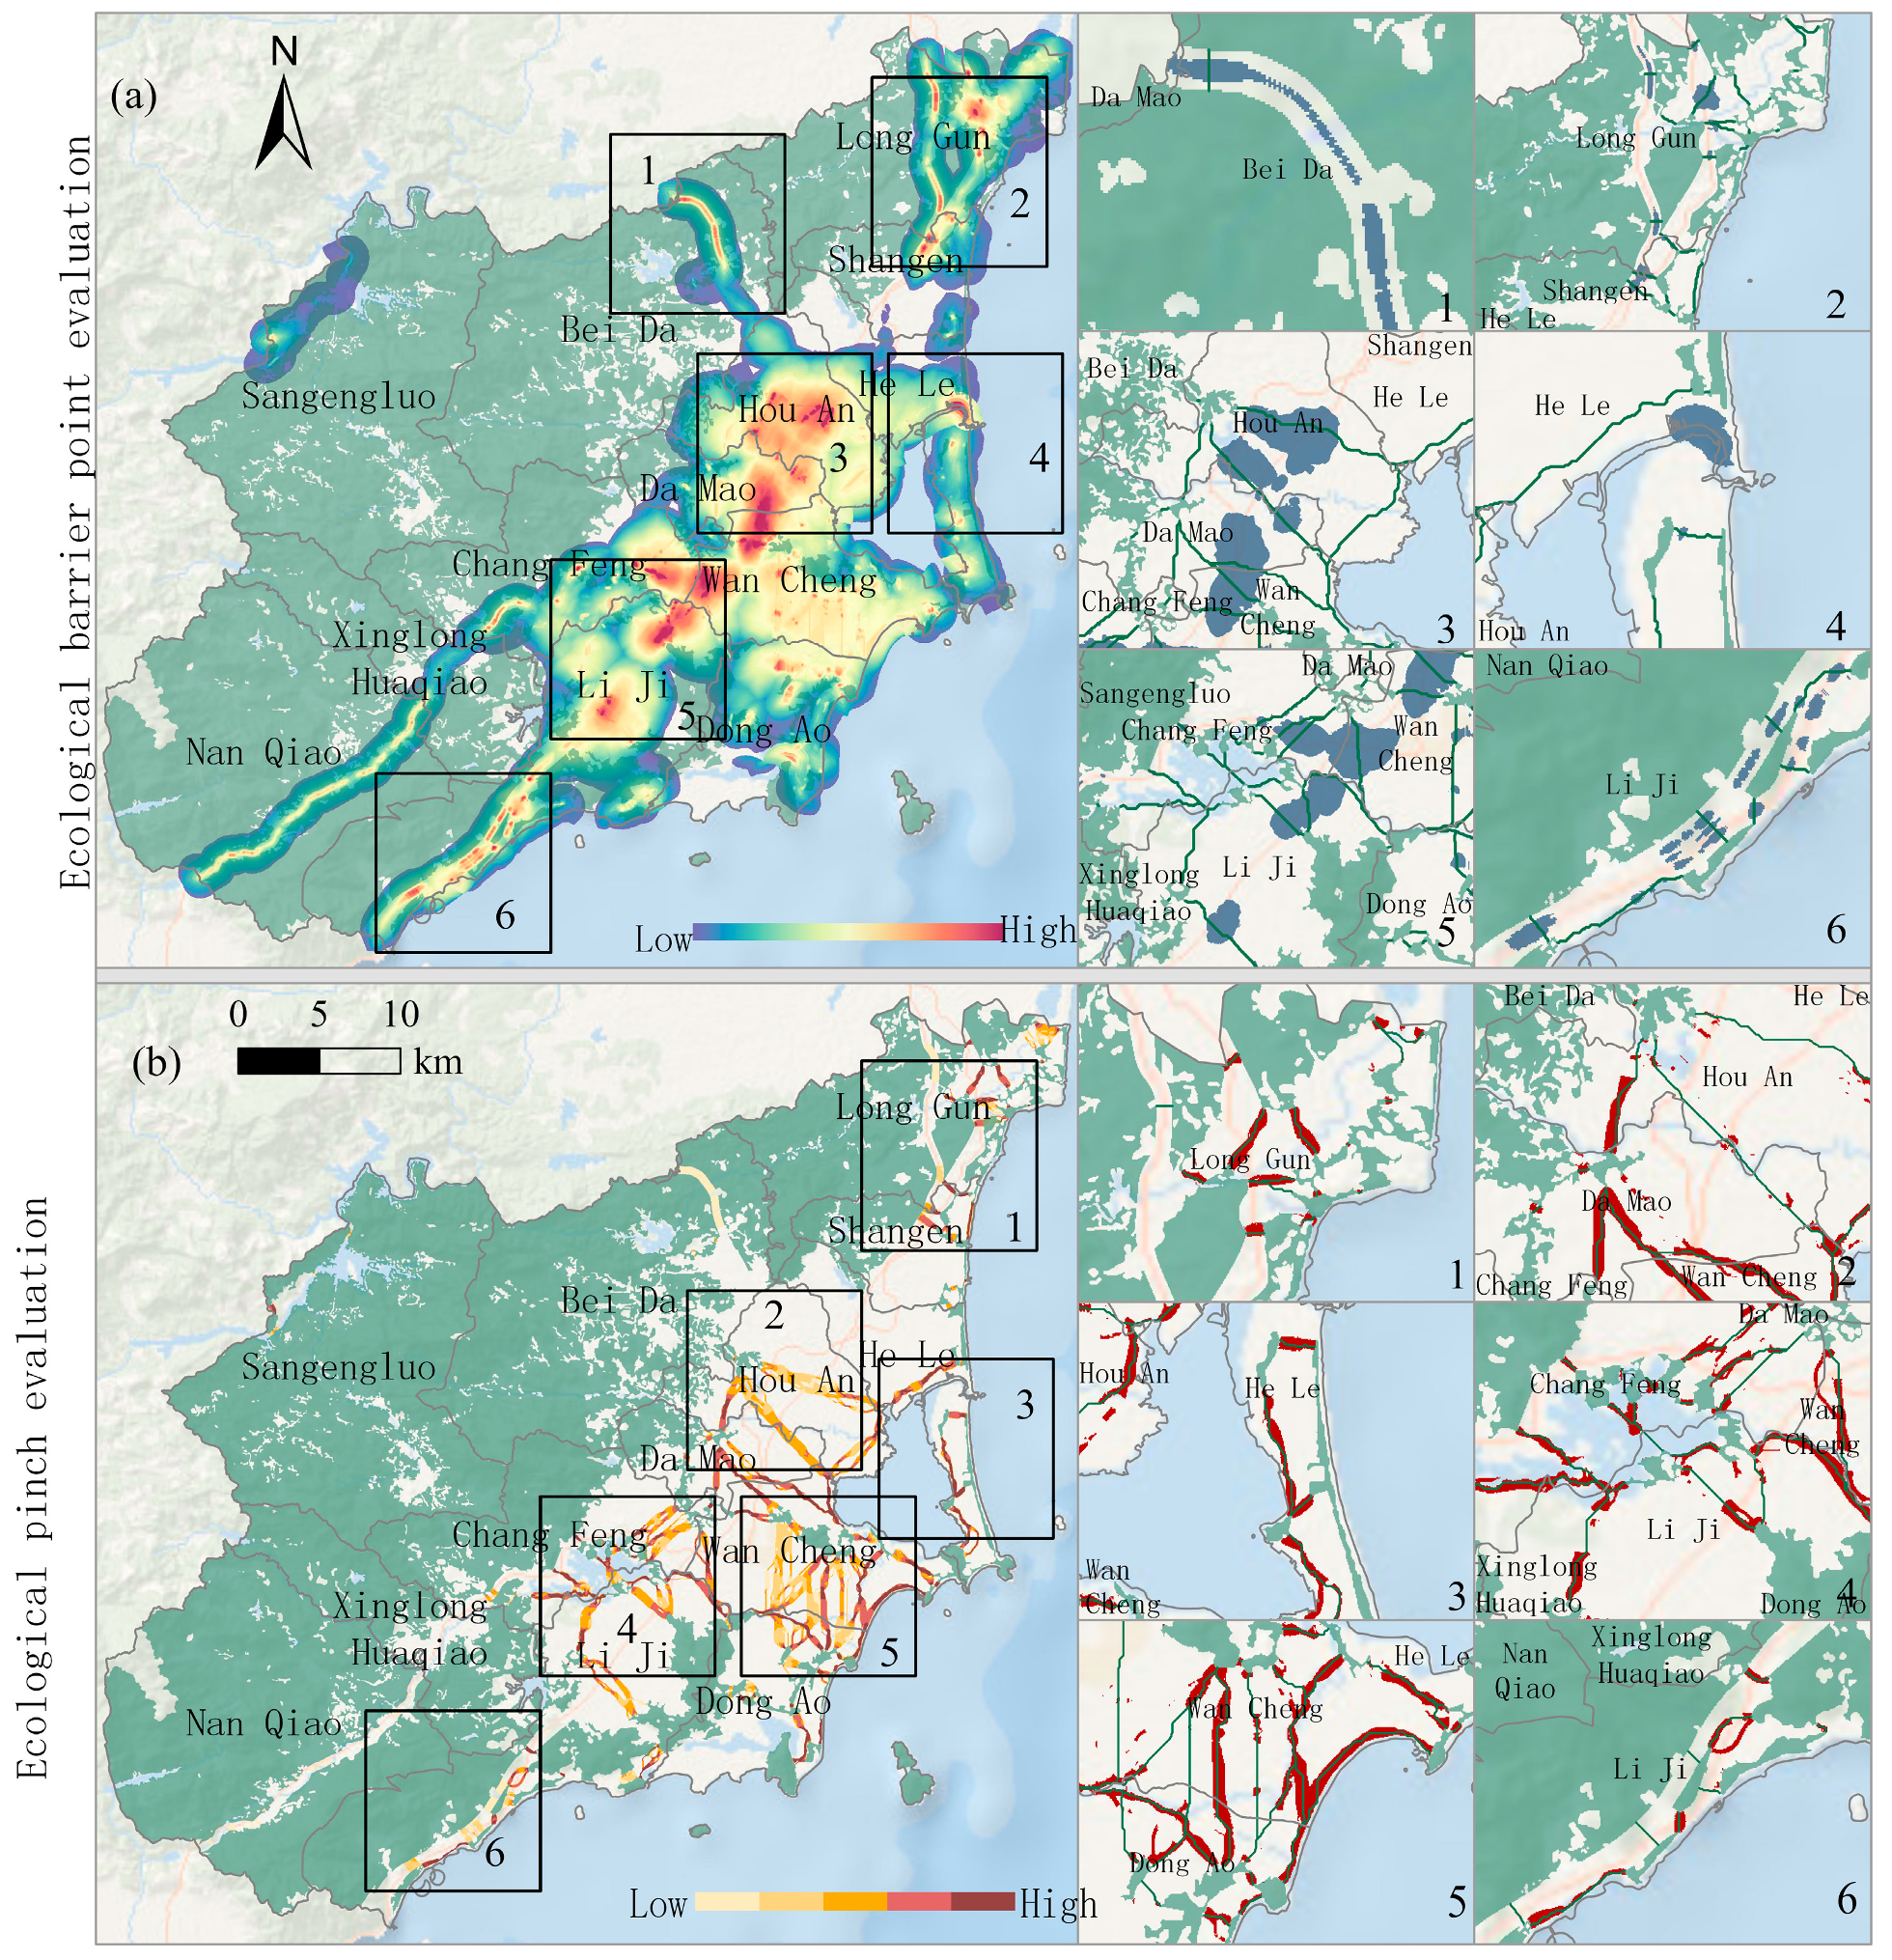
The ecological source areas in Wanning City displayed notable regional variations, with higher concentrations found in the western and southern sectors, while the central and eastern regions exhibited fewer ecological source areas. The ecological corridors were predominantly located in the central and eastern parts of the city, with a less dense presence in the northern area. This divergence can be attributed to the prevalence of mountains and extensive forest and grassland in the eastern region, in contrast to the dominance of hills and plains, characterized by urbanization and human activities, in the central and western areas. This disparity highlights the substantial spatial heterogeneity within the ecological network.
(3)
The in-depth scrutiny of the ecological network structure reveals several critical findings. Between 2000 and 2020, ecological source areas within Wanning City decreased, indicating a trend toward fragmentation, reduced structural accessibility, and diminished landscape connectivity within the ecological network. The number of patches in the ecological source area increased while the total area diminished, signifying the dwindling dominance of habitat patches. This trend corresponds with changes in the AWMPI, LPI, and DIVISION landscape pattern indices. Furthermore, during the same period, the number of ecological corridors increased, but the average path length also increased. This signifies a decrease in the efficiency of biological flow within ecological corridors, primarily due to two factors. Firstly, habitat fragmentation caused by the shrinking of the ecological source area necessitates connecting more distant habitats, and secondly, increased urbanization and human activities have elevated ecological resistance, lengthening the shortest path between ecological sources. Furthermore, the analysis of ecological network performance reveals that the ecological network structure was better suited in 2000 than in 2020, with significantly higher values for the α, β, and γ indices, as well as for the PC and IIC indices, representing the network’s structure. The results indicate a reduction in the number of loops and structural accessibility of the ecological network in Wanning City, leading to a transition from a ring-like structure in 2000 to a more radial one in 2020, ultimately reducing the landscape connectivity and habitat accessibility of the network.
(4)
To protect crucial ecological spaces and restore degraded and damaged areas, we propose an ecological network space protection and restoration plan, termed “one belt, four sources, eight districts, multiple corridors, and multiple points”. The restoration of territorial space will be focused on areas in Houan, Damao, Changfeng, and Liji. Emphasis will be placed on protecting and restoring ecological lands, such as forestland and grassland, in the north-central and eastern regions of the city to mitigate fragmentation. The goal is to enhance the connectivity of the landscape ecological network by increasing the number and size of ecological patches in regions like Wancheng, Damao, Dongao, and other central and eastern areas, while also restoring connectivity between ecological sources. Additionally, we aim to establish multiple ecological corridors and important ecological nodes based on reservoirs, wetlands, islands, and mountains, connected by the landscape of the Weiyu region. To ensure the protection and control of ecological resources, ecological protection spaces are classified into four levels: significant, relatively important, necessary, and generally essential, based on the importance of ecological source patches and the current centrality value of ecological corridors.
In conclusion, this research provides valuable insights for scientifically assessing critical areas for territorial ecological restoration, identifying essential regions for ecological preservation, and optimizing the allocation of natural resources.

Author Contributions

S.Z. and J.G. designed the research; R.F. processed the data; S.Z. analyzed the data; S.Z. and J.G. wrote the paper. All authors have read and agreed to the published version of the manuscript.

Funding

This research was funded by the National Social Science Foundation of China and Fundamental Research Funds for the Central Universities, China University of Geosciences (Wuhan).

Data Availability Statement

The authors have not obtained permission to publish the data. Therefore, the data can be obtained from the corresponding author upon reasonable request.

Conflicts of Interest

The authors declare no conflicts of interest. The funding sponsors had no role in the design of the study; in the collection, analysis, or interpretation of data; in the writing of the manuscript; or in the decision to publish results.

References

  1. Gu, C.; Guan, W.; Liu, H. Chinese urbanization 2050: S.D. modeling and process simulation. Sci. China Earth Sci. 2017, 60, 1067–1082. [Google Scholar] [CrossRef]
  2. Liu, X.; Wei, M.; Zeng, J.; Zhang, S. Ecological network analysis and construction: A case study of the urban agglomeration of the Min River Delta, China. Resour. Sci. 2021, 43, 357–367. [Google Scholar] [CrossRef]
  3. Wu, D.; Li, H.; Ai, N.; Tao, H.; Gu, J. Predicting spatiotemporal changes in land use and habitat quality based on CA-Markov: A case study in central Ningxia, China. Chin. J. Eco-Agric. 2020, 28, 1969–1978. [Google Scholar] [CrossRef]
  4. Gao, J.; Gong, J.; Li, J. Effects of source and sink landscape pattern on land surface temperature: An urban heat island study in Wuhan City. Prog. Geog. 2019, 38, 1770–1782. [Google Scholar] [CrossRef]
  5. Wang, Z.; Ya, S.; Pu, H.; Mofakkarul, I.; Ou, L. Simulation of spatiotemporal variation of land use in mountainous-urban fringes based on improved CA-Markov model. Trans. Chin. Soc. Agric. Eng. 2020, 36, 239–248. [Google Scholar] [CrossRef]
  6. Bielecka, E. GIS spatial analysis modeling for land use change. A bibliometric analysis of the intellectual base and trends. Geosciences 2020, 10, 421. [Google Scholar] [CrossRef]
  7. Zhao, C.; Jensen, J.L.R.; Weaver, R. Global and local modeling of land use change in the border cities of Laredo, Texas, USA and Nuevo Laredo, Tamaulipas, Mexico: A comparative analysis. Land 2020, 9, 347. [Google Scholar] [CrossRef]
  8. Huang, M.; Yue, W.; Feng, S.; Cai, J. Analysis of spatial heterogeneity of ecological security based on MCR model and ecological pattern optimization in the Yuexi county of the Dabie Mountain Area. J. Nat. Resour. 2019, 34, 771–784. [Google Scholar] [CrossRef]
  9. Peng, J.; Zhao, H.; Liu, Y.; Wu, J. Research progress and prospects on regional ecological security pattern construction. Geogr. Res. 2017, 36, 407–419. [Google Scholar]
  10. Zhou, C.; Wu, Y. A planning support tool for layout integral optimization of urban blue–green infrastructure. Sustainability 2020, 12, 1613. [Google Scholar] [CrossRef]
  11. Saputra, M.H.; Lee, H.S. Prediction of land use and land cover changes for North Sumatra, Indonesia, using an artificial-neural-network-based cellular automaton. Sustainability 2019, 11, 3024. [Google Scholar] [CrossRef]
  12. Walker, N.J.; Schaffer-Smith, D.; Swenson, J.J.; Urban, D. Improved connectivity analysis using multiple low-cost paths to evaluate habitat for the endangered San Martin Titi monkey (Plecturocebus oenanthe) in North-Central Peru. Landsc. Ecol. 2019, 34, 1859–1875. [Google Scholar] [CrossRef]
  13. Heinonen, T. Developing landscape connectivity in commercial boreal forests using minimum spanning tree and spatial optimization. Can. J. For. Res. 2019, 49, 1198–1206. [Google Scholar] [CrossRef]
  14. Cao, Z.; Sun, Y.; Xie, G.; Qiu, P. Study on the evolution of the ecological network in the Haikou coastal zone. Acta Ecol. Sin 2020, 40, 1044–1054. [Google Scholar]
  15. Yang, J.; Zeng, C.; Cheng, Y. Spatial influence of ecological networks on land use intensity. Sci. Total Environ. 2020, 717, 137151. [Google Scholar] [CrossRef]
  16. He, J.; Pan, Y.; Liu, D. Analysis of the wetland ecological pattern in Wuhan City from the perspective of ecological network. Acta Ecol. Sin 2020, 40, 3590–3601. [Google Scholar]
  17. Zhao, W.; Han, Z.; Yan, X.; Zhong, J. Ecological security pattern construction based on the multi-scenario trade-off of ecosystem services: A case study of Wafangdian, Dalian. J. Nat. Resour. 2020, 35, 546–562. [Google Scholar]
  18. Fang, Y.; Wang, J.; Huang, L.; Zhai, T. Determining and identifying critical areas of ecosystem preservation and restoration for territorial spatial planning based on ecological security patterns: A case study of Yantai city. J. Nat. Resour. 2020, 35, 190–203. [Google Scholar]
  19. Shi, F.; Liu, S.; An, Y.; Sun, Y.; Dong, S.; Wu, X. Changes of landscape fragmentation and connectivity with urbanization: A case study of Kunming City. Acta Ecrol. Olog. Sin 2020, 40, 3303–3314. [Google Scholar]
  20. Shi, F.; Liu, S.; An, Y.; Sun, Y. Biodiversity conservation of mountains-rivers-forests-farmlands-lakes-grasslands using an ecological network: A case study on the Zuoyoujiang river basin in Guangxi Province, China. Sheng Tai Xue Bao 2019, 39, 8930–8938. [Google Scholar] [CrossRef]
  21. Wei, Z.; Luo, G.; Lu, Y. Optimization of landscape pattern in Wanning City based on ecological perspective. Mod. Hortic. 2018, X, 108–111. [Google Scholar]
  22. Liu, X.; Li, J.; Zhou, Y.; Chen, Z.; Ding, Y. Analysis of landscape ecological pattern evolution and ecological network structure optimization for Shanghai. Resour. Environ. Yangtze Basin 2019, 28, 2340–2352. [Google Scholar]
  23. Liu, X.P.; Zhang, Z.; Li, L.Y.; Li, M.X. Comprehensive evaluation of the evolution of ecological network structure in Tianjin, China, from a multi-dimensional perspective. Ying Yong Sheng Tai Xue Bao. 2021, 32, 1554–1562. [Google Scholar] [CrossRef] [PubMed]
  24. Li, X. The Delineation of the Ecological Red Line Considers the Pattern and Function of the Ecological Network; Wuhan University: Wuhan, China, 2017. [Google Scholar]
  25. Li, W.; Ma, L.; Zang, Z.; Gao, J.; Li, J. Construction of ecological security patterns based on the ecological red line in Erhai Lake Basin of southwestern China. J. Beijing For. Univ. 2018, 40, 85–95. [Google Scholar] [CrossRef]
  26. Wu, L. Study on the Optimal Layout of the Ecological Network of the Oasis in Hexi Corridor; Gansu Agricultural University: Lanzhou, China, 2016. [Google Scholar]
  27. Saura, S.; Torné, J. CONEFOR SENSINODE 2.2: A software package for quantifying the importance of habitat patches for landscape connectivity. Environ. Model Softw. 2009, 24, 135–139. [Google Scholar] [CrossRef]
  28. Mcgarigal, K.; Marks, B.J. Fragstats—Spatial Pattern Analysis Program for Quantifying Landscape Structure; US Department of Agriculture, Forest Service, Pacific Northwest Research Station: Washington, DC, USA, 1995; p. 351. [Google Scholar]
Figure 1. Threshold analysis for minimum ecological source areas.
Land 13 00122 g001
Figure 2. Distribution map of habitat suitability and the ecological resistance surface in Wanning City from 2000 to 2020. ((a,c): habitat suitability for 2000 and 2020; (b,d): ecological resistance surface for 2000 and 2020).
Land 13 00122 g002
Figure 3. Spatial distribution of ecological networks in Wanning from 2000 to 2020.
Land 13 00122 g003
Figure 4. Optimization pattern of ecological networks in Wanning City. ((a). ecological barrier point evaluation; (b). ecological pinch evaluation).
Land 13 00122 g004
Figure 5. Distribution of ecological spaces for protection and restoration in Wanning City. ((a). ecological protection and restoration area (b) ecological source and corridor).
Land 13 00122 g005
Table 1. Habitat suitability and ecological resistance factors and their scores in Wanning City.
FactorResistance FactorCoefficientHabitat
Suitability
Land useFarmland500.5
Woodland11
Grassland200.9
Wetland200.8
Waters1000
Construction land1000
Bare land700.2
RoadRailway900
Expressway600
Distance from a water source<100 m10.9
100–200 m100.8
200–500 m200.7
>500 m400.6
Distance from major traffic arteries<100 m900.1
100–200 m700.3
200–500 m500.5
500–1000 m400.7
>1000 m100.9
Geomorphic morphological indexValley10.9
Low slope100.8
Gentle slope200.6
Steep slope300.5
Extremely steep slope500.3
Table 3. Structural changes in the ecological network in Wanning City from 2000 to 2020.
FactorIndex20002020
Ecological sourceEcological source4961
T.A./km21219.971158.35
LPI46.9240.03
AWMPI42542793
DIVISION0.760.82
Ecological corridorEcological corridor94114
MAL/km1.912.30
Network performance analysisNetwork performance analysisα0.4950.462
β1.9181.869
γ0.6670.644
Network connectivityIIC0.2890.244
PC0.3720.335
Disclaimer/Publisher’s Note: The statements, opinions and data contained in all publications are solely those of the individual author(s) and contributor(s) and not of MDPI and/or the editor(s). MDPI and/or the editor(s) disclaim responsibility for any injury to people or property resulting from any ideas, methods, instructions or products referred to in the content.

