Abstract
This article addresses the bidirectional relationship between residential micro-segregation, in the form of built barriers to mobility, and social capital. I engage with two bodies of the literature. On the one hand, I critique a widespread top-down model of residential segregation. This model suggests that higher-status groups drive segregation through direct (e.g., secluded neighbourhoods) and indirect (e.g., by funnelling housing demand) measures. On the other hand, I provide evidence of the bounding effects of segregation on social capital. While some scholars suggest residential homogeneity favours social capital, others argue that benefits occur within privileged neighbourhoods. The effects of segregation on social capital are less clear at lower scales and in highly unequal Global South cities. My argument is twofold. First, I uncover the dynamics of segregation below the neighbourhood scale. I use the notion of horizontal micro-segregation to identify the social and spatial conditions associated with a higher concentration of street-level segregating infrastructure. My methodological approach draws on data for all residential blocks in Lima, Peru (N = 99,685). I find that suburban-inspired urban design is positively associated with micro-segregating infrastructure, upon controlling for other factors such as socioeconomic status, density, and urbanization age of each block. Second, I provide evidence of the bounding effects of segregation on social capital. Using ten waves of the Lima Cómo Vamos survey (2010–2019), I show that micro-segregating infrastructure is associated with higher trust in neighbours and lower civic engagement. These findings indicate that exposure to segregation affects social capital within and across secluded neighbourhoods throughout the socioeconomic spectrum.
1. Introduction
In this paper, I present a novel approach to the study of contemporary patterns of urban segregation and its implications for social (dis)integration. Sociospatial divides are an important dimension of recent discussions on social fragmentation and political polarization around the world [1,2]. Nonetheless, most of the attention is paid to the differences across large geographic areas (e.g., urban–suburban, urban–rural, and across regions or neighbourhoods). Exploring sociospatial fragmentation at smaller scales poses several conceptual and methodological challenges [3]. Building on recent innovations in spatial analysis in combination with survey data, I identify the spatial underpinnings of residential segregation at the level of street segments and its consequences for social capital. I use the entire city of Lima, Peru, as my case study.
This study brings attention to the sociospatial dynamics that underlie residential (micro-)segregation as both a product and a cause of social fragmentation. First, I question widely shared assumptions about what explains the proliferation of segregated residential patterns. By contrast with dominant approaches, I emphasize urban design as an element that facilitates the erection of horizontal micro-segregation across social groups in highly unequal cities. Second, I explore the implications of micro-segregation on two dimensions of social capital: trust and civic engagement. I suggest that exposure to micro-segregating infrastructure limits the scope of social capital to those in closer proximity (e.g., one’s neighbours).
Many existing theories characterize residential (micro-)segregation as a top-down process. According to the segregation model stemming from the Anglosphere, higher-status groups impose restrictions on lower-status groups’ housing choices in two ways. Directly, as upper-status families limit access to “exclusive” neighbourhoods [4,5]. Indirectly, as upper-status families’ preferences lead to the concentration of affordable housing in less desirable areas [6,7]. Both upper- and lower-status segregated neighbourhoods are physically, symbolically, and often legally separated from the rest of the city. The boundaries around segregated areas range from terrain conditions (e.g., rivers or hills), to infrastructure (e.g., highways or railways) and physical barriers (e.g., gates, walls, and fences).
The micro-segregation approach provides an alternative to enable the study of the sociospatial structuring of social groups scales below the neighbourhood (e.g., the residential tower) in higher-density contexts [3]. This model mostly retains the top-down assumption but challenges the notion that the neighbourhood is the central unit of sociospatial inequality in dense cities. While Lima’s segregation pattern follows the latter model more closely—highly fragmented at lower scales—it is also geographically and socioeconomically disperse across levels of density [8,9]. I study Lima’s street-blocking infrastructure as a form of micro-segregation to challenge the top-down assumption in the segregation and micro-segregation scholarship.
Meanwhile, there is inconclusive evidence on the effects of segregation on social capital. A thread of scholarship argues that demographic homogeneity—e.g., segregated neighbourhoods—favours social capital, including civic engagement and social trust [10,11]. In response, others show that segregation fosters bonding ties (i.e., within the neighbourhood), particularly among privileged groups, while curtailing bridging ties (i.e., beyond the neighbourhood) among underprivileged ones [12,13,14]. The relationship is less clear at lower scales. Studies on segregation in Latin America hypothesize that urban fragmentation (e.g., street-level residential enclosures) leads to social disintegration [8,15,16,17]. I present evidence of (micro-)segregating infrastructure’s mixed effects on social capital independently of living inside physically segregated spaces at different scales.
This study addresses the relationship between residential micro-segregation and social capital, in the form of built barriers to urban mobility, in two steps. First, I draw on open data to identify the main socioeconomic and spatial factors associated with micro-segregating infrastructure. I define this type of infrastructure as the disperse barriers (gates, walls, and fences), often built on appropriated public space, that interrupt pedestrian mobility throughout the street network. Operationally, I count the barriers within walking distance from each residential block of the city (N = 99,685). My findings suggest that suburban-inspired street design is positively associated with micro-segregating infrastructure. Additionally, higher socioeconomic status and older urbanization positively predicts more barriers, while socioeconomic diversity and population density have negligible effects.
Second, I use 10 waves of the Lima Cómo Vamos survey (2010–2019) on urban issues (N = 12,000 per year) to assess the impact of higher environmental exposure to barriers on social capital. The relationship between barriers and social capital is not necessarily causal. The correlation between measures of these concepts may respond to underlying dynamics of social differentiation—e.g., racial or class divisions [18]. I explore the causal effect of barriers on social capital based on theoretical and empirical considerations. Theoretically, I suggest that micro-segregating barriers built on public spaces convey meanings of fear and exclusion that not only amplify existing forms of social fragmentation but bound the sense of belonging to narrow (and spatially close) communities. Empirically, most existing barriers in Lima were built between the late 1990s and early 2000s, while the survey data were collected in the 2010s [19]. Respondents had been living in a fragmented city for about a decade at the time of first survey. My multilevel models provide preliminary evidence of this causal relationship, considering the coarse spatial aggregation of the data. Individuals are nested within their districts of residence (43 districts in total), the smallest geographic unit available. My results provide evidence that otherwise comparable individuals living in areas with more barriers are less likely to participate in civic actions (e.g., volunteering in neighbourhood organizations) but more likely to trust their neighbours.
My contributions to the existing research on residential segregation include challenging some long-held assumptions and expanding its methodological toolkit. I build on micro-segregation scholarship to highlight the role of the street level for segregation patterns in the U.S. and Latin America [8,16,20,21,22,23]. Specifically, I draw on the notion of horizontal micro-segregation to outline the fragmentation of the urban landscape resulting from resident-driven street enclosures within and across neighbourhoods, and throughout the socioeconomic spectrum. This form of micro-segregation drives attention to the spatial conditions (e.g., street design) that facilitate small-scale enclosures beyond traditional gated communities.
Methodologically, I leverage access to open software tools for spatial analysis (Python 3.10 and R 4.3.1), large spatial datasets (OpenStreetMap), and census and survey data (Lima Cómo Vamos) to study segregation and its implications at the city block and individual scales. Systematic work on street-level segregation may involve labour-intensive fieldwork or the manual coding of aerial photographs [15,20]. However, recent scholarship has shown the possibilities of fine-grained geolocated data to uncover overlooked segregation patterns [21,22,23,24]. I follow this line of work, providing a template (and reproducible code) for collecting and analysing spatial data using open software, and combining it with traditional sociodemographic and survey data.
More broadly, this paper contributes to understanding the relationship between residential segregation and social capital at the micro scale. My approach conceptualizes the street continuum as a relatively malleable public space. Despite the limitations of coarsely geolocated survey data, I provide preliminary evidence that exposure to (micro-)segregating infrastructure negatively affects civic engagement while promoting in-group trust regardless of which side of the fence people live on. In other words, spatial fragmentation may create or reinforce social boundaries across the socioeconomic spectrum.
1.1. The Spatiality of Residential (Micro-) Segregation
The literature on residential segregation addresses the spatialization of social inequalities in cities. Several explanations of segregation share three assumptions: (1) segregation is primarily driven by upper-status groups; (2) social groups are well defined, generally by ethnicity, race, or class; and (3) the neighbourhood is the preferred unit of analysis. Scholarship on micro-segregation challenges this last assumption while providing insights into the spatial sorting of groups at lower scales. I draw on the micro-segregation approach to highlight the role of barriers as horizontally segregating infrastructure within and across neighbourhoods where preexisting group boundaries are diffuse.
According to the Anglosphere-focused scholarship, residential segregation entails two interrelated processes: sorting by preferences—i.e., families choosing housing in a free market—and sorting by restrictions—i.e., limitations upon lower-status families’ choices. On the one hand, families are attracted to neighbourhoods with similar demographic compositions [25], and in proximity to regular destinations such as work, school, and previous social networks [26]. On the other hand, developers, authorities, and civil associations use an array of financial, legal, and physical mechanisms to limit housing options. While some mechanisms funnel housing demand, others directly restrict access to certain neighbourhoods. Planning policy and regulations, combined with market dynamics, affect demand by making certain areas more or less attractive to different groups. For instance, upper-status families’ housing preferences affect the desirability of neighbourhoods, often leading to planning decisions that concentrate affordable rental homes in the less desirable places [7,27]. Meanwhile, direct measures include zoning ordinances, restrictive covenants, redlining, and physical boundaries. The latter encompass terrain conditions (e.g., rivers), infrastructure (e.g., highways), and barriers (e.g., gates, walls, and fences). Following this model, segregated residential patterns respond not just to families’ purchasing power and locational preferences, but to the restrictions driven by upper-status groups’ interests.
The types and degree of definition of the social groups driving and experiencing segregation vary by region of the world. In North America, whiter and wealthier groups often target restrictions against minorities, particularly Black and Indigenous families [7,28,29,30]. Emphasizing defined groups, however, often leads to omitting complex racial dynamics within and across “races” in the U.S. and beyond [31,32,33,34]. Scholarship from other regions of the world shows that segregation patterns predominantly follow class differences, although frequently intertwined with racial and ethnic ones [3,35]. The physical separation of groups, especially when they incorporate barriers to mobility, can fixate social boundaries in contexts where social differentiation is rather blurry and porous in everyday life [18].
The standard approach to the empirical study of segregation uses the neighbourhood as the unit of analysis (with the census tract or zip code as the unit of observation) and variations in the dissimilarity index as its metric. This attention to neighbourhoods responds both to substantive—the meanings people attach to where they live [6,36,37]—and practical reasons—the availability of georeferenced demographic data [23]. However, this approach is limited to accounting for spatial dynamics within and across neighbourhoods. First, the dissimilarity index ignores the spatial sorting of groups in relation to one another—the checkerboard problem [38]. Second, census tracts are administrative units that omit the effect of the arbitrary selection of boundaries on their internal demographic composition—the modifiable areal unit problem (MAUP) [39]. The result is that certain neighbourhoods may appear to be socially mixed when, in fact, they are segregated at the scale of the street or even the residential building.
Micro-segregation scholarship has developed conceptual and methodological tools to study the spatial organization of social groups at low scales, such as the residential tower and the street segment [3,22]. A thread of this line of work stems from analysing sociospatial hierarchies in dense and densifying cities, primarily in Europe and parts of East Asia and Latin America. In these contexts, micro-segregation is often vertical—namely, the altitude of residence is associated with social hierarchy as in Paris’ Haussmann-style buildings [40]. Horizontal micro-segregation is more common in the less dense North American context. For instance, Grigoryeva and Ruef [21] show that southern cities in the late nineteenth-century U.S. displayed a “backyard” pattern of segregation, where Black families were relegated to alleys while White ones controlled the front streets. Others have shown that residential sorting is more consistent at the level of the street segment rather than the census tract [22]. These studies generally retain the assumption that patterns of micro-segregation are top-down processes involving defined social groups (by class, ethnicity, or race), although some suggest less hierarchical dynamics involving conservative religious groups [41].
Methodologically, micro-segregation research leverages fine-grained qualitative and quantitative approaches. Case studies reveal patterns of social differentiation in buildings that respond not only to vertical hierarchies but to interactions with suitable housing quality, type of tenancy, and local policy, among other factors, as Meyer and Pfirsch show for central Marseille [42]. Others leverage fine-grained quantitative data to show that attention to the spatial configuration within and across neighbourhoods uncovers subtle patterns of horizontal micro-segregation [21,22,24].
I use the case of Lima to question three widespread assumptions about the causes of residential (micro-)segregation. First, both the segregation and micro-segregation models assume well-defined upper-status groups actively separating themselves from lower-status ones, and passively relegating the latter to less attractive areas. If this holds, at the horizontal level (micro-)segregating infrastructure should surround upper-strata families wherever they are near lower-strata ones. Instead, I argue that barriers are widely distributed across the socioeconomic spectrum and are not a particularity of dense, diverse, or segregated places in Lima. I suggest that urban design and growth play a key role in facilitating the erection of segregating infrastructure. Second, I bring attention to the discontinuities in the pedestrian road network around each block of the city to account for barriers within and beyond administrative units of spatial aggregation. Third, my approach builds on the micro-segregation tradition to escape the limitations of using neighbourhoods as units of analysis.
1.2. Segregation and Social Capital
In the dominant approaches outlined above, both macro and micro forms of spatial segregation express pre-existing social boundaries. Here, I examine the relationship between the two phenomena in the opposite direction, i.e., whether segregation expands social fragmentation. I use social capital as an approximation of social integration. Drawing on prior scholarship, I suggest that proximity to micro-segregating infrastructure has a negative effect on outwardly oriented social capital, and a positive effect on its inwardly oriented form. In other words, when the built environment favours segmentation over continuity, social fractures deepen and ties with those in the immediate surroundings (e.g., neighbours) become stronger.
Social capital provides insights into the degree of integration of communities in large urban areas. Definitions of social capital vary widely [43]. A common element in these definitions is that the concept alludes to the resources available to individuals through their interpersonal networks [44,45,46,47]. The ties in these networks can be either bonding (e.g., friendships) or bridging (e.g., acquaintances). Both types are important as the former are indicative of supportive communities—inward social capital—while the latter create exchange opportunities across them—outward social capital [26,48]. Besides networks, scholars since Putnam [49] measure social capital using dimensions, including civic engagement (e.g., participation in collective action or voluntary associations) and interpersonal trust. I follow Putnam’s social capital tradition as the dimensions he identifies are instrumental to studies assessing the impact of segregation on social capital [50,51].
Researchers debate to what extent segregated communities have a negative impact on social capital. Some argue that demographic heterogeneity is part of the problem [10,11]. This position suggests that certain forms of segregation that preserve homogeneity benefit stronger communities. By contrast, others show that the negative effects of diversity vary by social group and type of social capital [13,14]. Segregation can have a positive effect on bonding social capital among upper-status groups, like the homeowners of a planned neighbourhood who actively seek to preserve land value [12]. However, segregation also limits bridging social capital across the socioeconomic spectrum [50,52]. These findings echo urban scholars who, for decades, have argued that neighbourhoods disconnected from the city’s fabric are prone to social isolation [5,53].
Research on Latin America and elsewhere in the Global South zooms into the interaction between segregation and social capital at smaller scales. Urbanization has pushed the rich and the poor closer together in Latin America, the world’s most unequal region [54]. While Latin American cities have grown vertically in the last three decades, residential buildings are generally homogeneous—although, social differentiation does occur within them between, for instance, old and new middle classes [55]. The result is a dominant pattern of horizontal segregation characterized by the proliferation of “fortified enclaves” among upper- and middle-income (and whiter) groups that sharply contrast with deprived neighbouring communities [16,56]. These enclaves vary in size and format ranging from planned gated communities (e.g., in Mexico City) to small residential developments and subsequently enclosed street segments (e.g., in Lima and Bogota) [8,15].
The points of contention in this tradition are whether walls and fences impede social interaction, and whether these barriers foster social capital within them. Ethnographic studies on Santiago de Chile suggest, at small scales (e.g., residential enclaves), that segregation favours interaction across previously disconnected social groups but does not strengthen social capital within them [17,57]. From this perspective, gates, walls, and fences structure social contact. For instance, fortified enclaves are often built near disadvantaged areas—e.g., former peasant communities on the outskirts of growing cities. Proximity to wealthy enclaves provides lower-income people access to job opportunities in services such as housekeeping, gardening, and security. By contrast, Garrido [18] sees these barriers as expressions of hardened class boundaries in the case of Manila. Interactions that occur across social groups reinforce class identities. Within street-level residential enclaves in Lima, Plöger [8] finds that erecting barriers is a collective action that often does not translate into tighter communities. The maintenance of barriers and other security devices is often a contentious issue among neighbours. Overall, these studies present limited and mixed evidence on segregation’s impact on social disintegration across places while agreeing on its limited positive impact on local social capital.
I test these propositions by paying attention to the spatial configuration of pedestrian streets. The notion of micro-segregation highlights how the built environment restricts random encounters in its everyday use [52,58]. My focus on micro-segregating infrastructure drives attention to disperse patterns of barriers to mobility. Like the walls or fences surrounding gated communities, micro-segregating barriers symbolize exclusivity and private security measures often on appropriated public spaces [8]. However, micro-segregating barriers are more permeable than the traditional ones (e.g., some gates are closed solely during the night), thus the boundaries they establish between inside and outside spaces are less defined.
My approach takes the city’s network of streets as an uneven although continuous public space [53,59]. Thus, while the street continuum is accessible to anyone in principle, parts of it are less welcoming to certain groups than to others (e.g., wealthy residential streets are often heavily policed, targeting racialized people as potential threats). Both the initial design and subsequent interventions affect the flow of the street network and condition its potential uses. On the one hand, frequent and visible intersections favour widespread public life, while sinuous and discontinuous layouts (e.g., cul-de-sacs) restrict it to residents [60]. On the other hand, subsequent interventions may increase (e.g., new public spaces) or limit (e.g., barriers to pedestrian mobility) the streets’ level of public life.
My argument is twofold: (1) frequent exposure to barriers through living in proximity to them negatively impacts outward social capital regardless of which side of the barriers people live on; and (2) it increases people’s sense of social proximity to their immediate neighbours, which translates into higher inward social capital. I emphasize the impact of spatial configuration and segmentation on social capital formation through random encounters in the street [52]. This approach takes Lima’s pedestrian network as a single public space where social capital is curtailed through spatial segmentation. I elaborate on Lima’s history and segregation patterns below before presenting the study’s hypotheses.
1.3. Lima Cercada: The Fenced City
Lima offers several advantages in terms of the study of micro-segregation, as one of the largest urban areas in Latin America, home to over ten million people. Lima’s segregation pattern escapes dominant views of contemporary urban fragmentation in Latin America [16]. Here, I provide some background and my rationale for selecting Lima as a case study.
Lima is a highly unequal city with a long history of residential segregation. The centre of the current metropolis is the colonial City of Lima, today known as Cercado de Lima, or enclosed Lima. The name originates from the wall that protected the city until the nineteenth century. While the wall’s official purpose was to protect Lima from pirate attacks, it created a symbolic boundary around the White Spanish settlers [61]. Residential areas reproduced similar symbolic boundaries, with patio houses (“quintas” in Spanish) internally subdivided between masters and servants [62]. Today, lower-status groups inhabit the patio houses of the old city, flattening the social differentiation between the more prestigious street-facing units and the less prestigious inner ones [63]. The wall came down in the late nineteenth century as the city grew, but the segregation patterns remained relatively stable decades later [59].
The twentieth century shaped Lima’s contemporary spatial organization. The city expanded rapidly due to rural–urban migration in the 1940s and 1950s, and through the forced displacement of the rural population during the internal armed conflict of the 1980s and 1990s [64]. Today, Lima Metropolitana—the city’s official name—has 43 districts, each of them with elected municipal authorities. While this study focuses on the city of Lima, its metropolitan area includes the contiguous port city of Callao and its seven districts (see Figure 1).
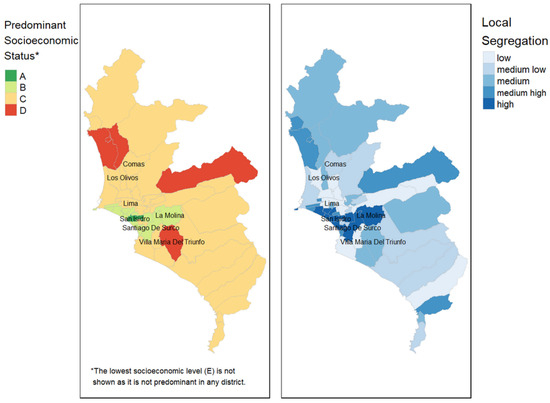
Figure 1.
Left: Map of Lima by predominant (modal) socioeconomic (SES) level, where A is the highest and E the lowest. The lowest SES level, E, is not shown on the map as it is not the mode in any of the city’s districts. The SES levels are calculated by the Peruvian National Institute of Statistics and Informatics based on household income. For reference, the percentages of dwellings per SES at the city level are A = 5.1, B = 19.7, C = 40.3, D = 25.9, E = 9.0. Right: Map of Lima by level local segregation. Darker colours indicate higher segregation within the district by comparison with the city.
The mid-century settlement patterns combine planned formal housing (including social housing) with informal settlements or barriadas. In broad strokes, the upper and middle classes settled in planned developments in the near south and southeast of the historic centre. Earlier developments followed traditional grid designs (e.g., Lince and San Isidro), while more recent ones follow suburban-inspired sinuous patterns (e.g., La Molina and San Borja), although with higher density than in North America [65]. Meanwhile, the lower classes occupied former agricultural and desertic areas in the north, northeast, and south. Settlements in these areas vary in levels of planning and design, with some (less planned) following traditional grids (e.g., San Martín de Porres), others more sinuous designs (e.g., Los Olivos), and one following pedestrian-oriented superblocks (Villa El Salvador) [63]. See Figure 2 for illustrations of these settlement’s street layouts.

Figure 2.
Examples of urban grids in three districts of Lima (Lince, Los Olivos, and San Borja) at 1 square kilometre. Lince was urbanized in the early twentieth century, while Los Olivos and San Borja between the 1960s and 1980s. The plots are organized left to right by levels of circuity average. I explain this variable in Section 2; in sum, it indicates the sinuosity of the street layouts. Part of my argument below is that more sinuous layouts (e.g., San Borja) facilitate the construction of micro-segregating infrastructure.
The twentieth century’s settlement processes have shaped Lima’s horizontal segregation patterns. At the city level, districts in southern-central Lima are generally wealthy (e.g., Miraflores and San Isidro), others in the north and southeast are generally disadvantaged (e.g., Comas and Villa El Salvador), while eastern Lima has a combination of both (e.g., Ate Vitarte and La Molina) (see Figure 1). Eastern Lima is where some of the most visible forms of segregation take place, like a 10 km long wall separating La Molina and Santiago de Surco (wealthy) from San Juan de Miraflores and Villa María del Triunfo (poor) [59,66].
At the neighbourhood level, Lima’s horizontal segregation is marked by the abundance of subsequent residential enclosures mostly built between the 1990s and the early 2000s [19]. These enclosures generally encompass a few blocks within a residential neighbourhood and share three attributes. First, local associations promote and process applications to build the barriers that create the enclosures. While, in some districts, enclosures have construction permits, these are often approved after the barriers are in place. Second, enclosures are a widespread private security measure against perceived threats (e.g., burglaries and hooliganism). Other measures vary depending on the associations’ resources and can include private guards (in lower-income areas, guards often live within or near the enclosure), security cameras, and codes of conduct restricting activities (e.g., parties) in the street. Third, the collective action involved in erecting the barriers often fades over time. This leads to fences and gates becoming permanently open or closed, and to residents within certain enclosures to build fences around a more limited number of blocks; often a short street segment (see illustrations in Figure 3) [8].

Figure 3.
Examples of segregation barriers in Lima. Left: lift gate and security booth at the entrance of a gated community in the affluent district of La Molina. Right: closed swing fence with open pedestrian access in a lower-stratum residential neighbourhood in the San Martín de Porres district. Source: Google Street View.
The characteristics of these subsequent residential enclosures pose challenges for the study of Lima’s horizontal micro-segregation. Physical barriers vary in size and porosity, often creating a nested structure of enclosures that pedestrians and vehicles must navigate. This form of fragmentation of the urban fabric differs from other large Latin American cities, like Mexico or Sao Paulo, where gated communities abound. Other cities like Bogota and Rio de Janeiro feature similar enclosures but these are not as widespread [16]. This study aims to contribute to prior efforts to identify the conditions that have facilitated the proliferation of barriers in Lima, and the impact these barriers have on social (dis)integration.
1.4. Hypotheses and Empirical Predictions
In the next sections, I empirically test two theoretical propositions:
Hypothesis 1.
Urban design (e.g., discontinuous street layout) facilitates residential micro-segregation. This relationship holds across socioeconomic groups and levels of density and is heightened in periods of rapid urban growth.
Empirically, this proposition suggests that barriers to mobility such as gates, walls, and fences are widespread across the city regardless of the socioeconomic status of the area. Moreover, proximity to barriers should be associated with sinuous street layouts evocative of suburban design, and with areas urbanized before the rapid growth of the 1990s. In a context of high inequality and weak institutional responses to crime, rapid urban growth, particularly when associated with lower-status groups (e.g., Indigenous rural immigrants), heightens the insecurity discourses used to justify the erection of barriers.
Hypothesis 2.
Residential micro-segregation negatively affects bridging social capital, such as civic engagement, while it fosters bonding social capital among individuals in otherwise similar social positions.
Empirically, this suggests that people living in places where micro-segregation is more pervasive should show lower levels of civic engagement, including participation in activities such as signing petitions or attending demonstrations. By contrast, higher exposure to barriers in the environment increases the sense of proximity to neighbours as reflected in higher trust towards them. Exposure presupposes that barriers predate the measures of social capital. These predictions should hold upon accounting for several other factors affecting social capital and commonly used as rationales for erecting barriers, including crime victimization and perceptions of safety.
2. Data
I use two types of data in this study: block-level socioeconomic and spatial information, and individual-level surveys. The main source of spatial data is OpenStreetMap (OSM), a volunteer-led open access map of the entire world (www.openstreetmap.org, accessed on 28 March 2023). I also use geotagged images hosted in Mapillary (www.mapillary.com, accessed on 31 March 2023) for missing data points, socioeconomic census data (2017) from the Peruvian National Institute for Statistics and Informatics (INEI) (http://arcgis.inei.gob.pe:6080/arcgis/rest/services/, accessed on 26 September 2022), and epoch of urbanization data from the European Commission’s Global Human Settlement (GHS-SMOD) data repository (https://ghsl.jrc.ec.europa.eu/ghs_smod2019.php, accessed on 5 May 2023). At the individual level, I use Lima Cómo Vamos’ (LCV) 2010–2019 survey data (https://www.limacomovamos.org/data/, accessed 19 January 2023). LCV is a nonprofit organization aimed at improving urban policy through evidence. They conduct an annual survey of about 1200 respondents. While the respondents’ precise locations are protected, they are georeferenced at the district level.
2.1. Data Collection and Processing
I collected the blocks database in three main steps. First, I added not previously mapped barriers to the OSM platform. This is a way to reduce OSM’s coverage bias. OSM requires contributors to provide open-source visual support to the new features they add. For instance, to map a new school, contributors may use satellite images or geolocated photographs—excluding Street View and similar proprietary platforms. OSM contributors often use Mapillary to host crowdsourced geolocated photographs. However, Mapillary’s coverage is unevenly distributed: while most thoroughfares are densely photographed, many residential segments are not. Moreover, the quality of photographs is often poor, so barriers are difficult to spot.
With the support of two research assistants and a Lima-based OSM contributor, I mapped missing barriers in nine districts that represent 38 percent of the city’s population: Comas, Carabayllo, Los Olivos (north), La Molina, San Juan de Lurigancho (east), Santiago de Surco, Villa El Salvador, Villa María del Triunfo (south), and San Miguel (west-central). I selected these districts as prior studies have included them as having some of the highest concentrations of residential enclaves [8]. The mapping used existing Mapillary images as support and Street View for verification. In one case, for San Juan de Lurigancho (the city’s most populated district), I completed the mapping by uploading photographs to Mapillary directly. I used this sample of districts as a standard of accuracy to support my analyses of the entire city.
Second, I counted the barriers within a 1 km walking distance from each residential block in Lima (N = 99,685). My main interest was the barriers that interrupt the flow of the street network. Therefore, the barriers I included are gates (e.g., swing gates), walls, and fences. These barriers are usually located at the intersections of two or more street segments and at least one of them is residential. I used a Python script to pull the data from OSM (using the ‘osmnx’ package [67]) and process it (using ‘geopandas’ [68]). The script ran for 20 days in the SciNet supercomputers. Below is a step-by-step summary of the script that produced the data (see Supplementary Materials for additional details). The script:
- (1)
- Creates a map of the entire city as a pedestrian network where the edges are continuous street segments, while the nodes are intersections of three or more street segments;
- (2)
- Separately, pulls all the barriers (gates, walls, and fences) previously mapped into OSM;
- (3)
- Creates a pedestrian network at 1 km network distance around each block of the city by truncating the city-wide network from step 1;
- (4)
- Counts the number of barriers from step 2 that interrupt the flow of the network around each block from step 3 by spatially overlapping the two objects.
In the final step, I added buffers (at 1, 3, 5, and 10 m) around the network to account for variations in street width and to include barriers removed from the street centreline. Wider buffers make it possible to correct for issues inherent to collaborative mapping. For example, a gate may have been mapped as blocking only one sidewalk, whereas, in fact, it blocks both sides and the road. Without a buffer, the network would not intersect with the barrier. At the same time, wider buffers may introduce errors by including barriers outside the street network itself (e.g., by including fences or gates around private property). To prevent bias, I use models with different buffer levels in the analyses below.
Finally, I merged the barrier data with socioeconomic data from INEI and the GHS-SMOD urbanization epoch data at the block level. Ojo Público, a digital news outlet, pre-processed the original INEI data for a feature on urban inequality [69]. For each block, the data include the population disaggregated by socioeconomic status (SES, or NSE in Spanish). The SES is based on income and is estimated combining the 2017 census with the national household survey [70]. There are five SES levels, where “A” is the highest and “E” the lowest. Additionally, I processed the GHS-SMOD data to identify blocks of the city that were categorized as “urban centre” or “dense urban cluster” only after 1990.
For the analysis of social capital, I used ten waves of the LCV survey (2010–2019). These years’ data are harmonized and published online as a single file. The survey’s annual sample size (N = 1200) is representative of the city’s population. Survey respondents are geolocated at the level of their districts of reference. Since districts are broad and uneven units of aggregation (see Figure 1), the individual-level analyses render preliminary evidence in support of my hypotheses. I processed the data using R. From the 12,000 observations, my models use N = 11,429 (civic engagement) and N = 4207 (trust in neighbours).
2.2. Variables of Interest
Three variables of interest correspond with my two hypotheses. For the first one, I use barriers, defined as the count of barriers (gates, walls, and fences) that interrupt the pedestrian network around each block of the city at a 1 km distance. Since I obtained the count using buffers around the network, I include five models corresponding each of those buffers (in metres from the network’s centreline): 0 (no buffer), 1, 3, 5, and 10.
For the second hypothesis, I use civic engagement and trust in neighbours. I operationalize civic engagement as an indicator of whether the respondent had partaken in any of the following activities in the past 12 months: signing a petition, contacting media outlets regarding local issues, serving in a neighbourhood organization, engaging in participatory budget, volunteering, and demonstrating (sittings and marches). Around 19 percent of respondents across all years answered positively. The measure of trust in neighbours comes from a five-point scale question included in the LCV survey between 2010 and 2014. I recoded the original scale so that 0 is the lowest value and 4 is the highest. The average trust in neighbours is 1.76 (SD = 1.07).
3. Methodology and Methods
My methodology involves using open-source free software to explore fine-grained micro-segregation and social capital data through regression models. This approach offers three main advantages. First, fine-grained geolocated quantitative data facilitate comparisons between places with similar physical and sociodemographic characteristics [71]. While qualitative studies provide richer accounts of the processes that affect segregation and social capital, they pose challenges for conducting broader comparisons. Second, using open software and data facilitates the reproducibility of my methods in different contexts. For instance, OpenStreetMap has worldwide coverage, while the Cómo Vamos surveys are regularly conducted in several Latin American cities. Third, regression models using either complete or large and representative datasets provide reliable evidence of the statistical relationship between variables. My preliminary quantitative evidence may guide future ethnographic work that zooms into how people experience segregation in relation to social integration [72].
I tested Hypothesis 1 in two steps. First, I explored the distribution of barriers accounting for the predominant (modal) socioeconomic status of each block. Second, I fitted negative binomial regression models predicting the count of barriers within a 1 km pedestrian distance from each block in the city at different buffer levels. The use of negative binomial models responds to three conditions: (1) barriers are count variables, (2) their distributions are heavily skewed, and (3) they show overdispersion (thus discarding Poisson regression) [73]. I transformed the estimated coefficients into incidence rate ratios and provided prediction plots for easier interpretation. Equation (1) represents the models.
Here, represents the dependent variable at different buffer levels. On the right, I included the spatial and socioeconomic predictors of interest. Circuity average indicates the mean ratio of network distances to straight-line distances from each point in a network [74]. The circuity between any two points in a network (A and B) is 1 when the distance between them is a straight line. A higher value like 1.5 indicates that the distance from point A and B in the network is 50 percent longer than the straight line between them. The second term indicates the number of intersections in the pedestrian network around each block. An intersection is defined as the convergence of three or more street segments. Barriers to mobility are mostly erected on intersections in residential areas. The count of intersections allows to isolate the effect of circuity on barriers regardless of the opportunities for barriers in a network. Thus, I also included an interaction term between both variables. The variable on density indicates the population per area at the block level. The fourth spatial variable of interest is the age of urbanization, operationalized as a dummy variable indicating blocks urbanized between 1990 and 2020.
The socioeconomic variables of interest are the predominant SES level of each block as a factor, with , the highest level, as the reference value, and the local segregation score. Local segregation is defined as the comparison in socioeconomic composition between each block and the district in which it is embedded. Higher values indicate that the block is more segregated (i.e., more unique), while lower values indicate its distribution is similar to the district’s [75].
My estimation approach for Hypothesis 2 involves multilevel models with random intercepts. The first variable of interest, civic engagement, is a dichotomous indicator. Thus, I used multilevel logistic regression models (see Equation (2)).
Here, is the probability that the respondent i in district j participated in any civic engagement activity in the past year. Additionally, is the intercept, is a vector of the individual-level covariates, and is the district-level barriers component. One of its elements, , is the main statistic to estimate as it represents the effect of barriers on civic engagement, accounting for other individual-level factors. I defined the barriers variable as the mean count of barriers within a 1 km pedestrian network distance of all the blocks in a district. The buffer around the network is 3 metres, although the results hold for other buffers as well.
The individual-level variables in include several factors usually associated with civic engagement, including socioeconomic status1, age, gender, living for over ten years in the city (old timer), whether the respondent works outside the home, and their main form of transportation (driving or taxi versus others). I incorporated measures of perception of safety and prior crime victimization, as research shows that the latter increases political engagement [76]. As controls, I considered the year of the survey, district-level local segregation scores, and the proportion of blocks urbanized after 1990. I report one additional model including two cross-level interaction terms to account for the potential enhancing effects of victimization and being an old timer on barriers.
Finally, I modelled trust in neighbours using multilevel linear regression models. These models have a similar specification to the civic engagement ones. See Equation (3) below.
Besides the different link functions, the models differ slightly in the individual-level predictors they use. I accounted for lower education and whether the respondent has dependents under 15 years of age. This is possible given the additional variables available for the 2010–2014 period discontinued in later waves. I report a model with two cross-level interaction terms to assess how neighbourhood safety and living longer in the city affect barriers as a predictor.
4. Findings
4.1. Barriers and the Role of Design
The proximity to barriers is widespread in Lima across socioeconomic groups. Table 1 shows that there are generally more fences around higher-status groups, particularly A and B. However, there is high variation even within socioeconomic levels, and the average number of fences around medium-low groups (C and D) remains relatively high. For instance, there are about 23 barriers at 3 m buffer of the pedestrian network for the C socioeconomic level, which is closer to the 32 around the A-level than to the 6 around the E-level blocks. Visual exploratory analysis suggests similar patterns (Figure 4): namely, that while fences are more prominent among higher-status groups, they surround blocks across the socioeconomic spectrum.

Table 1.
Mean and standard deviation of the count of barriers at different buffers by predominant socioeconomic status of the block.
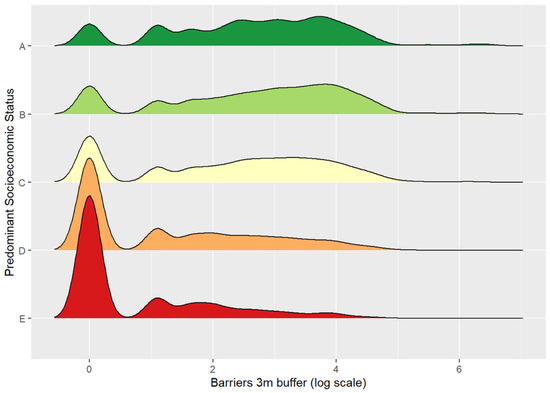
Figure 4.
Ridgeline density plots of barriers (3 m buffer) by SES. Each density curve represents the estimated (smoothed) distribution of barriers around blocks grouped by predominant SES. The data are logged using to facilitate visual comparisons.
Furthermore, the distribution of barriers is relatively even across levels of segregation. I calculated five levels of segregation using kmeans clustering on local segregation scores. The clustering method, kmeans, produces relatively homogeneous groups for better comparisons. Figure 5 provides visual evidence that there are nearly the same number of barriers around very segregated and very integrated blocks. In fact, highly segregated places do not appear to have the most barriers around them. This finding indicates that barriers appear to be more common where people from different socioeconomic backgrounds are in closer proximity to one another.

Figure 5.
Ridgeline density plots of barriers (3 m buffer) by local segregation score. Given that local segregation is a continuous variable, the levels of segregation are calculated through kmeans clustering. Each density curve represents the estimated (smoothed) distribution of barriers around blocks grouped by level of segregation. The data are logged using to facilitate visual comparisons.
The negative binomial models indicate that, in addition to socioeconomic status, the variation in barriers responds to features of the urban design. In Figure 6, I show the models predicting barriers at different buffers around the 1 km pedestrian network from the block. The model coefficients are displayed as standardized incidence rate ratios.
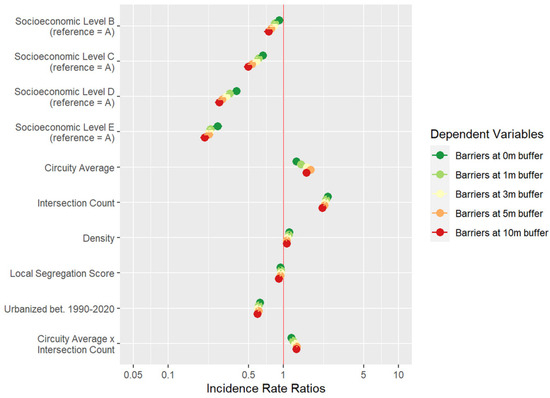
Figure 6.
Plot of negative binomial models predicting the count of barriers at different buffer levels. The vertical red line indicates whether the estimated effects are negative (left) or positive (right). The estimated effects are not statistically significant if their confidence intervals intersect the vertical red line.
The model plots in Figure 6 offer three key insights in support of Hypothesis 1. The first is that some of the largest effects are related to the predominant socioeconomic status of each block, particularly among the lower groups by comparison with the highest one (A is the reference level). However, the effect of local segregation is negative and significant but small. This supports the proposition that barriers are pervasive and not unique to highly segregated places. In fact, less socioeconomically segregated blocks tend to have more barriers around them, as suggested in Figure 5. Density at the block level has a positive and significant effect although comparatively small, indicating that denser areas are more prone to barrier construction.
Second, the effects of urban design are positive, relatively large, and statistically significant. Thus, places with more intersections and a higher circuity average are more likely to have more barriers around them. Moreover, the effect of circuity is enhanced by the number of intersections in the network. Figure 7 is a prediction plot summarizing the effects of three of the variables of interest in the models. The three subplots correspond to different levels of circuity average, from low (left) to high (right). In each plot, we see the relationship between intersections and the count of barriers (at a 3 m buffer) for each of the five SES levels. This plot shows that higher levels of circuity and intersections correspond with growing counts of barriers for all SES levels, particularly the highest ones (A and B). Intersections and circuity are both conditioned by planning decisions, regulations, and terrain conditions. This finding suggests that residential areas that combine both factors may facilitate the subsequent enclosure of streets upon perceived threats regardless of the socioeconomic status or level of segregation of each block. The threats may come, for instance, from rapid urban growth in the surroundings. This might explain that barriers are more frequent around established blocks of the city, i.e., urbanized before 1990.
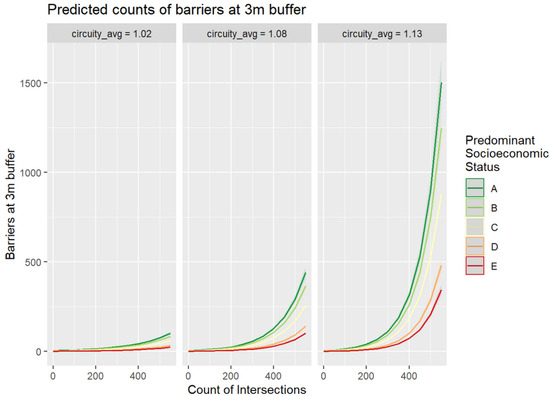
Figure 7.
Predicted counts of barriers at a 3 m buffer by different levels of circuity average, counts of intersections, and SES levels.
A third aspect worth noting is that the five models provide similar results. This suggests that the patters I have identified are consistent regardless of the potential biases introduced through collecting the data using different buffers. Additionally, I conducted sensitivity analyses using subsamples of the data. For instance, I selected La Molina (high SES), San Miguel (medium SES), and San Juan de Lurigancho (low SES). These districts are both theoretically relevant and have the mostly complete data. The results remain fairly similar to those using the complete dataset.
Overall, I have found support for my first hypothesis. The evidence suggests that barriers such as gates, walls, and fences are present across levels of segregation, although with pronounced variations regarding the predominant socioeconomic status of each block. The models that account for these factors also suggest that urban design plays a significant role in creating opportunities for erecting subsequent segregating infrastructure. Thus, the circuity average and the intersections in the network around each block are important predictors of the number of barriers, while the age of urbanization indicates that established neighbourhoods are more likely to erect barriers than newer ones.
4.2. Proximity to Barriers and Social Capital
My analyses provide preliminary evidence of the effects of micro-segregation on social integration. Residents living in districts with higher exposure to barriers are less likely to participate in civic engagement while reporting higher trust in their neighbours. I elaborate these findings in two steps. First, I explore the variables of interest with an emphasis on their variation across districts. Second, I present the multilevel models’ results highlighting some of their most important insights.
Civic engagement is relatively stable across years and districts. Around 19 percent of respondents to the LCV survey had participated in any form of civic action in the previous 12 months between 2010 and 2019. Figure 8 shows that the variation across districts is low. Upon fitting an intercept-only multilevel model, the intra-class correlation (ICC) is of 0.01, which suggests that around 1 percent of the variance is explained by district-to-district differences. It is worth noting that districts are difficult to compare to one another. They vary a great deal in size and population—e.g., their sizes range from 3 (Lince) to 347 (Carabayllo) square kilometres, and their population from 7 thousand (Punta Negra) to over 1 million (San Juan de Lurigancho)2. However, districts are the smallest geographic unit at which socioeconomic and survey data are often aggregated in Peru. Thus, my findings are mostly exploratory.
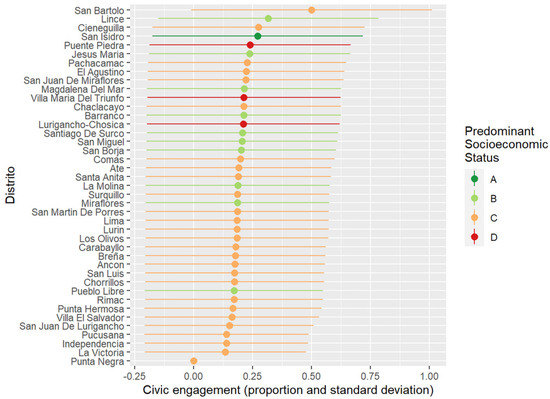
Figure 8.
Civic engagement by district grouped by predominant SES.
Even accounting for this limitation, the logistic regression models suggest that civic engagement is lower among respondents in districts with higher exposure to barriers (see Figure 9). Thus, an increase of one standard deviation unit in the district average of barriers per block reduces the odds of a respondent engaging in civic activities by 9.5 percent (standard error of 3.4 percent). None of the other district-level variables in the model (local segregation and proportion of recently urbanized blocks) have significant effects. At the individual level, lower socioeconomic status, and negative perceptions of safety in the city at large generally decrease the likelihood of civic engagement. Conversely, factors associated with a higher likelihood of civic participation include age, victimization, living longer in the city, and perceiving one’s neighbourhood as safe, which confirms prior research [51,76]. It is worth noting that the cross-level interaction between victimization and barriers did not render a significant effect, while the interaction between being an old timer and barriers is positive although small. Therefore, the negative effect of barriers on civic engagement is accentuated among those more recently living in the city. This may be indicative of respondents being less willing to partake in collective action due to living surrounded by barriers but having had no voice in the decision-making process to build them.
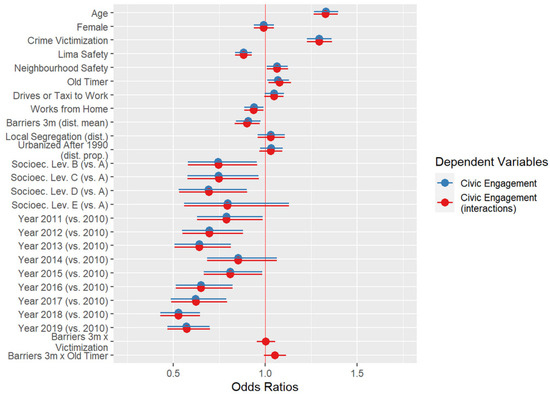
Figure 9.
Multilevel logistic regression models predicting civic engagement. The vertical red line indicates whether the estimated effects are negative (left) or positive (right). The estimated effects are not statistically significant if their confidence intervals intersect the vertical red line.
Regarding my second measure of social capital, respondents in districts with more fences around their blocks generally show more trust towards their neighbours. The distribution of this variable follows an approximately normal distribution, with a mean of 1.76 and a standard deviation of 1.07 (scale from 0 to 4). More importantly, there is more variability in responses by district. Figure 10 suggests that districts with predominantly higher status residents tend to report more trust in their neighbours compared to lower status ones. The ICC is 0.04, higher than in the civic engagement case, confirming the observed district-to-district variability in Figure 10. The level of variability is remarkable considering the heterogeneity in district size and population.
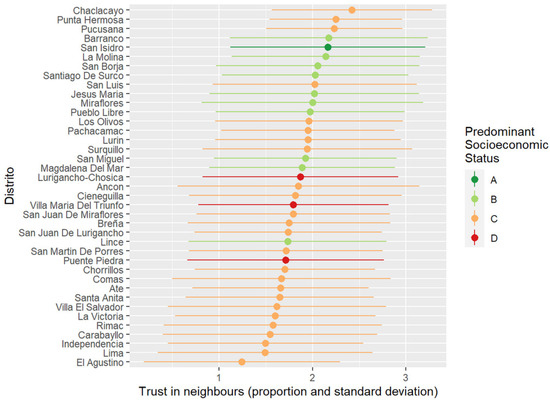
Figure 10.
Trust in neighbours by district grouped by predominant SES.
The multilevel models in Figure 11 show that part of the district-level variation corresponds with the role of proximity to barriers. An increase in one standard deviation unit in the mean barriers per block in a district increases trust in neighbours by 0.04 standard deviation units (standard error of 0.27). While the effect is small, it remains statistically significant upon controlling for several other factors with a known influence on trust. For instance, trust decreases among lower socioeconomic groups (confirming the trend in Figure 10), low education, and among females, while it increases with age and positive perceptions of safety in one’s neighbourhood and in the city at large. The interaction term between barriers and neighbourhood safety indicates that higher counts of barriers predict higher trust in neighbours among those who perceive their neighbourhoods as safe, while the relationship reverses for those with lower perceptions of safety. Additionally, trust in neighbours is higher in districts urbanized after 1990. This is consistent with prior research showing the importance of local social capital within newer residential areas, particularly among informal settlements where residents organize to access sanitation, electricity, and other public services [8,61].
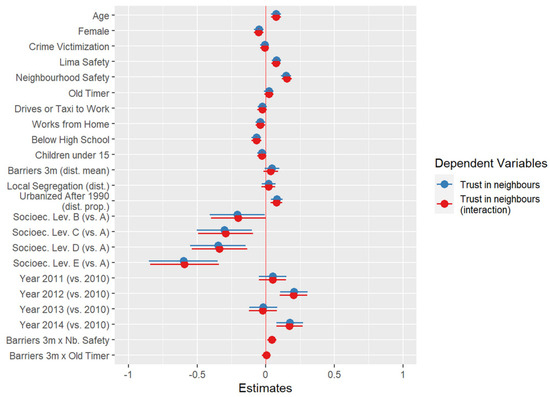
Figure 11.
Multilevel linear regression models predicting trust in neighbours. The vertical red line indicates whether the estimated effects are negative (left) or positive (right). The estimated effects are not statistically significant if their confidence intervals intersect the vertical red line.
Combined, my findings provide preliminary evidence for the hypothesis that micro-segregation has mixed effects on social capital. On the one hand, survey respondents in districts where the presence of barriers is more frequent report lower civic participation. On the other, higher exposure to barriers is associated with higher trust in neighbours. These results are meaningful considering that the models account for several other individual factors, including socioeconomic status, age, gender, crime victimization, and perceptions of safety. Thus, I bring attention to the interplay between built environment and social integration.
5. Discussion
This study’s two main goals connect residential segregation and social integration in opposite directions. The first goal is to challenge some assumptions in the study of the causes of residential (micro-)segregation using recent theoretical and methodological innovations on a fragmented city like Lima. The second is to employ my novel approach to address an old discussion about the effects of segregation on social integration. My findings suggest that fine-grained measures of the built environment offer important insights into contemporary modes of horizontal residential segregation at the scale of the street, and into the extent to which exposure to certain features affects people’s attitudes towards others. Below, I provide an overview of my study’s main contributions, limitations, and implications for future research.
My first hypothesis suggests that horizontal micro-segregation, in the form of barriers to mobility, responds to elements of urban design and other spatial dynamics across socioeconomic groups and levels of segregation. This proposition has three implications for the residential segregation scholarship.
First, I question the dominant view that well-defined higher-status groups drive segregation through direct (e.g., building “fortified enclaves”) and indirect (e.g., funneling affordable housing to deprived areas) measures. This approach obscures the role of middle- and some lower-status groups in the production of segregation. Instead, I provide evidence that barriers are widely distributed across SES levels, while being more present among the higher ones. Additionally, the presence of barriers is slightly more common around more diverse places rather than the more segregated ones. These findings align with prior scholarship on Latin America and elsewhere in the Global South arguing that residential segregation occurs independently of well-defined group boundaries—in fact, segregating infrastructure can physically inscribe them [18,35]. I add that the diffuse presence of micro-segregating infrastructure in Lima—where some fences are permanently closed and others permanently open in the same neighbourhood [8]—shows that boundaries are negotiated across the social ladder. My findings suggest that both social dynamics and spatial attributes interact in the (re)production of micro-segregating infrastructure.
The second implication of the first hypothesis is to highlight the role of scale in segregation analysis. I follow prior scholarship showing the limitations of the neighbourhood (or the gated community) as a unit of analysis [3,20,21,22]. My models highlight the importance of street design and related spatial conditions (circuity and intersections) that allow residents to erect micro-segregating infrastructure. For instance, in Lima, some street segments have fences or gates within previously enclosed areas. Defining discrete units of analysis in scenarios like this posits conceptual and methodological challenges [8,15]. I address them by taking the pedestrian street continuum as a large public space. Thus, I conceptualize barriers as subsequent restrictions on opportunities for random encounters with strangers of different backgrounds [52,58]. Methodologically, I operationalize exposure to barriers using network distances from each block of the city to avoid the pitfalls of bounded census tracts or zip codes as units of observation.
Third, my findings suggest that, combined with other factors, design decisions may have undesired consequences for the spatial articulation of the city [58]. In the case of Lima, mid-twentieth century suburban-inspired residential development design has facilitated the construction of barriers in a context where other conditions coincide, such as limited enforcement of regulations, fear of crime, and inadequate provision of public services (e.g., policing) [8]. Certainly, my findings confirm that the fear-of-crime rhetoric masks discriminatory attitudes towards “the other”, particularly those in lower socioeconomic statuses [56]. My contribution is to bring attention to the spatial conditions that facilitate the segmentation of streets as a response to inequality-infused external threats wherever they may appear.
Through the second hypothesis, I reframe the study of the effects of residential segregation on social capital. My approach explores the effects of exposure to segregating infrastructure on expressions of social capital such as civic engagement and trust in neighbours. Prior research suggests that segregation negatively impacts bridging social capital while fostering its bonding forms within segregated neighbourhoods, at least among privileged groups [12,50]. Others, instead, argue that segregating infrastructure may structure interactions among previously disconnected social strata and has limited impact on inward sentiments of community [17]. These studies draw on comparisons between relatively homogeneous populations living inside and outside enclosed areas. I find preliminary support to the first set of findings adding that the effects of segregating infrastructure are pervasive. Barriers can reduce the likelihood of participating in civic life while increasing our trust in those in closer proximity to us, regardless of which side of the barriers people live.
Lima exemplifies broader patterns of how small-scale segregation emerges and its impact on social integration. The city’s rapid growth, sharp inequality, and diffuse governance structure create conditions for residents to take matters in their own hands upon experiencing external threats. Similar conditions exist in cities around the world where private local governance structures have appeared [12]. Their private security measures can result inconveniences—e.g., restricting access to certain parts of the city—but can also lead to fatal situations like the murder of Trayvon Martin in 2013. I expect my research on micro-segregating infrastructure to bring attention not only to the fear of “others” they express, but to their impact on everyone living around them.
Finally, this study opens avenues for future research addressing the relationship between micro-segregation and social capital across time and space. First, OSM has improved its coverage in recent years, but its data for most Global South cities is limited when it comes to identifying temporal changes. Future studies may leverage other data sources or timestamp a sample of barriers for longitudinal designs. Second, I use public and cross-sectional survey data over multiple years. While I nest respondents within their districts of residence, further research using more precise geolocation may analyse smaller and more consistent spatial units of analysis. Third, my study scratches the surface of how different groups of people make sense of living in micro-segregated places. Subsequent work may use social media discussions and other forms of qualitative data to further explore the meanings of segregating infrastructure in different contexts.
6. Conclusions
Urban communities often build walls and fences against perceived threats. This study shows that street-blocking infrastructure has unexpected impacts on those living within them while perturbing the urban experience of everyone around them. Through the concept of horizontal micro-segregation, I bring attention to barriers as fractures to the largest public space in the city: the street continuum. My analysis sheds light onto the complex dynamics between social and spatial boundaries. In Lima, both upper- and lower-status groups across levels of density contribute fragmentation of the street to different degrees. Using a novel methodological approach, I identify the spatial conditions that allow the emergence of barriers, and explore the latter’s impact on social integration. I focus on the street level to examine the symbolic power of micro-segregating infrastructure on how people relate to their social milieu.
The case of Lima reveals that exposure to barriers limits our willingness to act collectively, while fostering a bounded sense of community with those immediately around us. Contemporary discussions posit social fragmentation at the core of rising political polarization and extremist politics. While these debates account for spatial cleavages, their scope is usually broad (e.g., urban–suburban). Enclosed communities and street segments are a growing trend, especially in Global South cities from Manila to Delhi and Bogota [15,18,77]. Future comparative research could use my template to identify the conditions that enable segregating infrastructure around the world. Policymakers may benefit from tools to prevent further deepening of existing social and spatial fractures in cities.
Supplementary Materials
The following supporting information can be downloaded at: https://fcalderonfigueroa.github.io/land_microsegregation_lima/ and the doi: 10.5281/zenodo.10557420 accessed on 14 January 2024, (e.g., Code, Processed Data, Additional Models with Restricted Data, Prediction Plots, etc.).
Funding
This research received no external funding.
Data Availability Statement
The original contributions presented in the study are included in the article/Supplementary Material, further inquiries can be directed to the corresponding author.
Acknowledgments
This project was enabled in part by support provided by SciNet at the University of Toronto (https://www.scinethpc.ca, accessed on 31 march 2023) and the Digital Research Alliance of Canada (alliancecan.ca, accessed on 31 march 2023). I thank Yang (Christina) Lu, Nelson Qiu, Omar Vega, and Tarik Tavera for their support in collecting the data. I also thank Dan Silver, Luisa Farah Schwartzman, Prentiss Dantzler, Marco Garrido, Mark Fox, Robert Wright, Cheryl Cheung, Thiago Silva, Tyler Bateman, and Diana Barrero for their overall support and guidance, and the anonymous reviewers and academic editors for their generous feedback.
Conflicts of Interest
The author declares no conflict of interest.
Note
| 1 | Polling companies calculate socioeconomic status differently than INEI. Both use the letter system but have different underlying methodologies. For the LCV survey, SES includes income, occupation, dwelling conditions, and access to services. |
| 2 | I omit Santa María del Mar from the analysis. The district is small, with a population of under one thousand, and is mostly composed of beach houses only inhabited in the summer. Surveys generally leave Santa María out of their samples. |
References
- Carothers, T.; O’Donohue, A. Democracies Divided: The Global Challenge of Political Polarization; Brookings Institution Press: Washington, DC, USA, 2019. [Google Scholar]
- Doering, J.; Silver, D.; Taylor, Z. The Spatial Articulation of Urban Political Cleavages: Evidence from Chicago, Toronto, and London. Urban Aff. Rev. 2021, 57, 911–951. [Google Scholar] [CrossRef]
- Maloutas, T.; Karadimitriou, N. Introduction to Vertical Cities: Urban micro-segregation, housing markets and social reproduction. In Vertical Cities; Maloutas, T., Karadimitriou, N., Eds.; Edward Elgar Publishing: Cheltenham, UK, 2022; pp. 1–21. ISBN 9781800886391. [Google Scholar]
- Atkinson, R. Padding the bunker: Strategies of middle class affiliation and the city. Urban Stud. 2006, 43, 819–832. [Google Scholar] [CrossRef]
- Mumford, L. The Neighborhood and the Neighborhood Unit. Town Plan. Rev. 1954, 24, 256–270. [Google Scholar] [CrossRef]
- Galster, G. Making Our Neighborhoods, Making Ourselves; The University of Chicago Press: Chicago, IL, USA, 2019; ISBN 9780226599854. [Google Scholar]
- Massey, D.S.; Denton, N.A. American Apartheid: Segregation and the Making of the Undercla; Harvard University Press: Cambridge, MA, USA, 1993. [Google Scholar]
- Plöger, J. Territory, Local Governance, and Urban Transformation: The Processes of Residential Enclave Building in Lima, Peru. In Decentralized Development in Latin America: Experiences in Local Governance and Local Development; van Lindert, P., Verkoren, O., Eds.; Springer: Berlin/Heidelberg, Germany, 2010; pp. 35–48. [Google Scholar]
- Calderón Cockburn, J. Densificación en altura y mercado inmobiliarioen la ciudad de Lima (Perú) 2007–2017. Rev. Sociol. 2022, 35, 25–51. [Google Scholar]
- Putnam, R.D. E Pluribus Unum: Diversity and Community in the Twenty-First Century the 2006 Johan Skytte Prize Lecture. Scand. Political Stud. 2007, 30, 137–174. [Google Scholar] [CrossRef]
- Alesina, A.F.; La Ferrara, E. Who Trusts Others? J. Public Econ. 2002, 85, 207–234. [Google Scholar] [CrossRef]
- Ruef, M.; Kwon, S.W. Neighborhood associations and social capital. Soc. Forces 2016, 95, 159–190. [Google Scholar] [CrossRef]
- Pearson-Merkowitz, S. The Limits of the Homogeneity Model: Segregation and Civic Engagement in Latino Communities. Am. Politics Res. 2012, 40, 701–736. [Google Scholar] [CrossRef]
- Abascal, M.; Baldassarri, D. Love Thy Neighbor? Ethnoracial Diversity and Trust Reexamined. Am. J. Sociol. 2015, 121, 722–782. Available online: http://www.journals.uchicago.edu/doi/10.1086/683144 (accessed on 1 January 2018). [CrossRef]
- Kostenwein, D. Between walls and fences: How different types of gated communities shape the streets around them. Urban Stud. 2021, 58, 3230–3246. [Google Scholar] [CrossRef]
- Borsdorf, A.; Hidalgo, R. From polarization to fragmentation. Recent changes in Latin American urbanization. In Decentralized Development in Latin America: Experiences in Local Governance and Local Development; van Lindert, P., Verkoren, O., Eds.; Springer: Berlin/Heidelberg, Germany, 2010; pp. 23–34. [Google Scholar] [CrossRef]
- Salcedo, R.; Torres, A. Gated communities in Santiago: Wall or frontier? Int. J. Urban Reg. Res. 2004, 28, 27–44. [Google Scholar] [CrossRef]
- Garrido, M. The Patchwork City: Class, Space, and Politics in Metro Manila; University of Chicago Press: Chicago, IL, USA, 2019. [Google Scholar]
- Plöger, J. The emergence of a “City of Cages” in Lima: Neighbourhood appropriation in the context of rising insecurities. Cybergeo Eur. J. Geogr. 2007. [Google Scholar] [CrossRef]
- Grannis, R. The Importance of Trivial Streets: Residential Streets and Residential Segregation. Am. J. Sociol. 1998, 103, 1530–1564. [Google Scholar] [CrossRef]
- Grigoryeva, A.; Ruef, M. The Historical Demography of Racial Segregation. Am. Sociol. Rev. 2015, 80, 814–842. [Google Scholar] [CrossRef]
- Logan, J.R.; Graziul, C.; Frey, N. Neighborhood formation in St. Louis, 1930. Environ. Plan. B Urban Anal. City Sci. 2018, 45, 1157–1174. [Google Scholar] [CrossRef]
- Roberto, E. The Spatial Proximity and Connectivity Method for Measuring and Analyzing Residential Segregation. Sociol. Methodol. 2018, 48, 182–224. [Google Scholar] [CrossRef]
- Deurloo, M.C.; Musterd, S.; Sleutjes, B.; Slot, J. Co-location of different population categories. Micro-level segregation dynamics: The case of Amsterdam. In Vertical Cities: Micro-Segregation, Social Mix and Urban Housing Markets; Maloutas, T., Karadimitriou, N., Eds.; Edward Elgar Publishing: Cheltenham, UK, 2022; pp. 99–115. [Google Scholar]
- Galster, G. On the Nature of Neighbourhood. Urban Stud. 2001, 38, 2111–2124. [Google Scholar] [CrossRef]
- Sampson, R.J. Great American City: Chicago and the Enduring Neighborhood Effect; The University of Chicago Press: Chicago, IL, USA; London, UK, 2012; ISBN 978-0-226-73456-9. [Google Scholar]
- Bertaud, A. Order without Design: How Markets Shape Cities; The MIT Press: Cambridge, MA, USA, 2018; 413p. [Google Scholar]
- Rothstein, R. The Color of Law: A Forgotten History of How Our Government Segregated America; Liveright: New York, NY, USA, 2017; ISBN 9781631492860. [Google Scholar]
- Walker, R.C. Searching for Aboriginal/indigenous self-determination: Urban citizenship in the Winnipeg low-cost-housing sector, Canada. Environ. Plan. A 2006, 38, 2345–2363. [Google Scholar] [CrossRef]
- Dantzler, P.A. The urban process under racial capitalism: Race, anti-Blackness, and capital accumulation. J. Race Ethn. City 2021, 2, 113–134. [Google Scholar] [CrossRef]
- Brubaker, R. Ethnicity without groups. Eur. J. Sociol. 2002, 43, 163–189. [Google Scholar] [CrossRef]
- Barron, J. Living Life in the Middle? Multiracials, Residential Segregation and the Fate of the US Color-Line. Ph.D. Dissertation, Texas A&M University, College Station, TX, USA, 2013. [Google Scholar]
- Bonilla-Silva, E. From Bi-racial to Tri-racial: Towards a New System of Racial Stratification in the USA. Ethn. Racial Stud. 2004, 27, 931–950. [Google Scholar] [CrossRef]
- Schwartzman, L.F. Colour violence, deadly geographies, and the meanings of “race” in Brazil. Ethn. Racial Stud. 2020, 43, 950–975. [Google Scholar] [CrossRef]
- Aliaga-Linares, L.; Álvarez-Rivadulla, M.J. Segregación Residencial en Bogotá a Través del Tiempo y Diferentes Escalas; Lincoln Institute of Land Policy: Cambridge, MA, USA, 2010. [Google Scholar]
- Talen, E. Neighborhood; Oxford University Press: New York, NY, USA, 2019; ISBN 978-0-19-090749-5. [Google Scholar]
- Suttles, G.D. The Social Construction of Communities; The University of Chicago Press: Chicago, IL, USA; London, UK, 1972; 278p. [Google Scholar]
- White, M.J. The measurement of spatial segregation. Am. J. Sociol. 1983, 88, 1008–1018. [Google Scholar] [CrossRef]
- Wong, D. The Modifiable Areal Unit Problem. In The SAGE Handbook of Spatial Analysis; Fotheringham, A.S., Rogerson, P.A., Eds.; SAGE Publications: Thousand Oaks, CA, USA, 2009; pp. 105–124. ISBN 9781412910828. [Google Scholar]
- White, P. The West European City: A Social Geography; Longman: London, UK, 1984. [Google Scholar]
- Flint, S.; Benenson, I.; Alfasi, N. Between Friends and Strangers: Micro-Segregation in a Haredi Neighborhood in Jerusalem. City Community 2012, 11, 171–197. [Google Scholar] [CrossRef]
- Meyer, A.; Pfirsch, T. Flat by flat: Producing micro-scale social differentiation in an arrival neighbourhood of Marseille. In Vertical Cities: Micro-Segregation, Social Mix and Urban Housing Markets; Maloutas, T., Karadimitriou, N., Eds.; Edward Elgar Publishing: Cheltenham, UK, 2022; pp. 39–56. [Google Scholar]
- Adams, J.; Fitch, K.V. Whose Social Capital?: Citation and Co-citation Patterns of a Fragmented Concept. Socius 2023, 9, 23780231231184770. [Google Scholar] [CrossRef]
- Putnam, R.D. Bowling Alone: The Collapse and Revival of American Community; Simon & Schuster: New York, NY, USA, 2000; ISBN 0684832836. [Google Scholar]
- Portes, A. Social Capital: Its Origins and Applications in Modern Sociology. Annu. Rev. Sociol. 1998, 24, 1–24. [Google Scholar] [CrossRef]
- Coleman, J.S. Foundations of Social Theory; Harvard University Press: Cambridge, MA, USA, 1990. [Google Scholar]
- Bourdieu, P. Le capital social. Actes Rech. Sci. Soc. 1980, 31, 2–3. [Google Scholar] [CrossRef]
- Granovetter, M.S. The Strength of Weak Ties. Am. J. Sociol. 1973, 78, 1360. [Google Scholar] [CrossRef]
- Putnam, R.D. Bowling alone: America’s declining social capital. J. Democr. 1995, 6, 65–78. [Google Scholar] [CrossRef]
- Wichowsky, A. Civic Life in the Divided Metropolis: Social Capital, Collective Action, and Residential Income Segregation. Urban Aff. Rev. 2019, 55, 257–287. [Google Scholar] [CrossRef]
- Whitham, M.M. Community Entitativity and Civic Engagement. City Community 2019, 18, 896–914. [Google Scholar] [CrossRef]
- Small, M.L.; Adler, L. The Role of Space in the Formation of Social Ties. Annu. Rev. Sociol. 2019, 45, 111–132. [Google Scholar] [CrossRef]
- Jacobs, J. The Death and Life of Great American Cities; Vintage Books: New York, NY, USA, 1961; pp. 1–472. [Google Scholar]
- Oxfam International. Latin America Remains the Most Unequal Region in the World [Internet]. Inequality and Essential Services Blog Channel. 2017. Available online: https://blogs.oxfam.org/en/blogs/17-12-18-latin-america-remains-most-unequal-region-world/index.html (accessed on 31 May 2023).
- Pereyra, O. Contemporary Middle Class in Latin America: A Study of San Felipe; Lexington Books: Lanham, MD, USA, 2014. [Google Scholar]
- Caldeira, T.P.R. City of Walls: Crime, Segregation, and Citizenship in São Paulo; University of California Press: Berkeley, CA, USA, 2000; ISBN 9780520221437. [Google Scholar]
- Sabatini, F.; Cáceres, G.; Cerda, J. Segregación residencial en las principales ciudades chilenas: Tendencias de las tres últimas décadas y posibles cursos de acción. EURE 2001, 27, 21–42. [Google Scholar] [CrossRef]
- Hillier, B.; Hanson, J. The Social Logic of Space; Cambridge University Press: Cambridge, UK, 1984; ISBN 0521367840. [Google Scholar]
- Vega Centeno, P. La Desigualdad Invisible: El uso Cotidiano de los Espacios Públicos en la Lima del Siglo XXI. Territorios 2017, 36, 23–46. Available online: http://www.scielo.org.co/scielo.php?script=sci_arttext&pid=S0123-84182017000100002 (accessed on 31 May 2023). [CrossRef]
- Cozens, P.; Hillier, D. The Shape of Things to Come: New Urbanism, the Grid and the Cul-De-Sac. Int. Plan. Stud. 2008, 13, 51–73. [Google Scholar] [CrossRef]
- Ludeña, W. Lima: Poder, centro y centralidad: Del centro nativo al centro neoliberal. EURE 2002, 28, 45–65. [Google Scholar] [CrossRef]
- Borsdorf, A.; Hidalgo, R.; Sánchez, R. A new model of urban development in Latin America: The gated communities and fenced cities in the metropolitan areas of Santiago de Chile and Valparaíso. Cities 2007, 24, 365–378. [Google Scholar] [CrossRef]
- de Córdova, G.F.; Fernández-Maldonado, A.M.; del Pozo, J.M. Recent changes in the patterns of socio-spatial segregation in Metropolitan Lima. Habitat Int. 2016, 54, 28–39. [Google Scholar] [CrossRef]
- Matos Mar, J. Desborde Popular y Crisis del Estado: El Nuevo Rostro del Perú en la Década de 1980; Instituto de Estudios Peruanos: Lima, Peru, 1984; Volume 21. [Google Scholar]
- Ludeña, W. Ciudad y patrones de asentamiento: Estructura urbana y tipologización para el caso de Lima. EURE 2006, 32, 37–59. [Google Scholar] [CrossRef]
- Janetsky, M. Lima’s ‘Wall of Shame’ and the Art of Building Barriers [Internet]. The Atlantic. 2019. Available online: https://www.theatlantic.com/international/archive/2019/09/peru-lima-wall/597085/ (accessed on 23 June 2023).
- Boeing, G. OSMnx: New methods for acquiring, constructing, analyzing, and visualizing complex street networks. Comput. Environ. Urban Syst. 2017, 65, 126–139. Available online: https://www.sciencedirect.com/science/article/pii/S0198971516303970 (accessed on 31 May 2023). [CrossRef]
- Jordahl, K.; den Bossche, J.V.; Fleischmann, M.; Wasserman, J.; McBride, J.; Gerard, J.; Tratner, J.; Perry, M.; Badaracco, A.G.; Farmer, C.; et al. geopandas/geopandas: v0.8.1. 2020. Available online: https://zenodo.org/records/3946761 (accessed on 23 June 2023).
- Huamán, G.; Castro, A.; Tavera, T.; Escobedo, M.D.C.; Seoane, C.; Montes, D. Cartografía de la Desigualdad [Internet]. Ojo Público. 2021. Available online: https://ojo-publico.com/especiales/cartografia-de-la-desigualdad/index.html (accessed on 30 November 2021).
- INEI. Planos Estratificados de Lima Metropolitana a Nivel de Manzanas 2020: Según Ingreso per Cápita del Hogar [Internet]. Lima. 2020. Available online: https://www.inei.gob.pe/media/MenuRecursivo/publicaciones_digitales/Est/Lib1744/libro.pdf (accessed on 15 April 2023).
- Arribas-Bel, D. Accidental, open and everywhere: Emerging data sources for the understanding of cities. Appl. Geogr. 2014, 49, 45–53. [Google Scholar] [CrossRef]
- Small, M.L.; Manduca, R.A.; Johnston, W.R. Ethnography, Neighborhood Effects, and the Rising Heterogeneity of Poor Neighborhoods across Cities. City Community 2018, 17, 565–589. [Google Scholar] [CrossRef]
- Roback, P.; Legler, J. Beyond Multiple Linear Regression: Applied Generalized Linear Models and Multilevel Models in R [Internet]; CRC Press: Boca Raton, FL, USA, 2021; Available online: https://bookdown.org/roback/bookdown-BeyondMLR/ (accessed on 1 August 2023).
- Boeing, G. The Morphology and Circuity of Walkable and Drivable Street Networks. SocArXiv Pap [Internet]. January 2019. Available online: https://osf.io/preprints/socarxiv/edj2s/ (accessed on 1 August 2023).
- Elbers, B. A Method for Studying Differences in Segregation across Time and Space. Sociol. Methods Res. 2023, 52, 5–42. [Google Scholar] [CrossRef]
- Bateson, R. Crime victimization and political participation. Am. Political Sci. Rev. 2012, 106, 570–587. [Google Scholar] [CrossRef]
- Dupont, V. Secured residential enclaves in the Delhi region: Impact of indigenous and transnational models. City Cult. Soc. 2016, 7, 227–236. [Google Scholar] [CrossRef]
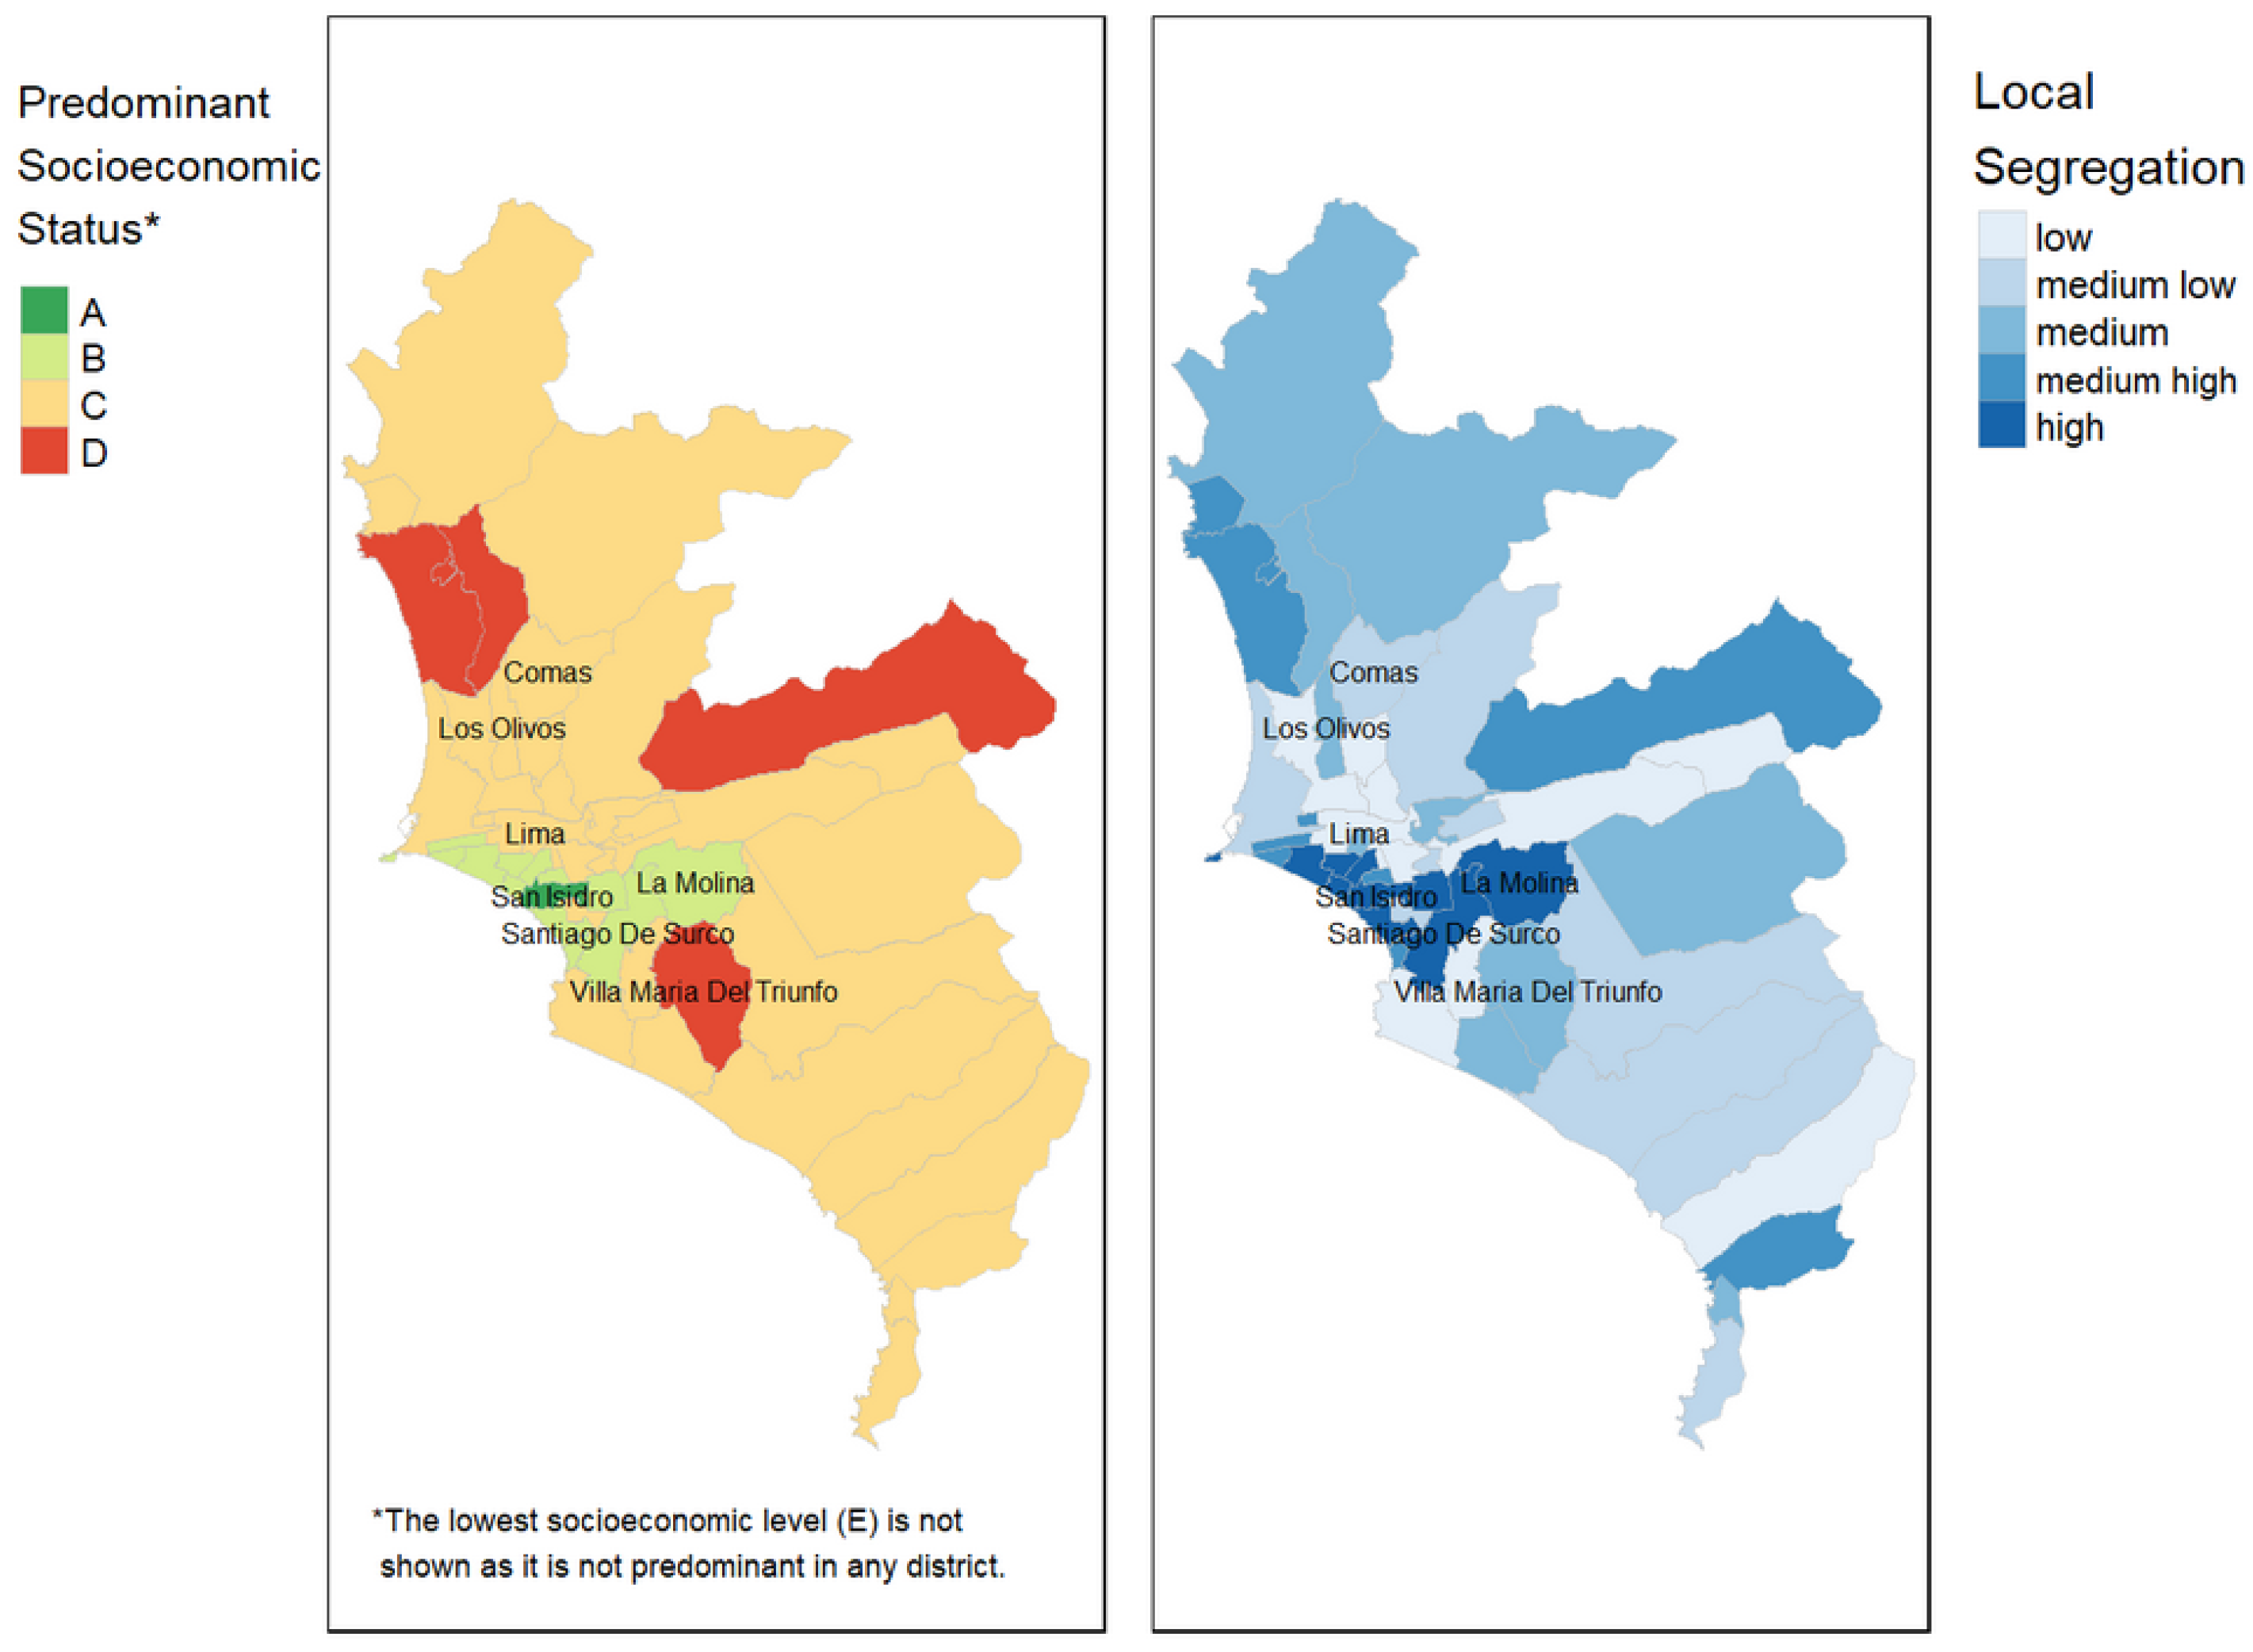
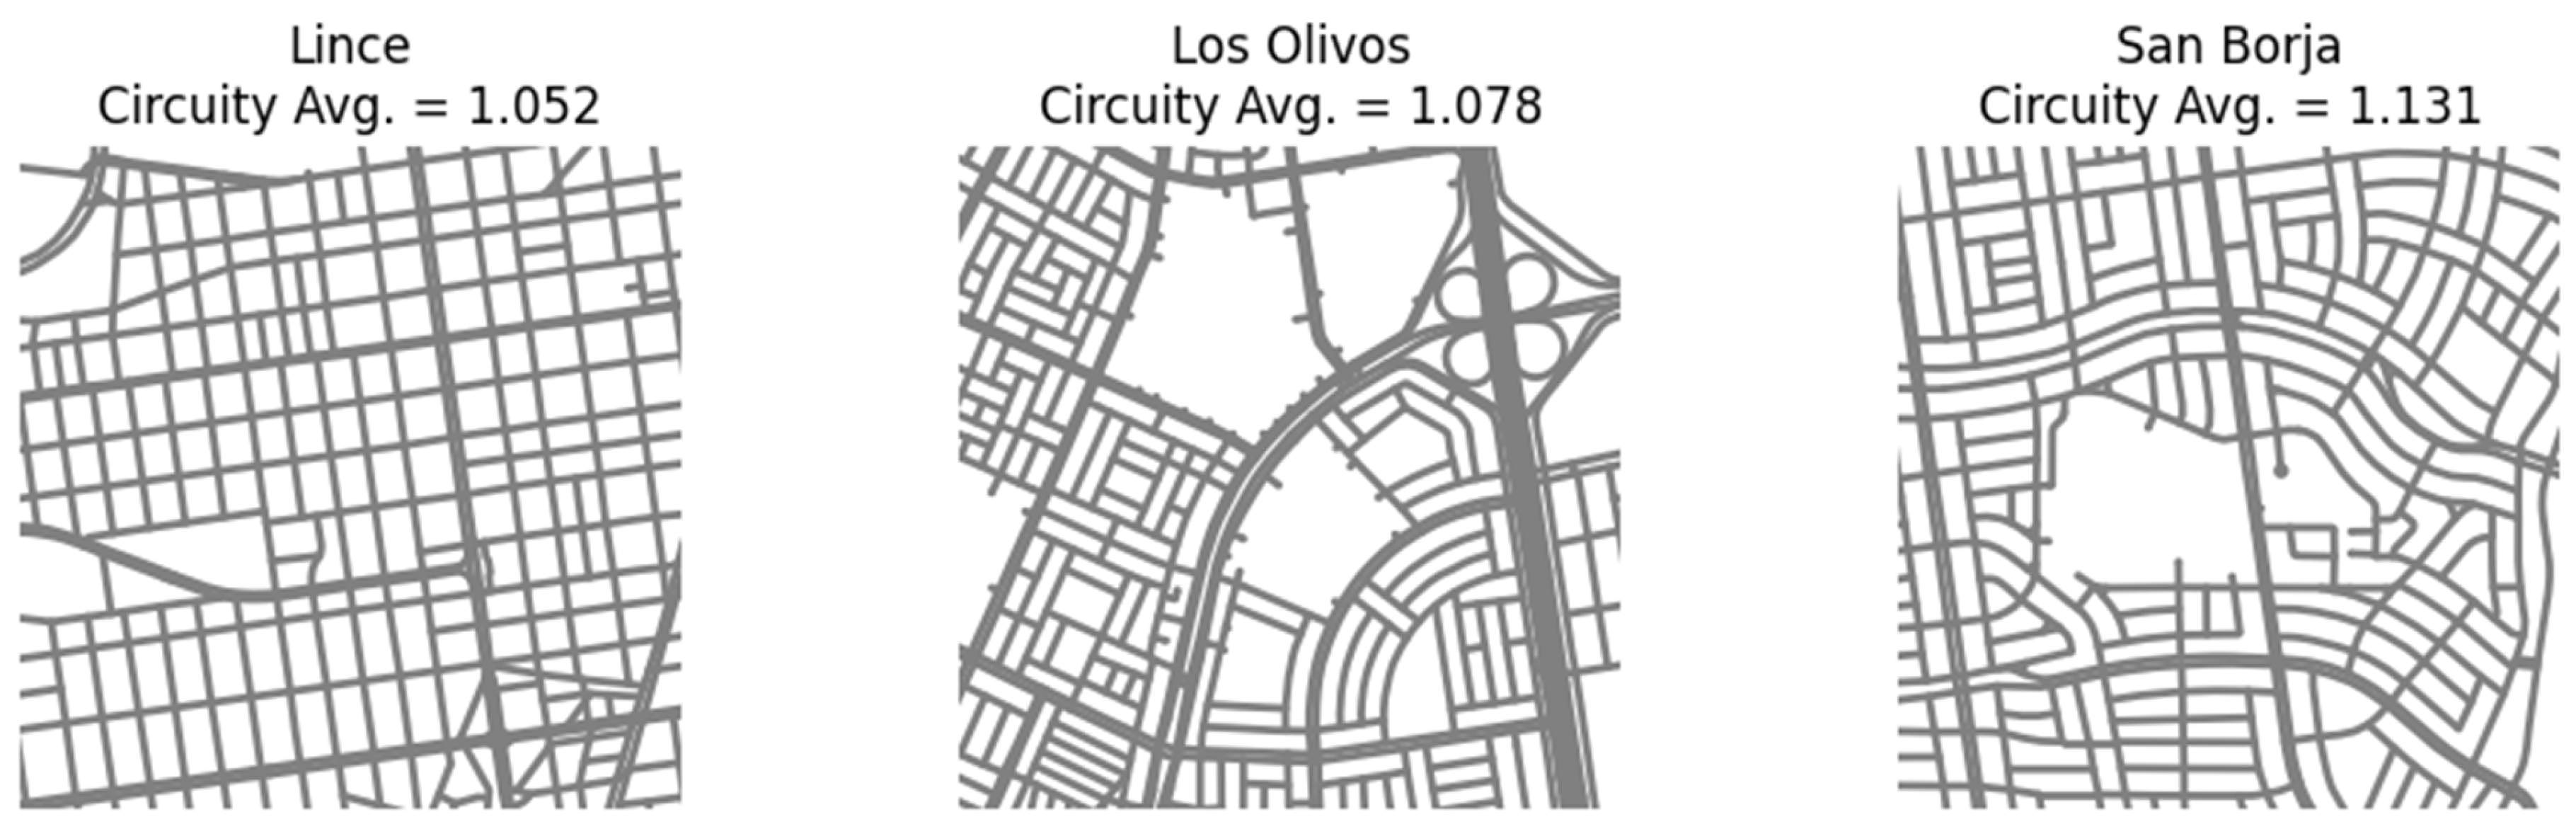
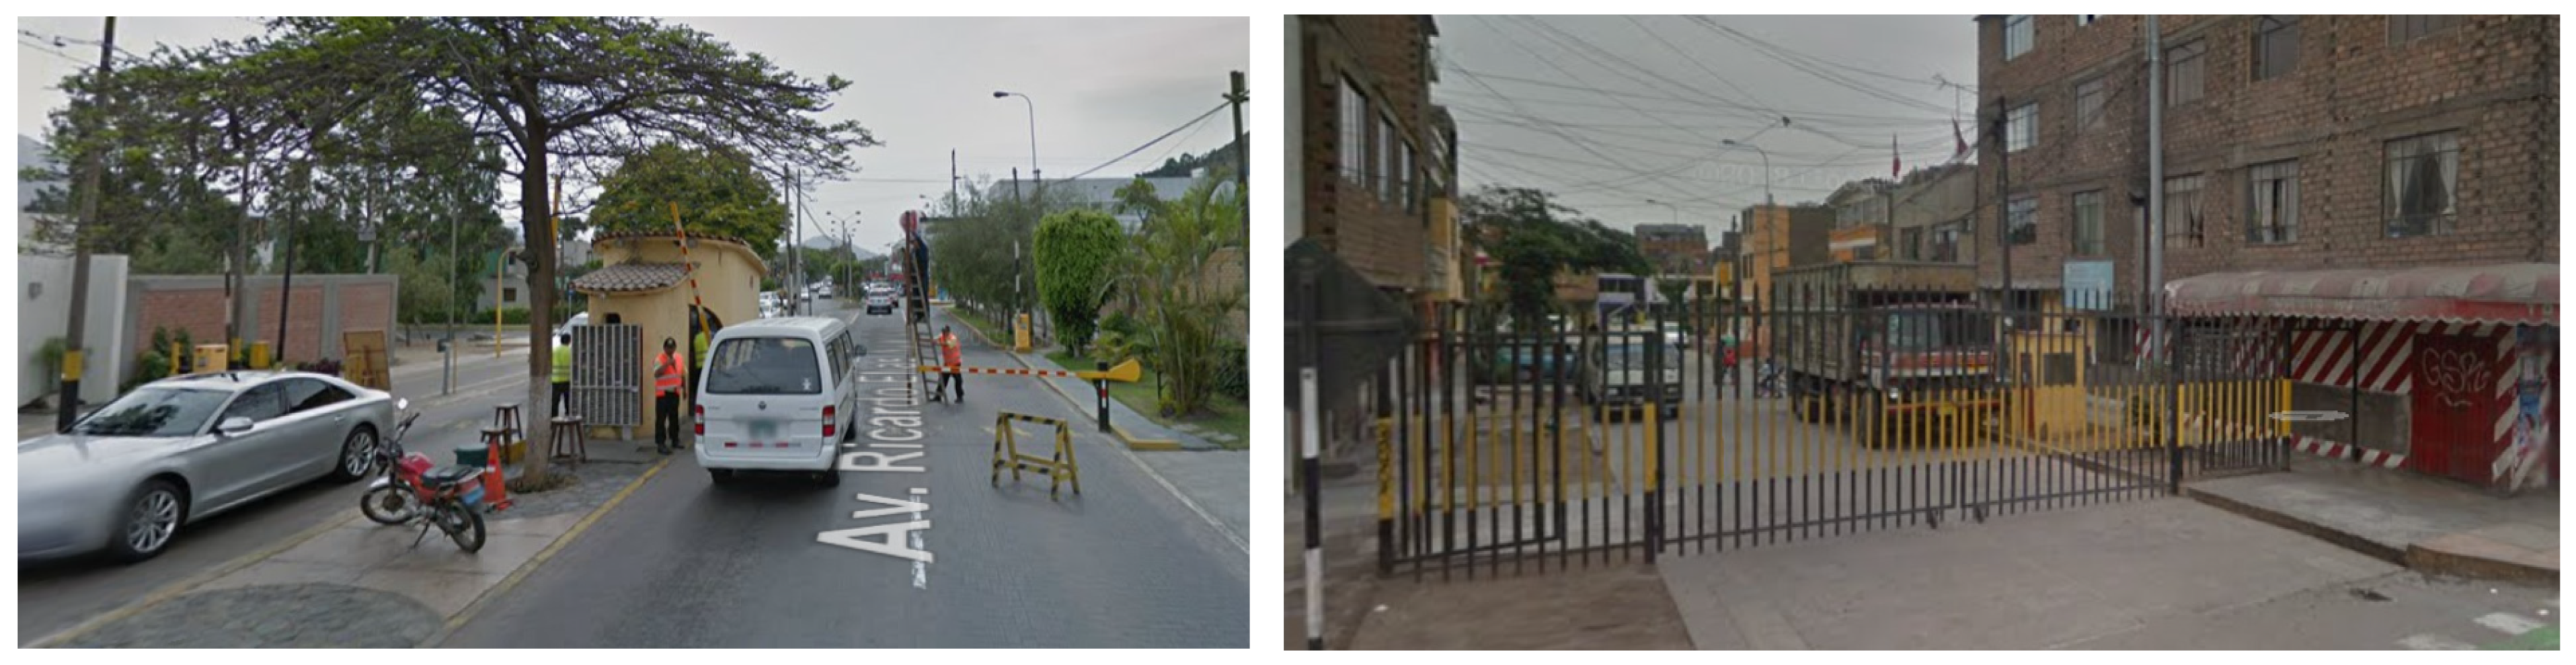

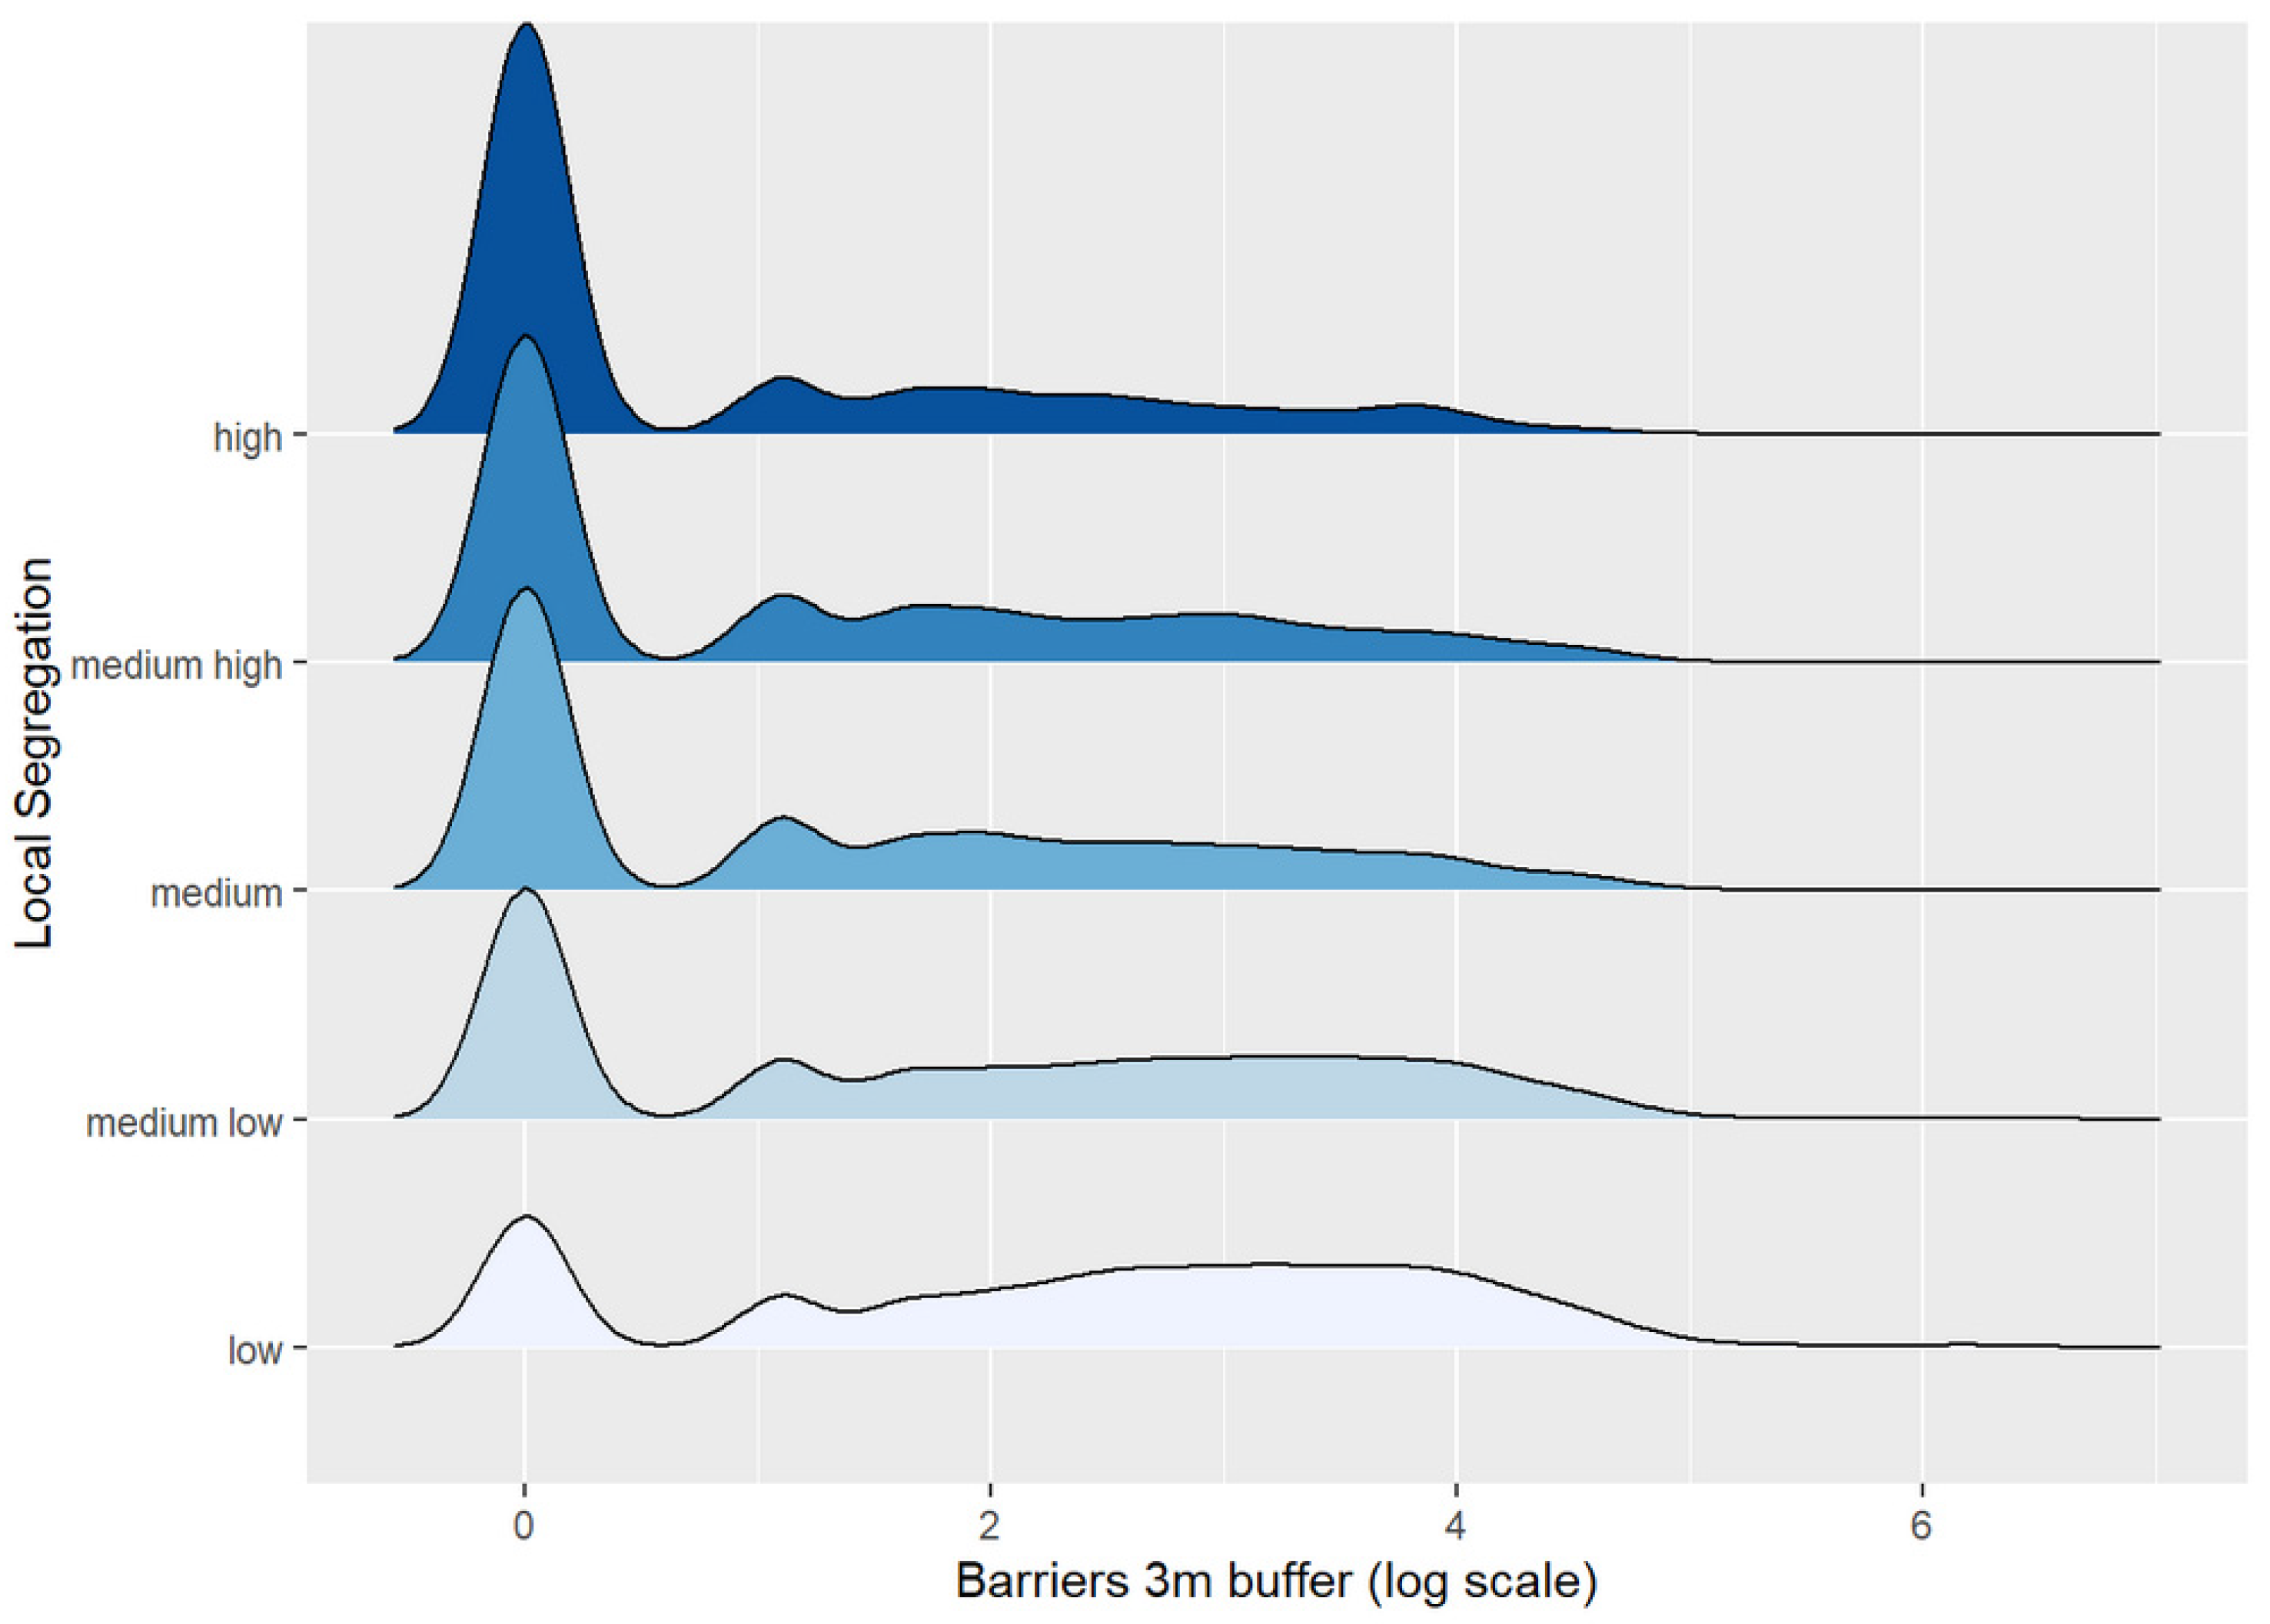
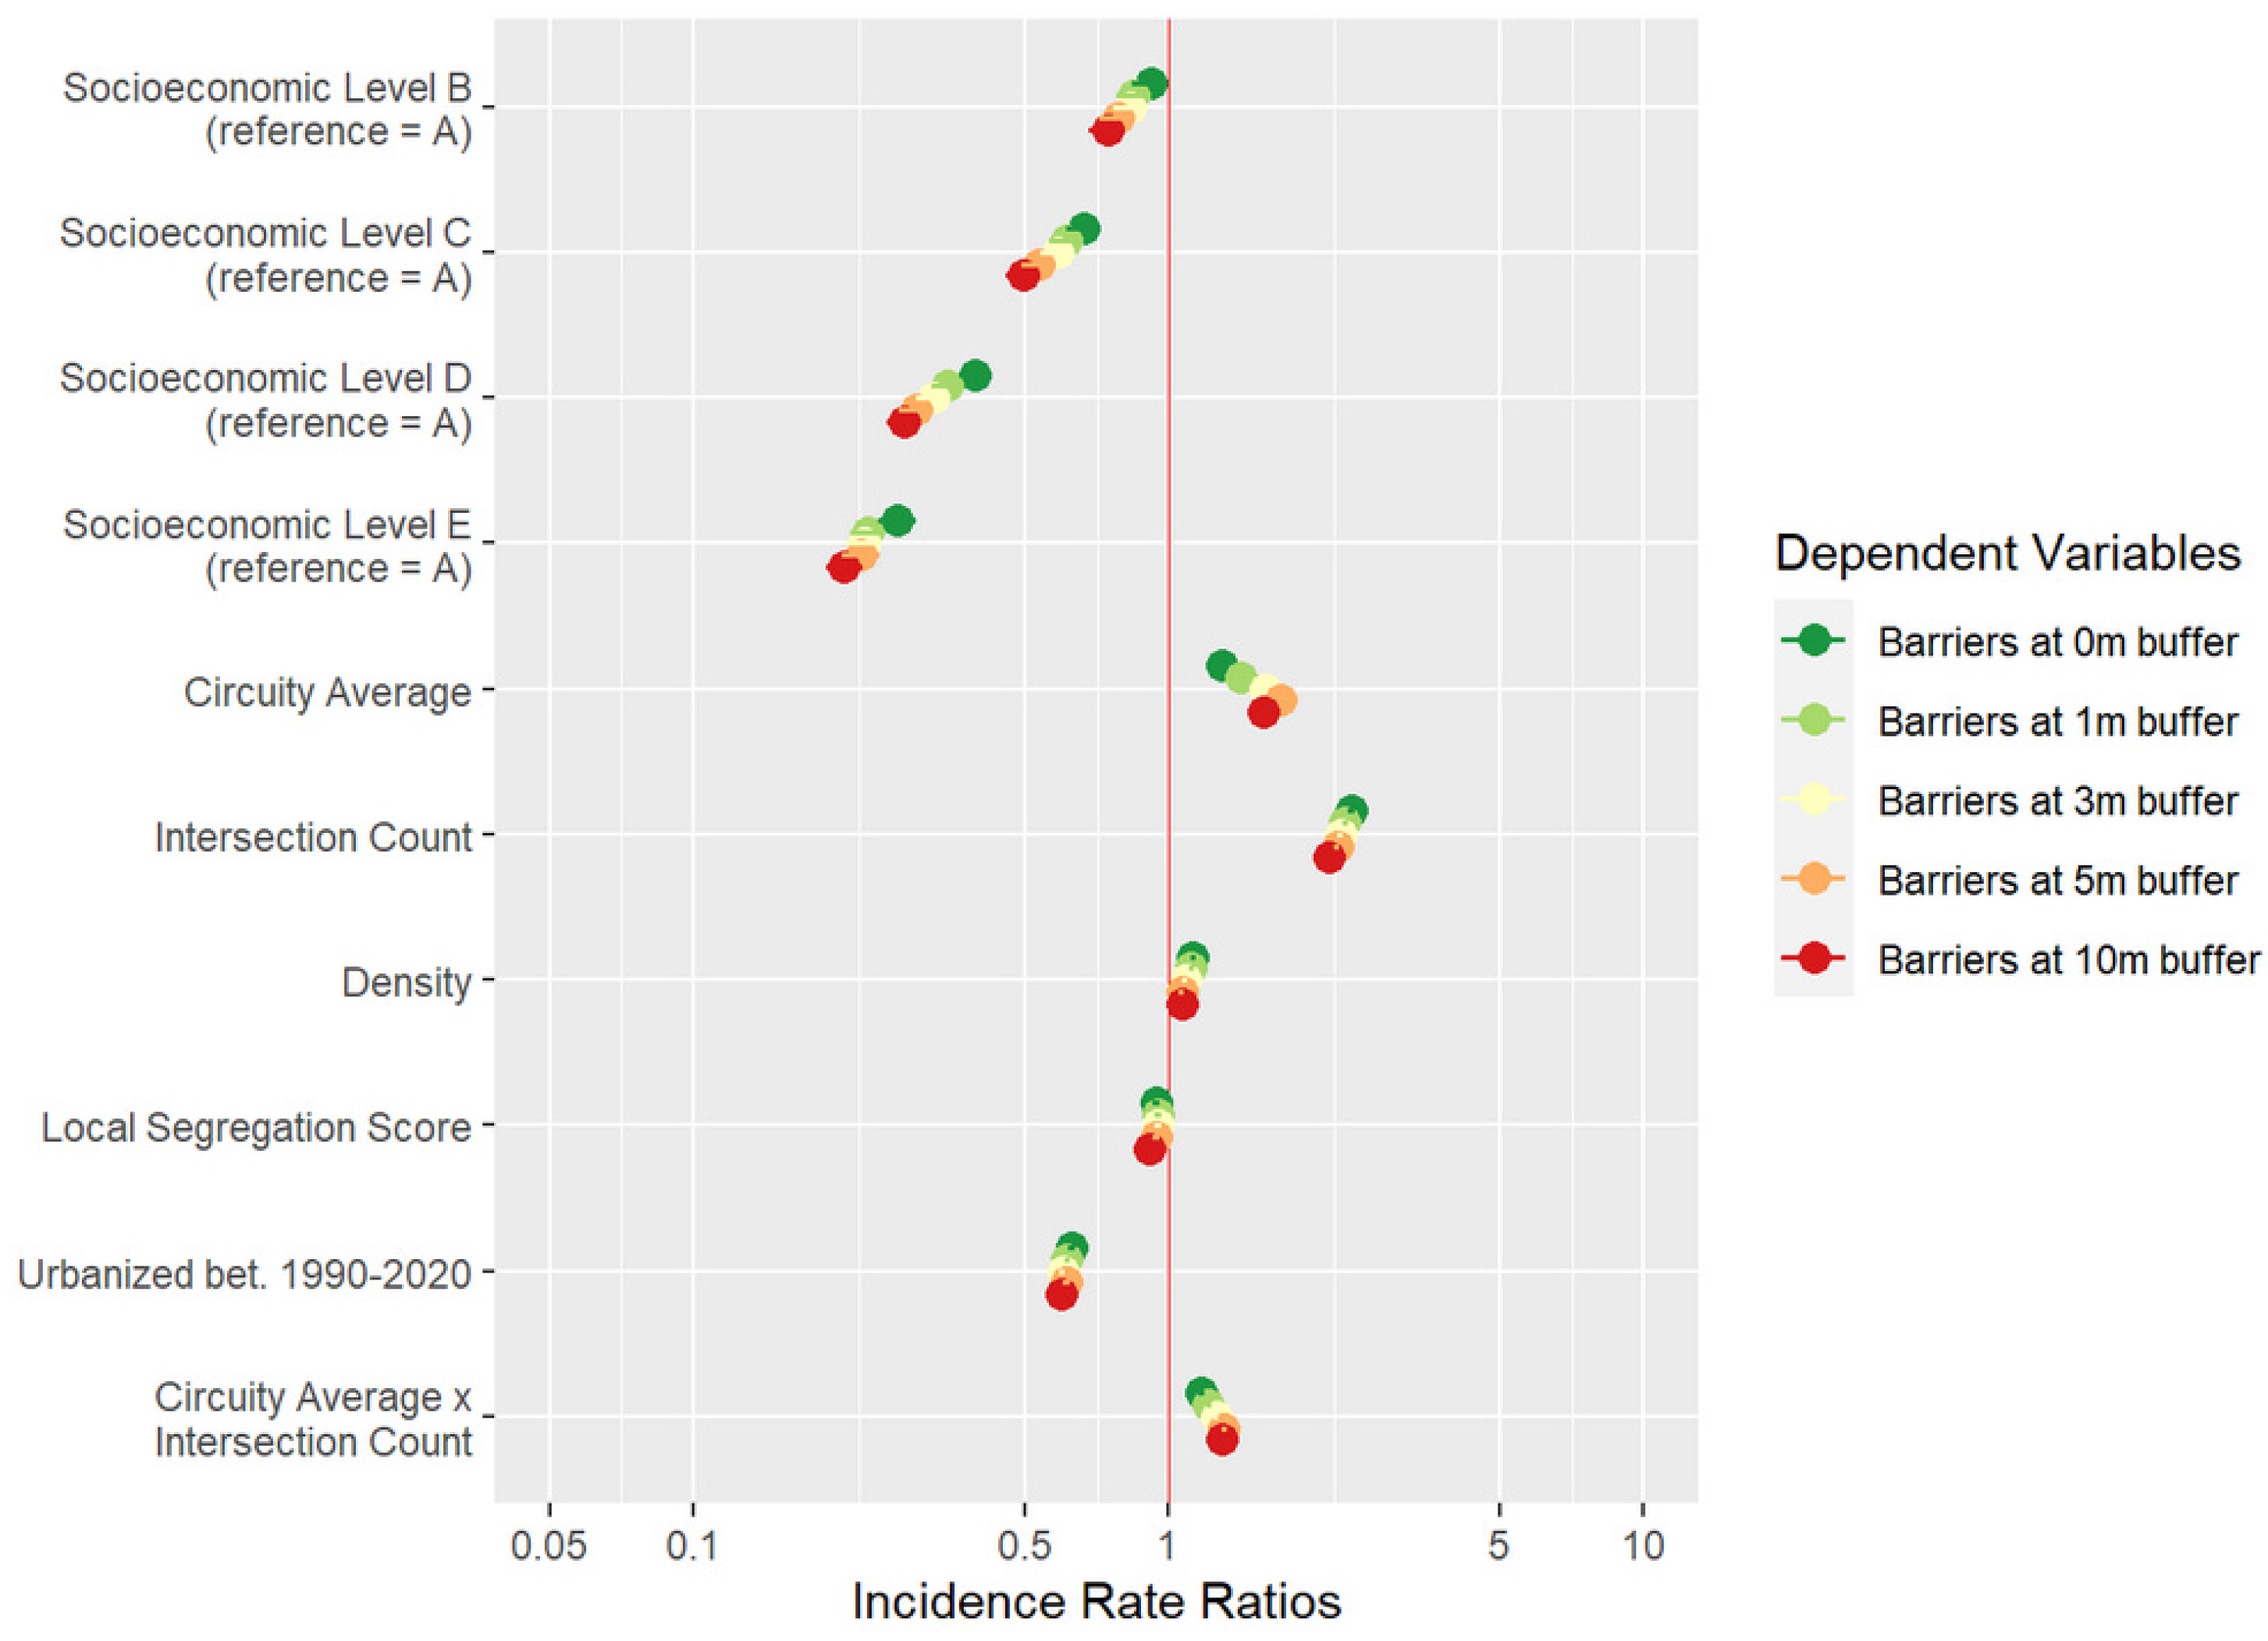
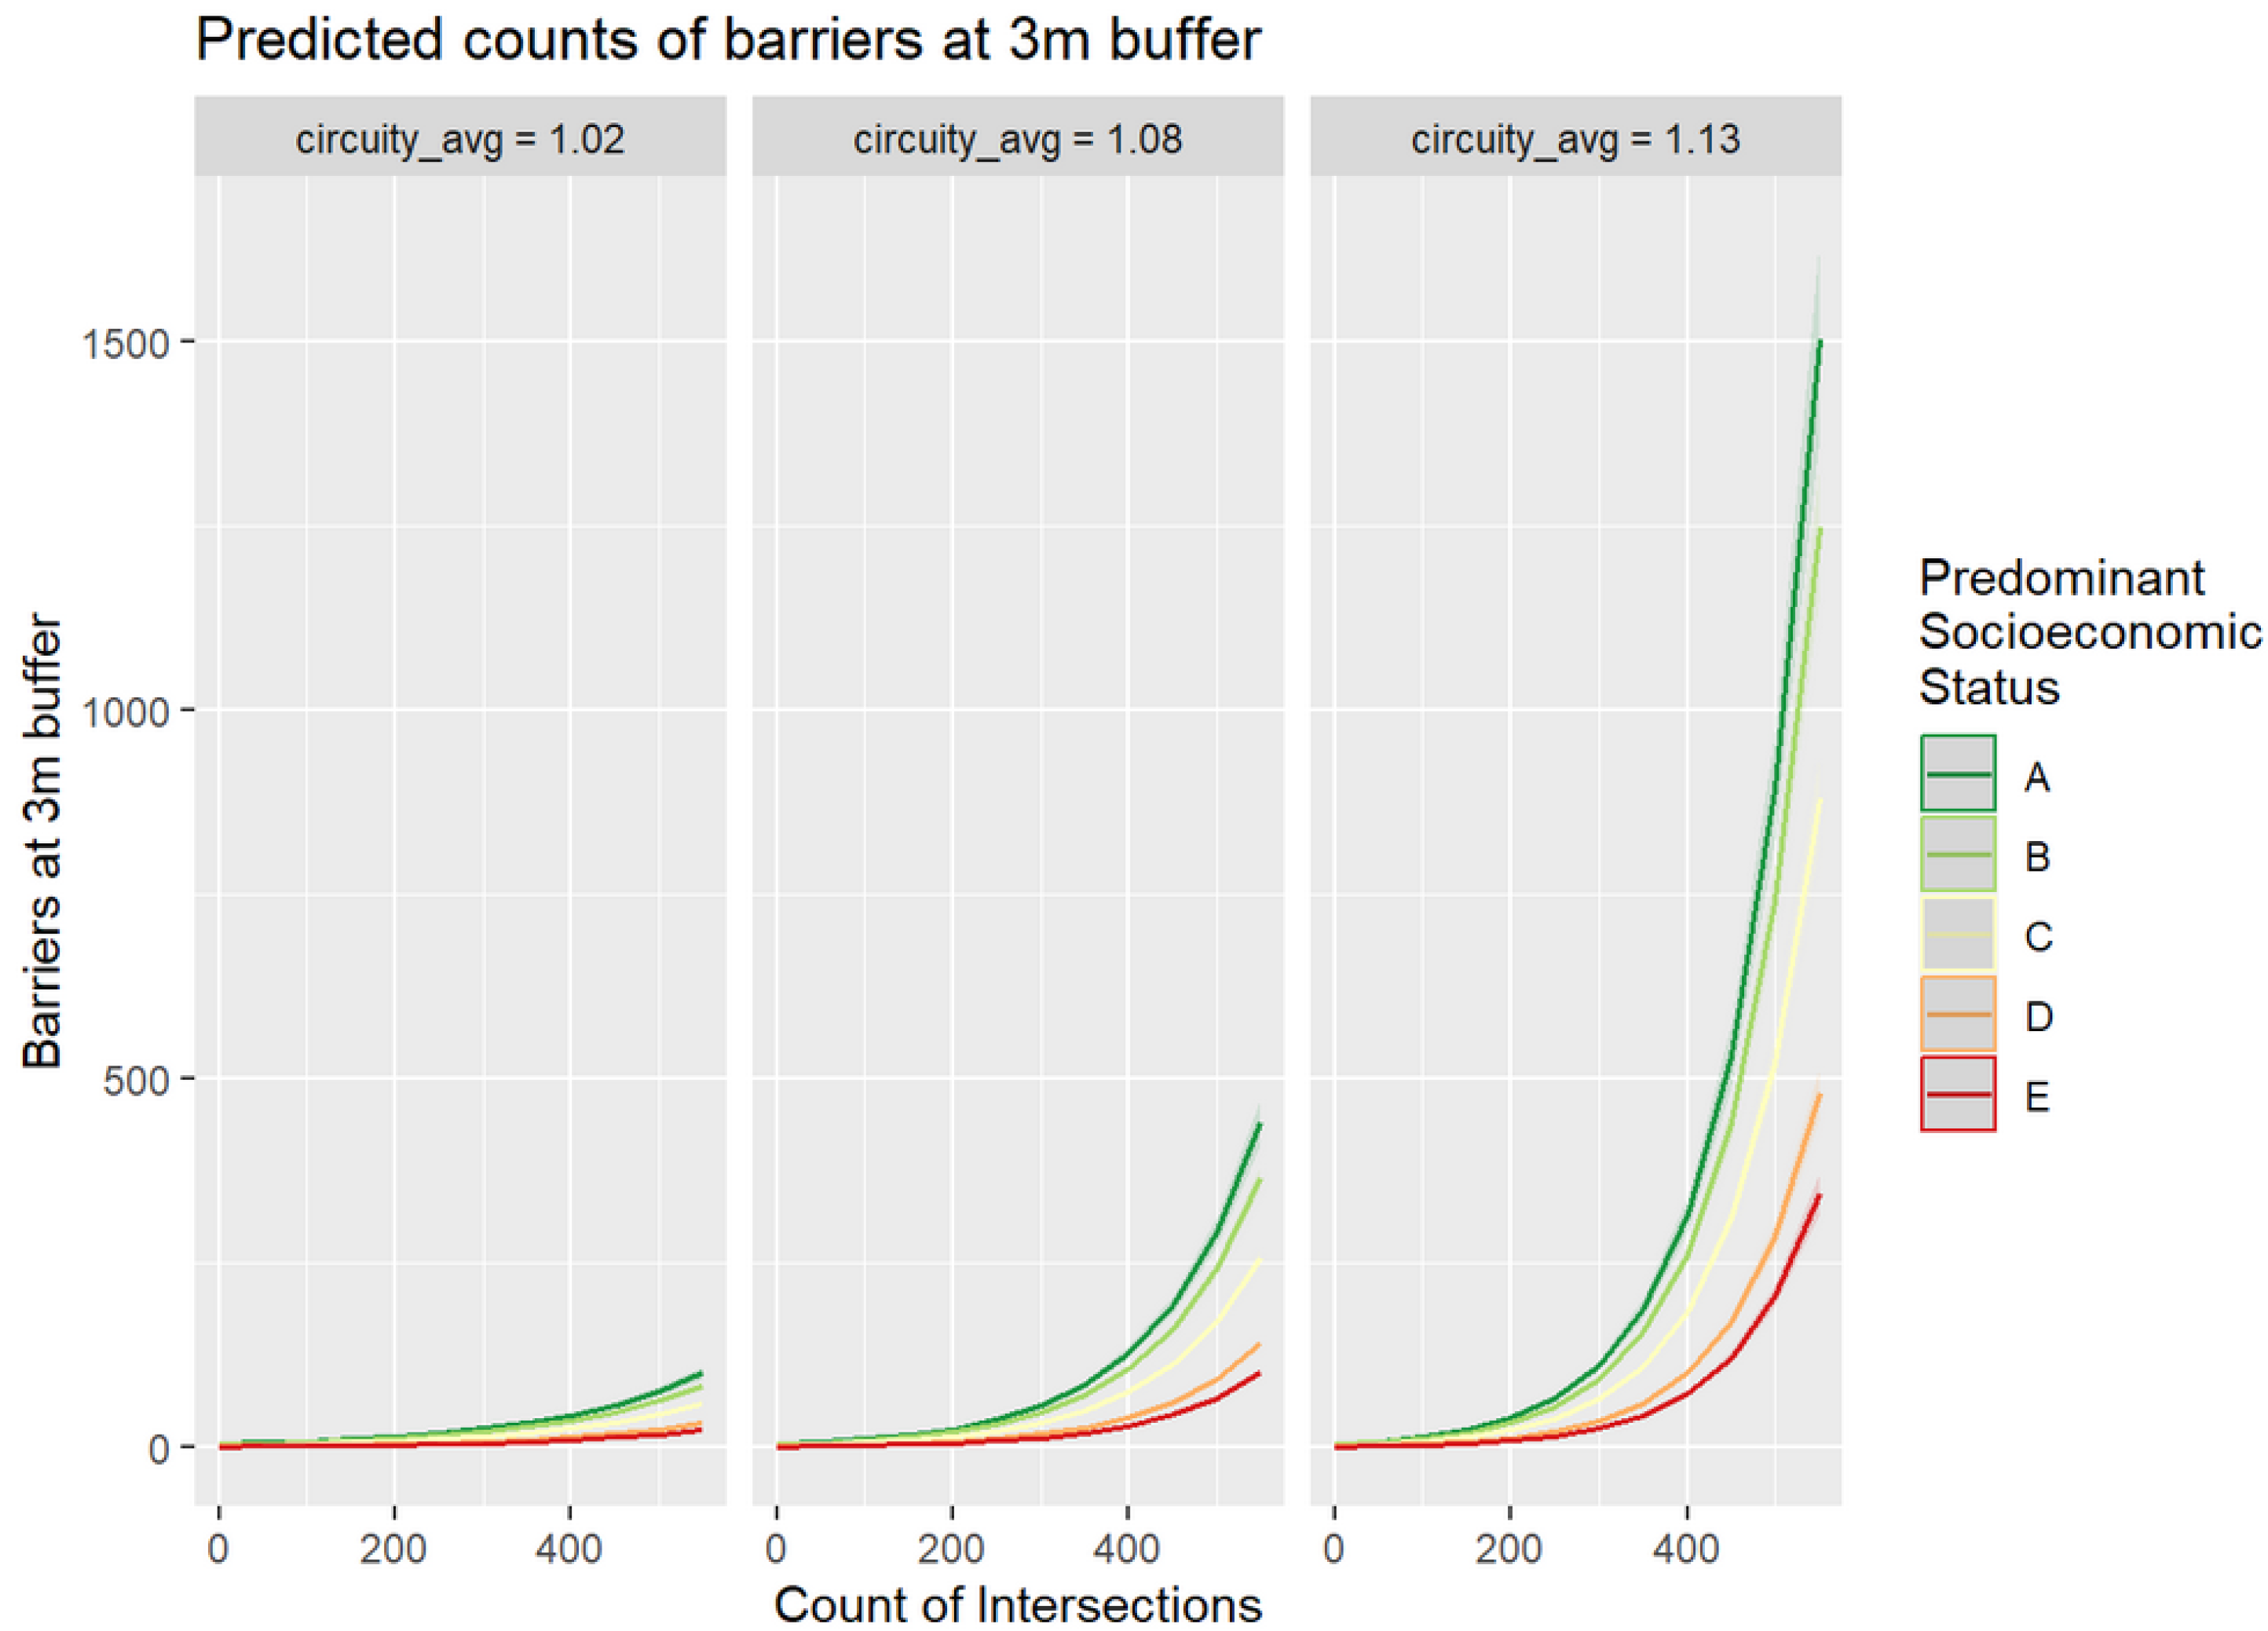
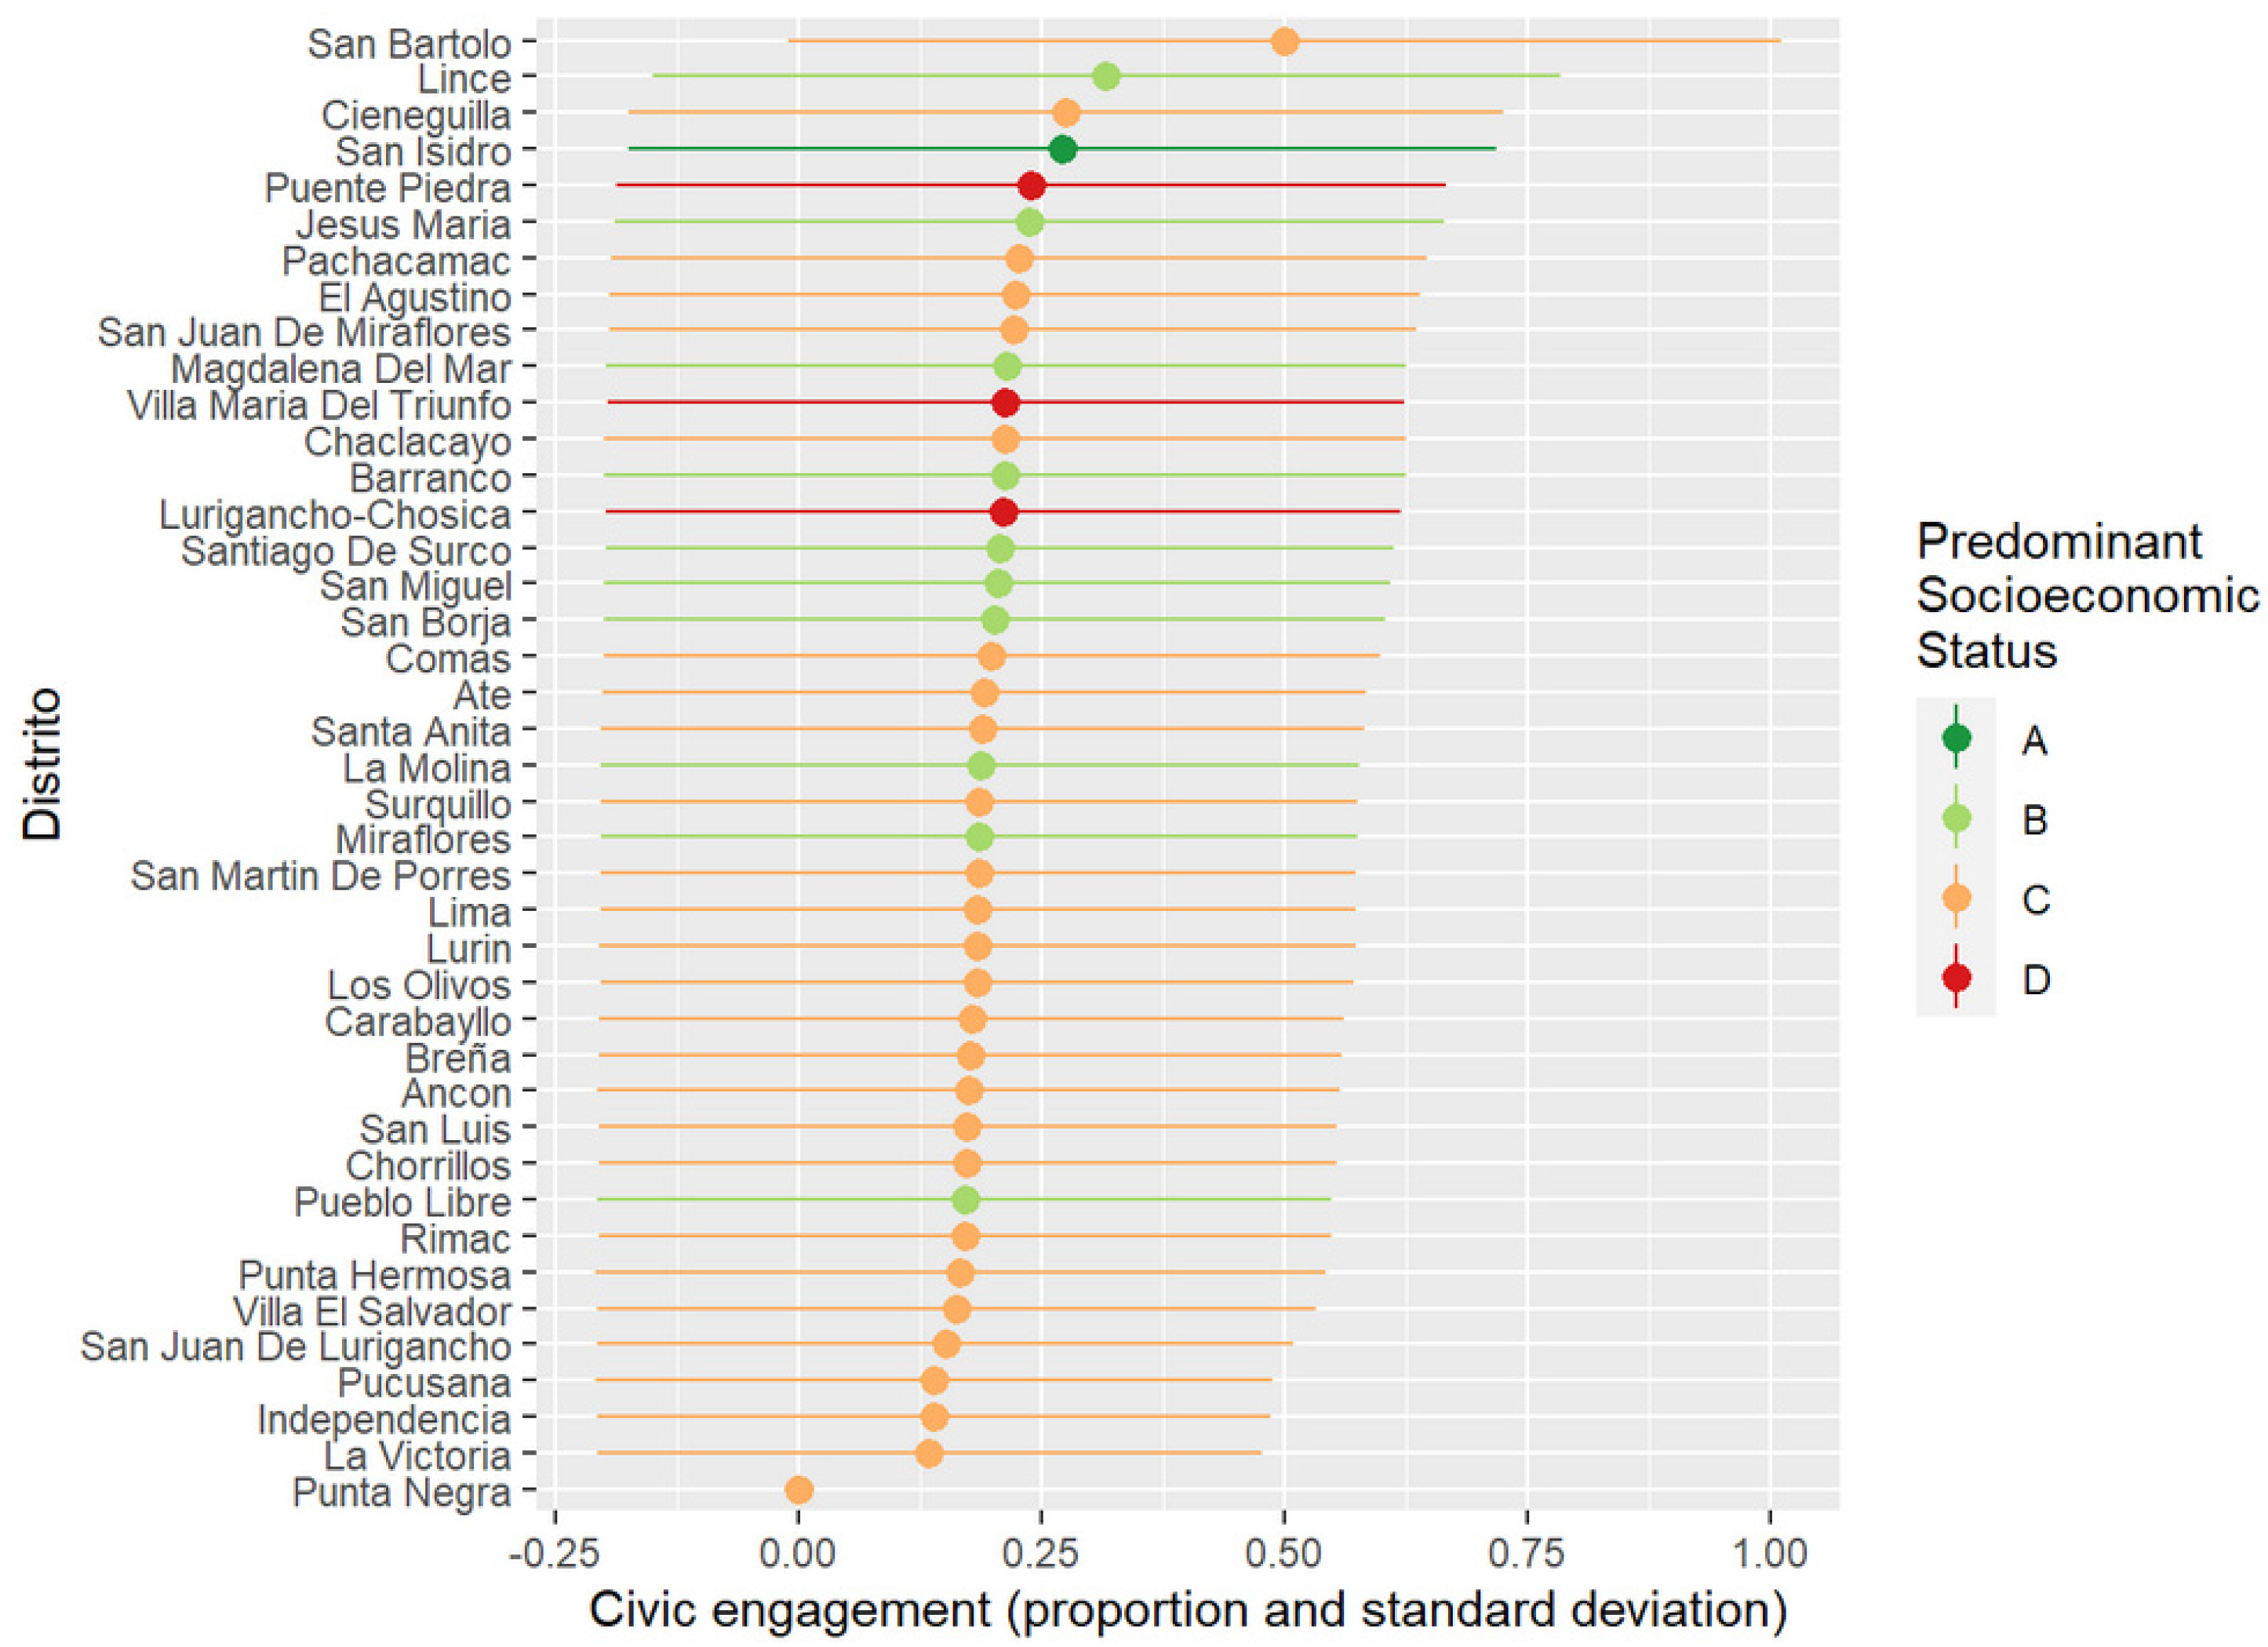
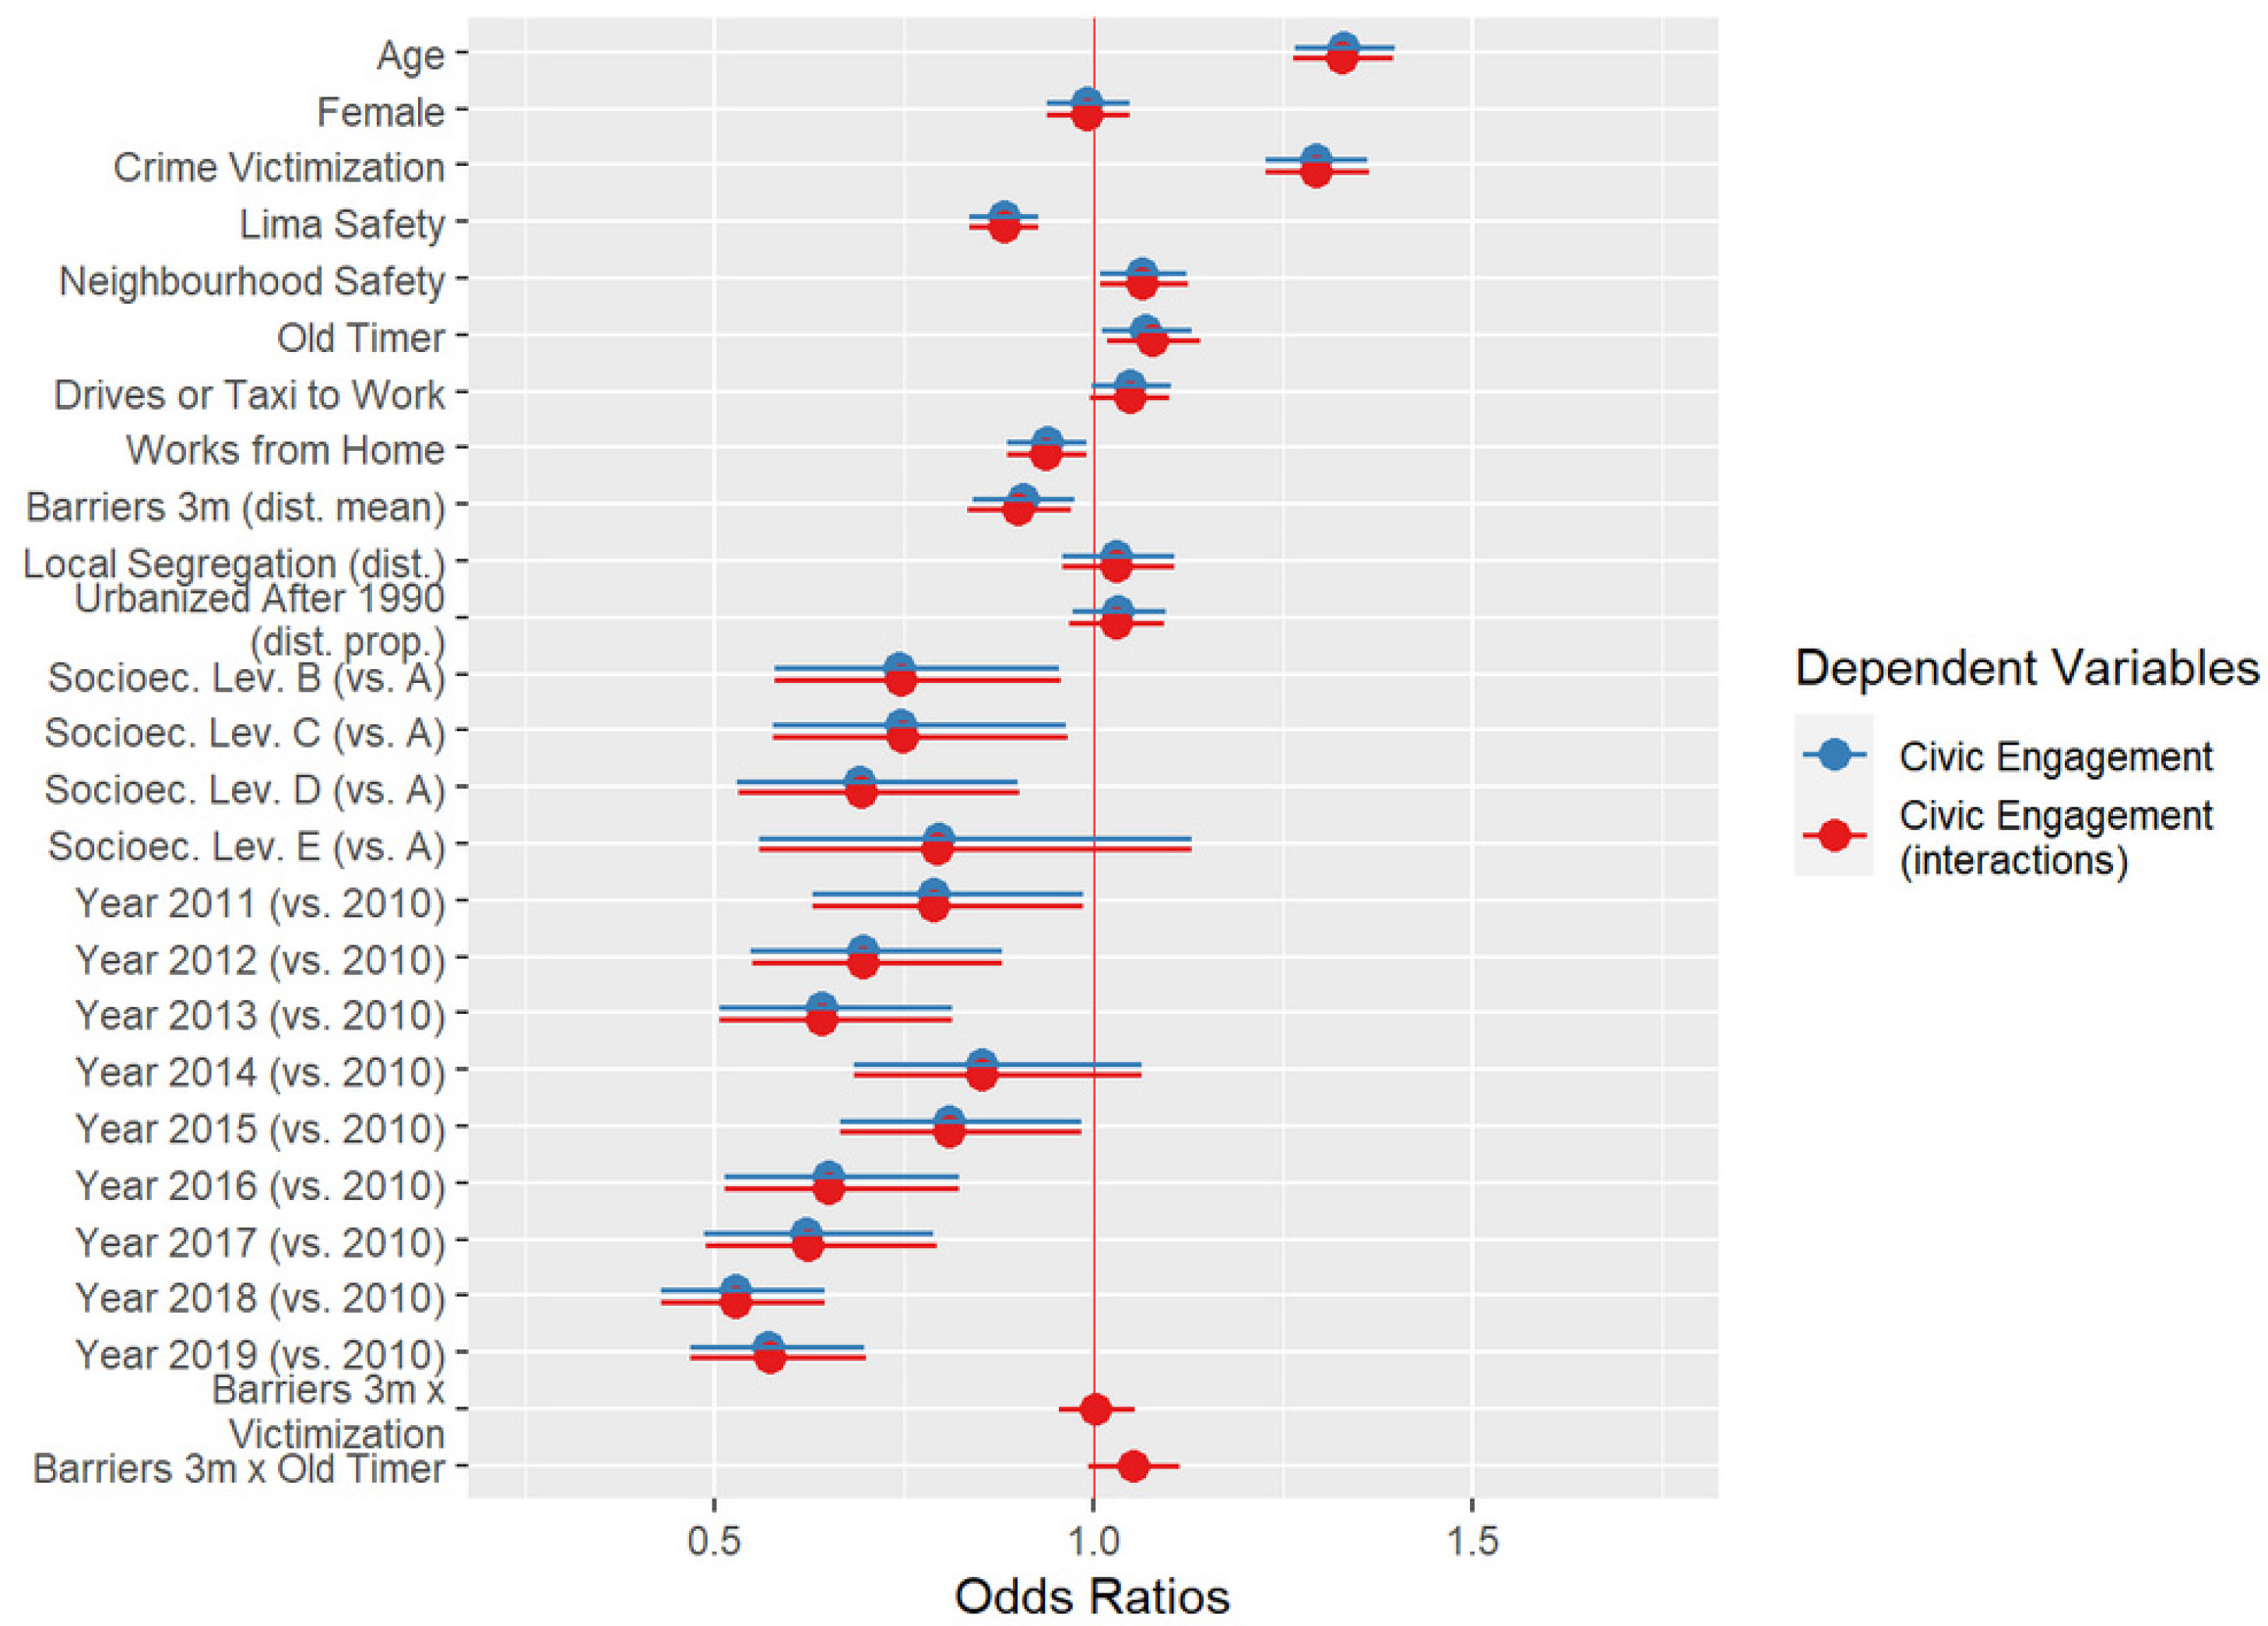
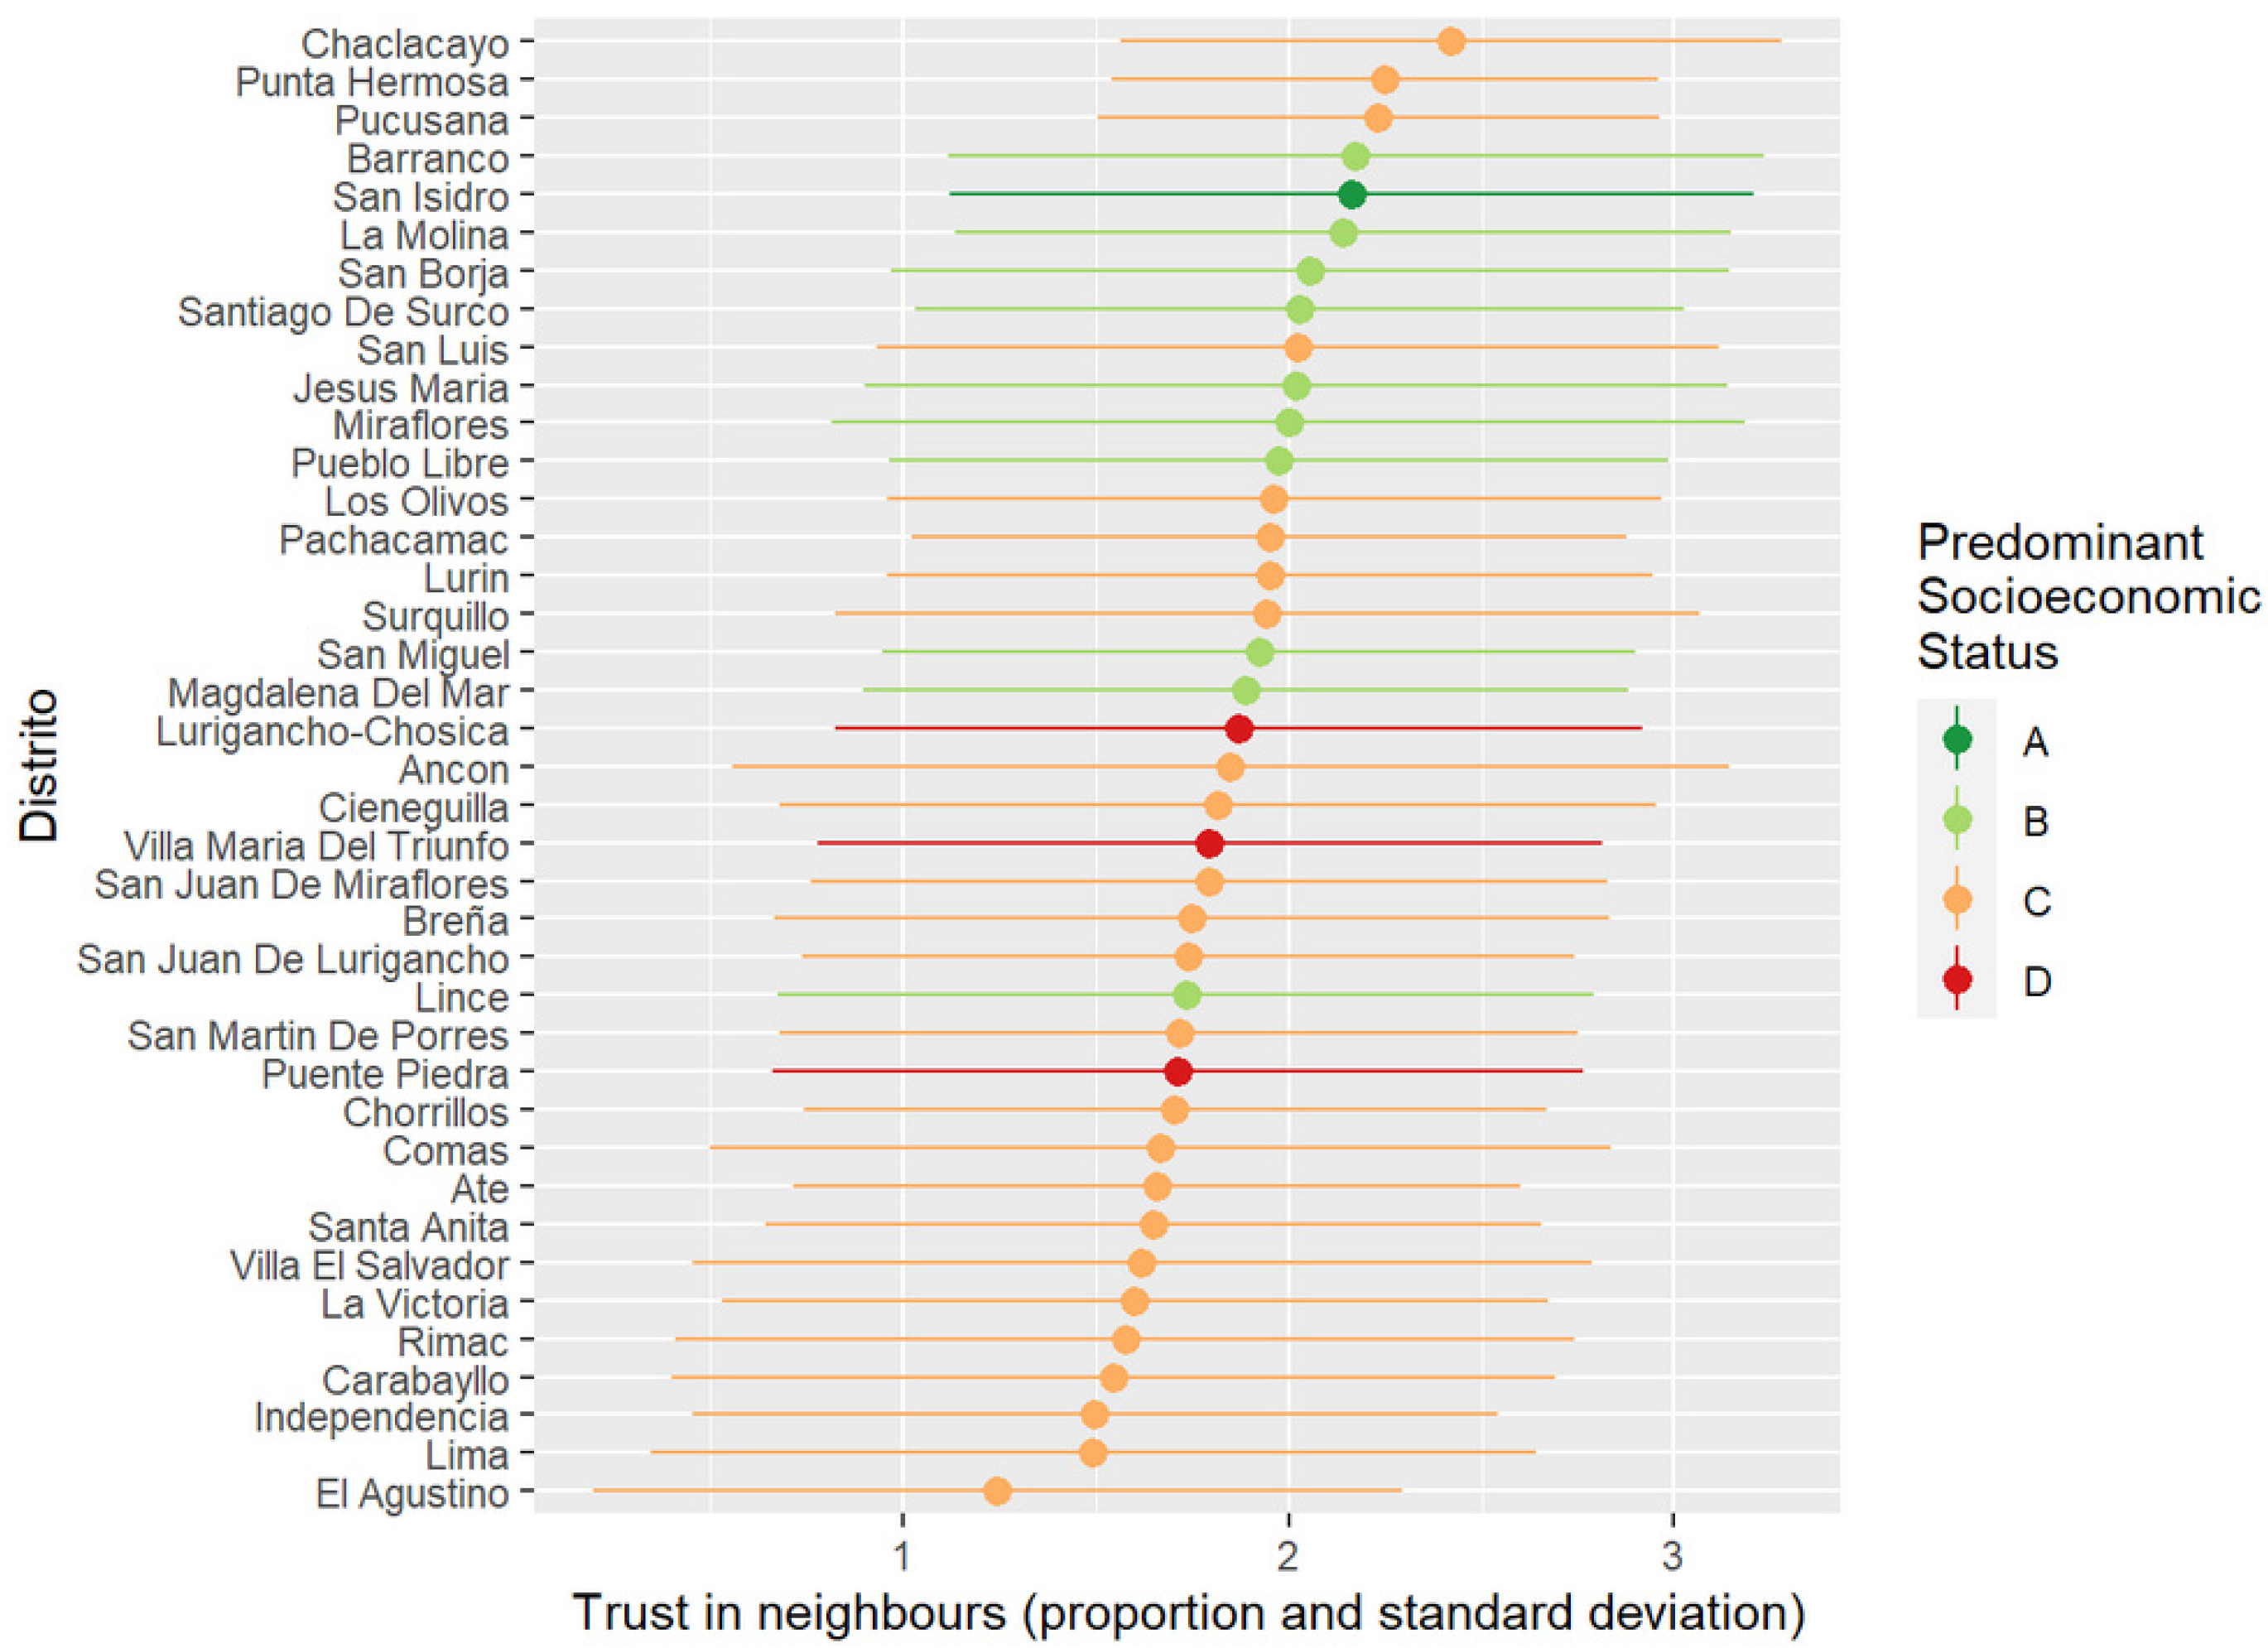
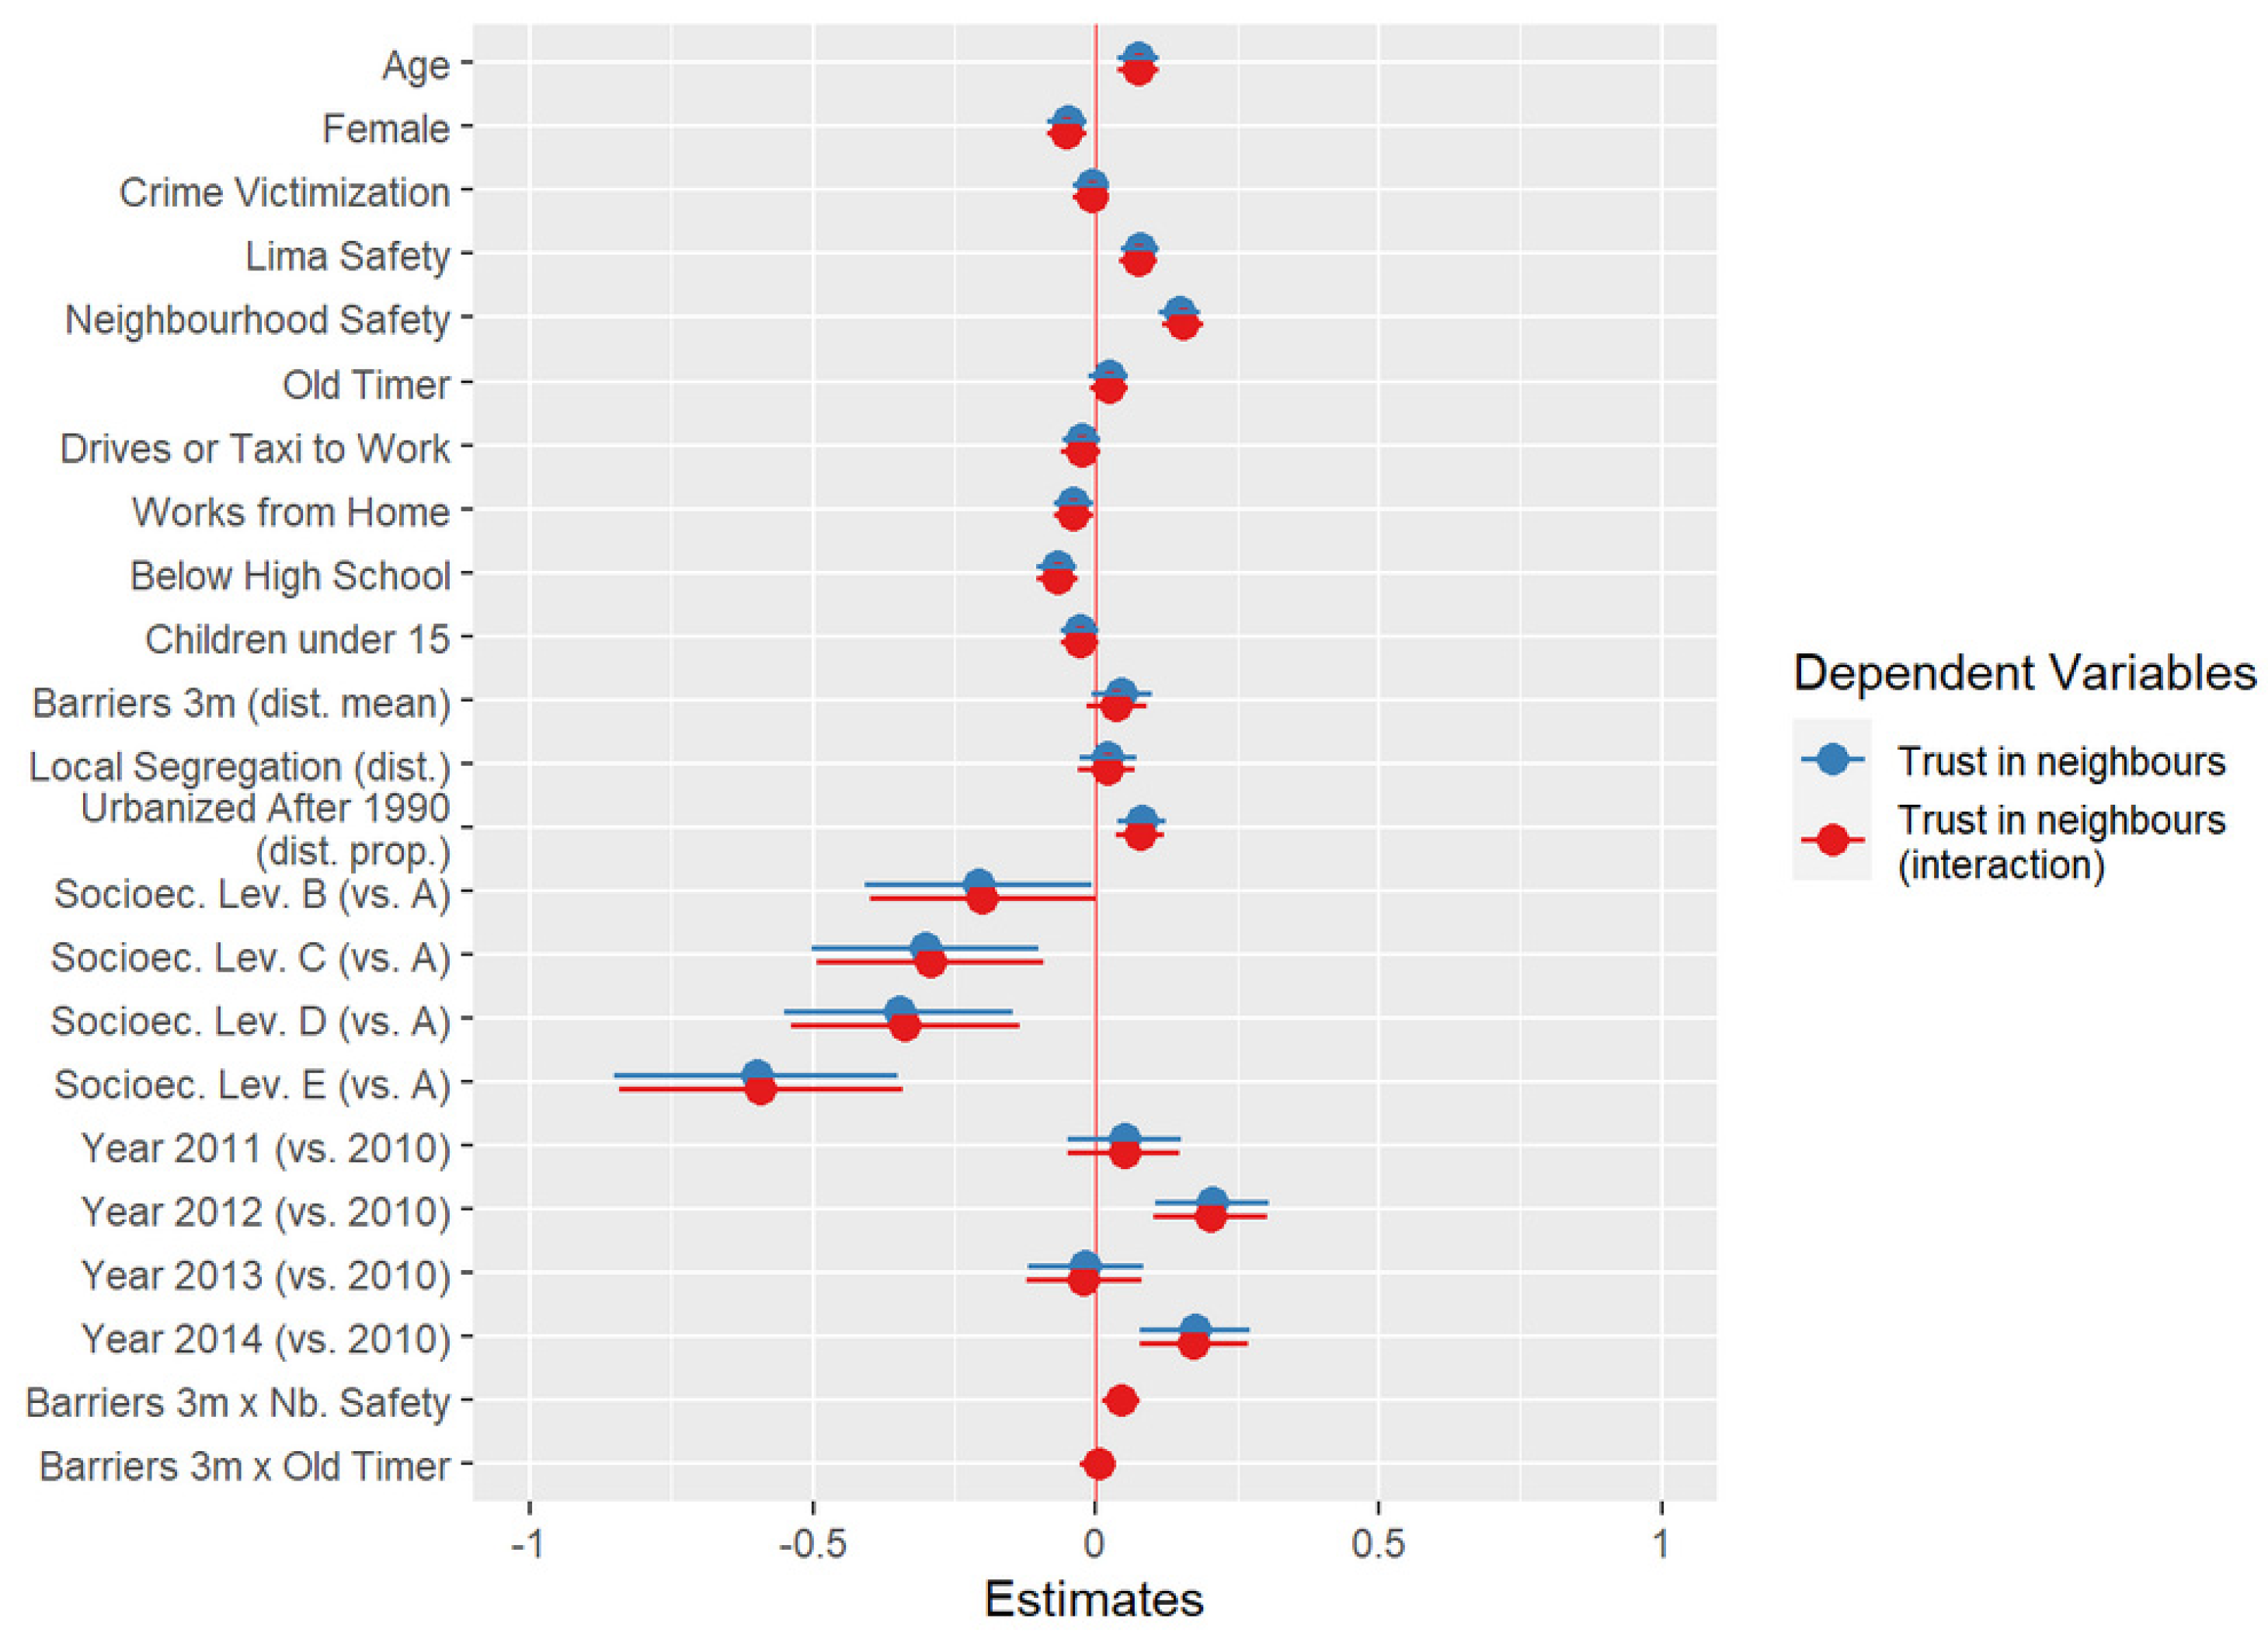
Disclaimer/Publisher’s Note: The statements, opinions and data contained in all publications are solely those of the individual author(s) and contributor(s) and not of MDPI and/or the editor(s). MDPI and/or the editor(s) disclaim responsibility for any injury to people or property resulting from any ideas, methods, instructions or products referred to in the content. |
© 2024 by the author. Licensee MDPI, Basel, Switzerland. This article is an open access article distributed under the terms and conditions of the Creative Commons Attribution (CC BY) license (https://creativecommons.org/licenses/by/4.0/).