Article

Spatiotemporal Evolution of Urban Resilience and Spatial Spillover Effects in Guangdong Province, China

1
School of Geography and Planning, Sun Yat-sen University, Guangzhou 510006, China
2
Guangdong Provincial Key Laboratory of Urbanization and Geo-Simulation, Guangzhou 510006, China
3
Guangdong Provincial Engineering Research Center for Public Security and Disaster, Sun Yat-sen University, Guangzhou 510006, China
4
Southern Marine Science and Engineering Guangdong Laboratory, Zhuhai 519000, China
*
Author to whom correspondence should be addressed.
Land 2023, 12(9), 1800; https://doi.org/10.3390/land12091800
Submission received: 7 July 2023 / Revised: 10 September 2023 / Accepted: 14 September 2023 / Published: 17 September 2023

Abstract

:
In the context of global environmental changes, the frequency of various disasters and extreme events is increasing, and enhancing urban resilience has become an important guide for current urban development. Previous studies have mainly focused on changes in urban resilience, with less consideration for the impact of spatial spillover effects on urban resilience. Therefore, this paper aims to analyze the temporal and spatial evolution of urban resilience and its spatial spillover effects in Guangdong from 2012 to 2020 based on the urban resilience assessment model, the Getis-Ord Gi* model, and the improved Capello model. The results are as follows: Affected by COVID-19, the urban resilience of Guangdong Province declined from 2019 to 2020, and 42.86% of the cities demonstrated negative growth in their urban resilience. Urban resilience exhibited significant spatially non-equilibrium characteristics among different cities. The urban resilience of the cities in eastern, northern, and western Guangdong, which are the “collapse zone” of urban resilience, was lower than 0.229 from 2012 to 2020. The intensity of urban resilience spillover in Guangdong presented a typical three-level circle structure of “core-subcore-periphery”, which decreased from the core circle to the surrounding circle. COVID-19 caused a 27.21% decrease in the total urban resilience spillover in Guangdong from 2019 to 2020. Finally, we identified critical driving factors of urban resilience using the optimal-parameters geographical detector model. This study can provide a scientific reference for the Chinese government to build resilient cities and improve sustainable urban development.

1. Introduction

During urbanization and industrialization, human beings exploit various ecological resources and consume significant amounts of energy, contributing to the frequent extreme weather events and natural disasters around the world. On the other hand, cities are susceptible to environmental pollution, water shortages, and traffic congestion due to the rapid increase in population growth. In addition, various accidents, disasters, public health incidents, and social security incidents threaten the development of cities, greatly challenging urban management [1]. Therefore, cities urgently need to seek more effective ideas to guide their sustainable development. Urban resilience refers to the ability of cities to resist disasters and to deploy resources rationally to recover quickly from them [2,3]. Urban resilience, emphasizing cities’ systemic and adaptive longevity, aligns with this need.
Currently, “urban resilience” is receiving attention from several countries and organizations [1,4]. International projects or initiatives such as the Global 100 Resilient Cities, the United Nations 2030 Sustainable Development Goals (SDGs), and the New Urban Agenda include building resilient cities and improving urban resilience as important goals [2]. Among them, Goal 11 of the Sustainable Development Goals (SDGs) emphasizes the significance of constructing sustainable cities and communities, focusing on urban resilience and inclusivity. Enhancing urban resilience constitutes a crucial component of Goal 11 within the SDGs framework, and it helps ensure that cities can effectively contribute towards the broader global Sustainable Development Goals [5]. Coronavirus disease 2019 (COVID-19) has had a severe negative impact on many aspects of the global economy, society, and healthcare systems. Consequently, the concept of “urban resilience” has received increased attention from governments [6,7]. In 2020, the Chinese government also proposed the goal of building resilient cities [8].
Some scholars have also expanded the definition of urban resilience based on different disciplinary perspectives. For example, Alberti and Pickett considered urban resilience from a bioscientific perspective as the ability of an urban system to resolve changes when it undergoes disturbance and reorganization [9,10]. Alliance, from an ecological perspective, clarified urban resilience as the ability of urban systems to absorb external disturbances and maintain their original structure and key functions [11]. Hill clarified the concept of urban resilience from the perspective of economics. Hill described urban resilience as the capacity for urban economy to resist shocks and reach equilibrium quickly, that is, the capacity to return to the pre-shock level after experiencing exogenous shocks [12]. From a management perspective, Wardekker argues that urban resilience refers to the ability of cities to withstand disturbances, which could help them reduce or offset harm or damage and recover from and adapt to these disturbances [13,14].
Some studies have employed multiple indicators to construct urban resilience assessment models to assess urban resilience quantitatively. For example, Yang et al. used the entropy-weighted TOPSIS comprehensive evaluation method to measure the urban resilience levels of 44 cities in the Chengdu–Chongqing Economic Circle in 2019 from five dimensions: economic, social, ecological, infrastructural, and cultural [15]. The same approach was shared by Liu, who also constructed the urban resilience development index framework from the five dimensions mentioned above and analyzed the resilience of Chinese cities in 2020 using this framework [8]. Similarly, Zhao built a comprehensive urban resilience evaluation index system encompassing five dimensions: economic, social, institutional, ecological, and infrastructural, based on the Baseline Resilience Indicators for Communities (BRIC) model, to analyze the spatial and temporal evolution of urban resilience in China [16]. Liu assessed the spatial and temporal evolution of urban resilience in the Beijing–Tianjin–Hebei region from three aspects: urban social system, urban engineering system, and urban ecosystem [17]. Wang analyzed the spatial and temporal evolution of COVID-19 in China and its impact on urban economic resilience from three dimensions: economic, social opinion, and population mobility [4].
Studies conducted in this field have increasingly emphasized the comprehensiveness and diversity of urban resilience assessments. Nevertheless, some studies merely reference existing studies when selecting indicators, failing to choose indicators characteristic of the specific study area. Concurrently, there is a tendency to overlook the spatial spillover effects of urban resilience, as certain scholars emphasize changes in urban resilience within individual cities [8,15,18].
Guangdong is one of the regions exhibiting robust economic dynamics, rapid population growth, and notable urban expansion, and it holds a crucial position in the nation’s overall development. Guangzhou, Shenzhen, Dongguan, and Foshan in Guangdong Province are characterized by large total populations, high density, and high mobility, often making them the hardest hit by accidents, disasters, and public health incidents [8]. Furthermore, Guangdong boasts two national cities: Guangzhou and Shenzhen. This province must take the lead in advancing the construction of resilient cities to mitigate the adverse impacts of urban systems in the face of unforeseen crises.
In the context of globalization and China’s deepening reform and opening up, the development of cities in Guangdong Province no longer occurs within isolated, closed systems, and there is a growing flow of resilience elements between cities. This dynamic flow not only shapes the evolution of urban resilience but also engenders the phenomenon of spatial spillover in urban resilience. Frequently, certain central cities within specific regions assume roles as economic, cultural, and scientific hubs, and they exert profound spatial spillover effects that significantly influence the regional urban resilience landscape. Therefore, it was imperative to account for the spatial spillover effect when examining urban resilience in Guangdong Province.
The Chinese government is concerned about whether COVID-19 will significantly impact urban resilience and consistently affect cities with varying industrial structures and serving different urban functions. This paper develops an urban resilience assessment model in four dimensions—economic, ecological, infrastructural, and social—and examines the spatiotemporal evolution of urban resilience and its spatial spillover effects in Guangdong Province from 2012 to 2020 by combining the Getis-Ord Gi* model and the improved Capello model. Finally, the optimal-parameters geographical detector (OPGD) model was used to explore the driving factors of urban resilience in Guangdong Province.
The objectives of this study are as follows: (1) To investigate the spatial and temporal evolution characteristics of urban resilience and its spatial spillover effects in Guangdong Province, considering two perspectives of urban resilience: internal and external. Moreover, this paper investigates the critical driving factors of urban resilience and their interactions. (2) To assess the negative impacts of COVID-19 on cities with varying population sizes and industrial structures. (3) To compare the evolution characteristics of urban resilience and its spatial spillover effects in Guangdong Province before and after COVID-19, which will be expected to provide a decision-making reference for Chinese government to assess the negative impact of public health emergencies on urban resilience and explore key factors to improve urban resilience.

2. Study Area and Data Sources
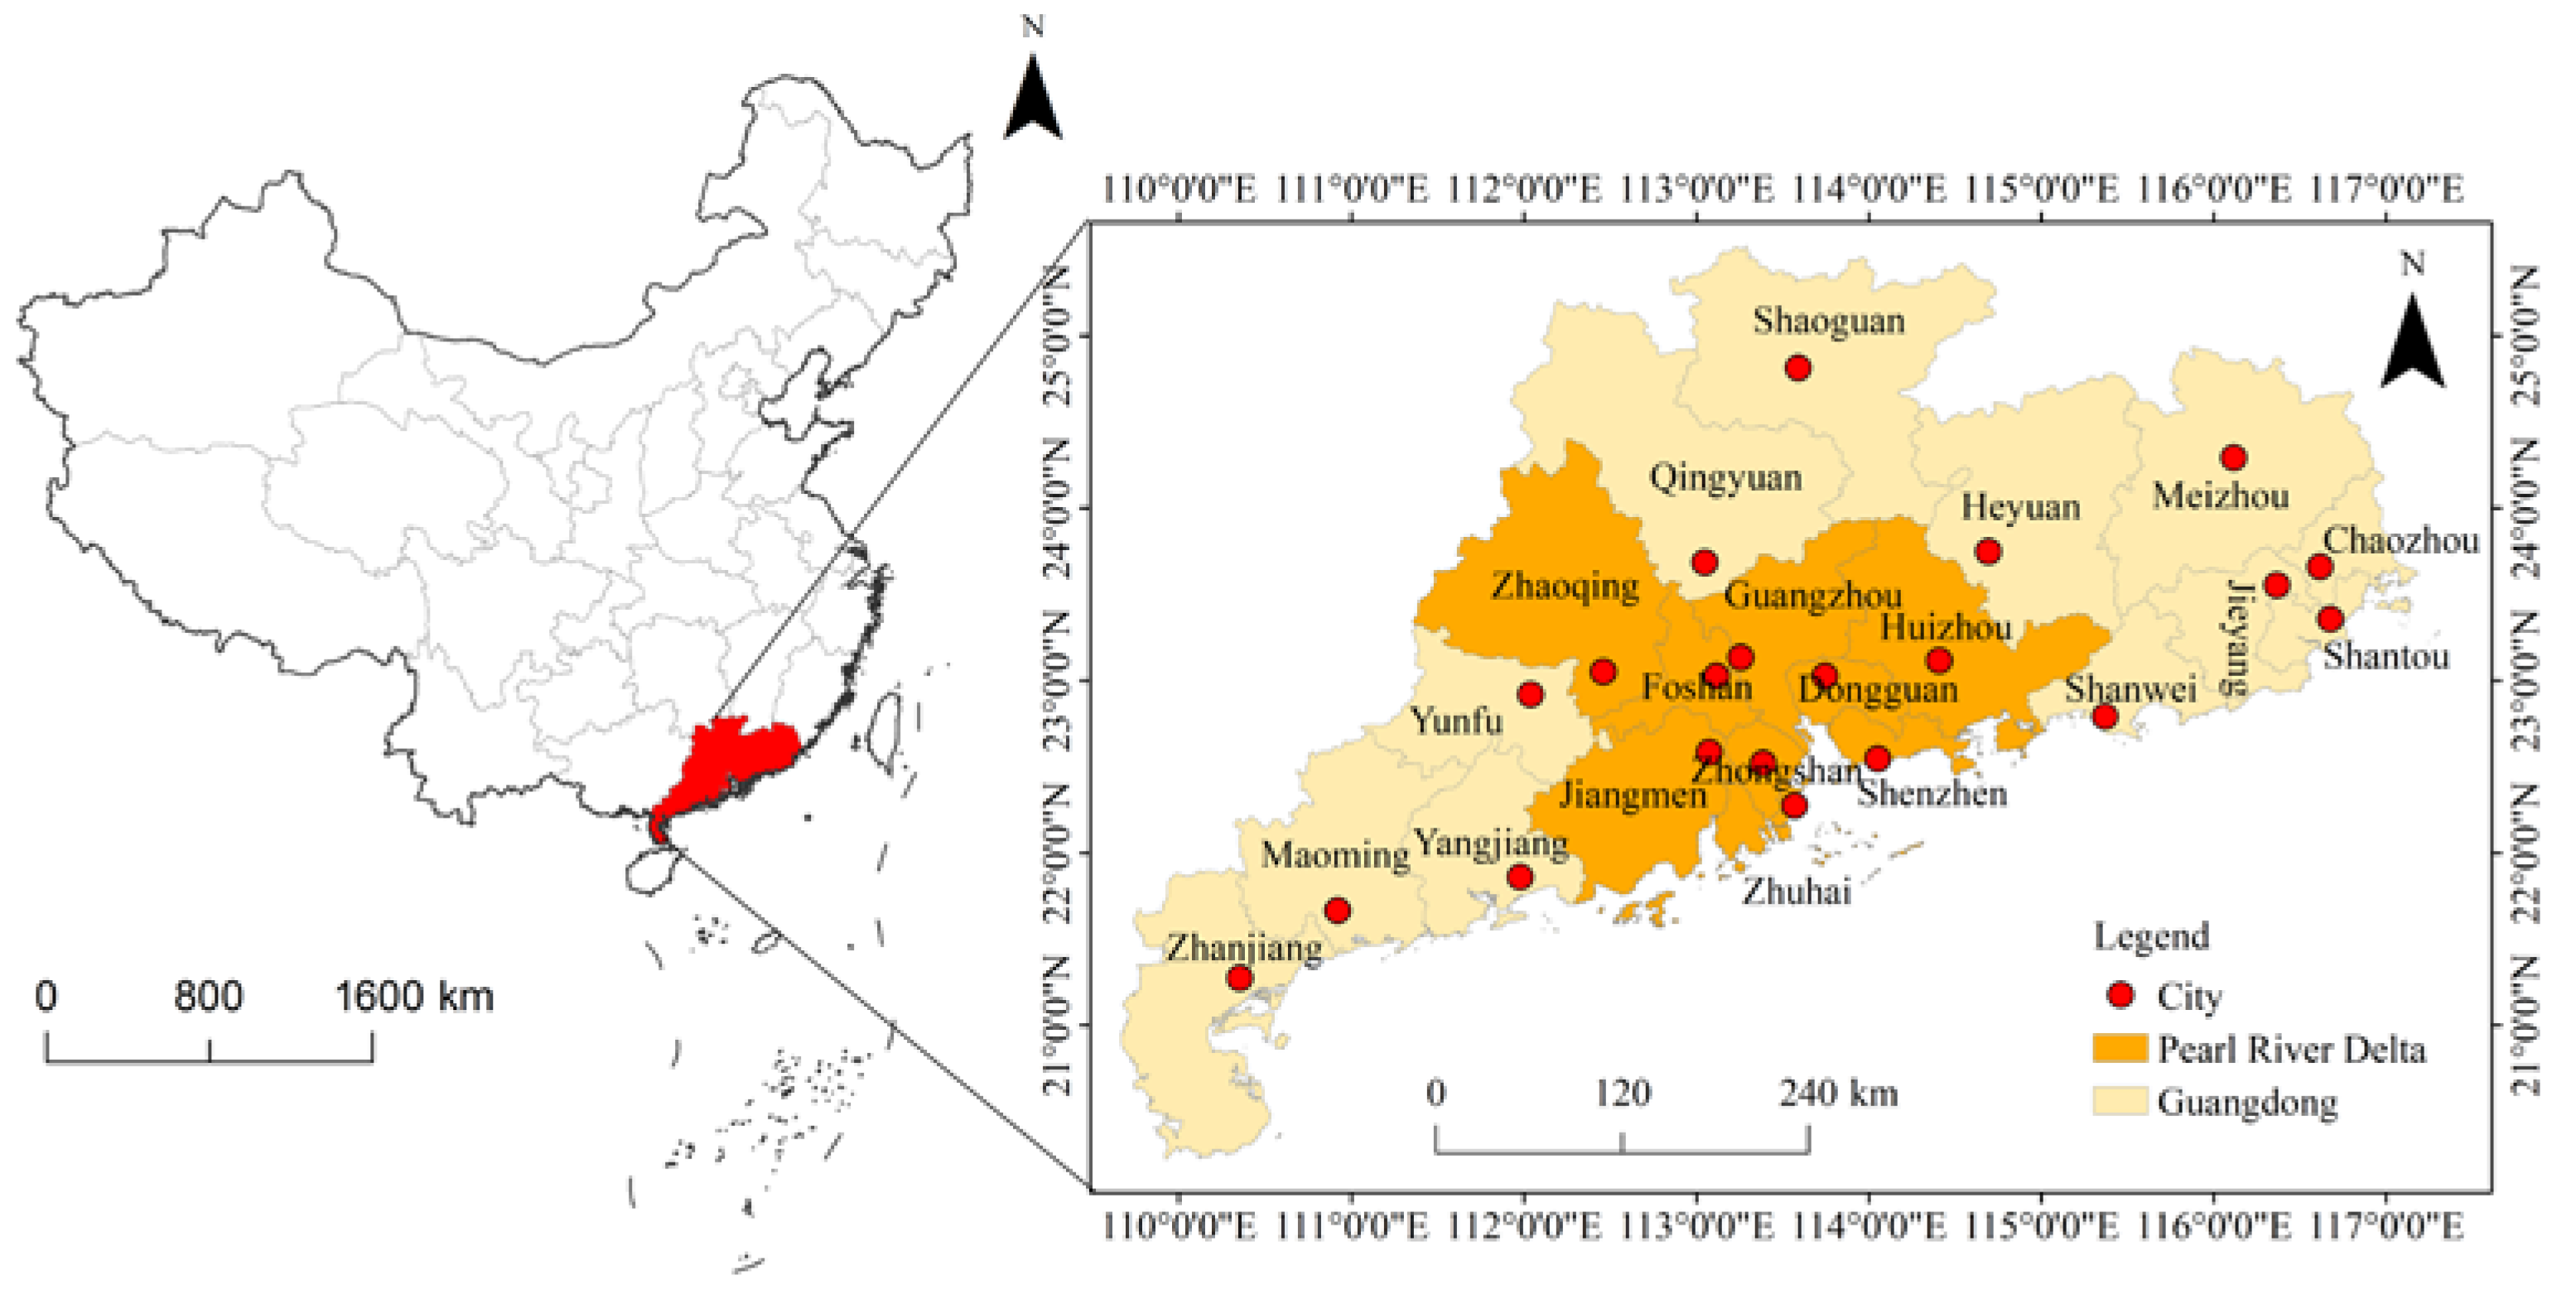
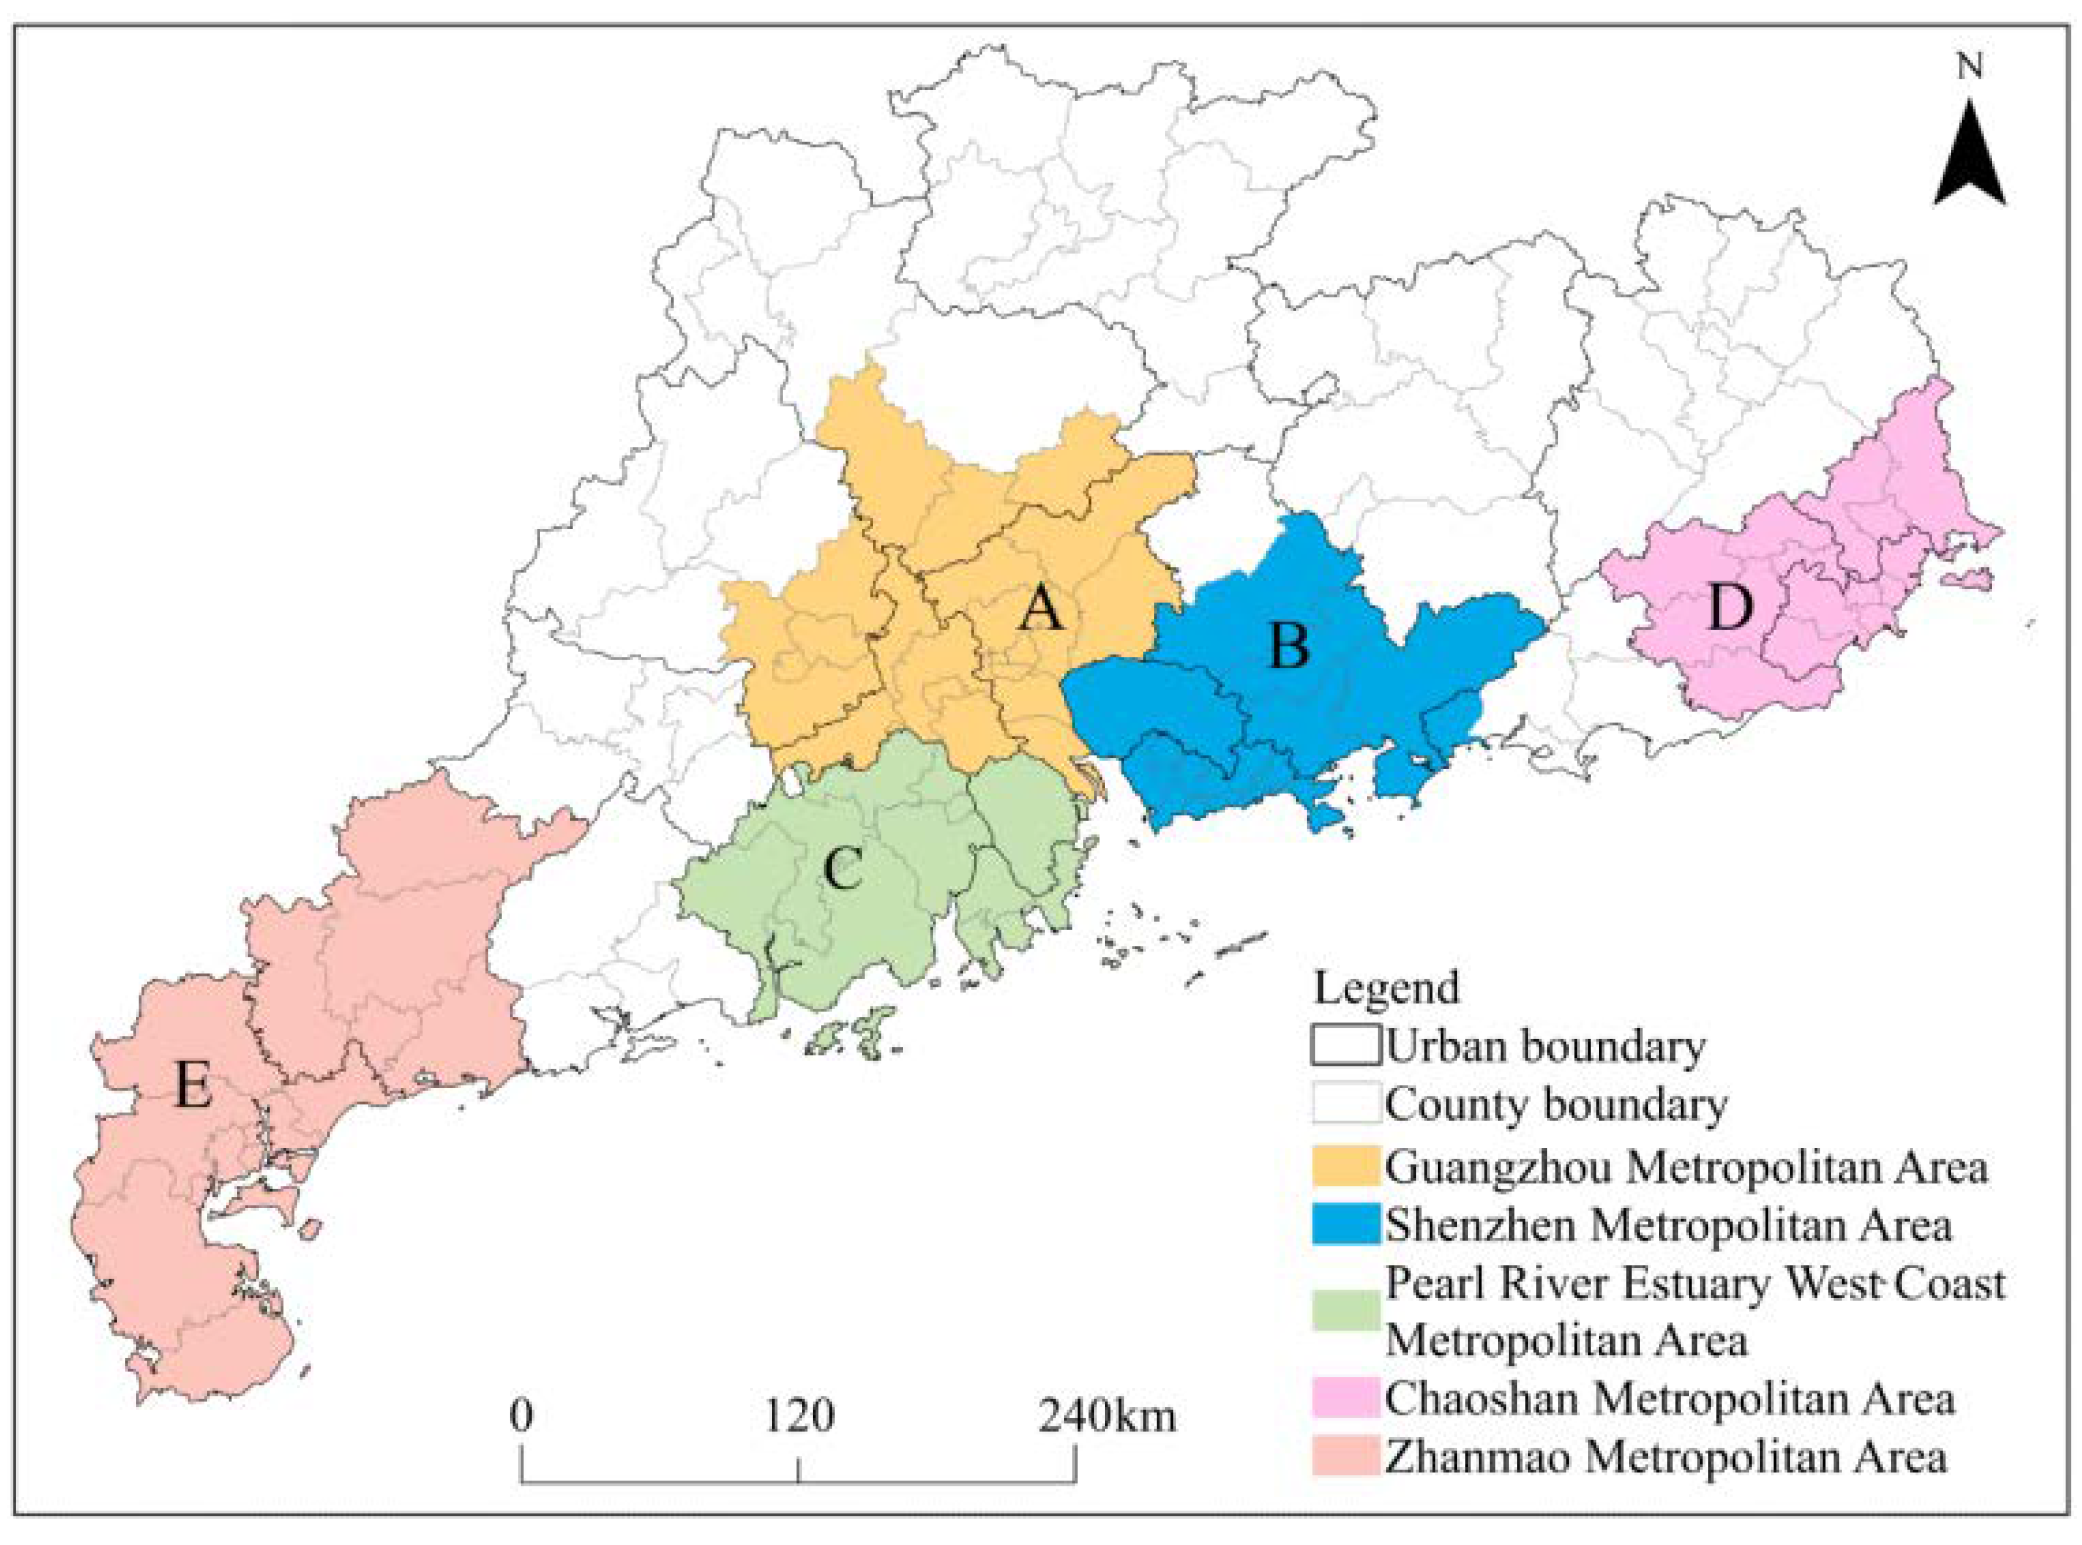
2.1. Study Area

Guangdong Province is one of the areas with the most vigorous economic vitality, rapid population growth, and significant urban expansion in China, and occupies an important position in China’s overall national development. The area of Guangdong accounts for 1.87% of China’s total land area, and its gross domestic product (GDP) was CNY 11,076.094 billion in 2020 [19]. Over the past 20 years, the permanent resident population of Guangdong has increased by 39.7397 million, reaching 126.24 million in 2020, accounting for 8.94% of China’s total population during the same period [19]. Guangdong Province encompasses 21 prefecture-level cities (Figure 1), categorized into four distinct regions: the Pearl River Delta, eastern Guangdong, western Guangdong, and northern Guangdong. The Pearl River Delta (PDR) region commands preeminence as the most economically advanced, densely inhabited, and extensively urbanized zone within Guangdong Province.
Based on the city size classification standard established by the State Council of China [20], Guangzhou and Shenzhen have been classified as super-metropolises, with a permanent population of more than 17 million in 2020. Dongguan and Foshan are classified as hyper-megalopolises, with a permanent population of more than 9 million in 2020. Thirteen cities, including Shantou, Zhongshan, and Huizhou, are classified as metropolises. Meizhou, Heyuan, and Yunfu are medium-sized cities, while Shanwei is a small city. Among them, Guangzhou, Shenzhen, Dongguan, and Foshan are characterized by substantial population sizes, high population density, and pronounced mobility, rendering them particularly susceptible to incidents, disasters, and public health crises [8]. Furthermore, affected by COVID-19, Guangdong experienced a 5.48% decrease in its GDP growth rate in 2020 compared to the previous year. Foreign investment projects decreased by 11.55%, social commodity sales decreased by CNY 274.39 billion, and unemployment increased by 195,900 [19,21].

2.2. Data Sources and Process
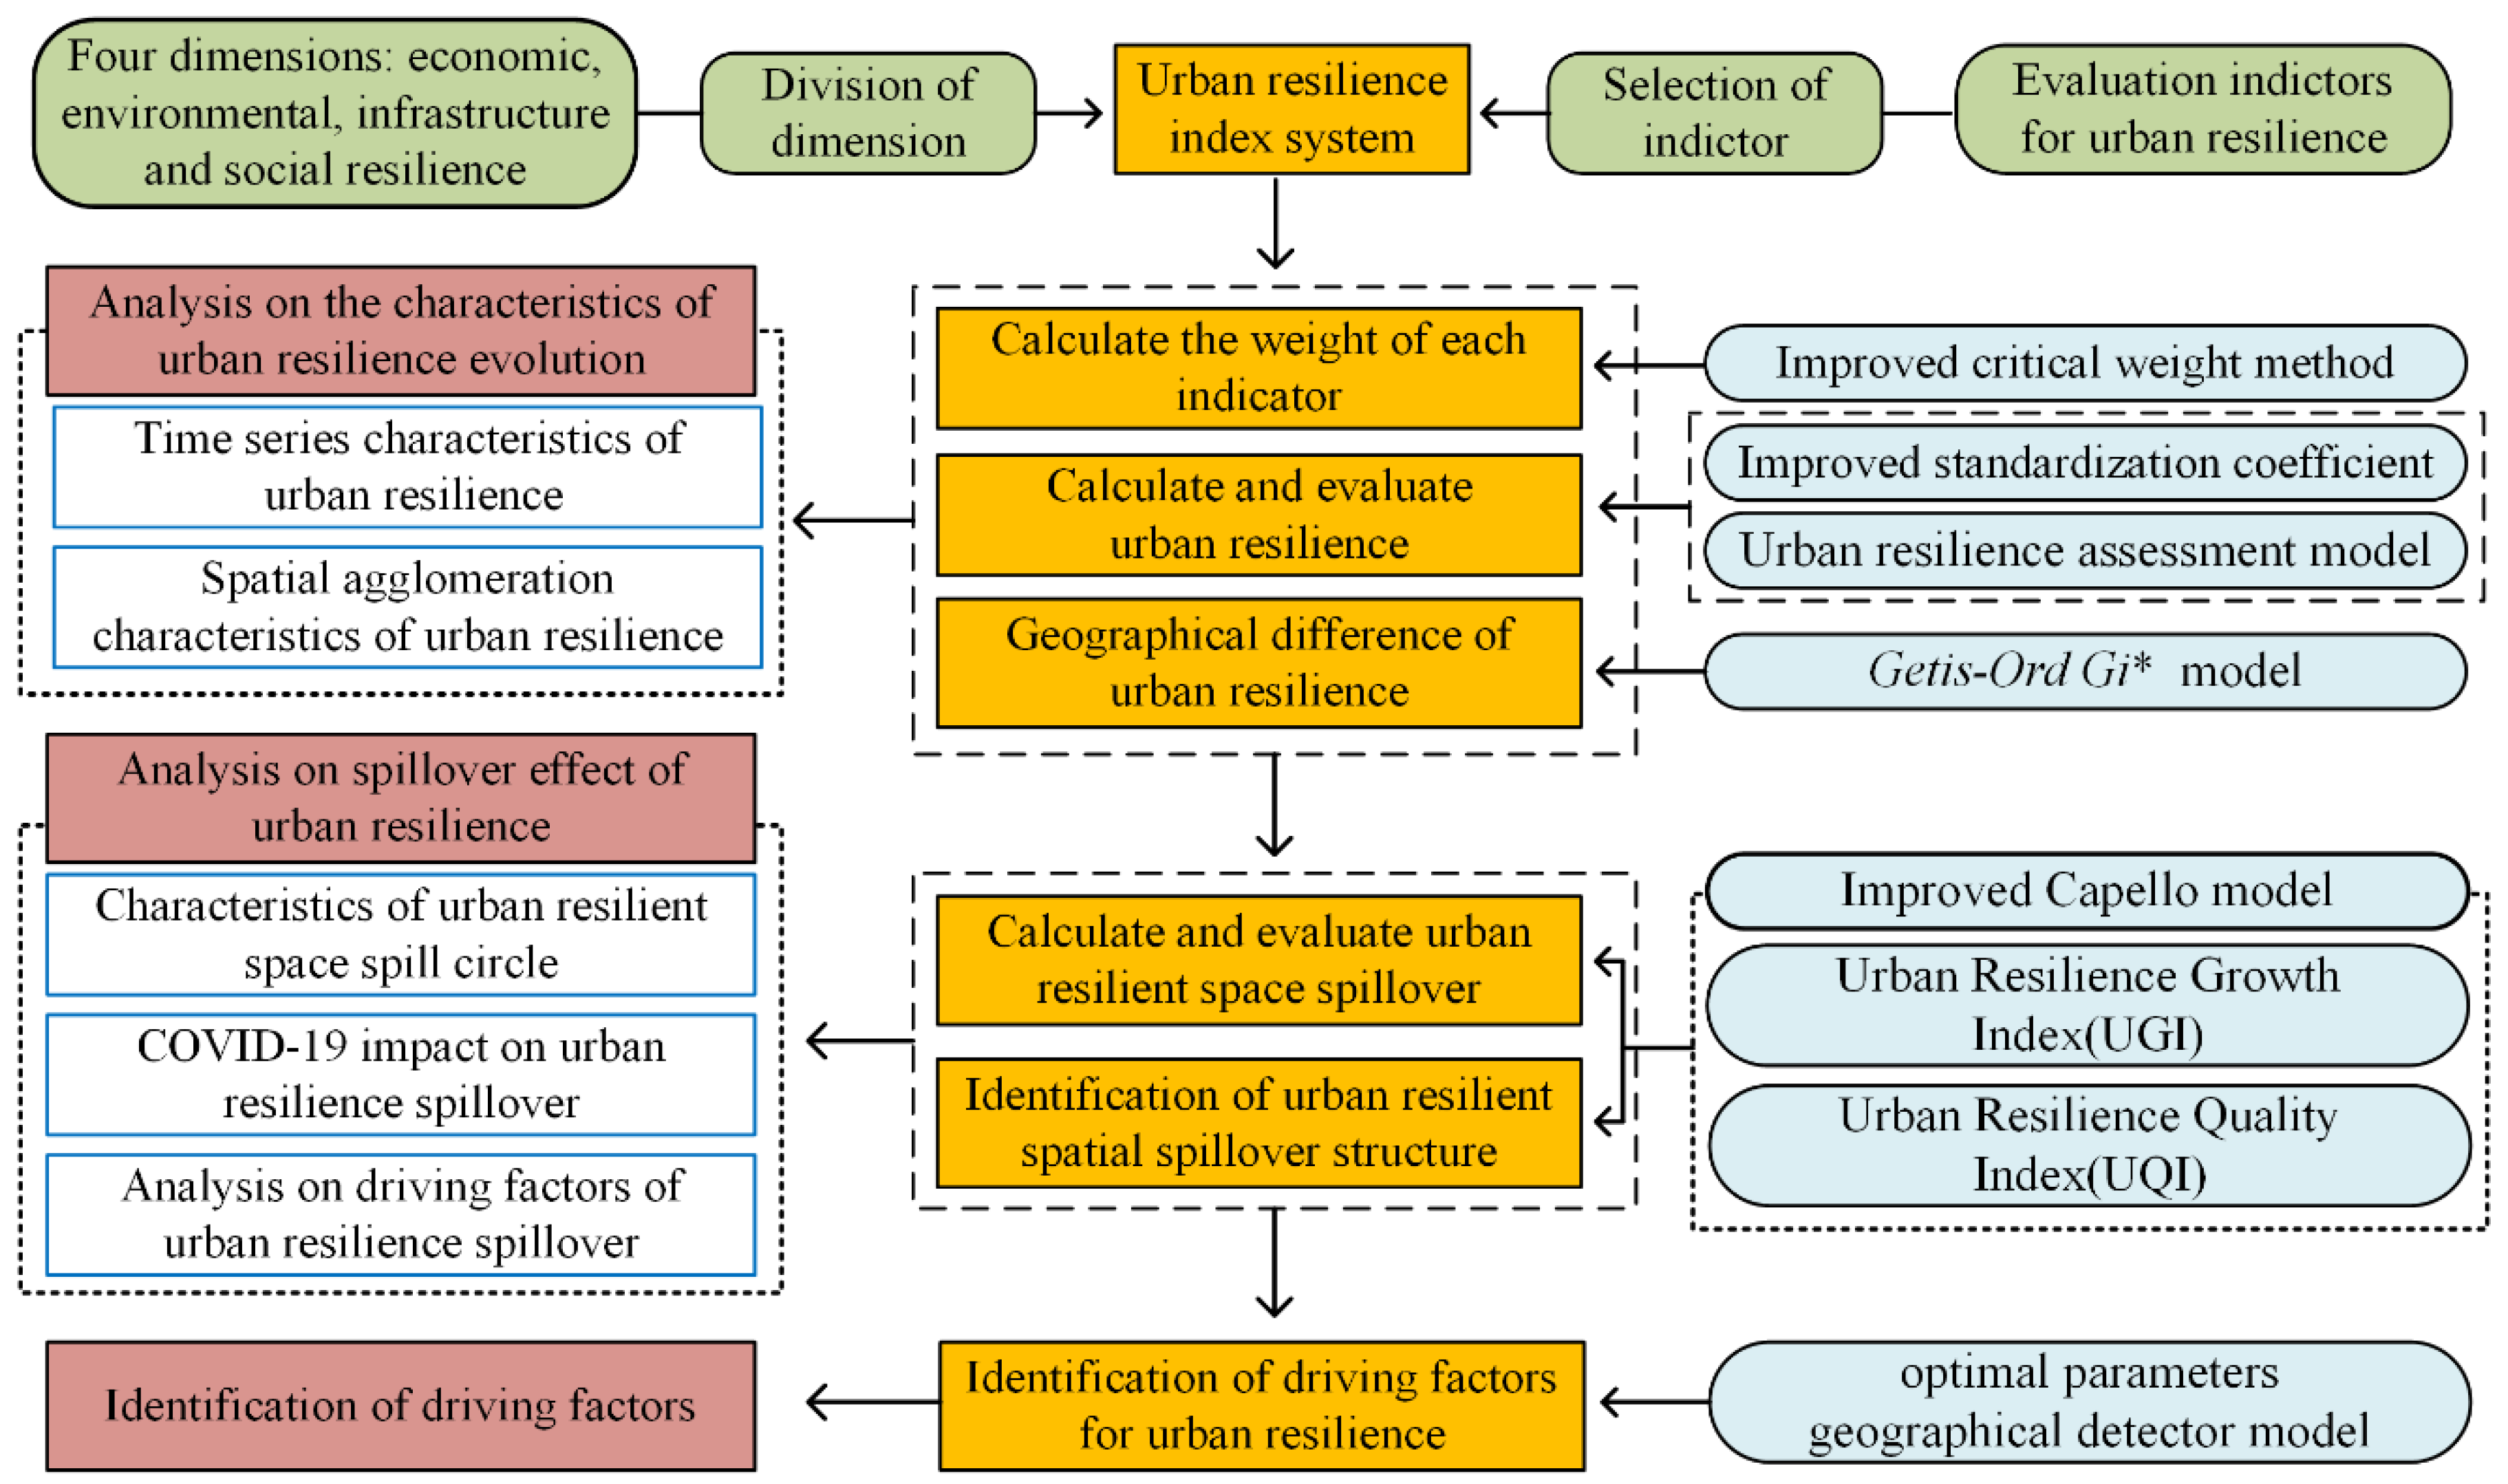
(1) The nighttime light data utilized in this study for the period spanning from 2012 to 2020 were sourced from the NPP-VIIRS-like NTL dataset [22], featuring a spatial resolution of 500 m. (2) The socioeconomic, demographic, and environmental statistics for Guangdong Province covering the same period were gleaned from the China Urban Statistical Yearbook and the Guangdong Statistical Yearbook. (3) The urban traffic distance and traffic time in Guangdong province from 2012 to 2020 were acquired through Baidu Map (https://map.baidu.com/, accessed on 1 July 2022) and AutoNavi Map (https://www.amap.com/, accessed on 1 July 2022). (4) The net vegetation productivity data, digital elevation model (DEM) data, land-use/land-cover data, and urban slope data were acquired through processing on the PIE-Engine cloud platform (https://engine.piesat.cn/dataset-list, accessed on 20 July 2022). Additionally, the source data for urban vegetation net productivity were derived from NASA’s MODIS dataset, featuring a spatial resolution of 500 m. (5) Data regarding particulate matter 2.5 (PM2.5) were made available by the Atmospheric Composition Analysis Group at Dalhousie University, Canada, accessible at the following link: https://sites.wustl.edu/acag/datasets/surface-pm2-5/, accessed on 20 July 2022. (6) Population density data, characterized by a spatial resolution of 100 m, were sourced from WorldPop.
This study employs two key indicators—traffic time and distance—to measure the evolving intercity distances in Guangdong from 2012 to 2020. Given that traffic time and traffic distance represent two distinct evaluation criteria, they inherently present divergent time-series quantification challenges. The standardized index can only standardize indicators of different dimensions simultaneously. To overcome this problem, this paper introduces an improved standardized index [23]:
D a t a n o r ( i , t ) = D a t a ( i , t ) D a t a ( M i n , 2012 ) D a t a ( M a x , 2012 ) D a t a ( M i n , 2012 )
where Datanor(i,t) is the normalized value of an indicator in city i in year t, Data(i,t) is an index value of city i in year t, Data(Min,2012) is the minimum value of the same indicator in 2012, and Data(Max,2012) is the maximum value of the same indicator in 2012.

3. Methodology

This paper uses the urban resilience assessment model, Getis-Ord Gi* model, and optimal-parameters geographical detector model to analyze the temporal and spatial evolution characteristics of urban resilience in Guangdong Province and explore the driving factors of urban resilience. Additionally, the improved Capello model is used to analyze the spatial spillover effect of urban resilience. The analysis process of this study is shown in Figure 2.

3.1. Urban Resilience Measurement Model

3.1.1. Indicator Selection

This study will analyze the spatiotemporal evolution of urban resilience in Guangdong Province in four dimensions: economic, ecological, infrastructural, and social. Economic resilience refers to the ability of the urban economic system to respond to risk shocks and reduce losses flexibly, and it is closely related to factors such as the city’s economic base and industrial structure. Ecological resilience is concerned with the ecological carrying capacity and resilience of cities in the process of urban development and population agglomeration, emphasizing the need for minimizing ecological and environmental costs in exchange for urban development.
Guangdong Province faces challenges such as hazy weather, poorer air quality, and limited urban water supply [24,25,26,27]. In response to the specific conditions prevailing within the study area, we curated a set of nine indicators for quantifying urban ecological resilience. The nine indicators encompass the greening rate of built-up areas, sewage treatment efficiency, proportion of water body area, urban flood vulnerability, industrial wastewater discharge, sulfur dioxide emissions, etc. (Table 1). Moreover, urban flood vulnerability, as indicated in reference [28], was assessed by delineating flood-prone areas within Guangdong Province and calculating urban flood vulnerability based on parameters such as total population and total nighttime light within these flood-affected regions. Infrastructure resilience refers to cities with well-developed transportation and medical systems that can help overcome the adverse cascading effects of extreme events between urban systems and guarantee residents’ basic needs. Social resilience emphasizes the city’s ability to respond to external pressures brought about by changes in the social environment and reflects the vitality of urban development [8]. This paper presents 32 urban resilience indicators in Table 1.

3.1.2. Indicator Weight Calculation

The CRITIC weight method is an objective weighting method based on data volatility proposed by Diakoulaki [29]. Compared with other methods, the CRITIC weight method can better consider the contrast intensity and conflict between evaluation indicators. However, the traditional CRITIC weight method does not account for the dispersion degree of the indicators and only uses the standard deviation to consider the comparative intensity of the indicators. This paper utilized the improved CRITIC weight method to calculate the weight of urban resilience indicators. When quantifying information fluctuations within urban resilience indicators, we used correlation coefficients in the calculations, considering the interrelationships among the indicators. In addressing conflicts that might have arisen among various urban resilience indicators, this study takes the absolute value of the correlation coefficient, which neutralizes distinctions between positive and negative correlations, rendering the resolution of conflicts among indicators more consistent and streamlined. The improved CRITIC weight method is as follows:
C i = s i i = 1 n ( 1 r i j )
w i = C i i = 1 n C i
where Ci is the degree of influence of the i-th evaluation index on the urban resilience evaluation system. When Ci is larger, the i-th evaluation index plays a greater role in the whole evaluation index system and should be assigned more weight. si is the standard deviation of the index i. rij is the correlation coefficient between the evaluation indicators i and j. The correlation coefficient of the improved CRITIC weight method is calculated by using Pearson’s correlation coefficient, and the absolute value of the correlation coefficient is taken, where wi is the weight value of the ith evaluation index [29].

3.1.3. Urban Resilience Calculation

The constructed evaluation model formula of urban resilience is as follows:
U R t = i = 1 n ( w i x n o r ( i , t ) )
where URt is the resilience of the city in year t, and n is the number of variables. A total of 32 variables are used in the urban resilience assessment in this paper, so n is 32. Wi is the weight of the ith factor. Xnor(i,t) is the normalized value of the ith factor in year t, which is calculated using the improved standardized index (Formula (1)). The larger the UR value, the higher the urban resilience.

3.2. Getis-Ord Gi* Model

The Getis-Ord Gi* model can measure the statistics of whether there is a spatial correlation between each observation value and adjacent environmental elements, and it can accurately discover the spatial clustering of high-value or low-value elements [30,31]. This study uses the Getis-Ord Gi* model to identify high-value clusters of urban resilience in Guangdong from 2012 to 2020. The Getis-Ord Gi* model is as follows:
G i = j = 1 n w ( i , j ) x j x ¯ j = 1 n w ( i , j ) S [ n j = 1 n w ( i , j ) 2 ( j = 1 n w ( i , j ) ) 2 ] n 1
x ¯ = j = 1 n x j n
S = j = 1 n x j 2 n ( x ¯ ) 2
where xj is the urban resilience value of city j, W(i,j) is the spatial weight between city i and city j, and n is the total number of cities. The Z score is the statistical value of urban resilience returned for each city. When the Z score is positive and higher, the clustering of high values of urban resilience (hot spots) is tighter. Furthermore, the lower the Z score, the tighter the clustering of low values of urban resilience (cold spots) [30,31].

3.3. Improved Capello Model

Regional interconnection and interaction lead to spatial spillover effects between regions, and revealing the regional spillover effects is of great significance for clarifying the laws of regional development. Capello classifies spatial spillovers such as economic spillovers, industrial spillovers, and knowledge spillovers, and explains the inherent properties and spatial scale differences of these spatial spillovers [32]. Based on the cognition of spatial spillover, Capello proposed the Capello model to analyze the spatial spillover effect of the regional economy quantitatively. However, some scholars who have applied the Capello model to the study of regional economic spillover effects have only considered economic growth factors, ignoring the quality of the regional economy. This paper uses the gravity model [23] to improve the Capello model and considers the impact of urban resilience growth rate and urban resilience quality on spillover effects. Furthermore, to obtain a more accurate quantification of the distance between cities, this study uses a combination of traffic distance (sd) and traffic time (td) to quantify the distance between cities. The improved Capello model is as follows:
T U R S ( i , T ) = i = 1 n ( w ( i , T ) U R G n o r ( i , T ) + U R P nor ( i , T ) s d n o r ( i , j , T ) + t d n o r ( i , j , T ) )
w ( i , T ) = w ( i , t 1 ) + w ( i , t 2 ) 2
where TURS(i,T) is the total urban resilience spillover of city i, n is the number of cities in the study area, w(i,t2) is the proportion of city i in the total urban resilience of the study area in year t2, and T is the study period, which is [t1,t2]. The research periods of this paper are 2012–2014, 2014–2015, 2015–2018, 2018–2019, and 2019–2020. sd(i,j,T) refers to the optimal traffic distance (unit: km) between city i and city j in period T. tdnor(i,j,T) is the optimal traffic distance time between city i and city j in period T (unit: min). Among them, sdnor(i,j,T), tdnor(i,j,T), URGnor(i,,T), URPnor(i,,T) are the use of the improved standardized index (Equation (1)) on sd(i,j,T), td(i,j,T), URG(i,,T) (Equation (10)), and URP(i,,T) (Equation (11)) after calculation, respectively.
The Urban Resilience Growth Index (URG) is the average annual urban resilience growth rate. The Urban Resilience Quality Index (URP) refers to the improved standardized index, uses the period from 2012 to 2014 as the benchmark for quantifying the quality of urban resilience, and quantifies the changes in the quality of urban resilience in time series. The formulae for URG and URP are as follows:
U R G ( i , T ) = U S ( i , t 2 ) U S ( i , t 1 ) U S ( i , t 1 ) / ( t 2 t 1 )
U R P ( i , T ) = U S ( i , t 1 ) + U S ( i , t 2 ) i = 1 n ( U S ( i , 2012 ) + U S ( i , 2014 ) ) / n
where URG(i,T) is the average annual urban resilience growth value of city i during the research period T. US(i,t1) and US(i,t2) are the urban resilience of city i in years t1 and t2, respectively. URP(i,T) is the urban resilience quality of city i. US(i,2012) and US(i,2014) are the urban resilience values of city i in 2012 and 2014, respectively, and n is the number of cities.

3.4. Optimal-Parameters Geographical Detector (OPGD)

Geographic detectors are a statistical method that can detect the spatial heterogeneity of natural, economic, and social phenomena and reveal the driving force(s) behind them [33]. However, when traditional geographic detectors discretize the driving factors, they are based on professional experience rather than data-driven methods, which may lead to a lack of objectivity in research. The optimal-parameters geographical detector (OPGD) model uses equal breaks, natural breaks, quantile breaks, geometric breaks, and standard deviation breaks to discretize driving factors, and the discretization effect of factors can be evaluated using q statistics. The OPGD model can overcome the excessive subjectivity present in the data discretization processing of conventional geographic detectors [34]. This paper selects 14 driving factors (Table 2) and combines with the OPGD model to identify the critical driving factors of urban resilience in Guangdong Province from 2012 to 2020. The optimal discretization method and the number of optimal division levels for driving factor values are shown in Table 3.

4. Results and Analysis

4.1. Spatiotemporal Evolution of Urban Resilience

4.1.1. Temporal Evolution of Urban Resilience

The urban resilience measurement model (Equation (5)) was used to analyze the urban resilience’s spatial and temporal evolution. The results showed that the urban resilience of Guangdong Province increased from 2012 to 2019, followed by a subsequent decline from 2019 to 2020 (Figure 3). From 2012 to 2019, Guangdong’s urban resilience rose from 3.976 to 5.975, with an average annual growth rate of 7.18%. Affected by the adverse impact of COVID-19, the urban resilience in Guangdong Province decreased from 5.975 to 5.874 in 2020. Additionally, 42.86% of cities showed negative growth in urban resilience. Although COVID-19 has had a significant negative impact on cities with tertiary-led industries and regional centers, it has also contributed to narrowing the gap in regional urban resilience.
Since COVID-19 reduced mobility for both people and goods, Guangzhou and Shenzhen, where the output value of the service sector accounts for the highest proportion of GDP in the region, exhibited negative urban resilience growth [19]. Moreover, Guangzhou and Shenzhen’s urban functions and positioning were the main reasons for their declining urban resilience. In 2020, 1394 cumulative new coronavirus cases were confirmed in Guangzhou and Shenzhen, representing 68.13% of confirmed cases throughout Guangdong Province [35]. Since Guangzhou and Shenzhen are important regional transportation hub cities and economic, cultural, and technological centers, they had larger mobile populations, leading to a higher frequency, with long outbreak prevention and control times, negatively impacting their urban resilience. In contrast, some small and medium-sized cities still maintained positive growth in their urban resilience in 2020, as they were less affected by COVID-19. The standard deviation of urban resilience in Guangdong Province decreased to 0.176 from 0.180 in 2019, indicating that COVID-19 improved the coordination of urban resilience in Guangdong Province.

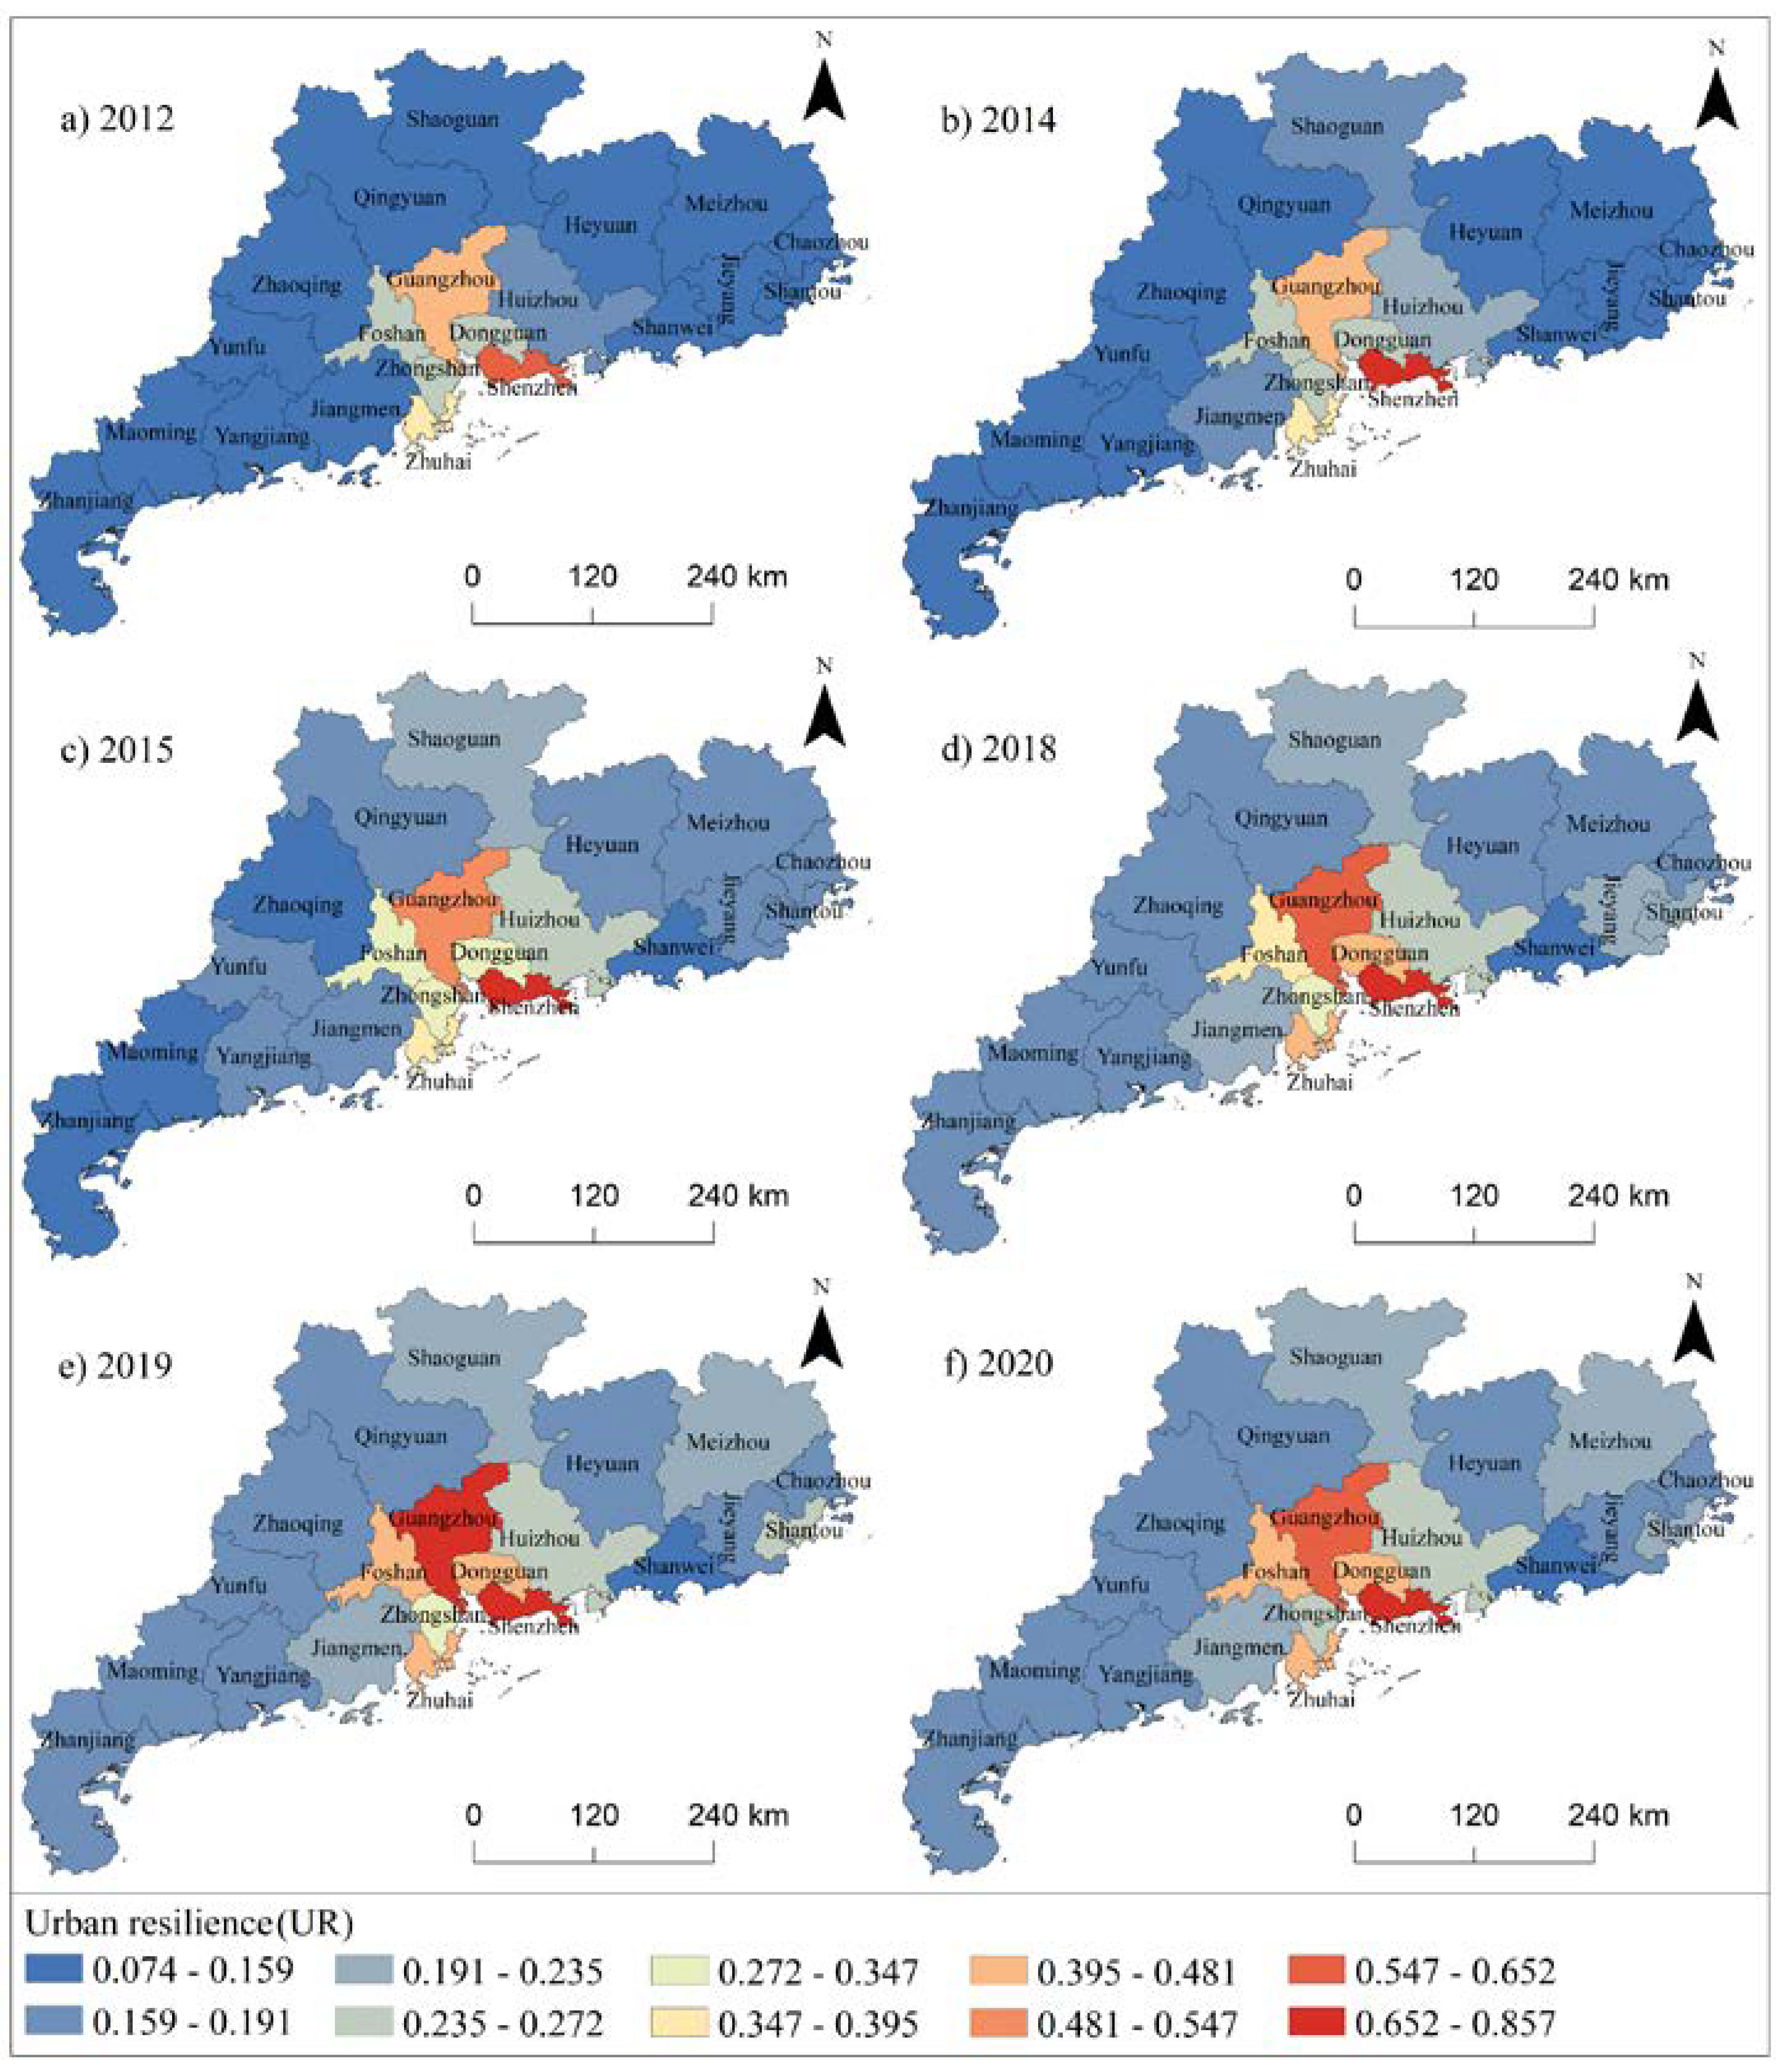
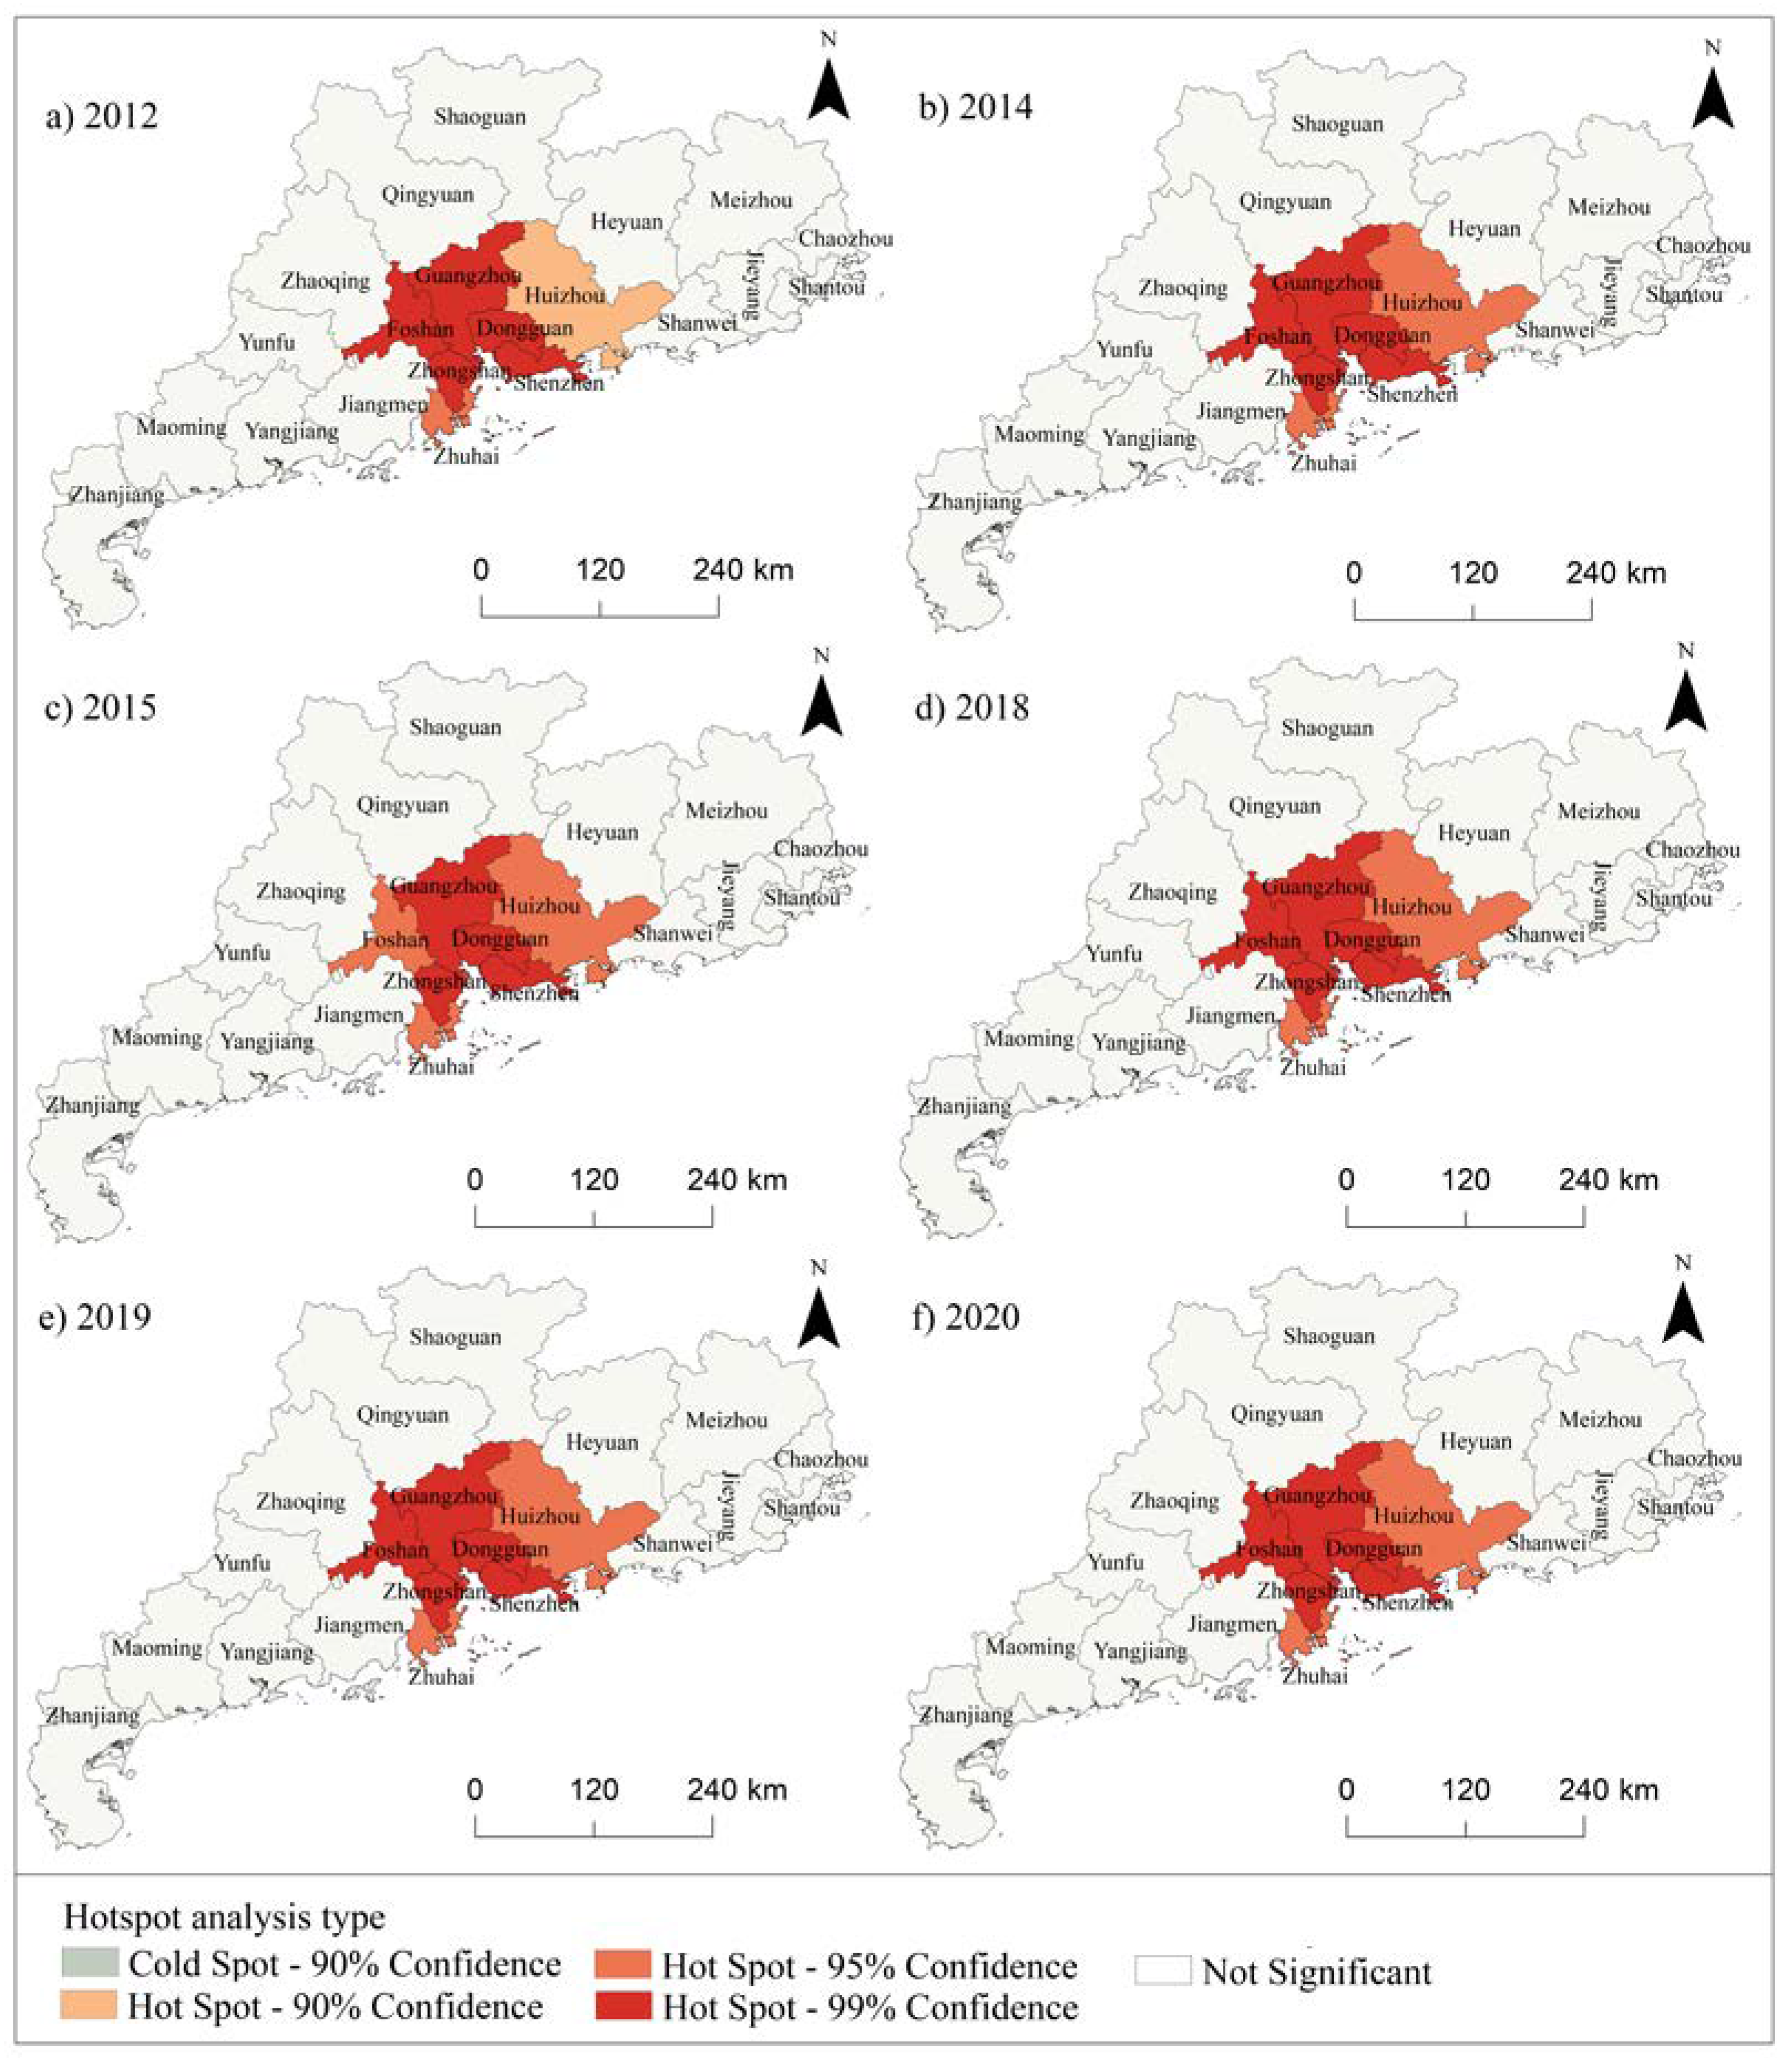
4.1.2. Spatial Evolution of Urban Resilience

We used the Getis-Ord Gi* model to identify high-value urban resilience agglomeration areas. Significant imbalances in the spatial distribution of urban resilience in Guangdong Province were characterized by “faults” in urban resilience. Guangzhou, Dongguan, Shenzhen, Foshan, Zhongshan, Huizhou, and Zhuhai in the Pearl River Delta (PDR) showed high-value agglomerations of urban resilience, while the eastern, northern, and western regions of Guangdong were the “collapse zones” of urban resilience (Figure 4). Guangzhou, Dongguan, Shenzhen, Foshan, and Zhongshan exhibited hot-spot 95% confidence, indicating high-value urban resilience from 2012 to 2020. Huizhou and Zhuhai were the next highest-value agglomerations of urban resilience. Zhuhai was identified as a hot spot of 95% confidence, while Huizhou’s hot-spot type varied between 90% confidence and 95% confidence.
The urban resilience of high-value agglomerations accounts for 55.07% to 59.92% of Guangdong Province. Additionally, the urban resilience of cities in eastern, northern, and western Guangdong has consistently remained below 0.229, which denotes the “collapse zone” for urban resilience (Figure 3). This situation can be attributed to the lower level of economic development in these regions, along with the negative impact of the “collapse zones“ in the PDR. As a result, a portion of the labor force and production factors has migrated to cities in the Pearl River Estuary, leading to lower economic, infrastructure and social resilience levels in these areas.

4.2. Analysis of the Spillover Effect of Urban Resilience

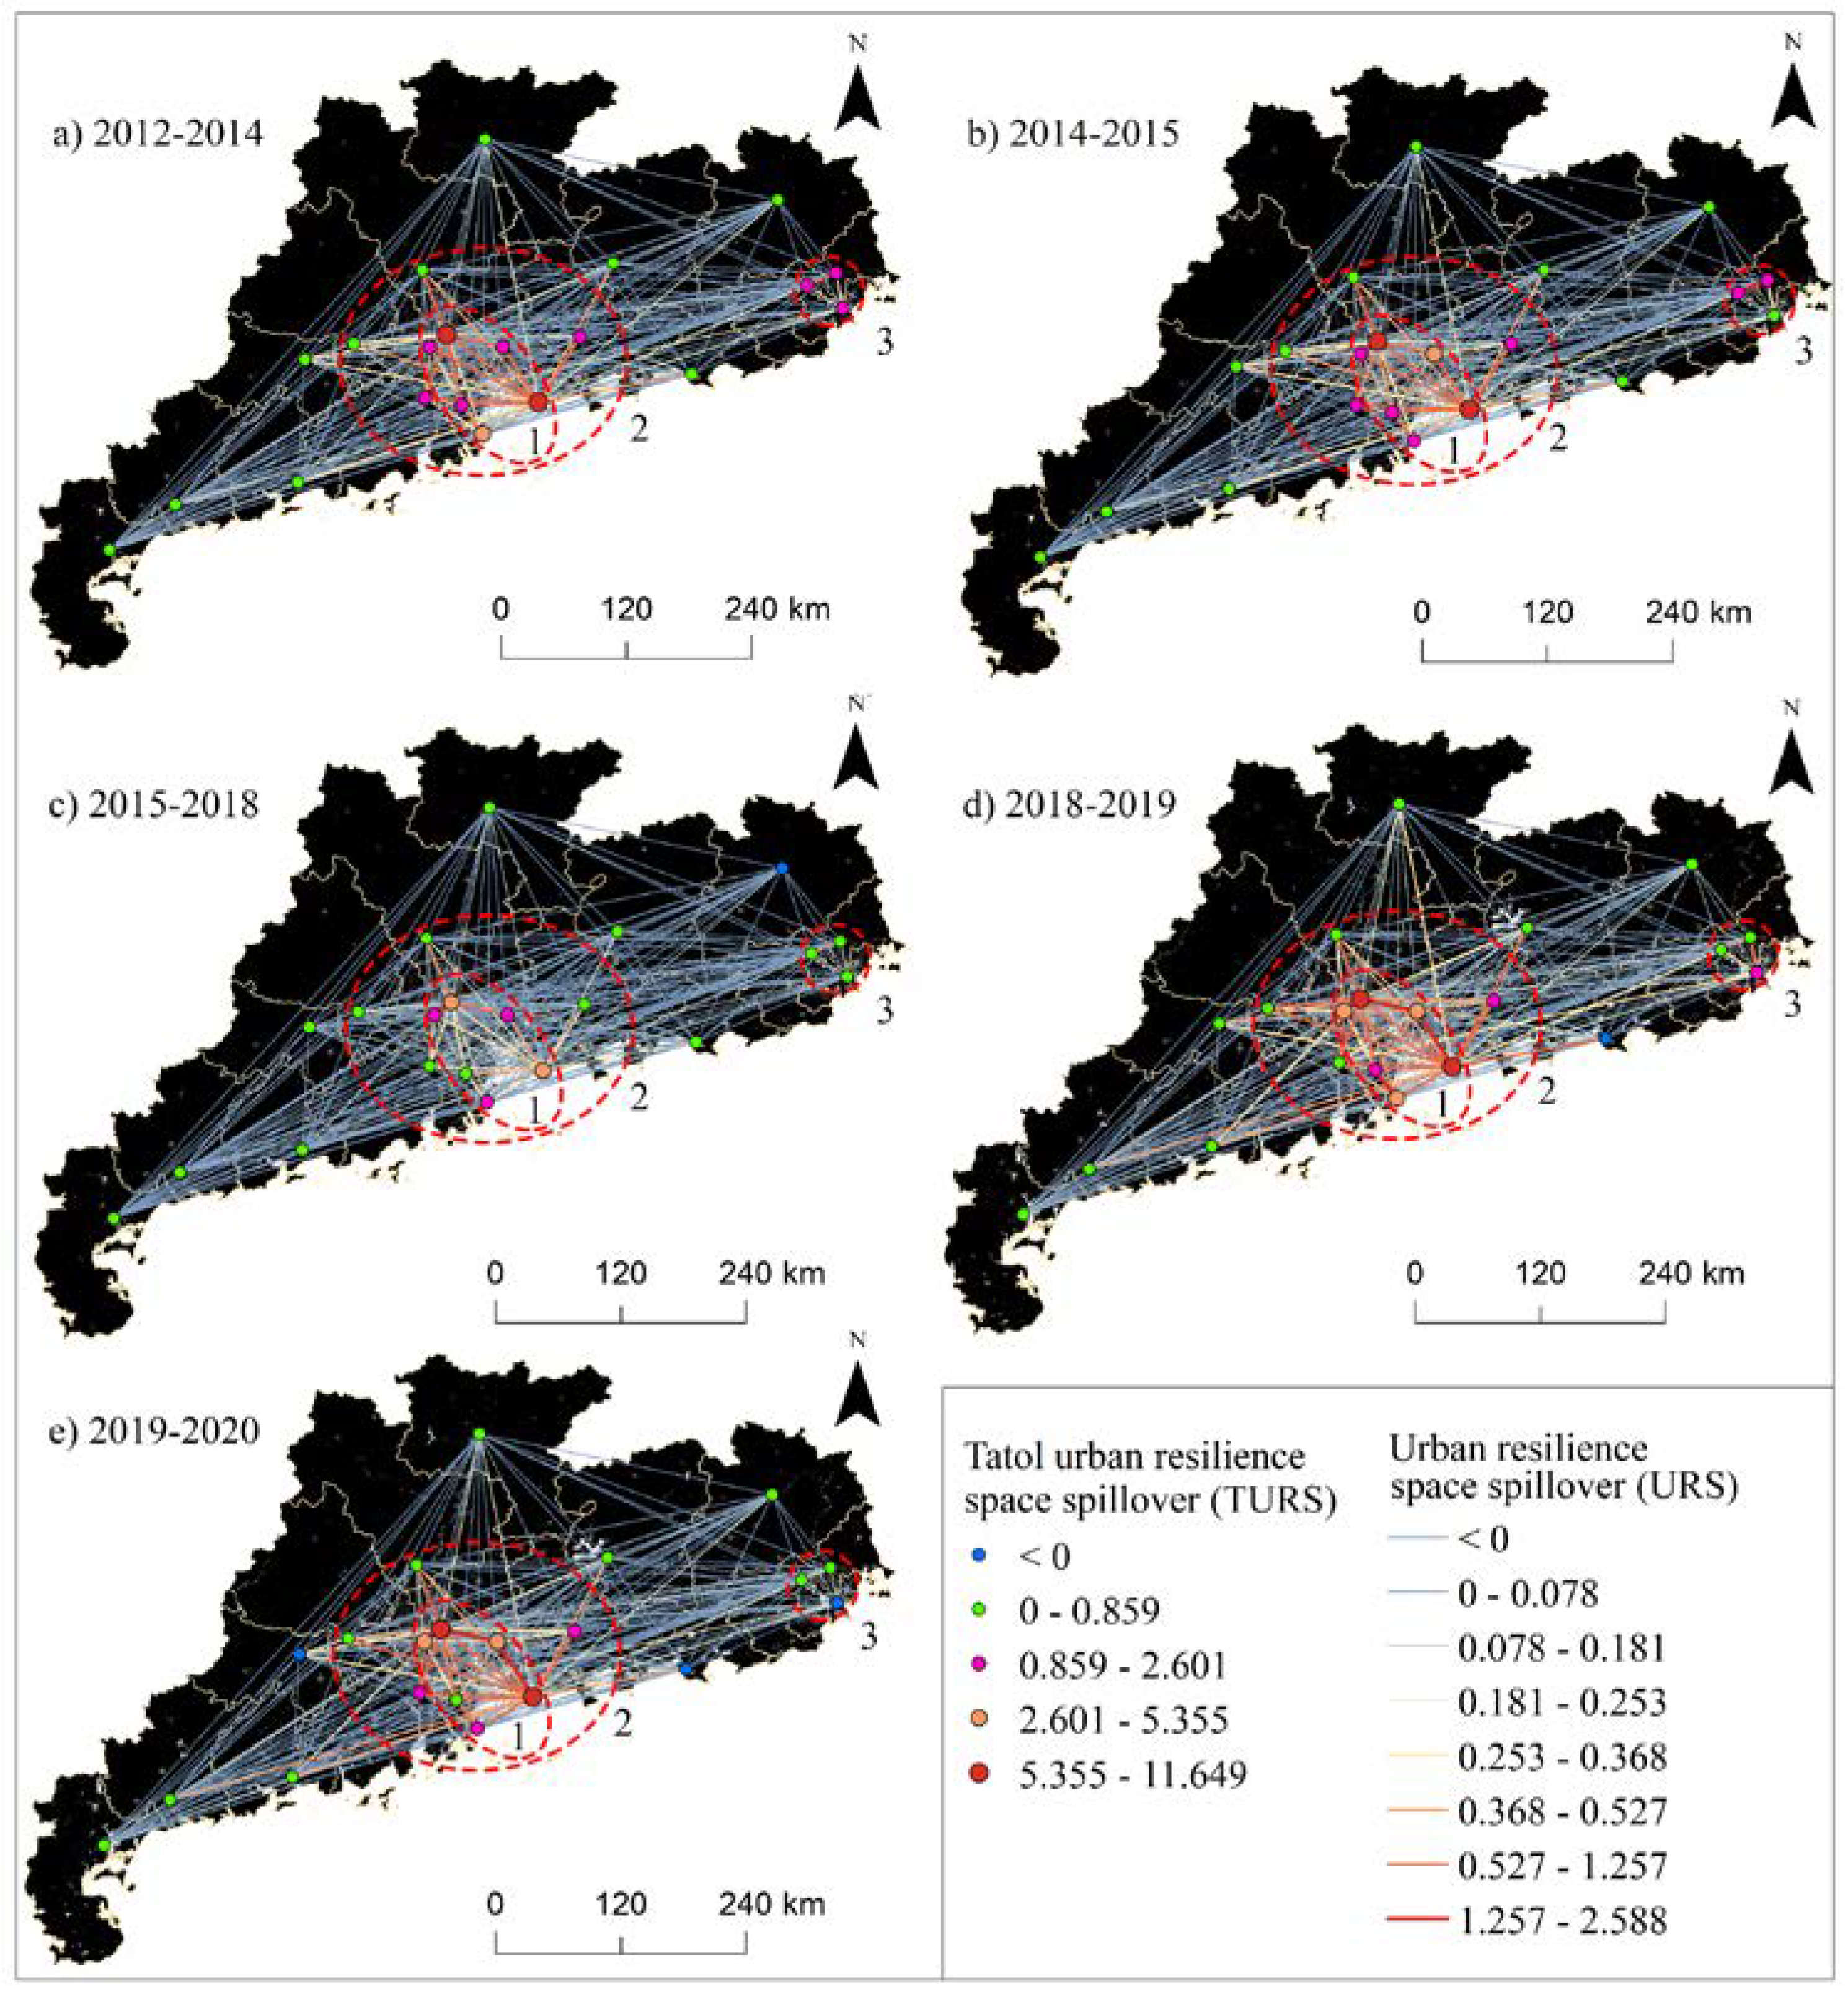
4.2.1. Spatial Spillover Structure of Urban Resilience

The improved Capello model (Equation (9)) was used to analyze the spillover effect of urban resilience in Guangdong from 2012 to 2020. The results revealed a significant three-level circle structure of “core-subcore-periphery” in terms of the intensity of the effect of spatial spillover on urban resilience. The core circle (Figure 5 (1)) encompassed six cities around the Pearl River Estuary, namely, Guangzhou, Foshan, Dongguan, Shenzhen, Zhongshan, and Zhuhai. The subcore circle consisted of the central subcore circle (Figure 5 (2)) and the Chaoshan subcore circle (Figure 5 (3)). The central subcore circle (Figure 5 (2)) comprised Huizhou, Qingyuan, Zhaoqing, and Jiangmen, while the Chaoshan subcore circle included Chaozhou, Jieyang, and Shantou. The peripheral circle encompassed Meizhou, Yunfu, Shanwei, Heyuan, Shaoguan, Maoming, Zhanjiang, and Yangjiang. Among these, the core circle exhibited the highest density and intensity of spatial spillover of urban resilience, with its total spatial spillover of urban resilience (TURS) accounting for 68.44% to 86.82% of Guangdong Province.
The spatial spillover intensity of urban resilience in Guangdong Province exhibits a gradient decay from the core circle to the peripheral circle. Although the core circle (Figure 5 (1)) has a radiation effect on the Chaoshan subcore circle (Figure 5 (3)) and the peripheral circle, the intensity of urban resilience spillover (URS) is limited, mostly ranging from 0.078 to 0.253. This restriction is due to the existence of mountainous terrain in the northern, western, and eastern regions of the Pearl River Delta (PRD), including the Jiu Lian Mountains, Tian Lu Mountain Range, Yun Wu Mountain Range, and Lotus Mountain Range, which impede the flow of resilience from the core circle into the peripheral and Chaoshan subcore circles.
The core circle is geographically adjacent to the central subcore circle (Figure 5 (2)), and these two circles are closely linked, with the URS mostly ranging from 0.181 to 0.527. The cities in the central subcore circle have certain advantages, including lower land rent and cheaper labor, which facilitate the transfer of industries from the core circle. They also exhibit a well-established industrial division of labor and cooperation with the core circle. Additionally, both circles have well-developed transportation systems, facilitating the swift transportation of resilience factors. On the other hand, the presence of the Pearl River Estuary impedes the flow of urban resilience factors within the core circle, which is situated on the east and west banks of the river. However, this hindrance indirectly facilitates the flow of urban resilience factors from the core circle to the central subcore circle.

4.2.2. Spatial Distribution Characteristics of Urban Resilience Spillover Intensity

COVID-19 has had a significant adverse impact on the spillover effect of urban resilience in Guangdong Province. The total urban resilience spillover (TURS) in Guangdong Province decreased by 27.21% to 32.919 from 2019 to 2020. The TURS of the core circle also dropped by 11.296, accounting for 91.80% of the total TURS decline in Guangdong Province. The COVID-19 pandemic has also narrowed the TURS gap between the core and central subcore circles. The core circle region recorded 1781 newly confirmed coronavirus cases in 2020, comprising 87.05% of all confirmed cases in Guangdong Province [35]. COVID-19 has led to restrictions on economic exchange, logistics, transportation, and the movement of people in their cities, negatively impacting their urban resilience spillover. The TURS of the core circle decreased by 40.39% from 2018–2019 to 2019–2020, measuring at 27.968. Moreover, the TURS of the central subcore circle increased from 2.066 to 3.479. Consequently, the gap between the TURS of the core circle and the central subcore circle reduced from 19.00 times to 8.04 times from 2019 to 2020.

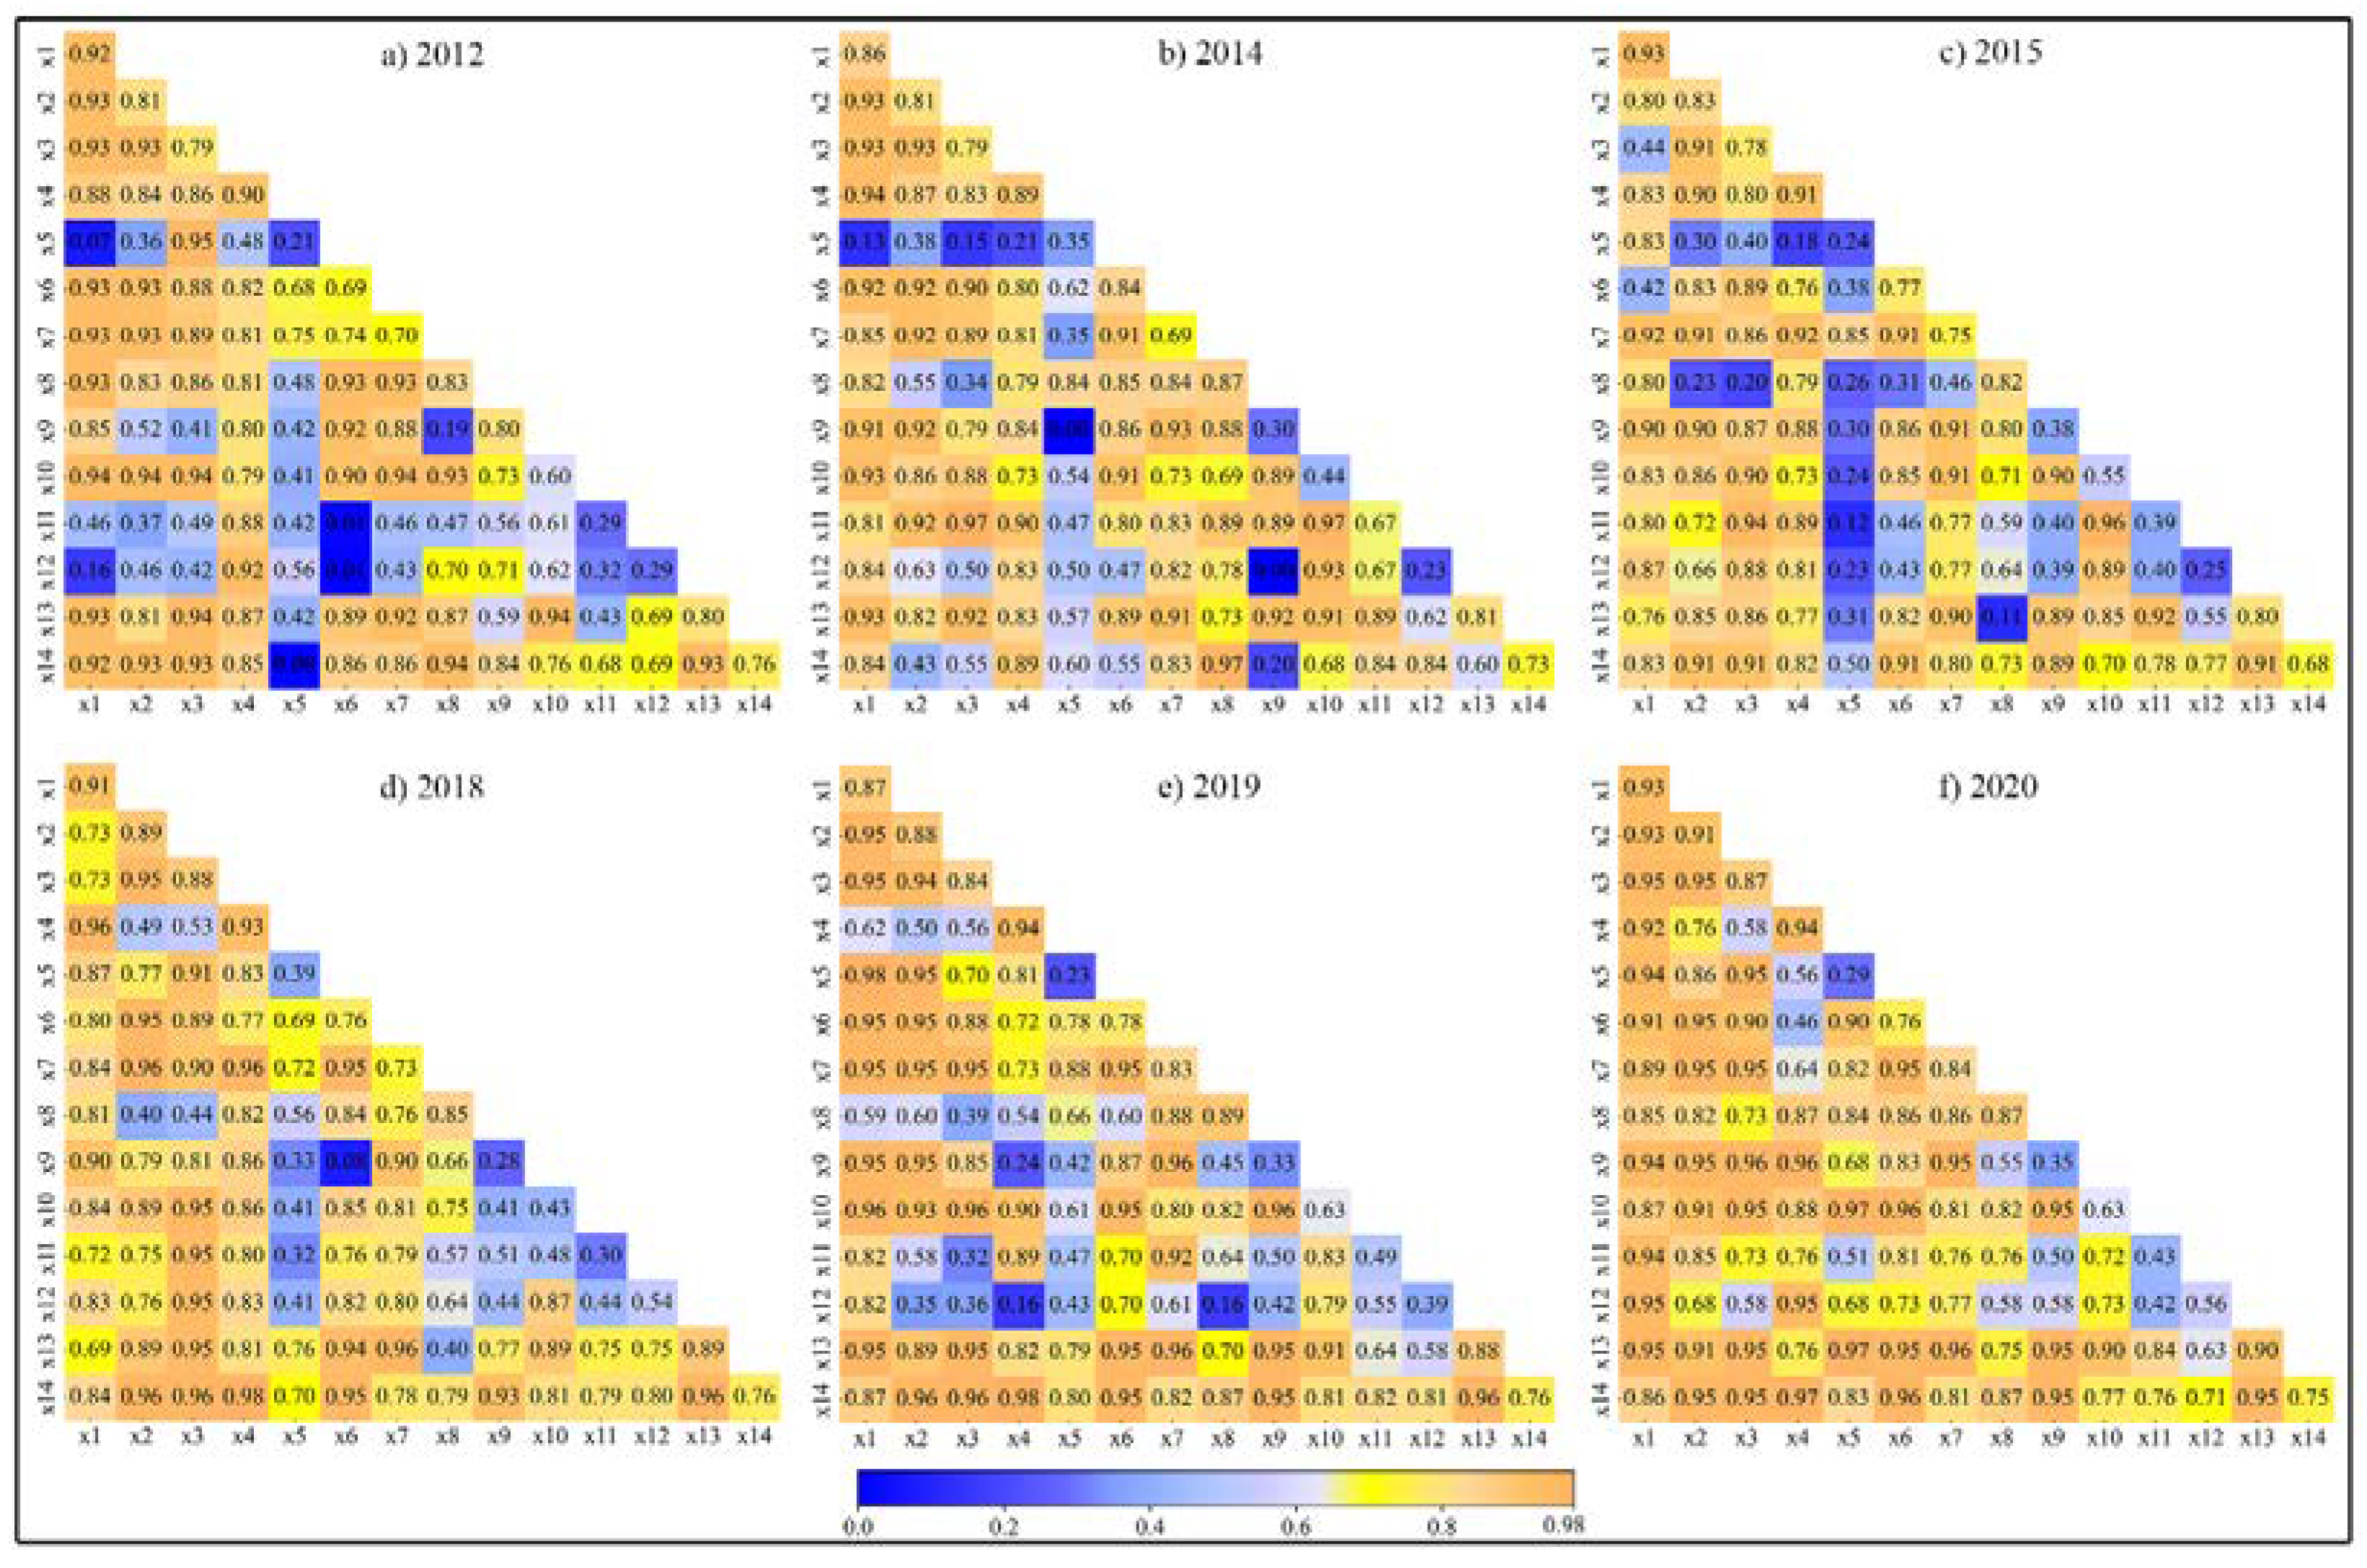
4.3. Driving Factors of Urban Resilience

This study identified the driving factors influencing urban resilience in Guangdong Province from 2012 to 2020 using the OPGD model. The GDP per capita (×1), GDP (×2), number of permanent urban residents (×3), proportion of primary industry (×4), proportion of tertiary industry (×6), number of higher education institutions (×7), profit of all urban businesses (×8), total balance of urban household deposits (×13), and per capita deposit balance (×14) all passed the significance level test, and their explanatory power (q) was 0.692 to 0.941 (Table 4). The results indicate that ×1, ×2, ×3, ×4, ×6, ×7, ×8, ×13, and ×14 were the critical driving factors of urban resilience in Guangdong Province from 2012 to 2020. Economic development played a leading role in increasing urban resilience. Guangdong Province has experienced significant economic growth, attracting foreign investment and labor, contributing to urban infrastructure and social security from 2012 to 2019. However, due to the negative impact of COVID-19, the GDP growth rate of Guangdong Province in 2020 decreased by 5.48% and the urban unemployment rate increased by 0.30% compared with 2019, and both the amount of regional foreign investment and the total resident population exhibited a decreasing trend, resulting in a decline in the growth rate of urban resilience [19,21].
The primary factor interaction type of the 14 driving factors from 2012 to 2020 was bi-enhance. Moreover, the q values of each factor interaction were higher than the individual effects of the individual factors, but lower than the sum of the explanatory power of each factor individually. These results suggested that 43.33% of the factor interactions had q values equal to or greater than 0.85 (Figure 6). The GDP (×1), per capita GDP (×2), proportion of tertiary industry (×6), total balance of urban household deposits (×13), and per capita deposit balance (×14) showed a significant increase in interaction with other factors, and the q values were relatively high, illustrating that the industrial and financial factors had an increasing impact on urban resilience.

5. Discussion

5.1. Comparative Analysis of Regional Urban Resilience Characteristics

Since some urban resilience studies vary in dimensions, indicators, and indicator weights, there could be differences in quantifying the urban resilience of the study regions. However, scholars have explored urban resilience in various regions of China, such as Chengdu–Chongqing, the Middle Yangtze River, the Guanzhong Plain, the Yangtze River Delta, and the Pearl River Delta, and found that the overall low level of urban resilience and the uneven distribution of cities with high urban resilience are significant characteristics of regional urban resilience [14,15,36]. Similarly, this study revealed a significant spatial imbalance in the distribution of urban resilience in Guangdong Province from 2012 to 2020. Guangzhou, Dongguan, Shenzhen, Foshan, Zhongshan, Huizhou, and Zhuhai were the areas with high values of urban resilience, while the eastern, northern, and western regions of Guangdong experienced a “collapse” in urban resilience. These regions are disadvantaged in economic and infrastructural resilience due to their weak economic infrastructure and dependency on a single industrial structure. Additionally, small and medium-sized cities’ resilience continues to decrease due to the negative impact of the “siphon effect” of large cities [23].
Scholars [37] have argued that the cities with the highest resilience values in the Beijing–Tianjin–Hebei, Yangtze River Delta, and Pearl River Delta regions have toughness values nearly eight times higher than the lowest cities. This study found that the ratio of the urban resilience for cities with the highest and least values in Guangdong Province decreased from 8.31 in 2012 to 5.88 in 2020, and the gap between them tended to narrow (Table 5). It has been shown that the cities in central Guangdong Province, particularly in the Pearl River Delta (PRD) region, exhibit higher levels of resilience, but there is a significant variation in resilience among the nine cities within the PRD [14,37]. The average urban resilience (USAvg) in the PRD region for 2012–2020 was 119.03% to 157.37% higher than the USAvg in the non-PRD region for the same period. The standard deviation of urban resilience (USSD) in the PRD region increased from 0.163 to 0.202 from 2012 to 2020, which was considerably higher than USSD of urban resilience in non-PRD regions during the same period (Table 5). Thus, there was a significant regional disparity in urban resilience, and the regional urban resilience gap was significant. Therefore, improving the level of regional urban resilience and narrowing the urban resilience gap are important topics for future research.

5.2. Implications of Spatial Spillover of Urban Resilience for Metropolitan Area Planning

From 2012 to 2020, the urban resilience spillover in Guangdong Province was in a three-level resilience spillover circle structure of “core-subcore-periphery”. In 2022, the Chinese government issued the document “Guangdong Metropolitan Area Territorial Spatial Planning Coordination Guidelines” [38], which divides Guangdong into five metropolitan areas (Figure 7). Among them, The Guangzhou metropolitan area (Figure 7A), Shenzhen metropolitan area (Figure 7B), and Pearl River Estuary West Coast metropolitan area (Figure 7C) are predominantly located in the core or central subcore circles, and they exhibit stronger urban resilience spatial spillover intensity. In contrast, the Chaoshan metropolitan area (Figure 7D) and Zhanmao metropolitan area (Figure 7E) show lower levels of urban resilience, due to their own lower levels of urban resilience because of their geographical distance from the core circle. Therefore, these areas’ inflow and spillover of urban resilience elements are diminished.
This study suggests that the government should concentrate on the following: (1) Cultivating Shantou within the Chaoshan metropolitan area and Zhanjiang within the Zhanmao metropolitan area as the regional core cities to stimulate and encourage the development of cities in the eastern and western regions of Guangdong Province. (2) Enhancing the transportation networks to improve connectivity among the Chaoshan metropolitan area, the Zhanjiang–Maoming metropolitan area, and the Pearl River Delta. The focus should be on strengthening the infrastructure, which involves constructing highways, railways, and light rail systems to increase transportation efficiency and convenience. Improving transportation conditions can promote industrial division and cooperation among different metropolitan areas, thereby enhancing the cities’ economic resilience and infrastructural resilience. (3) It is essential to strategically plan urban functions and positioning, promoting economic diversification and avoiding excessive reliance on a single industry. By adopting a diversified economic structure, cities can mitigate vulnerabilities and become more adaptable to economic uncertainties.

5.3. Impact of COVID-19 on Urban Resilience

Large cities have advantages in economic resilience, infrastructural resilience, and social resilience, and they are more resilient to disaster shocks than small and medium-sized cities [14,15,18]. However, this study found that this conclusion does not hold true when examining the changes in urban resilience in Guangdong Province during COVID-19. COVID-19 has significantly impacted densely populated large cities that heavily rely on tertiary industry. On the other hand, smaller cities like Meizhou, Heyuan, and Qingyuan have been less affected by COVID-19 due to their smaller populations. Although COVID-19 has negatively affected urban resilience in Guangdong Province, it has also narrowed the resilience gap between different regions in the province.
There is a pertinent issue to discuss: the urban industry in Guangdong Province is dominated by light industry, and the cities have fewer air pollution problems. Conversely, heavy industries such as steel metallurgy, coal, and the chemical industry dominate some of China’s northern cities, leading to long-term smog issues. COVID-19 has caused a decline in industrial production activities in northern Chinese cities, improving urban environmental quality. Can the enhanced ecological resilience of cities in northern China compensate for the decrease in their economic resilience?
COVID-19 has not significantly altered the spatiotemporal pattern of urban resilience spillover in Guangdong Province, and it has had a limited impact on the region’s urban resilience spillover. The Chinese government diligently refined and optimized epidemic control policies during COVLD-19, stabilizing urban economic development and restoring population mobility. The urban resilience spillover in Guangdong Province exhibited a three-level circle structure of “core-subcore-periphery”, with the core circle maintaining its predominant position in urban resilience spillover. The impact of COVID-19 on urban resilience and its spatial spillover in Guangdong Province are quantified in this paper, which could provide a reference for subsequent studies on assessing the impact of public health emergencies on urban resilience.

6. Conclusions

This study developed an urban resilience model based on four dimensions and, in conjunction with the Getis-Ord Gi* model, analyzed the spatiotemporal evolution characteristics of urban resilience in Guangdong from 2012 to 2020. Moreover, driving factors of urban resilience were detected based on the OPGD model. Additionally, the improved Capello model was used to analyze the spatial spillover effects of urban resilience. The conclusions can be summarized as follows:
(1) The urban resilience of Guangdong Province increased from 2012 to 2019. Subsequently, a decline was observed from 2019 to 2020 due to the impact of COVID-19. The urban resilience exhibited a significant spatially unbalanced distribution, with Guangdong’s eastern, northern, and western regions being the “collapse zones” of urban resilience.
(2) The intensity of urban resilience spillover in Guangdong Province exhibited a significant three-level circle structure of “core-subcore-periphery”, with the core circle being the area of highest density and intensity of urban resilience spillover. COVID-19 significantly weakened the spatial spillover intensity of cities in the core circle and narrowed the TURS gap between the core and central subcore circles.
(3) The critical driving factors affecting urban resilience in Guangdong Province from 2012 to 2020 were GDP per capita, GDP, number of permanent urban residents, proportion of primary industry, proportion of tertiary industry, number of higher education institutions, profit of all urban businesses, total balance of urban household deposits, and per capita deposit balance.

Author Contributions

Conceptualization, H.D. and K.L.; Methodology, H.D.; Software, H.D.; Writing—original draft, H.D.; Writing—review & editing, K.L. All authors have read and agreed to the published version of the manuscript.

Funding

This research was funded by the Guangdong Basic and Applied Basic Research Foundation, grant numbers 2021A1515011462 and 2021A1515110157, and the Innovation Group Project of Southern Marine Science and Engineering, Guangdong Laboratory (Zhuhai) (No. 311021004).

Data Availability Statement

Some or all of the data, models, or code generated or used during this study are available from the corresponding author by request.

Acknowledgments

We thank the PIE-Engine cloud platform for providing us with the data processing platform. Our Atmospheric Composition Analysis Group of Dalhousie University provided us with the data.

Conflicts of Interest

The authors declare no conflict of interest.

References

  1. Xu, H.; Jiao, M. City size, industrial structure and urbanization quality—A case study of the Yangtze River Delta urban agglomeration in China. Land Use Policy 2021, 111, 105735. [Google Scholar] [CrossRef]
  2. Zhao, R.; Fang, C.; Liu, H. Progress and prospect of urban resilience research. Progess Geogr. 2020, 39, 1717–1731. [Google Scholar] [CrossRef]
  3. Zhou, Q.; Qiao, Y.; Zhang, H.; Zhou, S. How does college scale affect urban resilience? Spatiotemporal evidence from China. Sustain. Cities Soc. 2022, 85, 104084. [Google Scholar] [CrossRef]
  4. Wang, X.; Wang, L.; Zhang, X.; Fan, F. The spatiotemporal evolution of COVID-19 in China and its impact on urban economic resilience. China Econ. Rev. 2022, 74, 101806. [Google Scholar] [CrossRef] [PubMed]
  5. Mallick, S.K.; Das, P.; Maity, B.; Rudra, S.; Pramanik, M.; Pradhan, B.; Sahana, M. Understanding future urban growth, urban resilience and sustainable development of small cities using prediction-adaptation-resilience (PAR) approach. Sustain. Cities Soc. 2021, 74, 103196. [Google Scholar] [CrossRef]
  6. Wang, Z.; Deng, X.; Wong, C.; Li, Z.; Chen, J. Learning urban resilience from a social-economic-ecological system perspective: A case study of Beijing from 1978 to 2015. J. Clean. Prod. 2018, 183, 343–357. [Google Scholar] [CrossRef]
  7. Lee, G.; Anat, T.; Shahar, S. Urban resilience as a mitigating factor against economically driven out-migration during COVID-19: The case of Eilat, a tourism-based city. Cities 2022, 125, 103636. [Google Scholar]
  8. Liu, Y. Urban resilience system development measurement: Based on an empirical study of 288 Chinese cities. Urban Dev. Stud. 2021, 28, 93–100. [Google Scholar]
  9. Alberti, M.; Marzluff, J.M. Ecological resilience in urban ecosystems: Linking urban patterns to human and ecological functions. Urban Ecosyst. 2004, 7, 241–265. [Google Scholar] [CrossRef]
  10. Pickett, S.T.; Cadenasso, M.L.; Grove, J.M. Resilient cities: Meaning, models, and metaphor for integrating the ecological, socio-economic, and planning realms. Landsc. Urban Plan. 2004, 69, 369–384. [Google Scholar] [CrossRef]
  11. Alliance, R. Urban Resilience Research Prospectus; CSIRO: Canberra, Australia; Arizona State University: Phoenix, AZ, USA; Stockholm University: Stockholm, Sweden, 2007. [Google Scholar]
  12. Hill, E.; Wial, H.; Wolman, H. Exploring Regional Economic Resilience; Working paper; University of California, Institute of Urban and Regional Development (IURD): Berkeley, CA, USA, 2008. [Google Scholar]
  13. Wardekker, J.A.; de Jong, A.; Knoop, J.M.; van der Sluijs, J.P. Operationalising a resilience approach to adapting an urban delta to uncertain climate changes. Technol. Forecast. Soc. Change 2010, 77, 987–998. [Google Scholar] [CrossRef]
  14. Huang, J.; Sun, Z.; Du, M. Differences and Drivers of Urban Resilience in Eight Major Urban Agglomerations: Evidence from China. Land 2022, 11, 1470. [Google Scholar] [CrossRef]
  15. Yang, M.; Jiao, M.; Zhang, J. Research on Urban Resilience and Influencing Factors of Chengdu-Chongqing Economic Circle. Sustainability 2022, 14, 10585. [Google Scholar] [CrossRef]
  16. Zhao, R.; Fang, C.; Liu, J.; Zhang, L. The evaluation and obstacle analysis of urban resilience from the multidimensional perspective in Chinese cities. Sustain. Cities Soc. 2022, 86, 104160. [Google Scholar] [CrossRef]
  17. Liu, L.; Lei, Y.; Fath, B.D.; Hubacek, K.; Yao, H.; Liu, W. The spatio-temporal dynamics of urban resilience in China’s capital cities. J. Clean. Prod. 2022, 379, 134400. [Google Scholar] [CrossRef]
  18. Zhu, Z.; Zheng, Y.; Xiang, P. Deciphering the spatial and temporal evolution of urban anthropogenic resilience within the Yangtze River Delta urban agglomeration. Sustain. Cities Soc. 2023, 88, 104274. [Google Scholar] [CrossRef]
  19. NBSC (National Bureau of Statistics of China). China Urban Statistics Yearbook; China Statistics Press: Beijing, China, 2021. [Google Scholar] [CrossRef]
  20. CPGPRC (Central People’s Government of the People’s Republic of China). Notification by the Standard of State Council on Adjusting the Urban Scale. Available online: https://www.gov.cn/zhengce/content/2014-11/20/content_9225.htm (accessed on 29 October 2014).
  21. NBSC (National Bureau of Statistics of China). China Statistics Yearbook; China Statistics Press: Beijing, China, 2021. [Google Scholar] [CrossRef]
  22. Chen, Z.; Yu, B.; Yang, C.; Zhou, Y.; Yao, S.; Qian, X.; Wang, C.; Wu, B.; Wu, J. An extended time series (2000–2018) of global NPP-VIIRS-like nighttime light data from a cross-sensor calibration. Earth Syst. Sci. Data 2021, 13, 889–906. [Google Scholar] [CrossRef]
  23. Deng, H.; Li, H. Characteristics of the spatiotemporal changes in urban agglomeration in the Guangdong–Hong Kong–Macao Greater Bay Area, China. J. Urban Plan. Dev. 2021, 147, 04021042. [Google Scholar] [CrossRef]
  24. Xue, Y.; Liu, K. Regional Differences, Distribution Dynamics, and Convergence of Air Quality in Urban Agglomerations in China. Sustainability 2022, 14, 7330. [Google Scholar] [CrossRef]
  25. Wang, Y.; Duan, X.; Liang, T.; Wang, L.; Wang, L. Analysis of spatio-temporal distribution characteristics and socioeconomic drivers of urban air quality in China. Chemosphere 2022, 291, 132799. [Google Scholar] [CrossRef]
  26. Song, P.B.; Wang, C.; Zhang, W.; Liu, W.F.; Sun, J.H.; Wang, X.Y.; Lei, X.H.; Wang, H. Urban Multi-Source Water Supply in China: Variation Tendency, Modeling Methods and Challenges. Water 2020, 12, 1199. [Google Scholar] [CrossRef]
  27. Haitao, Z.; Xinmin, X.; Junsan, H. Water Pollution Accident Control and Urban Safety Water Supply. In Proceedings of the 2011 2nd IEEE International Conference on Emergency Management and Management Sciences (ICEMMS), Beijing, China, 8–10 August 2011; pp. 37–40. [Google Scholar] [CrossRef]
  28. Huang, H.; Chen, X.; Wang, X.; Wang, X.; Liu, L. A Depression-Based Index to Represent Topographic Control in Urban Pluvial Flooding. Water 2019, 11, 2115. [Google Scholar] [CrossRef]
  29. Liu, L.; Lei, Y.; Zhuang, M.; Ding, S. The impact of climate change on urban resilience in the Beijing-Tianjin-Hebei region. Sci. Total Environ. 2022, 827, 154157. [Google Scholar] [CrossRef] [PubMed]
  30. Ord, J.K.; Getis, A. Local spatial autocorrelation statistics: Distributional issues and an application. Geogr. Anal. 1995, 27, 286–306. [Google Scholar] [CrossRef]
  31. Getis, A.; Ord, J.K. The analysis of spatial association by use of distance statistics. In Perspectives on Spatial Data Analysis; Springer: Berlin/Heidelberg, Germany, 2010; pp. 127–145. [Google Scholar]
  32. Capello, R. Spatial Spillovers and Regional Growth: A Cognitive Approach. Eur. Plan. Stud. 2009, 17, 639–658. [Google Scholar] [CrossRef]
  33. Wang, J.F.; Li, X.H.; Christakos, G.; Liao, Y.L.; Zhang, T.; Gu, X.; Zheng, X.Y. Geographical detectors-based health risk assessment and its application in the neural tube defects study of the Heshun Region, China. Int. J. Geogr. Inf. Sci. 2010, 24, 107–127. [Google Scholar] [CrossRef]
  34. Song, Y.; Wang, J.; Ge, Y.; Xu, C. An optimal parameters-based geographical detector model enhances geographic characteristics of explanatory variables for spatial heterogeneity analysis: Cases with different types of spatial data. GISci. Remote Sens. 2020, 57, 593–610. [Google Scholar] [CrossRef]
  35. NHCPRC (National Health Commission of the People’s Republic of China). Notification on the Prevention and Control of the Novel Coronavirus Pneumonia Epidemic. Available online: http://www.nhc.gov.cn/xcs/yqtb/list_gzbd_31.shtml (accessed on 1 January 2021).
  36. Zhu, J.; Sun, H. Research on spatial-temporal evolution and influencing factors of urban resilience of China’s three metropolitan agglomerations. Soft Sci. 2020, 34, 72–79. [Google Scholar]
  37. Yi, P.; Wang, S.; Li, W.; Dong, Q. Urban resilience assessment based on “window” data: The case of three major urban agglomerations in China. Int. J. Disaster Risk Reduct. 2023, 85, 103528. [Google Scholar] [CrossRef]
  38. GPDNR (Guangdong Provincial Department of Natural Resources). Guidelines for Land Spatial Planning Coordination in Metropolitan Area of Guangdong Province. Available online: http://nr.gd.gov.cn/gkmlpt/content/3/3988/post_3988983.html#683 (accessed on 5 August 2022).
Figure 1. Geographical location and administrative boundaries of Guangdong Province.
Land 12 01800 g001
Figure 2. The workflow of the paper.
Land 12 01800 g002
Figure 3. Spatiotemporal evolution of urban resilience in Guangdong Province, 2012–2020.
Land 12 01800 g003
Figure 4. Analysis of urban resilience hotspots in Guangdong Province from 2012 to 2020.
Land 12 01800 g004
Figure 5. Spatiotemporal evolution of the spillover effect of urban resilience in Guangdong Province from 2012 to 2020. (1) Core circle, (2) Central subcore circle, (3) Chaoshan subcore circle.
Land 12 01800 g005
Figure 6. Interactive detection of driving factors of urban resilience in Guangdong Province from 2012 to 2020.
Land 12 01800 g006
Figure 7. Spatial distribution of five major metropolitan areas in Guangdong Province. (A). Guangzhou Metropolitan Area, (B). Shenzhen Metropolitan Area, (C). Pear River Estuary West Coast Metropolitan Area, (D). Chaoshan Metropolitan Area, (E). Zhanmao Metropolitan Area.
Land 12 01800 g007
Table 1. Indicators selected for urban resilience assessment.
DomainsCriterion LevelIndicatorsUnitDirectionVariableWeight
Economic resilienceEconomic foundation and capabilities (a)Nighttime light densityDN/km2Positivea10.0450
Government expenditureCNY 10,000 Positivea20.0527
Number of urban large enterprisesPiecePositivea30.0433
Total amount of urban social retailCNY 10,000 Positivea40.0575
Economic structure and stability (b)Foreign investment as a percentage of urban GDP%Negativeb10.0097
Proportion of domestic enterprises%Positiveb20.0151
Second industrial outputCNY 10,000 Positiveb30.0461
Ecological resilienceEcological environment quality (c)Proportion of green area to built-up area%Positivec10.0078
PM 2.5 concentrationμmNegativec20.0143
Regional vegetation net productivitygc/m²Positivec30.0225
Slope°Positivec40.0271
Proportion of water body area%Positivec50.0448
Urban flood vulnerability%Negativec60.0209
Urban purification capacity (d)Urban sewage treatment rate%Positived10.0108
Total industrial wastewater discharge10,000 tNegatived20.0153
Total urban sulfur dioxide emissions10,000 tNegatived30.0539
Infrastructure resilienceMunicipal facilities (e)Number of buses per 10,000 peopleper 10,000 peoplePositivee10.0670
The total amount of urban freight transport10,000 tPositivee20.0496
Road area per capitam2/personPositivee30.0396
Per capita power supplykw·h/personPositivee40.0186
Density of urban drainage pipeskm/km2Positivee50.0647
Social resilienceSocial vitality (f)Labor force unemployment rate%Negativef10.0050
Number of college students per 10,000 peopleper 10,000 peoplePositivef20.0572
Population growth rate%Positivef30.0200
Urbanization level%Positivef40.0243
Public healthcare (g)Number of medical technical personnel per 10,000 peopleper 10,000 peoplePositiveg10.0167
Number of hospital beds per 10,000 peopleper 10,000 peoplePositiveg20.0186
Social security (h)Proportion of urban employee basic pension insurance contributors%Positiveh10.0167
Proportion of unemployment insurance contributors%Positiveh20.0337
Proportion of employees’ basic medical care insurance contributors%Positiveh30.0123
Proportion of work injury insurance contributors%Positiveh40.0322
Proportion of maternity insurance contributors%Positiveh50.0371
Table 2. The driving factors of spatial spillover of urban resilience.
Driving FactorsVariableUnit
GDP per capita×1CNY 10,000
Urban GDP×2CNY 10,000
Number of permanent urban residents×3CNY 10,000
Proportion of primary industry×4%
Proportion of second industry×5%
Proportion of tertiary industry×6%
Number of higher education institutions×7Piece
Profit of all urban businesses×8CNY 10,000
Total urban passenger traffic×910,000 people
Proportion of employed population in primary industry×10%
Proportion of employed population in secondary industry×11%
Proportion of employed population in tertiary industry×12%
Total balance of urban household deposits×13CNY 10,000
Per capita deposit balance×14CNY 10,000
Table 3. The optimal discretization method and the optimal number of division levels for driving factor values.
Factors2012 20142015201820192020
MethodsCnMethodsCnMethodsCnMethodsCnMethodsCnMethodsCn
×1Equal5Natural5Geometric5Geometric5Natural6Geometric4
×2Natural6Natural6Natural6Natural5Natural5Natural5
×3SD6Natural6Geometric6Geometric5Natural6Natural6
×4Geometric3Geometric3Geometric3Geometric5Geometric5Geometric5
×5SD6SD6Quantile6Geometric3Quantile6Equal6
×6Quantile6Equal4Natural5SD4Natural5Natural5
×7Quantile4Quantile4Quantile5Quantile5Quantile6Quantile6
×8Geometric6Geometric5Geometric4Geometric5Geometric5Geometric4
×9Geometric3Quantile6Quantile6Geometric3Quantile6Quantile6
×10Quantile6Quantile5Quantile5Quantile10Quantile5Quantile5
×11Quantile5Natural6Quantile6SD4Geometric5Geometric5
×12Geometric6Natural5Natural5Geometric4Natural6Geometric4
×13Natural4Natural4Natural5Natural6Natural6Natural6
×14Geometric6Geometric6Natural6Quantile6Quantile6Quantile6
Methods: the method of discretizing data. Cn: the number of optimal data division levels. Quantile: the quantile classification method; Natural: the natural breakpoint classification method; Geometric: the geometric discontinuity classification method; SD: the standard deviation classification method. Equal: the equal interval classification method.
Table 4. Analysis of factors affecting urban resilience in Guangdong Province from 2012 to 2020.
Factors2012 2014 2015 2018 2019 2020
qpqpqpqpqpqp
×10.923 ***0.0000.856 ***0.0010.933 ***0.0000.911 ***0.0000.870 ***0.0000.927 ***0.000
×20.810 ***0.0080.808 **0.0100.825 ***0.0060.889 ***0.0000.882 ***0.0000.907 ***0.000
×30.786 **0.0140.785 **0.0160.775 **0.0130.883 ***0.0000.843 ***0.0030.870 ***0.001
×40.898 ***0.0000.893 ***0.0000.908 ***0.0000.930 ***0.0000.941 ***0.0000.941 ***0.000
×50.2120.8460.3490.7240.2380.7940.386 **0.0080.2260.6620.2930.694
×60.692 **0.0140.843 ***0.0010.774 **0.0130.763 **0.0100.778 **0.0100.760 **0.011
×70.699 ***0.0050.693 ***0.0070.748 **0.0100.732 ***0.0050.832 ***0.0020.837 ***0.002
×80.833 ***0.0020.867 ***0.0000.819 ***0.0000.853 ***0.0000.891 ***0.0000.874 ***0.000
×90.803 ***0.0000.2970.4730.3770.3300.2750.0790.3270.4100.3520.365
×100.605 **0.0480.4350.0890.551 **0.0350.4340.0580.634 **0.0120.627 **0.013
×110.2860.3760.6690.0840.3900.3480.3050.4130.4930.0510.4270.067
×120.2920.4920.2330.4920.2500.4800.539 **0.0250.3900.4540.560 **0.016
×130.799 ***0.0040.805 ***0.0040.799 ***0.0050.887 ***0.0000.877 ***0.0010.898 ***0.000
×140.762 ***0.0030.734 ***0.0070.682 **0.0260.763 ***0.0030.762 ***0.0020.747 ***0.005
** p < 0.05, *** p < 0.01.
Table 5. Statistics of urban resilience indicators in Guangdong Province from 2012 to 2020.
YearGDPRDNon-PRD
USMaxUSMinUSAvgUSSDUSMaxUSMinUSAvgUSSDUSMaxUSMinUSAvgUSSD
20120.651 0.078 0.189 0.139 0.651 0.100 0.291 0.163 0.144 0.078 0.113 0.021
20140.667 0.112 0.215 0.133 0.667 0.128 0.309 0.159 0.184 0.112 0.144 0.018
20150.809 0.131 0.250 0.158 0.809 0.143 0.358 0.192 0.209 0.131 0.169 0.020
20180.805 0.156 0.272 0.164 0.805 0.179 0.394 0.191 0.227 0.156 0.180 0.021
20190.856 0.149 0.285 0.180 0.856 0.177 0.419 0.208 0.241 0.149 0.183 0.026
20200.851 0.145 0.280 0.176 0.851 0.190 0.412 0.202 0.222 0.145 0.180 0.023
GD, PRD, and non-PRD represent Guangdong Province, the PRD region, and the non-Pearl-River-Delta region, respectively. USMax, USMin, USavg, and USSD are the maximum, minimum, mean, and standard deviation of urban resilience, respectively.
Disclaimer/Publisher’s Note: The statements, opinions and data contained in all publications are solely those of the individual author(s) and contributor(s) and not of MDPI and/or the editor(s). MDPI and/or the editor(s) disclaim responsibility for any injury to people or property resulting from any ideas, methods, instructions or products referred to in the content.

