
Optimizing Sustainable Suburban Expansion with Autonomous Mobility through a Parametric Design Framework

Abstract
:1. Introduction
1.1. Environmental Opportunities in the Suburbs of Today and Tomorrow
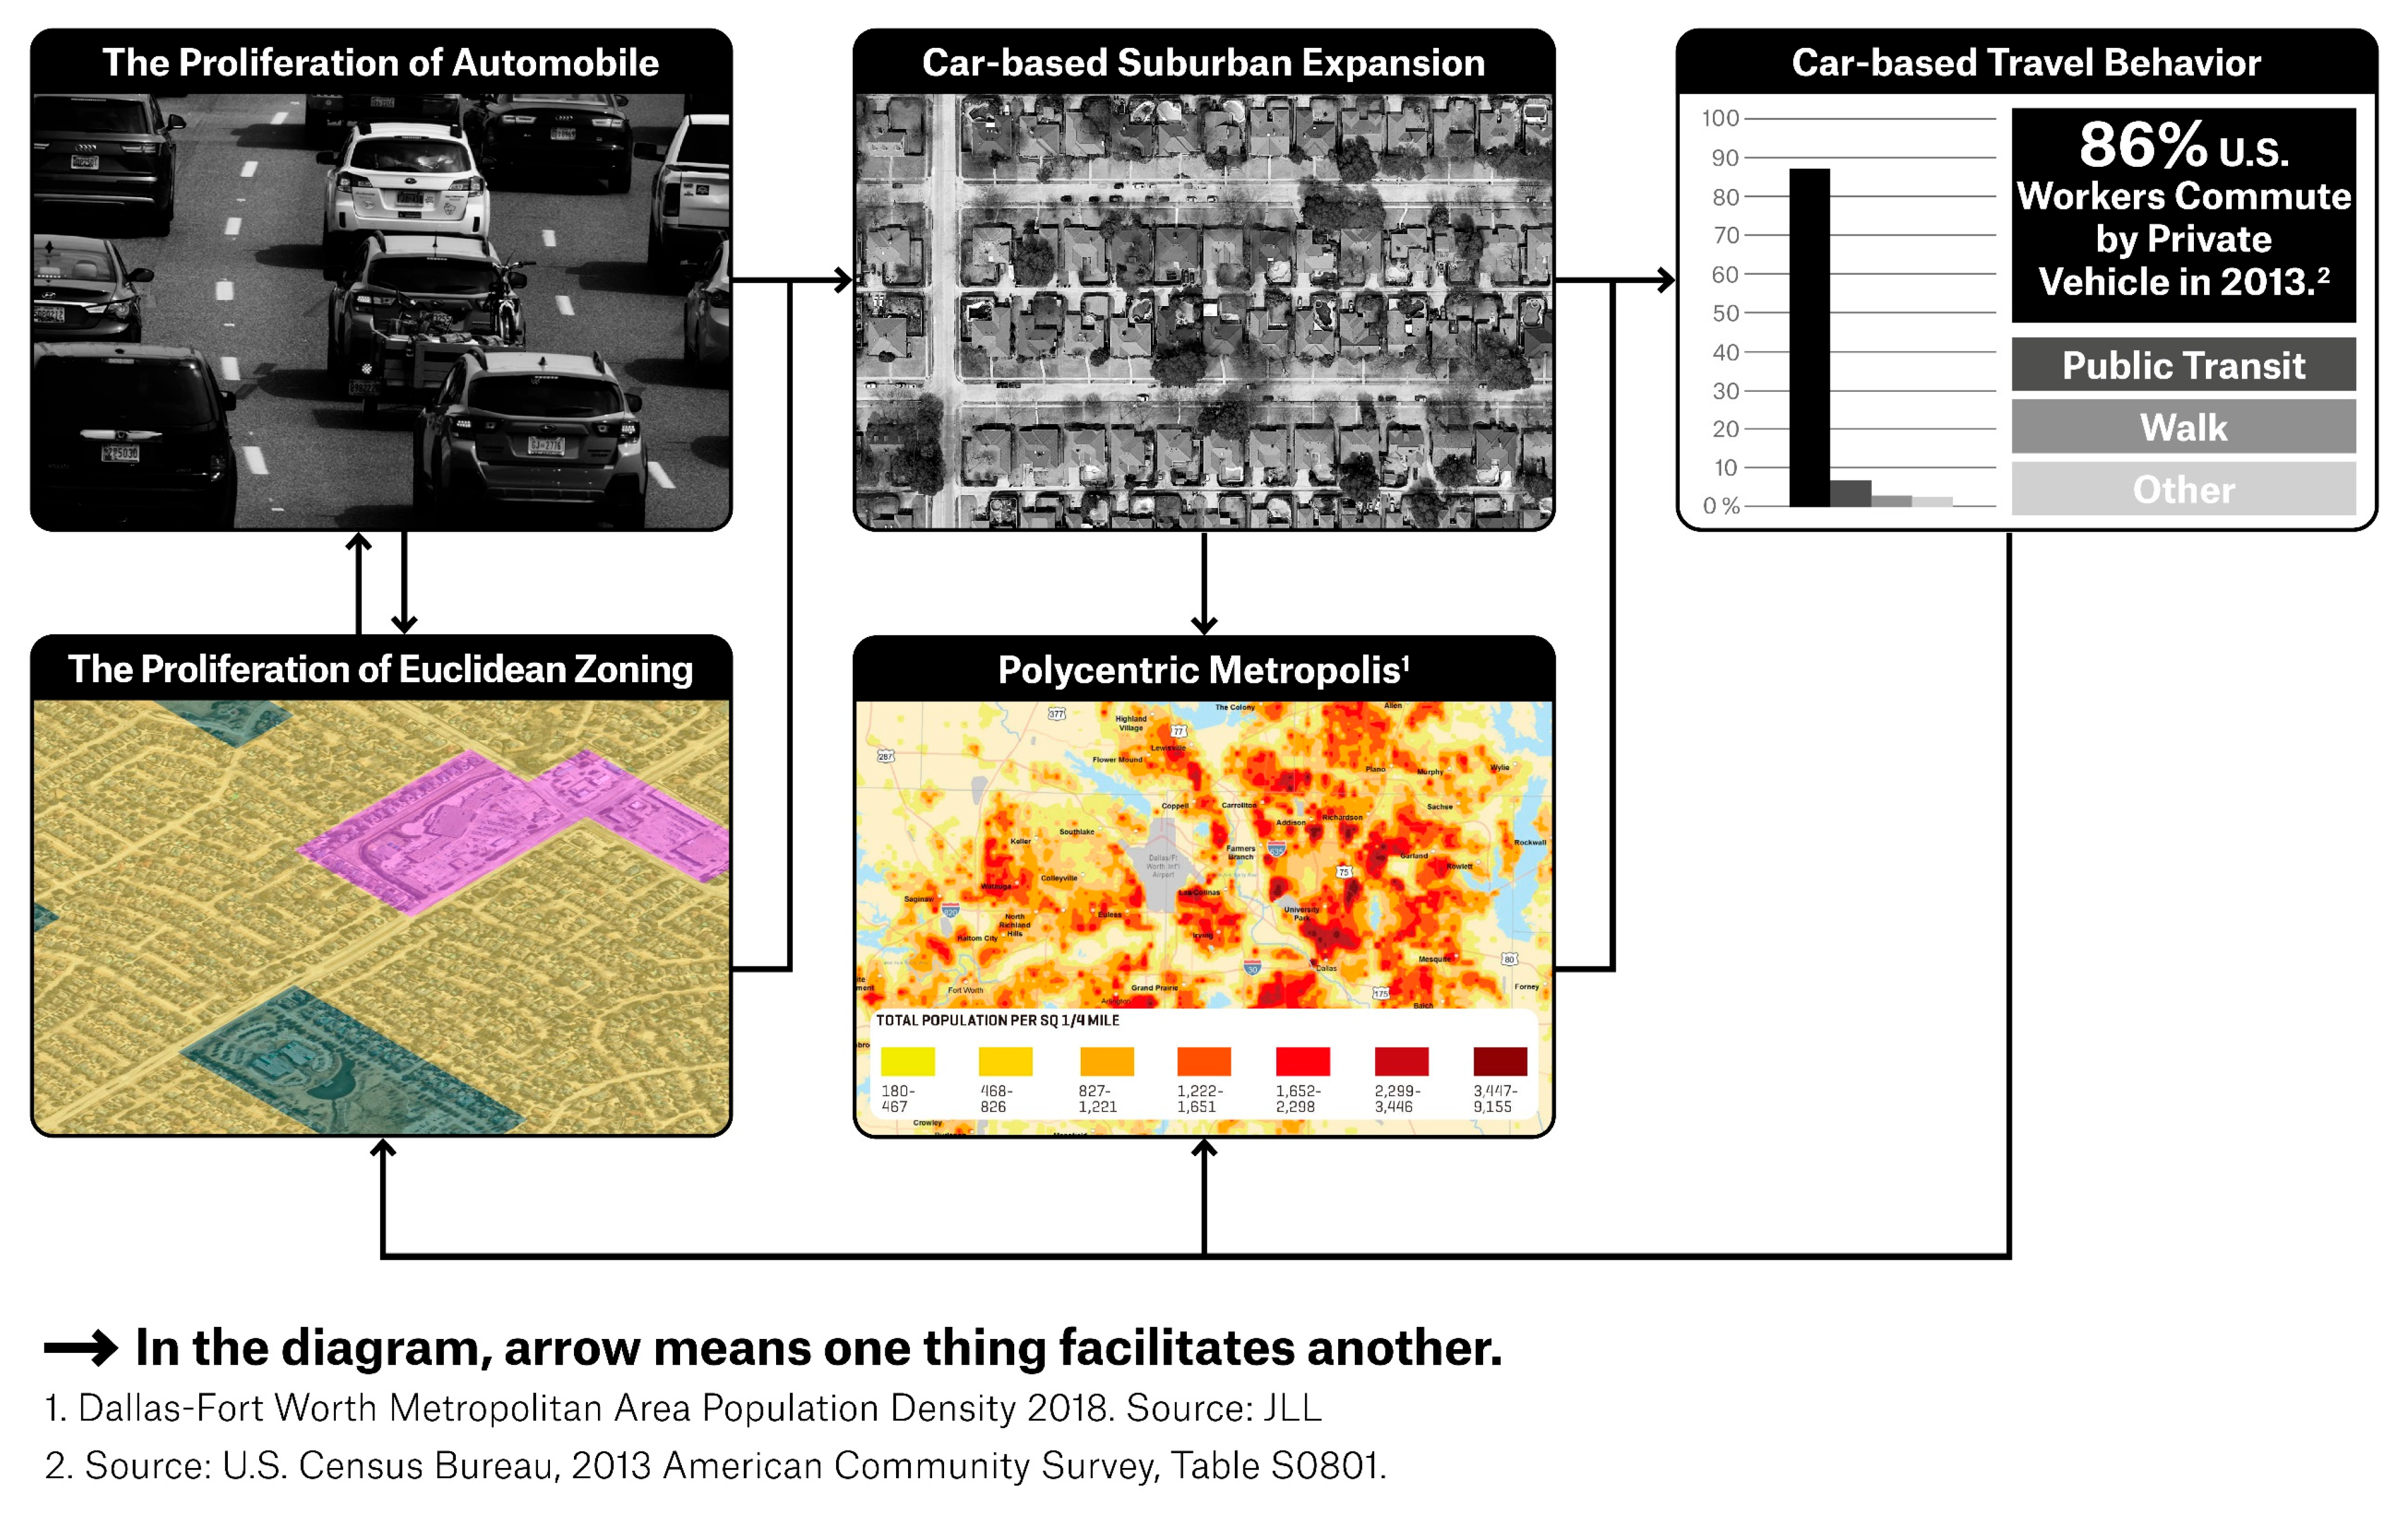
1.2. Historic Car-Based Suburban Expansion and Its Consequences
1.3. The Significance of Suburbs and Potential of Autonomous Mobility
1.4. Pre-Adapting Future Suburban Development through Urban Planning and Design
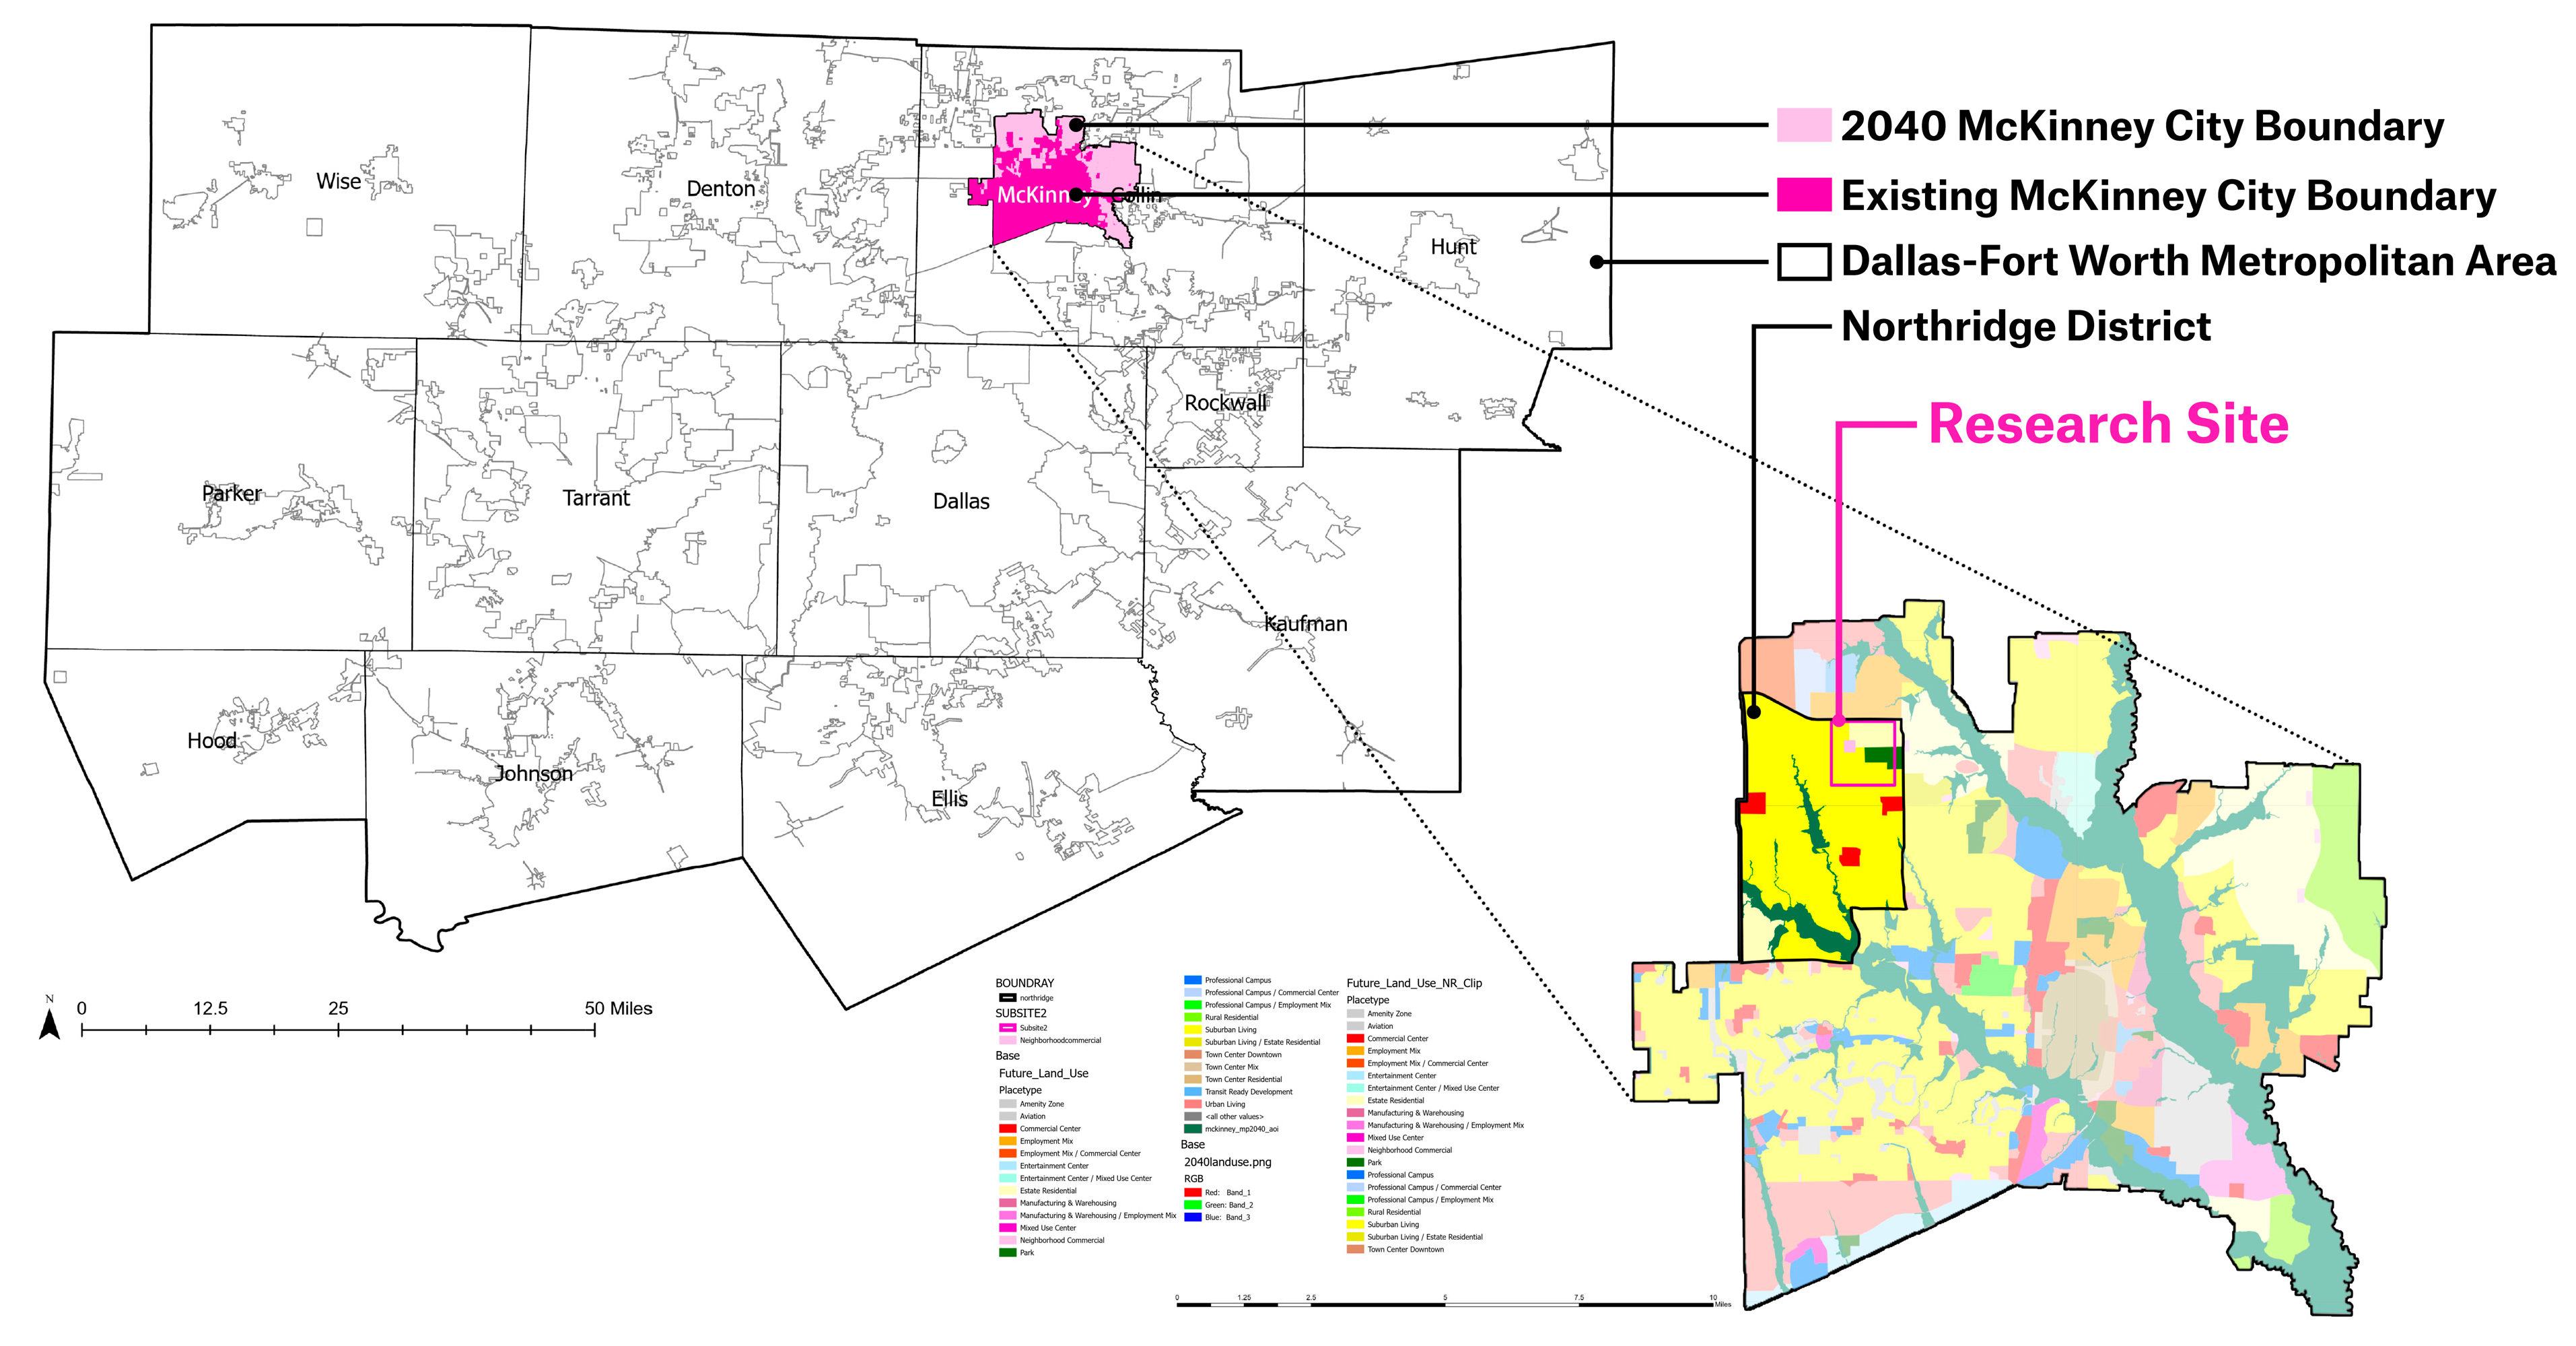
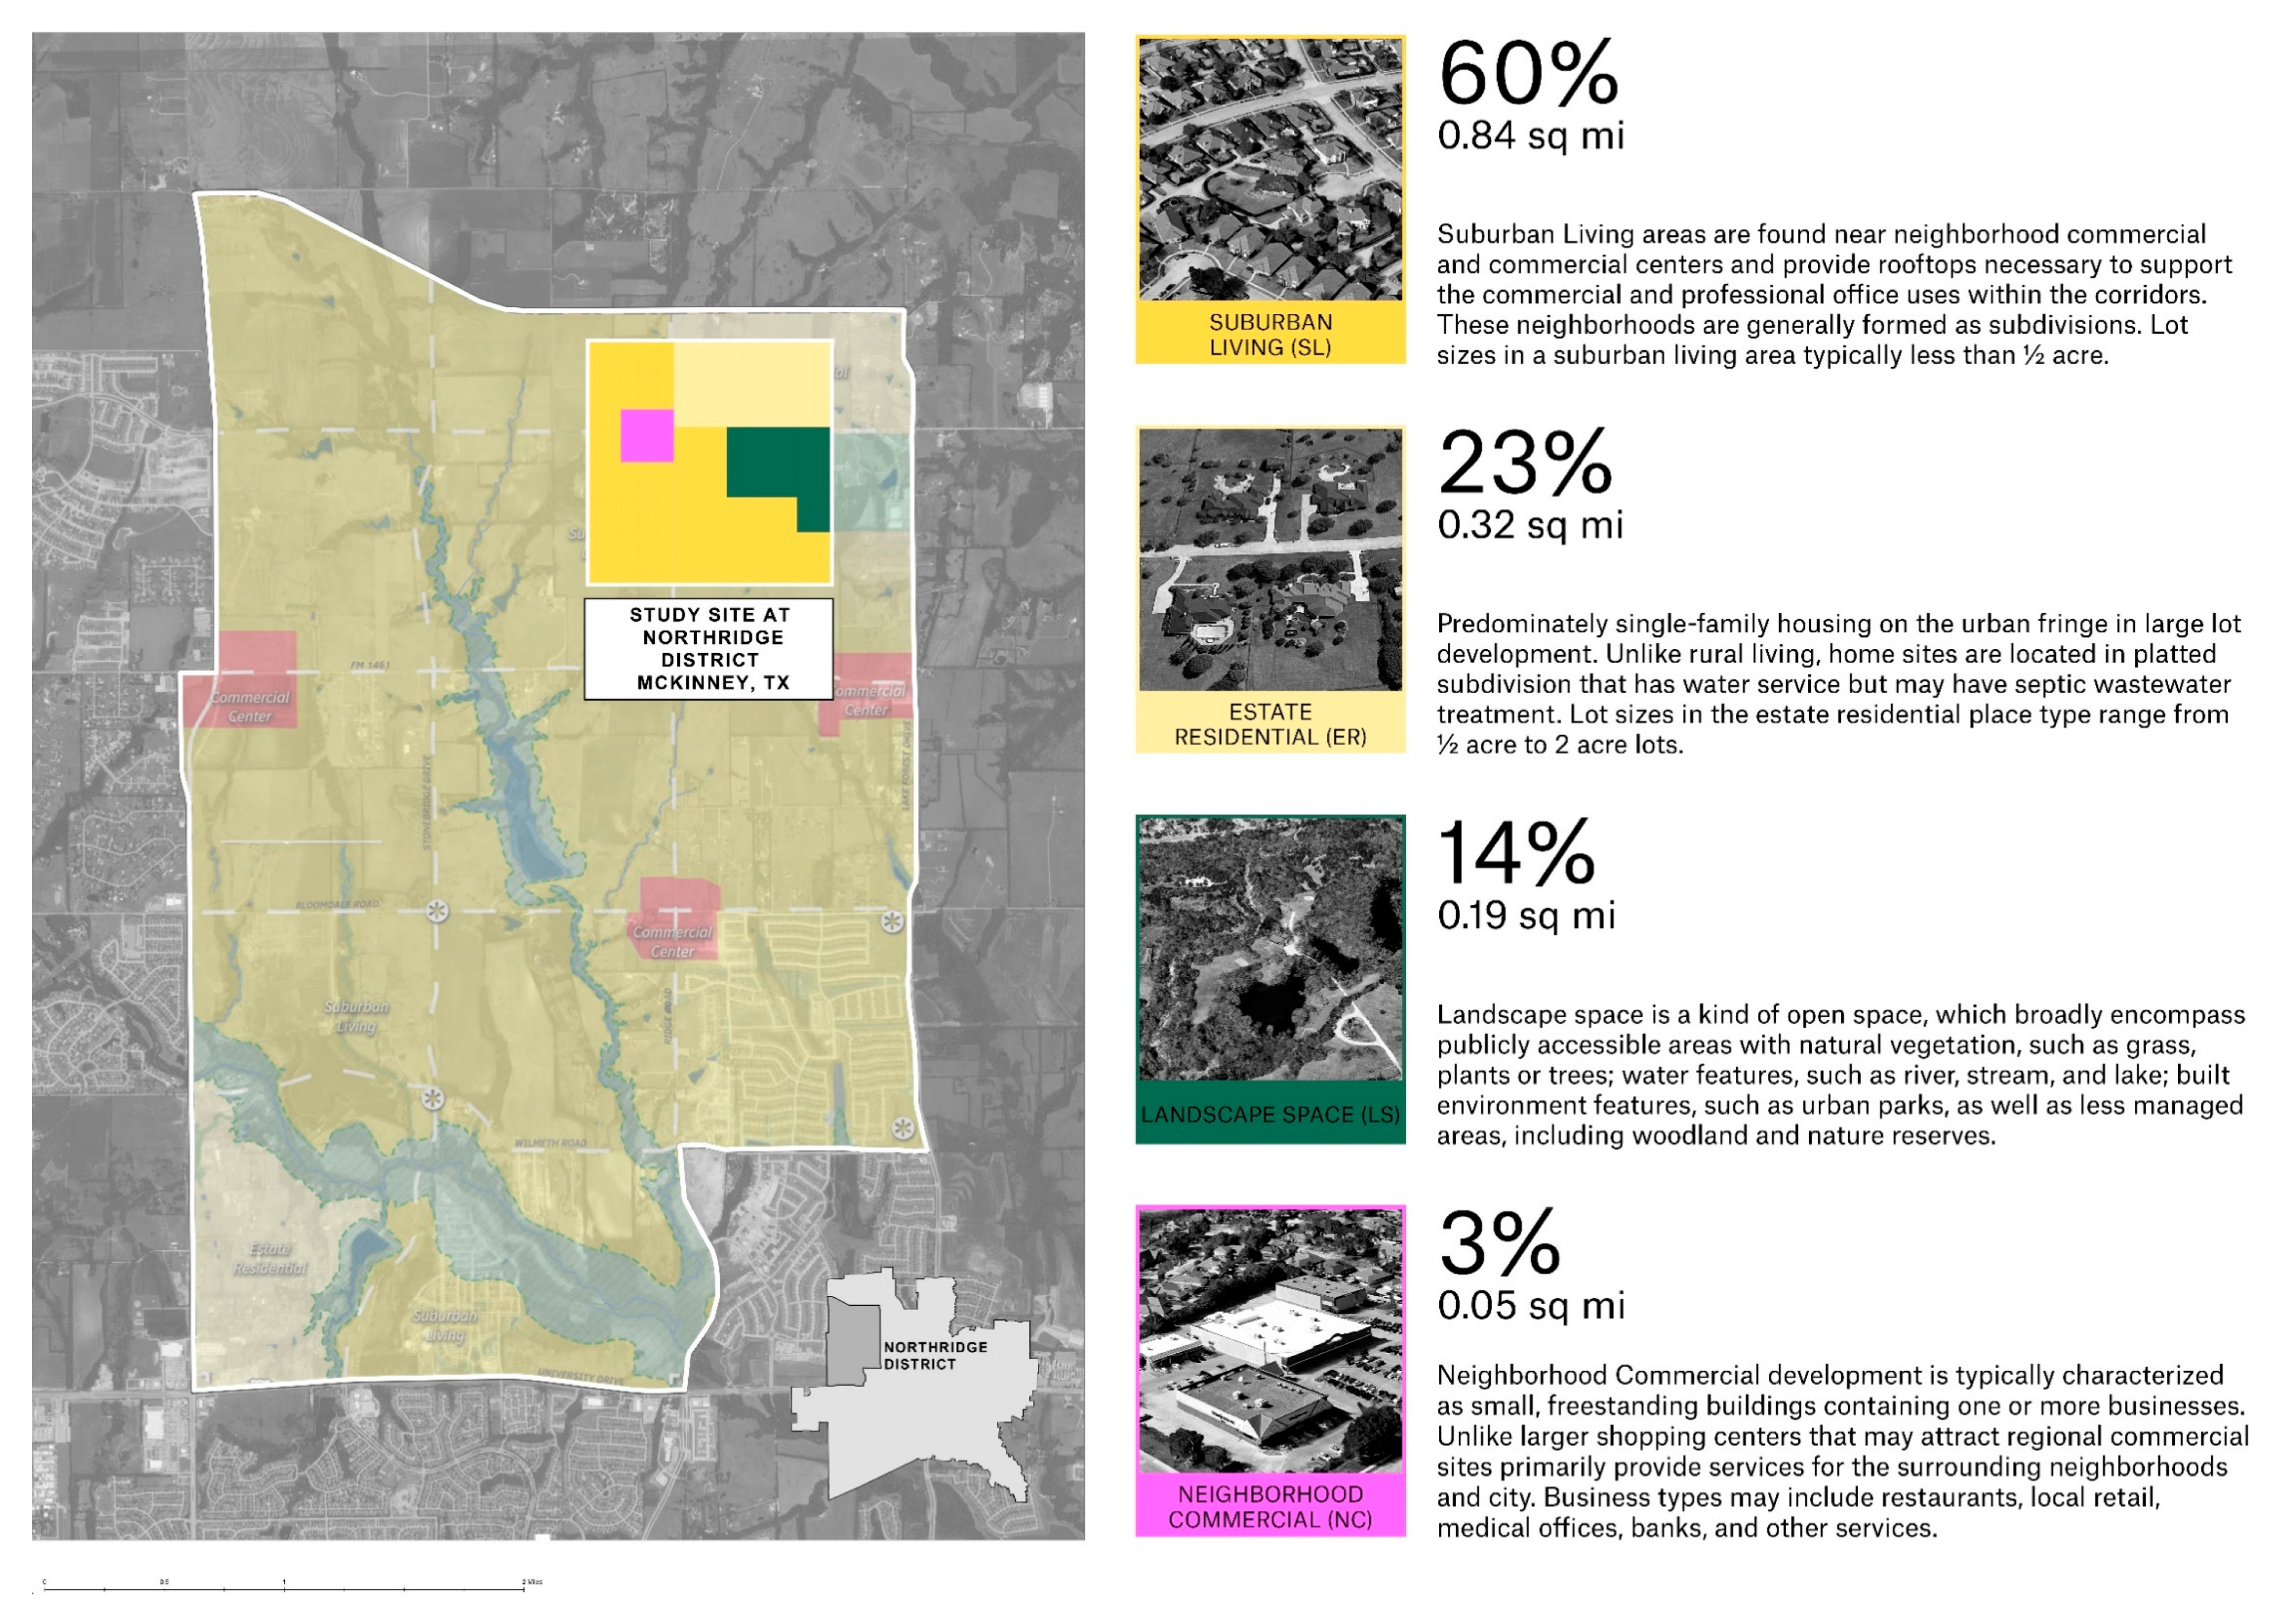
1.5. The Study Site—Northridge, McKinney, TX
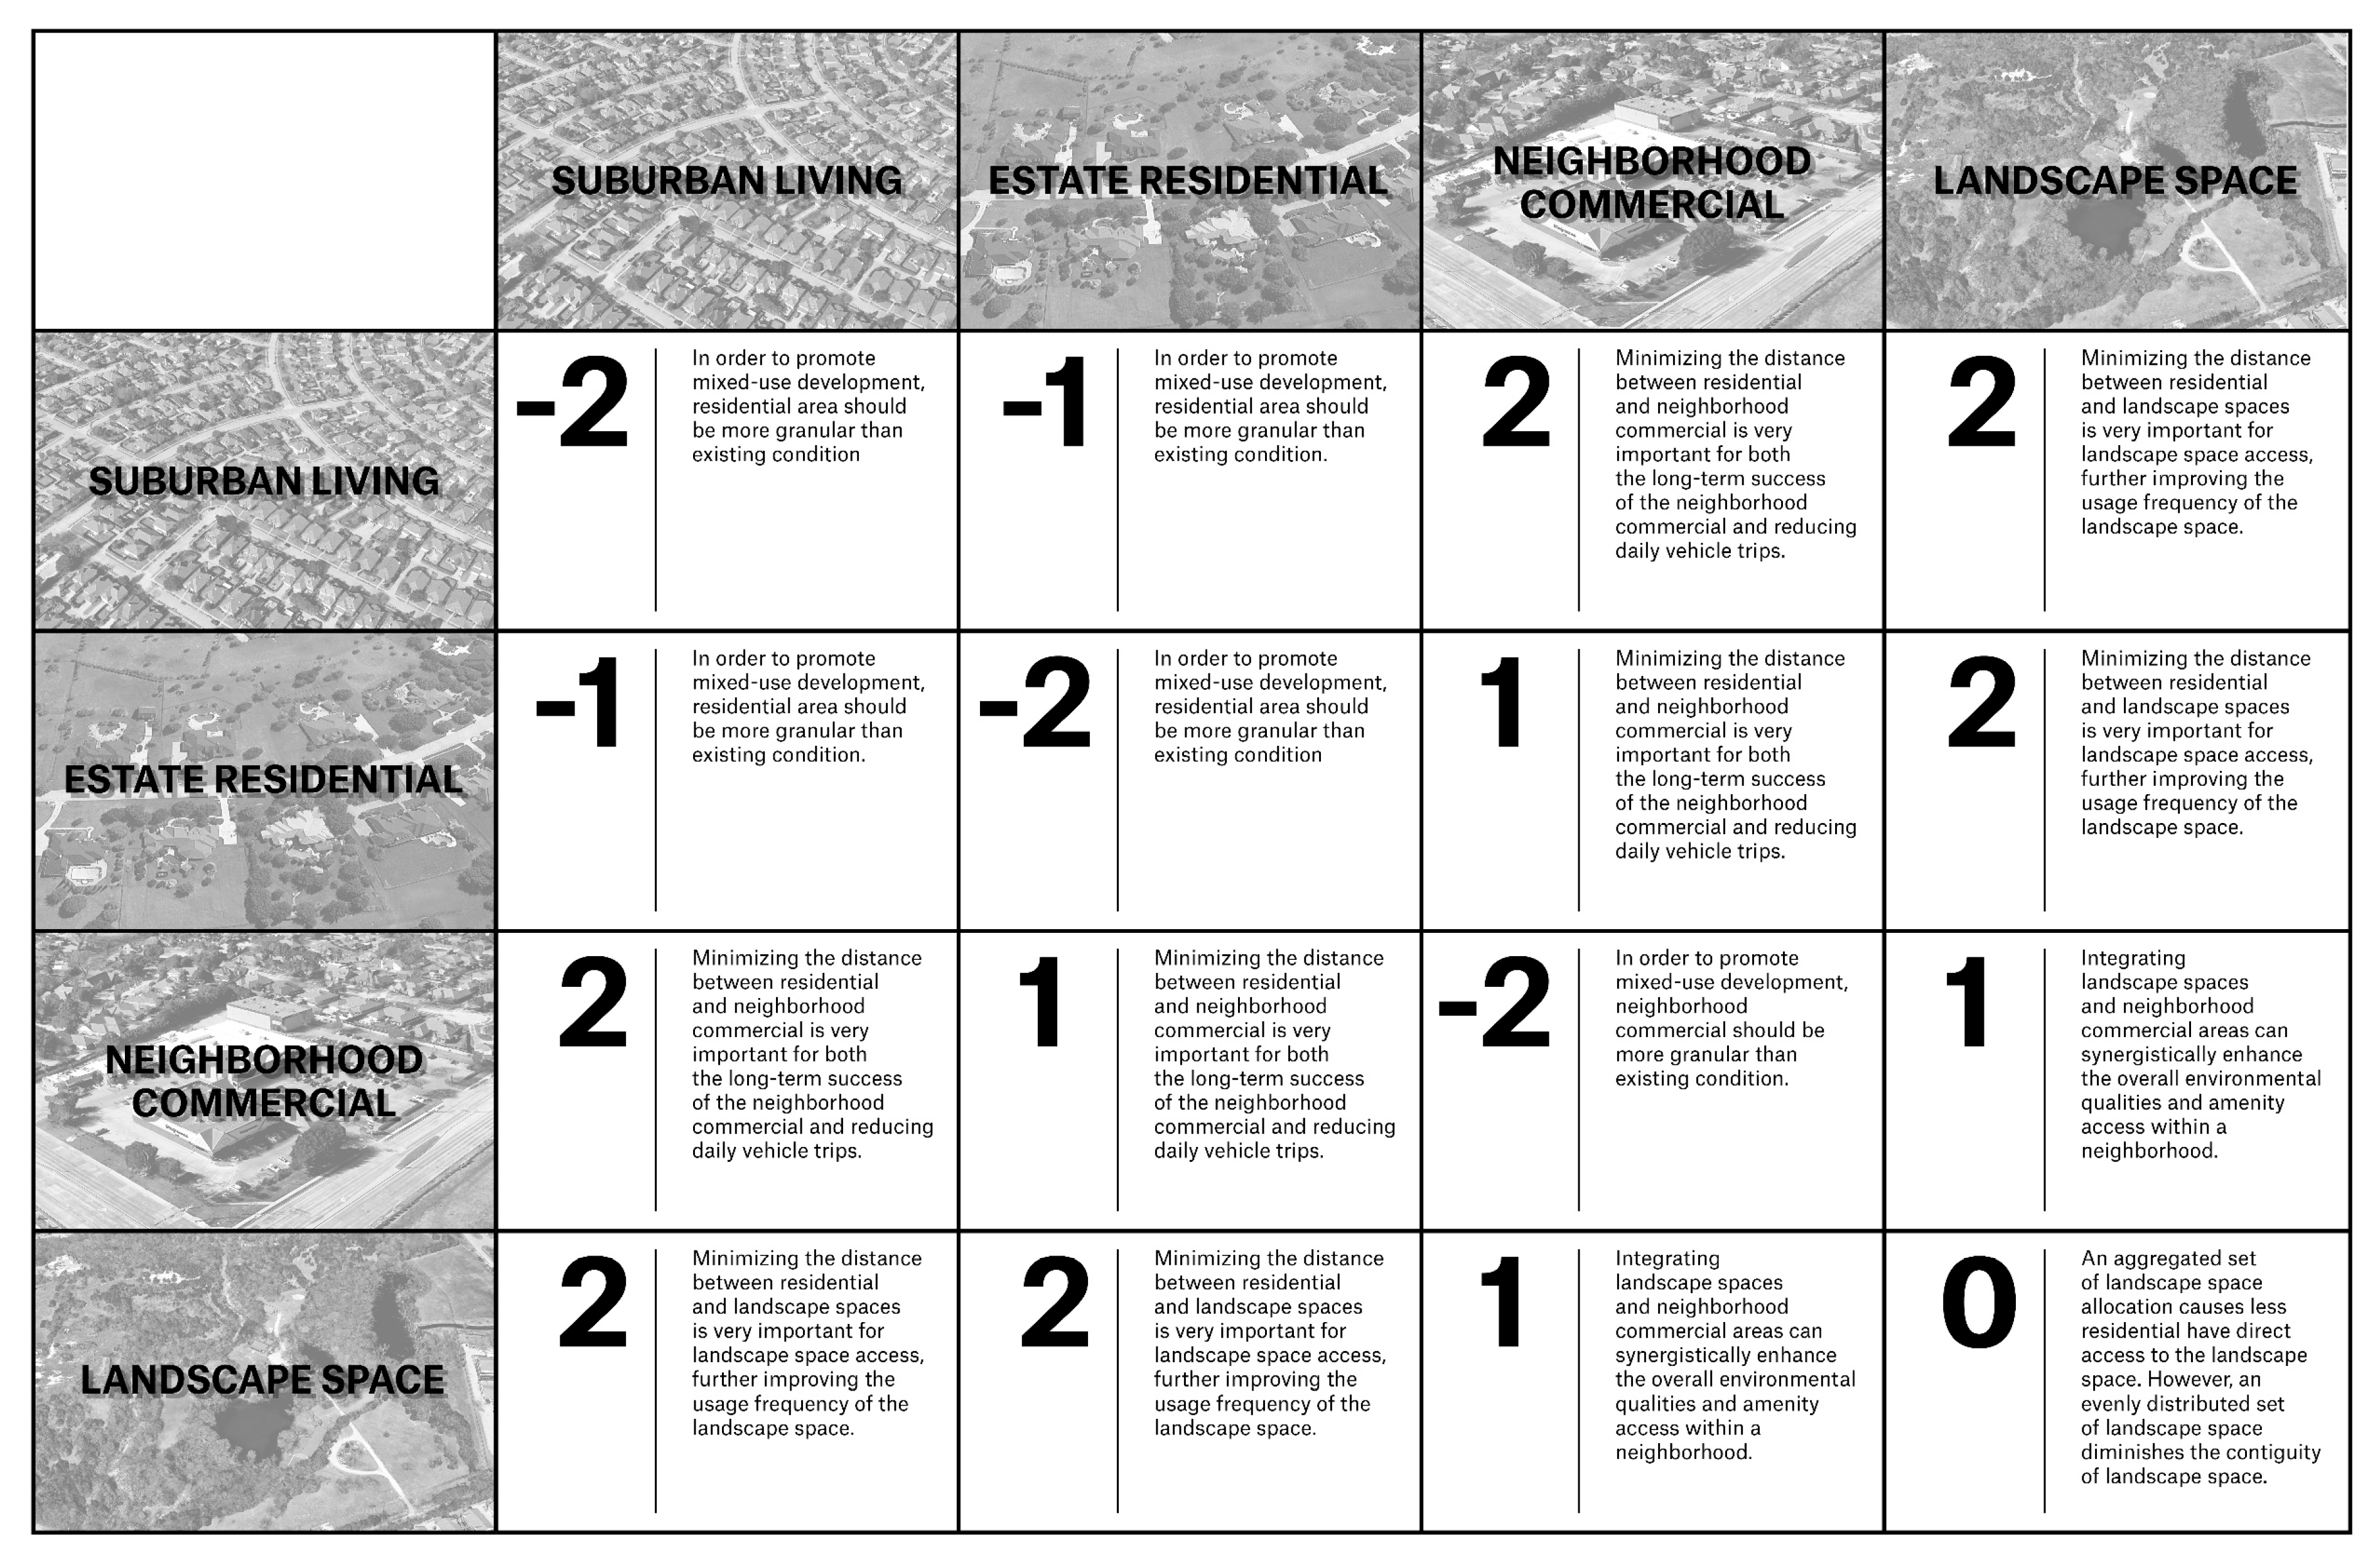
- At the district scale, the parametric design framework was used to explore potential spatial relationships between different land uses within the context of a widespread autonomous mobility system. The predetermined objectives for these new land use configurations were to increase access to a more distributed array of commercial and recreational amenities.
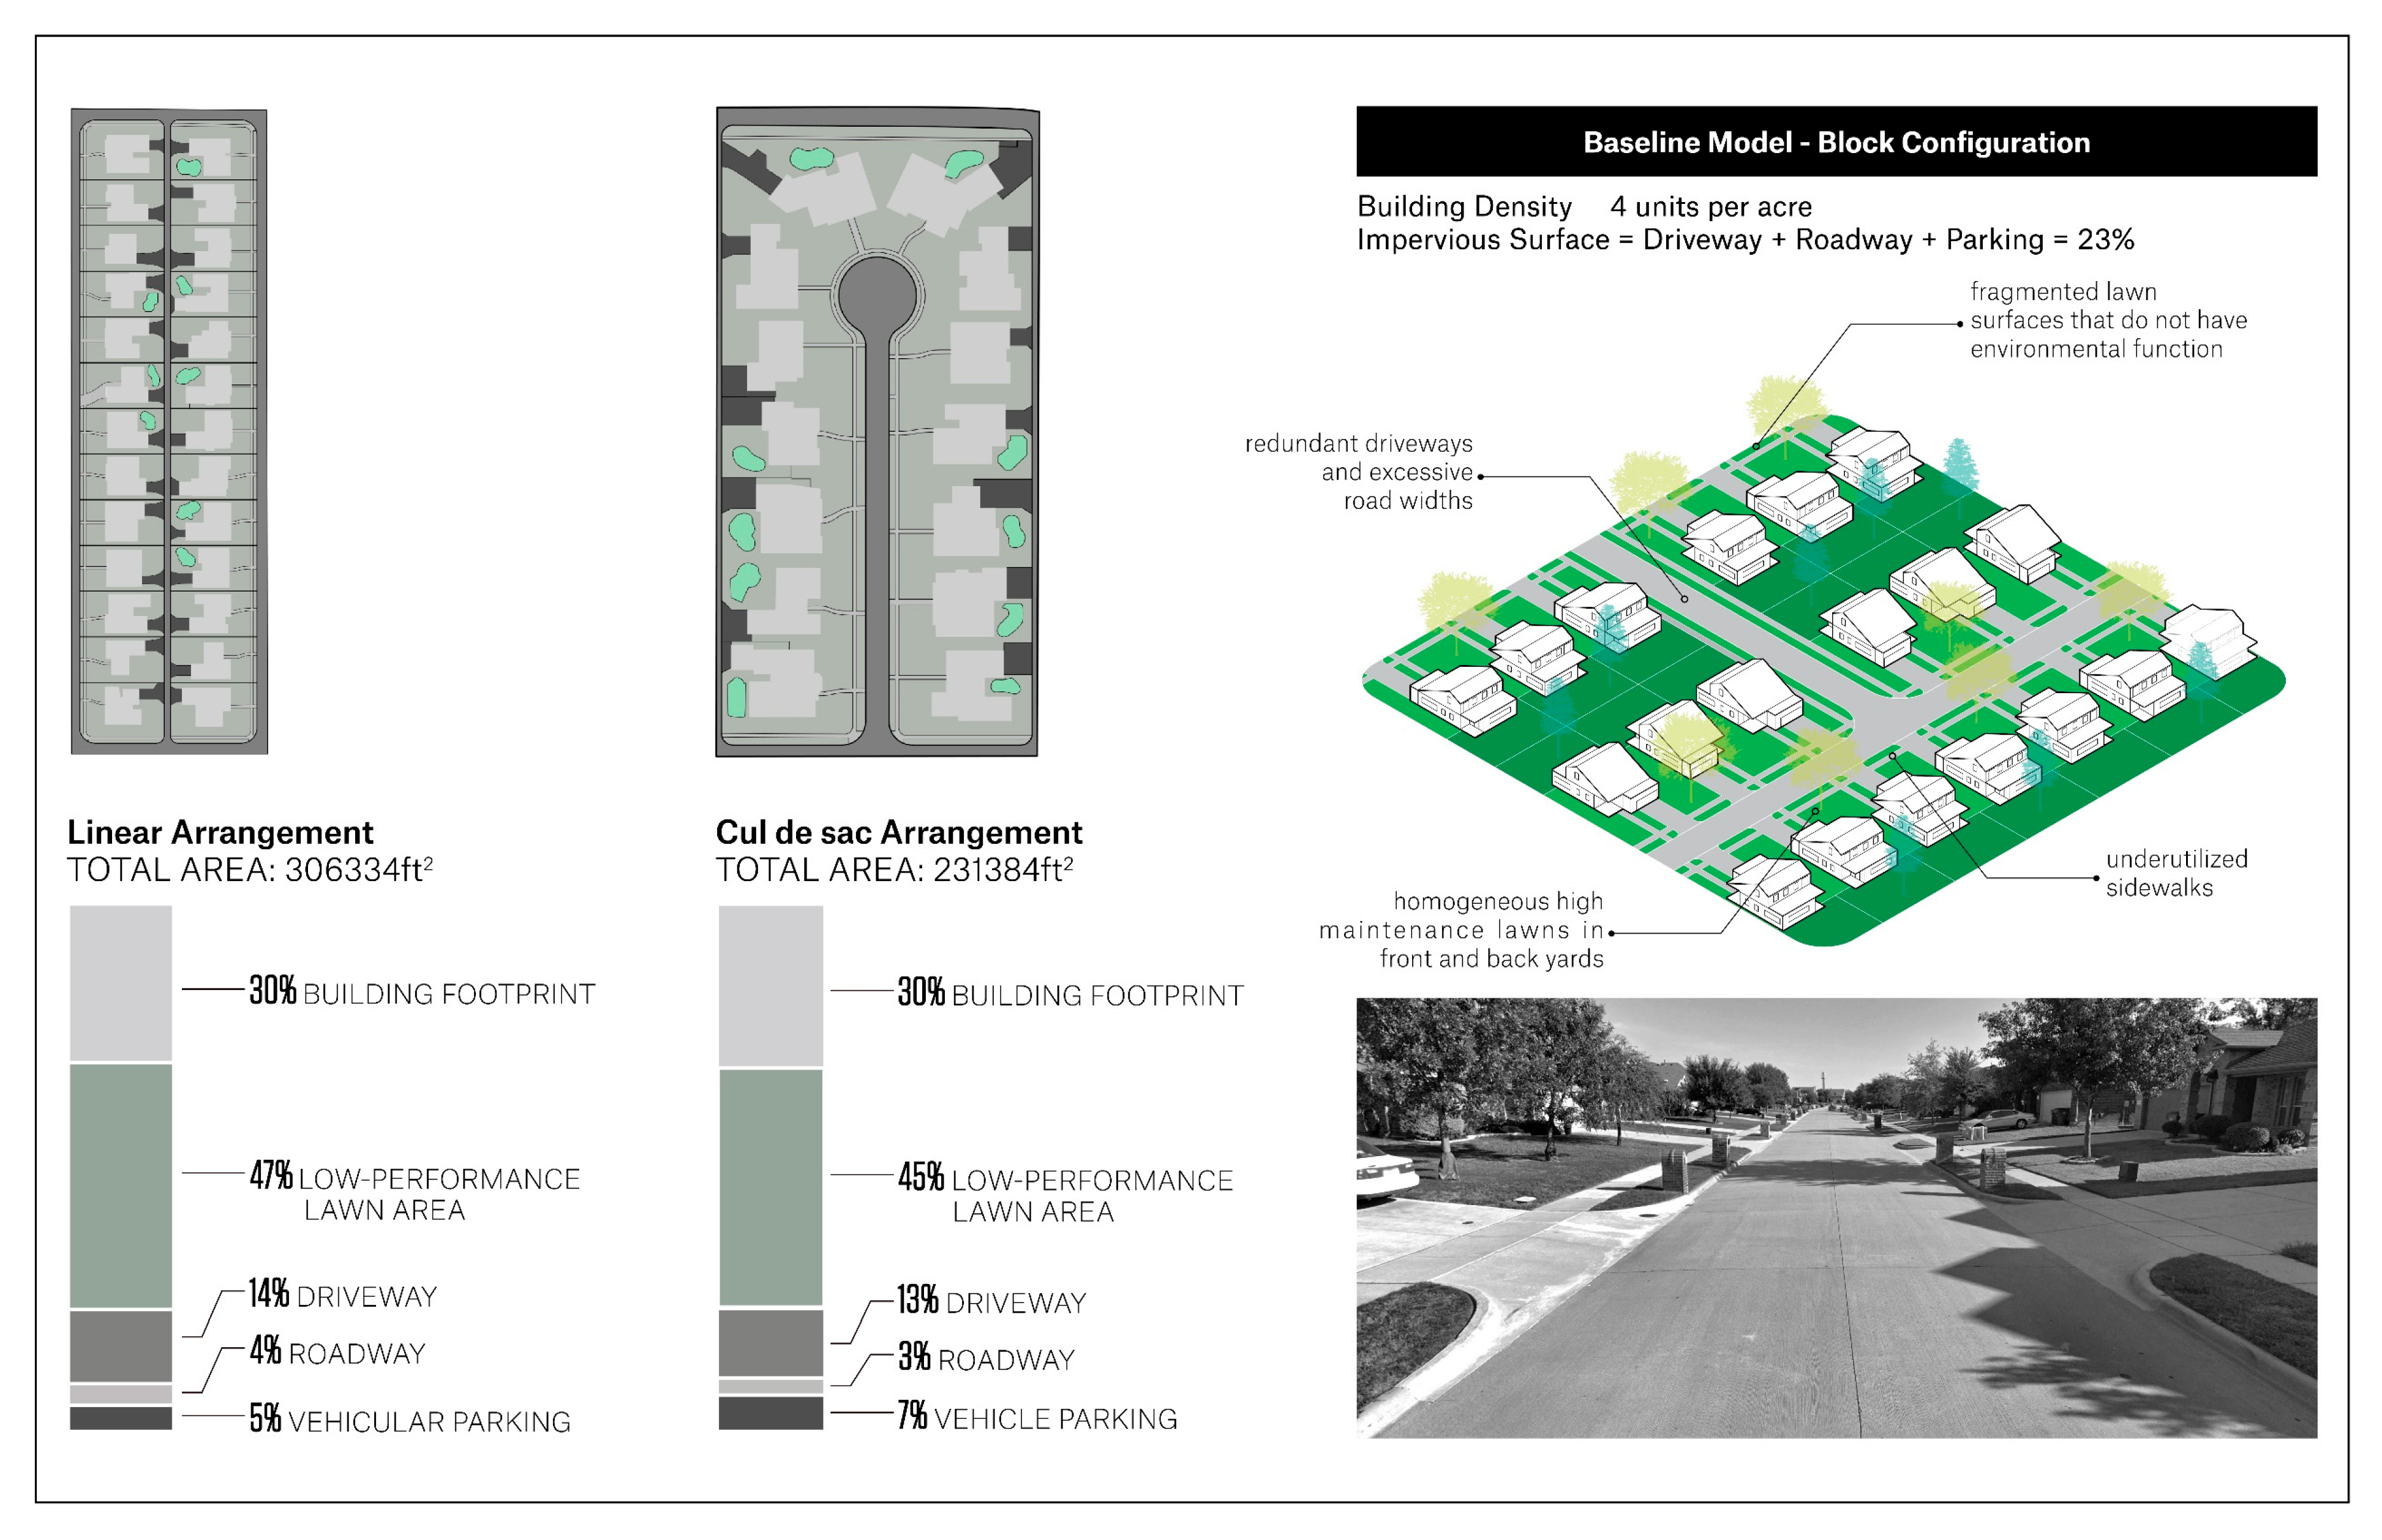
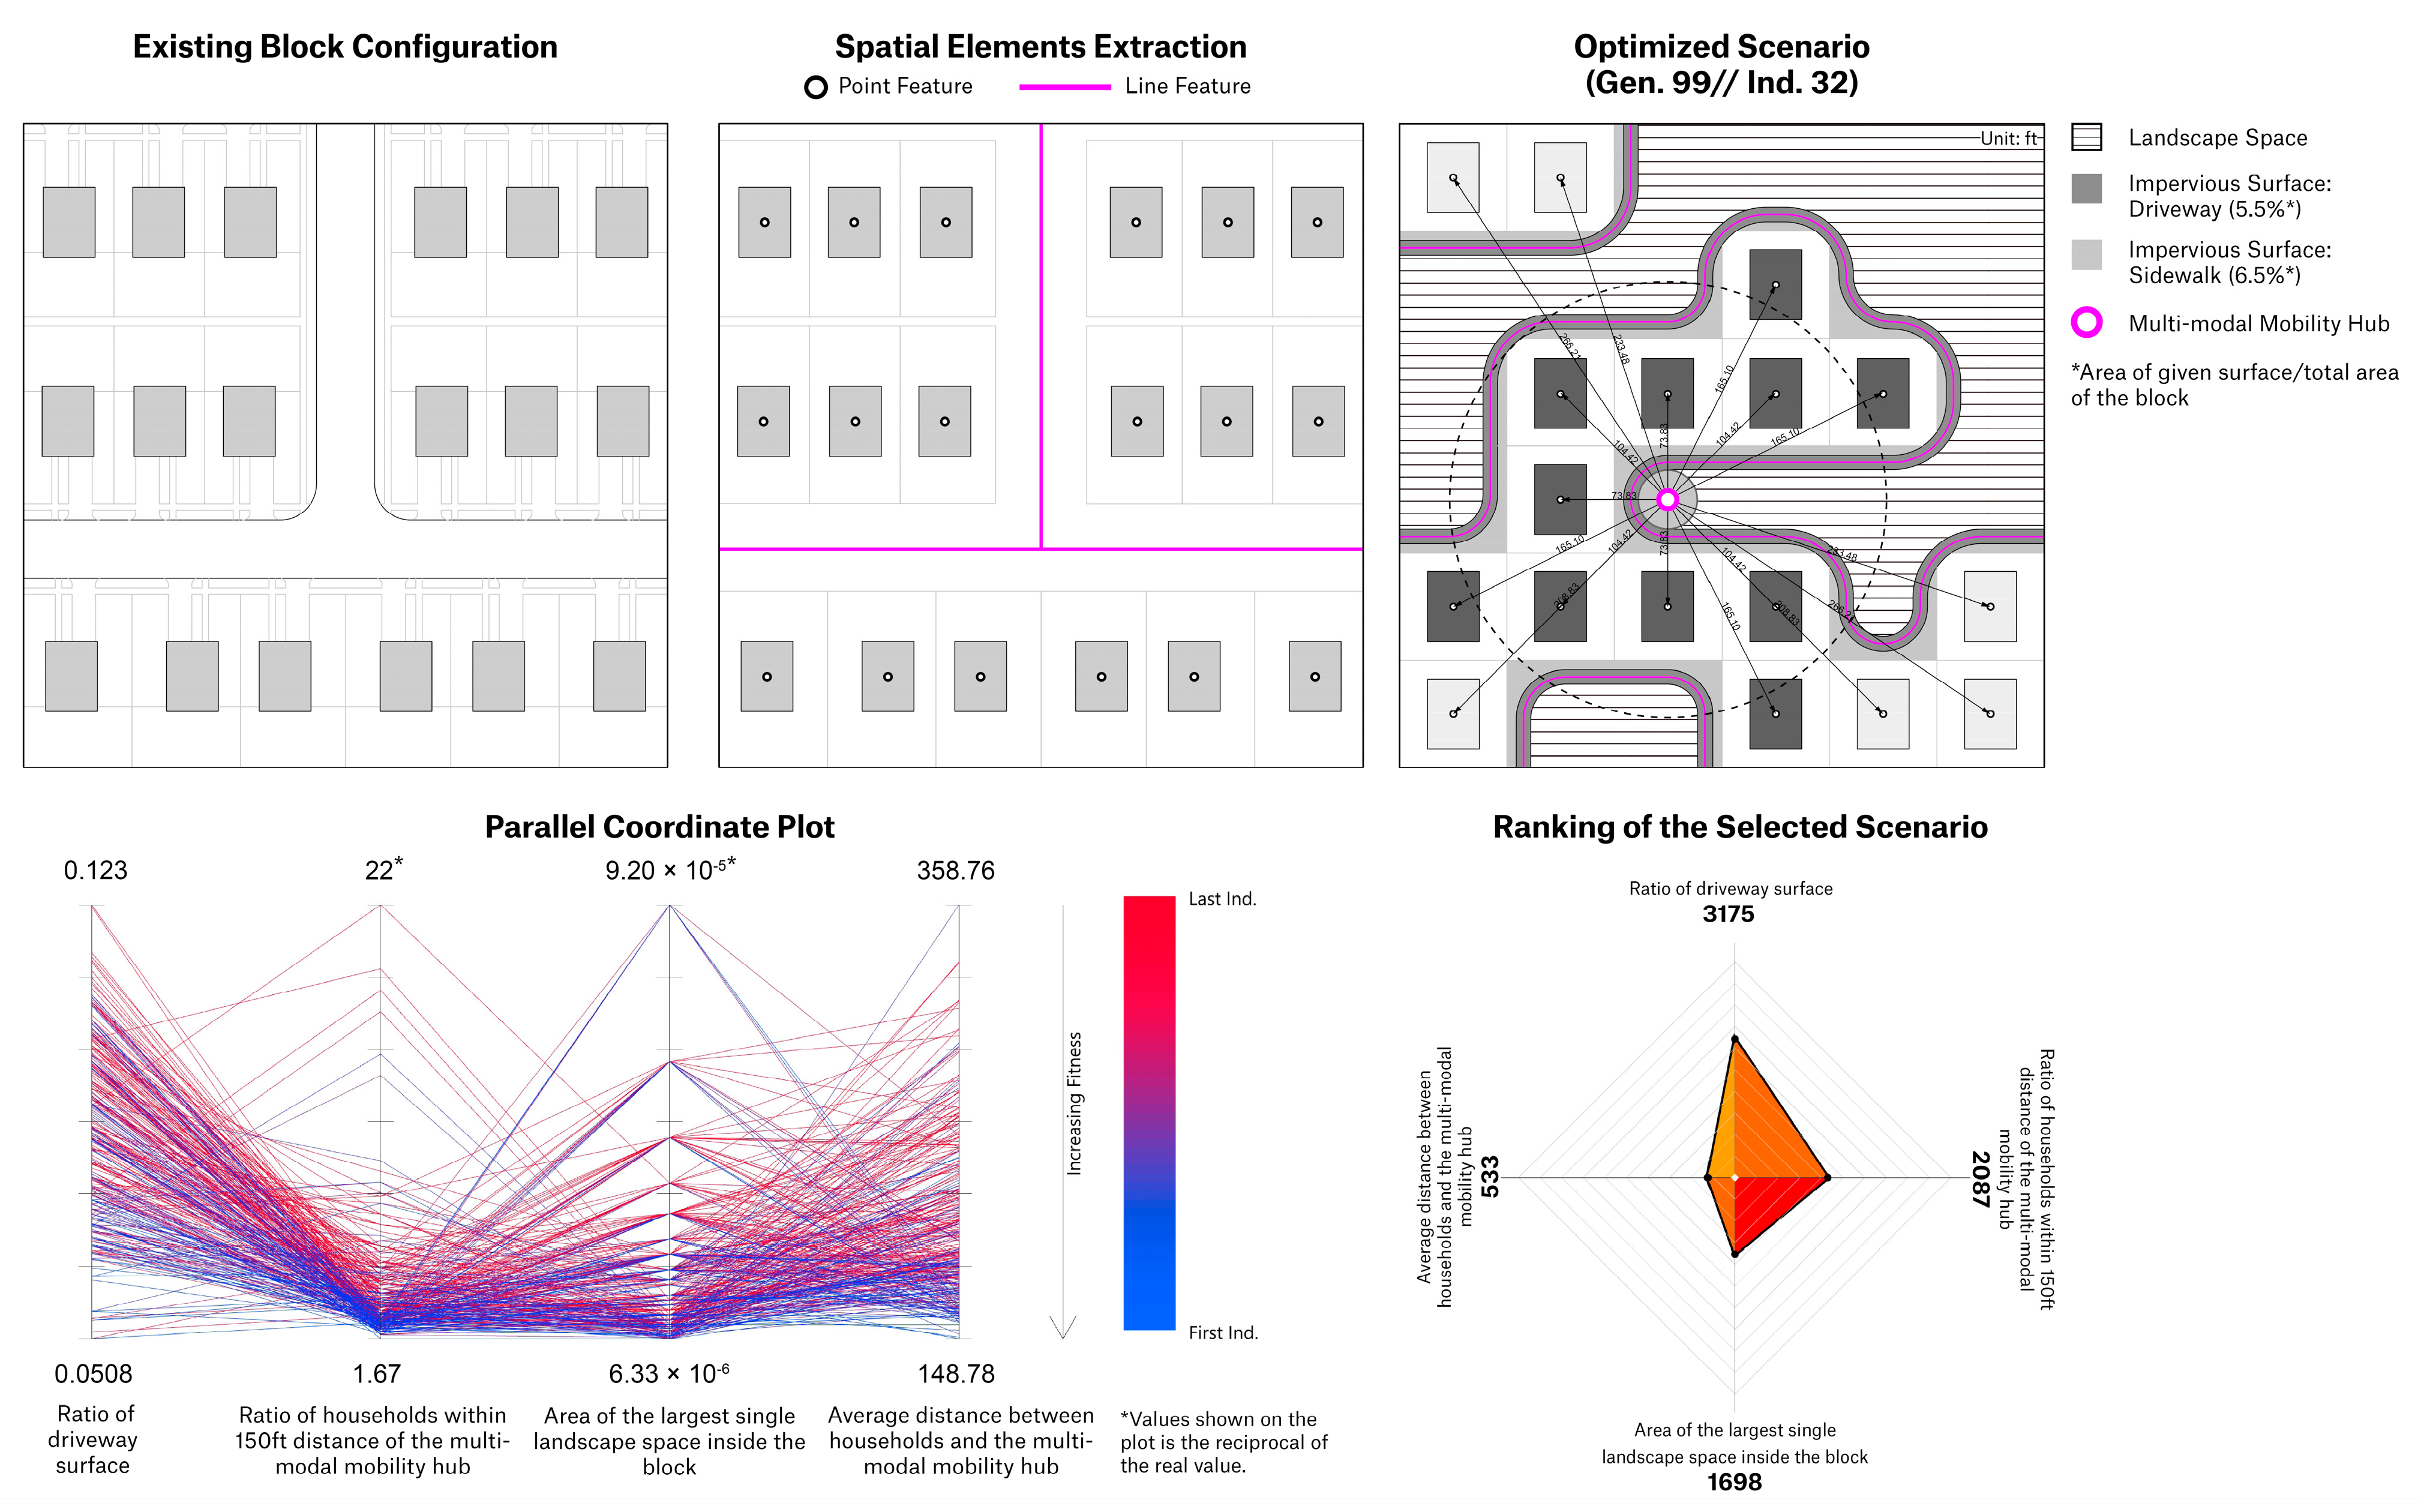
- At the block scale, the parametric design framework was used to experiment with various block configurations. These configurations were developed to respond to opportunities related to the adoption of an autonomous mobility system, such as narrower vehicular rights-of-way or more distributed multi-modal mobility hubs. The predetermined objectives for these optimized block configurations were to achieve improved accessibility, reduce impervious surfaces, and achieve more contiguous inner-block landscape space.
2. Materials and Methods
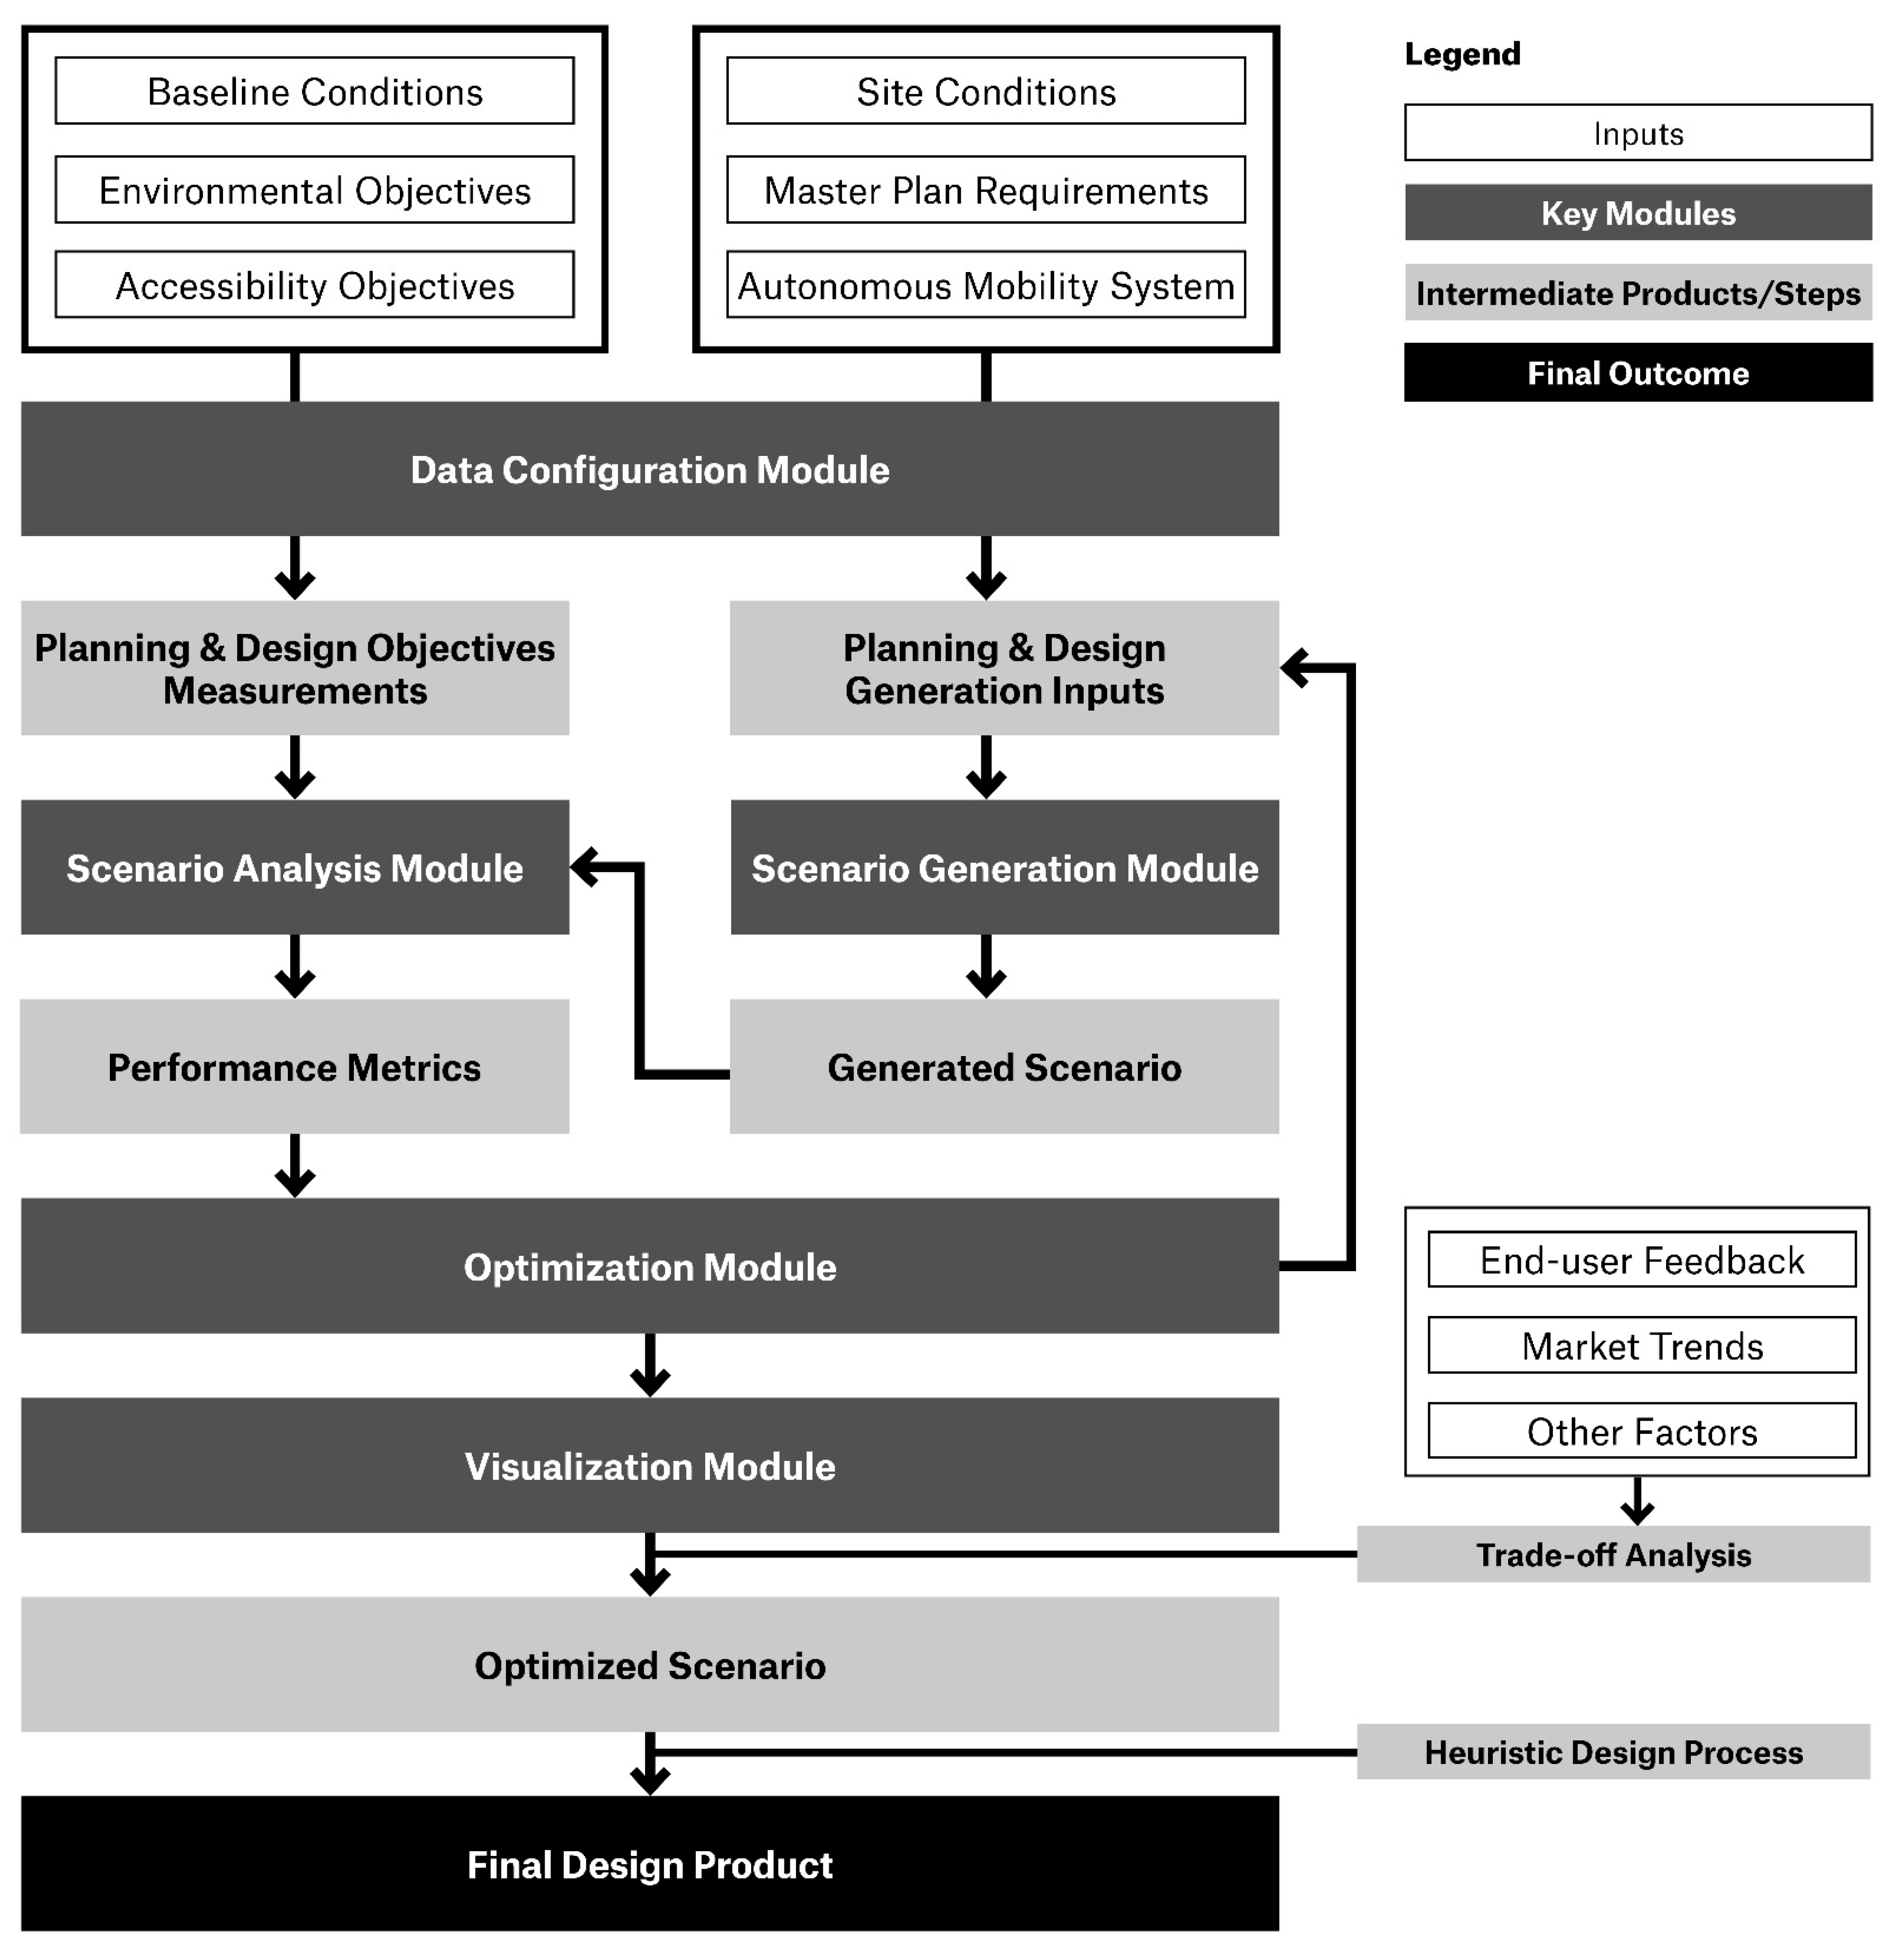
2.1. A Heuristic Parametric Design Framework—NOGAS
2.2. Key Modules
- Data configuration module: This module provides users with the capability to set or input parameters in multiple formats. Some of these parameters are associated with the generation of design scenarios, such as block size, building height, and land use attributes. Other parameters are typically linked to specific design objectives and are utilized later on in the scenario analysis module. This module can accommodate various data formats, including but not limited to Rhino3D vector data, ESRI Shapefile data, and matrix data. Different data formats are then converted into appropriate formats for future usage.
- Scenario generation module: With the input parameters from the data configuration module, this module is used to generate design scenarios based on predefined spatial objectives. As the parameters are modified, the generated results adapt accordingly.
- Scenario analysis module: This module is specifically designed to measure the performance factors of each generated scenario based on predefined metrics and predetermined objectives, as described in Section 2.2.
- Optimization module: This module is used to execute the design optimization processes. It serves as a crucial link between the scenario generation module and the scenario analysis module. By utilizing the performance metrics obtained from the scenario analysis module, this module dynamically adjusts the parameters that are input into the scenario generation module. This iterative process aims to refine and optimize the scenarios to achieve enhanced outcomes. It can accommodate various algorithms, including linear optimization [103], simulated annealing [104], particle swarm optimization [105], and others. After careful evaluation of different algorithms, Non-dominated Sorting Genetic Algorithm II (NSGA-II [106])3 is applied for its efficient non-dominated sorting procedure [107], performance in optimizing problems with two or more objectives [108], and ability to generate a comprehensive set of Pareto-optimal solutions rather than a single optimum solution [109].
- Visualization module: This module encompasses a collection of scripts that enable real-time visualization of output scenarios and performance metrics. By utilizing this module, designers gain a clear understanding of the generated and optimized scenarios, facilitating improved design communication.
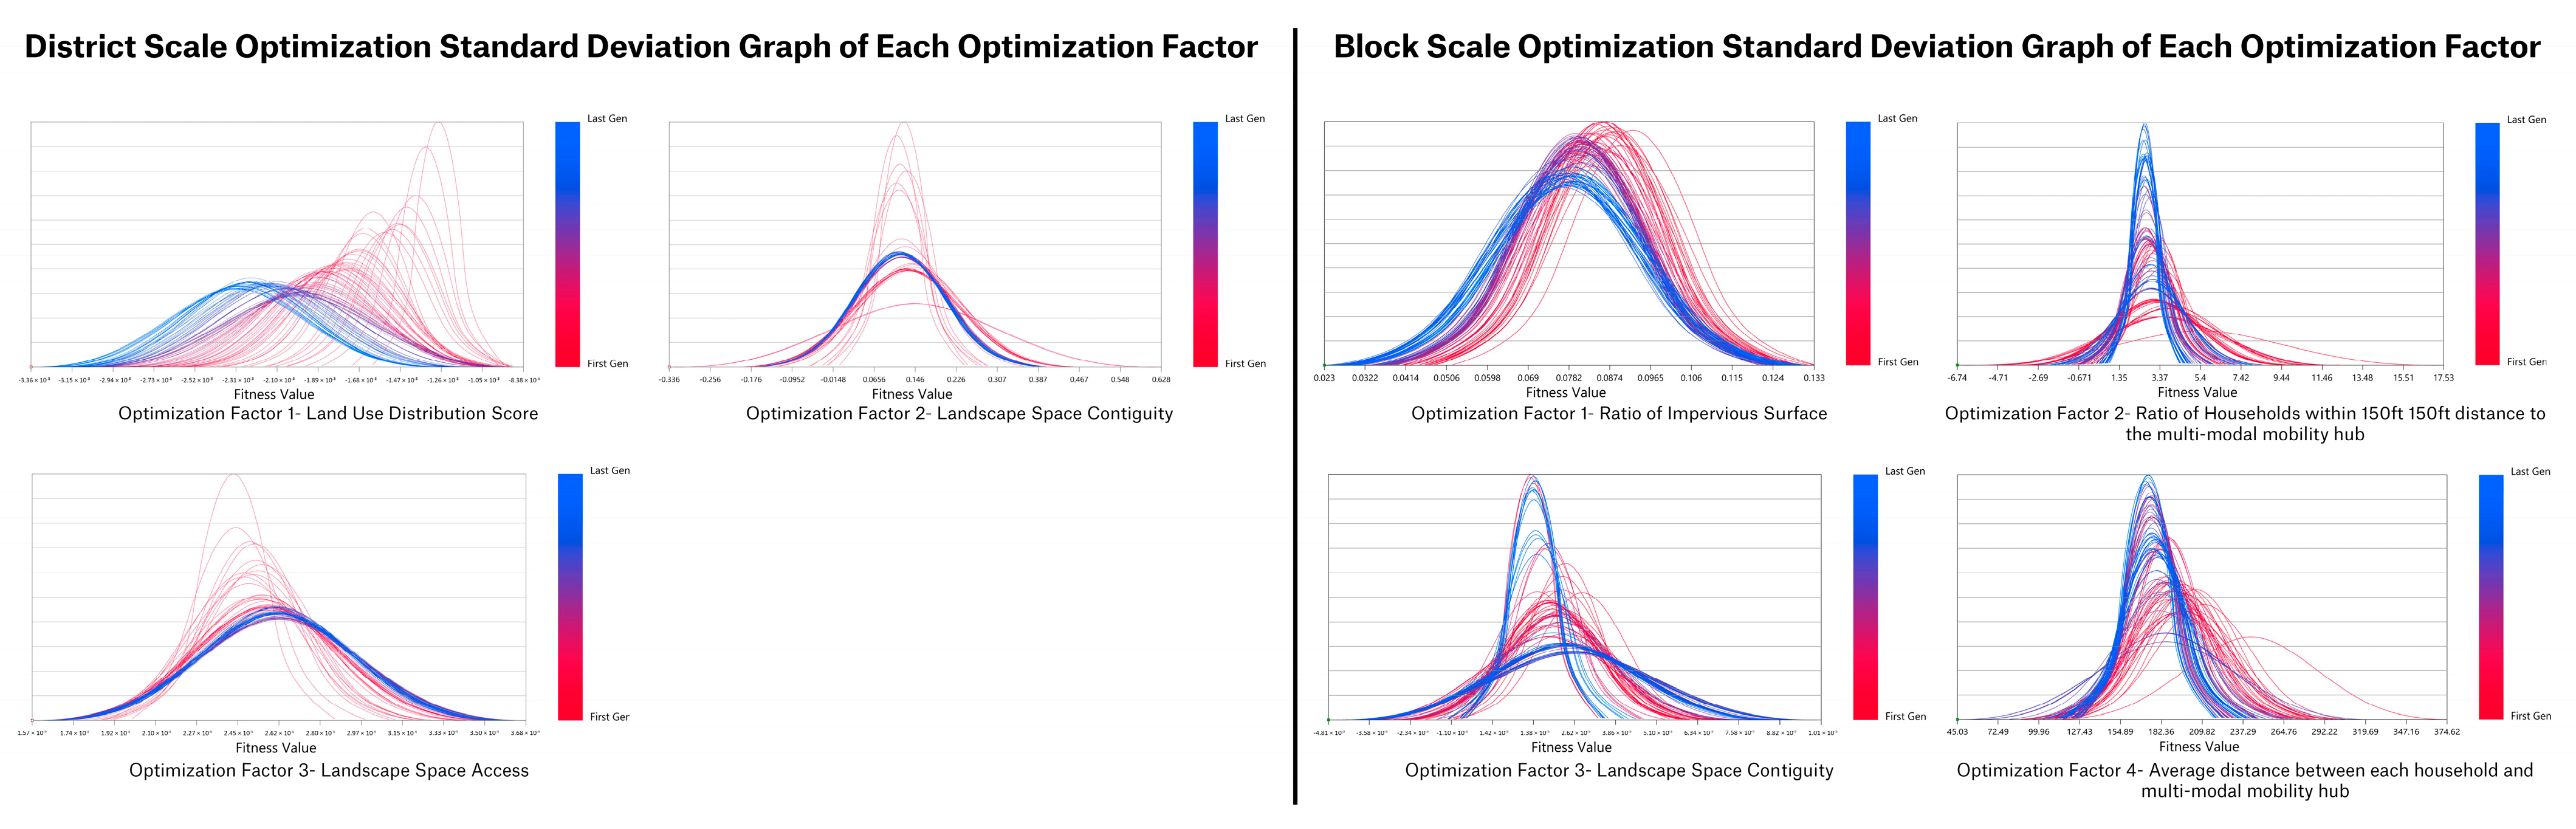
2.3. Optimization Factors
2.3.1. District Scale Optimization Factors
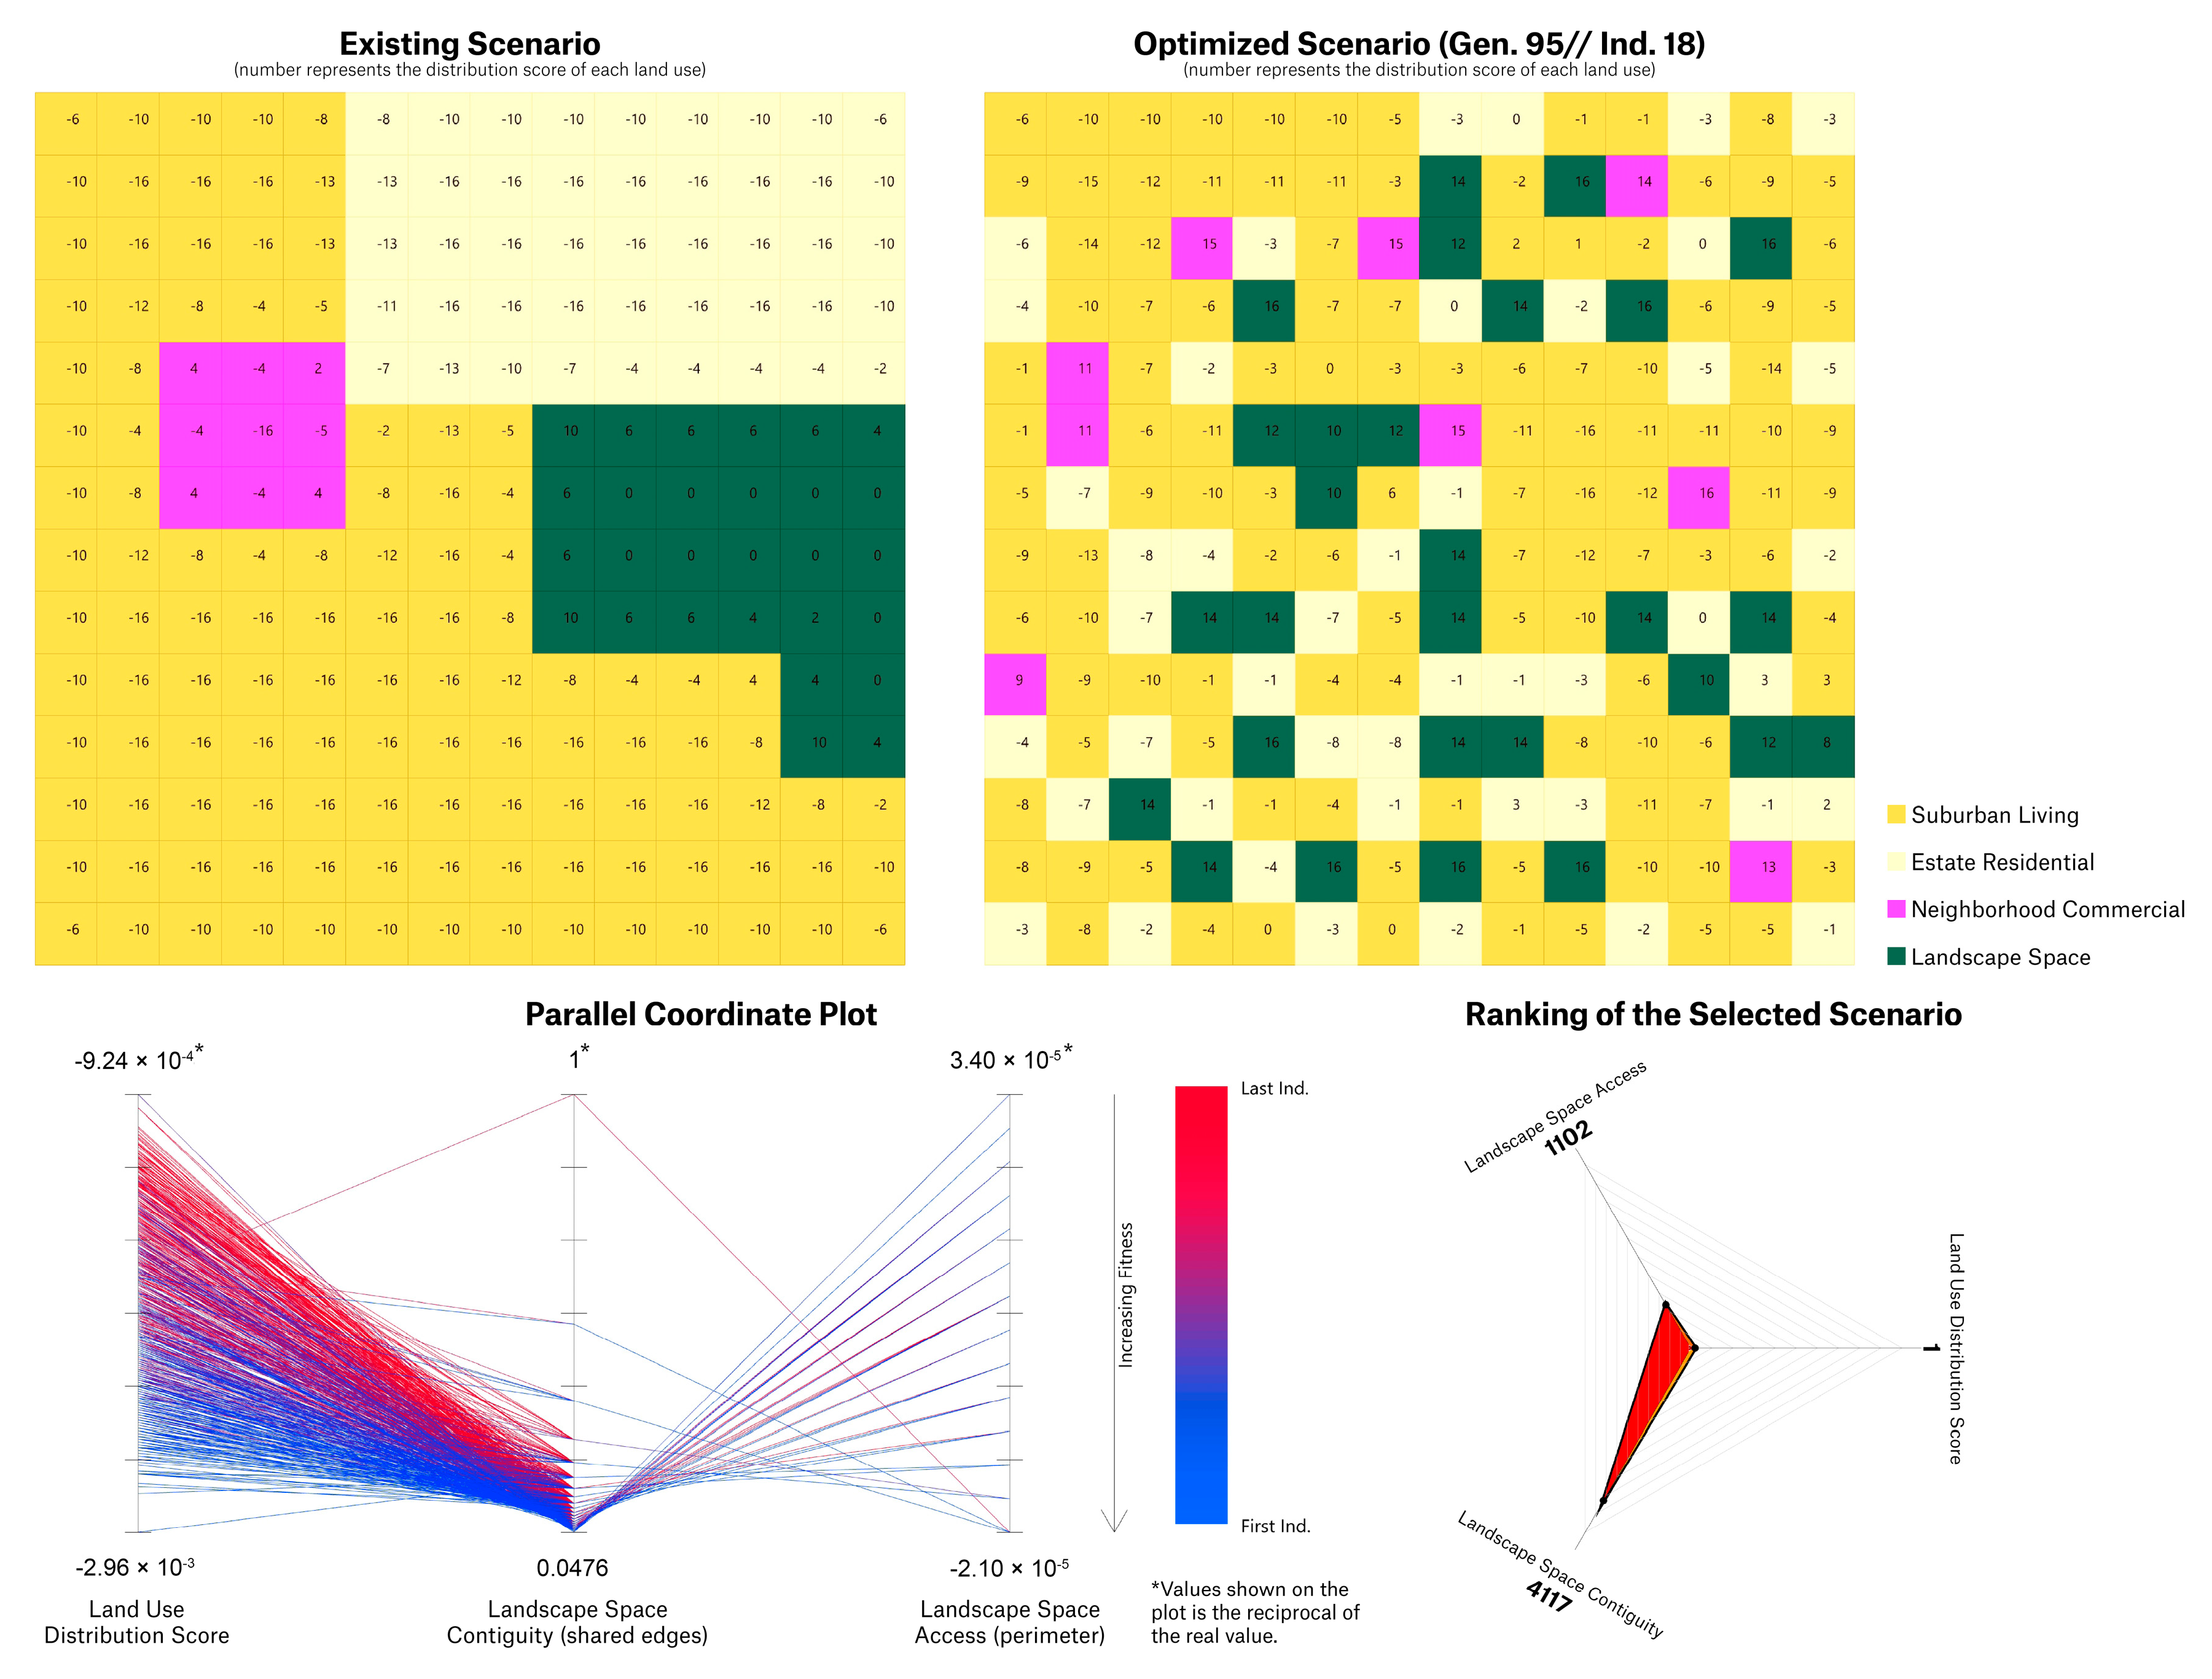
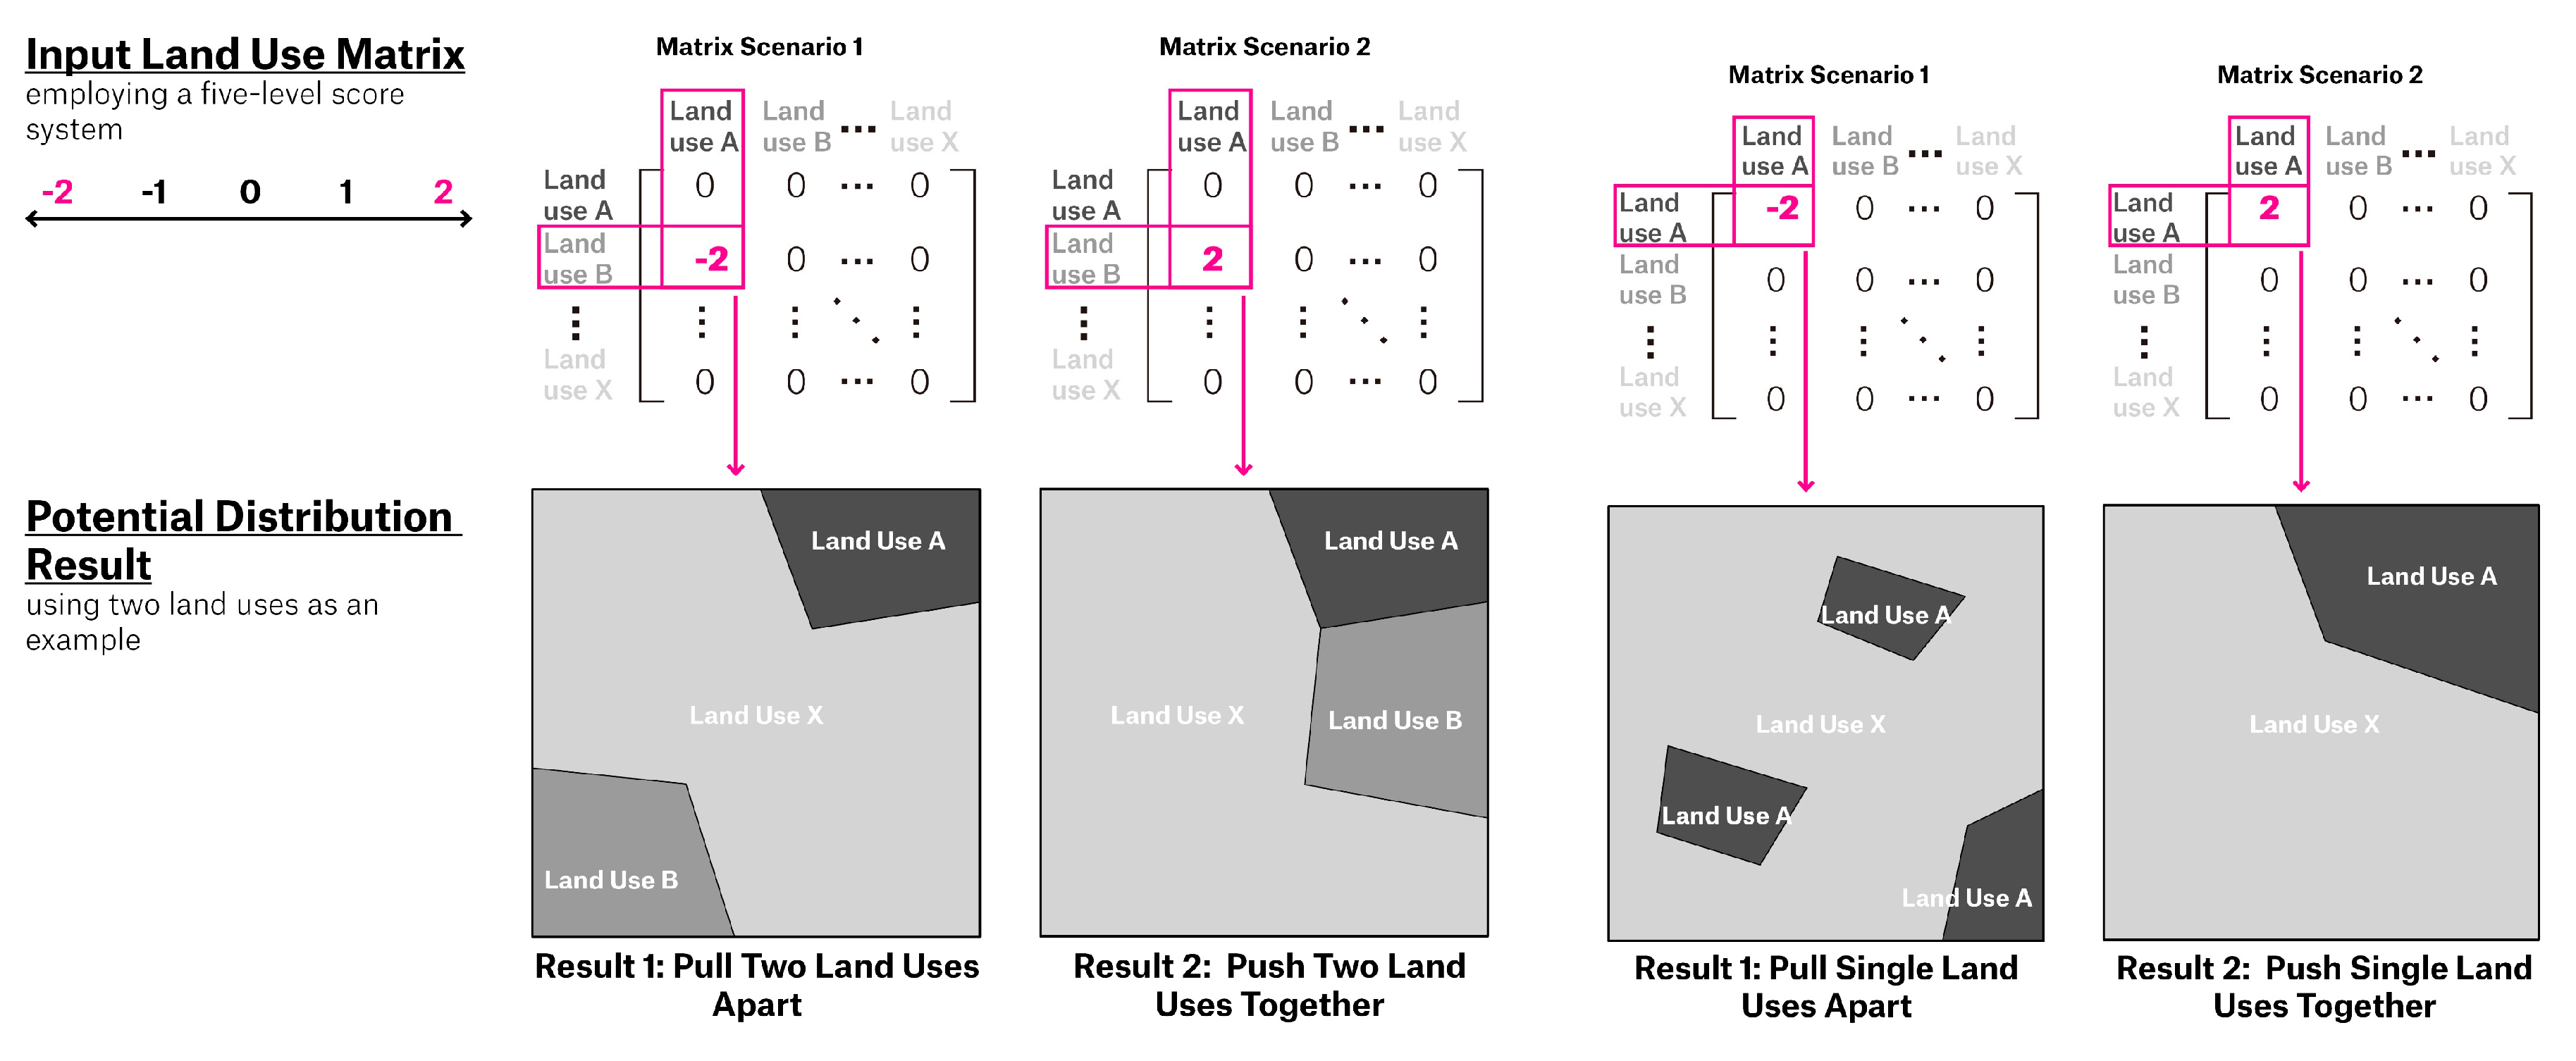
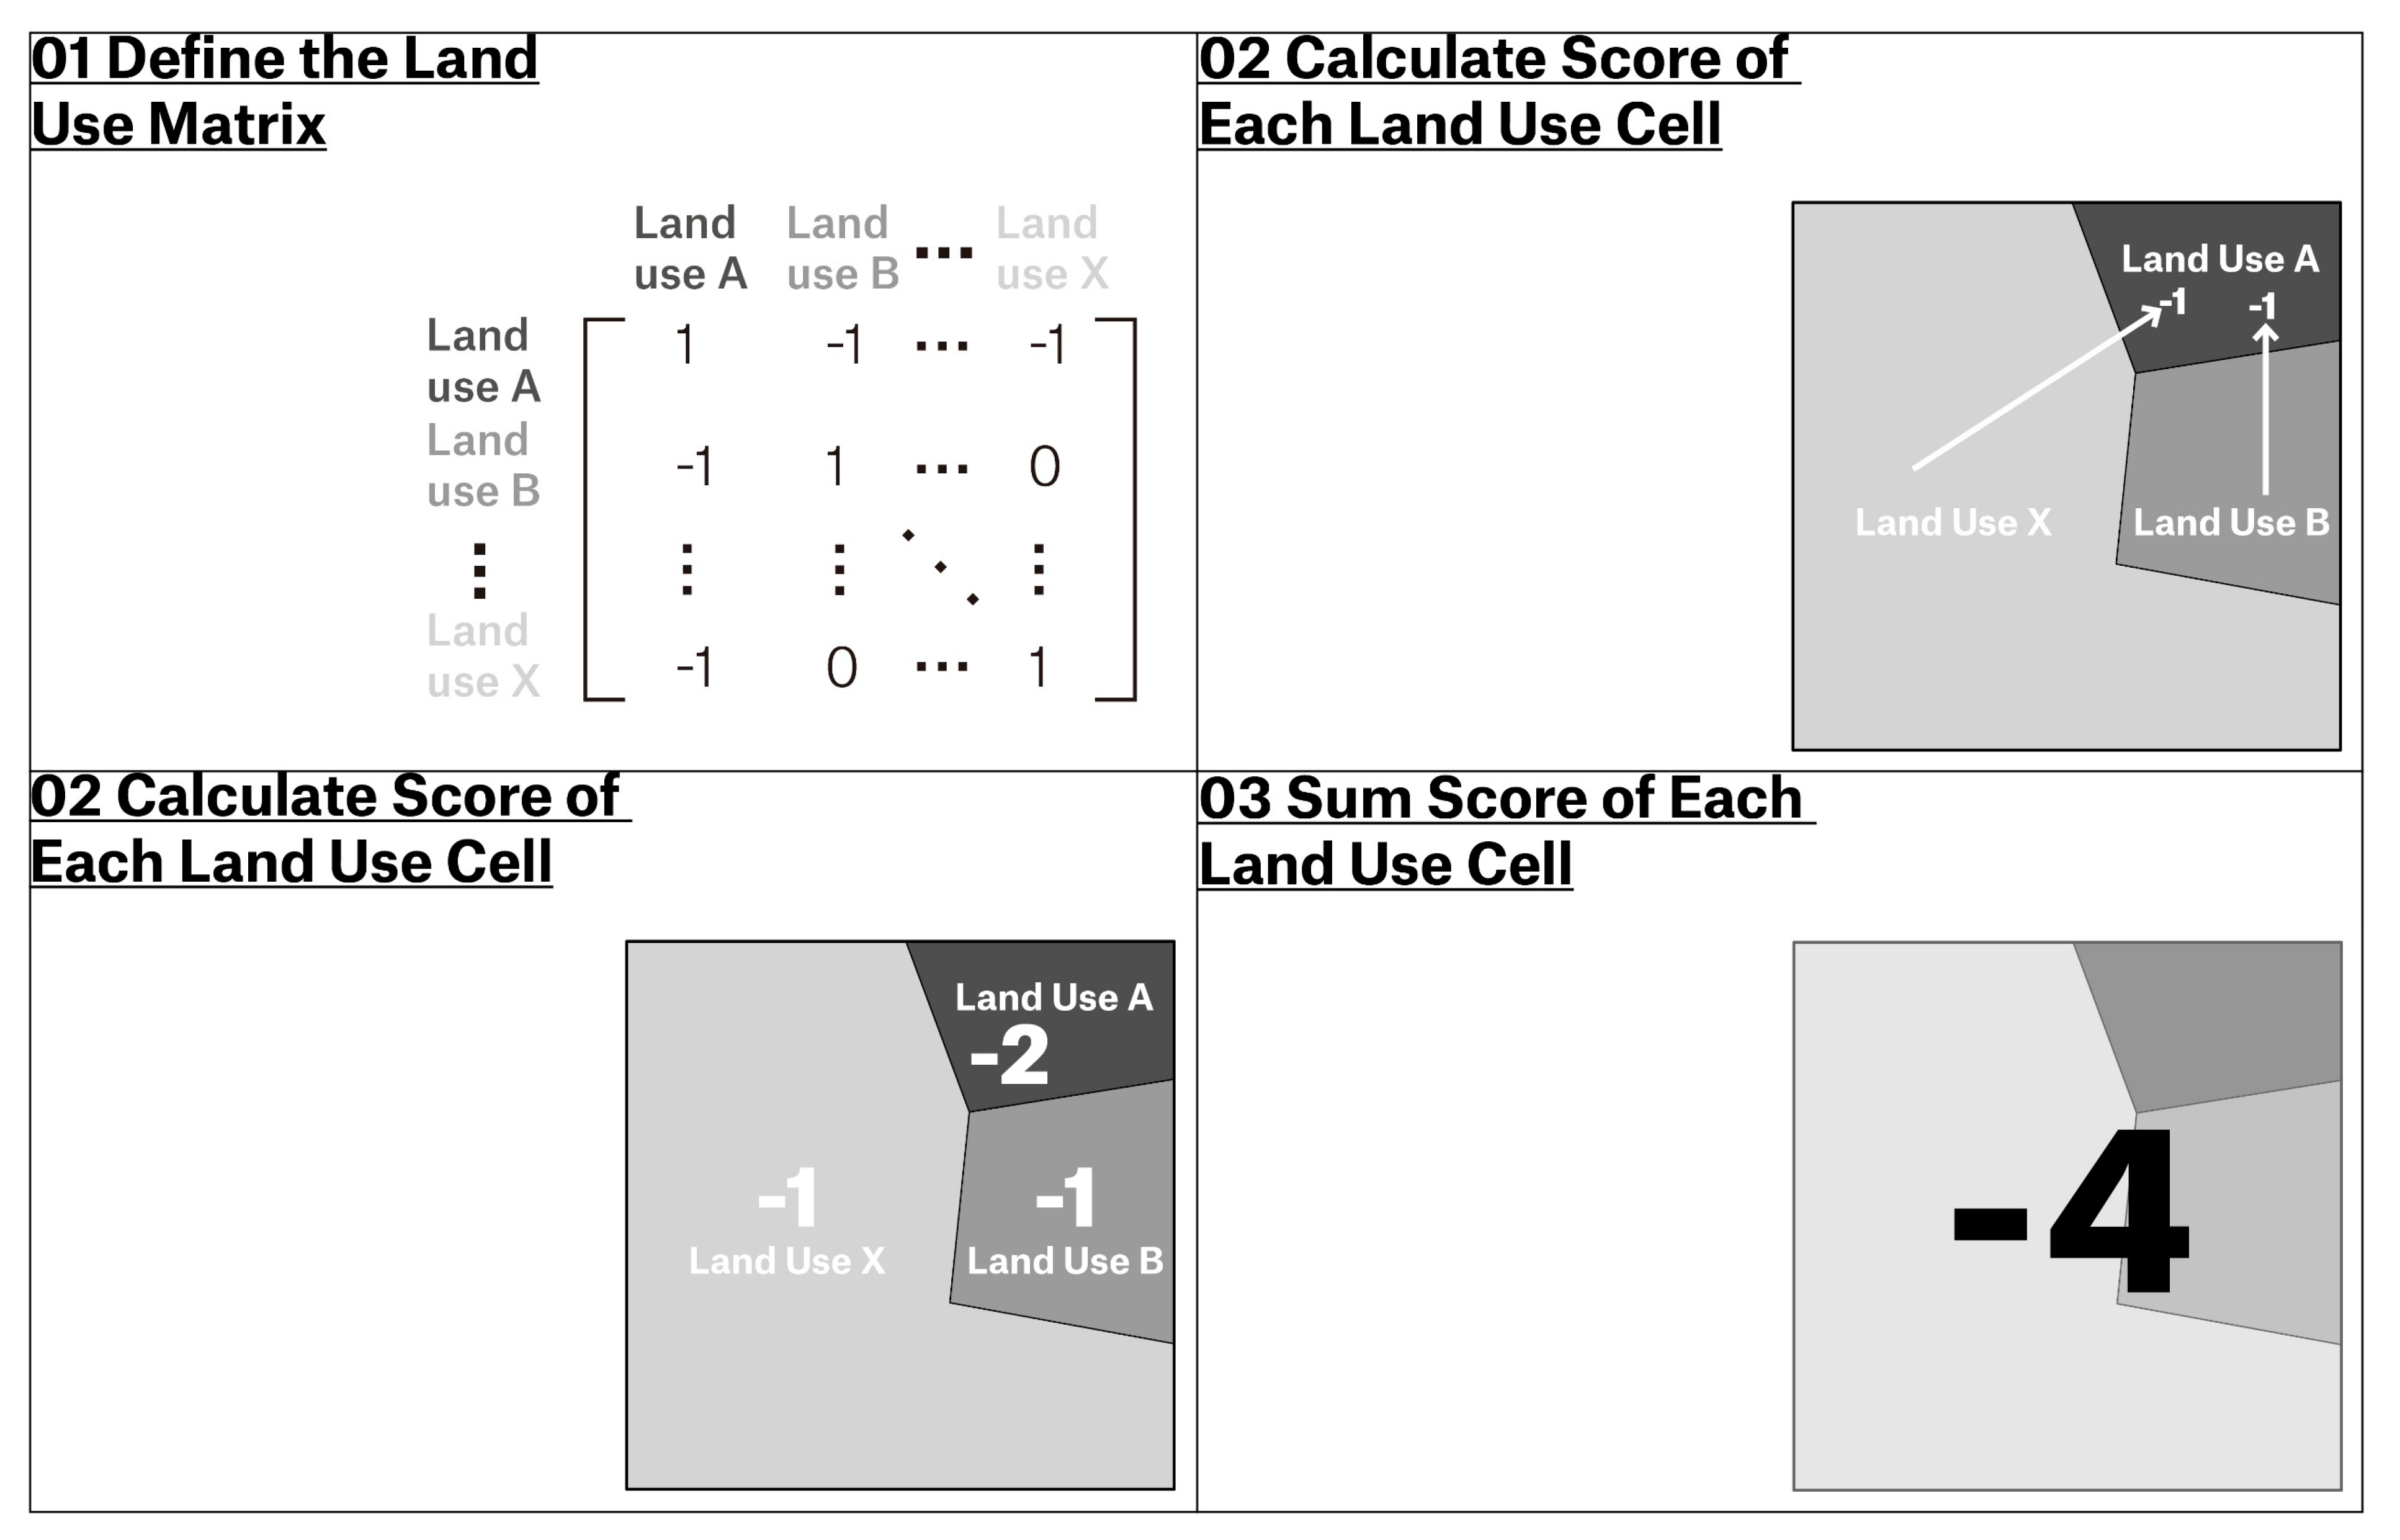
- Land Use Distribution
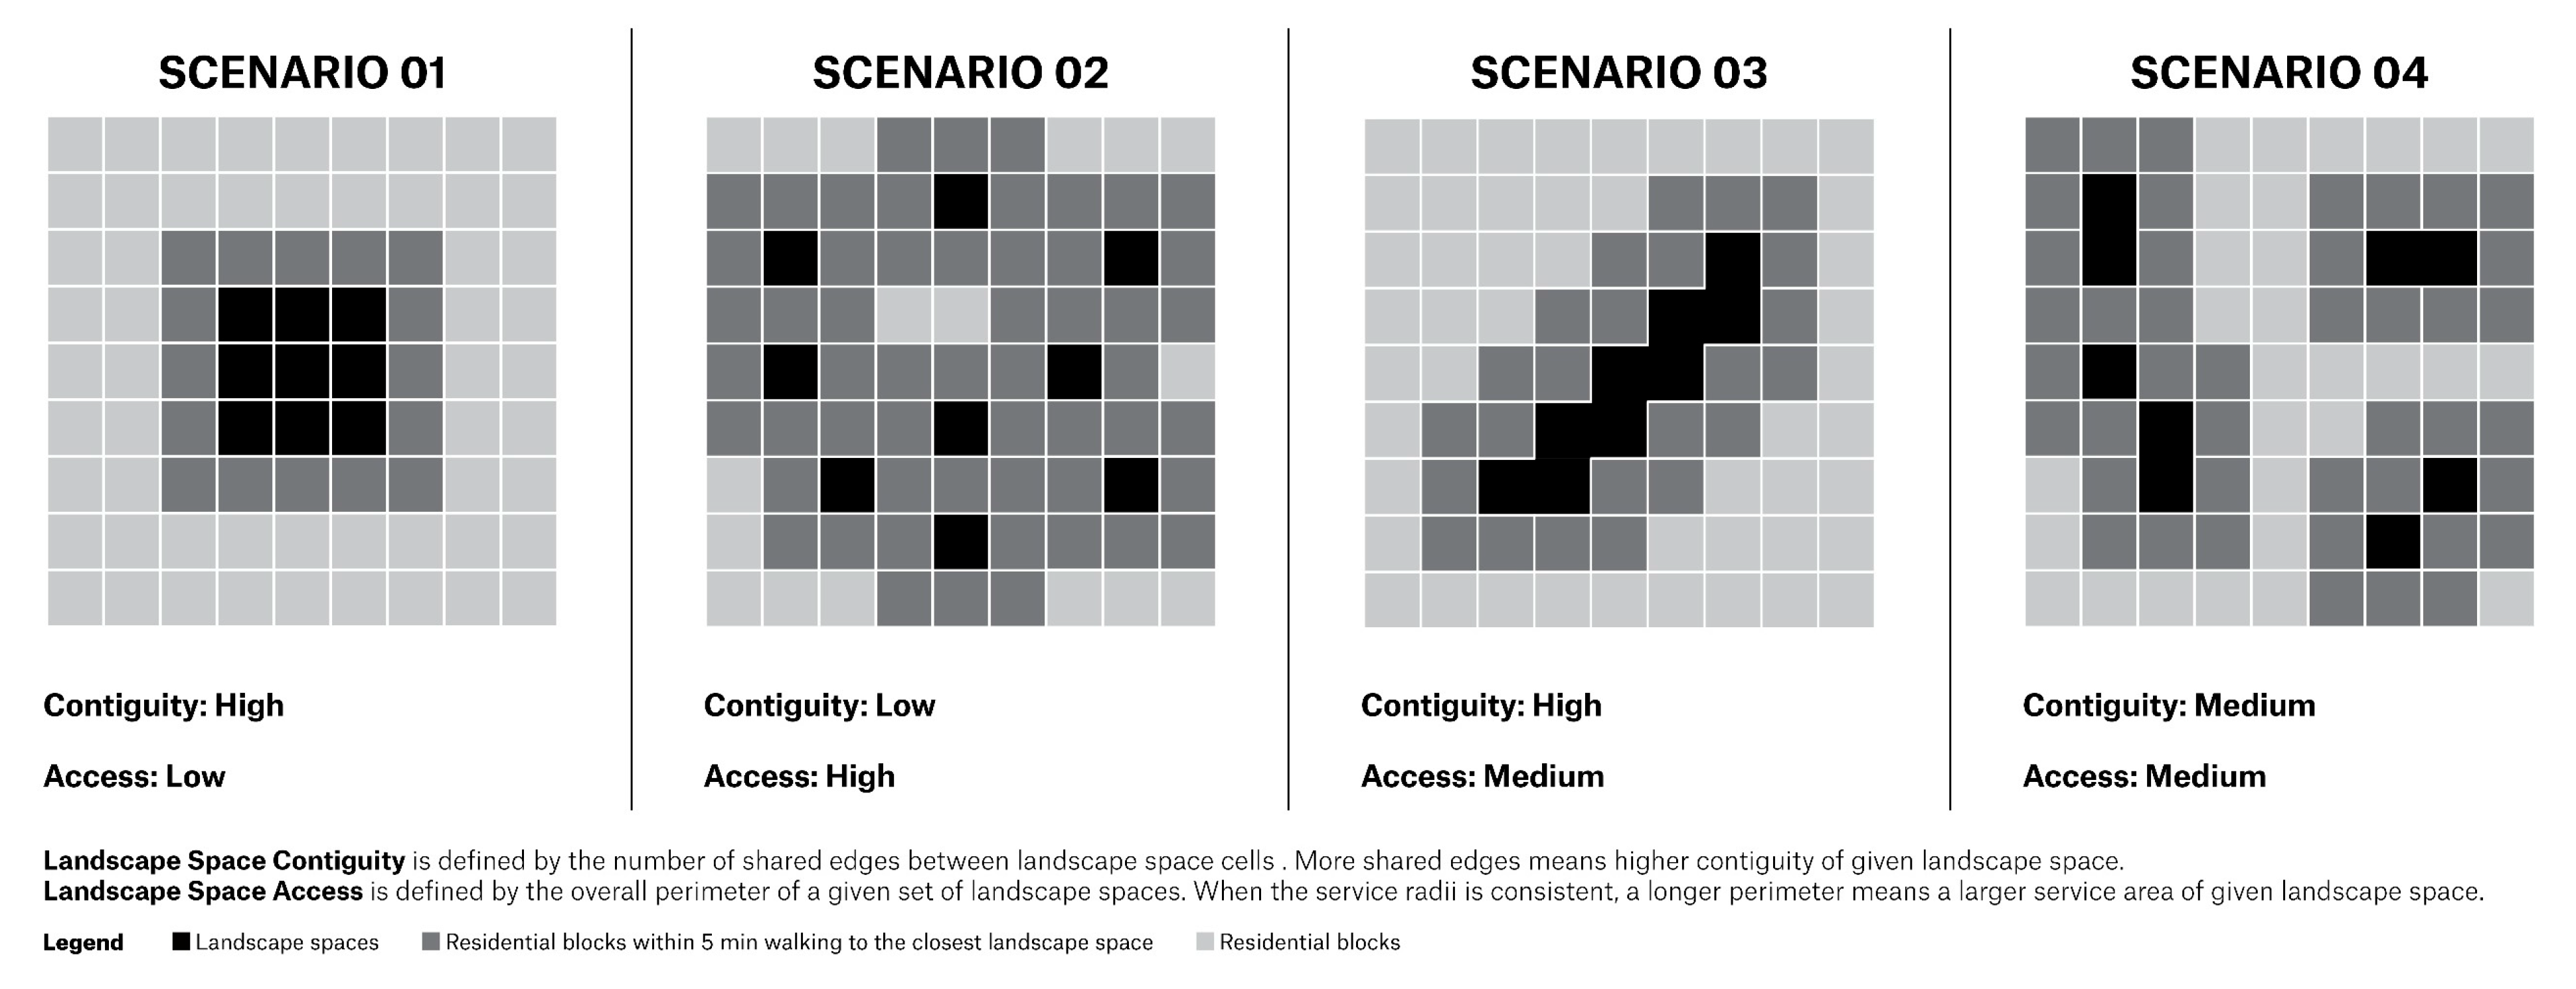
- Landscape Space Allocation
2.3.2. Block Scale Optimization Factors
- Impervious Surface Reduction and Landscape Space Contiguity
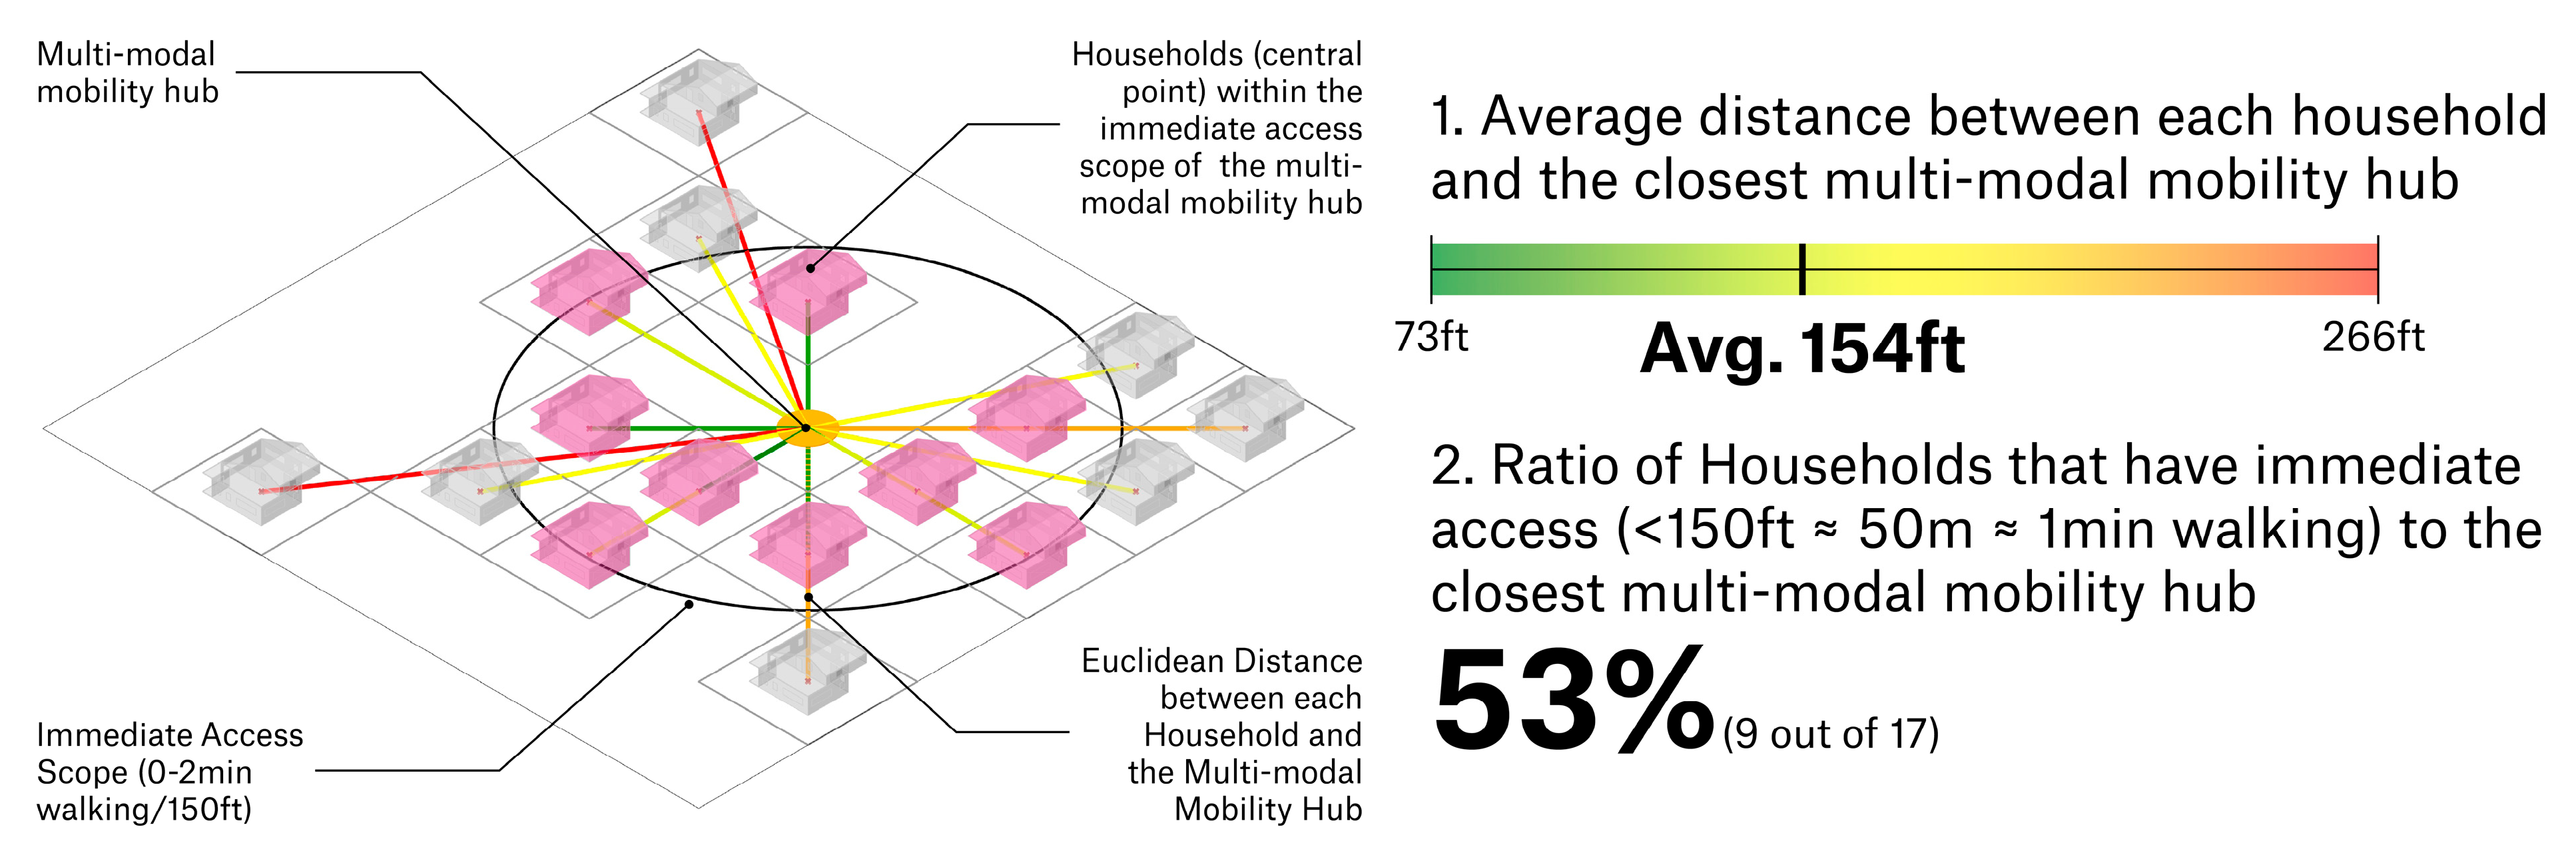
- Multi-modal Mobility Hub Access
2.4. Baseline Analysis and Input Configurations
2.4.1. Baseline Analysis
2.4.2. Input Configurations
3. Case Studies and Results
3.1. District Scale Results
3.2. Block Scale Results
4. Discussion: Design Interpretations from the Model Outputs
4.1. District Scale Design Interpretation
4.2. Block Scale Design Interpretation
5. Conclusions
- When developing future suburbs, policymakers, developers, and planners must move away from the last century’s car-centric models. Mobility in and around metro areas is much more diverse than the outdated transportation and policy model of planning solely for suburb to downtown core trunkline commuting patterns. People and jobs have spread out well beyond the historic cores of cities. Cities and towns should adopt a more dynamic transportation system for polycentric suburb-to-suburb linkages that prioritize accessibility and integrate a range of new mobility technologies and services.
- Leveraging emerging mobility solutions and innovating zoning codes to allow for new mobility patterns will give policymakers, developers, and planners the opportunity to reimagine the current car-based mixed-use development paradigm, which forces an extraordinary number of extra household trips.
- In shaping future suburbs integrated with new mobility systems, policymakers, developers, and planners should consider employing a landscape performance-oriented method of design optimization over the traditional pavement-come-first method, which can offer novel opportunities to devise more comprehensive and sustainable development strategies.
- In formulating policies and plans for future suburbs, policymakers, developers, and planners ought to consider integrating a parametric design framework, like NOGAS. This not only enhances the process’s efficiency and precision by accelerating iterations and delivering data-driven outcomes but also maximizes future prospects by offering a large testbed of innovative solutions in a relatively short period of iteration.
Author Contributions
Funding
Data Availability Statement
Conflicts of Interest
| 1 | The collaboration between P-REX lab, MIT and the City of McKinney, TX was funded by Toyota Mobility Foundation. |
| 2 | Rhino3D is a widely adopted professional 3D modeling platform developed by Robert McNeel & Associates, renowned in the planning and design industry. GH, serving as a plugin for Rhino3D, enables users to generate, analyze, and optimize design scenarios in a parametric manner. Additionally, GH provides a comprehensive coding environment, including Python and C++, allowing users to implement customized functions using programming languages. These capabilities grant Rhino3D and GH the necessary flexibility and usability to serve as the foundation for developing a new parametric design framework. |
| 3 | During optimization process, NSGA-II employs the crossover and mutation operation to generate new scenarios from old scenarios. These two operations mimic the process of natural evolution. The crossover operation is switching several parameters of two old scenarios to generate new scenarios. The mutation is randomly changing several parameters of an old scenario create new scenarios. Several open-source NSGA-II plugins are available on the market. The Wallacei evolutionary simulation engine was selected for this research. |
| 4 | The values shown in the plot are fitness values. Fitness value is an intermediate value used by algorithm to judge which scenario have better performance in terms of given objective. The smaller fitness value, the better performance of given scenario. |
References
- Ewing, R. Is Los Angeles-style sprawl desirable? J. Am. Plan. Assoc. 1997, 63, 107–126. [Google Scholar] [CrossRef]
- Squires, G.D. Urban sprawl and the uneven development of metropolitan America. Urban Spraw. Causes Conseq. Policy Responses 2002, 1–22. [Google Scholar]
- Pařil, V.; Ondrůšková, B.; Krajíčková, A.; Petra, Z. The cost of suburbanization: Spending on environmental protection. Eur. Plan. Stud. 2022, 30, 2002–2021. [Google Scholar] [CrossRef]
- Jones, C.; Kammen, D.M. Spatial distribution of US household carbon footprints reveals suburbanization undermines greenhouse gas benefits of urban population density. Environ. Sci. Technol. 2014, 48, 895–902. [Google Scholar] [CrossRef] [PubMed]
- Brody, S. The characteristics, causes, and consequences of sprawling development patterns in the United States. Nat. Educ. Knowl. 2013, 4, 2. [Google Scholar]
- Kahn, M.E. The environmental impact of suburbanization. J. Policy Anal. Manag. 2000, 19, 569–586. [Google Scholar] [CrossRef]
- Kowarik, I. Novel urban ecosystems, biodiversity, and conservation. Environ. Pollut. 2011, 159, 1974–1983. [Google Scholar] [CrossRef] [PubMed]
- Hinners, S.J.; Kearns, C.A.; Wessman, C.A. Roles of scale, matrix, and native habitat in supporting a diverse suburban pollinator assemblage. Ecol. Appl. 2012, 22, 1923–1935. [Google Scholar] [CrossRef]
- Catterall, C.P.; Cousin, J.A.; Piper, S.; Johnson, G. Long-term dynamics of bird diversity in forest and suburb: Decay, turnover or homogenization? Divers. Distrib. 2010, 16, 559–570. [Google Scholar] [CrossRef]
- Blair, R.B.; Launer, A.E. Butterfly diversity and human land use: Species assemblages along an urban grandient. Biol. Conserv. 1997, 80, 113–125. [Google Scholar] [CrossRef]
- Law, N.; Band, L.; Grove, M. Nitrogen input from residential lawn care practices in suburban watersheds in Baltimore County, MD. J. Environ. Plan. Manag. 2004, 47, 737–755. [Google Scholar] [CrossRef]
- Currie, W.S.; Kiger, S.; Nassauer, J.I.; Hutchins, M.; Marshall, L.L.; Brown, D.G.; Riolo, R.L.; Robinson, D.T.; Hart, S.K. Multi-scale heterogeneity in vegetation and soil carbon in exurban residential land of southeastern Michigan, USA. Ecol. Appl. 2016, 26, 1421–1436. [Google Scholar] [CrossRef] [PubMed]
- Nassauer, J.I. Greening Sprawl—Lawn Culture and Carbon Storage in the Suburban Landscape. In Infinite Suburbia; Berger, A., Kotkin, J., Guzman, C., Eds.; Princeton Architectural Press: Hudson, NY, USA, 2017; pp. 506–517. [Google Scholar]
- Hagan, S. Metabolic Suburbs, or the Virtue of Low Densities. In Infinite Suburbia; Berger, A., Kotkin, J., Guzman, C., Eds.; Princeton Architectural Press: Hudson, NY, USA, 2017; pp. 468–478. [Google Scholar]
- Jittrapirom, P.; Caiati, V.; Feneri, A.M.; Ebrahimigharehbaghi, S.; Alonso-González, M.J.; Narayan, J. Mobility as a service: A critical review of definitions, assessments of schemes, and key challenges. Urban Plan. 2017, 2, 13–25. [Google Scholar] [CrossRef]
- Ghanipoor, M.S.; Ahmadi, A.; Musial, W.; Katthe, A.; Melendez, B.; Jahangiri, A. Implications of a Narrow Automated Vehicle-Exclusive Lane on Interstate 15 Express Lanes. J. Adv. Transp. 2021, 2021, 6617205. [Google Scholar] [CrossRef]
- Nourinejad, M.; Bahrami, S.; Roorda, M.J. Designing parking facilities for autonomous vehicles. Transp. Res. Part B Methodol. 2018, 109, 110–127. [Google Scholar] [CrossRef]
- Marsden, G.; Docherty, I.; Dowling, R. Parking futures: Curbside management in the era of ‘new mobility’ services in British and Australian cities. Land Use Policy 2020, 91, 104012. [Google Scholar] [CrossRef]
- Hensher, D.A.; Ho, C.Q.; Reck, D.J. Mobility as a service and private car use: Evidence from the Sydney MaaS trial. Transp. Res. Part A Policy Pract. 2021, 145, 17–33. [Google Scholar] [CrossRef]
- American Planning Association. Standard State Zoning Enabling Act and Standard City Planning Enabling Act. Available online: https://www.planning.org/growingsmart/enablingacts.htm (accessed on 7 June 2023).
- Village of Euclid v. Ambler Realty Co.; 272 U.S. 365, 1926. Available online: https://www.oyez.org/cases/1900-1940/272us365 (accessed on 7 June 2023).
- Hall, E. Divide and sprawl, decline and fall: A comparative critique of Euclidean zoning. Univ. Pittsburgh Law Rev. 2006, 68, 915. [Google Scholar] [CrossRef]
- Checkoway, B.N. Suburbanization and Community: Growth and Planning in Postwar Lower Bucks County, Pennsylvania; University of Pennsylvania: Philadelphia, PA, USA, 1977. [Google Scholar]
- Nilles, J.M. Telecommuting and urban sprawl: Mitigator or inciter? Transportation 1991, 18, 411–432. [Google Scholar] [CrossRef]
- Moeckel, R. Working from home: Modeling the impact of telework on transportation and land use. Transp. Res. Procedia 2017, 26, 207–214. [Google Scholar] [CrossRef]
- U.S. Department of Transportation, Federal Highway Administration, State Motor-Vehicle Registrations. 1900–1995, 2000. 2020. Available online: https://www.fhwa.dot.gov/ohim/summary95/mv201.pdf (accessed on 7 June 2023).
- 70 Stat. 374—Federal-Aid Highway Act of 1956. Available online: https://www.govinfo.gov/content/pkg/STATUTE-70/pdf/STATUTE-70-Pg374.pdf (accessed on 7 June 2023).
- Jackson, K.T. Crabgrass Frontier: The Suburbanization of the United States; Oxford University Press: Oxford, UK, 1987. [Google Scholar]
- Gottmann, J. The Urbanized Northeastern Seaboard of the United States; México, DF; The Twentieth Century Fund: New York, NY, USA, 1961. [Google Scholar]
- Hall, P.G.; Pain, K. (Eds.) The Polycentric Metropolis: Learning from Mega-City Regions in Europe; Routledge: Oxfordshire, UK, 2006. [Google Scholar]
- Laberteaux, K.; Brown, C.; Berger, A. Interburbia: Ground Truthing US Metropolitan Urbanization. In Infinite Suburbia; Berger, A., Kotkin, J., Guzman, B.C., Eds.; Princeton Architectural Press: New York, NY, USA, 2017; pp. 232–251. [Google Scholar]
- English, J. Why Did America Give Up on Mass Transit. (Don’t Blame Cars). Streetcar, Bus, and Metro Systems Have Been Ignoring One Lesson for 100 Years: Service Drives Demand. Bloomberg, Citylab. 2018. Available online: https://www.bloomberg.com/news/features/2018-08-31/why-is-american-mass-transit-so-bad-it-s-a-long-story (accessed on 7 June 2023).
- Tomer, A.; Kane, J.; Vey, J. Connecting People and Places: Exploring New Measures of Travel Behavior; Brookings Institution: Washington, DC, USA, 2020. [Google Scholar]
- Pushkarev, B.S.; Zupan, J.M. Where transit works: Urban densities for public transportation. Urban Transp. Perspect. Prospect. 1982, 341–344. [Google Scholar]
- Spieler, C. Trains, Buses, People; Island Press: Washington, DC, USA, 2021. [Google Scholar]
- Federal Highway Administration. National Household Travel Survey; U.S. Department of Transportation: Washington, DC, USA, 2017.
- Burrows, M.; Burd, C.; McKenzie, B. Commuting by Public Transportation in the United States: 2019. Am. Community Surv. Rep. 2021, 802. [Google Scholar]
- Wilson, J.; Spinney, J.; Millward, H.; Scott, D.; Hayden, A.; Tyedmers, P. Blame the exurbs, not the suburbs: Exploring the distribution of greenhouse gas emissions within a city region. Energy Policy 2013, 62, 1329–1335. [Google Scholar] [CrossRef]
- U.S. Environmental Protection Agency. Fast Facts on Transportation Greenhouse Gas Emissions. 2021. Available online: https://www.epa.gov/greenvehicles/fast-facts-transportation-greenhouse-gas-emissions (accessed on 7 June 2023).
- United Nations (UN) Population Division. World Urbanization Prospects: The 2018 Revision; United Nations (UN) Population Division: New York, NY, USA, 2018.
- Rees, W.E. Ecological footprints and appropriated carrying capacity: What urban economics leaves out. Environ. Urban. 1992, 4, 121–130. [Google Scholar] [CrossRef]
- Berger, A.; Kotkin, J. (Eds.) Infinite Suburbia; Chronicle Books: San Francisco, CA, USA, 2018. [Google Scholar]
- Clapson, M.; Hutchison, R. Suburbanization in Global Society; Emerald: Bingley, UK, 2010. [Google Scholar]
- Cox, W. All Major Metropolitan Area Growth Outside Urban Core: Latest Year. Newgeography.com. 2022. Available online: https://www.newgeography.com/content/007430-all-major-metropolitan-area-growth-outside-urban-core-latest-year (accessed on 7 June 2023).
- U.S. Census Bureau, Department of Housing and Urban Development (HUD). American Housing Survey (AHS); 2017. Available online: https://www.census.gov/programs-surveys/ahs.html (accessed on 7 June 2023).
- Polzin, S.E.; Pisarski, A.E. Commuting in America 2013: The National Report on Commuting Patterns and Trends; American Association of State Highway and Transportation Officials: Washington, DC, USA, 2015. [Google Scholar]
- Chandler, J. Proposal to Add Density near Transit Stations Quickly Rejected in California Senate. Curbed Los Angeles. 2018. Available online: https://la.curbed.com/2018/4/17/17249654/california-senate-bill-827-housing-transit-vote (accessed on 7 June 2023).
- Symon, E. Senator Wiener Introduces ‘SB 50 Lite’ Housing Bill to End Single-Family Zoning in CA. California Globe. 2020. Available online: https://californiaglobe.com/articles/senator-wiener-introduces-sb-50-lite-housing-bill/ (accessed on 7 June 2023).
- Ewing, R.; Hamidi, S.; Tian, G.; Proffitt, D.; Tonin, S.; Fregolent, L. Testing Newman and Kenworthy’s theory of density and automobile dependence. J. Plan. Educ. Res. 2018, 38, 167–182. [Google Scholar] [CrossRef]
- Transportation Research Board and National Research Council. Driving and the Built Environment: The Effects of Compact Development on Motorized Travel, Energy Use, and CO2 Emissions; National Academies Press: Washington, DC, USA, 2009.
- Hubbard, P. NIMBY. In International Encyclopedia of Human Geography; Kitchin, R., Thrift, N., Eds.; Elsevier: Amsterdam, The Netherlands, 2019; pp. 444–449. [Google Scholar]
- National Association of Realtors. Home Buyers and Sellers Generational Trends. 2023. Available online: https://cdn.nar.realtor//sites/default/files/documents/2023-home-buyers-and-sellers-generational-trends-report-03-28-2023.pdf?_gl=1*c25d7v*_gcl_au*MTM4NDMzMDc5MC4xNjkyNzEzMDk1 (accessed on 22 August 2023).
- Economics, National Association of Home Builders. What Home Buyers Really Want; Economics, National Association of Home Builders: Washington, DC, USA, 2019.
- Shamshiripour, A.; Rahimi, E.; Shabanpour, R.; Mohammadian, A.K. How is COVID-19 reshaping activity-travel behavior? Evidence from a comprehensive survey in Chicago. Transp. Res. Interdiscip. Perspect. 2020, 7, 100216. [Google Scholar] [CrossRef] [PubMed]
- Helms, A.C. Understanding gentrification: An empirical analysis of the determinants of urban housing renovation. J. Urban Econ. 2003, 54, 474–498. [Google Scholar] [CrossRef]
- Davis, J. The Double-Edged Sword of Upzoning; Brookings Institution: Washington, DC, USA, 2021; Available online: https://www.brookings.edu/blog/how-we-rise/2021/07/15/the-double-edged-sword-of-upzoning/ (accessed on 7 June 2023).
- Infranca, J. Differentiating Exclusionary Tendencies. Fla. Law Rev. 2020, 72, 1271. [Google Scholar]
- Fulton, L.; Mason, J.; Meroux, D. Three revolutions in urban transportation: How to achieve the full potential of vehicle electrification, automation, and shared mobility in urban transportation systems around the world by 2050. In Three Revolutions in Urban; Fulton, L., Mason, J., Meroux, I.D., Eds.; UC Davis Institute for Transportation & Development Policy: Davis, CA, USA, 2017. [Google Scholar]
- Holland-Letz, D.; Kässer, M.; Kloss, B.; Müller, T. Mobility’s Future: An Investment Reality Check. McKinsey Insights. 2021. Available online: https://www.mckinsey.com/industries/automotive-and-assembly/our-insights/mobilitys-future-an-investment-reality-check (accessed on 7 June 2023).
- Nunno, R. Autonomous Vehicles: State of The Technology and Potential Role as A Climate Solution. Environmental and Energy Study Institute. 2021. Available online: https://www.eesi.org/files/IssueBrief_Autonomous_Vehicles_2021.pdf (accessed on 7 June 2023).
- Stephens, T.S.; Gonder, J.; Chen, Y.; Lin, Z.; Liu, C.; Gohlke, D. Estimated Bounds and Important Factors for Fuel Use and Consumer Costs of Connected and Automated Vehicles; National Renewable Energy Lab. (NREL): Golden, CO, USA, 2016. [Google Scholar]
- Hayes, B. Leave the driving to it. Am. Sci. 2011, 99, 362. [Google Scholar] [CrossRef]
- Faisal, A.; Kamruzzaman, M.; Yigitcanlar, T.; Currie, G. Understanding autonomous vehicles: A systematic literature review on capability, impact planning and policy. J. Transp. Land Use 2019, 12, 45–72. [Google Scholar] [CrossRef]
- Liu, F.; Zhao, F.; Liu, Z.; Hao, H. Can autonomous vehicle reduce greenhouse gas emissions? A country-level evaluation. Energy Policy 2019, 132, 462–473. [Google Scholar] [CrossRef]
- Zhang, W.; Wang, K. Parking futures: Shared automated vehicles and parking demand reduction trajectories in Atlanta. Land Use Policy 2020, 91, 103963. [Google Scholar] [CrossRef]
- Litman, T. Autonomous Vehicle Implementation Predictions: Implications for Transport Planning; Victoria Transport Policy Institute: Victoria, BC, Canada, 2020. [Google Scholar]
- Sparrow, R.; Howard, M. When human beings are like drunk robots: Driverless vehicles, ethics, and the future of transport. Transp. Res. Part C Emerg. Technol. 2017, 80, 206–215. [Google Scholar] [CrossRef]
- Fagnant, D.J.; Kockelman, K. Preparing a nation for autonomous vehicles: Opportunities, barriers and policy recommendations. Transp. Res. Part A Policy Pract. 2015, 77, 167–181. [Google Scholar] [CrossRef]
- Noy, K.; Givoni, M. Is ‘smart mobility’sustainable? Examining the views and beliefs of transport’s technological entrepreneurs. Sustainability 2018, 10, 422. [Google Scholar] [CrossRef]
- Berger, A.; Susskind, J.; Giampieri, M.; Zhu, C. Next Optimized Generation of Autonomous Suburbs. Available online: https://nogas.mit.edu/ (accessed on 7 June 2023).
- The City of McKinney. One McKinney 2040 Comprehensive Plan. 2018. Available online: https://www.mckinneytexas.org/292/2040-Comprehensive-Plan (accessed on 7 June 2023).
- The City of McKinney. Population History—McKinney, Texas. Available online: https://www.mckinneytexas.org/DocumentCenter/View/27908/Population-History---by-Decade?bidId= (accessed on 7 June 2023).
- Massar, M.; Reza, I.; Rahman, S.M.; Abdullah, S.M.; Jamal, A.; Al-Ismail, F.S. Impacts of autonomous vehicles on greenhouse gas emissions—Positive or negative? Int. J. Environ. Res. Public Health 2021, 18, 5567. [Google Scholar] [CrossRef] [PubMed]
- Soteropoulos, A.; Berger, M.; Ciari, F. Impacts of automated vehicles on travel behaviour and land use: An international review of modelling studies. Transp. Rev. 2019, 39, 29–49. [Google Scholar] [CrossRef]
- Porta, J.; Parapar, J.; Doallo, R.; Rivera, F.F.; Santé, I.; Crecente, R. High performance genetic algorithm for land use planning. Comput. Environ. Urban Syst. 2013, 37, 45–58. [Google Scholar] [CrossRef]
- Lima, F.; Brown, N.; Duarte, J. Urban design optimization: Generative approaches towards urban fabrics with improved transit accessibility and walkability: Generative approaches towards urban fabrics with improved transit accessibility and walkability. In Proceedings of the 26th International Conference of the Association for Computer-Aided Architectural Design Research in Asia: Projections, CAADRIA 2021, Hong Kong, China, 29 March–1 April 2021; pp. 719–728. [Google Scholar]
- Aerts, J.; Van Herwijnen, M.; Janssen, R.; Stewart, T. Evaluating spatial design techniques for solving land-use allocation problems. J. Environ. Plan. Manag. 2005, 48, 121–142. [Google Scholar] [CrossRef]
- Axhausen, K.W.; Horni, A.; Nagel, K. The Multi-Agent Transport Simulation MATSim; Ubiquity Press: London, UK, 2016. [Google Scholar]
- Monedero, J. Parametric design: A review and some experiences. Autom. Constr. 2000, 9, 369–377. [Google Scholar] [CrossRef]
- Touloupaki, E.; Theodosiou, T. Performance simulation integrated in parametric 3D modeling as a method for early stage design optimization—A review. Energies 2017, 10, 637. [Google Scholar] [CrossRef]
- Shi, Z.; Fonseca, J.A.; Schlueter, A. A review of simulation-based urban form generation and optimization for energy-driven urban design. Build. Environ. 2017, 121, 119–129. [Google Scholar] [CrossRef]
- Berawi, M.A.; Saroji, G.; Iskandar, F.A.; Ibrahim, B.E.; Miraj, P.; Sari, M. Optimizing land use allocation of Transit-Oriented Development (TOD) to generate maximum ridership. Sustainability 2020, 12, 3798. [Google Scholar] [CrossRef]
- Cao, K.; Huang, B.; Wang, S.; Lin, H. Sustainable land use optimization using Boundary-based Fast Genetic Algorithm. Comput. Environ. Urban Syst. 2012, 36, 257–269. [Google Scholar] [CrossRef]
- Caparros-Midwood, D.; Barr, S.; Dawson, R. Optimised spatial planning to meet long term urban sustainability objectives. Comput. Environ. Urban Syst. 2015, 54, 154–164. [Google Scholar] [CrossRef]
- Eikelboom, T.; Janssen, R.; Stewart, T.J. A spatial optimization algorithm for geodesign. Landsc. Urban Plan. 2015, 144, 10–21. [Google Scholar] [CrossRef]
- Haque, A.; Asami, Y. Optimizing urban land-use allocation: Case study of Dhanmondi Residential Area, Dhaka, Bangladesh. Environ. Plan. B Plan. Des. 2011, 38, 388–410. [Google Scholar] [CrossRef]
- Janssen, R.; Van, H.M.; Stewart, T.J.; Aerts, J.C. Multiobjective decision support for land-use planning. Environ. Plan. B Plan. Des. 2008, 35, 740–756. [Google Scholar] [CrossRef]
- Koenig, R.; Miao, Y.; Aichinger, A.; Knecht, K.; Konieva, K. Integrating urban analysis, generative design, and evolutionary optimization for solving urban design problems. Environ. Plan. B Urban Anal. City Sci. 2020, 47, 997–1013. [Google Scholar] [CrossRef]
- Li, X.; Parrott, L. An improved Genetic Algorithm for spatial optimization of multi-objective and multi-site land use allocation. Comput. Environ. Urban Syst. 2016, 59, 184–194. [Google Scholar] [CrossRef]
- Liu, X.; Li, X.; Shi, X.; Huang, K.; Liu, Y. A multi-type ant colony optimization (MACO) method for optimal land use allocation in large areas. Int. J. Geogr. Inf. Sci. 2012, 26, 1325–1343. [Google Scholar] [CrossRef]
- Liu, X.; Ou, J.; Li, X.; Ai, B. Combining system dynamics and hybrid particle swarm optimization for land use allocation. Ecol. Model. 2013, 257, 11–24. [Google Scholar] [CrossRef]
- Liu, Y.; Tang, W.; He, J.; Liu, Y.; Ai, T.; Liu, D. A land-use spatial optimization model based on genetic optimization and game theory. Comput. Environ. Urban Syst. 2015, 49, 1–14. [Google Scholar] [CrossRef]
- Makki, M.; Showkatbakhsh, M.; Tabony, A.; Weinstock, M. Evolutionary algorithms for generating urban morphology: Variations and multiple objectives. Int. J. Archit. Comput. 2019, 17, 5–35. [Google Scholar] [CrossRef]
- Mi, N.; Hou, J.; Mi, W.; Song, N. Optimal spatial land-use allocation for limited development ecological zones based on the geographic information system and a genetic ant colony algorithm. Int. J. Geogr. Inf. Sci. 2015, 29, 2174–2193. [Google Scholar] [CrossRef]
- Mohammadi, M.; Nastaran, M.; Sahebgharani, A. Development, application, and comparison of hybrid meta-heuristics for urban land-use allocation optimization: Tabu search, genetic, GRASP, and simulated annealing algorithms. Comput. Environ. Urban Syst. 2016, 60, 23–36. [Google Scholar] [CrossRef]
- Santé-Riveira, I.; Boullón-Magán, M.; Crecente-Maseda, R.; Miranda-Barrós, D. Algorithm based on simulated annealing for land-use allocation. Comput. Geosci. 2008, 34, 259–268. [Google Scholar] [CrossRef]
- Sharmin, N.; Haque, A.; Islam, M.M. Generating Alternative Land-use Allocation for Mixed Use Areas: Multi-Objective Optimization Approach. Geogr. Anal. 2019, 51, 448–474. [Google Scholar] [CrossRef]
- Stewart, T.J.; Janssen, R.; Van Herwijnen, M. A genetic algorithm approach to multiobjective land use planning. Comput. Oper. Res. 2004, 31, 2293–2313. [Google Scholar] [CrossRef]
- Zhang, H.; Zeng, Y.; Jin, X.; Shu, B.; Zhou, Y.; Yang, X. Simulating multi-objective land use optimization allocation using Multi-agent system—A case study in Changsha, China. Ecol. Model. 2016, 320, 334–347. [Google Scholar] [CrossRef]
- Westerink, J.; Haase, D.; Bauer, A.; Ravetz, J.; Jarrige, F.; Aalbers, C.B. Dealing with sustainability trade-offs of the compact city in peri-urban planning across European city regions. Eur. Plan. Stud. 2013, 21, 473–497. [Google Scholar] [CrossRef]
- Zhang, J.; Li, S.; Lin, N.; Lin, Y.; Yuan, S.; Zhang, L.; Zhu, J.; Wang, K.; Gan, M.; Zhu, C. Spatial identification and trade-off analysis of land use functions improve spatial zoning management in rapid urbanized areas, China. Land Use Policy 2022, 116, 106058. [Google Scholar] [CrossRef]
- Bradner, E.; Iorio, F.; Davis, M. Parameters tell the design story: Ideation and abstraction in design optimization. In Proceedings of the Symposium on Simulation for Architecture & Urban Design, Tampa, FL, USA, 13–16 April 2014; Volume 26. [Google Scholar]
- Bertsimas, D.; Tsitsiklis, J.N. Introduction to Linear Optimization; Athena Scientific: Belmont, MA, USA, 1997. [Google Scholar]
- Van Laarhoven, P.J.M.; Aarts, E.H. Simulated Annealing; Springer: Dordrecht, The Netherlands, 1987. [Google Scholar]
- Kennedy, J.; Eberhart, R. Particle swarm optimization. In Proceedings of the ICNN’95—International Conference on Neural Networks, Perth, Australia, 27 November–1 December 1995; Volume 4, pp. 1942–1948. [Google Scholar]
- Deb, K.; Pratap, A.; Agarwal, S.; Meyarivan, T.A. A fast and elitist multiobjective genetic algorithm: NSGA-II. IEEE Trans. Evol. Comput. 2002, 6, 182–197. [Google Scholar] [CrossRef]
- Li, H.; Zhang, Q. Multi-objective optimization problems with complicated pareto sets MOEA/D and NSGA-II. IEEE Trans. Evol. Comput. 2009, 13, 284–286. [Google Scholar] [CrossRef]
- Chow, C.K.; Yuen, S.Y. A multiobjective evolutionary algorithm that diversifies population by its density. IEEE Trans. Evol. Comput. 2011, 16, 149–172. [Google Scholar] [CrossRef]
- Cao, K.; Batty, M.; Huang, B.; Liu, Y.; Yu, L.; Chen, J. Spatial multi-objective land use optimization: Extensions to the non-dominated sorting genetic algorithm-II. Int. J. Geogr. Inf. Sci. 2011, 25, 1949–1969. [Google Scholar] [CrossRef]
- Sharifi, A. From Garden City to Eco-urbanism: The quest for sustainable neighborhood development. Sustain. Cities Soc. 2016, 20, 1–6. [Google Scholar] [CrossRef]
- Federal Register “Part III, Department of Health and Human Services, Centers for Medicare & Medicaid Services, 42 CFR Parts 403 and 408 Medicare Program; Medicare Prescription Drug Discount Card; Interim Rule and Notice”. 15 December 2003. Available online: https://www.cms.gov/Regulations-and-Guidance/Regulations-and-Policies/QuarterlyProviderUpdates/downloads/cms4063ifc.pdf (accessed on 28 June 2023).
- Millard-Ball, A. The autonomous vehicle parking problem. Transp. Policy 2019, 75, 99–108. [Google Scholar] [CrossRef]
- Duarte, F.; Ratti, C. The impact of autonomous vehicles on cities: A review. J. Urban Technol. 2018, 25, 3–18. [Google Scholar] [CrossRef]
- Gordon, T.J. Cross-Impact Method; American Council for the United Nations University: Washington, DC, USA, 1994. [Google Scholar]
- Amer, M.; Daim, T.U.; Jetter, A. A review of scenario planning. Futures 2013, 46, 23–40. [Google Scholar] [CrossRef]
- Gordon, T.J. The delphi method. Futures Res. Methodol. 1994, 2, 1–30. [Google Scholar]
- Lee, A.C.; Maheswaran, R. The health benefits of urban green spaces: A review of the evidence. J. Public Health 2011, 33, 212–222. [Google Scholar] [CrossRef] [PubMed]
- Gunawardena, K.R.; Wells, M.J.; Kershaw, T. Utilising green and bluespace to mitigate urban heat island intensity. Sci. Total Environ. 2017, 584, 1040–1055. [Google Scholar] [CrossRef] [PubMed]
- Prudencio, L.; Null, S.E. Stormwater management and ecosystem services: A review. Environ. Res. Lett. 2018, 1, 033002. [Google Scholar] [CrossRef]
- Aronson, M.F.; Lepczyk, C.A.; Evans, K.L.; Goddard, M.A.; Lerman, S.B.; MacIvor, J.S.; Nilon, C.H.; Vargo, T. Biodiversity in the city: Key challenges for urban green space management. Front. Ecol. Environ. 2017, 15, 189–196. [Google Scholar] [CrossRef]
- Niemelä, J.; Saarela, S.R.; Söderman, T.; Kopperoinen, L.; Yli-Pelkonen, V.; Väre, S.; Kotze, D.J. Using the ecosystem services approach for better planning and conservation of urban green spaces: A Finland case study. Biodivers. Conserv. 2010, 19, 3225–3243. [Google Scholar] [CrossRef]
- Haq, S.M. Urban green spaces and an integrative approach to sustainable environment. J. Environ. Prot. 2011, 2, 601–608. [Google Scholar] [CrossRef]
- Koohsari, M.J.; Mavoa, S.; Villanueva, K.; Sugiyama, T.; Badland, H.; Kaczynski, A.T.; Owen, N.; Giles-Corti, B. Public open space, physical activity, urban design and public health: Concepts, methods and research agenda. Health Place 2015, 33, 75–82. [Google Scholar] [CrossRef]
- Madanipour, A. (Ed.) Whose Public Space?: International Case Studies in Urban Design and Development; Routledge: Oxfordshire, UK, 2013. [Google Scholar]
- McCormack, G.R.; Rock, M.; Toohey, A.M.; Hignell, D. Characteristics of urban parks associated with park use and physical activity: A review of qualitative research. Health Place 2010, 16, 712–726. [Google Scholar] [CrossRef]
- Pickett, S.T.; Cadenasso, M.; Grove, J.; Nilon, C.; Pouyat, R.; Zipperer, W.; Costanza, R. Urban ecological systems: Linking terrestrial ecological, physical, and socio-economic components of metropolitan areas. Annu. Rev. Ecol. Syst. 2001, 32, 127–157. [Google Scholar] [CrossRef]
- Wu, X.; Murray, A.T.; Xiao, N. A multiobjective evolutionary algorithm for optimizing spatial contiguity in reserve network design. Landsc. Ecol. 2011, 26, 425–437. [Google Scholar] [CrossRef]
- Wright, J.; Revelle, C.; Cohon, J. A multi-objective integer programming model for the land acquisition problem. Reg. Sci. Urban Econ. 1983, 13, 31–53. [Google Scholar] [CrossRef]
- Nalle, D.J.; Athur, J.L.; Sessions, J. Designing compact and contiguous reserve networks with a hybrid heuristic algorithm. For. Sci. 2002, 48, 59–68. [Google Scholar]
- U.S. Environmental Protection Agency. EnviroAtlas Terms and Definitions. Available online: https://enviroatlas.epa.gov/enviroatlas/glossary/glossary.html#impervious (accessed on 7 June 2023).
- Arnold, C.L.; Gibbons, C.J. Impervious surface coverage. J. Am. Plan. Assoc. 1996, 62, 243–258. [Google Scholar] [CrossRef]
- Klein, R.D. Urbanization and stream water quality impairment. Water Resour. Bull. 1979, 15, 948–963. [Google Scholar] [CrossRef]
- Galli, J. Thermal Impacts Associated with Urbanization and Stormwater Management Best Management Practices: Metropolitan Washington Council of Governments; Maryland Department of the Environment: Washington, DC, USA, 1991; p. 188. [Google Scholar]
- Schueler, T.R. The importance of imperviousness. Watershed Prot. Tech. 1994, 1, 100–111. [Google Scholar]
- Tilley, J.S.; Slonecker, E.T. Quantifying the Components of Impervious Surfaces; Federal Highway Administration (US): Washington, DC, USA, 2007. [Google Scholar]
- Agriesti, S.; Brevi, F.; Gandini, P.; Marchionni, G.; Parmar, R.; Ponti, M.; Studer, L. Impact of driverless vehicles on urban environment and future mobility. Transp. Res. Procedia 2020, 49, 44–59. [Google Scholar] [CrossRef]
- Kittelson & Assoc, Inc.; Parsons Brinckerhoff, Inc.; KFH Group, Inc.; Texam A&M Transportation Institute, & Arup. Transit Capacity and Quality of Service Manual, 3rd ed.; Transit Cooperative Highway Research Program (TCRP) Report 165; Transportation Research Board: Washington, DC, USA, 2013. [Google Scholar]
- Zacharias, J. Pedestrian Behavior and Perception in Urban Walking Environments. J. Plan. Lit. 2001, 16, 3–18. [Google Scholar] [CrossRef]
- Handy, S.; Niemeier, A.D. Measuring Accessibility: An exploration of issues and alternatives. Environ. Plan. A 1997, 29, 1175–1194. [Google Scholar] [CrossRef]
- Robbins, P.; Polderman, A.; Birkenholtz, T. Lawns and toxins: An ecology of the city. Cities 2001, 18, 369–380. [Google Scholar] [CrossRef]
- Banks, J.; McConnell, R. National Emissions from Lawn and Garden Equipment. US Environmental Protection Agency (U.S. EPA). 2015. Available online: https://www.epa.gov/sites/default/files/2015-09/documents/banks.pdf (accessed on 7 June 2023).
- Lee, O.; Guhathakurta, S. An analysis of the effects of suburban densification on vehicle use for shopping: Do existing residents respond to land-use changes in the same way as recent movers? J. Transp. Geogr. 2018, 68, 193–204. [Google Scholar] [CrossRef]
- Saelens, B.E.; Handy, S.L. Built environment correlates of walking: A review. Med. Sci. Sport. Exerc. 2008, 40, S550–S566. [Google Scholar] [CrossRef] [PubMed]
- Yang, H.; Liang, Y.; Yang, L. Equitable? Exploring ridesourcing waiting time and its determinants. Transp. Res. Part D Transp. Environ. 2021, 93, 102774. [Google Scholar] [CrossRef]
- Zhang, L.; Menendez, M. Modeling and evaluating the impact of city block size on traffic performance. J. Urban Plan. Dev. 2020, 146, 04020021. [Google Scholar] [CrossRef]
- Sevtsuk, A.; Kalvo, R.; Ekmekci, O. Pedestrian accessibility in grid layouts: The role of block, plot and street dimensions. Urban Morphol. 2016, 20, 89–106. [Google Scholar] [CrossRef]
- Arnold, J.E.; Graesch, A.P.; Ochs, E.; Ragazzini, E. Life at Home in the Twenty-First Century: 32 Families Open Their Doors; ISD LLC: Bristol, CT, USA, 2012. [Google Scholar]
- Kim, S.; Choo, S.; Choi, S.; Lee, H. What Factors Affect Commuters’ Utility of Choosing Mobility as a Service? An Empirical Evidence from Seoul. Sustainability 2021, 13, 9324. [Google Scholar] [CrossRef]
- U.S. Census Bureau. An Aging Nation: Projected Number of Children and Older Adults. 2018. Available online: https://www.census.gov/library/visualizations/2018/comm/historic-first.html (accessed on 7 June 2023).
- Harvard University, Joint Center for Housing Studies. Projections and Implications for Housing a Growing Population: Older Adults 2015–2035. 2016. Available online: http://www.jchs.harvard.edu/housing-a-growing-population-older-adults (accessed on 7 June 2023).
- Riggs, W.; Pande, A. Gaps and Opportunities in Accessibility Policy for Autonomous Vehicles; Project 2106; Mineta Transportation Institute: San Jose, CA, USA, 2021. [Google Scholar]
- Bayless, S.H.; Davidson, S. Driverless Cars and Accessibility: Designing the Future of Transportation for People with Disabilities; The Intelligent Transportation Society of America (ITS America): Washington, DC, USA, 2019. [Google Scholar]
- Graham, S.M.; Joshi, A.; Pizlo, Z. The traveling salesman problem: A hierarchical model. Mem. Cogn. 2000, 28, 1191–1204. [Google Scholar] [CrossRef] [PubMed]
- Sweda, T.M.; Klabjan, D. Finding minimum-cost paths for electric vehicles. In Proceedings of the 2012 IEEE International Electric Vehicle Conference, Greenville, SC, USA, 4–8 March 2012; pp. 1–4. [Google Scholar]
- Vijay, R.; Cherian, J.; Riah, R.; De, B.N.; Choudhury, A. Optimal placement of roadside infrastructure sensors towards safer autonomous vehicle deployments. In Proceedings of the 2021 IEEE International Intelligent Transportation Systems Conference (ITSC), Indianapolis, IN, USA, 19–22 September 2021; pp. 2589–2595. [Google Scholar]
- Habibovic, A.; Lundgren, V.M.; Andersson, J.; Klingegård, M.; Lagström, T.; Sirkka, A.; Fagerlönn, J.; Edgren, C.; Fredriksson, R.; Krupenia, S.; et al. Communicating intent of automated vehicles to pedestrians. Front. Psychol. 2018, 9, 1336. [Google Scholar] [CrossRef]


| Land Use Allocation Optimization Reference | Planning and Design Context | Planning and Design Scales | Main Optimization Algorithm | Planning and Design Objectives | Operation Environment | ||||||||||||
|---|---|---|---|---|---|---|---|---|---|---|---|---|---|---|---|---|---|
| Urban | Suburb | Rural | Regional | City | District | Block | Linear Optimization | Genetic Algorithm | Particle Swarm Optimization | Ant Colony Optimization | Simulated Annealing | Economic Performance | Environmental Performance | Mobility Access | GIS Platform and Coding | Rhinoceros/Grasshopper Based Platform | |
| Berawi et al. (2020) [82] | • | • | • | • | |||||||||||||
| Cao et al. (2012) [83] | • | • | • | • | • | • | • | ||||||||||
| Caparros-Midwood et al. (2015) [84] | • | • | • | • | • | • | |||||||||||
| Eikelboom et al. (2015) [85] | • | • | • | • | • | ||||||||||||
| Haque and Asami (2014) [86] | • | • | • | • | |||||||||||||
| Janssen et al. (2008) [87] | • | • | • | • | • | ||||||||||||
| Koenig et al. (2020) [88] | • | • | • | • | |||||||||||||
| Li and Parrott (2016) [89] | • | • | • | • | • | • | • | • | |||||||||
| Liu et al. (2012) [90] | • | • | • | • | • | • | • | ||||||||||
| Liu et al. (2013) [91] | • | • | • | • | • | • | • | ||||||||||
| Liu et al. (2015) [92] | • | • | • | • | • | • | • | • | |||||||||
| Makki et al. (2019) [93] | • | • | • | • | • | ||||||||||||
| Mi et al. (2015) [94] | • | • | • | • | • | • | • | • | |||||||||
| Mohammadi et al. (2016) [95] | • | • | • | • | • | • | • | ||||||||||
| Porta et al. (2013) [75] | • | • | • | • | • | • | • | ||||||||||
| Sante et al. (2016) [96] | • | • | • | • | • | • | • | ||||||||||
| Sharmin et al. (2019) [97] | • | • | • | • | • | ||||||||||||
| Stewart and Janssen (2014) [98] | • | • | • | • | • | ||||||||||||
| Zhang et al. (2016) [99] | • | • | • | • | • | • | • | • | |||||||||
| This research | • | • | • | • | • | • | • | ||||||||||
| District Scale | |
|---|---|
| Inputs -> Scenario Generation Module | |
| 1. Land use cell size | 4.5 acres |
| 2. Land use cell type | Suburban living; estate residential; Neighborhood commercial; landscape space |
| 3. Land use cell count of each land use type | Suburban living: 114; estate residential: 45; Neighborhood commercial: 9; landscape space: 28 |
| 4. Site boundary | A spatial data input from Rhino3D |
| Inputs -> Scenario Analysis Module | |
| 1. Land use matrix | See Figure 10 for detailed information |
| Block scale | |
| Inputs -> Scenario Generation Module | |
| 1. Block size | 4.5 acres |
| 2. Building density | 4 units per acre |
| 3. Lot area | 5400 ft2 |
| 4. Building footprint (without garage) | 1400 ft2 |
| 5. Number of multi-modal mobility hub | 1 |
| Inputs -> Scenario Analysis Module | |
| 1 min walking distance | 150 ft |
| Optimization Size | District Scale|Block Scale | Algorithm Settings | District Scale|Block Scale |
|---|---|---|---|
| Generation size | 50|50 | Mutation rate | 1/n|1/n |
| Generation count | 100|100 | Crossover probability | 0.9|0.9 |
| Population size | 5000|5000 | Mutation distribution index | 20|20 |
| Number of variables | 784|10,002 | Crossover distribution index | 20|20 |
| Size of search space | 1 × 10118|2.5 × 10⁷ | Simulation runtime | 4 h 36 min|18 min |
| Optimization Factors | Existing Scenario | Optimized Scenario (Ranking out of 5000) | ΔVariation | |
|---|---|---|---|---|
| Land Use Distribution (fdist) | −1820 | −388 (1) | +1432 | |
| Landscape Space Allocation | Access (faccess) | 10,618 ft | 42,472 ft (1102) | +300% |
| Contiguity (fcontiguity) | 27 | 8 (4117) | −70% | |
| Optimization Factors | Baseline Solution | Optimized Solution (Ranking out of 5000) | Δ Variation | |
|---|---|---|---|---|
| Ratio of impervious surface (fimpervious) | 23% | 12% (3173) | −11% | |
| Landscape Space Contiguity | Area of the largest single landscape space inside the block (fconti) | 1755 | 92,673 ft2 (1698) | +5180% |
| Multi-modal Mobility Hub Access | Average distance between each household and multi-modal mobility hub (favgdistance) | N/A | 160 ft (533) | N/A |
| Ratio of households within a 150 ft distance to the multi-modal mobility hub (fhouseholdaccess) | N/A | 65% (2087) | N/A | |
| Existing Scenario | Optimized Scenario | ΔVariation | ||
|---|---|---|---|---|
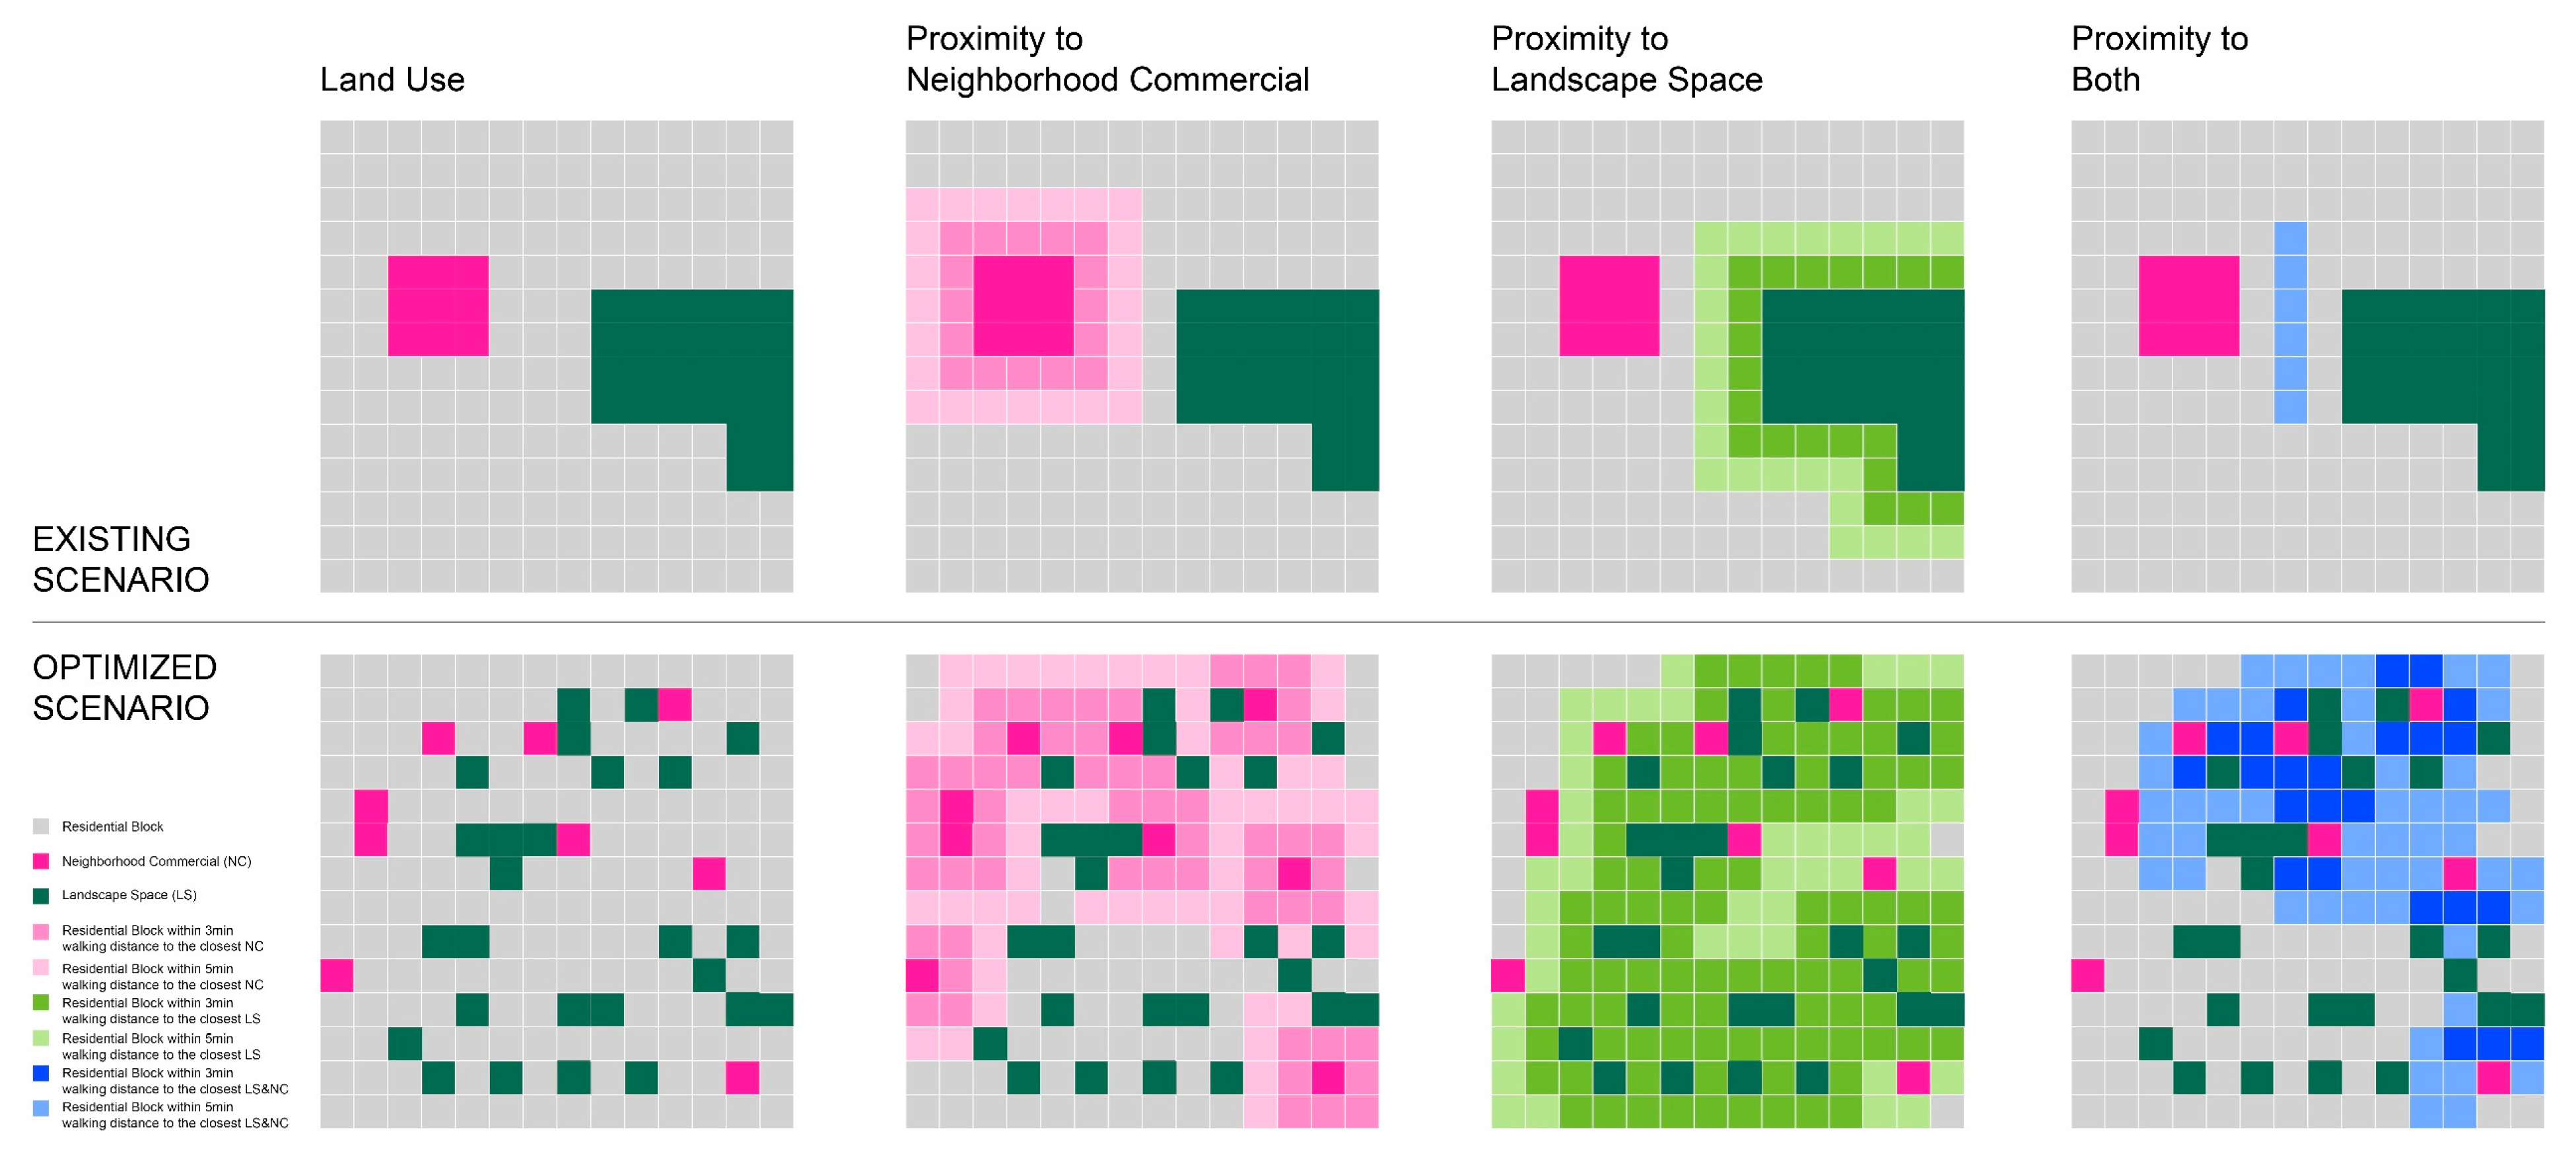
| Neighborhood Commercial | 3 min walking * | 10% | 36% | +26% |
| 5 min walking ** | 25% | 70% | +45% | |
| Landscape Space | 3 min walking * | 12% | 62% | +50% |
| 5 min walking ** | 27% | 89% | +62% | |
| Both | 3 min walking * | 0% | 15% | +15% |
| 5 min walking ** | 4% | 46% | +42% | |
Disclaimer/Publisher’s Note: The statements, opinions and data contained in all publications are solely those of the individual author(s) and contributor(s) and not of MDPI and/or the editor(s). MDPI and/or the editor(s) disclaim responsibility for any injury to people or property resulting from any ideas, methods, instructions or products referred to in the content. |
© 2023 by the authors. Licensee MDPI, Basel, Switzerland. This article is an open access article distributed under the terms and conditions of the Creative Commons Attribution (CC BY) license (https://creativecommons.org/licenses/by/4.0/).
Share and Cite
Zhu, C.; Susskind, J.; Giampieri, M.; O’Neil, H.B.; Berger, A.M. Optimizing Sustainable Suburban Expansion with Autonomous Mobility through a Parametric Design Framework. Land 2023, 12, 1786. https://doi.org/10.3390/land12091786
Zhu C, Susskind J, Giampieri M, O’Neil HB, Berger AM. Optimizing Sustainable Suburban Expansion with Autonomous Mobility through a Parametric Design Framework. Land. 2023; 12(9):1786. https://doi.org/10.3390/land12091786
Chicago/Turabian StyleZhu, Chenhao, Jonah Susskind, Mario Giampieri, Hazel Backus O’Neil, and Alan M. Berger. 2023. "Optimizing Sustainable Suburban Expansion with Autonomous Mobility through a Parametric Design Framework" Land 12, no. 9: 1786. https://doi.org/10.3390/land12091786
APA StyleZhu, C., Susskind, J., Giampieri, M., O’Neil, H. B., & Berger, A. M. (2023). Optimizing Sustainable Suburban Expansion with Autonomous Mobility through a Parametric Design Framework. Land, 12(9), 1786. https://doi.org/10.3390/land12091786