Abstract
The Yellow River Basin (YRB) stands as one of China’s most significant river basins, and the maintenance of its ecological functionality is of paramount importance for national well-being. The Guanzhong Plain Urban Agglomeration (GPUA), situated in the middle reaches of the YRB, represents the central hub of human activities. The rapid expansion of cities within this region poses formidable challenges to the ecological security framework of the highly sensitive middle reaches of the YRB. In this study, the dynamic equivalent coefficient method was employed to evaluate the changes in Ecological Service Values (ESVs) within the GPUA from 1990 to 2020, as well as the ecological costs incurred due to urban expansion. The results indicate the following: (1) Over the past three decades, the land-use pattern within the GPUA has undergone significant transformations. The area designated for urban development has expanded by a factor of 1.16 compared to its original extent, while the areas encompassing forests, shrubs, agricultural land, grassland, wetland, and bare land have experienced continuous reductions. (2) The ESV of the study area displays a declining trend initially, followed by a subsequent increase over the 30-year period. Forests play a predominant role in contributing to the ESV of the GPUA, with regulating services and supporting services standing out as the primary ecosystem functions. (3) The expansion of the GPUA between 1990 and 2020 has resulted in a net loss of 3772.10 km2 of ecological land. The ecological costs associated with urban expansion soar to an astonishing CNY 2.54 billion, with the highest costs attributed to the loss of hydrological regulation and soil conservation services; this issue demands significant attention. The outcomes of this research contribute to a better comprehension of the ecological costs and benefits that accompany the development of urban agglomerations in the middle reaches of the YRB. Furthermore, they provide invaluable insights for decision makers seeking to implement more effective strategies for sustainable land-use management.
1. Introduction
The 21st century has witnessed rapid land urbanization, imposing unprecedented pressure on ecosystems [1]. This process, driven by land expansion, has extensively utilized ecologically valuable areas, leading to the degradation of natural environments and the loss of critical ecosystem services [2,3]. These consequences contribute to global challenges like climate change and biodiversity loss [4]. The ecological costs associated with land urbanization are substantial [5], and the irreversible nature of this process means that restoring ecosystems to their original states may require significant long-term investments in labor and resources [6,7]. Since China’s economic reforms and opening up, rapid urbanization has occurred, with urban agglomerations driving national and regional development [8,9]. However, population growth, the loss of natural habitats, and unsustainable land-use practices in the hinterlands have hindered human well-being [10,11]. These activities have accelerated ecosystem degradation, undermining ecosystem integrity and security [1,12,13,14]. Consequently, people’s livelihoods have been significantly affected, leading to concerns among various stakeholders [15]. Future urban development will prioritize enhancing ecological benefits [16,17] and considering the cost-effectiveness of ecological aspects will be crucial in decision making [18]. It is essential to understand the extent of ecological welfare losses during the urbanization process to achieve sustainable ecosystem and socio-economic development. Assessing the ecological costs of land expansion through the loss of ESV is a vital approach to mitigating socio-ecological conflicts in ecologically sensitive areas [19]. This assessment has significant implications for reconciling the conflict between urban spatial development and ecological conservation in urban agglomerations, ultimately promoting sustainable development.
Cost is a fundamental concept in a market economy, representing a crucial component of commodity value. Ecological cost refers to the monetary value derived from the adverse impact on the natural environment during production and consumption activities driven by economic profit seeking [20]. There are two main types of ecological costs: direct ecological costs and indirect ecological costs. Direct ecological costs primarily include expenses related to natural resource depletion and environmental pollution management. On the other hand, indirect ecological costs mainly involve economic consequences resulting from the loss of ecosystem services, expenditures for environmental restoration, and biodiversity depletion. In recent research, Wang et al. defined the early ecological costs of urbanization as the loss of ecosystem service value resulting from agricultural land conversion. Mid-term ecological costs involve the land developed for urban construction, while late-term ecological costs refer to the investment required to enhance ecological service functions within the fiscal framework [21]. Quantitative methods like ecological footprint analysis, environmental load index, and ecological benefit assessments have been used by other scholars to assess the environmental impacts of human activities on the natural environment and ecological well-being [22,23,24]. However, these measures often overlook the monetary aspect of ecological costs, making it challenging to make precise comparisons with socio-economic development [25].
Ecosystem service valuation is a method for assessing the economic value of natural ecosystems in relation to human well-being. However, many ecosystem services are indirect and non-market-based, and their value is often recognized only when they become scarce or degraded [26]. This complexity makes it challenging to incorporate these intangible services into policy making, leading to the oversight of their hidden values [27]. Neglecting these values can result in the excessive exploitation and utilization of ecosystems and resources [28], compromising their long-term health and sustainability [29]. In the field of environmental-economic accounting, there has been significant progress in quantitative research, leading to the development of various methodologies for monetizing ecological costs. One notable approach is the evaluation of the ESV of different land types using value coefficients, as proposed by Costanza et al. [30]. Xie has also made contributions by establishing an equivalent coefficient table for ESV assessment in China and introducing a localized dynamic correction method for these coefficients [31,32,33]. The equivalent coefficient method has been widely applied in studies exploring the interconnectedness of land, economy, and ecology [34]. It has been used to examine the spatiotemporal variations of ESV driven by changes in land cover [35] and to explore ecological compensation based on ESV fluctuations [36]. Extensive research indicates that changes in land cover play a crucial role in driving ecosystem changes and associated services [37].The urbanization process often prioritizes economic gains while neglecting the crucial role of natural systems in promoting human well-being, especially in densely populated urban areas [38]. This oversight is due to a lack of economic evidence highlighting the services provided by nature for human well-being [39] and a limited number of studies addressing this issue [40]. Consequently, there is a lack of comprehensive research integrating rapid urbanization with the costs and benefits associated with ecosystems at the policy and regional management levels. This poses significant challenges for effective natural resource management and ecological degradation mitigation. Assessing the ecological costs of urbanization through ESV loss provides an intuitive and effective approach. It helps decision makers understand the trade-offs between ecosystem services and urban development over different time periods [40]. This understanding is crucial for implementing targeted decision-making strategies that enhance the positive linkages between ecosystem services and urban development, offering valuable insights for cost-effective regional planning and decision making.
The Yellow River Basin is a vital region in Chinese civilization, serving as an ecological security barrier and a key area for economic development [41]. However, the region faces challenges such as aridity, water scarcity, and human-induced disturbances, leading to ecological sensitivity and frequent disasters [42,43]. The Chinese government has committed to improving the ecological environment in the YRB’s urban agglomerations to enhance well-being [44]. As the core area of urbanization in the middle reaches of the YRB, the GPUA faces challenges in achieving green, co-ordinated, and sustainable development, with significant implications for regional ecological security [45,46]. Current research focuses on analyzing land cover change, urbanization, resource carrying capacity [22,47], and ecosystem dynamics in the GPUA [48,49,50]. However, limited research examines the ecological costs incurred during the urbanization process and their impact on ecological well-being. Quantitatively assessing the influence and costs of urbanization on the ecological well-being of the GPUA is crucial for mitigating the ecological costs, restoring ecosystems, and formulating sustainable urban planning and management policies.
The primary research objectives of this study are as follows: (1) Uncovering the long-term land-use changes and urban expansion processes in the GPUA to provide detailed data and analysis for a comprehensive understanding of urbanization development in the region. (2) Characterizing the spatiotemporal trajectories of ESVs driven by land cover changes, providing important scientific evidence for regional ecological conservation and restoration efforts. (3) Assessing the ecological costs resulting from the expansion of the GPUA and identifying key urban and ecological functions. This analysis will offer scientific references for clarifying priorities in ecological function restoration and optimizing land spatial management policies in the region.
2. Materials and Methods
2.1. Study Area
The Yellow River originates from the Bayan Har Mountains in the Qinghai–Tibet Plateau, and traverses nine provinces (autonomous regions) in China, namely Qinghai, Gansu, Sichuan, Ningxia, Inner Mongolia, Shaanxi, Shanxi, Henan, and Shandong, making it the second largest river basin in the country with a total area of approximately 795,000 km2. As of 2020, the urbanization rate in the YRB was 61.3%, and there are seven urban agglomerations within the basin, each with varying degrees of urban development [51]. The GPUA is situated south of the Qinling Mountains and connects with the Loess Plateau to the north. Over 95% of its area lies within the YRB, and the important tributary Wei River traverses through it. The GPUA serves as a crucial representative of the middle reaches of the YRB and has been included in China’s national key development strategies, such as the “Western Development Strategy” and the “Belt and Road” Initiative. Historically, this region has been a major population concentration area and an important grain-producing area in China, boasting abundant natural resources and diverse ecosystem types. With a large population and rapid economic development, the GPUA faces significant challenges of intense human disturbances to the ecological environment, as well as internal development disparities within the agglomeration itself [22]. The unique geographical location and complex topography exacerbate the vulnerability of the ecological environment in the Guanzhong region, while the irrational use of land highlights the conflicts between urban development and ecological conservation. The “Development Plan for the GPUA (2017–2035)” issued by the Chinese government in 2018 emphasizes the importance of creating a new type of urban agglomeration that achieves a harmonious coexistence between humans and nature as a key goal for the future development of the GPUA.
Based on the unique geographical position, resources, ecological significance, and strategic positioning of the GPUA in China and the YRB, assessing the ecological costs of its urban expansion is of significant importance for the protection and restoration of key ecological functions in the region, as well as for balancing the relationship between human activities and ecological environment conservation. An overview of the study area is shown in Figure 1.
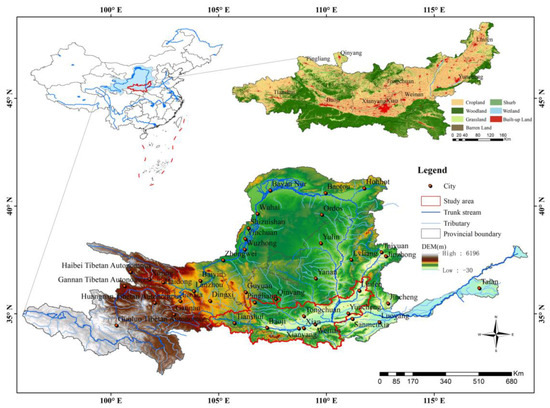
Figure 1.
Overall geographic characteristics of the YRB and location of the GPUA with land cover characteristics in 2020.
2.2. Data Sources
This study assesses the spatiotemporal characteristics of land use, ESV and ecological costs in the GPUA over a period of 30 years, starting from 1990 and utilizing 10-year intervals as time nodes. In China, short-term land planning typically follows 5-year or 10-year cycles. By employing a 10-year evaluation interval that aligns with China’s land planning cycle, this study can effectively reflect the trends and impacts of land-use changes and ecological functions within the planning period. Multiple datasets from different years, including land cover maps, meteorological data, remote sensing products, soil data, basic geographic data, and socio-economic statistics, were utilized in this research, specifically for the years 1990, 2000, 2010, and 2020. All data were processed and analyzed using ArcGIS 10.7, standardized to a 30 m resolution, and projected onto the WGS_1984_Albers coordinate system to ensure consistency across different datasets.
(1) The land cover data products for the years 1990, 2000, 2010, and 2020 were obtained from the Data Center for Resources and Environment Sciences, Chinese Academy of Sciences (https://www.resdc.cn/ accessed on 12 May 2021.). These data products were derived from remote sensing satellite imagery and were manually interpreted by professional personnel and visually interpreted using machine learning techniques. The overall accuracy of the data exceeds 90%, and it includes seven major land-use categories: woodland, shrub, grassland, cropland, wetland, built-up land, and bare land, as well as 25 detailed subcategories. In this study, the detailed ecological land categories in the original data were reclassified and statistically analyzed based on the ecological land classification system using an equivalence factor table (Table 1), in order to assess the ESV. The ecological land was reclassified into Dryland, Paddy field, Coniferous, Mixed, Broad-leaved, Bush, Prairie, Shrub grass, Meadow, Wetland, Desert, Barren, and Water. For validation, 300 sample points containing detailed land classes from medium- to high-resolution remote sensing images were selected for each of the four years using Google Earth. The results showed that the overall accuracy of the data exceeded 93%, with a Kappa coefficient above 0.95, meeting the accuracy requirements of the study. The validation accuracy statistics for each land-use type are presented in Table 2.

Table 1.
The equivalent coefficients table for ecosystem service value (ESV) per unit area for the six ecosystems and four ecosystem services.
Table 2.
Accuracy evaluation results for each land-use/cover category.
(2) The annual precipitation data and soil product data for the study area for four selected years were obtained from the National Earth System Data Centre (NESDC) (http://www.geodata.cn/ accessed on 12 May 2021.). The specific data for the study area were clipped using ArcGIS 10.7.
(3) The MOD17A3HGFNPP data products for the study area and the entire country, as well as ALOS World 3D-DEM data, were obtained using the Google Earth Engine (GEE) platform.
(4) The basic geographic data, including administrative divisions of the YRB, major cities, the planning scope of the GPUA, and the main stem and tributary data of the Yellow River, were obtained from NESDC.
(5) The data for the grain crop production, grain crop unit price, and grain crop planting area for each city in the study area were obtained from the statistical yearbooks and bulletins of Shaanxi Province, Shanxi Province, and Gansu Province.
2.3. Ecological Cost Assessment Based on the Dynamic Equivalent Coefficient Method
In this study, we used the dynamic equivalent coefficient method developed by Xie et al. to assess the ESV and ecological costs. This method considers the spatiotemporal dynamics of ecosystem structures and their service capacity, addressing the issue of poor timeliness in evaluating long-term ESV. Previous research has established a positive correlation between overall biomass and ecosystem functions such as food production, raw material production, gas regulation, climate regulation, environmental purification, nutrient cycling maintenance, biodiversity, and aesthetic landscape functions [52,53]. Water supply and hydrological regulation are influenced by precipitation variations, while soil conservation is linked to factors like precipitation, slope, soil properties, and vegetation coverage. The dynamic equivalent coefficient method incorporates these dynamics by adjusting the unit-area ESV equivalent coefficient based on the ratio of net primary productivity (NPP), precipitation, and soil conservation to the national average level over a specific period. This approach enables the construction of a spatiotemporal dynamic value equivalent table for the ecological services of the region during that specific period.
This study employed dynamic adjustment factors based on the proportion of NPP, precipitation, and soil conservation data in the GPUA region for the years 1990, 2000, 2010, and 2020, relative to the national average during the corresponding periods. These factors were integrated with the ESV equivalent table developed by Xie to establish ESV coefficients for each of the four study periods. By referencing data from statistical yearbooks, the equivalent factors were evaluated using the economic value per unit of grain crop in 2020 as a benchmark, enabling the monetization of ecosystem functions.
This methodology facilitates the quantification and comparison of ecological costs resulting from the conversion of ecological land due to urban agglomeration expansion, as well as the assessment of the extent to which urban agglomeration impacts the ecological environment. Consequently, it provides a robust scientific foundation for urban planning and decision making. The specific operational steps of this method are detailed as follows:
- (1)
- Estimation method of the total ESV
Calculation formula of the ESV for the GPUA:
In the equation, stands for the cumulative ESV. represents the equivalent factor for the unit area value of the category of the ecosystem service function in the region during the month. denotes the standard equivalent value, and represents the area of the grid unit for the land type . Consequently, the adjustment of the dynamic equivalence factor for the unit area value in the study area is achieved by establishing spatiotemporal adjustment factors for the NPP, precipitation, and soil retention.
- (2)
- Determine the dynamic equivalent factor for the value per unit area
The symbol represents the per unit area ecological value equivalent coefficient for the n-th category of the ecosystem service function in region during month . The variables , , and represent the spatiotemporal adjustment factors for the NPP, precipitation, and soil conservation for that particular ecosystem category in region during month . The services provided within the ecosystem category include food production, raw material production, gas regulation, climate regulation, environmental purification, nutrient cycling maintenance, biodiversity maintenance, and aesthetic landscape provision (referred to as category ). Additionally, the ecosystem category provides water supply and hydrological regulation services (referred to as category ), as well as soil conservation services (referred to as category ).
- (3)
- Calculation of dynamic adjustment factors for unit area value
To adjust the dynamic equivalent factors for the unit area value in the study area, spatiotemporal dynamic adjustment factors were constructed based on the NPP, precipitation, and soil conservation data for the four study periods. The calculation method is as follows:
In the equation, represents the NPP (t·hm−2) of the specific ecosystem category in the region during month . signifies the annual average NPP (t·hm−2) of the same ecosystem category nationwide. denotes the average unit area precipitation (mm · hm−2) in region during month . represents the annual average unit area rainfall (mm · hm−2) nationwide. represents the simulated soil retention quantity of the ecosystem in region during month . signifies the average simulated soil retention quantity per unit area nationwide.
- (4)
- Calculation of the benchmark price of the ESV equivalent coefficient
The equivalent value of a standard ES is worth seven times the economic value of the grain produced per unit area in that year, and the standard ESV of the study area was calculated as follows:
where is the standard equivalent factor value, is the number of the different kinds of grain crops in the GPUA, is the sown area of the kind of grain crops, is the unit price of the kind of grain crops, is the unit yield of the kind of grain crops, and is the sum of the area of all kinds of grain crops planted in the GPUA. In this study, the per unit area equivalent factor value for the ESV was determined based on the benchmark grain price in 2020.
- (5)
- The sensitivity of the estimated ESV
To validate the rationality of the ESV and ecological cost assessment in this study, as well as to examine the dependency of the results on the temporal variations of ESV coefficients, we refer to previous studies and adopt the concept of elasticity commonly used in economics to measure the sensitivity (CS) of the ESV index [35,54,55]. Specifically, we increase the value index of the different types of ecological land by 50% individually to assess the sensitivity of the ESV changes. The calculation formula is as follows:
where represents the ESV before and after adjustment, denotes the unit area ecosystem service value for the th type of ecological land, and represent the ESV coefficients before and after adjustment for the th type of ecological land, and and have the meanings as shown in Equation (1). If > 1, the ESV exhibits elasticity relative to . If < 1, the ESV is considered inelastic, and a lower value indicates a more reliable ESV adjustment coefficient.
3. Results
3.1. Spatial and Temporal Changes in Urban Agglomeration Expansion and Land Use in the GPUA
Since the 1990s, against the backdrop of rapid urbanization and development in China, the pace of urban–rural development in the Guanzhong Plain region has steadily accelerated. This has resulted in a notable expansion of regional construction land. The land-use changes in the study area from 1990 to 2020 are depicted in Figure 2, while Table 3 illustrates the quantitative fluctuations of different land-use types over four distinct time periods. Throughout the study period, the GPUA witnessed a continuous increase in the extent of construction land, forests, and shrub. Conversely, grassland exhibited an initial surge followed by a subsequent decline, while farmland experienced a consistent decrease. Among these land-use categories, grassland incurred the most substantial loss, amounting to a total reduction of 2824.61 km2. Farmland witnessed a cumulative decrease of 2748.67 km2, ranking second after grassland. Wetland exhibited an overall decrease of 235.29 km2, whereas bare land diminished by a total of 361.42 km2. From 1990 to 2020, the GPUA experienced a remarkable expansion of construction land. The built-up area increased from 3348.12 km2 in 1990 to 7226.26 km2 in 2020, representing a growth rate of 1.16 times the original size. The magnitude of the construction land growth varied significantly across different time periods, accompanied by distinct spatial distribution characteristics. During the three phases of 1990–2000, 2000–2010, and 2010–2020, the construction land area of the GPUA witnessed an expansion of 439.72 km2, 691.69 km2, and 2746.74 km2, respectively. Among the cities, Xi’an exhibited the most pronounced scale of construction land expansion, followed by Xianyang, Weinan, and Baoji. Qinyang city had the smallest degree of construction land expansion.

Figure 2.
Spatial pattern of land cover in the GPUA from 1990 to 2020.
Table 3.
Changes in the number of different land-use types in the GPUA from 1990 to 2020.
3.2. Spatiotemporal Change in ESV
3.2.1. Characterization of Spatial and Temporal Variations in Total ESV
Based on the dynamic ESV equivalent factor table from 1990 to 2020, we calculated the ESV variations for the years 1990, 2000, 2010, and 2020 in the GPUA. The sensitivity of the total ESV for the six major land categories during these four periods was evaluated, as illustrated in Figure 3a. The results indicate variations in the sensitivity indices of the ESV to the ecological value coefficients across the different land types. The CS ranges from 0.06 to 0.93, all of which are less than one, suggesting that the revised dynamic equivalent factors can reasonably assess the ESV changes and ecological costs in the GPUA. This assessment encompasses the provisioning service value (PSV), regulating service value (RSV), habitat service value (HSV), and cultural service value (CSV) for different land types and years. Figure 3b–d depict the overall ESV variations during the four periods, the characteristic changes in the ESVs provided by different ecological land types, and their contributions to the total ESV. The results reveal that the ESV in the GPUA for the years 1990, 2000, 2010, and 2020 are CNY 1305.26 × 108, 1281.78 × 108, 1640.90 × 108, and 1689.02 × 108, respectively. Overall, a declining trend was observed initially, followed by subsequent growth, with a notable decline in 2000 and a significant increase post-2000, albeit with a decelerated growth rate after 2010.
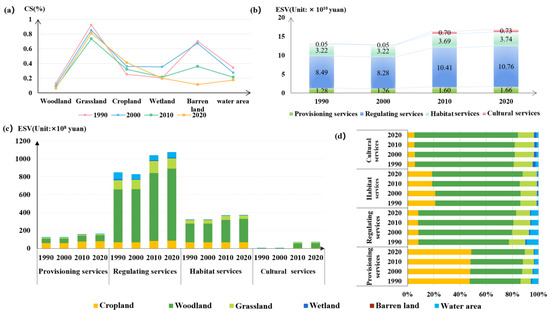
Figure 3.
(a) Results of the sensitivity analysis for ESV estimation of different land types. (b) The composition and changes in the four major ESVs in the GPUA from 1990 to 2020. (c) ESV changes in six ecological land types from 1990 to 2020. (d) Changes in the contribution rates of six ecological land types to the four ESVs from 1990 to 2020.
The research findings indicate that forests are the primary contributor to the ESV of the GPUA, with their contribution rates to the four ESV categories increasing annually. Cropland follows as the next significant contributor. Regulating services and habitat services are the main ecosystem functions in the GPUA, accounting for 90% of the total ESV. Forests provide a substantial amount of RSV, followed by grasslands, while the supply of RSV from water has declined over the years. The improvement in the PSV over the 30-year period is not significant, with the contributions from cropland and forests showing some increases, while the PSV from water bodies has decreased. The CSV was relatively weak between 1990 and 2000, but it has shown some increases since 2010.
Figure 3d illustrates the contribution rates of the different land types to each ESV category. The results reveal that the contribution rate of forests to the ESV increased from 65% in 1990 to 70% in 2020 throughout the study period. Cropland witnessed a decline in its contribution to the HSV after 2010, while grasslands experienced a modest increase followed by a subsequent decrease in their ESV contribution. The contribution rate of water areas to the ESV continuously decreased. The ESV variations of wetlands and barren land were not significant.
3.2.2. The Temporal and Spatial Distribution Characteristics of ESV Vary among Different Cities
During the period from 1990 to 2020, notable variations in ESV were observed among cities within the GPUA. Baoji emerged as the city with the highest total ESV value, followed by Shangluo. Notably, between 1990 and 2000, the ESV displayed a declining trend in the Guanzhong cities, with Weinan experiencing the most pronounced decrease. However, from 2000 to 2010, the ESV demonstrated accelerated growth across the cities, particularly evident in Baoji and Shangluo. Post-2010, Tianshui witnessed substantial ESV growth, while Weinan, Xianyang, Tongchuan, Linfen, and Xi’an recorded declines, which can be attributed to ecological land losses resulting from urban development and construction. Figure 4 visually presents the changes in the ESV per unit area for each city, along with the proportion of the four ecosystem service values. Shangluo boasted the highest ESV per unit area over the 30-year period, reaching CNY 2.107 million per hectare, followed by Baoji with CNY 1.8373 million per hectare. Tongchuan and Xian exhibited ESVs per unit area of CNY 1.5773 million and 1.4827 million, respectively, while Qingyang had the lowest ESV per unit area, followed by Yuncheng.
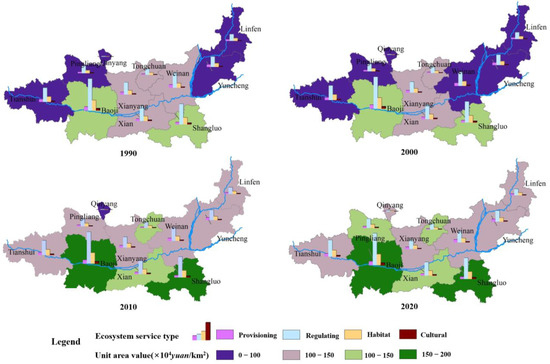
Figure 4.
Spatial distribution of ESV per unit area and the composition of four types of ecosystem service values in cities of the GPUA from 1990 to 2000.
Regarding the spatial distribution of ESVs, the high-value areas in the GPUA are primarily concentrated in the southern cities, while the northeastern and northwestern cities exhibit lower ESVs. The central cities demonstrate intermediate ESV levels. This distribution pattern can be attributed to the variations in the dominant land-use types and developmental disparities among the cities. The northern and central cities are situated in the Wei River Plain, which experiences a relatively arid climate due to its proximity to the Loess Plateau. Consequently, the land types dominated by built-up areas and croplands make a relatively lower contribution to ESV levels. In contrast, the southern cities of the urban agglomeration are characterized by a predominance of forests, with densely forested mountainous areas. As a result, these regions exhibit higher ESV levels per unit area. This phenomenon is particularly evident in Shangluo City, where the densely forested regions represent the highest ESV values within the GPUA. Conversely, cities such as Linfen, Yuncheng, Weinan, and Tianshui, which are predominantly located along the Yellow River, generally display lower overall ESV levels. These areas are characterized by higher ecological vulnerability and sensitivity.
3.3. Spatial and Temporal Dynamics of Ecological Costs Associated with Urban Agglomeration Expansion
3.3.1. Overall Ecological Land Loss Caused by Urban Agglomeration Expansion
We conducted a comprehensive analysis of the net ecological land loss resulting from urban expansion in the GPUA from 1990 to 2020, as depicted in Figure 5. Throughout the study period, there was a consistent increase in ecological land loss due to urban expansion, with distinct variations observed across different phases. Over the course of 30 years, the total ecological land loss attributed to expansion amounted to 3772.10 km2. Specifically, during the periods of 1990–2000, 2000–2010, and 2010–2020, the corresponding loss areas were 372.12 km2, 573.67 km2, and 2826.31 km2, respectively, accounting for proportions of 10%, 15%, and 75% of the total loss. Notably, croplands experienced the most substantial loss, reaching 3533.80 km2, which accounted for an overwhelming 93.68% of the overall expansion sources. Grasslands represented a proportion of 3.70% of the total loss.
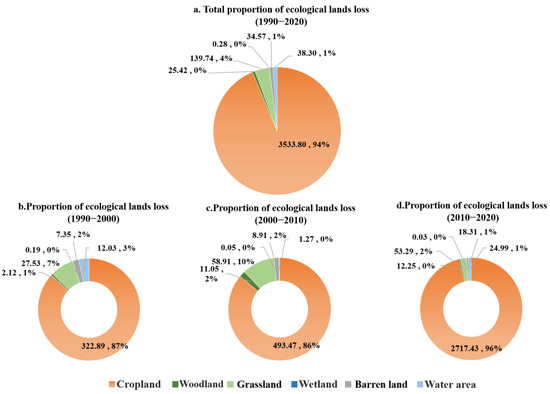
Figure 5.
Temporal characteristics of ecological land occupation via GPUA expansion from 1990 to 2020.
During the initial phase, the expansion of the urban agglomeration displayed a relatively subdued trend, resulting in a comparatively modest level of ecological land loss. Croplands and grasslands emerged as the primary sources of expansion, with respective loss areas of 322.89 km2 and 27.53 km2. Comparatively, from 2000 to 2010, there was a 5% increase in the extent of ecological land loss compared to the preceding phase. Croplands and grasslands continued to be the main contributors to expansion, with respective loss areas of 493.47 km2 and 58.91 km2. Throughout this period, there was a notable increase in the loss of grasslands and forests, while the proportion of water area loss declined. Subsequently, from 2010 to 2020, the ecological land loss reached its peak within the study period. Croplands accounted for a substantial 96% of the total expansion loss area, equating to 2717.43 km2. Although the proportions of forest and grassland loss decreased, both experienced a significant increase in terms of actual loss areas compared to the previous phase.
Figure 6 provides a refined analysis of the ecological land loss during three specific periods. The findings reveal distinct patterns of loss resulting from urban expansion. The Wetland and Desert categories experienced significant loss primarily between 1990 and 2000. The period from 2000 to 2010 witnessed a notable loss in the Bush and Shrub grass categories. Subsequently, between 2010 and 2020, the loss was most pronounced in the Dry land, Mixed, Broad-leaved, Prairie, and Barren categories. Conversely, other land classes exhibited comparatively minor areas of loss.
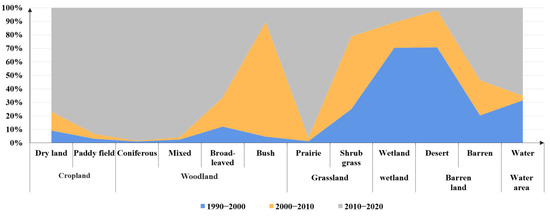
Figure 6.
Loss of various types of ecological land in GPUA from 1990 to 2020.
3.3.2. Overall Ecological Costs Arising from Urban Agglomeration Expansion
Between 1990 and 2020, the expansion of the urban agglomeration in the Guanzhong Plain resulted in a total ecological cost of CNY 2.54 billion. Figure 7a,b illustrates the detailed characteristics of ecological costs during the three phases. The ecological costs showed a progressive increase during the three time periods, with values of CNY 0.33 billion, 0.41 billion, and 1.79 billion, respectively. These costs accounted for 13%, 16%, and 71% of the total ecological costs. The majority of the losses were attributed to regulating services, totaling CNY 1.29 billion, followed by provisioning services (0.617 billion), habitat services (0.083 billion), and cultural services (0.545 billion).
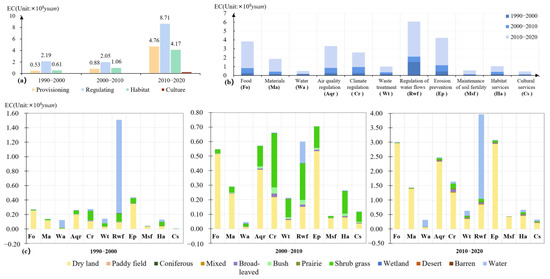
Figure 7.
(a) Overall changes in four types of ecological cost losses in the study area in three stages. (b) Detailed ecosystem service loss costs caused by the expansion of the GPUA. (c) Costs of ecosystem service loss due to the loss of various types of ecological land occupied by urban expansion from 1990 to 2020.
The study findings indicate that the GPUA experienced significant costs associated with the loss of ecosystem services (ES) between 1990 and 2020, showing a phased increase pattern. The highest cost was related to the regulation of water flow, amounting to CNY 608 million (24% of total ESV loss). Soil retention services incurred a cost of CNY 422 million (17% of total), while food provision services accounted for CNY 383 million (15% of total). Air quality regulation and climate regulation incurred costs of CNY 331 million and CNY 258 million, respectively, while the costs associated with other services were relatively minor. With the exception of the water resource supply and regulation of water flow, which remained stable, the costs of other ecosystem services resulting from expansion showed an accelerating upward trend during the three phases. Notably, the period from 2010 to 2020 had the highest ecological costs due to expansion, accounting for 71% of the overall proportion.
During the study period, the expansion of the GPUA resulted in significant losses in various ESVs, including food provision, soil retention, air quality regulation, and raw material production services, primarily due to the extensive conversion of cropland. From 1990 to 2000, the differences in the losses of these eleven ecosystem service values were relatively small. However, after 2000, there was a notable divergence in the costs associated with different ecosystem services. Over the course of 30 years, the compensation provided for the conversion of ecological land to developed land was insufficient to offset the ecological costs incurred by the land occupation.
Figure 7c shows the cost of the loss of ecosystem service types for the three phases of the detailed land classes. From 1990 to 2000, the highest cost of loss in the GPUA was associated with the regulation of water flow, primarily due to the reduction in water areas resulting from urban expansion. The second highest cost of loss was attributed to erosion prevention services, mainly due to the decrease in croplands and grasslands. The conversion of grasslands to developed land also led to reduced climate regulation and erosion prevention values. From 2000 to 2010, substantial ecological cost losses in the GPUA were primarily associated with soil retention, climate regulation, and the regulation of water flow. The conversion of croplands and grasslands was the main contributing factor to the decline in the ecological value during this period. Erosion prevention value loss was driven by the conversion of agricultural land to that of developed use, while the decline in the climate regulation value was a result of grassland loss due to urban expansion. The reduction in the value of the regulation of water flow was primarily attributed to the loss of grasslands, water areas, and croplands. Between 2010 and 2020, the expansion of the GPUA resulted in significant ecological cost losses, mainly due to the encroachment on croplands. This led to substantial declines in soil retention, food provision, air quality regulation, and the value of materials. The highest value loss during this period was observed in the regulation of water flow, totaling CNY 397 million.
3.3.3. Ecological Cost Variations Associated with Different Urban Expansions
Due to variations in resource endowments and disparities in urban development among cities within the GPUA, the ecological cost differentials resulting from their respective expansions are notably significant. Over a span of 30 years, Xi’an exhibited the highest extent of ecological land occupation, reaching 935.29 km2, accompanied by an associated ecological cost of CNY 632 million. Weinan ranked second, with a total ecological land occupation of 804.54 km2, followed by Yuncheng. The variations in ecological land occupation during the three phases were substantial among these cities, with the period from 2010 to 2020 being characterized by the most pronounced ecological land loss. Figure 8 illustrates the spatiotemporal characteristics of ecological land occupation and the ecological cost changes during the three stages of annual expansion in the cities of the GPUA.
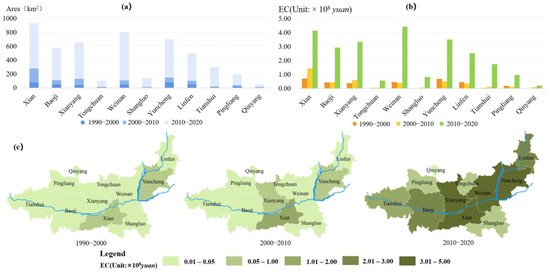
Figure 8.
(a) Loss of ecological land area due to urban sprawl in each of the three phases. (b) Ecological costs induced by urban expansion in each of the three stages. (c) Spatial and temporal changes in the ecological costs of each urban expansion in the GPUA from 1990 to 2020.
In terms of temporal changes, the initial phase of urban expansion exhibited relatively lower ecological costs, with Xi’an and Yuncheng being the cities with the highest ecological costs during this period. In the second phase, the costs of expansion continued to rise for Xi’an and Xianyang, while other cities experienced a decline in ecological costs compared to the previous phase. Following 2010, the GPUA entered a period of rapid development, resulting in a substantial increase in the ecological costs associated with expansion. During this phase, Weinan incurred the highest ecological costs, followed by Xi’an. At the interprovincial level, notable variations in ecological costs were observed in the development of the GPUA. Urban areas within Shaanxi Province experienced rapid overall development, leading to significant ecological costs. The urban areas in Shanxi Province held a moderate development status within the GPUA, while the urban areas in Gansu Province exhibited slower development, resulting in relatively lower ecological costs associated with their expansion.
As the largest urban agglomeration in the central part of the YRB, the construction and development of urban areas in the Guanzhong region hold significant importance for regional ecosystem provisioning and regulation. Spatially, the ecological costs incurred by the development of cities along the Yellow River have been consistently increasing over the years, with a particularly drastic surge observed after 2010. This poses greater challenges for the ecological restoration and management of the middle reaches of the YRB.
4. Discussion
4.1. Expansion of the GPUA and Ecological Impacts Driven by Policies
The middle reaches of the YRB, a crucial ecological barrier in China, have been significantly affected by surface structure and arid climatic conditions. Rising temperatures, frequent extreme events, and natural disasters have led to a decreased water flow in the region. Extensive urbanization and land development have greatly impacted the integrity and stability of existing ecosystems [56]. Climate change and unsustainable human activities have worsened soil erosion, disrupting the regional ecological balance [57]. Our observations from 1990 to 2020 show that within the GPUA, urban expansion has resulted in the loss of 3533.80 km2 of farmland, 139.74 km2 of grassland, 38.30 km2 of wetlands, and 25.42 km2 of woodland. This has led to an estimated loss of CNY 2.54 billion worth of ecosystem services over the three-decade period, with significant losses observed in water flow regulation, soil conservation services, and food supply. Previous studies have highlighted the deterioration of the ecological quality in core urban areas, such as Xi’an, due to intensified human activities and land-use transformations [58]. Our research further emphasizes the substantial ecological costs associated with the rapid expansion of cities like Xi’an, Weinan, and Yuncheng, which have implications for the sustainable provision of water and food resources for local communities [50]. The encroachment upon cropland and woodland by expanding urban centers disproportionately affects the socio-economic well-being of rural residents, undermining the equitable socio-ecological development of rural regions [59].
The GPUA experienced significant land cover changes due to policy interventions. From 1990 to 2000, the urban system in the GPUA was not fully developed, resulting in minimal disturbances to regional ecosystems. However, starting in 2000, the implementation of policies such as the reform of the national household registration system, the Western Development Strategy, and the establishment of urban development zones led to a rapid expansion of urban and rural construction land [60]. This expansion encroached upon croplands and grasslands, reducing the provision of ecosystem services. In the post-2010 era, the GPUA became one of China’s ten regional urban agglomerations, entering a high-growth phase of urbanization [61]. This expansionary trajectory intensified the ecological costs associated with the agglomeration. Efforts have been made since the early 21st century to address these ecological challenges through the implementation of national ecological policies [62], including initiatives like the Grain for Green program [63]. These measures have facilitated the conversion of agricultural land to forests and grasslands, leading to an improvement in the supply of ecosystem services in the area [12,64].
During the 11th five-year plan period (2006–2010), various measures were implemented in the YRB, including slope management, comprehensive small watershed management, and ecological water transfer projects [46,65]. The middle reaches of the YRB were identified as crucial afforestation areas [66], leading to improvements in the regional ecological environment. Public awareness regarding eco-environmental issues notably increased during the 13th five-year plan period (2015–2019) [67]. The middle reaches of the YRB continued to implement measures for returning farmland to forests [68], as our research indicates. By 2020, despite extensive urban development, the ESV of the GUPA remained comparable to the 2010 levels. The implementation of ecological protection and restoration policies has partly mitigated the significant impacts of urbanization on ecosystem services. Previous studies have also shown significant improvements in the ecological environment of the YRB with the implementation and adjustment of national and local government policies [45].
The rapid expansion of cities has negative consequences, including resource overexploitation and environmental overload, which impede the ecosystem’s ability to provide ecological services. Developing countries have incurred substantial economic and environmental costs due to rapid urbanization [69]. However, incorporating considerations of natural disaster risks and ecological costs into urban and land-use planning can reduce losses to both human economies and natural well-being. Urban land occupation resulting from city expansion affects soil and water conservation, increasing the risk of disasters [70]. Implementing sponge city initiatives [71], which minimize alterations to natural systems and enhance semi-natural ecosystems, can facilitate water retention and reduce flood risks. Therefore, formulating flexible urban development policies requires a comprehensive understanding of the dynamics and changes in ESs, enabling proactive and effective measures to be taken. Examining the relationship between urbanization and ESs from a policy implementation perspective is crucial for the future sustainable management of the GPUA.
4.2. Balancing the Benefits and Costs of Urban Agglomeration Development
The rapid expansion of the GPUA has negatively impacted the regional ESV, particularly in cities such as Xi’an, Xianyang, Weinan, and Yuncheng. Factors such as the large population size, flat topography, favorable location, well-developed transportation networks, and the “Xi’an-Xianyang Integration” development plan contribute to the higher ecological costs associated with their expansion over the past 30 years. The spatial expansion pattern of construction land, influenced by the changing internal and external environment of urban development, affects the ecological costs of expansion. The development of Xi’an has stimulated land development in surrounding cities, leading to the loss of agricultural land in peripheral areas and exacerbating the cost of agricultural ecosystem loss. Cities like Linfen and Yuncheng have had a significant impact on regional grassland ecosystems, while Xi’an, Xianyang, and Shangluo have shown greater occupations of forested areas. Cities with high ecological costs exhibit low levels of ESV within their urban boundaries, particularly Weinan, Xianyang, and Yuncheng, which have had consistently low ESV development levels over 30 years. In contrast, cities with a high ESV supply, such as Baoji and Shangluo, have a concentration of abundant forests. The scarcity of ESVs in highly urbanized areas is attributed to the prioritization of socio-economics over ecological economics, indicating an imbalance between the benefits of land urbanization development and ESV levels [49]. This imbalance has been identified as a primary reason for lower ESV levels in highly urbanized areas [72]. Regardless of the level of urbanization, an increase in land development puts pressure on ecosystems and affects the supply of ESV [73].
Urbanization has a significant impact on land-use patterns and ecological functions, while ecosystem limitations also affect the scale and sustainability of urbanization [74]. The GPUA, a prominent urban cluster in western China, has experienced a rapid increase in urbanization from 35.5% in 1990 to over 70% in 2021, accompanied by substantial economic growth [75]. However, construction activities have led to extensive environmental issues [76]. Research indicates that since 2005, the GPUA has been facing an ecological deficit, with ecosystems and economic systems being “completely disharmonious” as of 2016 [22,77]. The urbanization process continues to exert growing ecological pressure, with the inadequate utilization of natural capital flows to support economic and social development [22]. The most significant consequences of urban expansion are seen in the regulation of water flow and soil conservation services, posing a severe threat to ecosystems and the safety of human lives and properties in the middle reaches of watersheds, where water-related disasters, sedimentation, and erosion are frequent [78]. Improper human activities like excessive logging and land cultivation have contributed to vegetation degradation in certain areas of the YRB, characterized by a declining vegetation cover, shrinking marsh wetlands, grassland desertification, and increased secondary bare land areas [79]. Urban expansion exacerbates soil and water erosion, further damaging soil and water resources, intensifying vegetation degradation, and reducing overall ecological land productivity [80].
The pursuit of short-term socio-economic benefits at the expense of ecological costs imposes a heavy burden on the region’s ecology, necessitating greater investments in ecological restoration in the future. To address this issue, prioritizing ecological costs in the planning of urban clusters within watersheds is crucial. This approach involves considering the complex “nature-society-economy” system, which encompasses natural well-being and human factors. By adopting a holistic and co-ordinated decision-making approach, we can effectively balance development needs and preserve ecological integrity [81]. This integrated approach contributes to the sustainable development of urban cluster areas, promoting a harmonious coexistence between humans and nature, and yielding long-term benefits for regional economic and social progress. For example, the Xin’an River Basin, as a pilot project for trans-basin ecological compensation, prioritizes watershed ecological security in the development of its upstream cities. Through a well-established ecological compensation system, the basin has achieved comprehensive ecological civilization construction and promoted ESV growth throughout the region [36]. The balanced approach between ecological protection and economic development has played a significant role in fostering sustainable economic and social development in the upstream cities of the Xin’an River Basin.
4.3. Balancing Policy Impacts for a Sustainable Urban Agglomeration in the Middle Reaches of the YRB
Significant disparities exist in ecosystem service provisions among cities in the middle reaches of the YRB urban agglomeration. The rapid expansion of core cities has led to extensive ecological land occupation, resulting in a decline in ESV levels. Along the Yellow River, cities are experiencing increasing ecological costs, while secondary cities struggle to sustain ESV, leading to the excessive exploitation of natural resources [77]. The varying reliance on natural capital across different city types demonstrates the evolving process of ecological costs due to urban expansion, highlighting the importance of balancing natural systems and social development for effective ecological governance. Balancing policies are crucial for the future ecological sustainability of the YRB urban agglomeration. Several policies have been implemented, such as the “grain to green project,” sand and dust control measures, and water ecological civilization construction [82], which have improved the ecological fragility of the YRB [83]. These policies have facilitated the expansion of grassland and forest areas and enhanced multiple ecosystem services in the Guanzhong region [45]. To ensure future ecological sustainability, targeted ecological governance and protection measures should be implemented for key cities, adapting to local conditions, reducing ecological costs associated with urban expansion, and transforming the pattern of ecological vulnerability in the basin.
The future urbanization process of the YRB urban agglomeration in the middle reaches should consider the role of ESV at multiple scales. Differentiated policies among cities are needed to balance ecological costs and establish a long-term mechanism for ESV balancing within the urban agglomeration. The integrated development of Xi’an and Xianyang should be controlled to prevent the excessive exploitation of natural resources [84]. The strict delineation of ecological redlines, implementation of environmental regulatory systems, and accountability for natural resource management are crucial. Cities with a high ESV supply, like Baoji and Shangluo, should enhance their ecological benefits through ecological engineering and protected areas [77]. Ecological restoration projects and ecological economy initiatives should be consolidated to promote economic strength. Ecologically vulnerable cities like Linfen, Yuncheng, and Tianshui should prioritize improving urban ecological quality, enhancing resource-carrying capacity, and implementing differentiated restoration measures for damaged ecosystems [85]. Fairness in ES utilization between cities can be achieved through reasonable ecological compensation systems, promoting flexible spatial planning and management mechanisms. Cities directly traversed by the Yellow River should strengthen their ecological protection, while ecologically benefiting cities should provide compensation to support both conservation and development in ecologically constrained cities. This approach ensures regionally co-ordinated development and ecological security throughout the urban agglomeration [76].
4.4. Limitation and Future Outlook
In this study, we used the dynamic equivalent factor method to assess the ecological costs of urban expansion in the GPUA based on ESV loss. While this method provides an effective approach for large-scale ESV assessment, future research can improve the accuracy of ecological impact evaluation by incorporating a comprehensive assessment framework that integrates various technical methods and data. For instance, integrating remote sensing and geographic information system technologies can enhance data acquisition and the real-time monitoring of urban cluster development and its ecological impacts. Developing new models and methods to optimize the equivalent factor method can also provide a scientific foundation for decision-making.
Several considerations for future research are identified: (1) When evaluating the ecological costs and impacts of urban expansion, it is crucial to integrate multiple assessment methods and indicators to construct a comprehensive framework for assessing the ecological costs of urbanization. In addition to the cost of reduced ecosystem services, factors such as pollution control costs, energy consumption, carbon emissions, water resource utilization, biodiversity loss, and soil quality changes can also be taken into account. This integrated assessment can provide a more comprehensive evaluation of the ecological costs of urbanization, thereby facilitating effective collaborative governance. (2) Exploring cross-scale analysis methods to assess the impacts of urbanization on ecosystems at the watershed scale. This will contribute to ecological conservation and planning decisions at the watershed level. (3) Investigating sustainable planning methods and technologies to optimize land-use patterns in urban clusters while reducing ecological costs. This involves utilizing land-use models, multi-objective optimization methods, and spatial planning tools. Further research is needed to apply sustainable planning methods in the spatial planning and decision making of urban clusters within watersheds.
By addressing these research directions, future studies can comprehensively assess the ecological cost impacts of urban cluster development, provide specific recommendations for ecological conservation and planning decisions, and contribute to sustainable development.
5. Conclusions
This study comprehensively evaluated the changes in the ESV and associated ecological cost losses caused by the land cover dynamics in the GPUA from 1990 to 2020. The integrated approach utilized land-use analysis, remote sensing, and meteorological statistics. The results showed a continuous expansion of built-up areas, leading to a decrease in ecological land cover, except for forests. The ESV of the urban cluster initially decreased but then increased over the study period, with forests making the largest contribution. The expansion resulted in the loss of 3772.10 km2 of ecological land, with cropland experiencing the most extensive loss. The urban expansion led to a net loss of CNY 2.54 billion worth of ecosystem services, primarily impacting water flow regulation and soil conservation functions. Soil conservation emerges as an urgent ecological task in the region. Different cities within the GPUA incurred varying ecological costs based on their geographical location, natural resources, and development levels. Xi’an had the highest ecological cost, followed by Weinan, Yuncheng, and Xianyang. This study identified an increasing trend in the ecological costs of urban expansion along the Yellow River in the GPUA, posing challenges to ecological governance. While policies have strengthened ecological restoration efforts, the declining trend of the ESV has only been partially alleviated. Reversing ecological issues in the YRB requires tailored ecological management policies and stricter land growth control measures. These findings contribute to the formulation of ecological protection and restoration policies for urban clusters in the middle reaches of the YRB.
Author Contributions
X.R. conceived and designed the study, conducted data processing and analysis, and drafted the manuscript. X.R. and Y.Y. performed image classification and mapping. Z.W. provided the dataset, including land use and remote sensing data. Y.Y. revised the paper. All authors have read and agreed to the published version of the manuscript.
Funding
This research was funded by the “Strategic Priority Research Program of the Chinese Academy of Sciences of China”, grant numbers “XDA28020501 and XDA19040500“, as well as the “National Natural Science Foundation of China”, grant number “42222103”.
Data Availability Statement
Not applicable.
Acknowledgments
The authors would like to thank the anonymous reviewers for their comments and suggestions.
Conflicts of Interest
The authors declare no conflict of interest.
References
- Cumming, G.S.; Buerkert, A.; Hoffmann, E.M.; Schlecht, E.; von Cramon-Taubadel, S.; Tscharntke, T. Implications of agricultural transitions and urbanization for ecosystem services. Nature 2014, 515, 50–57. [Google Scholar] [CrossRef] [PubMed]
- Costanza, R.; De Groot, R.; Sutton, P.; Van der Ploeg, S.; Anderson, S.J.; Kubiszewski, I.; Farber, S.; Turner, R.K. Changes in the global value of ecosystem services. Glob. Environ. Change 2014, 26, 152–158. [Google Scholar] [CrossRef]
- Su, W.; Chen, W.; Guo, R.; Ru, J. The occupation of river network by urbanrural land expansion in Taihu Basin. China J. Nat. Resour. 2016, 34, 1289–1301. [Google Scholar]
- Benítez-López, A.; Alkemade, R.; Verweij, P.A. The impacts of roads and other infrastructure on mammal and bird populations: A meta-analysis. Biol. Conserv. 2010, 143, 1307–1316. [Google Scholar] [CrossRef]
- Cao, Y.; Kong, L.; Zhang, L.; Ouyang, Z. The balance between economic development and ecosystem service value in the process of land urbanization: A case study of China’s land urbanization from 2000 to 2015. Land Use Policy 2021, 108, 105536. [Google Scholar] [CrossRef]
- Sui, D.Z.; Zeng, H. Modeling the dynamics of landscape structure in Asia’s emerging desakota regions: A case study in Shenzhen. Landsc. Urban. Plan. 2001, 53, 37–52. [Google Scholar] [CrossRef]
- Schneider, A.; Logan, K.E.; Kucharik, C.J. Impacts of urbanization on ecosystem goods and services in the US Corn Belt. Ecosystems 2012, 15, 519–541. [Google Scholar] [CrossRef]
- Fei, W.; Zhao, S. Urban land expansion in China’s six megacities from 1978 to 2015. Sci. Total Environ. 2019, 664, 60–71. [Google Scholar] [CrossRef]
- Zhou, Y.; Li, X.; Liu, Y. Rural land system reforms in China: History, issues, measures and prospects. Land Use Policy 2020, 91, 104330. [Google Scholar] [CrossRef]
- Kindu, M.; Schneider, T.; Teketay, D.; Knoke, T. Changes of ecosystem service values in response to land use/land cover dynamics in Munessa-Shashemene landscape of the Ethiopian highlands. Sci. Total Environ. 2016, 547, 137–147. [Google Scholar] [CrossRef]
- Tesfay, F.; Tadesse, S.A.; Getahun, Y.S.; Lemma, E.; Gebremedhn, A.Y. Evaluating the impact of land use land cover changes on the values of ecosystem services in the Chacha Watershed, Ethiopia’s central highland. Environ. Sustain. Indic. 2023, 18, 100256. [Google Scholar] [CrossRef]
- Hooper, T.; Beaumont, N.; Griffiths, C.; Langmead, O.; Somerfield, P.J. Assessing the sensitivity of ecosystem services to changing pressures. Ecosyst. Serv. 2017, 24, 160–169. [Google Scholar] [CrossRef]
- Sijing, X.; Gang, L.; Biao, M. Vulnerability analysis of land ecosystem considering ecological cost and value: A complex network approach. Ecol. Indic. 2023, 147, 109941. [Google Scholar] [CrossRef]
- He, C.; Liu, Z.; Tian, J.; Ma, Q. Urban expansion dynamics and natural habitat loss in China: A multiscale landscape perspective. Glob. Change Biol. 2014, 20, 2886–2902. [Google Scholar] [CrossRef] [PubMed]
- Olewiler, N. Environmental sustainability for urban areas: The role of natural capital indicators. Cities 2006, 23, 184–195. [Google Scholar] [CrossRef]
- Kaczorowska, A.; Kain, J.-H.; Kronenberg, J.; Haase, D. Ecosystem services in urban land use planning: Integration challenges in complex urban settings—Case of Stockholm. Ecosyst. Serv. 2016, 22, 204–212. [Google Scholar] [CrossRef]
- Sukhdev, P.; Wittmer, H.; Miller, D. The economics of ecosystems and biodiversity (TEEB): Challenges and responses. In Nature in the Balance: The Economics of Biodiversity; Oxford University Press: Oxford, UK, 2014; pp. 135–152. [Google Scholar]
- Liang, C.; Zhang, R.-C.; Zeng, J. Optimizing ecological and economic benefits in areas with complex land-use evolution based on spatial subdivisions. Landsc. Urban. Plan. 2023, 236, 104782. [Google Scholar] [CrossRef]
- Su, Y.; Chen, X.; Liao, J.; Zhang, H.; Wang, C.; Ye, Y.; Wang, Y. Modeling the optimal ecological security pattern for guiding the urban constructed land expansions. Urban. For. Urban. Green. 2016, 19, 35–46. [Google Scholar] [CrossRef]
- Li, M.; Liu, S.; Wang, F.; Liu, H.; Liu, Y.; Wang, Q. Cost-benefit analysis of ecological restoration based on land use scenario simulation and ecosystem service on the Qinghai-Tibet Plateau. Glob. Ecol. Conserv. 2022, 34, e02006. [Google Scholar] [CrossRef]
- Wang, Y.; Yang, X. Fiscal Ecological Cost of Land in China: Estimation and Regional Differences. Land 2022, 11, 1221. [Google Scholar] [CrossRef]
- Yang, Y.; Cai, Z. Ecological security assessment of the Guanzhong Plain urban agglomeration based on an adapted ecological footprint model. J. Clean. Prod. 2020, 260, 120973. [Google Scholar] [CrossRef]
- Miroshnyk, N.V.; Likhanov, A.; Grabovska, T.O.; Teslenko, I.; Roubík, H. Green infrastructure and relationship with urbanization–Importance and necessity of integrated governance. Land Use Policy 2022, 114, 105941. [Google Scholar] [CrossRef]
- Zou, Z.; Wu, T.; Xiao, Y.; Song, C.; Wang, K.; Ouyang, Z. Valuing natural capital amidst rapid urbanization: Assessing the gross ecosystem product (GEP) of China’s ‘Chang-Zhu-Tan’ megacity. Environ. Res. Lett. 2020, 15, 124019. [Google Scholar] [CrossRef]
- Zheng, H.; Wang, L.; Peng, W.; Zhang, C.; Li, C.; Robinson, B.E.; Wu, X.; Kong, L.; Li, R.; Xiao, Y. Realizing the values of natural capital for inclusive, sustainable development: Informing China’s new ecological development strategy. Proc. Natl. Acad. Sci. USA 2019, 116, 8623–8628. [Google Scholar] [CrossRef] [PubMed]
- Almenar, J.B.; Elliot, T.; Rugani, B.; Philippe, B.; Gutierrez, T.N.; Sonnemann, G.; Geneletti, D. Nexus between nature-based solutions, ecosystem services and urban challenges. Land Use Policy 2021, 100, 104898. [Google Scholar] [CrossRef]
- Qiting, Z.; Zhizhuo, Z.; Junxia, M.; Jiawei, L. Solutions to Difficult Problems Caused by the Complexity ofHuman–Water Relationship in the Yellow River Basin: Based on the Perspective of Human–Water Relationship Discipline. Water 2010, 1, 413–426. [Google Scholar]
- Luqman, M.; Rayner, P.J.; Gurney, K.R. Combining Measurements of Built-up Area, Nighttime Light, and Travel Time Distance for Detecting Changes in Urban Boundaries: Introducing the BUNTUS Algorithm. Remote Sens. 2019, 11, 2969. [Google Scholar] [CrossRef]
- Aslam, R.W.; Shu, H.; Yaseen, A. Monitoring the population change and urban growth of four major Pakistan cities through spatial analysis of open source data. Ann. GIS 2023, 29, 355–367. [Google Scholar] [CrossRef]
- Costanza, R.; d’Arge, R.; De Groot, R.; Farber, S.; Grasso, M.; Hannon, B.; Limburg, K.; Naeem, S.; O’Neill, R.V.; Paruelo, J. The value of the world’s ecosystem services and natural capital. Nature 1997, 387, 253–260. [Google Scholar] [CrossRef]
- Xie, G.; Zhen, L.; Lu, C.-X.; Xiao, Y.; Chen, C. Expert knowledge based valuation method of ecosystem services in China. J. Nat. Resour. 2008, 23, 911–919. [Google Scholar]
- Xie, H. A type of multi-level correction scheme for eigenvalue problems by nonconforming finite element methods. BIT Numer. Math. 2015, 55, 1243–1266. [Google Scholar] [CrossRef]
- Xie, G.-d.; Zhang, C.-x.; Zhang, L.-m.; Chen, W.-h.; Li, S.-m. Improvement of the Evaluation Method for Ecosystem Service Value Based on Per Unit Area. J. Nat. Resour. 2015, 30, 1243–1254. [Google Scholar]
- Wang, X.; Pan, T.; Pan, R.; Chi, W.; Ma, C.; Ning, L.; Wang, X.; Zhang, J. Impact of Land Transition on Landscape and Ecosystem Service Value in Northeast Region of China from 2000–2020. Land 2022, 11, 696. [Google Scholar] [CrossRef]
- Xie, L.; Wang, H.; Liu, S. The ecosystem service values simulation and driving force analysis based on land use/land cover: A case study in inland rivers in arid areas of the Aksu River Basin, China. Ecol. Indic. 2022, 138, 108828. [Google Scholar] [CrossRef]
- Yu, H.; Chen, C.; Shao, C. Spatial and temporal changes in ecosystem service driven by ecological compensation in the Xin’an River Basin, China. Ecol. Indic. 2023, 146, 109798. [Google Scholar] [CrossRef]
- Lawler, J.J.; Lewis, D.J.; Nelson, E.; Plantinga, A.J.; Polasky, S.; Withey, J.C.; Helmers, D.P.; Martinuzzi, S.; Pennington, D.; Radeloff, V.C. Projected land-use change impacts on ecosystem services in the United States. Proc. Natl. Acad. Sci. USA 2014, 111, 7492–7497. [Google Scholar] [CrossRef] [PubMed]
- Woodruff, S.C.; BenDor, T.K. Ecosystem services in urban planning: Comparative paradigms and guidelines for high quality plans. Landsc. Urban. Plan. 2016, 152, 90–100. [Google Scholar] [CrossRef]
- Ten Brink, P. The Economics of Ecosystems and Biodiversity in National and International Policy Making; Routledge: Abingdon, UK, 2011. [Google Scholar]
- Hirokawa, K.H.; Gottlieb, C. Sustainable habitat restoration: Fish, farms, and ecosystem services. Fordham Environ. Law. Rev. 2012, 23, 1–54. [Google Scholar] [CrossRef][Green Version]
- Yuhan, R.; Yuping, B.; Yihan, L.; Jiale, W.; Fan, Z.; Zheng, W. Conflict or Coordination? Analysis of Spatio-Temporal Coupling Relationship between Urbanization and Eco-Efficiency: A Case Study of Urban Agglomerations in the Yellow River Basin, China. Land 2010, 1, 413–426. [Google Scholar]
- Qiu, M.; Yang, Z.; Zuo, Q.; Wu, Q.; Jiang, L.; Zhang, Z.; Zhang, J. Evaluation on the relevance of regional urbanization and ecological security in the nine provinces along the Yellow River, China. Ecol. Indic. 2021, 132, 108346. [Google Scholar] [CrossRef]
- Zhang, X.; Liu, K.; Wang, S.; Wu, T.; Li, X.; Wang, J.; Wang, D.; Zhu, H.; Tan, C.; Ji, Y. Spatiotemporal evolution of ecological vulnerability in the Yellow River Basin under ecological restoration initiatives. Ecol. Indic. 2022, 135, 108586. [Google Scholar] [CrossRef]
- Li, S.; Liang, W.; Fu, B.; Lü, Y.; Fu, S.; Wang, S.; Su, H. Vegetation changes in recent large-scale ecological restoration projects and subsequent impact on water resources in China’s Loess Plateau. Sci. Total Environ. 2016, 569–570, 1032–1039. [Google Scholar] [CrossRef] [PubMed]
- Zhao, Y.; Feng, Q.; Lu, A. Spatiotemporal variation in vegetation coverage and its driving factors in the Guanzhong Basin, NW China. Ecol. Inform. 2021, 64, 101371. [Google Scholar] [CrossRef]
- Jiang, C.; Wang, F.; Zhang, H.Y.; Dong, X.L. Quantifying changes in multiple ecosystem services during 2000–2012 on the Loess Plateau, China, as a result of climate variability and ecological restoration. Ecol. Eng. 2016, 97, 258–271. [Google Scholar] [CrossRef]
- Yang, Y.; Li, Y.; Guo, Y. Impact of the differences in carbon footprint driving factors on carbon emission reduction of urban agglomerations given SDGs: A case study of the Guanzhong in China. Sustain. Cities Soc. 2022, 85, 104024. [Google Scholar] [CrossRef]
- Chen, Y.; Li, Z.; Li, P.; Zhang, Z.; Zhang, Y. Identification of Coupling and Influencing Factors between Urbanization and Ecosystem Services in Guanzhong, China. Sustainability 2021, 13, 10637. [Google Scholar] [CrossRef]
- Yang, J.; Ma, X.; Zhao, X.; Li, W. Spatiotemporal of the Coupling Relationship between Ecosystem Services and Human Well-Being in Guanzhong Plain Urban Agglomeration. Int. J. Env. Res. Public. Health 2022, 19, 12535. [Google Scholar] [CrossRef] [PubMed]
- Peng, L.; Zhang, L.; Li, X.; Wang, Z.; Wang, H.; Jiao, L. Spatial expansion effects on urban ecosystem services supply-demand mismatching in Guanzhong Plain Urban Agglomeration of China. J. Geogr. Sci. 2022, 32, 806–828. [Google Scholar] [CrossRef]
- Wang, J.; Liu, H.; Peng, D.; Lv, Q.; Sun, Y.; Huang, H.; Liu, H. The County-Scale Economic Spatial Pattern and Influencing Factors of Seven Urban Agglomerations in the Yellow River Basin—A Study Based on the Integrated Nighttime Light Data. Sustainability 2021, 13, 4220. [Google Scholar] [CrossRef]
- Li, S. Studies on the Flow Processes of Typical Ecosystem Services Based on Observation Network; Institute of Geographic Sciences and Natural Resources Research, Chinese Academy of Sciences: Beijing, China, 2010. [Google Scholar]
- Pei, S. Flow Processes of Typical Ecosystem Services and Their Value Based on Data from Field Stations; Institute of Geographic Sciences and Natural Resources Research: Beijing, China, 2013. [Google Scholar]
- Shuping, Y.U.E.; Shuwen, Z.; Yechao, Y.A.N. Impacts of Land Use Change on Ecosystem Services Value in the Northeast China Transect (NECT). Acta Geogr. Sin. 2007, 62, 879–886. [Google Scholar]
- Wang, X.; Dong, X.; Liu, H.; Wei, H.; Fan, W.; Lu, N.; Xu, Z.; Ren, J.; Xing, K. Linking land use change, ecosystem services and human well-being: A case study of the Manas River Basin of Xinjiang, China. Ecosyst. Serv. 2017, 27, 113–123. [Google Scholar] [CrossRef]
- Zhang, G.; Huang, J.; Liu, X.; Guan, X.; Wei, Y.; Ding, L.; Han, D. The evolution of ecological security and its drivers in the Yellow River Basin. Environ. Sci. Pollut. Res. 2023, 30, 47501–47515. [Google Scholar] [CrossRef]
- Yong, X.; Chuansheng, W. Ecological protection and high-quality development in the Yellow River Basin: Framework, path, and countermeasure. Bull. Chin. Acad. Sci. 2020, 35, 875–883. [Google Scholar]
- Yang, S.; Su, H. Multi-Scenario Simulation of Ecosystem Service Values in the Guanzhong Plain Urban Agglomeration, China. Sustainability 2022, 14, 8812. [Google Scholar] [CrossRef]
- Ring, I.; Hansjürgens, B.; Elmqvist, T.; Wittmer, H.; Sukhdev, P. Challenges in framing the economics of ecosystems and biodiversity: The TEEB initiative. Curr. Opin. Environ. Sustain. 2010, 2, 15–26. [Google Scholar] [CrossRef]
- Wang, Z.H.; Kong, X.S.; Cheng, P. Spatiotemporal evolution of national development zones and their impact on urban land growth in China. J. Geogr. Sci. 2022, 32, 1451–1470. [Google Scholar] [CrossRef]
- Li, G.D.; Fang, C.L.; Li, Y.J.; Wang, Z.B.; Sun, S.A.; He, S.W.; Qi, W.; Bao, C.; Ma, H.T.; Fan, Y.P.; et al. Global impacts of future urban expansion on terrestrial vertebrate diversity. Nat. Commun. 2022, 13, 1628. [Google Scholar] [CrossRef]
- Mao, D.; He, X.; Wang, Z.; Tian, Y.; Xiang, H.; Yu, H.; Man, W.; Jia, M.; Ren, C.; Zheng, H. Diverse policies leading to contrasting impacts on land cover and ecosystem services in Northeast China. J. Clean. Prod. 2019, 240, 117961. [Google Scholar] [CrossRef]
- Liu, X.; Pan, Y.; Zhu, X.; Li, S. Spatiotemporal variation of vegetation coverage in Qinling-Daba Mountains in relation to environmental factors. Acta Geogr. Sin. 2015, 70, 75–716. [Google Scholar]
- Han, B.; Jin, X.; Xiang, X.; Rui, S.; Zhang, X.; Jin, Z.; Zhou, Y. An integrated evaluation framework for Land-Space ecological restoration planning strategy making in rapidly developing area. Ecol. Indic. 2021, 124, 107374. [Google Scholar] [CrossRef]
- Cuo, L.; Zhang, Y.X.; Gao, Y.H.; Hao, Z.C.; Cairang, L.S. The impacts of climate change and land cover/use transition on the hydrology in the upper Yellow River Basin, China. J. Hydrol. 2013, 502, 37–52. [Google Scholar] [CrossRef]
- Chen, L.D.; Wei, W.; Fu, B.J.; Lu, Y.H. Soil and water conservation on the Loess Plateau in China: Review and perspective. Prog. Phys. Geogr. Earth Environ. 2007, 31, 389–403. [Google Scholar] [CrossRef]
- Li, P.; Wang, D.; Li, W.; Liu, L. Sustainable water resources development and management in large river basins: An introduction. Env. Earth Sci. 2022, 81, 179. [Google Scholar] [CrossRef]
- Chen, Y.; Miao, Q.; Zhou, Q. Spatiotemporal Differentiation and Driving Force Analysis of the High-Quality Development of Urban Agglomerations along the Yellow River Basin. Int. J. Env. Res. Public. Health 2022, 19, 2484. [Google Scholar] [CrossRef]
- Albarracin, G. Urban form and ecological footprint: Urban form and ecological footprint: A morphological analysis for harnessing solar energy in the suburbs of Cuenca, Ecuador. Energy Procedia 2017, 115, 332–343. [Google Scholar] [CrossRef]
- Gu, Q.; Wang, H.; Zheng, Y.; Zhu, J.; Li, X. Ecological footprint analysis for urban agglomeration sustainability in the middle stream of the Yangtze River. Ecol. Model. 2015, 318, 86–99. [Google Scholar] [CrossRef]
- Leng, L.; Mao, X.; Jia, H.; Xu, T.; Chen, A.S.; Yin, D.; Fu, G. Performance assessment of coupled green-grey-blue systems for Sponge City construction. Sci. Total Environ. 2020, 728, 138608. [Google Scholar] [CrossRef] [PubMed]
- Tian, Y.; Zhou, D.; Jiang, G. Conflict or Coordination? Multiscale assessment of the spatio-temporal coupling relationship between urbanization and ecosystem services: The case of the Jingjinji Region, China. Ecological Indicators 2020, 117, 106543. [Google Scholar] [CrossRef]
- Zhou, D.Y.; Tian, Y.Y.; Jiang, G.H. Spatio-temporal investigation of the interactive relationship between urbanization and ecosystem services: Case study of the Jingjinji urban agglomeration, China. Ecol. Indic. 2018, 95, 152–164. [Google Scholar] [CrossRef]
- Lu, D.; Chen, M. Several viewpoints on the background of compiling the "National New Urbanization Planning (2014–2020)". Acta Geogr. Sin. 2015, 70, 179–185. [Google Scholar]
- Han, J.; Gao, M.; Sun, Y. Measurement of City Clusters’ Economic Growth Effects and Analysis of the Influencing Factors. Chin. J. Urban. Environ. Stud. 2020, 8, 2050006. [Google Scholar] [CrossRef]
- Mi, Y.; Sun, K.; Li, L.; Lei, Y.; Wu, S.; Tang, W.; Wang, Y.; Yang, J. Spatiotemporal pattern analysis of PM2. 5 and the driving factors in the middle Yellow River urban agglomerations. J. Clean. Prod. 2021, 299, 126904. [Google Scholar] [CrossRef]
- Yang, Y.; Yang, H.; Cheng, Y. Why is it crucial to evaluate the fairness of natural capital consumption in urban agglomerations in terms of ecosystem services and economic contribution? Sustain. Cities Soc. 2021, 65, 102644. [Google Scholar] [CrossRef]
- Zhuguo, M.; Congbin, F.; Tianjun, Z.; Zhongwei, Y.; Mingxing, L.; Ziyan, Z.; Liang, C.; Meixia, L. Status and ponder of climate and hydrology changes in the Yellow River Basin. Bull. Chin. Acad. Sci. 2020, 35, 52–60. [Google Scholar]
- Wang, F.; Ning, D.; Li, R. Soil and Water Conservation Policies Change in the Yellow River Basin, China. In Global Degradation of Soil and Water Resources: Regional Assessment and Strategies; Springer: Berlin/Heidelberg, Germany, 2022; pp. 243–255. [Google Scholar]
- Deng, L.; Shangguan, Z. High quality developmental approach for soil and water conservation and ecological protection on the Loess Plateau. Front. Agric. Sci. Eng. 2021, 8, 501–511. [Google Scholar] [CrossRef]
- Zhang, G.; Chen, Y.; Wu, Y. Commentary on eco-hydrological regulation for integrated river basin management. Sci. Geogr. Sin. 2019, 39, 1191–1198. [Google Scholar]
- Feng, L.; Zhao, H. Ecological Well-Being Performance Evaluation and Spatio-Temporal Evolution Characteristics of Urban Agglomerations in the Yellow River Basin. Land 2022, 11, 413–426. [Google Scholar] [CrossRef]
- Yang, J.; Xie, B.; Wang, S.; Zhang, D.; Liu, C.; Mak-Mensah, E. Temporal and spatial characteristics of grassland ecosystem service value and its topographic gradient effect in the Yellow River Basin. PLoS ONE 2022, 17, e0278211. [Google Scholar] [CrossRef]
- Shang, J.; Dong, L.; Ali, R.; Shen, X.; Rehman, R. The influence mechanism of new-type urbanization on the eco-environment in western china-guanzhong using improved entropy weight method. Int. J. Environ. Sci. Technol. 2022, 20, 6395–6418. [Google Scholar] [CrossRef]
- Xi, F.; Wang, R.; Shi, J.; Zhang, J.; Yu, Y.; Wang, N.; Wang, Z. Spatio-Temporal Pattern and Conflict Identification of Production–Living–Ecological Space in the Yellow River Basin. Land 2022, 11, 744. [Google Scholar] [CrossRef]
Disclaimer/Publisher’s Note: The statements, opinions and data contained in all publications are solely those of the individual author(s) and contributor(s) and not of MDPI and/or the editor(s). MDPI and/or the editor(s) disclaim responsibility for any injury to people or property resulting from any ideas, methods, instructions or products referred to in the content. |
© 2023 by the authors. Licensee MDPI, Basel, Switzerland. This article is an open access article distributed under the terms and conditions of the Creative Commons Attribution (CC BY) license (https://creativecommons.org/licenses/by/4.0/).