
Future Land Use Spatial Conflicts and Habitat Quality Impacts Based on SSPs-RCPs Scenarios—Qin-Ba Mountain City

Abstract
:1. Introduction
2. Materials and Methods
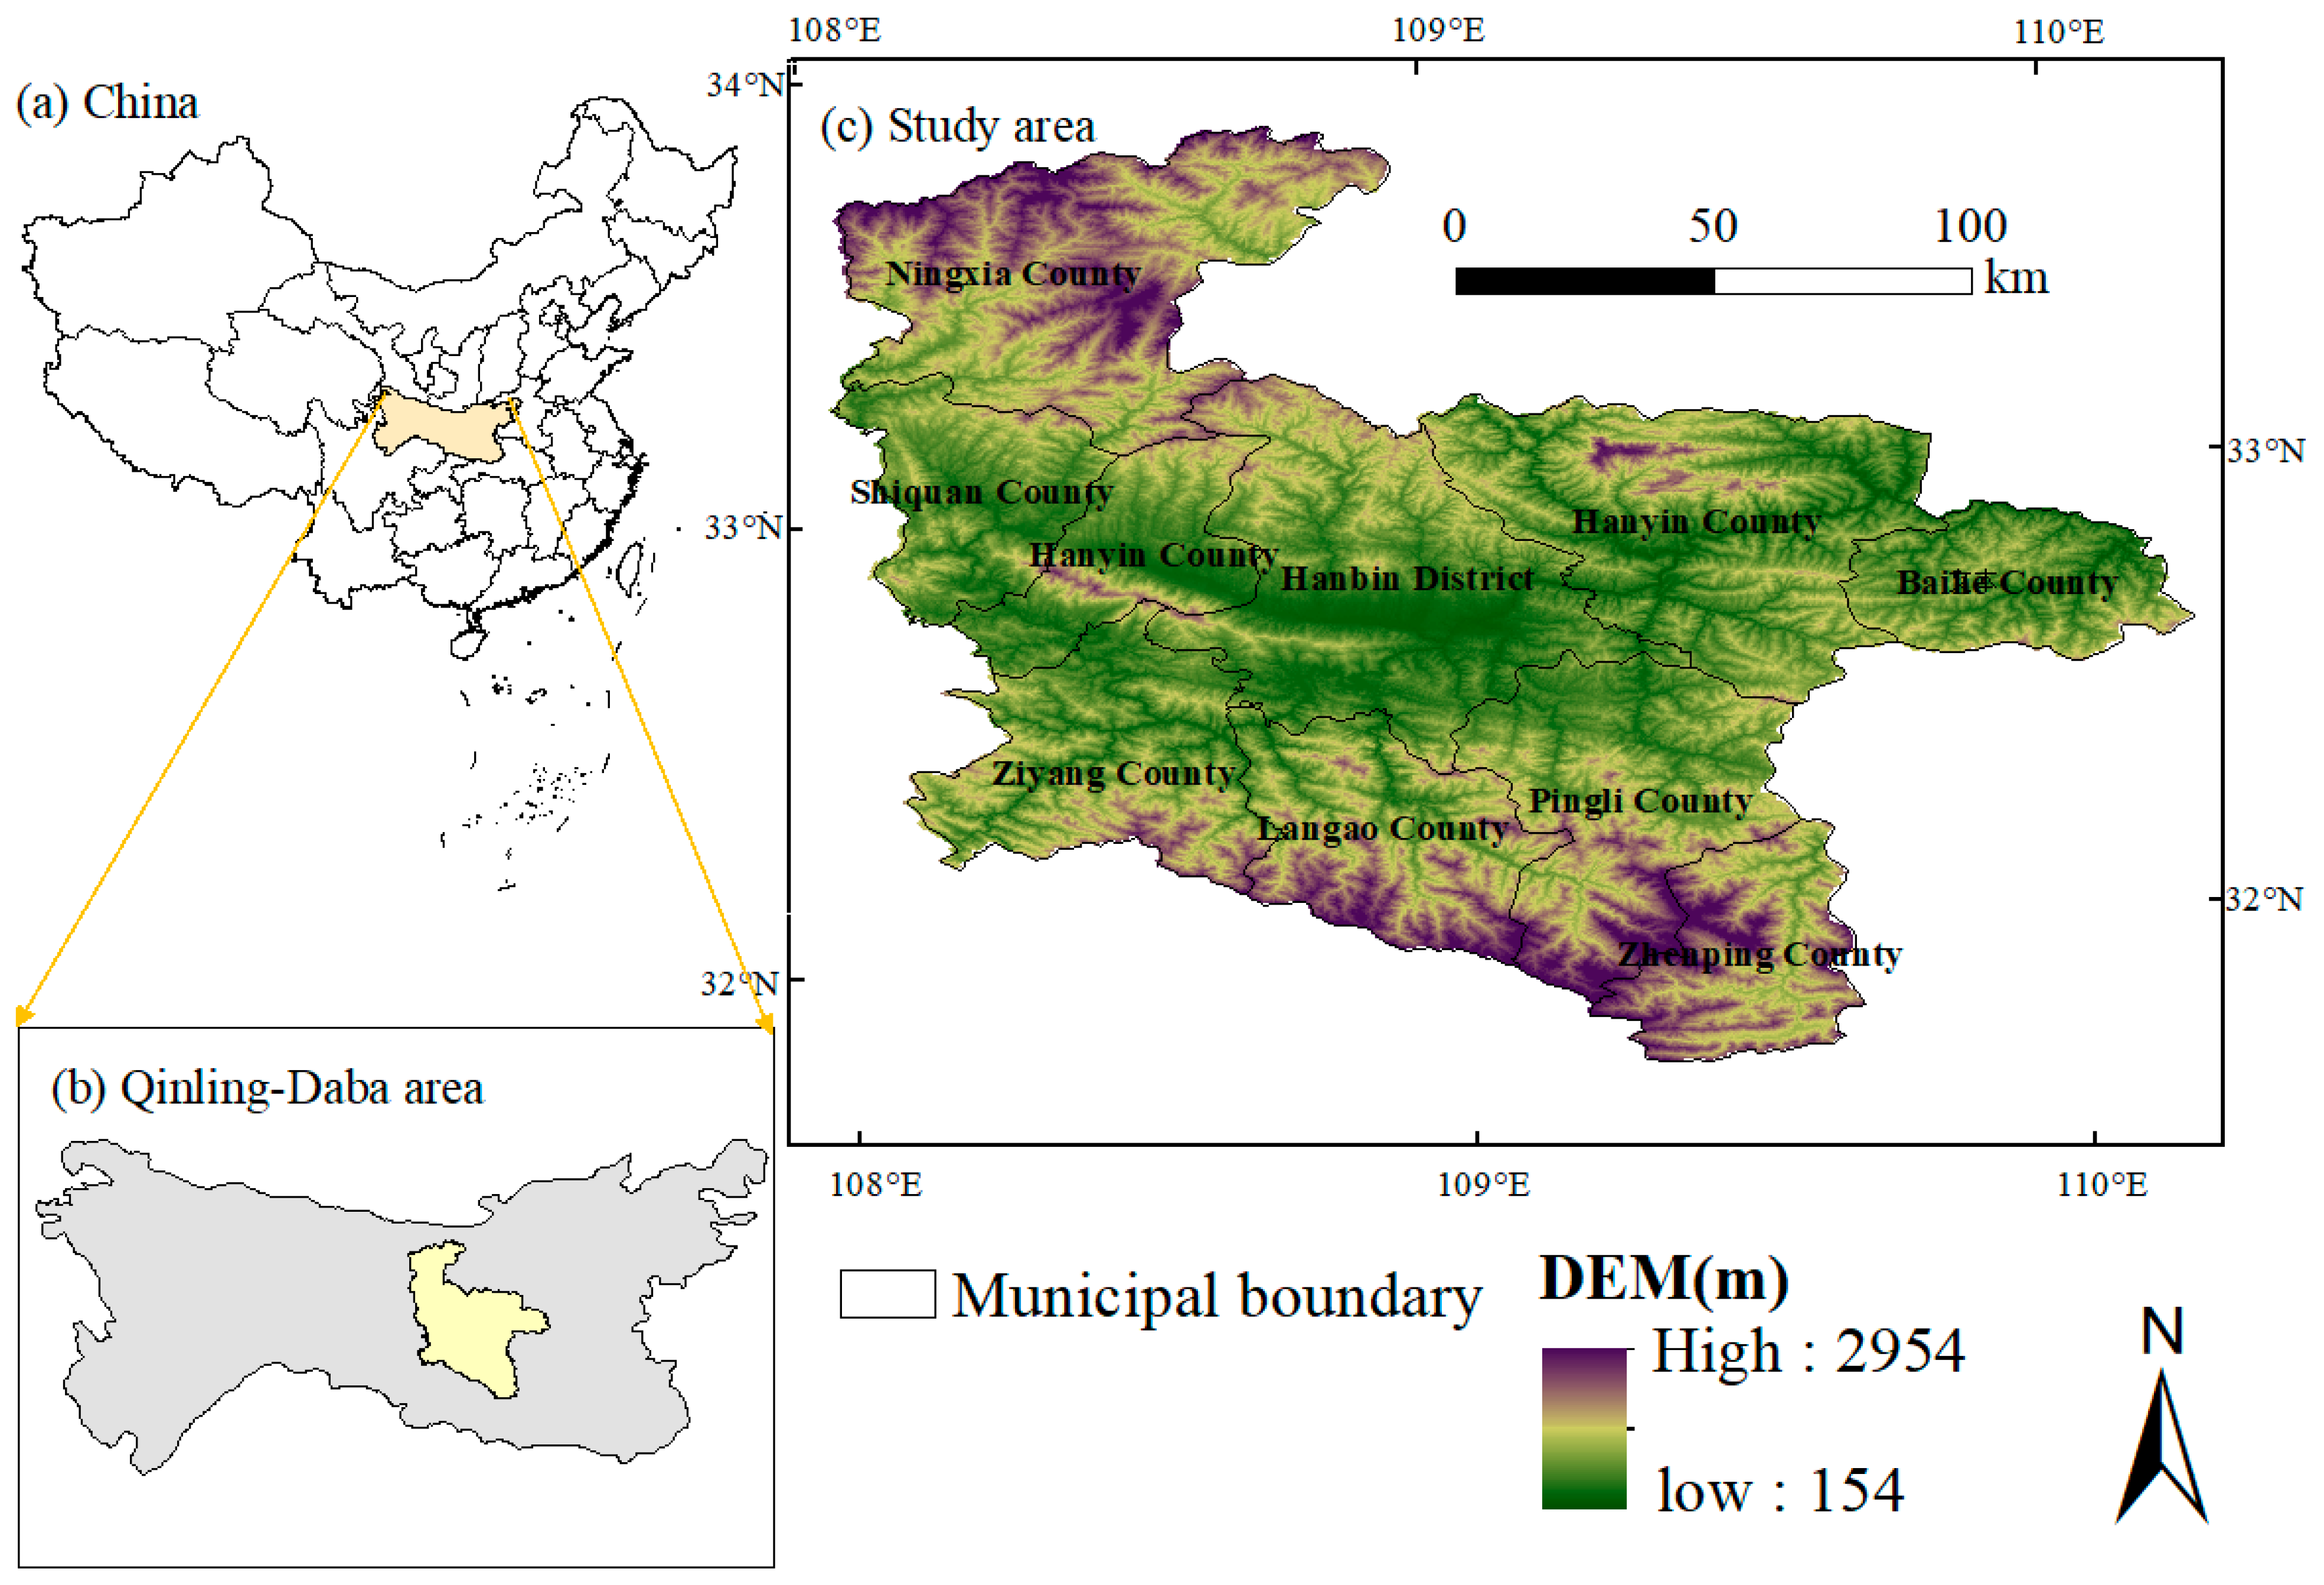
2.1. Study Area
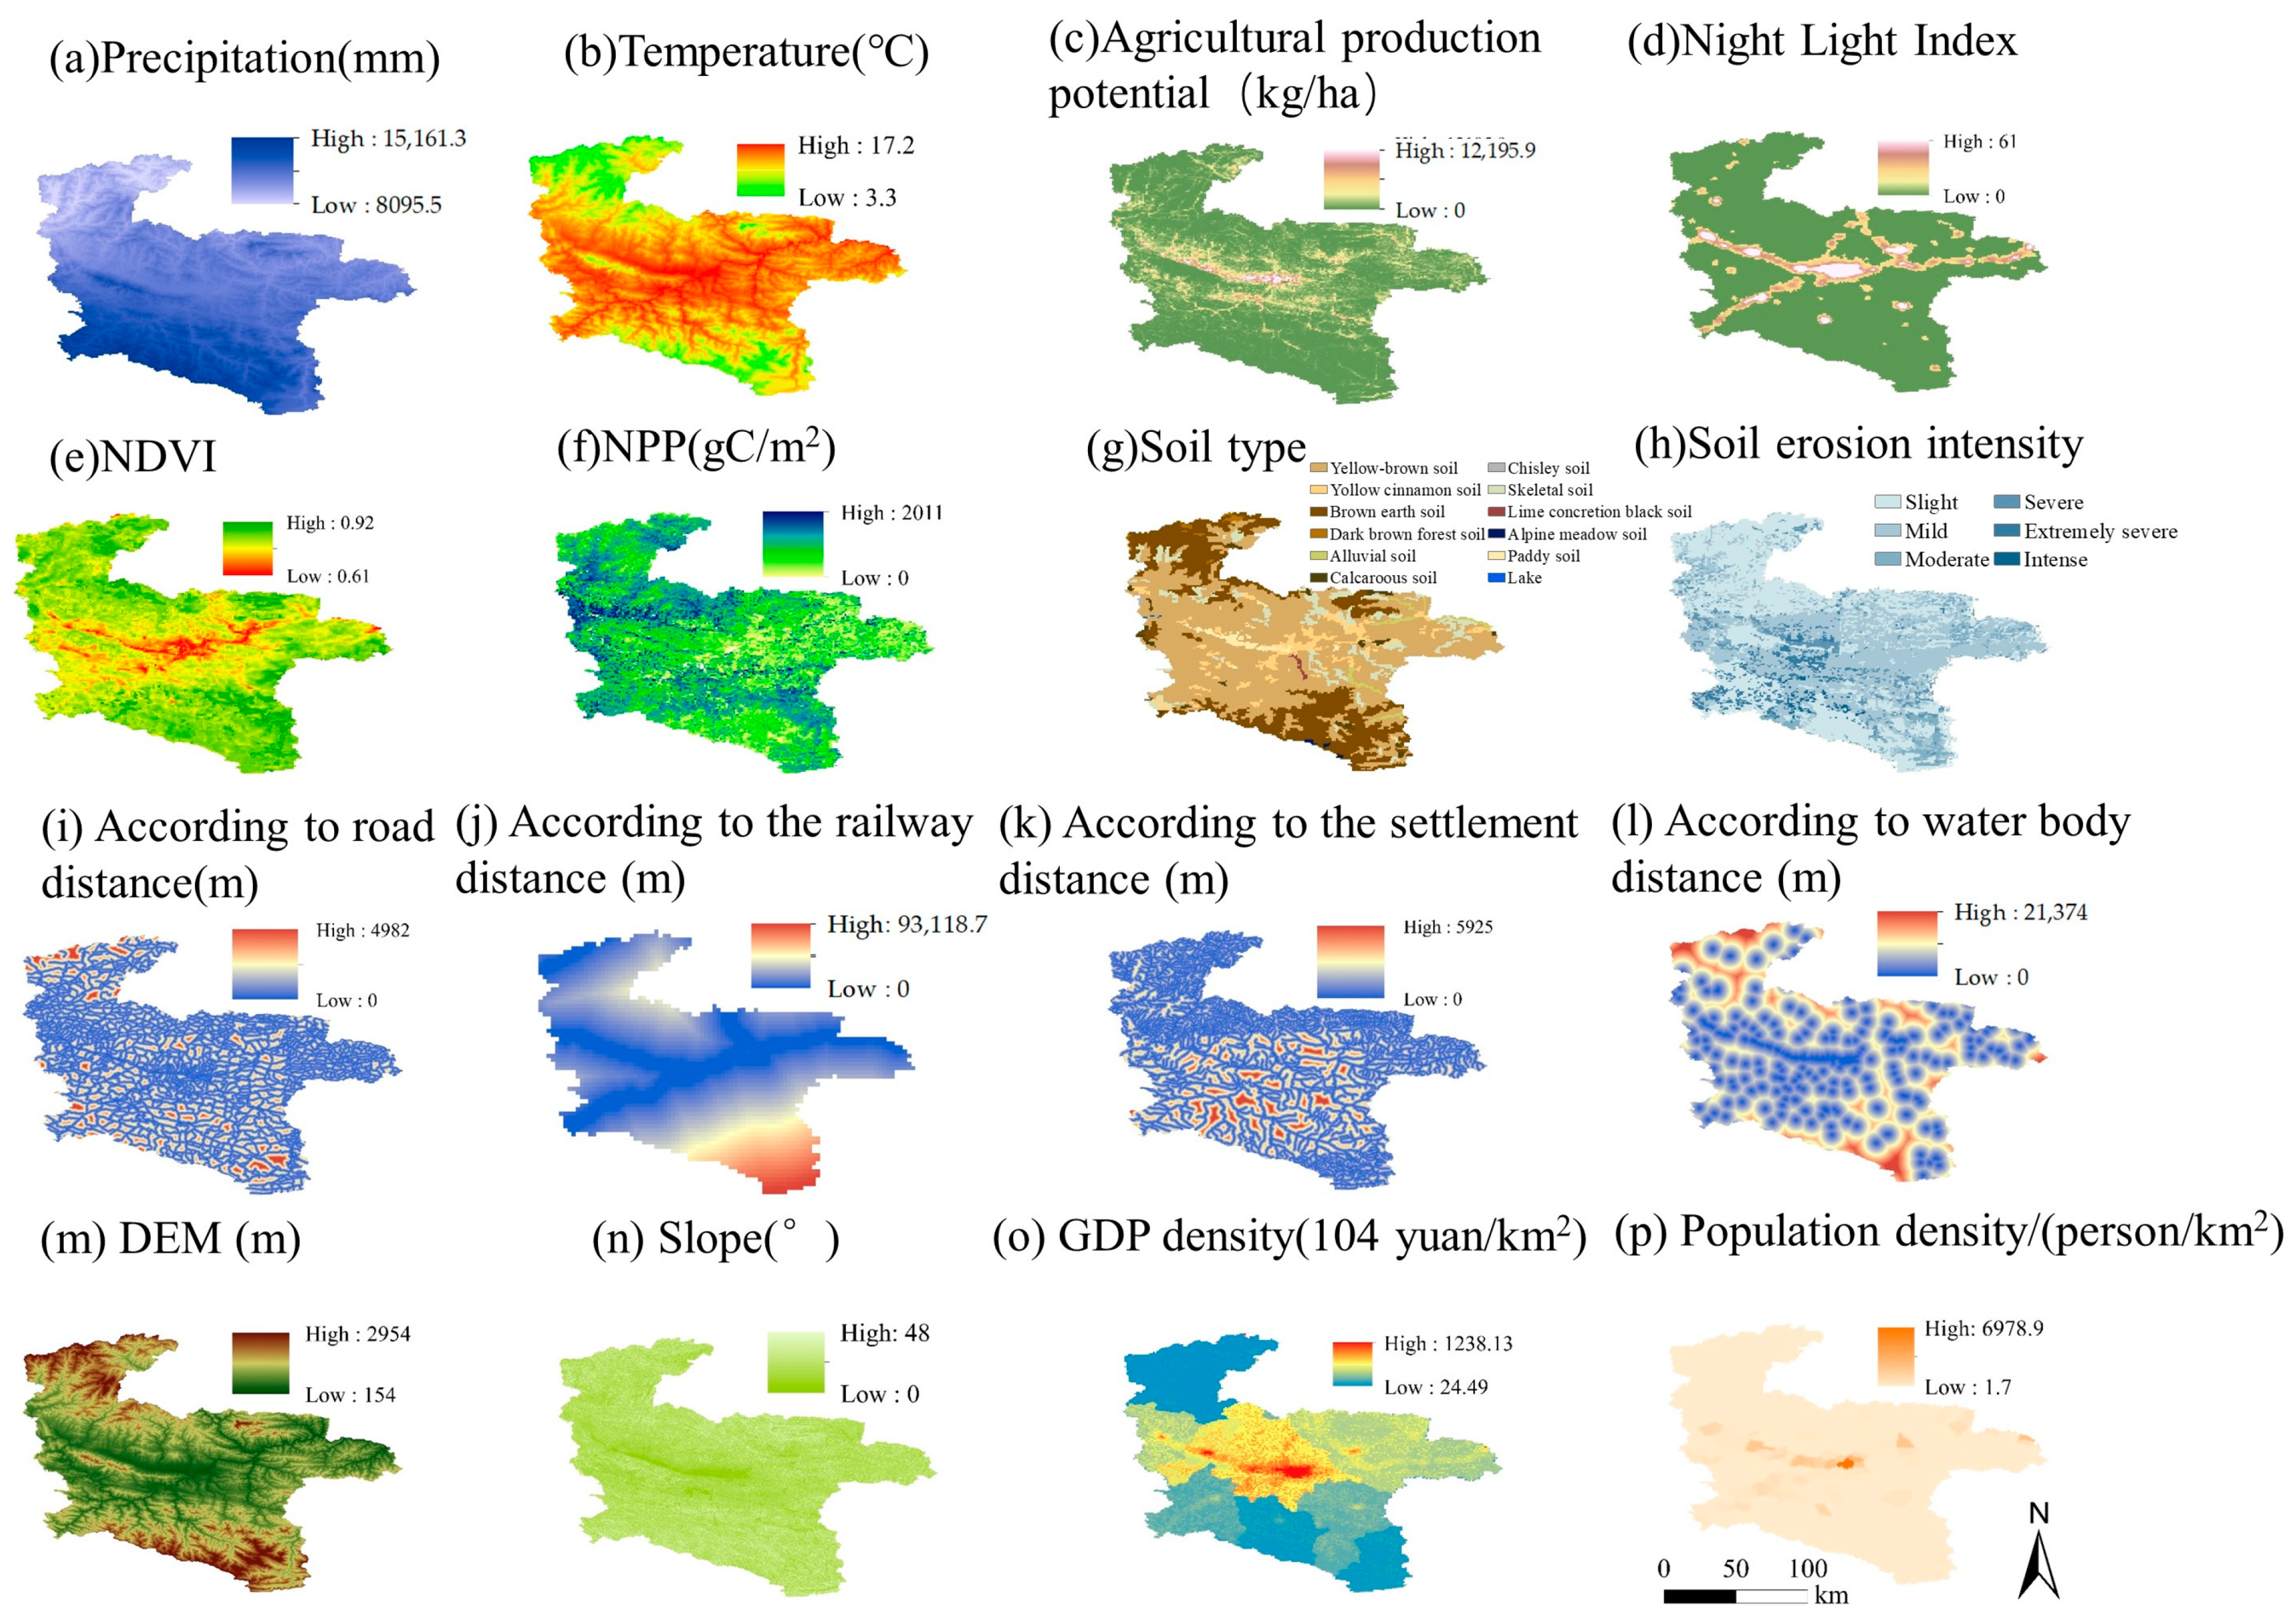
2.2. Data Sources
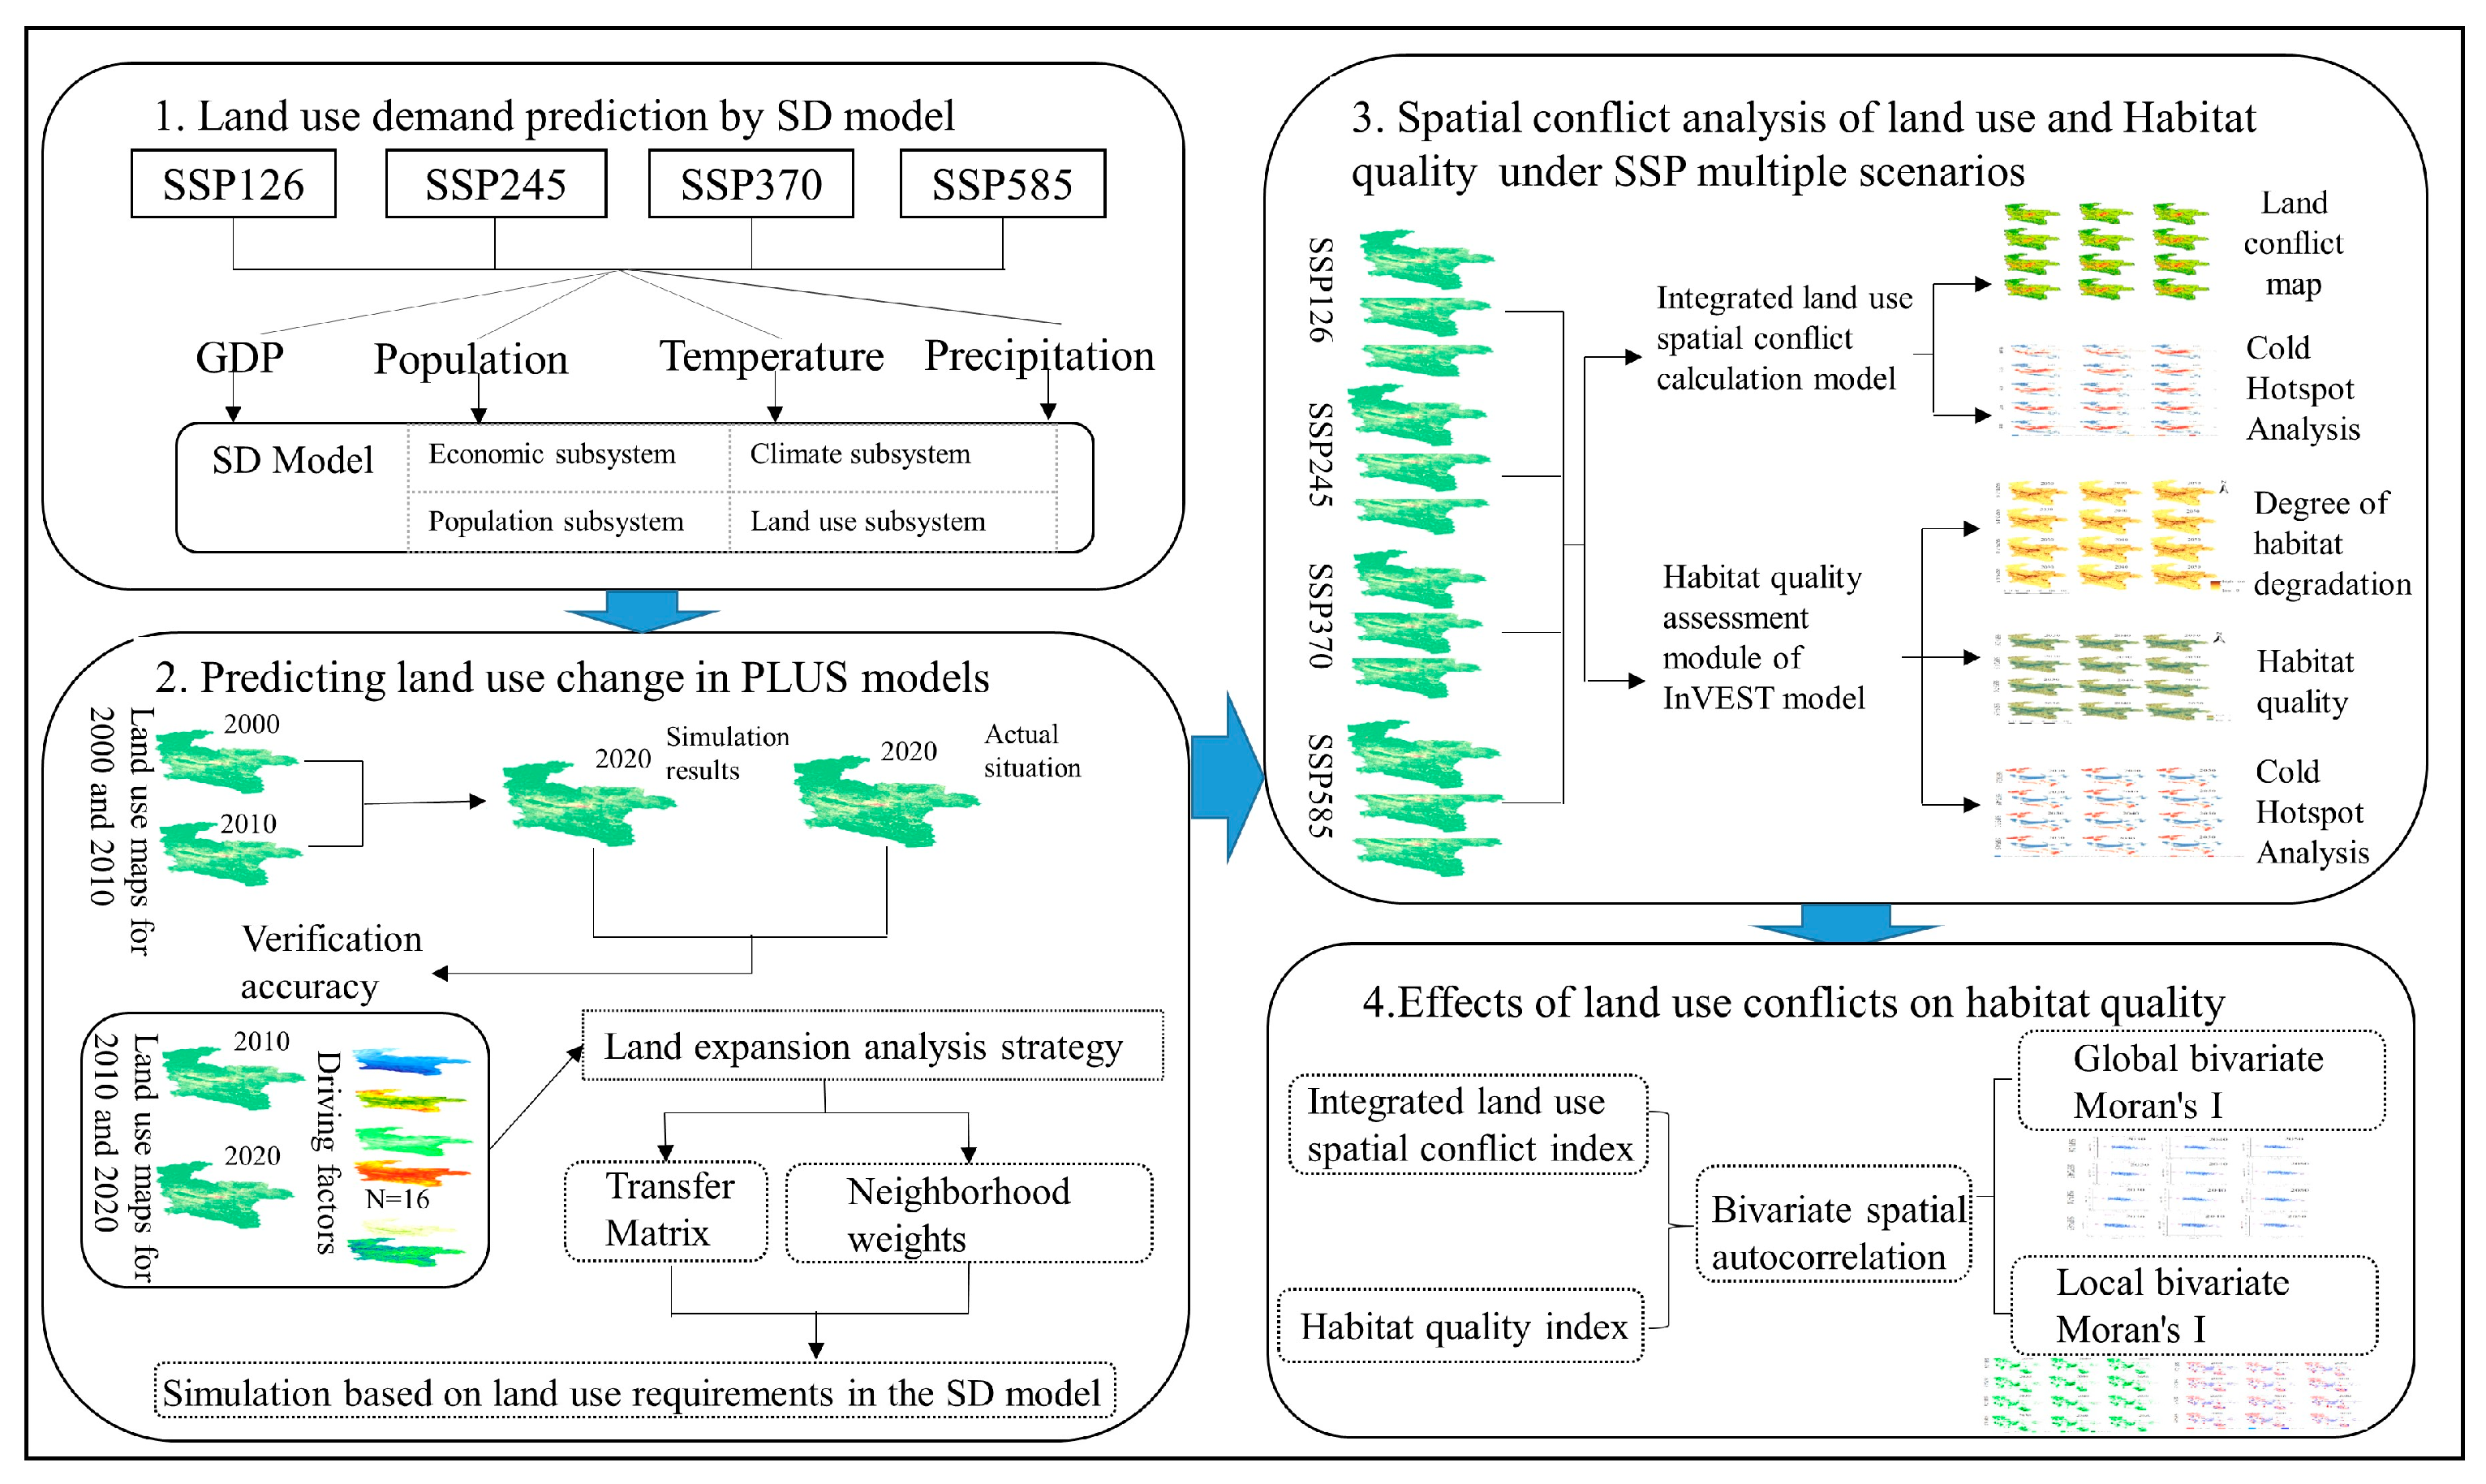
2.3. Research Methods
2.3.1. SSPs-RCPs Scenarios
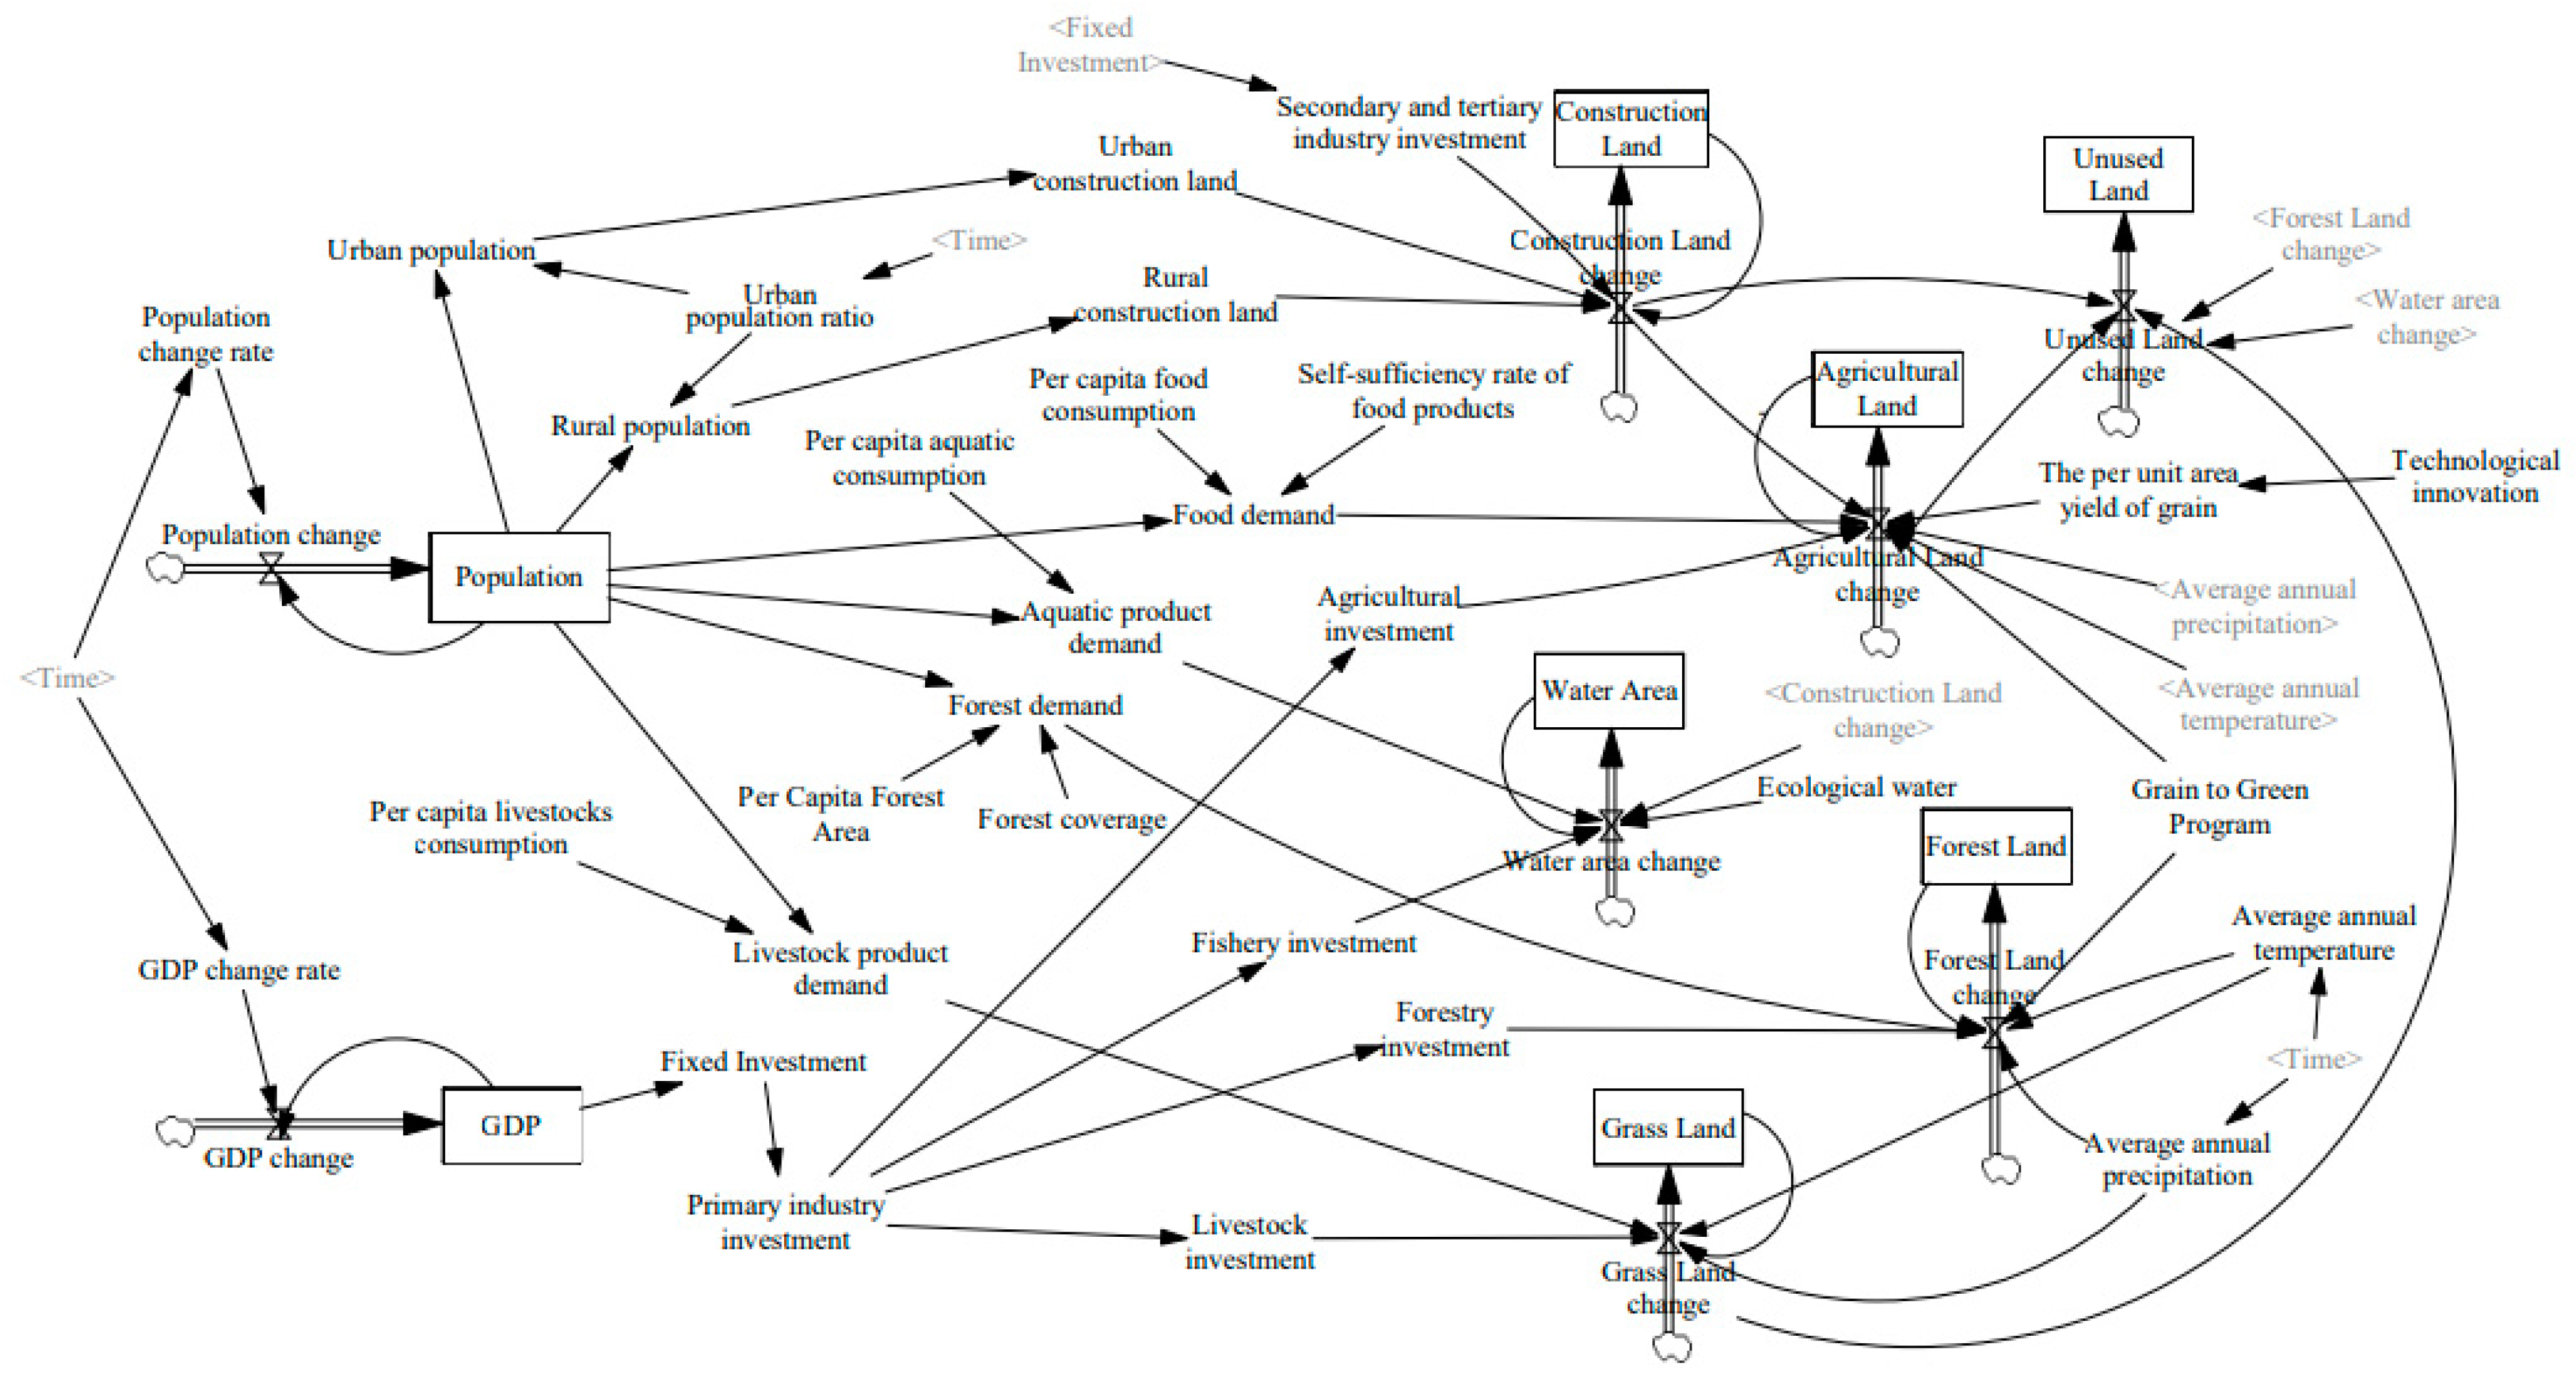
2.3.2. System Dynamics Model
2.3.3. PLUS Model
2.3.4. Land Use Conflict Measurement Model
2.3.5. InVEST Model
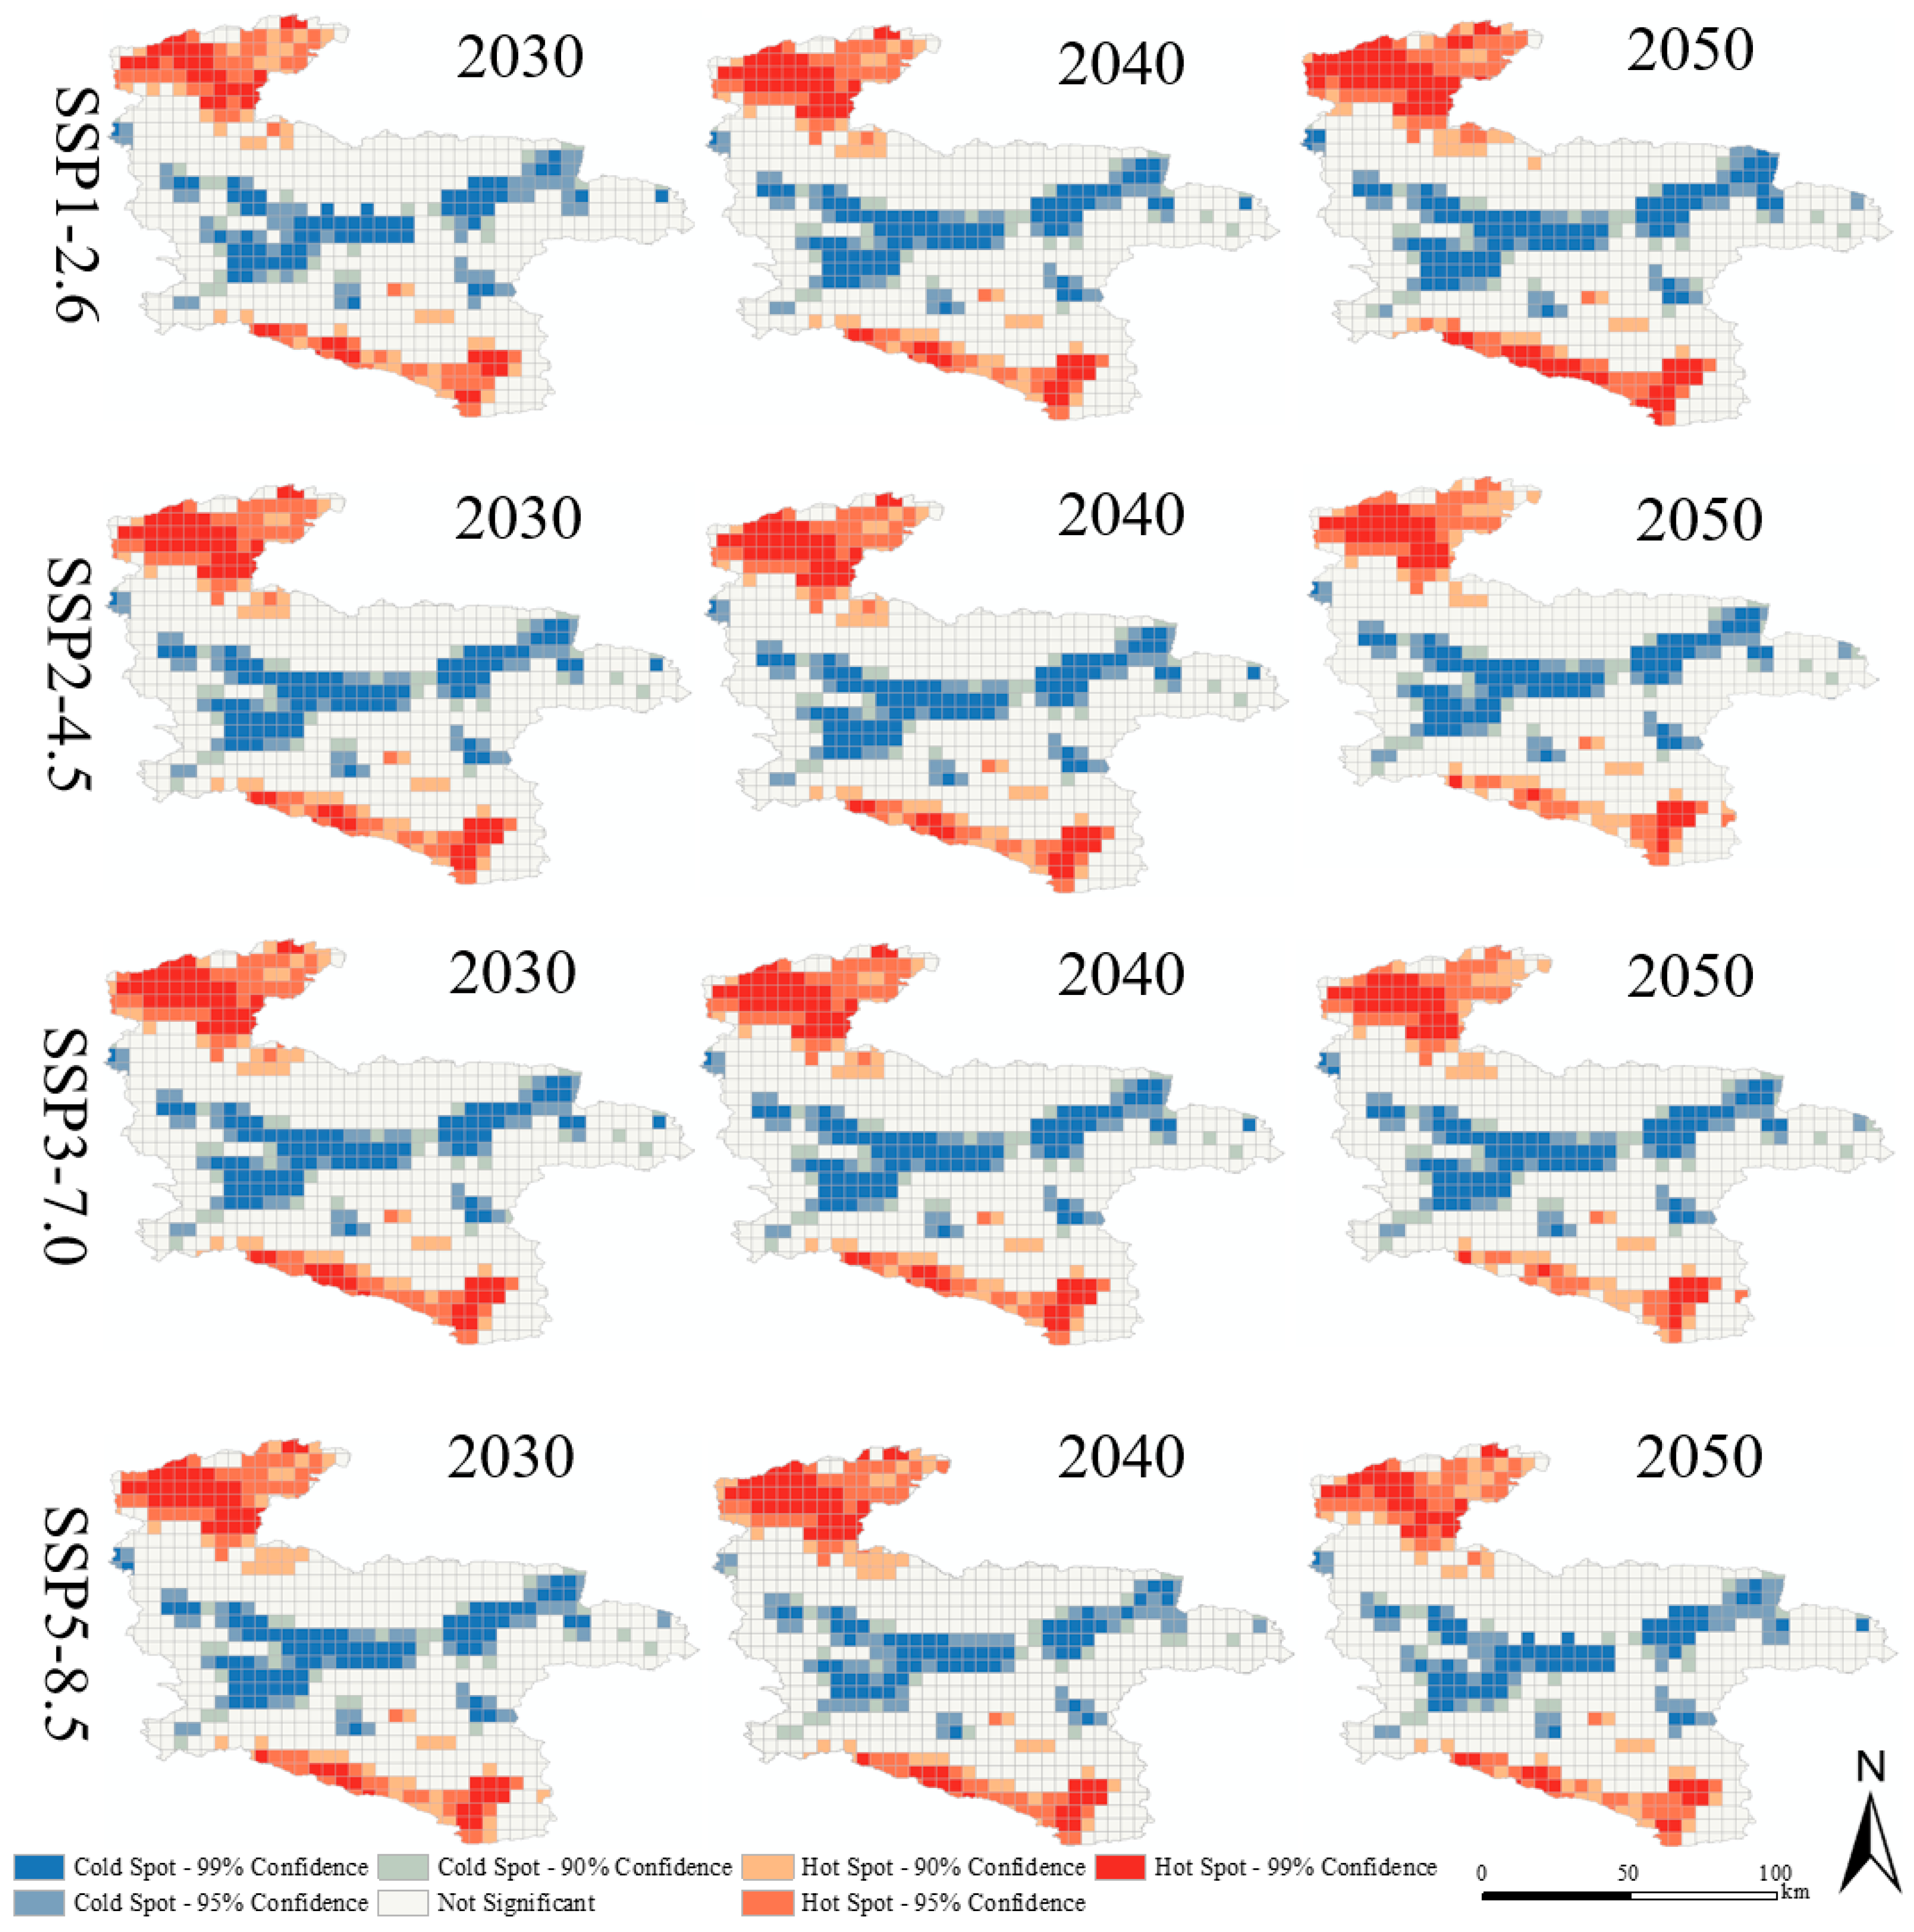
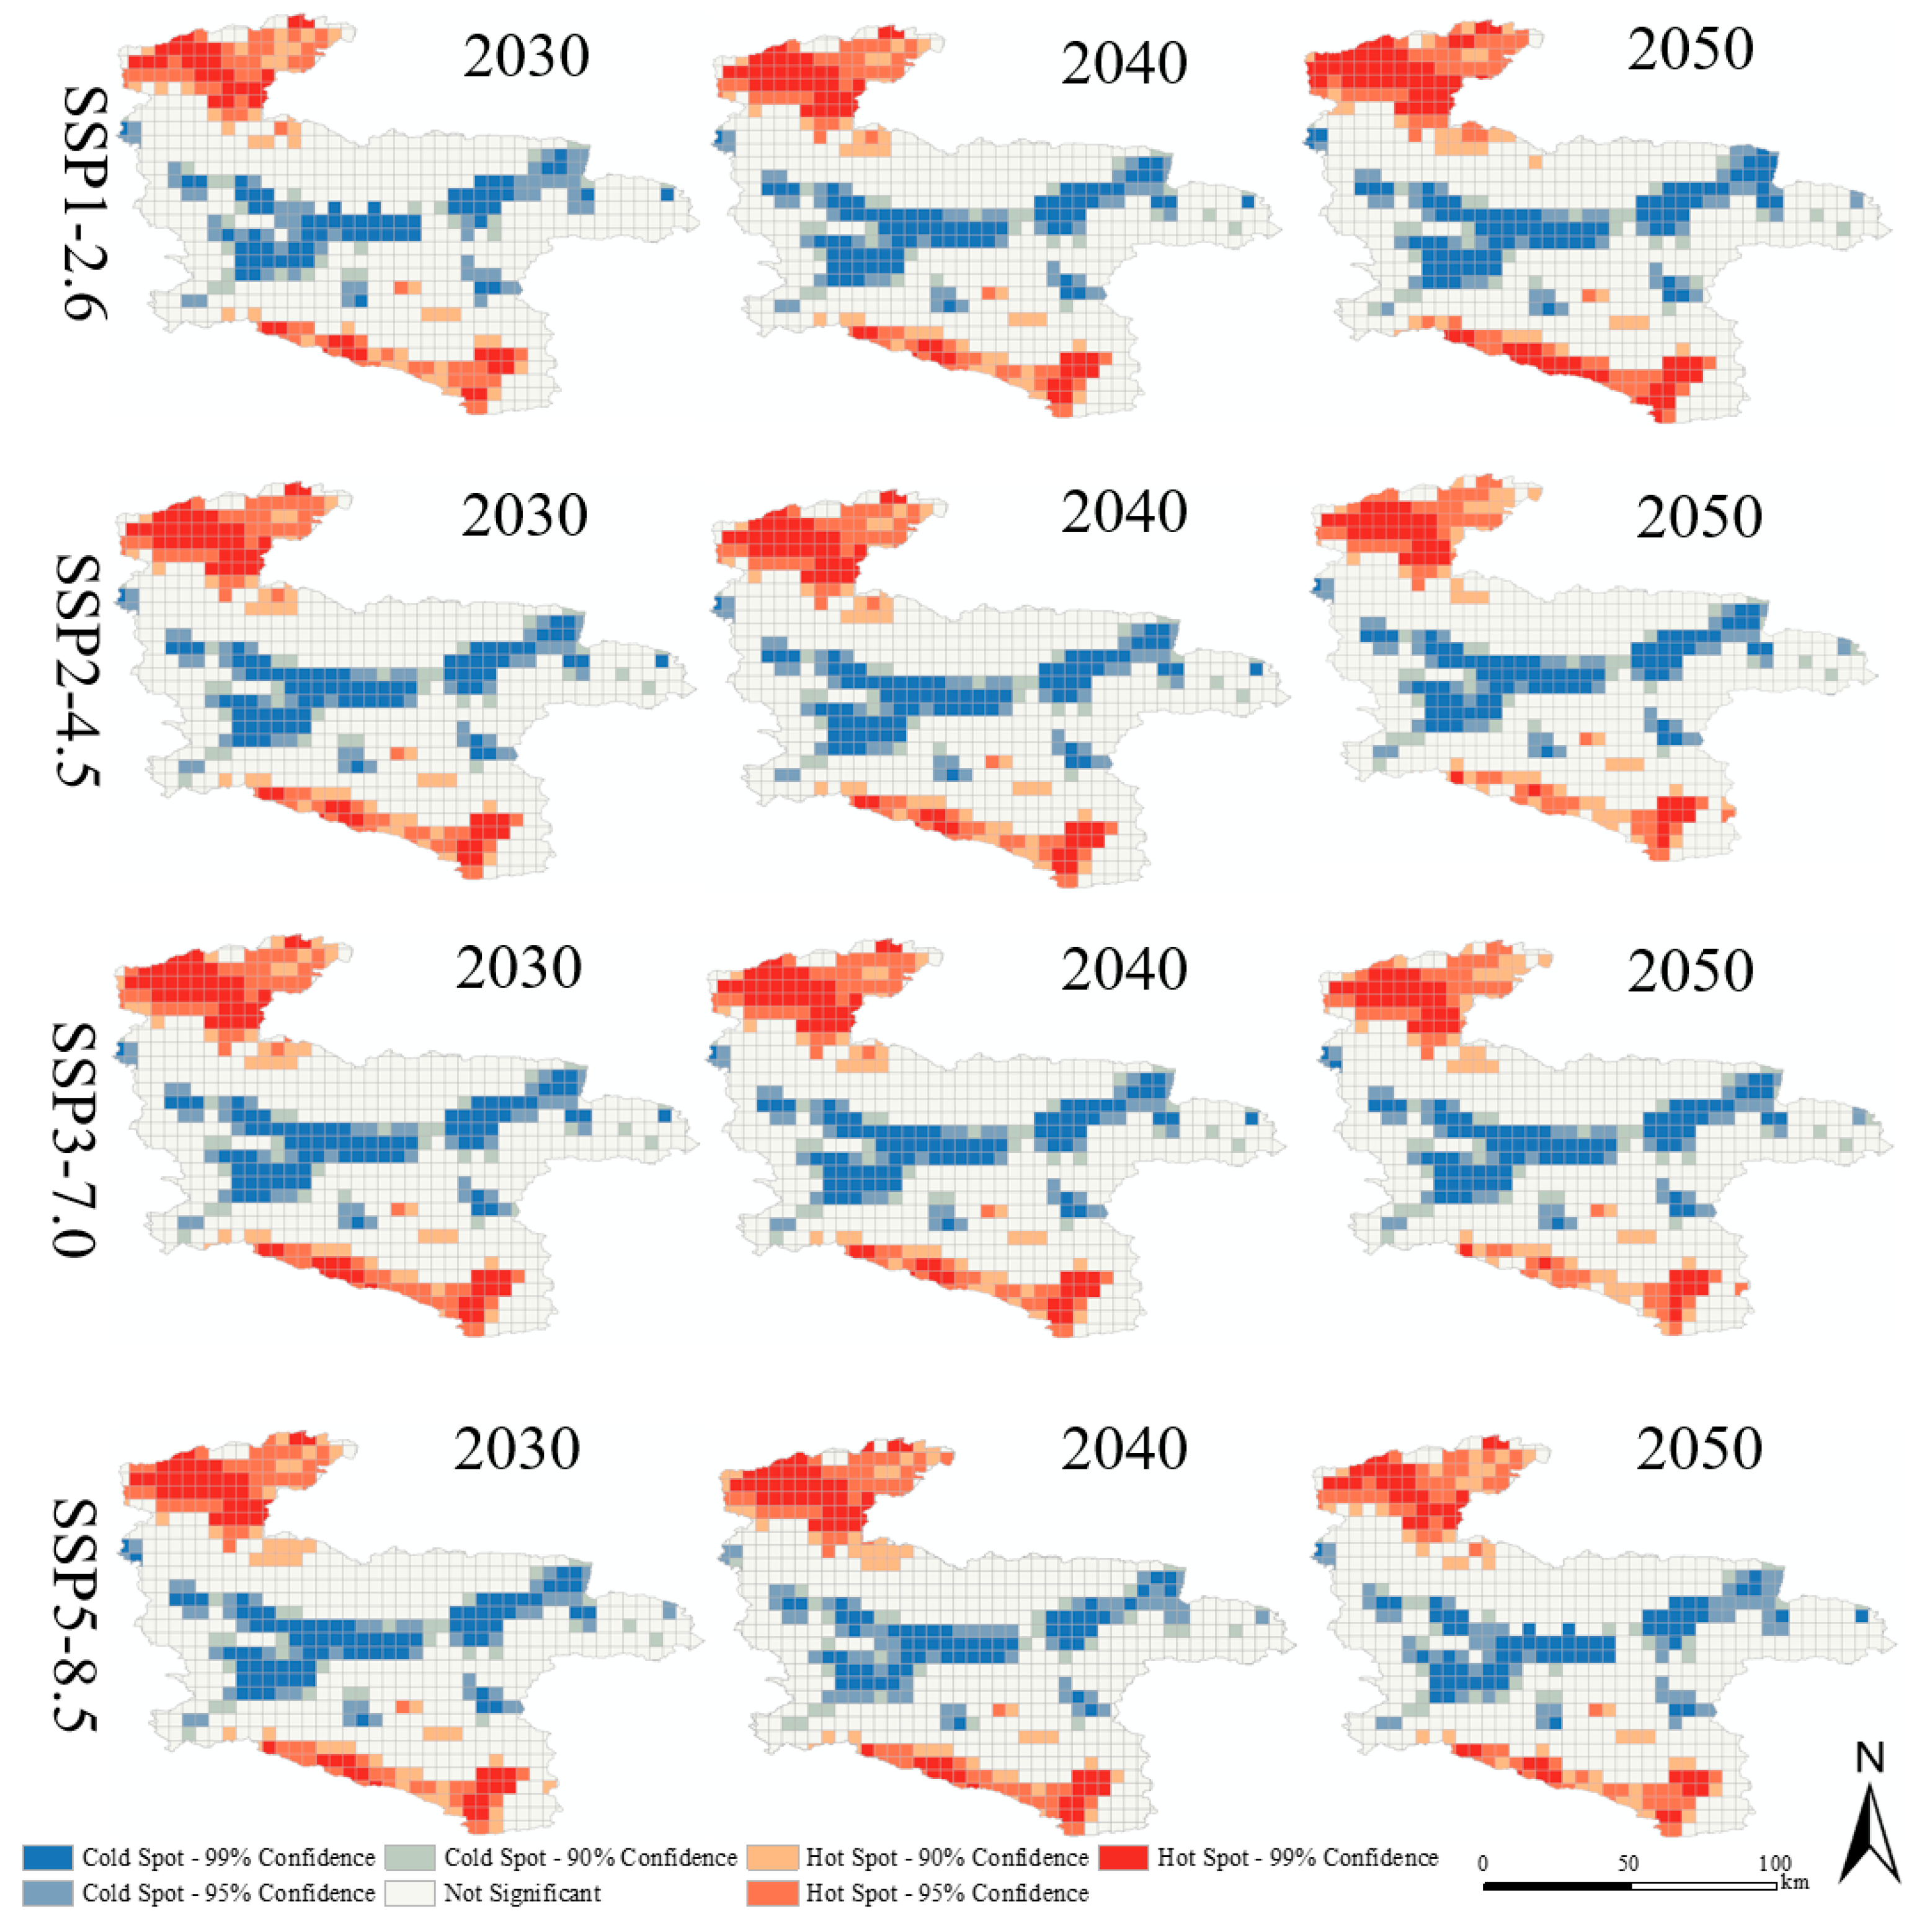
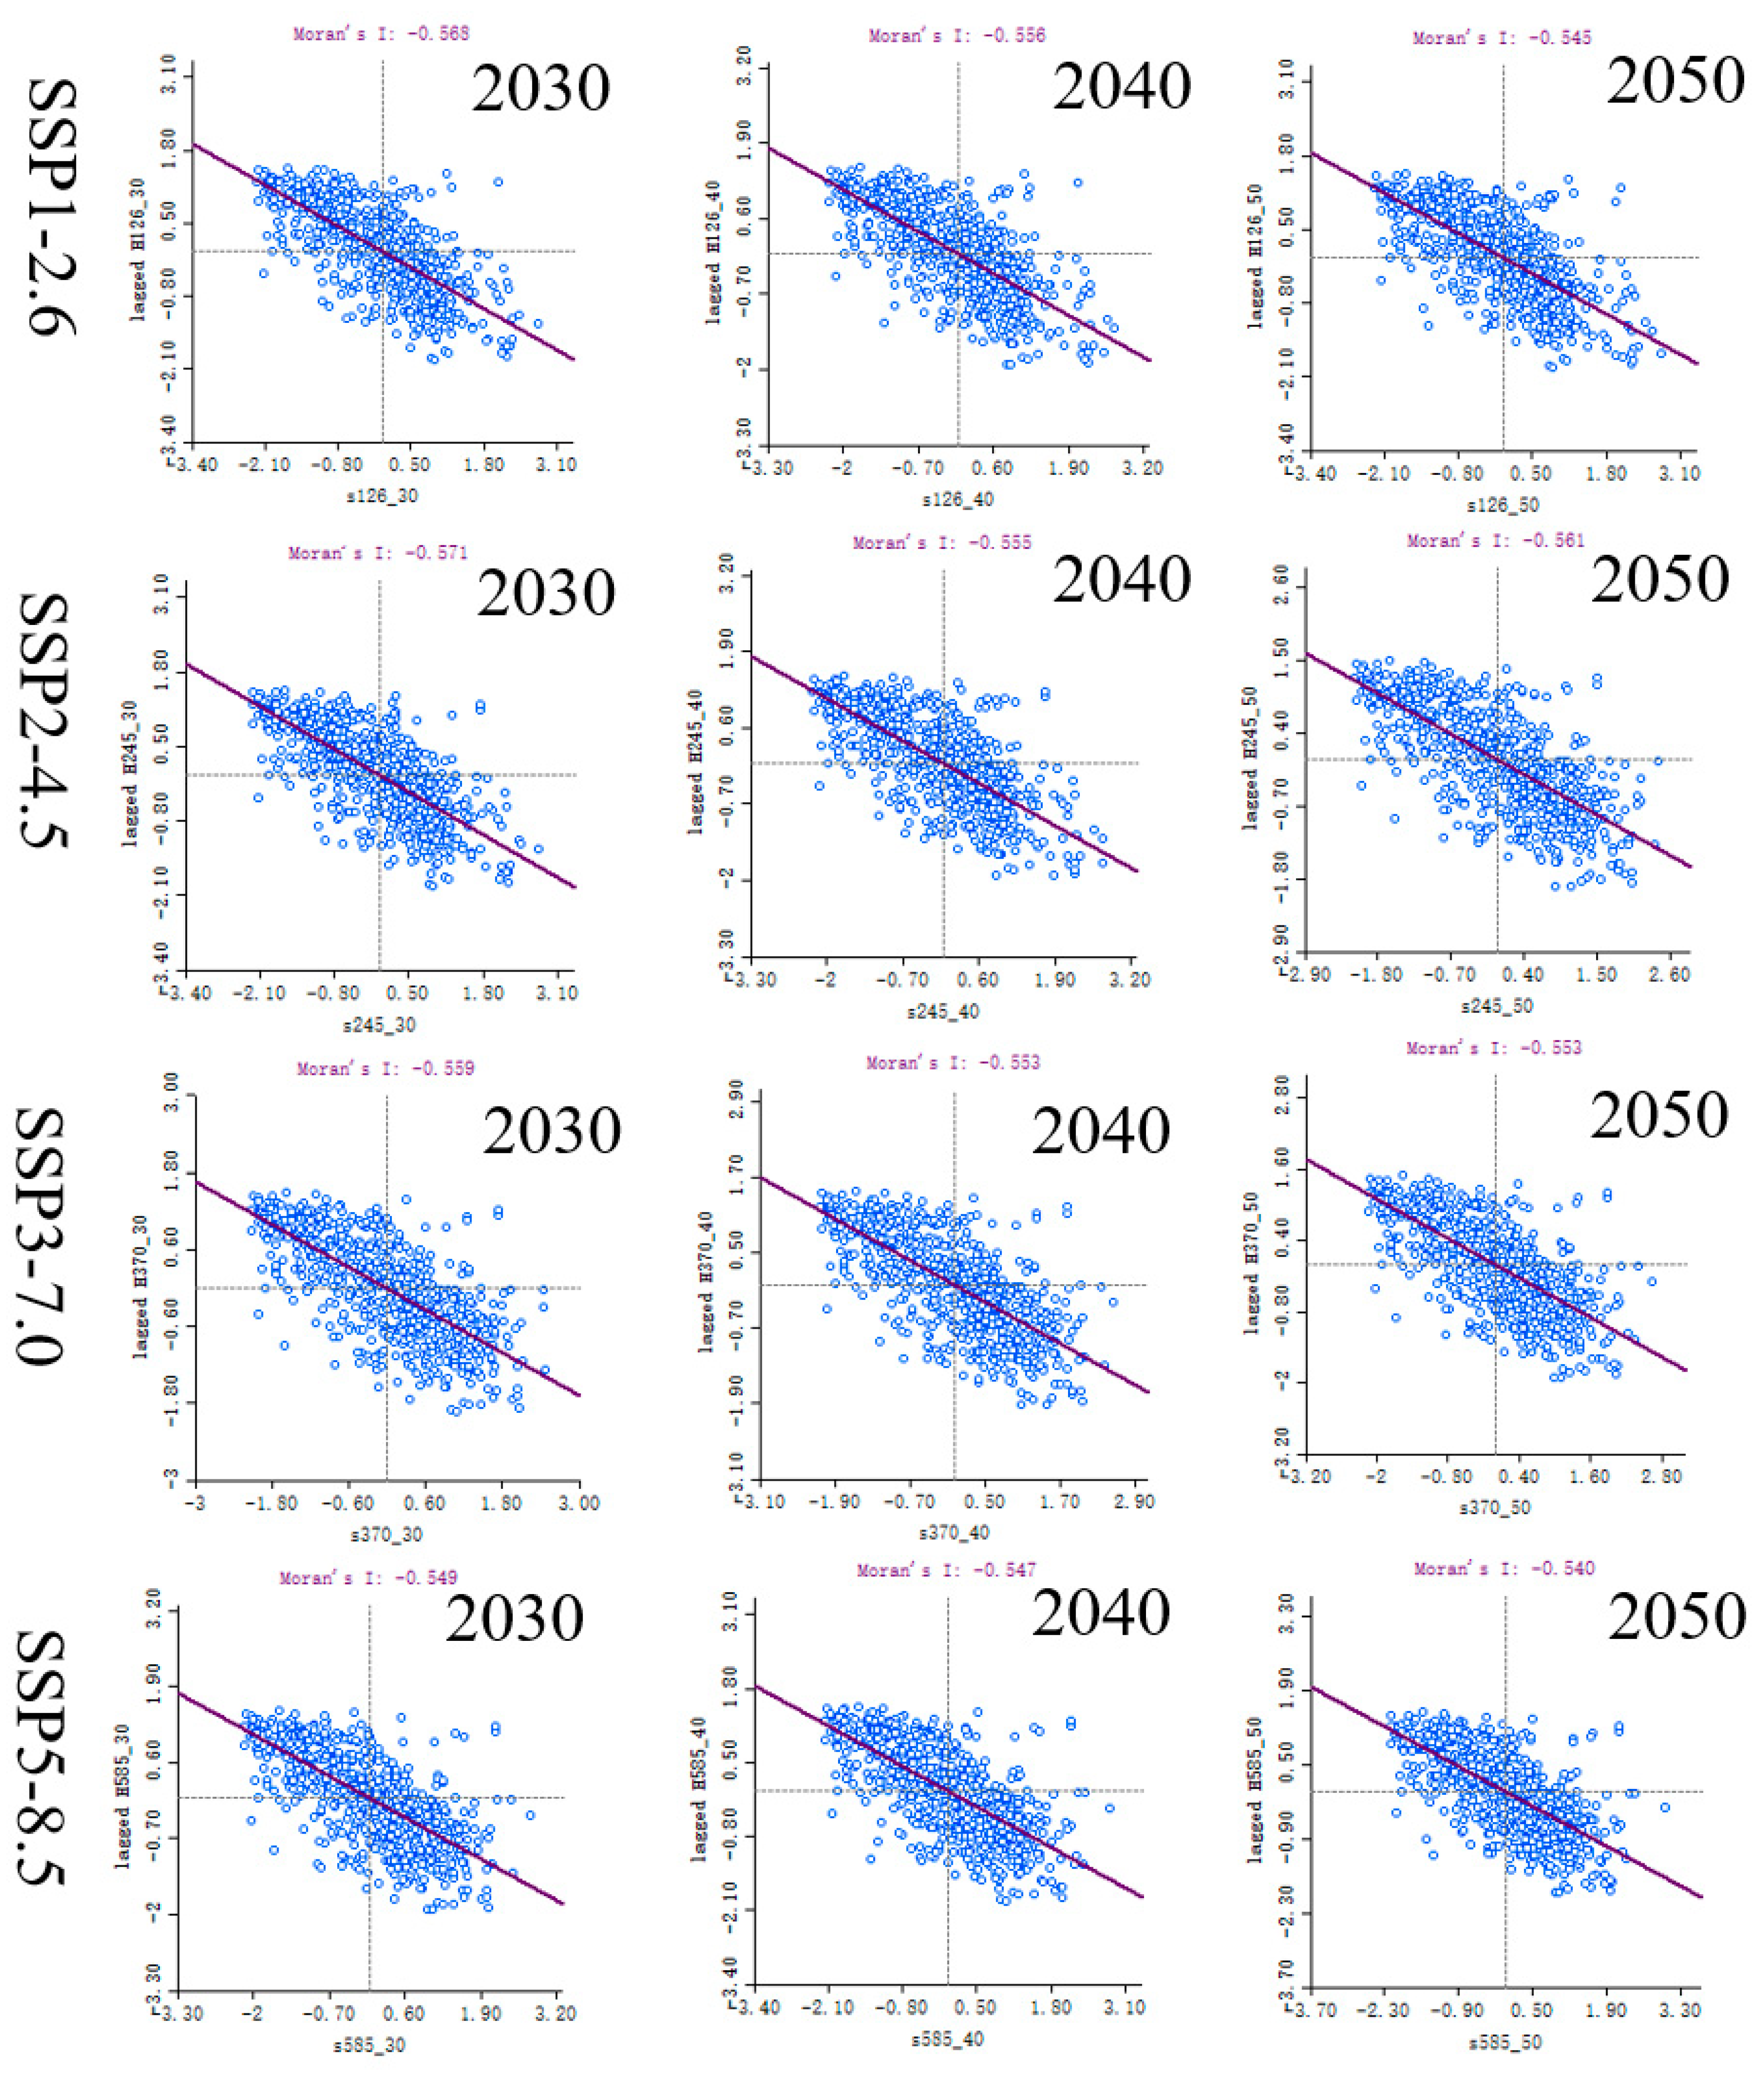
2.3.6. Spatial Heterogeneity Analysis of Land Use
3. Results
3.1. Land Use Analysis
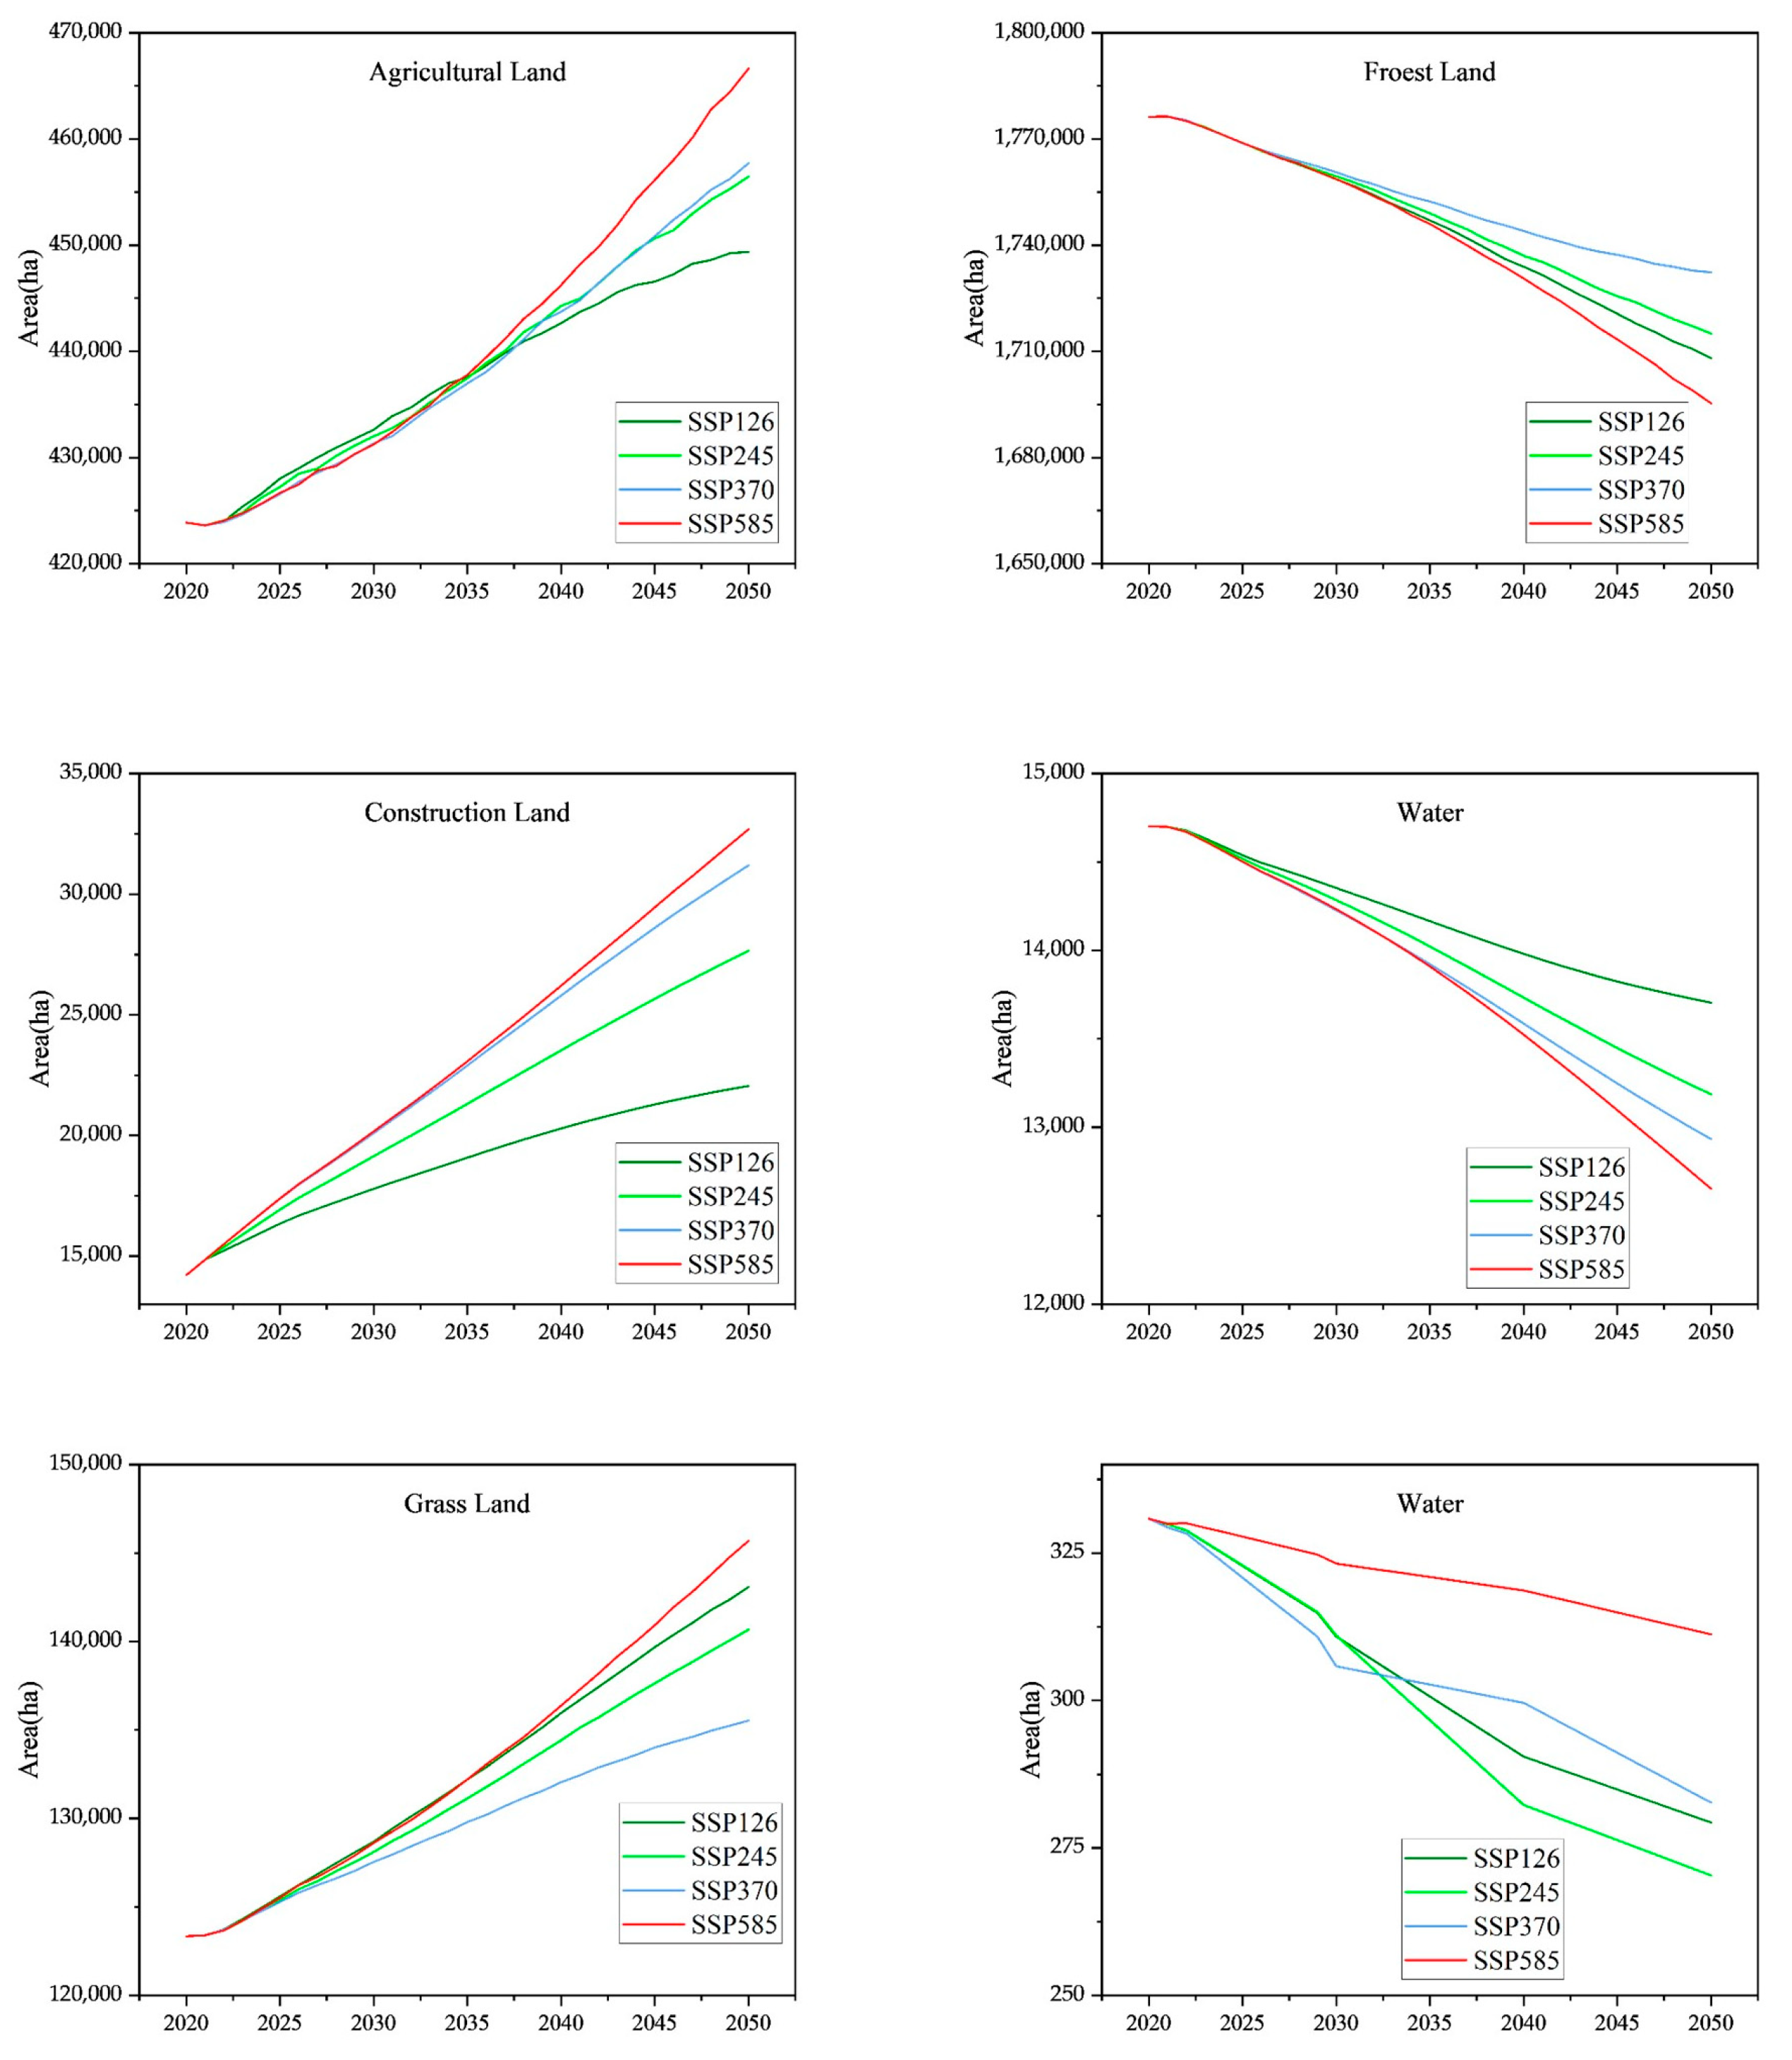
3.1.1. Land Use Demand Prediction in Ankang Based on the SD Model
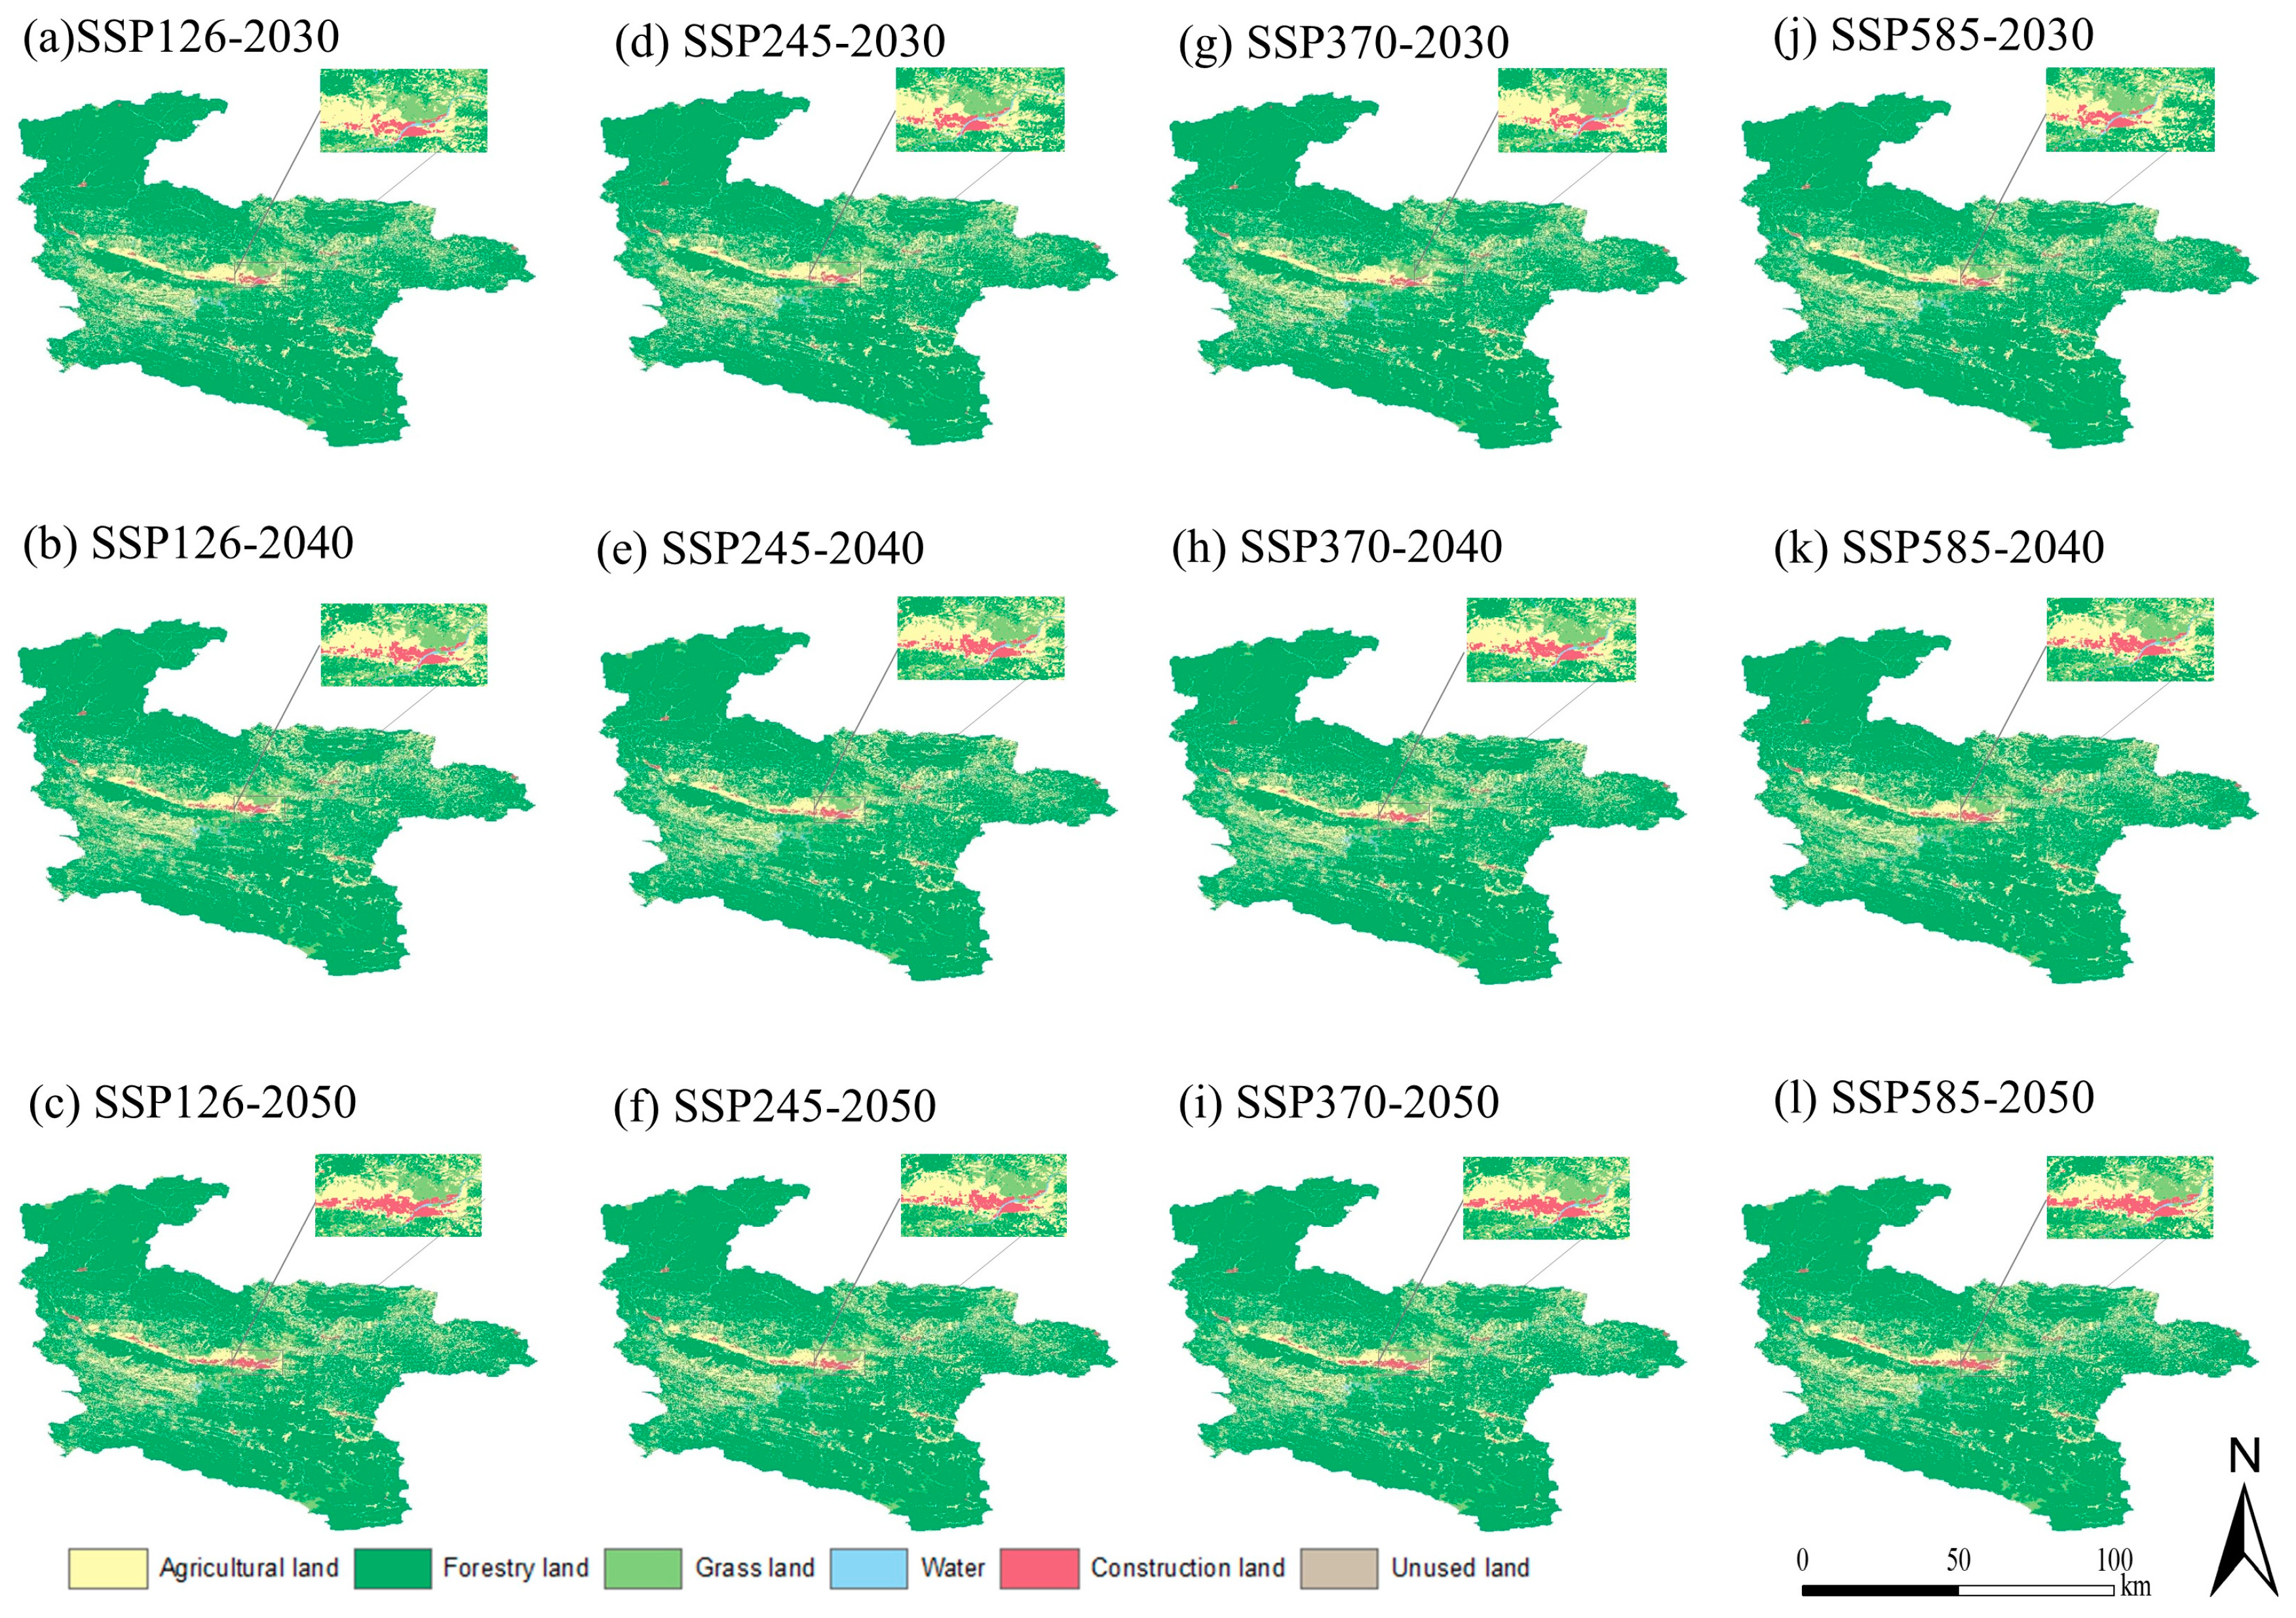
3.1.2. The PLUS Model Simulates the Future Land Use Distribution in Ankang
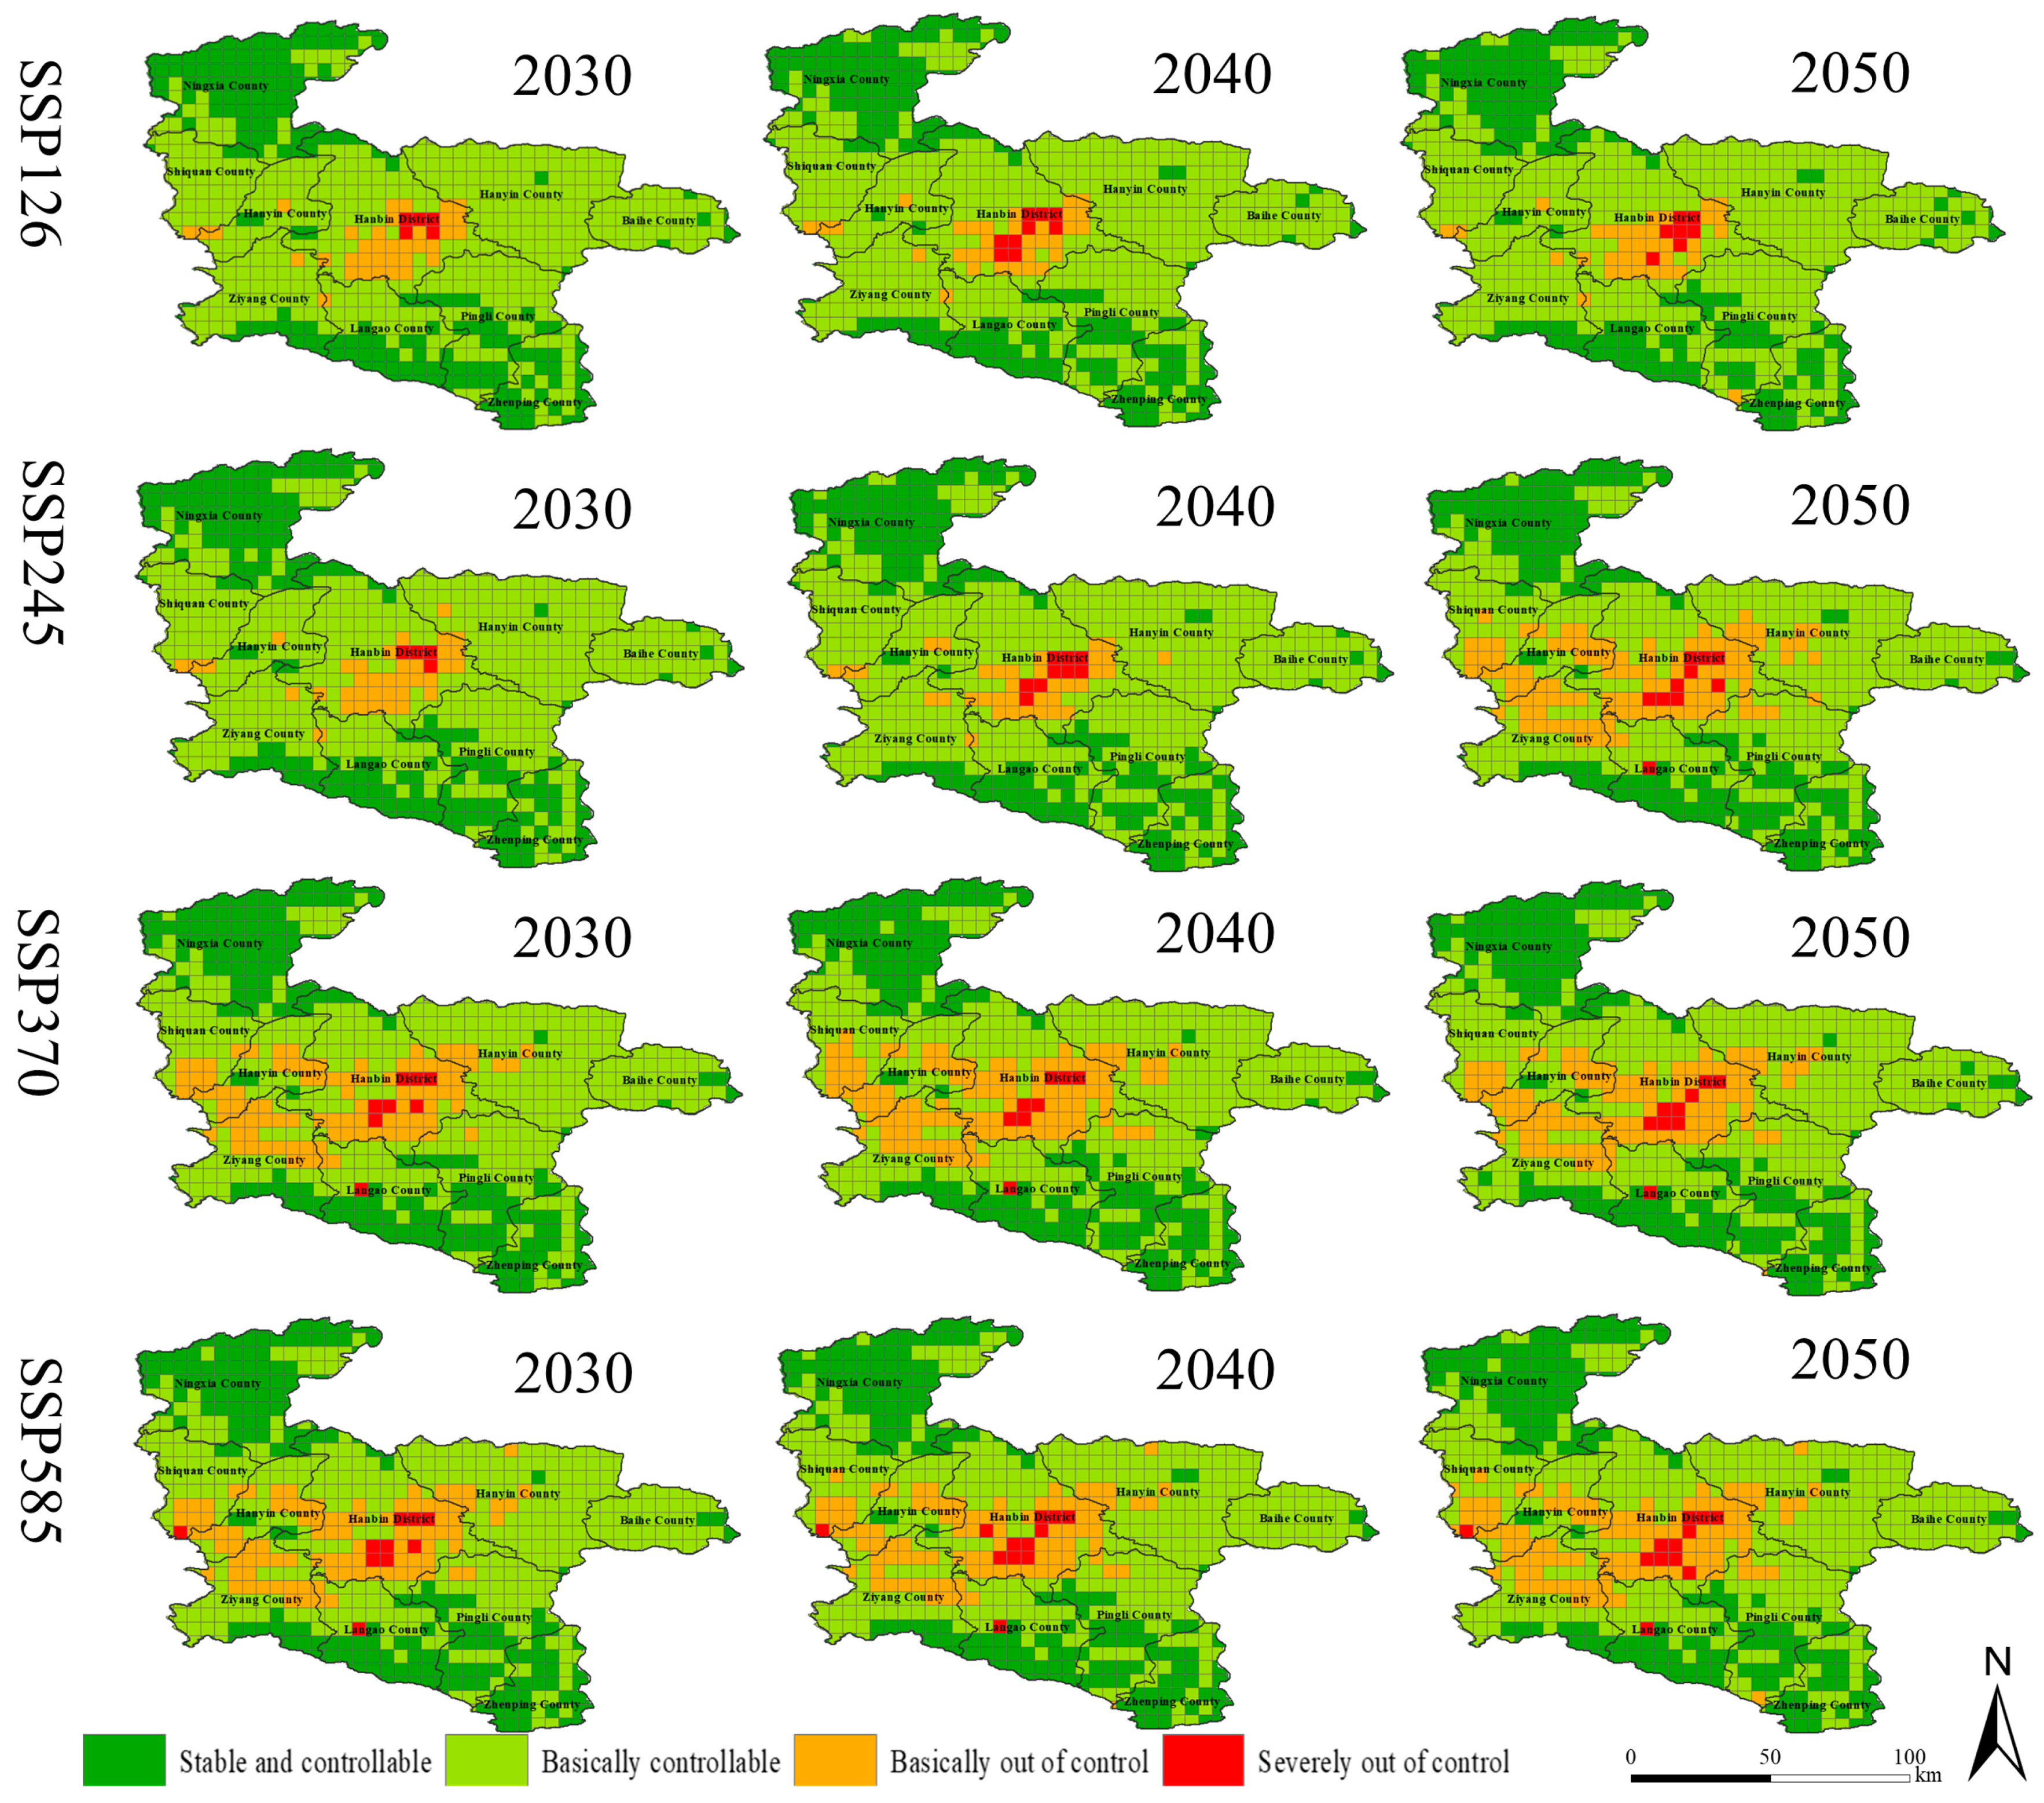
3.1.3. Spatial and Temporal Analysis of Land Use Conflicts in Ankang
3.2. Habitat Quality Analysis
3.2.1. Habitat Quality Classes in Ankang
3.2.2. Habitat Quality Spatial Distribution Characteristics
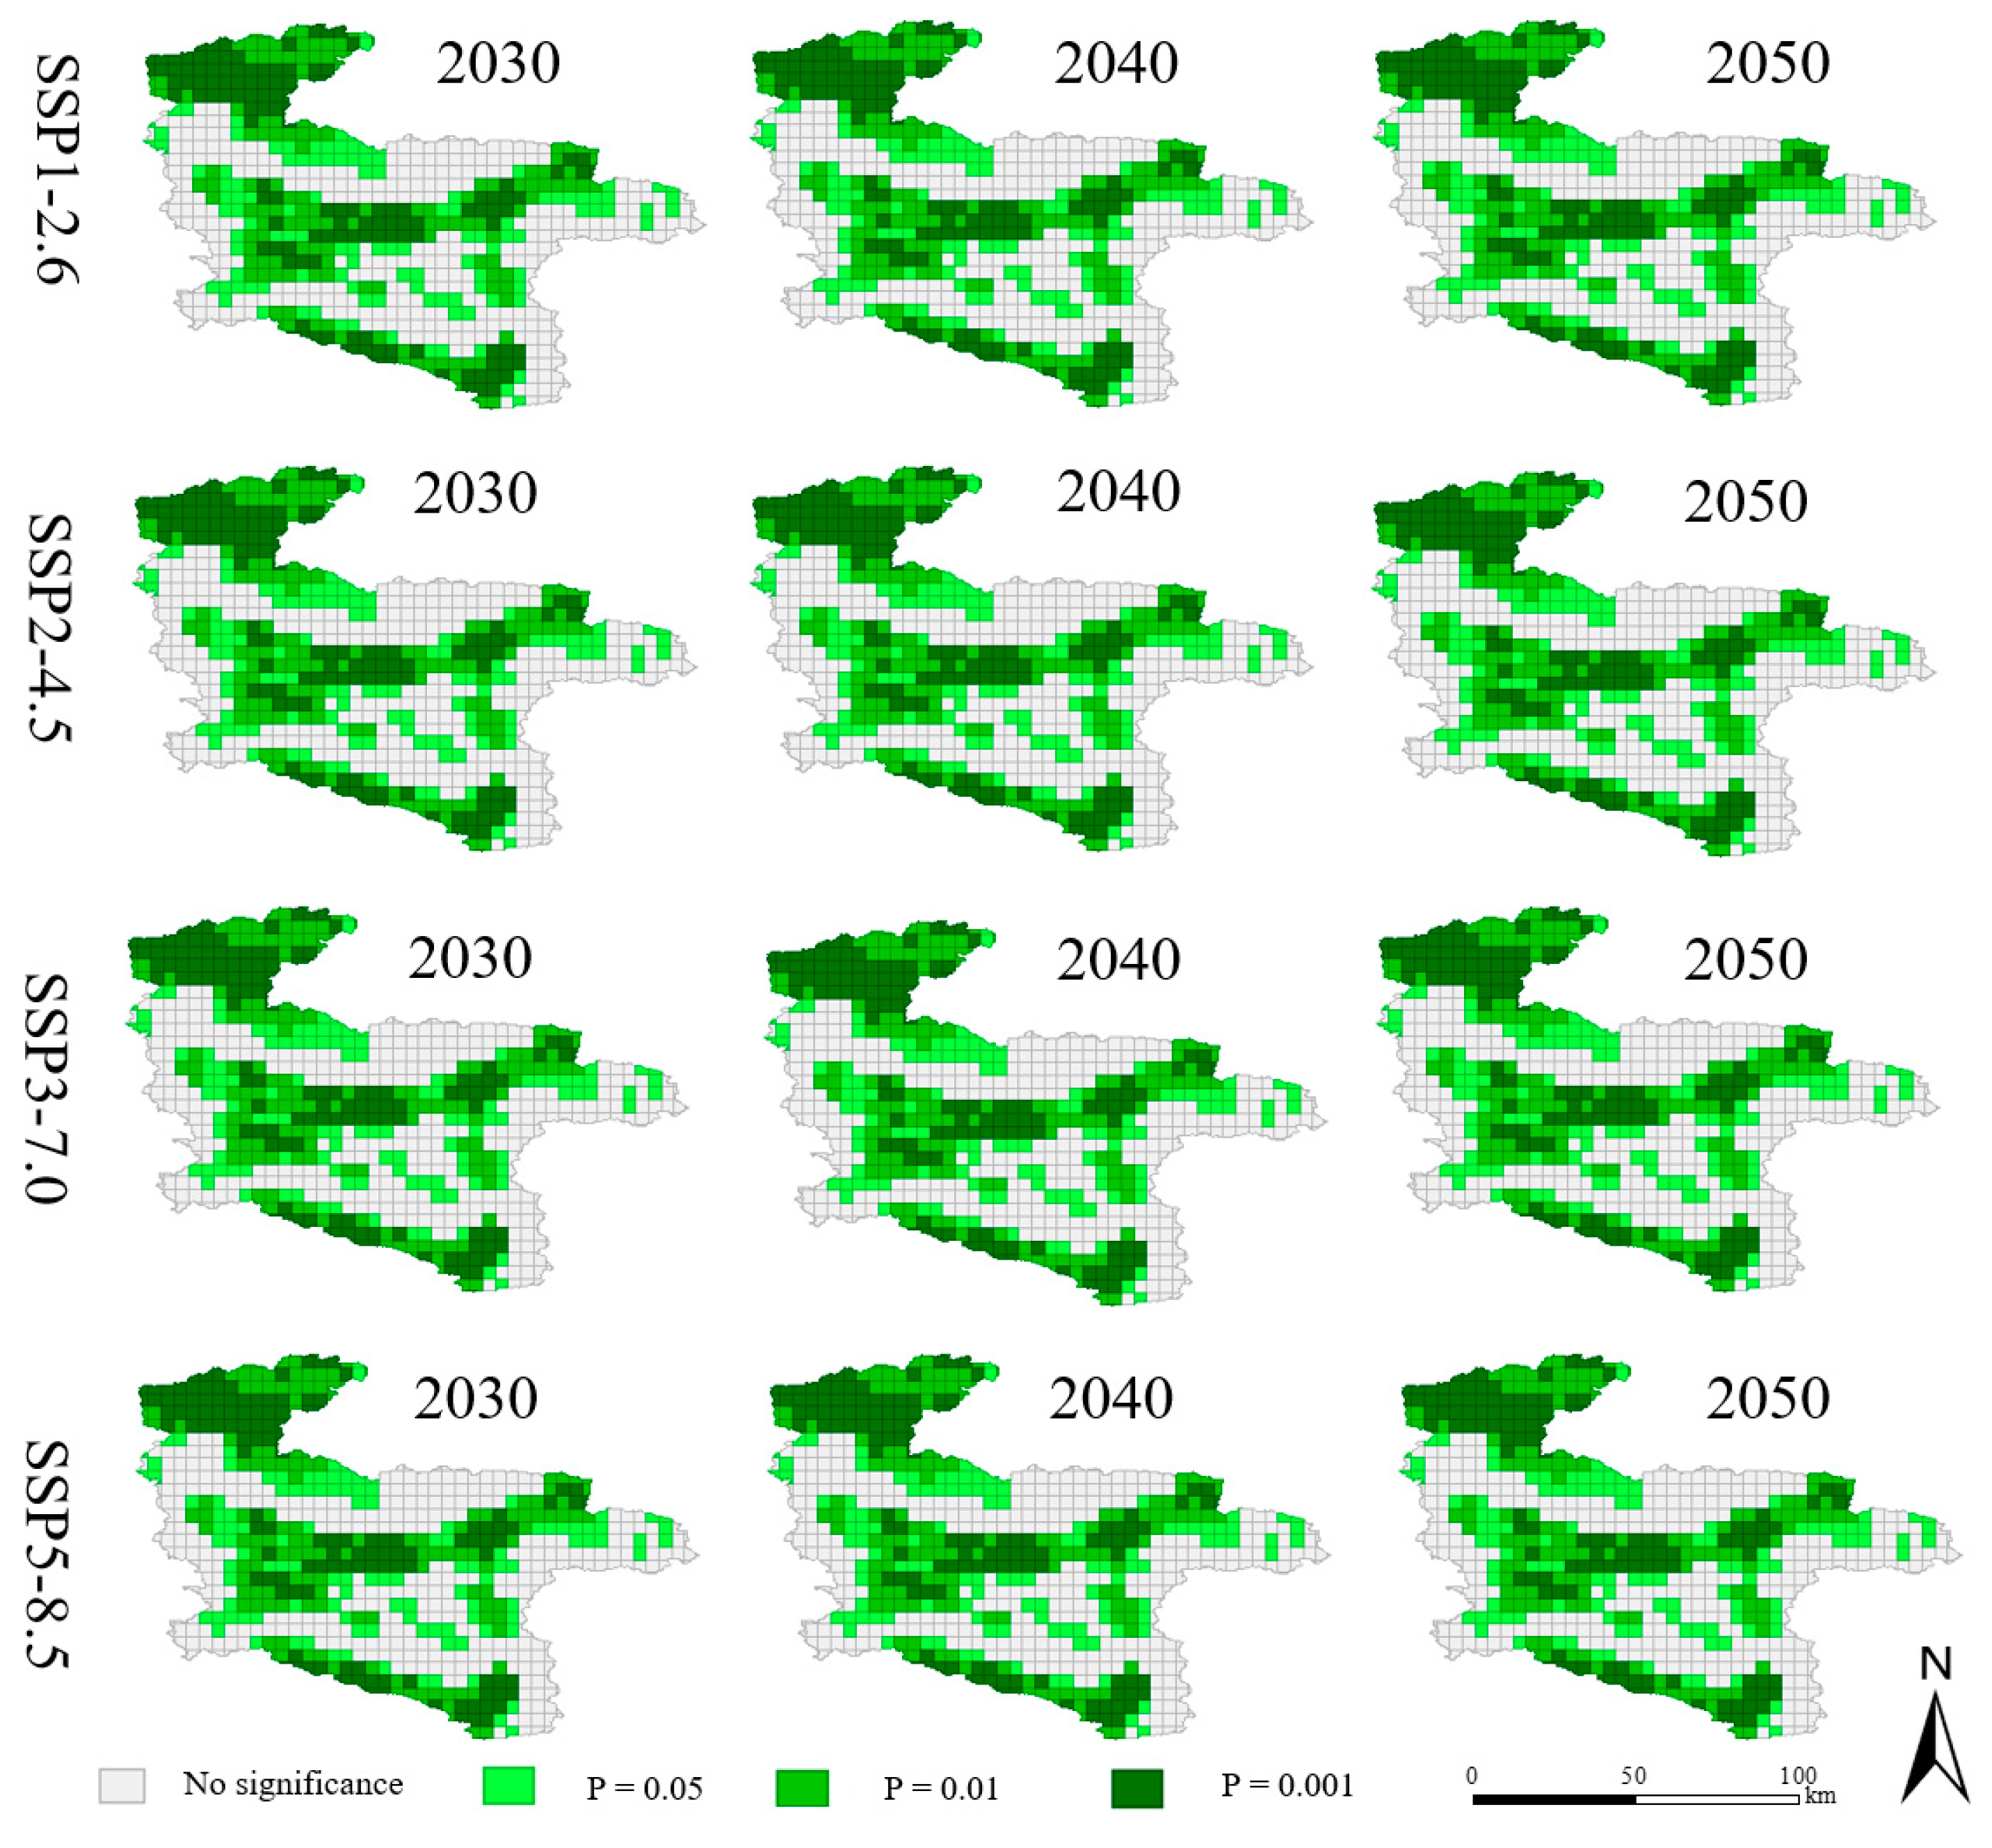
3.3. Influence Analysis between Habitat Quality and Land Use Conflicts
4. Discussion
4.1. Significant Differences in Land Use Conflicts and Habitat Quality under SSP-RCP Scenarios
4.2. Changes in Land Types Lead to Intensified Land-Use Conflicts
4.3. Habitat Quality Response to Land Type Change
4.4. Effects between Land Use and Habitat Quality
5. Conclusions
6. Limitations
Author Contributions
Funding
Data Availability Statement
Acknowledgments
Conflicts of Interest
References
- Tang, H.J.; Wu, W.B.; Yang, P.; Chen, Y.Q.; Verburg, P.H. Recent Progresses of Land Use and Land Cover Change (LUCC) Models. Acta Geogr. Sin. 2009, 64, 456–468. [Google Scholar]
- Rodrigo-Ilarri, J.; Romero, C.P.; Rodrigo-Clavero, M.-E. Land Use/Land Cover Assessment over Time Using a New Weighted Environmental Index (WEI) Based on an Object-Oriented Model and GIS Data. Sustainability 2020, 12, 10234. [Google Scholar] [CrossRef]
- Dai, E.; Ma, L.; Yang, W.; Wang, Y.; Yin, L.; Tong, M. Agent-based model of land system: Theory, application and modelling framework. J. Geogr. Sci. 2020, 30, 1555–1570. [Google Scholar] [CrossRef]
- Bohua, Y.U.; Changhe, L.V. The Progress and Prospect of Land Use Conflicts. Prog. Geogr. 2006, 25, 106–115. [Google Scholar]
- Lu, S.; Zhang, J.; Wu, Z. Study on the Spatial Conflict of Land Use in Jinghe County Oasis. J. Ecol. Rural. Environ. 2022, 38, 428–436. [Google Scholar]
- Yang, Y.; An, Q.; Zhu, L. Diagnosis Based on the PSR Model of Rural Land-use Conflicts Intensity. Prog. Geogr. 2012, 31, 1552–1560. [Google Scholar]
- Bao, W.; Yang, Y.; Zou, L. How to reconcile land use conflicts in mega urban agglomeration? A scenario-based study in the Beijing-Tianjin-Hebei region, China. J. Environ.Manag. 2021, 296, 113168. [Google Scholar] [CrossRef]
- Li, Q.; Wu, X.; Wang, M. Identification of Potential Land Use Conflict in Desertification Area at the County Level. Acta Sci. Nat. Univ. Pekin. 2018, 54, 616–624. [Google Scholar]
- Liu, Q.Q.; Zhao, H.F.; Wu, K.N.; Yu, X.; Zhang, Q. Identifying Potential Land Use Conflict Based on Competitiveness of Different Land Use Types in Beijing, China. Resour. Sci. 2014, 36, 1579–1589. [Google Scholar]
- Zhang, J.; Sheng, H.; Liu, Y.; Meng, Z. Sustainability Assessment of Land Consolidation Based on the Improved Grey Target Modela Case of Jiangsu Province. Resour. Environ. Yangtze Basin 2014, 23, 153–160. [Google Scholar]
- Liu, X.; Shu, J.; Zhang, L. Research on applying minimal cumulative resistance model in urban land ecological suitability assessment: As an example of Xiamen City. Acta Ecol. Sin. 2010, 30, 421–428. [Google Scholar]
- Zhao, X.; Tang, F.; Zhang, P.T.; Hu, B.; Xu, L. Dynamic simulation and characteristic analysis of county production-living ecological spatial conflicts based on CLUE-S model. Acta Ecol. Sin. 2019, 39, 5897–5908. [Google Scholar]
- Girona, M.M.; Morin, H.; Gauthier, S.; Bergeron, Y. (Eds.) Boreal Forests in the Face of Climate Change. In Advances in Global Change Research; Springer: Cham, Switzerland, 2023; Volume 74. [Google Scholar] [CrossRef]
- Cieslak, I. Identification of areas exposed to land use conflict with the use of multiple-criteria decision-making methods. Land Use Policy 2019, 89, 104225. [Google Scholar] [CrossRef]
- Brown, G.; Raymond, C.M. Methods for identifying land use conflict potential using participatory mapping. Landsc. Urban Plan. 2014, 122, 196–208. [Google Scholar] [CrossRef]
- Karimi, A.; Hockings, M. A social-ecological approach to land-use conflict to inform regional and conservation planning and management. Landsc. Ecol. 2018, 33, 691–710. [Google Scholar] [CrossRef]
- Zou, L.; Liu, Y.; Wang, J.; Yang, Y.; Wang, Y. Land use conflict identification and sustainable development scenario simulation on China’s southeast coast. J. Clean. Prod. 2019, 238, 117899. [Google Scholar] [CrossRef]
- Wei, L.; Zhou, L.; Sun, D.; Tang, X. The evolution of spatio-temporal pattern and scenario simulation of urban agglomeration expansion in the Yellow River Basin: A case study in the Hohhot-Baotou-Ordos-Yulin Urban Agglomeration. Geogr. Res. 2022, 41, 1610–1622. [Google Scholar]
- Zhang, X.; Gu, R. Spatio-temporal pattern and multi-scenario simulation of land use conflict: A case study of the Yangtze River Delta urban agglomeration. Geogr. Res. 2022, 41, 1311–1326. [Google Scholar]
- Hof, A.R.; Montoro Girona, M.; Fortin, M.J.; Tremblay, J.A. Editorial: Using Landscape Simulation Models to Help Balance Conflicting Goals in Changing Forests. Front. Ecol. Evol. 2021, 9, 795736. [Google Scholar] [CrossRef]
- Schmitz, C.; van Meijl, H.; Kyle, P.; Nelson, G.C.; Fujimori, S.; Gurgel, A.; Havlik, P.; Heyhoe, E.; D’Croz, D.M.; Popp, A.; et al. Land-use change trajectories up to 2050: Insights from a global agro-economic model comparison. Agric. Econ. 2013, 45, 69–84. [Google Scholar] [CrossRef]
- Doelman, J.C.; Stehfest, E.; Tabeau, A.; van Meijl, H.; Lassaletta, L.; Gernaat, D.E.; Hermans, K.; Harmsen, M.; Daioglou, V.; Biemans, H.; et al. Exploring SSP land-use dynamics using the IMAGE model: Regional and gridded scenarios of land-use change and land-based climate change mitigation. Glob. Environ. Chang. 2018, 48, 119–135. [Google Scholar] [CrossRef]
- O’Neill, B.C.; Kriegler, E.; Ebi, K.L.; Kemp-Benedict, E.; Riahi, K.; Rothman, D.S.; Van Ruijven, B.J.; Van Vuuren, D.P.; Birkmann, J.; Kok, K.; et al. The roads ahead: Narratives for shared socioeconomic pathways describing world futures in the 21st century. Glob. Environ. Change-Hum. Policy Dimens. 2017, 42, 169–180. [Google Scholar] [CrossRef]
- Cook, B.I.; Mankin, J.S.; Marvel, K.; Williams, A.P.; Smerdon, J.E.; Anchukaitis, K.J. Twenty-First Century Drought Projections in the CMIP6 Forcing Scenarios. Earth’s Futur. 2020, 8, e2019EF001461. [Google Scholar] [CrossRef]
- Tan, J.; Li, A.; Lei, G.; Xie, X. A SD-MaxEnt-CA model for simulating the landscape dynamic of natural ecosystem by considering socio-economic and natural impacts. Ecol. Model. 2019, 410, 108783. [Google Scholar] [CrossRef]
- Liang, X.; Liu, X.; Li, D.; Zhao, H.; Chen, G. Urban growth simulation by incorporating planning policies into a CA-based future land-use simulation model. Int. J. Geogr. Inf. Sci. 2018, 32, 2294–2316. [Google Scholar] [CrossRef]
- Wang, Z.; Li, X.; Mao, Y.; Li, L.; Wang, X.; Lin, Q. Dynamic simulation of land use change and assessment of carbon storage based on climate change scenarios at the city level: A case study of Bortala, China. Ecol. Indic. 2022, 134, 108499. [Google Scholar] [CrossRef]
- Chen, Y.; Li, X.; Liu, X.; Ai, B. Modeling urban land-use dynamics in a fast developing city using the modified logistic cellular automaton with a patch-based simulation strategy. Int. J. Geogr. Inf. Sci. 2013, 28, 234–255. [Google Scholar] [CrossRef]
- Yang, X.; Chen, R.; Zheng, X. Simulating land use change by integrating ANN-CA model and landscape pattern indices. Geomatics, Nat. Hazards Risk 2016, 7, 918–932. [Google Scholar] [CrossRef]
- Luo, G.; Yin, C.; Chen, X.; Xu, W.; Lu, L. Combining system dynamic model and CLUE-S model to improve land use scenario analyses at regional scale: A case study of Sangong watershed in Xinjiang, China. Ecol. Complex. 2010, 7, 198–207. [Google Scholar] [CrossRef]
- Zhu, W.; Gao, Y.; Zhang, H.; Liu, L. Optimization of the land use pattern in Horqin Sandy Land by using the CLUMondo model and Bayesian belief network. Sci. Total. Environ. 2020, 739, 139929. [Google Scholar] [CrossRef]
- Ding, Q.; Chen, Y.; Bu, L.; Ye, Y. Multi-Scenario Analysis of Habitat Quality in the Yellow River Delta by Coupling FLUS with InVEST Model. Int. J. Environ. Res. Public Heal. 2021, 18, 2389. [Google Scholar] [CrossRef] [PubMed]
- Dong, N.; You, L.; Cai, W.; Li, G.; Lin, H. Land use projections in China under global socioeconomic and emission scenarios: Utilizing a scenario-based land-use change assessment framework. Glob. Environ. Change Hum. Policy Dimens. 2018, 50, 164–177. [Google Scholar] [CrossRef]
- Liang, X.; Liu, X.; Li, X.; Chen, Y.; Tian, H.; Yao, Y. Delineating multi-scenario urban growth boundaries with a CA-based FLUS model and morphological method. Landsc. Urban Plan. 2018, 177, 47–63. [Google Scholar] [CrossRef]
- Liu, X.; Liang, X.; Li, X.; Xu, X.; Ou, J.; Chen, Y.; Li, S.; Wang, S.; Pei, F. A future land use simulation model (FLUS) for simulating multiple land use scenarios by coupling human and natural effects. Landsc. Urban Plan. 2017, 168, 94–116. [Google Scholar] [CrossRef]
- Li, C.; Wu, Y.; Gao, B.; Zheng, K.; Wu, Y.; Li, C. Multi-scenario simulation of ecosystem service value for optimization of land use in the Sichuan-Yunnan ecological barrier, China. Ecol. Indic. 2021, 132, 108328. [Google Scholar] [CrossRef]
- Zhai, H.; Lv, C.; Liu, W.; Yang, C.; Fan, D.; Wang, Z.; Guan, Q. Understanding Spatio-Temporal Patterns of Land Use/Land Cover Change under Urbanization in Wuhan, China, 2000–2019. Remote Sens. 2021, 13, 3331. [Google Scholar] [CrossRef]
- Yushanjiang, A.; Zhang, F.; Yu, H.; Kung, H.-T. Quantifying the spatial correlations between landscape pattern and ecosystem service value: A case study in Ebinur Lake Basin, Xinjiang, China. Ecol. Eng. 2018, 113, 94–104. [Google Scholar] [CrossRef]
- Felipe-Lucia, M.R.; Soliveres, S.; Penone, C.; Fischer, M.; Ammer, C.; Boch, S.; Boeddinghaus, R.S.; Bonkowski, M.; Buscot, F.; Fiore-Donno, A.M.; et al. Land-use intensity alters networks between biodiversity, ecosystem functions, and services. Proc. Natl. Acad. Sci. USA 2020, 117, 28140–28149. [Google Scholar] [CrossRef]
- Xu, C.; Jiang, W.; Huang, Q.; Wang, Y. Ecosystem services response to rural-urban transitions in coastal and island cities: A comparison between Shenzhen and Hong Kong, China. J. Clean. Prod. 2020, 260, 121033. [Google Scholar] [CrossRef]
- Zhou, D.; Xu, J.; Wang, L. Land use spatial conflicts and complexity: A case study of the urban agglomeration around Hangzhou Bay, China. Geogr. Res. 2015, 34, 1630–1642. [Google Scholar]
- Chen, X.; Chen, S.; He, Z.; Xue, D.; Fang, G.; Pan, K.; Fang, K. Developing a system for comprehensive regional Eco-environmental quality assessment in mountainous areas—A case study of Western Sichuan, China. Front. Environ. Sci. 2022, 10, 1325. [Google Scholar] [CrossRef]
- Gevrey, M.; Dimopoulos, I.; Lek, S. Review and comparison of methods to study the contribution of variables in artificial neural network models. Ecol. Model. 2003, 160, 249–264. [Google Scholar] [CrossRef]
- Yu, W.; Ji, R.; Han, X.; Chen, L.; Feng, R.; Wu, J.; Zhang, Y. Evaluation of the Biodiversity Conservation Function in Liaohe Delta Wetland, Northeastern China. J. Meteorol. Res. 2020, 34, 798–805. [Google Scholar] [CrossRef]
- Wu, L.; Sun, C.; Fan, F. Estimating the Characteristic Spatiotemporal Variation in Habitat Quality Using the InVEST Model—A Case Study from Guangdong–Hong Kong–Macao Greater Bay Area. Remote Sens. 2021, 13, 1008. [Google Scholar] [CrossRef]
- Liu, L.; Li, J.; Wang, J.; Liu, F.; Cole, J.; Sha, J.; Jiao, Y.; Zhou, J. The establishment of an eco-environmental evaluation model for southwest China and eastern South Africa based on the DPSIR framework. Ecol. Indic. 2022, 145, 109687. [Google Scholar] [CrossRef]
- Terrado, M.; Sabater, S.; Chaplin-Kramer, B.; Mandle, L.; Ziv, G.; Acuña, V. Model development for the assessment of terrestrial and aquatic habitat quality in conservation planning. Sci. Total. Environ. 2016, 540, 63–70. [Google Scholar] [CrossRef] [PubMed]
- Huang, C.; Huang, X.; Peng, C.; Zhou, Z.; Teng, M.; Wang, P. Land use/cover change in the Three Gorges Reservoir area, China: Reconciling the land use conflicts between development and protection. CATENA 2019, 175, 388–399. [Google Scholar] [CrossRef]
- Wei, Q.; Abudureheman, M.; Halike, A.; Yao, K.; Yao, L.; Tang, H.; Tuheti, B. Temporal and spatial variation analysis of habitat quality on the PLUS-InVEST model for Ebinur Lake Basin, China. Ecol. Indic. 2022, 145, 109632. [Google Scholar] [CrossRef]
- Chen, W.X.; Chi, G.Q. Urbanization and ecosystem services: The multi-scale spatial spillover effects and spatial variations. Land Use Policy 2022, 114, 105964. [Google Scholar] [CrossRef]
- Zhou, T.; Zou, L.; Chen, X. Commentary on the Coupled Model Intercomparison Project Phase 6 (CMIP6). Progress. Inquisitiones De Mutat. Clim. 2019, 15, 445–456. [Google Scholar]
- Van Vuuren, D.P.; Stehfest, E.; Gernaat, D.E.; Doelman, J.C.; Van den Berg, M.; Harmsen, M.; de Boer, H.S.; Bouwman, L.F.; Daioglou, V.; Edelenbosch, O.Y.; et al. Energy, land-use and greenhouse gas emissions trajectories under a green growth paradigm. Glob. Environ. Change Hum. Policy Dimens. 2017, 42, 237–250. [Google Scholar] [CrossRef]
- Wang, Y.; Wang, A.; Zhai, J.; Tao, H.; Jiang, T.; Su, B.; Yang, J.; Wang, G.; Liu, Q.; Gao, C.; et al. Tens of thousands additional deaths annually in cities of China between 1.5 °C and 2.0 °C warming. Nat. Commun. 2019, 10, 3376. [Google Scholar] [CrossRef]
- Fricko, O.; Havlik, P.; Rogelj, J.; Klimont, Z.; Gusti, M.; Johnson, N.; Kolp, P.; Strubegger, M.; Valin, H.; Amann, M. The marker quantification of the Shared Socioeconomic Pathway 2: A middle-of-the-road scenario for the 21st century. Glob. Environ. Change-Hum. Policy Dimens. 2017, 42, 251–267. [Google Scholar] [CrossRef]
- Kriegler, E.; Bauer, N.; Popp, A.; Humpenöder, F.; Leimbach, M.; Strefler, J.; Baumstark, L.; Bodirsky, B.L.; Hilaire, J.; Klein, D.; et al. Fossil-fueled development (SSP5): An energy and resource intensive scenario for the 21st century. Glob. Environ. Chang. 2017, 42, 297–315. [Google Scholar] [CrossRef]
- Riahi, K.; Van Vuuren, D.P.; Kriegler, E.; Edmonds, J.; O’neill, B.C.; Fujimori, S.; Bauer, N.; Calvin, K.; Dellink, R.; Fricko, O.; et al. The Shared Socioeconomic Pathways and their energy, land use, and greenhouse gas emissions implications: An overview. Glob. Environ. Change Hum. Policy Dimens. 2017, 42, 153–168. [Google Scholar] [CrossRef]
- Geng, B.; Zheng, X.; Fu, M. Scenario analysis of sustainable intensive land use based on SD model. Sustain. Cities Soc. 2017, 29, 193–202. [Google Scholar] [CrossRef]
- Fujimori, S.; Hasegawa, T.; Masui, T.; Takahashi, K.; Herran, D.S.; Dai, H.; Hijioka, Y.; Kainuma, M. SSP3: AIM implementation of Shared Socioeconomic Pathways. Glob. Environ. Chang. 2017, 42, 268–283. [Google Scholar] [CrossRef]
- Qiu, G.; Wang, Y.; Guo, S.; Niu, Q.; Qin, L.; Zhu, D.; Gong, Y. Assessment and Spatial-Temporal Evolution Analysis of Land Use Conflict within Urban Spatial Zoning: Case of the Su-Xi-Chang Region. Sustainability 2022, 14, 2286. [Google Scholar] [CrossRef]
- Li, S.-Y.; Miao, L.-J.; Jiang, Z.-H.; Wang, G.-J.; Gnyawali, K.R.; Zhang, J.; Zhang, H.; Fang, K.; He, Y.; Li, C. Projected drought conditions in Northwest China with CMIP6 models under combined SSPs and RCPs for 2015–2099. Adv. Clim. Chang. Res. 2020, 11, 210–217. [Google Scholar] [CrossRef]
- Zhou, D.; Lin, Z.; Lim, S.H. Spatial characteristics and risk factor identification for land use spatial conflicts in a rapid urbanization region in China. Environ. Monit. Assess. 2019, 191, 677. [Google Scholar] [CrossRef]
- Zhu, C.; Zhang, X.; Zhou, M.; He, S.; Gan, M.; Yang, L.; Wang, K. Impacts of urbanization and landscape pattern on habitat quality using OLS and GWR models in Hangzhou, China. Ecol. Indic. 2020, 117, 106654. [Google Scholar] [CrossRef]
- Natural Capital Project. 2022. InVEST 3.13.0 User’s Guide. Stanford University, University of Minnesota, Chinese Academy of Sciences, The Nature Con-servancy, World Wildlife Fund, and Stockholm Resilience Centre. 2022. Available online: https://naturalcapitalproject.stanford.edu/software/invest (accessed on 12 July 2023).
- Pei, M.; Liu, X.; Wang, J.; Liu, J.; Zhao, X.; Li, H.; Wang, R.; Luo, X.; Xing, L.; Wang, C.; et al. Spatiotemporal Characteristics and Habitat Quality Analysis in the Temperate Desert Sub-Region of Ordos Plateau, China. Land 2023, 12, 1470. [Google Scholar] [CrossRef]
- He, N.; Guo, W.; Wang, H.; Yu, L.; Cheng, S.; Huang, L.; Jiao, X.; Chen, W.; Zhou, H. Temporal and Spatial Variations in Landscape Habitat Quality under Multiple Land-Use/Land-Cover Scenarios Based on the PLUS-InVEST Model in the Yangtze River Basin, China. Land 2023, 12, 1338. [Google Scholar] [CrossRef]
- Zhao, X.Q.; Shi, X.Q.; Li, Y.H.; Li, Y.M.; Huang, P. Spatio-temporal pattern and functional zoning of ecosystem services in the karst mountainous areas of southeastern Yunnan. Acta Geogr. Sin. 2022, 77, 736–756. [Google Scholar]
- Zhang, C.-Y.; Zhao, L.; Zhang, H.; Chen, M.-N.; Fang, R.-Y.; Yao, Y.; Zhang, Q.-P.; Wang, Q. Spatial-temporal characteristics of carbon emissions from land use change in Yellow River Delta region, China. Ecol. Indic. 2022, 136, 108623. [Google Scholar] [CrossRef]
- Geng, L.; Zhang, Y.; Hui, H.; Wang, Y.; Xue, Y. Response of Urban Ecosystem Carbon Storage to Land Use/Cover Change and Its Vulnerability Based on Major Function-Oriented Zone Planning. Land 2023, 12, 1563. [Google Scholar] [CrossRef]
- Zhao, T.; Pan, J.H.; Bi, F. Can human activities enhance the trade-off intensity of ecosystem services in arid inland river basins? Taking the Taolai River asin as an example. Sci. Total Environ. 2023, 861, 160662. [Google Scholar] [CrossRef]
- Meimei, W.; Zizhen, J.; Tengbiao, L.; Yongchun, Y.; Zhuo, J. Analysis on absolute conflict and relative conflict of land use in Xining metropolitan area under different scenarios in 2030 by PLUS and PFCI. Cities 2023, 137, 104314. [Google Scholar] [CrossRef]
- Wu, J.; Luo, J.; Zhang, H.; Qin, S.; Yu, M. Projections of land use change and habitat quality assessment by coupling climate change and development patterns. Sci. Total. Environ. 2022, 847, 157491. [Google Scholar] [CrossRef]
- Gao, L.; Tao, F.; Liu, R.; Wang, Z.; Leng, H.; Zhou, T. Multi-scenario simulation and ecological risk analysis of land use based on the PLUS model: A case study of Nanjing. Sustain. Cities Soc. 2022, 85, 104055. [Google Scholar] [CrossRef]
- Wei, L.; Zhou, L.; Sun, D.; Yuan, B.; Hu, F. Evaluating the impact of urban expansion on the habitat quality and constructing ecological security patterns: A case study of Jiziwan in the Yellow River Basin, China. Ecol. Indic. 2022, 145, 109544. [Google Scholar] [CrossRef]
- Banks-Leite, C.; Ewers, R.M.; Folkard-Tapp, H.; Fraser, A. Countering the effects of habitat loss, fragmentation, and degradation through habitat restoration. One Earth 2020, 3, 672–676. [Google Scholar] [CrossRef]


| Data Type | Data Name | Resolution | Source |
|---|---|---|---|
| Land use data | Land use data | 30 m | National Geographic Information Resources Catalogue Service System https://www.webmap.cn/, accessed on 12 April 2023. |
| Socioeconomic data | Statistical data | —— | Shaanxi Statistical Yearbook, Ankang Statistical Yearbook, Ankang Annual Statistical Bulletin |
| GDP | 1 km | Resource and Environment Science and Data Centre https://www.resdc.cn/, accessed on 21 April 2023. | |
| Population density | 1 km | ||
| Night lights | 500 m | Earth Observation Group (EOG) https://eogdata.mines.edu, accessed on 18 April 2023. | |
| Roads, Railways | —— | National Geographic Information Resources Catalogue Service https://www.webmap.cn/, accessed on 18 April 2023. | |
| Natural factors data | Soil dryness | 1 km | Chinese Academy of Sciences Resource and Environmental Science and Data Centre https://www.resdc.cn/, accessed on 21 April 2023. |
| Soil type | 1 km | ||
| Soil erosion type | 1 km | ||
| Soil erosion intensity | 1 km | ||
| NDVI | 1 km | ||
| NPP | 1 km | ||
| Agricultural production potential | 1 km | ||
| River Water Resources | —— | National Geographic Information Resources Catalogue Service https://www.webmap.cn, accessed on 18 April 2023. | |
| DEM | 30 m | National Geographic Information Resources Catalogue Service https://www.webmap.cn, accessed on 18 April 2023. | |
| Meteorological data | —— | National Geophysical Data Center https://www.ncdc.noaa.gov/, accessed on 18 April 2023. |
| Scenarios | Forcing Category | Parameter Data | Source |
|---|---|---|---|
| SSP126 [52] | Low forcing scenario | GDP | GDP forecast data [53] |
| SSP245 [54] | Medium forcing scenario | Population | China’s future population km-scale grid data [55] |
| SSP370 [56] | Medium to high forcing scenario | Temperature | World Climate Research Program [57] (WCRP) https://esgf-node.llnl.gov/cmip6, accessed on 27 April 2023. |
| SSP585 [58] | High forcing scenario | Rainfall |
| Scenarios | 2030 | 2040 | 2050 | |||||||||
|---|---|---|---|---|---|---|---|---|---|---|---|---|
| GGR | PGR | TCR | PCR | GGR | PGR | TCR | PCR | GGR | PGR | TCR | PCR | |
| SSP126 | 5.08% | 0.01% | 3.13% | 12.25% | 3.05% | 0.14% | 4.92% | 19.84% | 1.70% | 0.36% | 2.70% | 25.20% |
| SSP245 | 4.78% | −0.10% | 3.08% | 26.30% | 2.79% | 0.02% | 3.70% | 17.16% | 1.58% | 0.19% | 4.39% | 25.84% |
| SSP370 | 4.09% | −0.20% | 5.20% | 18.57% | 2.00% | −0.09% | 4.49% | 19.40% | 0.80% | −0.02% | 5.78% | 17.06% |
| SSP585 | 5.37% | 0.01% | 7.78% | 14.77% | 3.58% | 0.14% | 4.93% | 18.43% | 2.32% | 0.36% | 5.97% | 26.42% |
| Land Use Conflict Measurement Model | Equation | Number |
|---|---|---|
| Land Use Conflict Comprehensive Index [61] | LUCI = LUAWMPFD+ LUFI − LUSI | (1) |
| Land Use Complexity Index (LUAWMPFD) [62] | (2) | |
| Land Use Vulnerability Index (LUFI) | (3) | |
| Land Use Stability Inde (LUSI) | LUSI = 1 − PD | (4) |
| Threat Source | Maximum Threat Distance/km | Weight | Distance Attenuation Type |
|---|---|---|---|
| Agricultural land | 2 | 0.4 | Linear |
| Railroads | 5 | 0.7 | Linear |
| Road | 4 | 0.6 | Linear |
| Residential site | 10 | 1 | Exponential |
| Construction land | 8 | 1 | Exponential |
| Land Use Type | Habitat Suitability | Threat Source | ||||
|---|---|---|---|---|---|---|
| Agricultural Land | Railway | Road | Residential Site | Construction Land | ||
| Agricultural land | 0.5 | 0.3 | 0.7 | 0.7 | 0.6 | 0.9 |
| Forest land | 1 | 0.5 | 0.8 | 0.7 | 0.6 | 0.9 |
| Grassland | 0.8 | 0.5 | 0.6 | 0.6 | 0.4 | 0.6 |
| Water | 0.3 | 1 | 0.7 | 0.7 | 0.4 | 0.4 |
| Construction land | 0 | 0 | 0 | 0 | 0 | 0 |
| Unused land | 0.1 | 0.1 | 0.2 | 0.2 | 0.1 | 0.1 |
| Land Use Type | Actual Value in 2020 | Projected Value in 2020 | Simulation Error (%) |
|---|---|---|---|
| Agricultural land | 423,669.7 | 423,601.3 | −0.02% |
| Forest land | 1,778,084.1 | 1,776,178.2 | −0.11% |
| Grassland | 123,596.8 | 123,553.3 | −0.04% |
| Water | 14,707.7 | 14,682.4 | −0.17% |
| Construction land | 14,829.1 | 14,828.1 | −0.01% |
| Unused land | 330.8 | 337.6 | 2.04% |
| Land Use Type | SSP126 | SSP245 | SSP370 | SSP585 | ||||||||
|---|---|---|---|---|---|---|---|---|---|---|---|---|
| 2030 | 2040 | 2050 | 2030 | 2040 | 2050 | 2030 | 2040 | 2050 | 2030 | 2040 | 2050 | |
| Agricultural land | 420,631 | 416,496 | 411,507 | 420,599 | 416,411 | 411,331 | 420,941 | 416,774 | 411,202 | 420,562 | 416,318 | 411,169 |
| Forest land | 1,772,098 | 1,769,306 | 1,769,371 | 1,770,209 | 1,762,461 | 1,755,524 | 1,768,101 | 1,755,610 | 1,747,139 | 1,771,303 | 1,757,337 | 1,743,319 |
| Grassland | 127,924 | 133,320 | 137,483 | 128,550 | 136,148 | 144,063 | 129,533 | 140,031 | 151,506 | 129,106 | 138,774 | 15,1369 |
| Water | 14,313.7 | 13,847.3 | 13,500.7 | 14,238.9 | 13,555.4 | 12,847.4 | 14,136 | 13,170.2 | 12,100.6 | 14,282.7 | 13,285.3 | 12,107.6 |
| Construction land | 18,014.2 | 20,015.9 | 21,148.7 | 19,872.4 | 24,430.1 | 29,243.5 | 20,648 | 27,858.6 | 31,069.3 | 20,419.6 | 27,290.7 | 35,049.2 |
| Unused land | 305.8 | 299.6 | 282.7 | 311.1 | 287.1 | 274.6 | 310.9 | 278.8 | 274.2 | 310.5 | 279.9 | 274.2 |
| Level | SSP126 | SSP245 | SSP370 | SSP585 | ||||||||
|---|---|---|---|---|---|---|---|---|---|---|---|---|
| 2030 | 2040 | 2050 | 2030 | 2040 | 2050 | 2030 | 2040 | 2050 | 2030 | 2040 | 2050 | |
| 0–0.2 | 2.62 | 2.58 | 2.53 | 2.56 | 2.69 | 2.64 | 2.54 | 2.85 | 3.02 | 4.54 | 4.80 | 4.88 |
| 0.2–0.4 | 13.40 | 13.35 | 13.60 | 13.21 | 13.12 | 13.59 | 13.57 | 13.78 | 13.89 | 11.02 | 11.31 | 12.15 |
| 0.4–0.6 | 16.70 | 16.83 | 16.57 | 16.74 | 16.78 | 16.72 | 16.85 | 16.81 | 16.77 | 23.17 | 24.18 | 32.76 |
| 0.6–0.8 | 48.14 | 47.79 | 47.86 | 48.05 | 48.12 | 47.71 | 47.81 | 47.50 | 47.38 | 44.05 | 43.32 | 34.78 |
| 0.8–1 | 19.13 | 19.45 | 19.43 | 19.45 | 19.30 | 19.33 | 19.22 | 19.06 | 18.94 | 17.21 | 16.37 | 15.42 |
| Mean | 0.6421 | 0.6428 | 0.6429 | 0.6436 | 0.6427 | 0.6415 | 0.6407 | 0.6401 | 0.6397 | 0.5615 | 0.5592 | 0.5360 |
| StdDev | 0.1974 | 0.1971 | 0.1969 | 0.1967 | 0.1974 | 0.1978 | 0.1979 | 0.1973 | 0.1991 | 0.1927 | 0.1943 | 0.1958 |
Disclaimer/Publisher’s Note: The statements, opinions and data contained in all publications are solely those of the individual author(s) and contributor(s) and not of MDPI and/or the editor(s). MDPI and/or the editor(s) disclaim responsibility for any injury to people or property resulting from any ideas, methods, instructions or products referred to in the content. |
© 2023 by the authors. Licensee MDPI, Basel, Switzerland. This article is an open access article distributed under the terms and conditions of the Creative Commons Attribution (CC BY) license (https://creativecommons.org/licenses/by/4.0/).
Share and Cite
Li, X.; Cheng, S.; Wang, Y.; Zhang, G.; Zhang, L.; Wu, C. Future Land Use Spatial Conflicts and Habitat Quality Impacts Based on SSPs-RCPs Scenarios—Qin-Ba Mountain City. Land 2023, 12, 1708. https://doi.org/10.3390/land12091708
Li X, Cheng S, Wang Y, Zhang G, Zhang L, Wu C. Future Land Use Spatial Conflicts and Habitat Quality Impacts Based on SSPs-RCPs Scenarios—Qin-Ba Mountain City. Land. 2023; 12(9):1708. https://doi.org/10.3390/land12091708
Chicago/Turabian StyleLi, Xia, Songtao Cheng, Yigui Wang, Guozhuang Zhang, Leyi Zhang, and Chen Wu. 2023. "Future Land Use Spatial Conflicts and Habitat Quality Impacts Based on SSPs-RCPs Scenarios—Qin-Ba Mountain City" Land 12, no. 9: 1708. https://doi.org/10.3390/land12091708
APA StyleLi, X., Cheng, S., Wang, Y., Zhang, G., Zhang, L., & Wu, C. (2023). Future Land Use Spatial Conflicts and Habitat Quality Impacts Based on SSPs-RCPs Scenarios—Qin-Ba Mountain City. Land, 12(9), 1708. https://doi.org/10.3390/land12091708