Article

The Land-Use and Land-Cover Changes in the Este District, South Gondar Zone, Northwestern Ethiopia, in the Last Four Decades (the 1980s to 2020s)

1
Plant Biology and Biodiversity Management Department, Natural Sciences College, Addis Ababa University, Addis Ababa 1000, Ethiopia
2
Biology Department, Faculty of Natural and Computational Sciences, Debre Tabor University, Debre Tabor 6300, Ethiopia
3
Department of Natural Resource Management, Agricultural and Environmental Sciences College, Bahir Dar University, Bahir Dar 6000, Ethiopia
*
Author to whom correspondence should be addressed.
Land 2023, 12(9), 1655; https://doi.org/10.3390/land12091655
Submission received: 7 December 2021 / Accepted: 11 January 2022 / Published: 24 August 2023

Abstract

:
Environmental transformations are the results of land-use and land-cover (LULC) changes. This study aims to investigate the LULC changes and associated factors in the Este District in northwestern Ethiopia, for the last four decades (the 1980s to 2020s). The land-use and land-cover classes were analyzed using supervised classification techniques in ERDASS IMAGINE 2015 and ArcGIS 10.3.1, categorizing the Landsat satellite images for 1984, 2000, and 2018 into six cover classes: settlement, forests-shrublands, cropland, grassland, bare land, and water body. We used a historical Google map, topo-sheets, and ancillary data to verify the classification accuracies for 1984, 2000, and 2018, respectively. The climate and demographic data were obtained from the Ethiopian Meteorological Station and Ethiopian Statistical Agency, respectively. In addition, data from key informant interviews and focus group discussions were also used to understand the local community experiences and perceptions toward LULC changes. The values of each LULC class were correlated with the demographic and climatic variables, using simple correlation analysis to evaluate the impact of demographic and climatic conditions on LULC changes. The analysis indicated that the least and largest classes of LULC in Este District were water bodies (mean cover = 1.9 km2) and croplands (mean cover = 791.7 km2), respectively. Cropland coverage increased by 2% in 2000, then decreased by 11% in 2018. Between 1984 and 2018, the grasslands and settlements increased by 22% and 0.5%, respectively. Half of the bare land and one-tenth of the forests-shrublands also decreased over the last four decades (the 1980s to 2020s). As a result, the original croplands and forests–shrublands classes (11% each) before 2000 were converted into new grasslands and croplands after 2018, respectively. The study indicated that precipitation, solar radiation, and population growth are the potential drivers, and the perceptions of local communities are nearly in line with the statistical analysis results. Alternative income sources, such as tourism and carbon trading and the participation in afforestation programs, could reverse the situation in the study area.

1. Introduction

Land-use and land-cover change are aspects of the transformation of the earth’s land-use and land-cover systems [1]. These processes and associated effects influence the abiotic and biotic resources of a specific region [2]. Depending on the type of derivers, every LULC modification is a switch from one form of cover to the other [3,4]. LULC changes can be explained in temporal and spatial perspectives [5]. Temporally, these changes vary from time-to-time and are not recent phenomena; they date back to prehistory [6]. Spatially, however, the changes are explained to vary from region to region and they are not confined to a specific continent or region of the earth [7]. Many research works show that the most considerable LULC changes, especially the loss of forests, took place in most parts of sub-Saharan Africa [8].
Assessing changes in either the spatial or temporal LULC patterns is important for land management, especially forest conservation [5,9]. However, assessing these changes without the use of advanced technologies could be challenging, considering the time and financial resources it may require for remote areas [9]. The application of GIS technology assessing the LULC changes over a large area removes the constraints of the resources, despite some of its limitations [2,9].
In developing regions, such as those in sub-Saharan Africa, agricultural lands and settlements are expanding while forest–shrubland cover is decreasing in proportion to the increasing human population [10,11]. Changes in agricultural lands and settlements and forest–shrubland cover may put tremendous pressure on water [12,13], land stability [14] and biodiversity [2,15]. Ethiopia has lost its fertile land and high forest cover because of the drivers behind the rapid LULC changes [12,13,16].
The drivers of these LULC changes include population growth, demand for energy, and the shortage of arable land [17,18]. Additionally, climate change, such as the unpredictable variation in rainfall, has also impacted the LULC dynamics of the country [19,20].
The interconnection between LULC changes and population growth, climate change and variability [12,19,21], is estimated to be high in the Amhara Regional State of Ethiopia [22], which is the second highest in population among the regional states in the country [23]. A few similar large-scale research works conducted to understand LULC changes in the region have indicated that population growth and agricultural expansion are the major forces that drive LULC change [19,24]. However, studies in LULC changes are rare on a small-scale, such as in the Este District, South Gondar Zone, Amhara Region, Ethiopia. Hence, this research aims at detecting LULC changes and the associated forces behind the changes and, to evaluate the perception of local communities regarding these changes and factors in the Este District, South Gondar Zone, Ethiopia between 1980 and 2020.

2. Materials and Methods

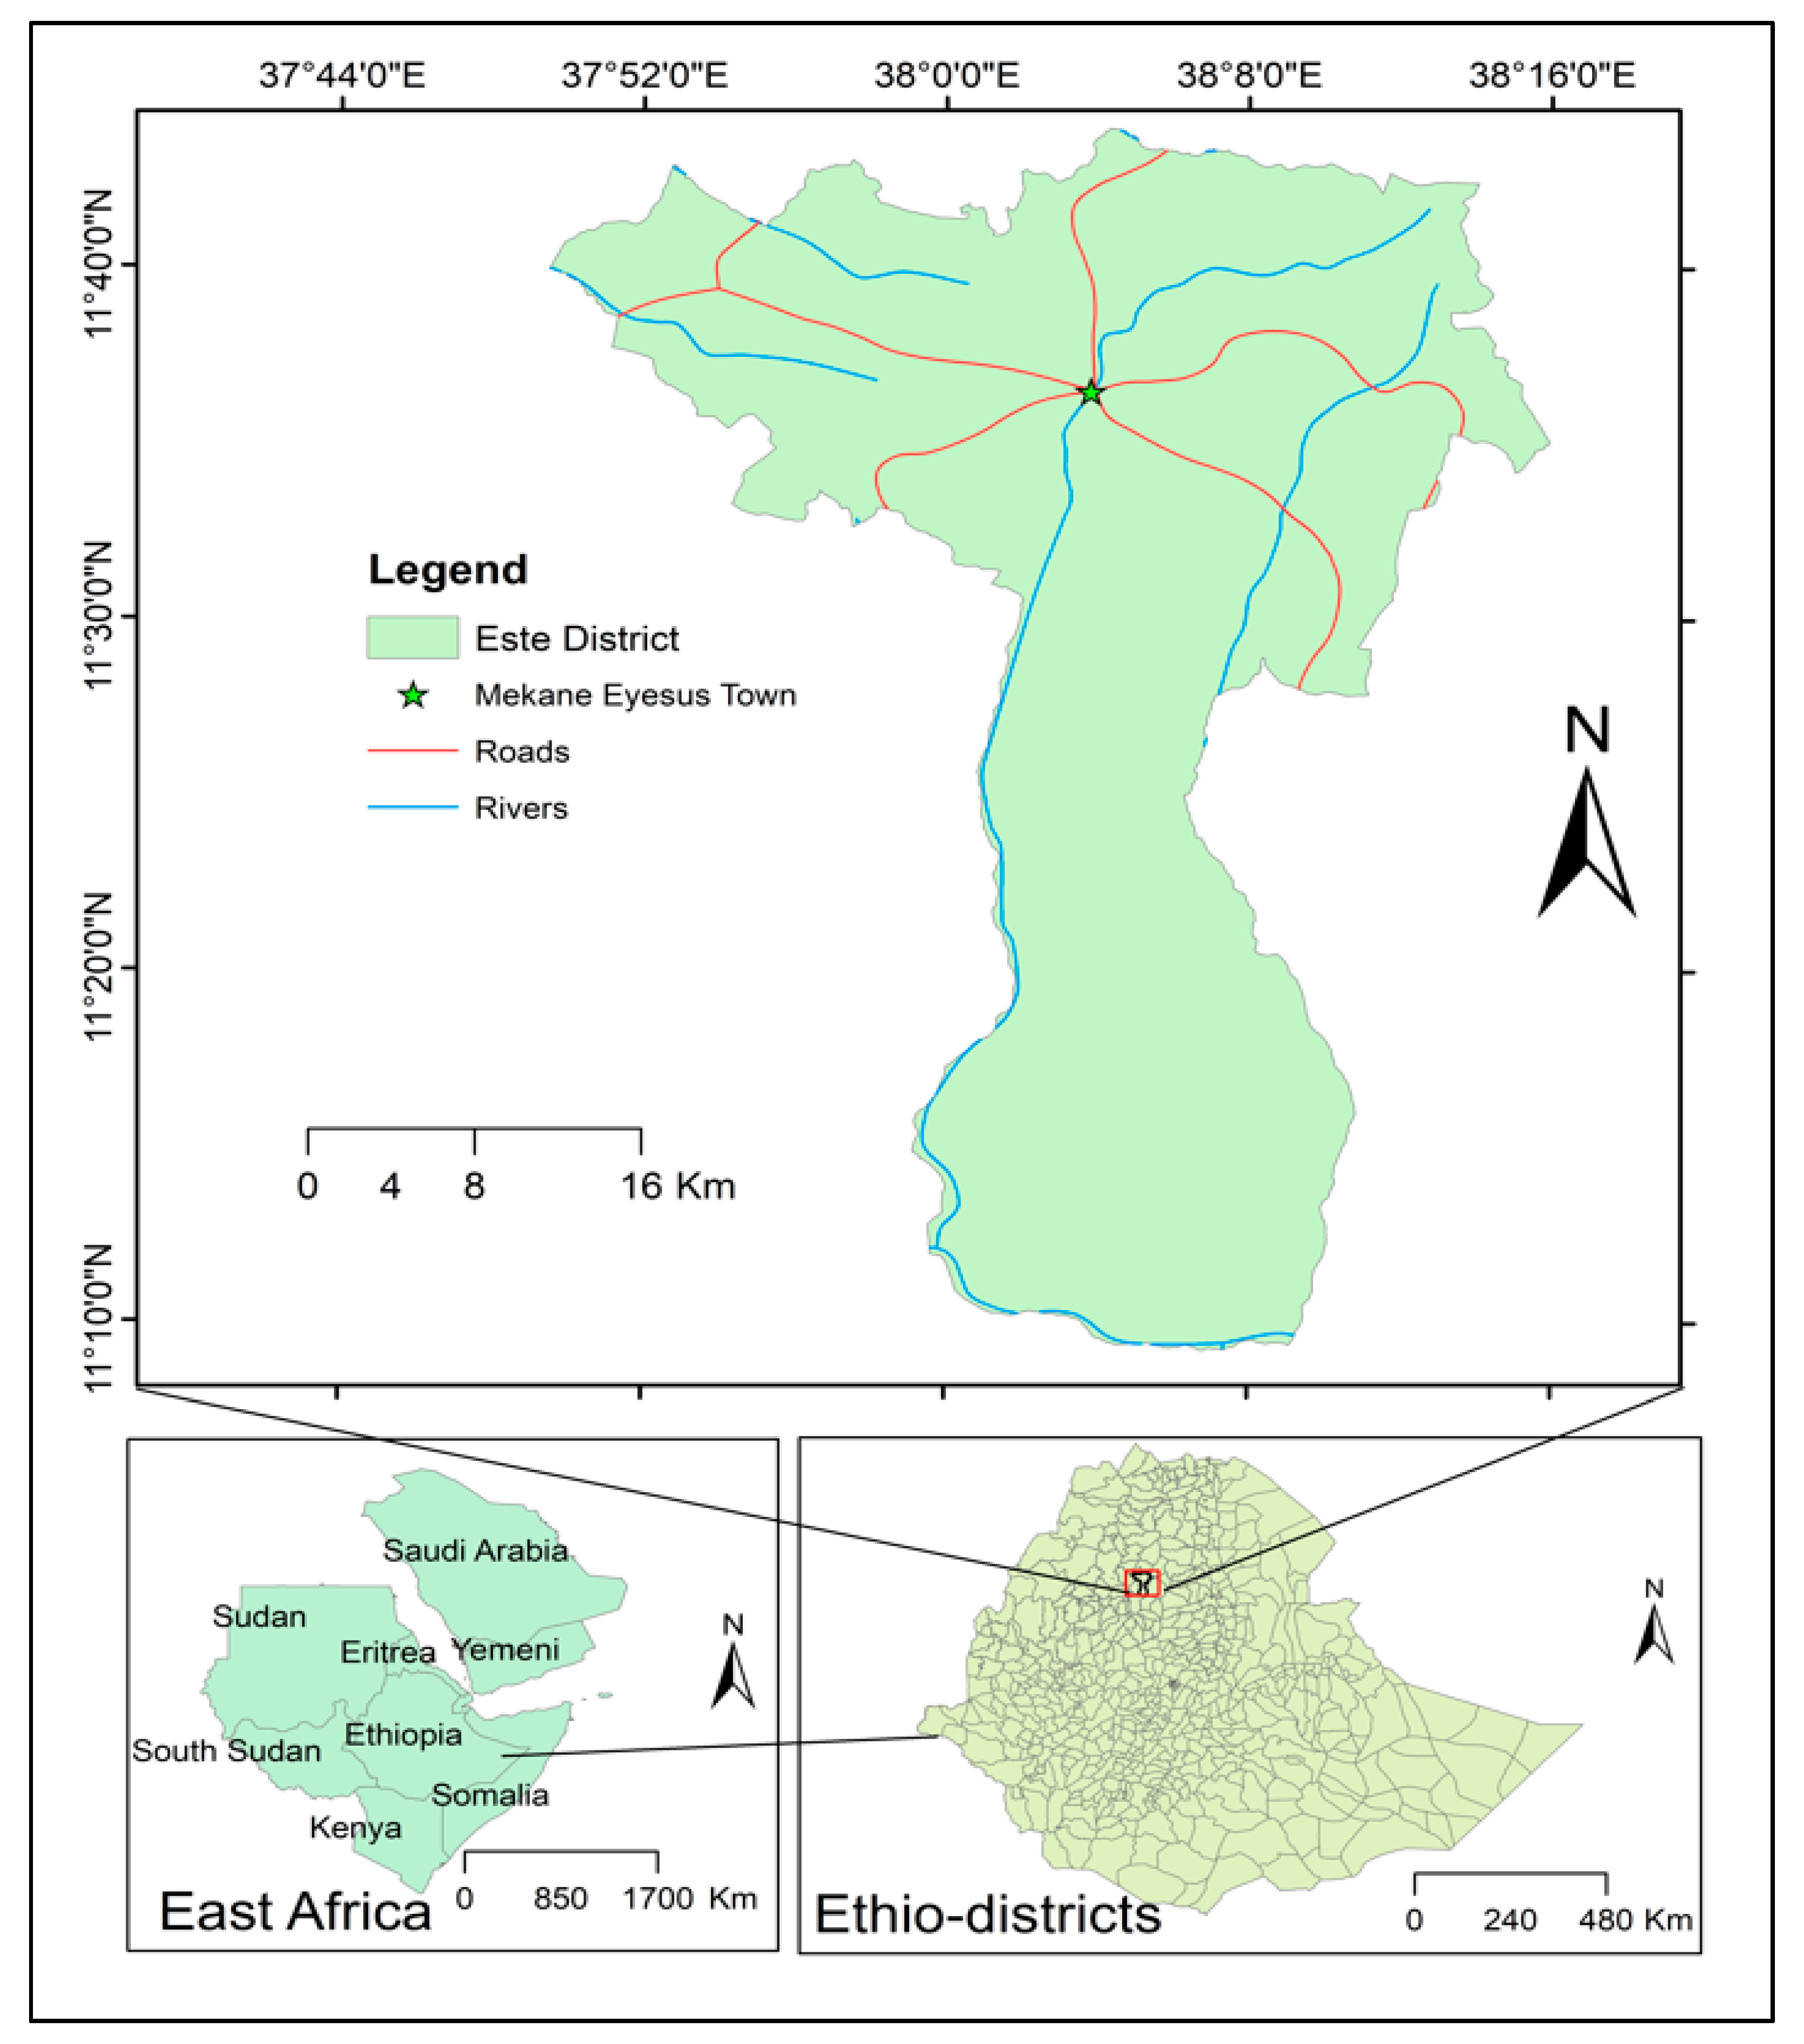
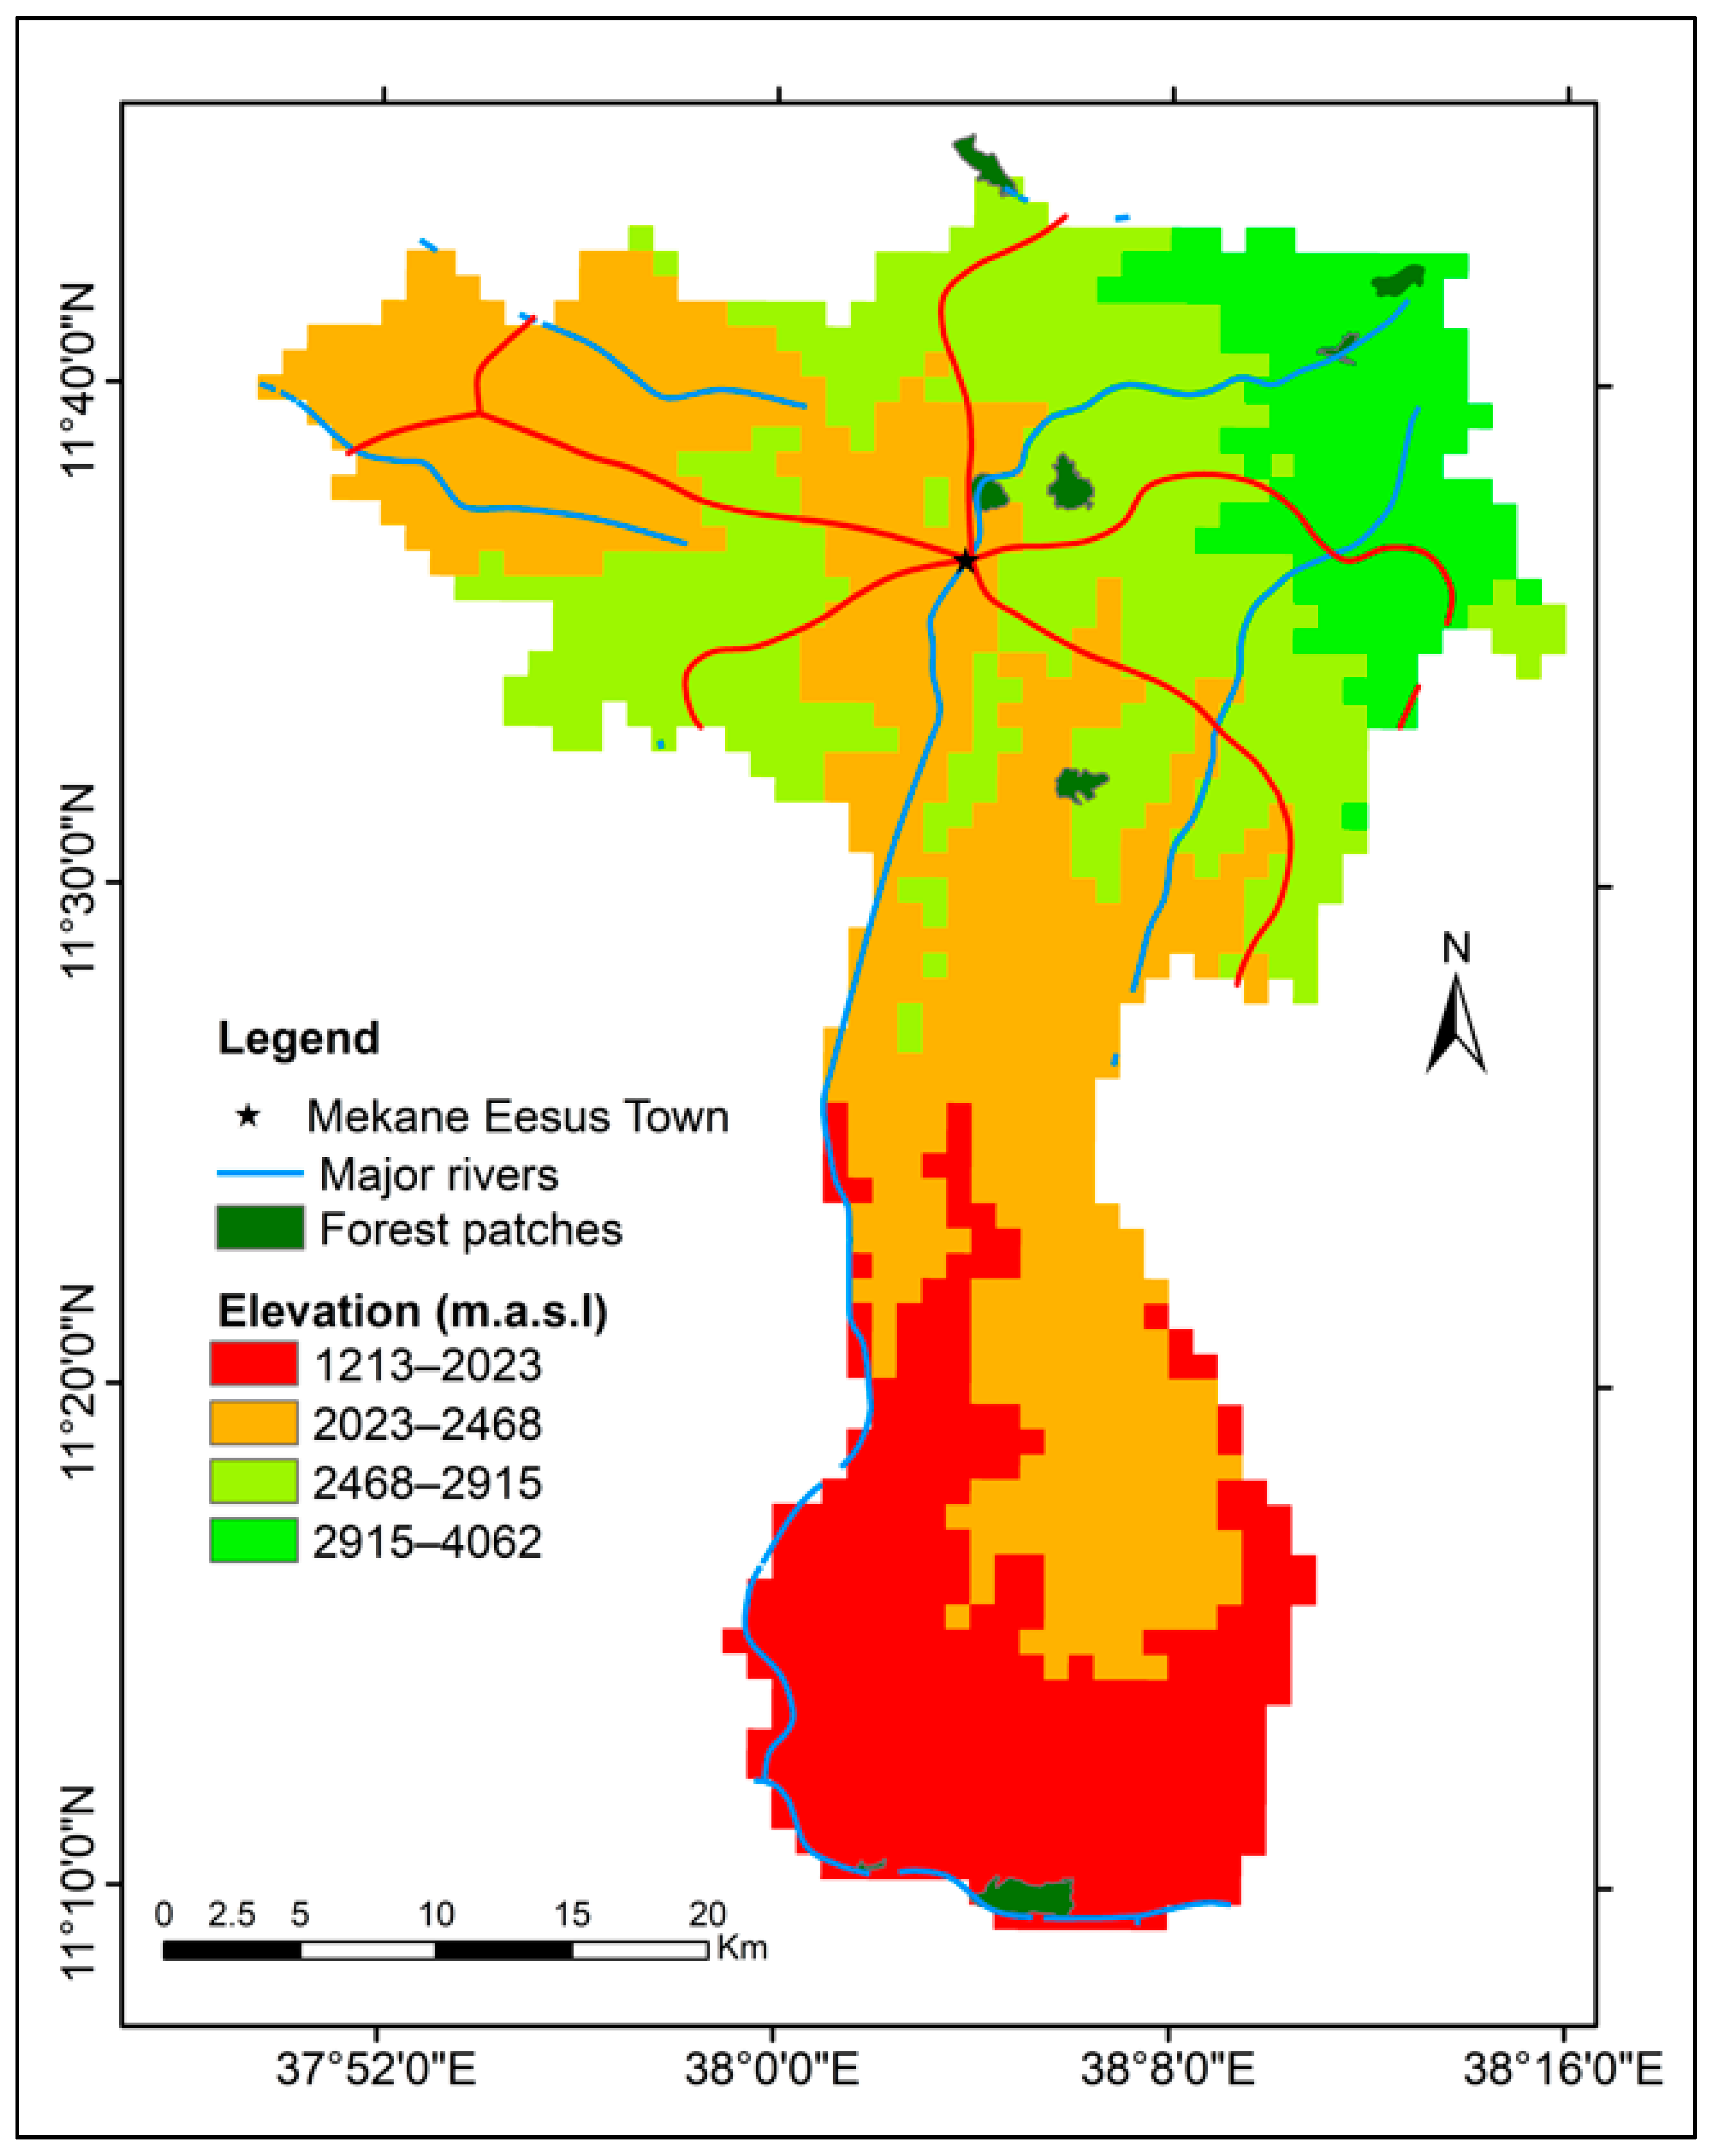
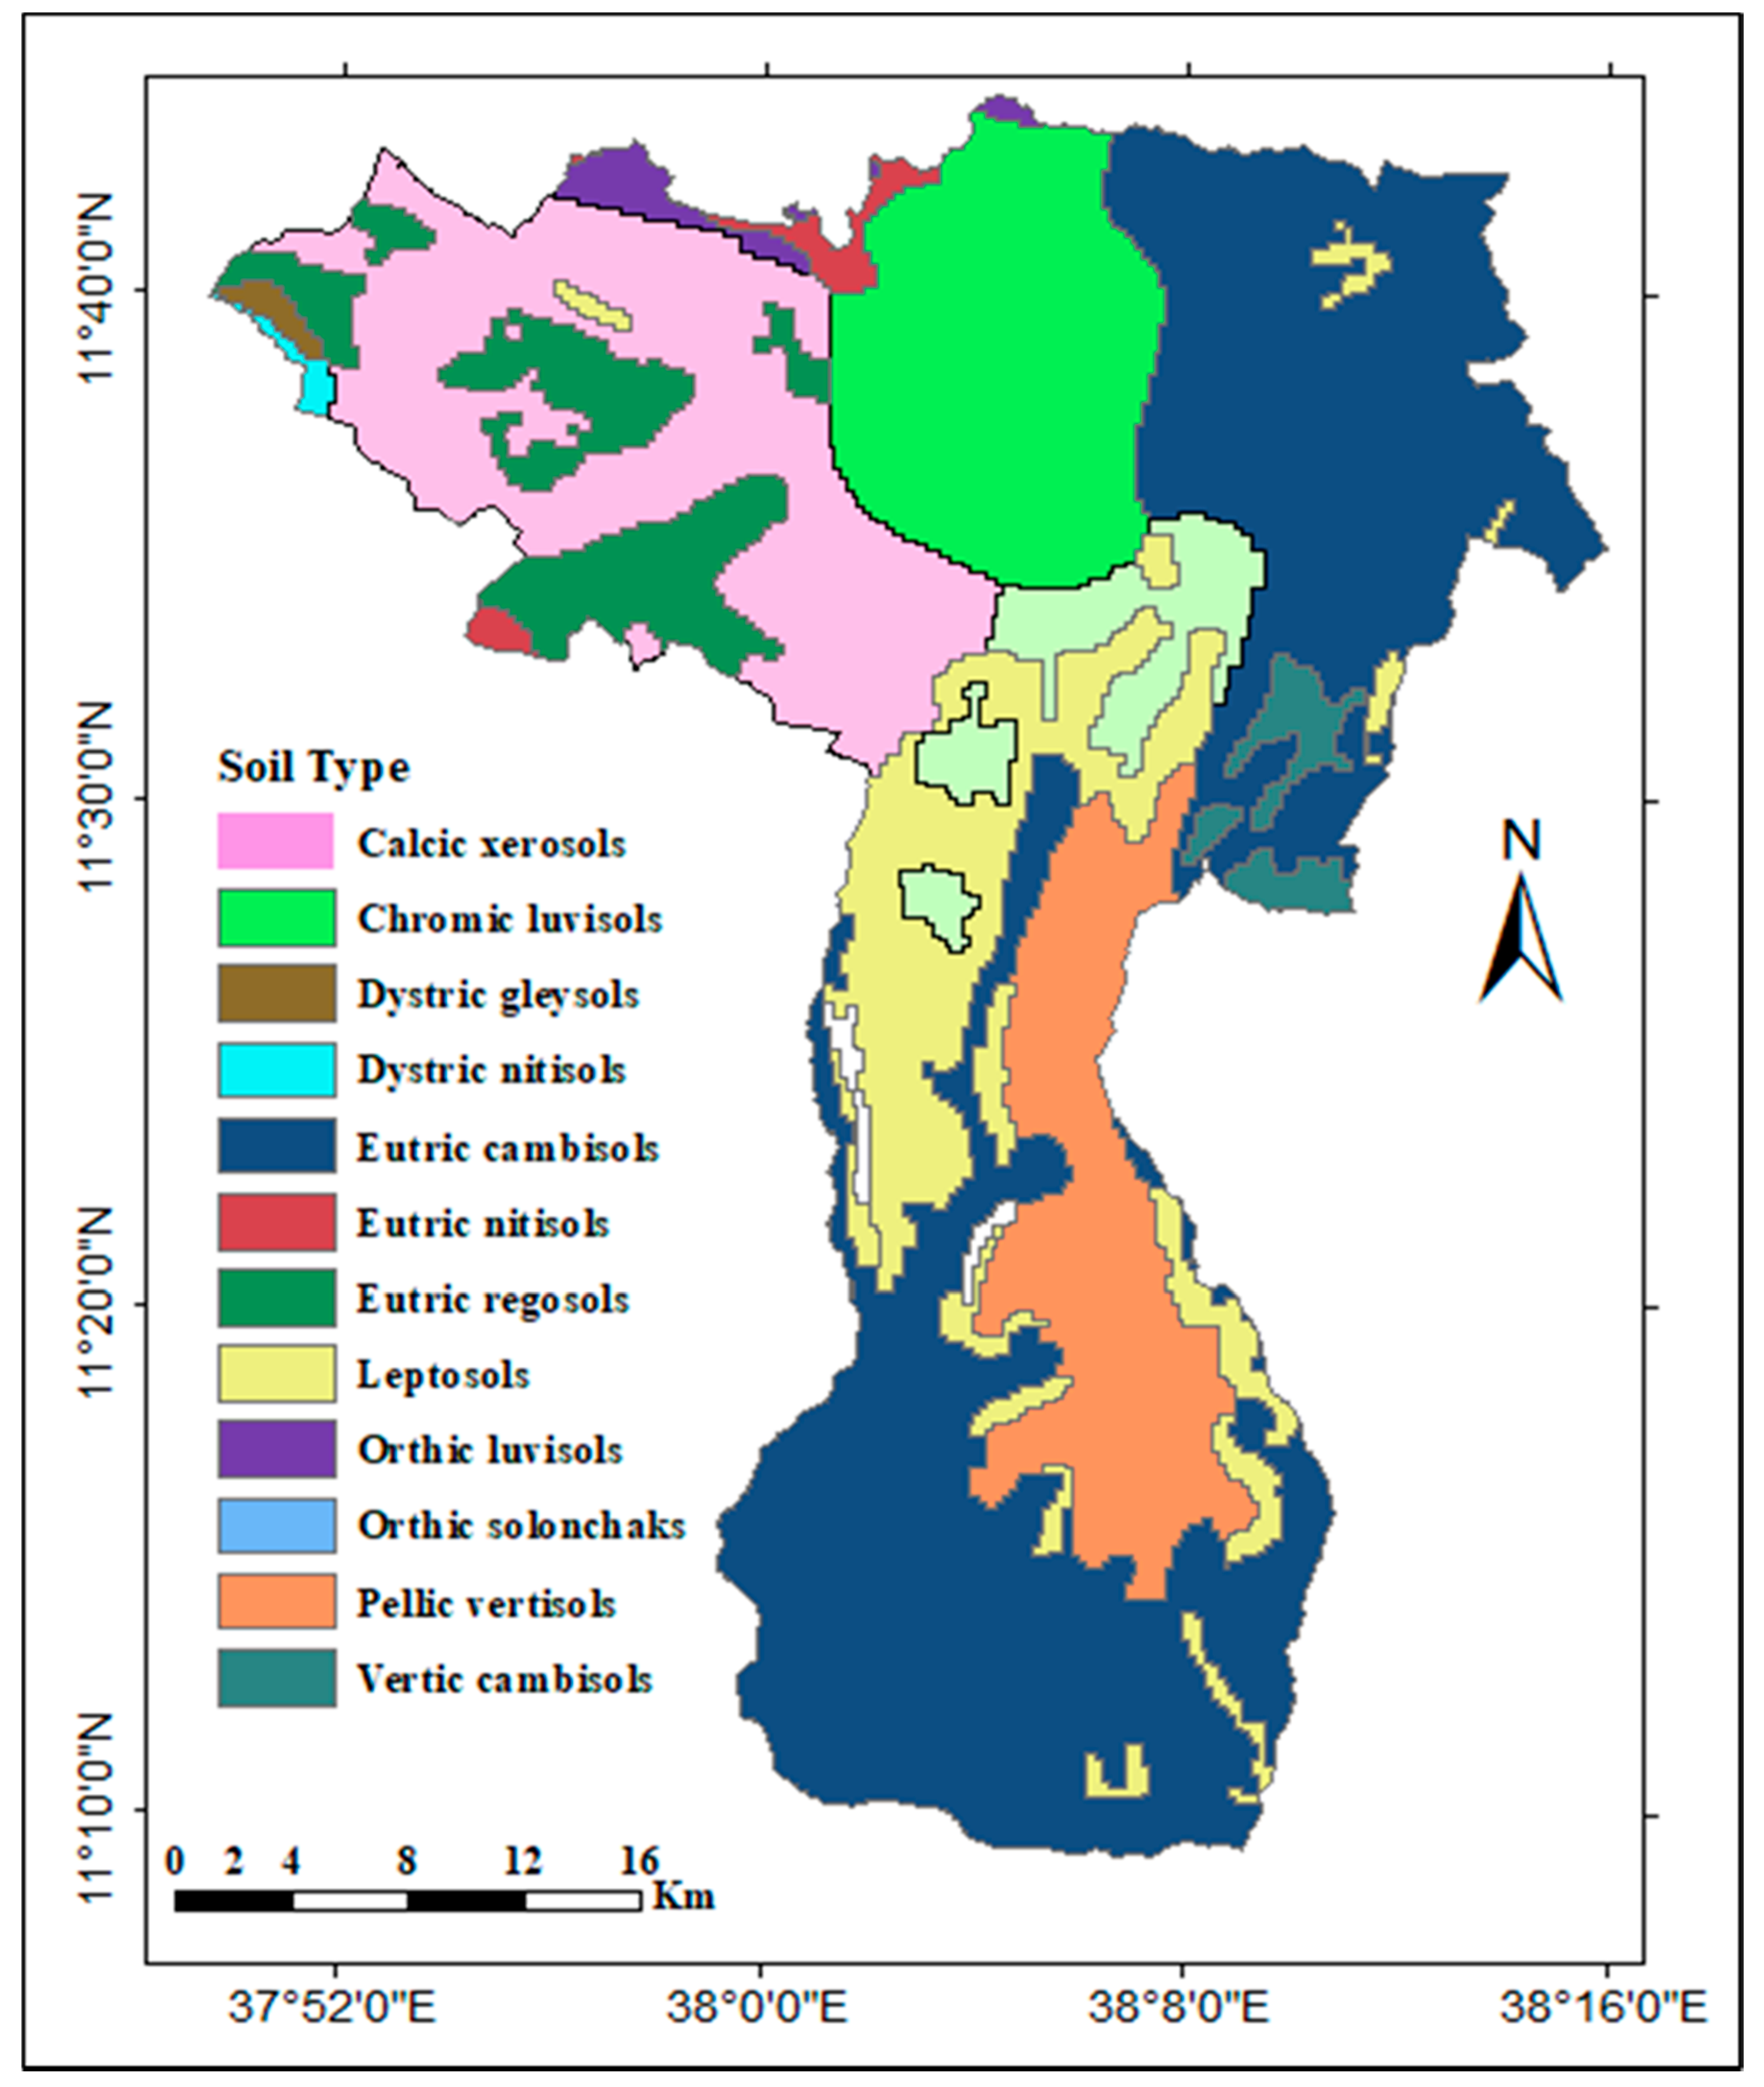
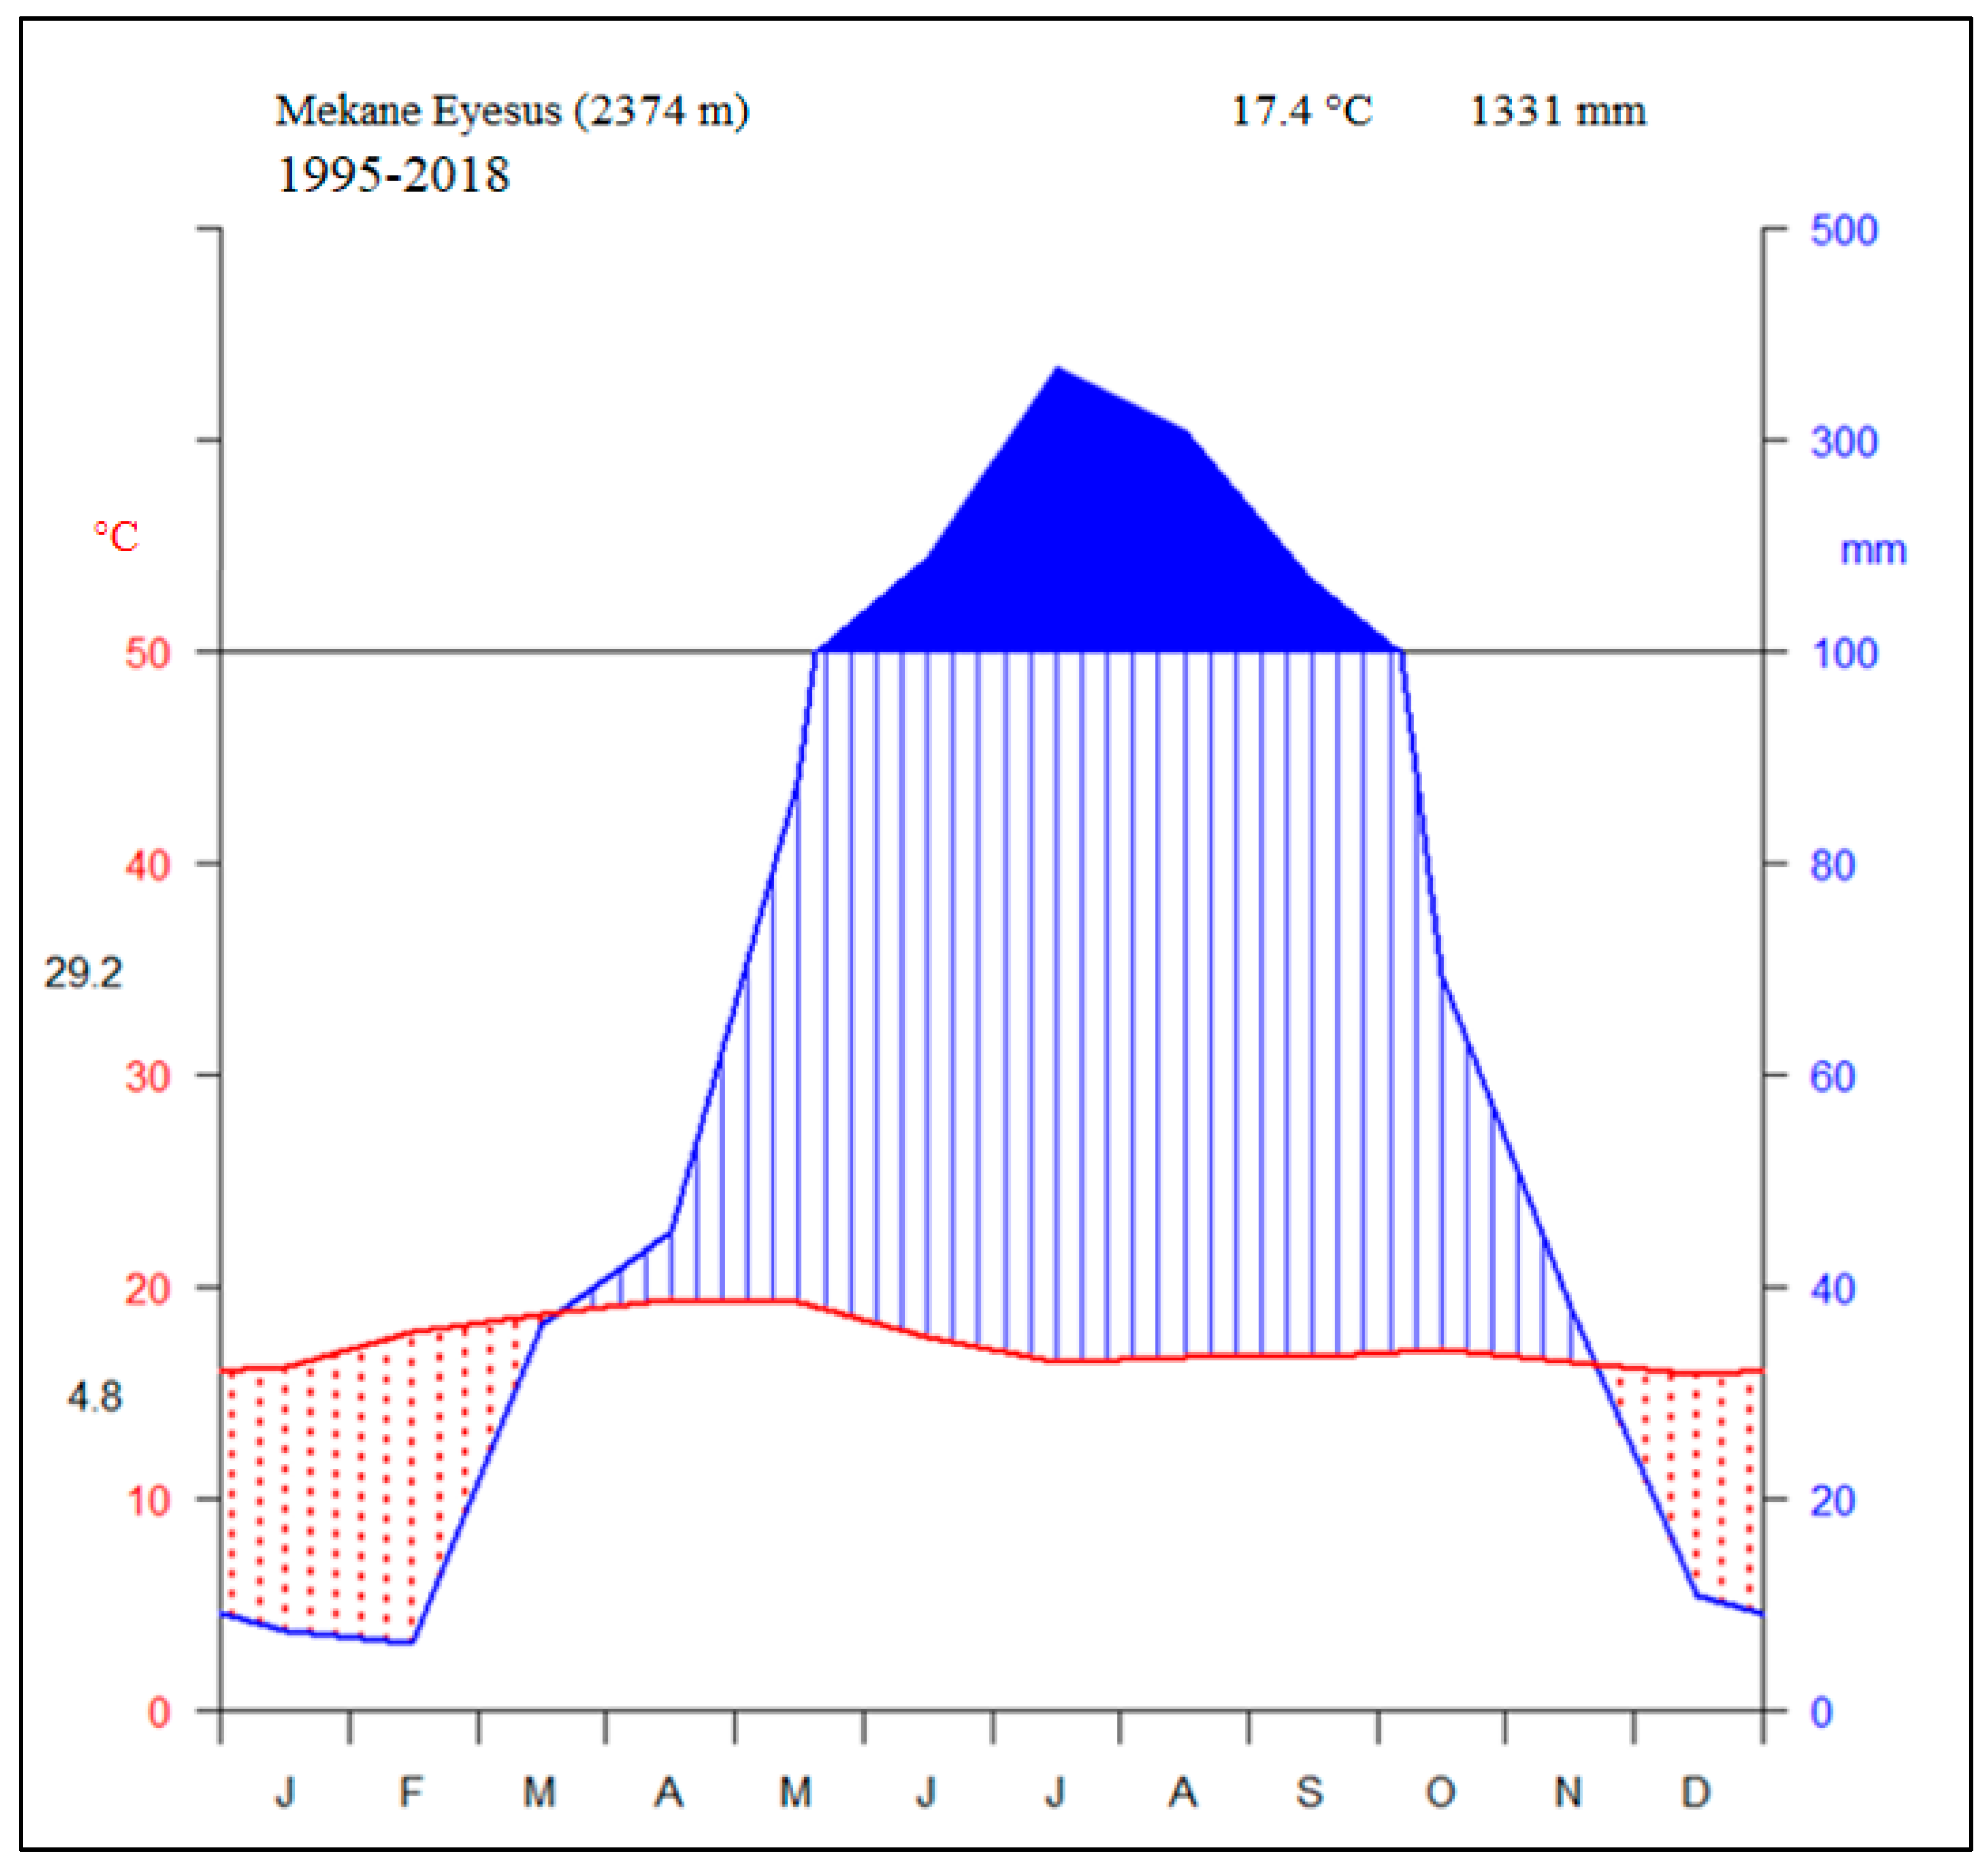
2.1. Descriptions of the Study Area

Este District is bordered by the Simada and Lay Gaynt districts to the east, the Farta District to the north, the Andabet District to the west, and the East Gojjam Administration Zone to the south. The district extends from 37°50′00″ to 38°16′00″ E and 11°10′0″ to 11°55′0″ N. The total area of the district is approximately 1365.2 km2 (Figure 1).
Este District is characterized by high mountain peaks and plateaus of the Guna mountain range (4062 m. a. s. l.) in the north, and hills with many slopes steadily diminishing towards the west, culminating at the Blue Nile Gorge (1200 m. a. s. l.). Although the altitude of the study area ranges from 1200 m. a. s. l. to more than 4062 m. a. s. l., the main surface area lies between 1800 and 2800 m. a. s. l. (Figure 2). Rivers, such as Saga, Gumara, and Wanka, and the tributaries of the Blue Nile river flow from the north to the south of the district (Figure 2).
According to Ethiopia’s Central Statistical Agency [25], the human population in the district was estimated to be more than 211,000, of which 108,000 and 103,000 were male and female, respectively. The majority (197,000) of the population live in rural areas while the remaining small portion (14,000) live in urban areas [25].
Mekane Eyesus town is the capital city of the district. Even though the Este District population is largely comprised of youths, there is a slight decrement in the 0–4-year age group in recent times. The majority of the population (65%) is under 25 years [25].
There are three major ecosystem types in the district, namely Afroalpine, sub-Afroalpine and, Dry Evergreen Montane forest ecosystems. These ecosystems are found in the altitudinal range of high (>3200 m. a. s. l.), medium (between 1900 and 3400 m. a. s. l.), and low mountains (500 and 1900 m. a. s. l.) [26], respectively. The district produces “Teff” (Eragrostis tef, which is a staple cereal crop), and other crops, such as maize (Zea mays L.), barley (Hordeum vulgare L.), wheat (Triticum aestivum L.), sorghum (Sorghum bicolor L.), peas (Pisum sativum L.), beans (Faba bean L.), and potatoes (Solanum tuberosum L.).
As the Digital Elevation Model (DEM) indicated four soil types (Eutric, Calcic, Chromic, and Luvisols) occupy nearly half the district’s surface area (Figure 3). There are eight major soil types (Calcic, Chromic, Dystric, Eutric, Leptosols, Orthic, Pellic, and Vertic soils) and 12 subsoils types (Figure 4) in the district as FAO-UNESCO soil classification system [27,28].
The climate data of the district were obtained from the Ethiopian Meteorological Agency, Mekane Eyesus Station, and Global Weather Data for SWAT (https://globalweather.tamu.edu/, accessed on 20 November 2019). The climate in the study area is a unimodal type of rainfall [29]. The annual precipitation and annual mean temperature were 1331 mm and 17.4 °C, respectively (Figure 4).

2.2. Data Collections

Data collection and analysis were categorized into four major processes: downloading, post-classification, classification, and verification. ERDAS IMAGINE 2015 and ArcGIS 10.3.1 were used to process Landsat satellite images of the study area. We collected ancillary data, topo-sheets, and shapefiles from the field, Ethiopian map agency, and webs, such as Diva-GIS (https://www.diva-gis.org/datadown, accessed on 2 December 2019), respectively. Generally, we followed the main steps shown in the following workflow (Figure 5).
Three remotely-sensed Landsat images were acquired in dry and cloud-free seasons from the Earth Explorer (http://earthexplore.usgs.gov, accessed on 9 December 2019). The following table shows the image (satellite image) source, resolution, direction, row, and image acquisition date (Table 1).

2.2.1. Pre-Classification

After being geometrically corrected, the satellite images were reprojected to WGS 1984 UTM, zone 37N. In the pre-classification process, two steps were performed: layer stacking and sub-setting. Layer stacking combines seven images with different bands and helps create a clear view of the image in the classification process [30]. Similarly, a sub-setting image helps to concentrate attention on a small site in the classification process [30] and is shown in the figure (Figure 6).

2.2.2. Classifications

We performed the steps following supervised classification methods to characterize the LULC changes of Este District with ERDAS IMAGINE 2015 [27,28,31,32,33]. The sub-set and mosaic images were classified into six classes: forests–shrublands, croplands, grasslands, settlements, water bodies, and bare lands. The classification was created based on the signatures collected from the available pixels of the area of interest (Este District). After selecting the training areas, the maximum likelihood classification algorithm was used to classify the images. Table 2 offers an overview of the land-use and cover groups identified in the research (Table 2).

2.2.3. The Verification and Clipping Processes

Eight hundred and sixty training points were used: 214, 341, and 305 from fields, historical Google Earth Pro imagery and a topo-sheet for images of 1984, 2000, and 2018, respectively, following Abineh and Bogale [34] and Czaplewski [35]. The area of interest was then clipped using ArcGIS 10.3.1. The classes and values of the reference data was matched in Excel 2013, copied and pasted in Notepad, and saved as readable (ANCI format) by ERDAS IMAGINE 2015. We classified the image into land-use and land-cover types after entering the image data into ERDASS IMAGINE 2015. Before the accuracy level and kappa statistics were observed as >85% and 0.85, respectively, the classification was repeated several times to achieve the desired level of the accuracy [36]. We clipped the area of interest using ArcGIS 10.3.1. The software was used to draw the clipping process to the area of interest.

2.2.4. Causes, Derivers, and Perceptions of Population to the LULC Changes in the Study Area

Data on the population of the district for 1984 to 2018 were obtained from the South Gondar Administration Zone, Economic, and Finance Department, and the Ethiopian Central Statistical Agency, to analyze the possible association of the population growth and the extent of LULC classes.
The rate of change of the LULC values was calculated by comparing the change in the value of each LULC class with the value’s change rate, with the value of the previous year. Additionally, 450 key informants (40 years old and higher) were selected to share their perceptions on the LULC changes in their area, from 10 November to 9 December 2020. The informants were chosen in two stages. First, five of the minor administrative units (“kebeles” = Amharic) were selected at random (four from dry evergreen Afromontane forests and one from Afroalpine and sub-Afroalpine ecosystems types). Second, representative households in the “kebele” and informants were chosen based on their age and recommendations from the district agricultural officers. Interviews and focus groups were then held with the key informants.

2.3. Data Analysis

The area in km2 of each LULC class and total study area was calculated using ArcGIS 10.3.1 and Excel 2013, respectively [37,38]. The last LULC map was reclassified using ArcGIS 10.3.1 to identify the LULC class changes from 1984 to 2018. The reclassified raster image was transformed into a polygon using raster-to-polygon conversion tools. Two polygons were intersected using intersect tools (1984 with 2000, 1984 with 2018, and 2000 with 2018), and the area was measured using a geometric calculator in ArcGIS 10.3.1. Each LULC class’s area was saved in a dBase file format. PivotTable in Excel 2013 was used to define the unchanged position, and was subjected to change. Intersect methods in ArcGIS were used to test the transition matrixes between the analyzed years and classes of the LULC, followed by PivotTable in Excel 2013. The importance of the change matrix is to identify the dynamics of the LULC classes [39,40]. The change, which is the lost or gained value of the changes in each LULC class of the two years, was calculated as the common values of the two years subtracted from the row total values and column total values [34]. Bar graphs and change matrix tables were produced to compare the LULC classes of the different years (1984, 2000, and 2018) using a statistical program R [41] and MS Excel 2013, respectively. The association between the LULC and potential derivers was tested using correlation analysis in R package Hmisc [42]. In addition, the perception of the local communities towards the LULC changes was evaluated using a scale from 10 to 100% values.

3. Results

3.1. The Accuracy Assessment

Table 3 displays the accuracy values of the overall and classes of the study. The overall accuracies of old (1984), medium (2000), and current (2018) image classifications were 99.3%, 96.1%, and 91.5%, respectively (Table 3). Similarly, the Producer’s Accuracy (%), User’s Accuracy (%), and Kappa Statistics lied in 80–100, 88–100 and 0.90–0.99, respectively (Table 3).

3.2. LULC Classes of Este District in the Last Four Decades

Croplands, forests–shrublands, grasslands, bare lands, settlements, and water bodies were the LULC classes identified from satellite images arranged in decreasing order (Figure 7). The dominant class was croplands (60.8%), followed by forests-shrublands (25.4%) in 1984, and continued to dominate until 2000. Croplands accounted for at least 50% of the district (51 to 62%) in 1984, 2000, and 2018 (Figure 7 and Table 4).
The second largest LULC class, next to croplands until 2000, was forests–shrublands (243.4–346.4 km2~18 to 25% of the study site). In contrast, the least dominant class was the water bodies (0.1%) (Table 4). The intermediate classes were the grasslands (122.5 km2~9.0% of the site) and bare lands (59.0 km2~4.3%). However, after 2000, most of the forests–shrublands (150.4 km2 or 50% of total forests–shrublands) were converted to croplands (186.0 km2~8% of total croplands) and grasslands (5.4 km2~5% of the grasslands) (Table 5). Although the cropland remained as the dominant LULC class, they have greatly reduced from 851.5 km2 (62%) in 2000, to 694.0 km2 (51%) in 2018. Forests–shrublands cover decreased from 243.4 km2 (18%) in 2000, to 204.7 km2 (15%) in 2018. In contrast, grasslands and settlements increased from 216.7 km2 (16%) and 6.2 km2 (0.5%) in 2000, to 424.4 km2 (31%) and 13.1 km2 (~1%) in 2018, respectively (Figure 8 and Table 4).
The areas (km2) and percent cover (%) of each LULC type are shown in Table 4. During 2000, the study also identified that croplands reached their maximum (62%) (Table 4).

3.3. Land-Use and Land-Cover Change Rates in Este District

There were four trends for the LULC shift rates (increment, decrement, constant, and both increment and decrement trends). During the study periods, some land-cover classes expanded (settlement and grassland), others shrank (forest–shrubland and bare land), and others remained relatively constant (water body). The cropland increased in the first period (1984 to 2000), but decreased in the second period (2000–2018). The cropland, grassland, and settlement areas increased by 2 km2, 8 km2, and 0.015 km2 per year, respectively, until 2000. On the other hand, the water body, bare ground, and forest–shrubland decreased by a rate of 0.06 km2, 1 km2, and 7 km2 per year, respectively, during the same years. The increment in the cropland was at the expense of the forest–shrubland (17.5%) and some bare land (1.8%). 12:25 PMCropland increased at the expense of the forest–shrubland, some part of it (12%) changed into grassland. In the second period (2000–2018), the grassland and settlement continued to increase at a rate of 12 km2 and 0.5 km2 per year, and cropland and bare land decreased at a rate of 9 km2 and 1 km2 per year, respectively. Some cropland changed to other LULC classes at the expense of non-cultivated and new lands, especially the forest–shrubland. The water body showed a relatively constant change. However, a significant and dynamic change was observed in the grassland and settlement (both positive change), and the forest–shrubland and bare land (both negative change) parts of the LULC changes (Table 5).
The most considerable net change (−7.6%) between 1984–2000 was in the forest—shrubland, the most being the conversion to cropland. The second (6.9%) and third (1.7%) most significant LULC changes occurred in grasslands and croplands, respectively (Table 6).
A small portion of cropland (<2%) was changed into forest–shrubland from 1984 to 2018. However, a large amount of forest–shrubland (>11%) was converted into cropland during the same years (Table 7).
Similarly, a significant net change was observed in grasslands (22%) followed by forests–shrublands (−10.4%) during 1984–2018. In contrast, a minor net change was observed in the water body class (Table 8).
The interchange between grasslands and croplands was high from 2000 to 2018. About 57.8 km2 (27.2%) of the grassland was converted into cropland, while 237.9 km2 (27.6%) of the cropland changed into grassland (Table 9).
The most significant net shift was observed in the grassland (15%), followed by cropland (−11%) from 2000 to 2018 (Table 10).

3.4. The Potential Causes of the LULC Changes in Este District

The correlation analysis between the LULC classes and demography and climatic condition, showed that the most determinant factor for all the classes of LULC changes was the growth in the human population. Population exerts a significant pressure on some LULC classes (grassland, water body, and settlement, r = 0.82 and p-values = 0) and others (cropland, bare land, and forest–shrubland, r = −0.96 and p-values = 0). Of the seven environmental factors (both demographical and climatic) that were tested for their impact on the LULC changes, three variables, population growth, precipitation, and solar radiation, have been identified to strongly and significantly influence the dynamics of the LULC changes (Table 11). The grassland and settlement showed positive changes, while the bare land and forest–shrubland showed negative changes. In contrast, the cropland showed both negative and positive changes during the last four decades in Este District (Figure 9).
Compared with the remaining environmental conditions, the minimum temperature also affected the cropland and water body dynamics in the study area at a nearly significant level (Table 11).

3.5. The Experiences and Perceptions of Local People towards the LULC Changes

Participants in the focus groups and primary informants provided their personal views and impressions of the LULC changes in the last four decades. Accordingly, they stated that the expansion in the settlements and grasslands was progressive and the factors behind the LULC changes were population growth and uncontrolled grazing in the district. According to the participants, the local people previously practiced free grazing. However, currently, they keep improved cattle varieties and practice stall feeding. The stall feeding resulted in the expansion of the settlements and grasslands in the district. The shrinkage of forest–shrubland cover in the district appears to be the clearing of forests and shrublands by the landless and jobless youth, to produce cereals and pulses in response to the growing demand for food by the rapidly growing population. There is some reconversion of old agricultural fields to grasslands for alternative income, from selling grass or feeding improved cattle for more milk production, which is in high demand (Table 12).

4. Discussion

The results of the level of accuracy in this study, suggested that the classification process achieved its highest level of reliability of the information. Many research works agree that the accuracy of classification is acceptable if it is greater than 85 [43,44]. Classification accuracy may be influenced by a variation in the quality of images, such as cloud cover [45], and post-classification correction with ancillary data [46].
In this study, cropland, on average, accounted for more than 58% of the study area. This result is consistent with the findings of Dagnenet et al. [20], Solomon et al. [47], and Woldeamlak [48]. Hagos [49] and Tatek and Ayalew [50], indicated that croplands accounted for about 66% and 84% in Huluka and Muga water shades, respectively. Other studies conducted to determine LULC dynamics, indicated the expansion of croplands [17,19,47,48]. Still, other studies showed no change in the cropland area due to the intensification of agriculture or an increase in crop production per unit area of land [51], and the conversion of cropland into settlements [52] and grasslands to ameliorate soil fertility [53] and to feed livestock for better means of income than crops [54].
This study showed that grasslands and settlements increased considerably in the period considered (1984 to 2018). The net change in the grasslands was considerably high (15–22%) compared to the other classes of LULC. A similar study was reported from the Derekoli catchment, from 1980 to 2000 [55], the Komto forest area from 1990 to 2020 [56], the Somado watershed [57] in Ethiopia, and the Greater Accra Metropolitan area in Ghana from 1991 to 2000 [58]. The expansion of grasslands was also reported in Northern Chiba, Japan [59], and the cause of the expansion in grasslands is attributed to livestock feed, production, soil fertility, rehabilitation, and biodiversity conservation [54]. The driving force behind the expansion of settlement areas is attributable to population growth and government policies in favor of urbanization [60].
This result showed a significant and pertinent connection between population growth, precipitation, and solar radiation and land-use and land-cover classes. The literature is replete with similar findings [61]. The findings of several studies on the effect of climate change on the LULC (for example, Brandon [62], Dale [63], and Liu et al. [64]) are consistent with the findings of the current study. Additionally, nearly similar research on the experiences and perceptions of local elders on the potential drivers of LULC changes have been reported from neighboring areas, such as the Koga catchments [24] and Muga watersheds [48]. The similarity in the results may be due to the similarity in the LULC drivers [24,65].
This study can be used to understand the relative size of each LULC class and devise a plan to maintain the balance of the land’s components [66]. For example, knowledge on the current extent of forest damage is crucial for restoring deforested areas or protecting current forest cover from extra-deforestation [67]. This study can also serve as a starting point for current or future development strategies involving land resource allocation for diverse human purposes [66]. The bare land, particularly if used for settlements, and the other areas for agriculture, forest, and other land-use categories can be important for the wise use of natural resources, such as land [68].

5. Conclusions and Recommendations

In this study, the LULC dynamics study was analyzed in the Este District (in the South Gondar zone, the Amhara regional state, Ethiopia), with the objectives of identifying the major LULC classes and the dynamics in the specified classes during the last four decades (1984–2018), and analyzing the drivers of these changes. During the study period, six major land-cover classes were established for the last four decades in the study site (1984–2018). Croplands, forests–shrublands, grasslands, bare lands, settlements, and water bodies were the classes in decreasing order. The LULC changes in Este District during the last four decades showed three patterns: some classes increased, while others decreased and others did not show a clear direction of change. The grasslands and settlements expanded, while the forests–shrublands and bare lands declined, and the cropland grew in the first phase (1984–2000) but declined in the second (2000–2018). Relatively, steady-state change was observed in the water body. The dominant LULC change was mainly from forests–shrublands to croplands. Towards the end of 2018, the rate of the grassland expansion had been gradually rising in the study region. Climatic factors, such as solar radiation and precipitation, and demographic factors, such as rapid population growth, were the major forces for the conversion of forests–shrublands into cultivated land. The remaining climatic variables, such as the wind velocity and temperature, were found to have no significant effect on the LULC changes in the Este District. Moreover, the respondents shared their perceptions and experiences. They agreed that the implementation of controlled grazing and improved cattle varieties in the district resulted in the expansion of the grasslands and the decrease of croplands in the district. The growing number of improved cattle varieties increased alternative sources of income for the local community. This research suggests that the concerned body, especially the district leaders, should intervene in establishing sustainable land-use to reverse or mitigate the impacts on undesirable LULC changes, primarily by halting forests–shrublands conversion to cultivated lands.

Author Contributions

Conceptualization, D.G., Z.W., S.N. and E.A.; methodology, D.G.; software, D.G.; validation, Z.W., S.N. and E.A.; formal analysis, D.G.; investigation, D.G.; resources, D.G.; data curation, D.G.; writing—original draft preparation, D.G.; writing—review and editing, D.G., Z.W., S.N. and E.A.; visualization, D.G., Z.W., S.N. and E.A.; supervision, Z.W., S.N. and E.A.; project administration, Z.W., S.N. and E.A.; funding acquisition, D.G. All authors have read and agreed to the published version of the manuscript.

Funding

This research received no external funding.

Institutional Review Board Statement

Not applicable.

Informed Consent Statement

Not applicable.

Data Availability Statement

The data presented in this study are available on request from the first and corresponding author.

Acknowledgments

Authors thank Addis Ababa University and Debre Tabor University, both in Ethiopia, and IDEA WILD, non-profitable organization in USA, for supporting and sponsoring this research. Este District community, South Gondar Zone, Amhara Region, north-western Ethiopia are acknowledged for their hospitality.

Conflicts of Interest

The authors declare no conflict of interest. The funders had no role in the design of the study; in the collection, analyses, or interpretation of data; in the writing of the manuscript; or in the decision to publish the results.

References

  1. Lambin, E.F.; Geist, H.J.; Lepers, E. Dynamics of land-use and land-cover change in tropical regions. Annu. Rev. Environ. Resour. 2003, 28, 205–241. [Google Scholar] [CrossRef]
  2. Roy, P.S.; Roy, A. Land-use and land-cover change: A remote sensing & GIS perspective. J. Indian Inst. Sci. 2010, 90, 489–502. Available online: https://www.researchgate.net/publication/235987981 (accessed on 21 February 2019).
  3. Britz, W.; Verburg, P.H.; Leip, A. Modeling of land cover and agricultural change in Europe: Combining the CLUE and CAPRI-Spat approaches. Agric. Ecosyst. Environ. 2011, 142, 40–50. [Google Scholar] [CrossRef]
  4. Fox, J.; Vogler, J.B. Land-use and land-cover change in Montane Mainland Southeast Asia. Environ. Manag. 2005, 36, 394–403. [Google Scholar] [CrossRef]
  5. Hassan, Z.; Shabbir, R.; Ahmad, S.S.; Malik, A.H.; Aziz, N.; Butt, A. Dynamics of land-use and land-cover change (LULCC) using geospatial techniques: A case study of Islamabad Pakistan. SpringerPlus 2016, 5, 812. [Google Scholar] [CrossRef]
  6. Singh, M.; Gairola, S. Land-use/land-cover change detection using geospatial technique: A case study of Sahaspur Block in Dehradun District (Uttarakhand). Int. J. Sci. Res. Sci. Eng. Technol. 2015, 4, 4–7. [Google Scholar]
  7. Goldewijk, K.; Ramankutty, N. Land-cover change over the last three centuries due to human activities: The availability of new global data sets. GeoJournal 2004, 61, 335–344. [Google Scholar] [CrossRef]
  8. Bodart, C.; Brink, A.B.; Donnay, F.; Lupi, A.; Mayaux, P.; Achard, F. Continental estimates of forest cover and forest cover changes in the dry ecosystems of Africa between 1990 and 2000. J. Biogeogr. 2013, 40, 1036–1047. [Google Scholar] [CrossRef]
  9. Koranteng, A.; Adu-poku, I.; Donkor, E.; Zawiła-niedźwiecki, T. Geospatial assessment of land-use and land-cover dynamics in the mid-zone of Ghana. Folia For. Pol. 2020, 62, 288–305. [Google Scholar] [CrossRef]
  10. Liu, X.; Ren, L.; Yuan, F.; Singh, V.P.; Fang, X.; Yu, Z.; Zhang, W. Quantifying the effect of land-use and land-cover changes on green water and blue water in northern part of China. Hydrol. Earth Syst. Sci. 2009, 13, 735–747. [Google Scholar] [CrossRef]
  11. Mukherjee, S.; Bebermeier, W.; Schütt, B. An overview of the impacts of land-use land-cover changes (1980–2014) on urban water security of Kolkata. Land 2018, 7, 91. [Google Scholar] [CrossRef]
  12. Shiferaw, A.; Abate, S. Evaluating the land-use and land-cover Dynamics in Borena Woreda of South Wollo Highlands, Ethiopia. J. Sustain. Dev. Afr. 2011, 13, 87–107. [Google Scholar] [CrossRef]
  13. Tully, K.; Sullivan, C.; Weil, R.; Sanchez, P. The state of soil segradation in Sub-Saharan Africa: Baselines, trajectories, and solutions. Sustainability 2015, 7, 6523–6552. [Google Scholar] [CrossRef]
  14. Bajocco, S.; de Angelis, A.; Perini, L.; Ferrara, A.; Salvati, L. The impact of land-use/land-cover changes on land degradation dynamics: A Mediterranean case study. Environ. Manag. 2012, 49, 980–989. [Google Scholar] [CrossRef]
  15. Haines-Young, R. Land-use and biodiversity relationships. Land-Use Policy 2009, 26, 178–186. [Google Scholar] [CrossRef]
  16. Alewell, C.; Ballabio, C.; Ferro, V.; Robinson, D.A.; Panagos, P.; Borrelli, P.; Lugato, E.; Oost, K.V.; Schütt, B.; Fleischer, L.R.; et al. An assessment of the global impact of 21st century land-use change on soil erosion. Nat. Commun. 2017, 8, 1–13. [Google Scholar] [CrossRef]
  17. Biazin, B.; Sterk, G. Drought vulnerability drives land-use and land cover changes in the Rift Valley drylands of Ethiopia. Agric. Ecosyst. Environ. 2013, 164, 100–113. [Google Scholar] [CrossRef]
  18. Mengistie, K.; Schneider, T.; Demel, T.; Knoke, T. Drivers of land-use/land-cover changes in Munessa-Shashemene landscape of the south-central highlands of Ethiopia. Environ. Monit. Assess. 2015, 187, 452. [Google Scholar] [CrossRef]
  19. Belay, T. Land-cover/land-use changes in the Derekolli Catchment of the South Welo Zone of Amhara Region, Ethiopia. East. Afr. Soc. Sci. Res. Rev. 2002, 18, 1–20. [Google Scholar] [CrossRef]
  20. Dagnenet, F.; Duan, Z.; Rientjes, T.; Markus, D. Analysis of combined and isolated effects of land-use and land-cover changes and climate change on the upper Blue Nile River basin’s streamflow. Hydrol. Earth Syst. Sci. 2018, 22, 6187–6207. [Google Scholar]
  21. Temesgen, G.; Amare, B.; Abraham, M. Population dynamics and land-use/land-cover changes in Dera District, Ethiopia. Glob. J. Biol. Agric. Health Sci. 2014, 3, 137–140. [Google Scholar]
  22. Yilmaz, S.; Guner, A. Local government discretion and accountability in turkey. Public Admin. Dev. 2006, 33, 125–142. [Google Scholar] [CrossRef]
  23. United Nations Children’s Fund. Amhara Regional State 2015/16. A Report. 2018. Available online: https://www.unicef.org/esa/media/4261/file/UNICEF-Ethiopia-2018-Amhara-Regional-State-Budget-Brief.pdf (accessed on 6 December 2021).
  24. Eleni, Y.; Wagner, W.; Exner-kittridge, M.; Dagnachew, L. Identifying land-use/cover Dynamics in the Koga Catchment, Ethiopia, from multi-scale data, and implications for environmental change. ISPRS Int. J. Geo-Inf. 2013, 2, 302–323. [Google Scholar] [CrossRef]
  25. Central Statistical Agency. Statistical Amhara Part I: Population Size and Characteristics; Administrative Report; Central Statistical Agency: Addis Ababa, Ethiopia, 2012; p. 125. [Google Scholar]
  26. Friis, I.; Sebsebe, D.; van Breugel, P. Atlas of the potential vegetation of Ethiopia. In The Royal Danish Academy of Sciences and Letters; Selskab, D.V., Nielsen, M.A., Eds.; The Royal Danish Academy of Sciences and Letters: Copenhagen, Denmark, 2010. [Google Scholar] [CrossRef]
  27. Babykalpana, Y.; ThanushKodi, K. Supervised/unsupervised classification of LULC using remotely sensed data for Coimbatore city, India. Int. J. Comput. Appl. 2010, 2, 26–30. [Google Scholar] [CrossRef]
  28. Enderle, D.I.M.; Weihjr, R.C. Integrating supervised and unsupervised classification methods to develop a more accurate land-cover classification. J. Ark. Acad. Sci. 2005, 59, 65–73. [Google Scholar]
  29. Fazzini, M.; Bisci, C.; Billi, P. The Climate of Ethiopia. Landscapes and landforms of Ethiopia; Billi, P., Ed.; Springer Science + Business Media: Dordrech, The Netherland, 2015; pp. 65–87. [Google Scholar] [CrossRef]
  30. Young, N.E.; Anderson, R.S.; Chignell, S.M.; Vorster, A.G.; Lawrence, R.; Evangelista, P.H. A survival guide to Landsat preprocessing. Ecology 2017, 98, 920–932. [Google Scholar] [CrossRef]
  31. Mohd, H.L.; Pakhriazad, H.Z.P.; Shahrin, F. Evaluating supervised and unsupervised techniques for land cover mapping using remote sensing data. Geogr. Malays. J. Soc. Space 2009, 5, 1–10. [Google Scholar]
  32. Amershi, S.; Conati, C.C. Combining unsupervised and supervised classification to build user models for exploratory. JEDM 2009, 1, 18–71. [Google Scholar] [CrossRef]
  33. Lemenkova, P. Processing remote sensing data using Erdas Imagine for Mapping Aegean Sea Region, Turkey. Informatics 2015, 3, 11–15. Available online: https://elibrary.ru/item.asp?id=26663916 (accessed on 26 February 2019).
  34. Abineh, T.; Bogale, T. Accuracy assessment of land-use land-cover classification using Google Earth. Am. J. Environ. Prot. 2015, 4, 193–198. [Google Scholar]
  35. Czaplewski, L. Accuracy assessment of maps of forest condition: Statistical design and methodological considerations. In Remote Sensing of Forest Environments: Concepts and Case Studies; Wulder, M.A., Franklin, S.E., Eds.; Kluwer Academic Publishers: Norwell, MA, USA, 2003; pp. 115–140. [Google Scholar]
  36. Ismail, M.H.; Jusoff, K. Satellite data classification accuracy assessment based from reference dataset. Int. J. Comp. Inf. Eng. 2008, 2, 23–29. [Google Scholar]
  37. Chandran, S.; Kim, S.K.; Mount, D.M. Parallel computational geometry of rectangles. Algorithmica 1992, 7, 25–49. [Google Scholar] [CrossRef]
  38. Huang, H.E.; Witz, K.G. Children’s conceptions of area measurement and their strategies for solving area measurement problems. Curric. Teach 2013, 2, 10–26. [Google Scholar] [CrossRef]
  39. Cheruto, M.C.; Kauti, M.K.; Kisangau, P.D.; Kariuki, P. Assessment of land-use and land-cover change using GIS and remote sensing techniques: A case study of Makueni County, Kenya. J. Remote Sens. GIS 2016, 5, 1000175. [Google Scholar] [CrossRef]
  40. Kumar, P.; Rai, A.; Chand, S. Land-use and land-cover change detection using geospatial techniques in the Sikkim Himalaya, India. Egypt. J. Remote. Sens. Space Sci. 2019, 23, 133–143. [Google Scholar] [CrossRef]
  41. R Core Team. R: A Language and Environment for Statistical Computing, R version 3.4.3; R Foundation for Statistical Computing: Vienna, Australia, 2019; Available online: https://www.r-project.org/ (accessed on 12 March 2018).
  42. Frank, H.E. Hmisc: Harrell Miscellaneous, R package version 4.2-0; R Foundation for Statistical Computing: Vienna, Australia, 2019; Available online: https://cran.r-project.org/package=Hmisc (accessed on 17 March 2018).
  43. Franklin, S.E.; Wulder, M.A. Remote sensing method in medium spatial resolution satellite data land cover classification of large areas. Prog. Phys. Geogr. 2002, 26, 173–205. [Google Scholar] [CrossRef]
  44. Thomlinson, J.R.; Bolstad, P.V.; Cohen, W.B. Coordinating methodologies for scaling cand-cover classifications from Site-Specific to Global: Steps toward validating global map products. Remote Sens. Environ. 1999, 70, 16–28. [Google Scholar] [CrossRef]
  45. Wijedasa, L.S.; Sloan, S.; Michelakis, D.G.; Clements, G.R. Overcoming limitations with Landsat imagery for mapping of peat swamp forests in Sundaland. Remote Sens. 2012, 4, 2595–2618. [Google Scholar] [CrossRef]
  46. Manandhar, R.; Odeh, I.O.; Ancev, T. Improving the accuracy of land-use and land-cover classification of Landsat data using post-classification enhancement. Remote Sens. 2009, 1, 330–344. [Google Scholar] [CrossRef]
  47. Solomon, N.; Hishe, H.; Annang, T.; Pabi, O.; Asante, I.K.; Birhane, E. Forest cover change, key drivers and community perception in Wujig Mahgo Waren forest of northern Ethiopia. Land 2018, 7, 32. [Google Scholar] [CrossRef]
  48. Woldeamlak, B. Land-cover dynamics since the 1950s in Chemoga Watershed, Blue Nile Basin, Ethiopia. Mt. Res. Dev. 2002, 22, 263–269. [Google Scholar] [CrossRef]
  49. Hagos, G. Landuse land-cover dynamics of Huluka watershed, Central Rift Valley, Ethiopia. Int. Soil Water Conserv. Res. 2014, 2, 25–33. [Google Scholar] [CrossRef]
  50. Tatek, B.; Ayalew, D. Land-use and land-cover dynamics and drivers in the Muga watershed, Upper Blue Nile basin, Ethiopia. Remote Sens. Appl. Soc. Environ. 2009, 15, 100249. [Google Scholar] [CrossRef]
  51. Ramankutty, N.; Mehrabi, Z.; Waha, K.; Jarvis, L.; Kremen, C.; Herrero, M.; Rieseberg, L.H. Trends in global agricultural land-use: Implications for environmental health and food security. Annu. Rev. Plant Biol. 2018, 69, 789–815. [Google Scholar] [CrossRef]
  52. Sorecha, E.M.; Lenjisa, D. Assessment of plant species diversity, relative abundances and distribution in Haramaya University, Ethiopia. J. Phys. Sci. Environ. Stud. 2017, 3, 30–35. [Google Scholar]
  53. Skalský, R.; Barančíková, G.; Koco, Š.; Makovníková, J.; Halas, J.; Koleda, P.; Gutteková, M.; Takáč, J. Land-cover and land-use change driven change of regional soil organic carbon storage in croplands and grasslands of North-East Slovakia. Seindo 2020, 39, 159–173. [Google Scholar] [CrossRef]
  54. Boval, M.; Dixon, R.M. The importance of grasslands for animal production and other functions: A review on management and methodological progress in the tropics. Animal 2012, 6, 748–762. [Google Scholar] [CrossRef] [PubMed]
  55. Muluneh, A. Synthesis of Research on Land-Use and Land-Cover; UNU-Land Restoration Training Programme: Keldnaholt, Iceland, 2010; pp. 1–39. Available online: https://www.grocentre.is/static/gro/publication/393/document/unu-lrt_2010_alemayehu-muluneh.pdf (accessed on 23 December 2020).
  56. Negassa, M.D.; Mallie, D.T.; Gemeda, D.O. Forest cover change detection using geographic information systems and remote sensing techniques: A spatio-temporal study on Komto Protected forest priority area, East Wollega Zone, Ethiopia. Environ. Syst. Res. 2020, 9, 1. [Google Scholar] [CrossRef]
  57. Fasika, A.; Motuma, T.; Gizaw, T. Land Use Land Cover Change Trend and Its Drivers in Somodo Watershed South Western, Ethiopia. Afr. J. Agric. Res. 2019, 14, 102–117. [Google Scholar] [CrossRef]
  58. Addae, B.; Oppelt, N. Land-use/land-cover change analysis and urban growth modeling in the Greater Accra Metropolitan Area (GAMA), Ghana. Urban Sci. 2019, 3, 26. [Google Scholar] [CrossRef]
  59. Noda, A.; Kondoh, A.; Nishihiro, J. Changes in land-cover and grassland area over the past 120 years in a rapidly urbanized area in Japan. One Ecosyst. 2019, 4, e37669. [Google Scholar] [CrossRef]
  60. Leyk, S.; Uhl, J.H.; Connor, D.S.; Braswell, A.E.; Mietkiewicz, N.; Balch, J.K.; Gutmann, M. Two centuries of settlement and urban development in the United States. Sci. Adv. 2020, 6, eaba2937. [Google Scholar] [CrossRef] [PubMed]
  61. Kozak, M.; Krzanowski, W.; Tartanus, M. Use of the correlation coefficient in agricultural sciences: Problems, pitfalls and how to deal with them. An. Acad. Bras. Ciências 2012, 84, 1147–1156. [Google Scholar] [CrossRef]
  62. Brandon, K. Ecosystem Services from Tropical Forests: Review of Current Science; CGD Working Paper 380; Center for Global Development: Washington, DC, USA, 2014; p. 85. [Google Scholar]
  63. Dale, V.H. The relationship between land-use changes and climate change. Ecol. Appl. 1997, 7, 753–769. [Google Scholar] [CrossRef]
  64. Liu, J.; Feng, C.; Wang, D.; Wang, L.; Wilsey, B.J.; Zhong, Z. Impacts of grazing by different large herbivores in grassland depend on plant species diversity. J. Appl. Ecol. 2015, 52, 1053–1062. [Google Scholar] [CrossRef]
  65. Liu, J.; Shao, Q.; Yan, X.; Fan, J.; Zhan, J.; Deng, X.; Kuang, W.; Huang, L. The climatic impacts of land-use and land-cover change compared among countries. J. Geogr. Sci. 2016, 26, 889–903. [Google Scholar] [CrossRef]
  66. Niya, A.K.; Huang, J.; Karimi, H.; Keshtkar, H.; Naimi, B. Use of intensity analysis to characterize land-use/cove-change in the biggest Island of Persian Gulf, Qeshm Island, Iran. Sustainability 2019, 11, 4396. [Google Scholar] [CrossRef]
  67. Estoque, R.C.; Ooba, M.; Avitabile, V.; Hijioka, Y.; DasGupta, R.; Togawa, T.; Murayama, Y. The future of Southeast Asia’s forests. Nat. Commun. 2019, 10, 1–12. [Google Scholar] [CrossRef]
  68. Paster, E. Preservation of agricultural lands through land-use planning tools and techniques. Nat. Resour. J. 2004, 44, 282–318. [Google Scholar]
Figure 1. The location of the research area.
Land 12 01655 g001
Figure 2. The elevation, distribution of roads, and rivers in the Este District.
Land 12 01655 g002
Figure 3. IUSS-WRB soil types in Este District.
Land 12 01655 g003
Figure 4. Climate diagram of Este District.
Land 12 01655 g004
Figure 5. Flowchart of the major LULC classification and assessment methods (Notice: OA = overall accuracy and KS = kappa statistics).
Land 12 01655 g005
Figure 6. Sub-set image of the study area.
Land 12 01655 g006
Figure 7. The study site’s LULC classes for the last four decades.
Land 12 01655 g007
Figure 8. The relative area (km2) of the LULC classes of the study area.
Land 12 01655 g008
Figure 9. The overall LULC change values in Este District (1984–2018).
Land 12 01655 g009
Table 1. Landsat satellite images used.
Image SourcesResolution (m)Sensor Path Row Acquisition Date
Landsat 4–5 30 × 30 TM169528 December 1984
Landsat 7 30 × 30 ETM+1695227 January 2000
Landsat 8 30 × 30 OLI169521 January 2018
Table 2. Considered land-use and land-cover groups for the research in the Este District.
LULC ClassesDescriptions
Forests–shrublandsBushlands, shrublands, and natural and afforested forest areas
CroplandsAreas cultivated with annual crops, vegetables, or fruits
GrasslandsHerbaceous vegetation, sparse trees, sparse shrubs, and grasses
SettlementsTowns, churches, rural villages, schools, and roads
Water bodiesMajor rivers, such as the Nile river, ponds, and some wetlands
Bare landsExposed rocks and sandy areas
Table 3. LULC class and overall classification accuracies and kappa statistics (1984–2018).
YearExplan. Variable Forest–ShrublandCropland GrasslandSettlementWater BodyBare LandOAKS
1984PA 100.096.00100.00100.00100.00100.099.300.99
CE 0.004.000.000.000.000.00
UA 100.00100.0096.00100.00100.00100.0099.300.99
OE0.000.004.000.000.000.00
2000PA98.90100.0095.5087.1090.5097.3096.200.95
CE1.100.005.5012.909.502.70
UA95.7090.5098.50100.00100.00100.0096.200.95
OE4.309.501.500.000.000.00
2018PA80.0095.7093.4091.4094.10100.0091.500.90
CE20.004.306.608.605.900.00
UA98.1088.0090.5096.90100.0072.7091.500.90
OE1.9012.009.503.000.0027.30
Note: Explan. Variable, PA, CE, UA, OE, OA, and KS are the explanatory variables, producer’s accuracy (%), commission error (%), user’s accuracy (%), omission error (%), overall accuracy (%), and kappa statistics, respectively.
Table 4. Share of the LULC classes in Este District, in three analyzed years: 1984, 2000, and 2018.
LULC Classes198420002018
Area (km2)Area (%)Area (km2)Area (%)Area (km2)Area (%)
Forests–shrublands346.325.4243.417.8204.715.0
Croplands829.660.8851.562.4694.050.8
Grasslands122.59.0216.715.9424.431.0
Settlements5.90.46.20.513.11.0
Water bodies1.80.11.70.12.30.2
Bare lands59.04.345.63.326.72.0
Total1365.51001001365.51365.5100
Table 5. LULC change matrix between 1984 and 2000 (area in km2).
LULC ClassesClasses of 2000
GrasslandCroplandWater BodySettlementForest–ShrublandBare LandTotal
Classes of 1984Grassland78.126.50.00.14.29.7118.6
Cropland100.6665.60.34.447.619.8838.3
Water body0.00.21.20.00.40.01.8
Settlement0.23.50.00.20.80.14.8
Forest–shrubland5.4150.40.10.3186.01.0343.2
Bare land28.615.70.00.00.312.857.4
Total 212.9861.91.65.0239.343.41364.1
Table 6. No change, gain, loss, and net changes of LULC of Este District during 1984–2000.
LULC Classes19842000
CoverUnchangedGainLossNet Change
(km2)(%)(km2)(%)(km2)(%)(km2)(%)(km2)(%)
Forest–shrubland346.325.418613.653.43.9157.311.5−103.9−7.6
Cropland829.660.8665.648.8196.314.4172.912.723.41.7
Grassland122.59.078.15.7134.89.940.53.094.36.9
Settlement5.90.40.20.05.00.44.60.30.40.1
Water body1.80.11.20.10.50.00.60.0−0.10
Bare land59.14.312.80.930.62.244.73.3−14.1−1.1
Total 1365.2100943.969.1420.630.8420.630.800
Table 7. LULC change matrix between 1984 and 2018 (area (km2)).
LULC ClassesClasses of 2018
GrasslandCroplandWater BodySettlementForest–ShrublandBare LandTotal
Classes of 1984Grassland84.624.20.00.33.16.4118.6
Cropland276.1517.30.310.922.411.6838.5
Water body0.00.41.30.00.20.01.8
Settlement0.73.40.00.30.30.14.8
Forests–shrubland12.9152.50.70.6173.72.9343.3
Bare land47.24.40.00.11.74.157.5
Total 421.5702.22.312.1201.425.11364.5
Table 8. Unchanged, gain, loss, and net changes of the LULC changes during 1984–2000.
LULC Classes19842018
CoverUnchangedGain Loss Net Change
(km2)(%)(km2)(%)(km2)(%)(km2)(%)(km2)(%)
Forest–shrubland346.325.4173.712.727.82.0169.612.4−141.8−10.4
Cropland829.660.8517.437.9184.913.5321.223.5−136.3−10.0
Grassland122.59.084.66.2336.924.734.02.5302.922.2
Settlement5.90.40.30.011.80.94.50.37.30.6
Water body1.81.31.30.11.00.10.60.00.40.1
Bare land59.14.34.10.321.01.553.43.9−32.4−2.4
Total 1364.5100781.357.3583.342.7583.342.700
Table 9. LULC change matrix between 2000 and 2018 (area (km2)) of total Este District.
LULC ClassesClasses of 2018
GrasslandCroplandWater BodySettlementForest–ShrublandBare LandTotal
Classes of 2000Grassland141.457.80.00.88.54.5212.9
Cropland237.9534.90.610.260.817.5861.9
Water body0.10.60.90.00.10.01.7
Settlement1.82.70.00.40.20.15.2
Forest–shrubland10.995.00.70.4130.91.4239.3
Bare land29.611.30.00.21.01.543.5
Total 421.5702.22.312.1201.425.11364.5
Table 10. No change, gain, loss, and net changes in the LULC changes from 2000 to 2018.
LULC Classes20002018
CoverUnchangedGainLossNet Change
(km2)(%)(km2)(%)(km2)(%)(km2)(%)(km2)(%)
Forestshrubland239.317.5130.99.670.65.2108.47.9−37.8−2.7
Cropland861.963.2534.939.2167.412.332724.0−159.6−11.7
Grassland212.915.6141.410.4280.320.571.65.2208.715.3
Settlement5.20.40.40.011.60.94.80.46.80.5
Water body1.70.10.90.11.30.10.80.10.50
Bare land43.53.21.50.123.51.742.13.1−18.6−1.4
Total 1364.5100.081059.4554.740.7554.740.70.00.0
Table 11. The r-squared values and level of significance of the correlation between LULC classes and potential causes.
LULC ClassesMax. Temp.Min. Temp.PrecipitationWind VelocityHumiditySolar Rad.Population
Grassland0.139 ns−0.197 ns0.581 **0.214 ns−0.144 ns0.469 **0.987 ***
Cropland0.015 ns0.285 rs−0.620 **−0.224 ns−0.040 ns−0.529 **−0.850 ***
Water body−0.033 ns−0.292 rs0.619 **0.223 ns0.061 ns0.530 **0.825 ***
Settlement0.043 ns−0.257 ns0.617 **0.225 ns−0.029 ns0.516 **0.917 ***
Bare land−0.171 ns0.173 ns−0.550 **−0.210 ns0.201 ns−0.439 **−0.999 ***
Forest–shrubland−0.274 ns0.076 ns−0.441 **−0.170 ns0.318 rs−0.330 rs−0.968 ***
Note: Max. temp. = maximum temperature; min. temp. = minimum temperature; solar rad. = solar radiations; and ns, rs, **, and *** indicate not significant, nearly significant, at 0.05 and 0.00, respectively.
Table 12. Perceived causes of LULC changes by key informants and focus group discussion participants.
Cause/Derivers Yes (%)No (%)Cause/Derivers Yes (%)No (%)
Population growth919Expansion of farmland8614
Enhanced cattle breeds8713Conservation practices 7426
Infrastructure expansion 8119Expansion of settlements6535
Firewood 7525Irrigation 5545
Climate change 955Soil erosion/degradation955
Disclaimer/Publisher’s Note: The statements, opinions and data contained in all publications are solely those of the individual author(s) and contributor(s) and not of MDPI and/or the editor(s). MDPI and/or the editor(s) disclaim responsibility for any injury to people or property resulting from any ideas, methods, instructions or products referred to in the content.

