Differences in High-Quality Development and Its Influencing Factors between Yellow River Basin and Yangtze River Economic Belt
Abstract
1. Introduction
2. Literature Review
3. Materials and Methods
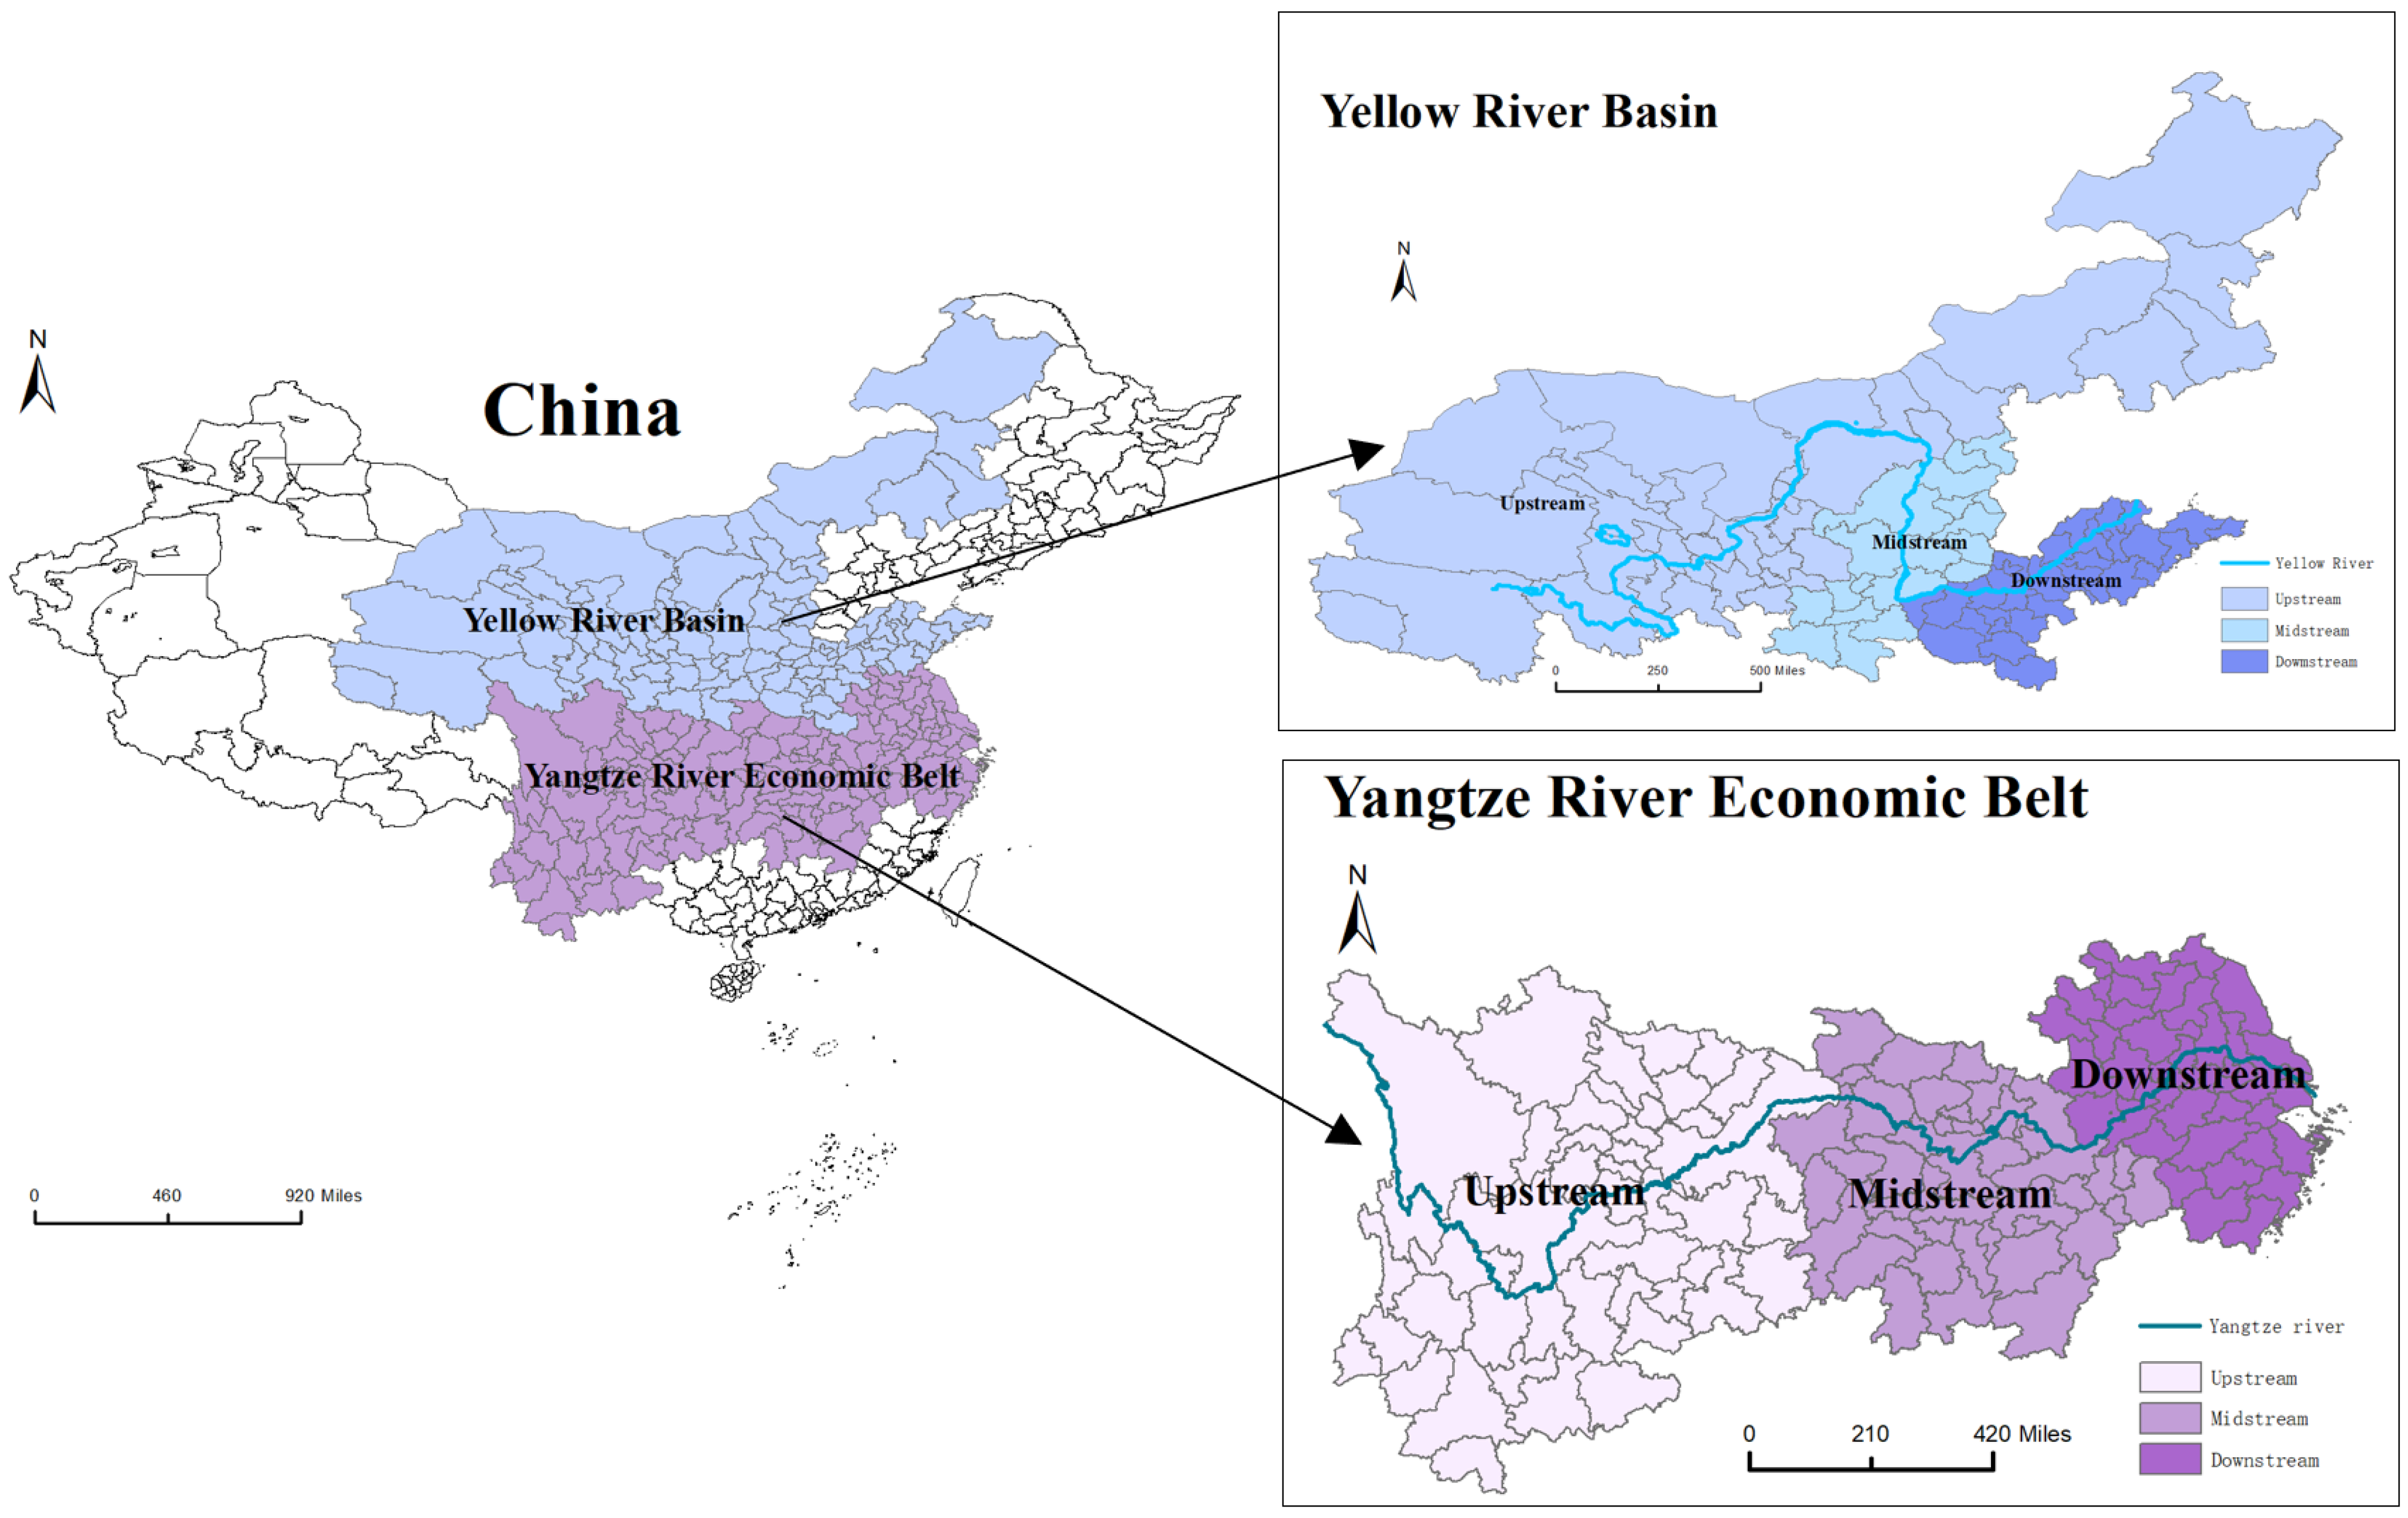
3.1. The Study Area
3.2. Data Source
3.3. The High-Quality Development Index System
3.3.1. Index System Construction
3.3.2. Calculation of High-Quality Development
3.3.3. Kernel Density Estimation Method
3.4. Empirical Model Setting
3.5. Variable Selection and Descriptive Statistics
3.5.1. Explained Variable
3.5.2. Explanatory Variables
4. Empirical Results
4.1. Differences in High-Quality Development
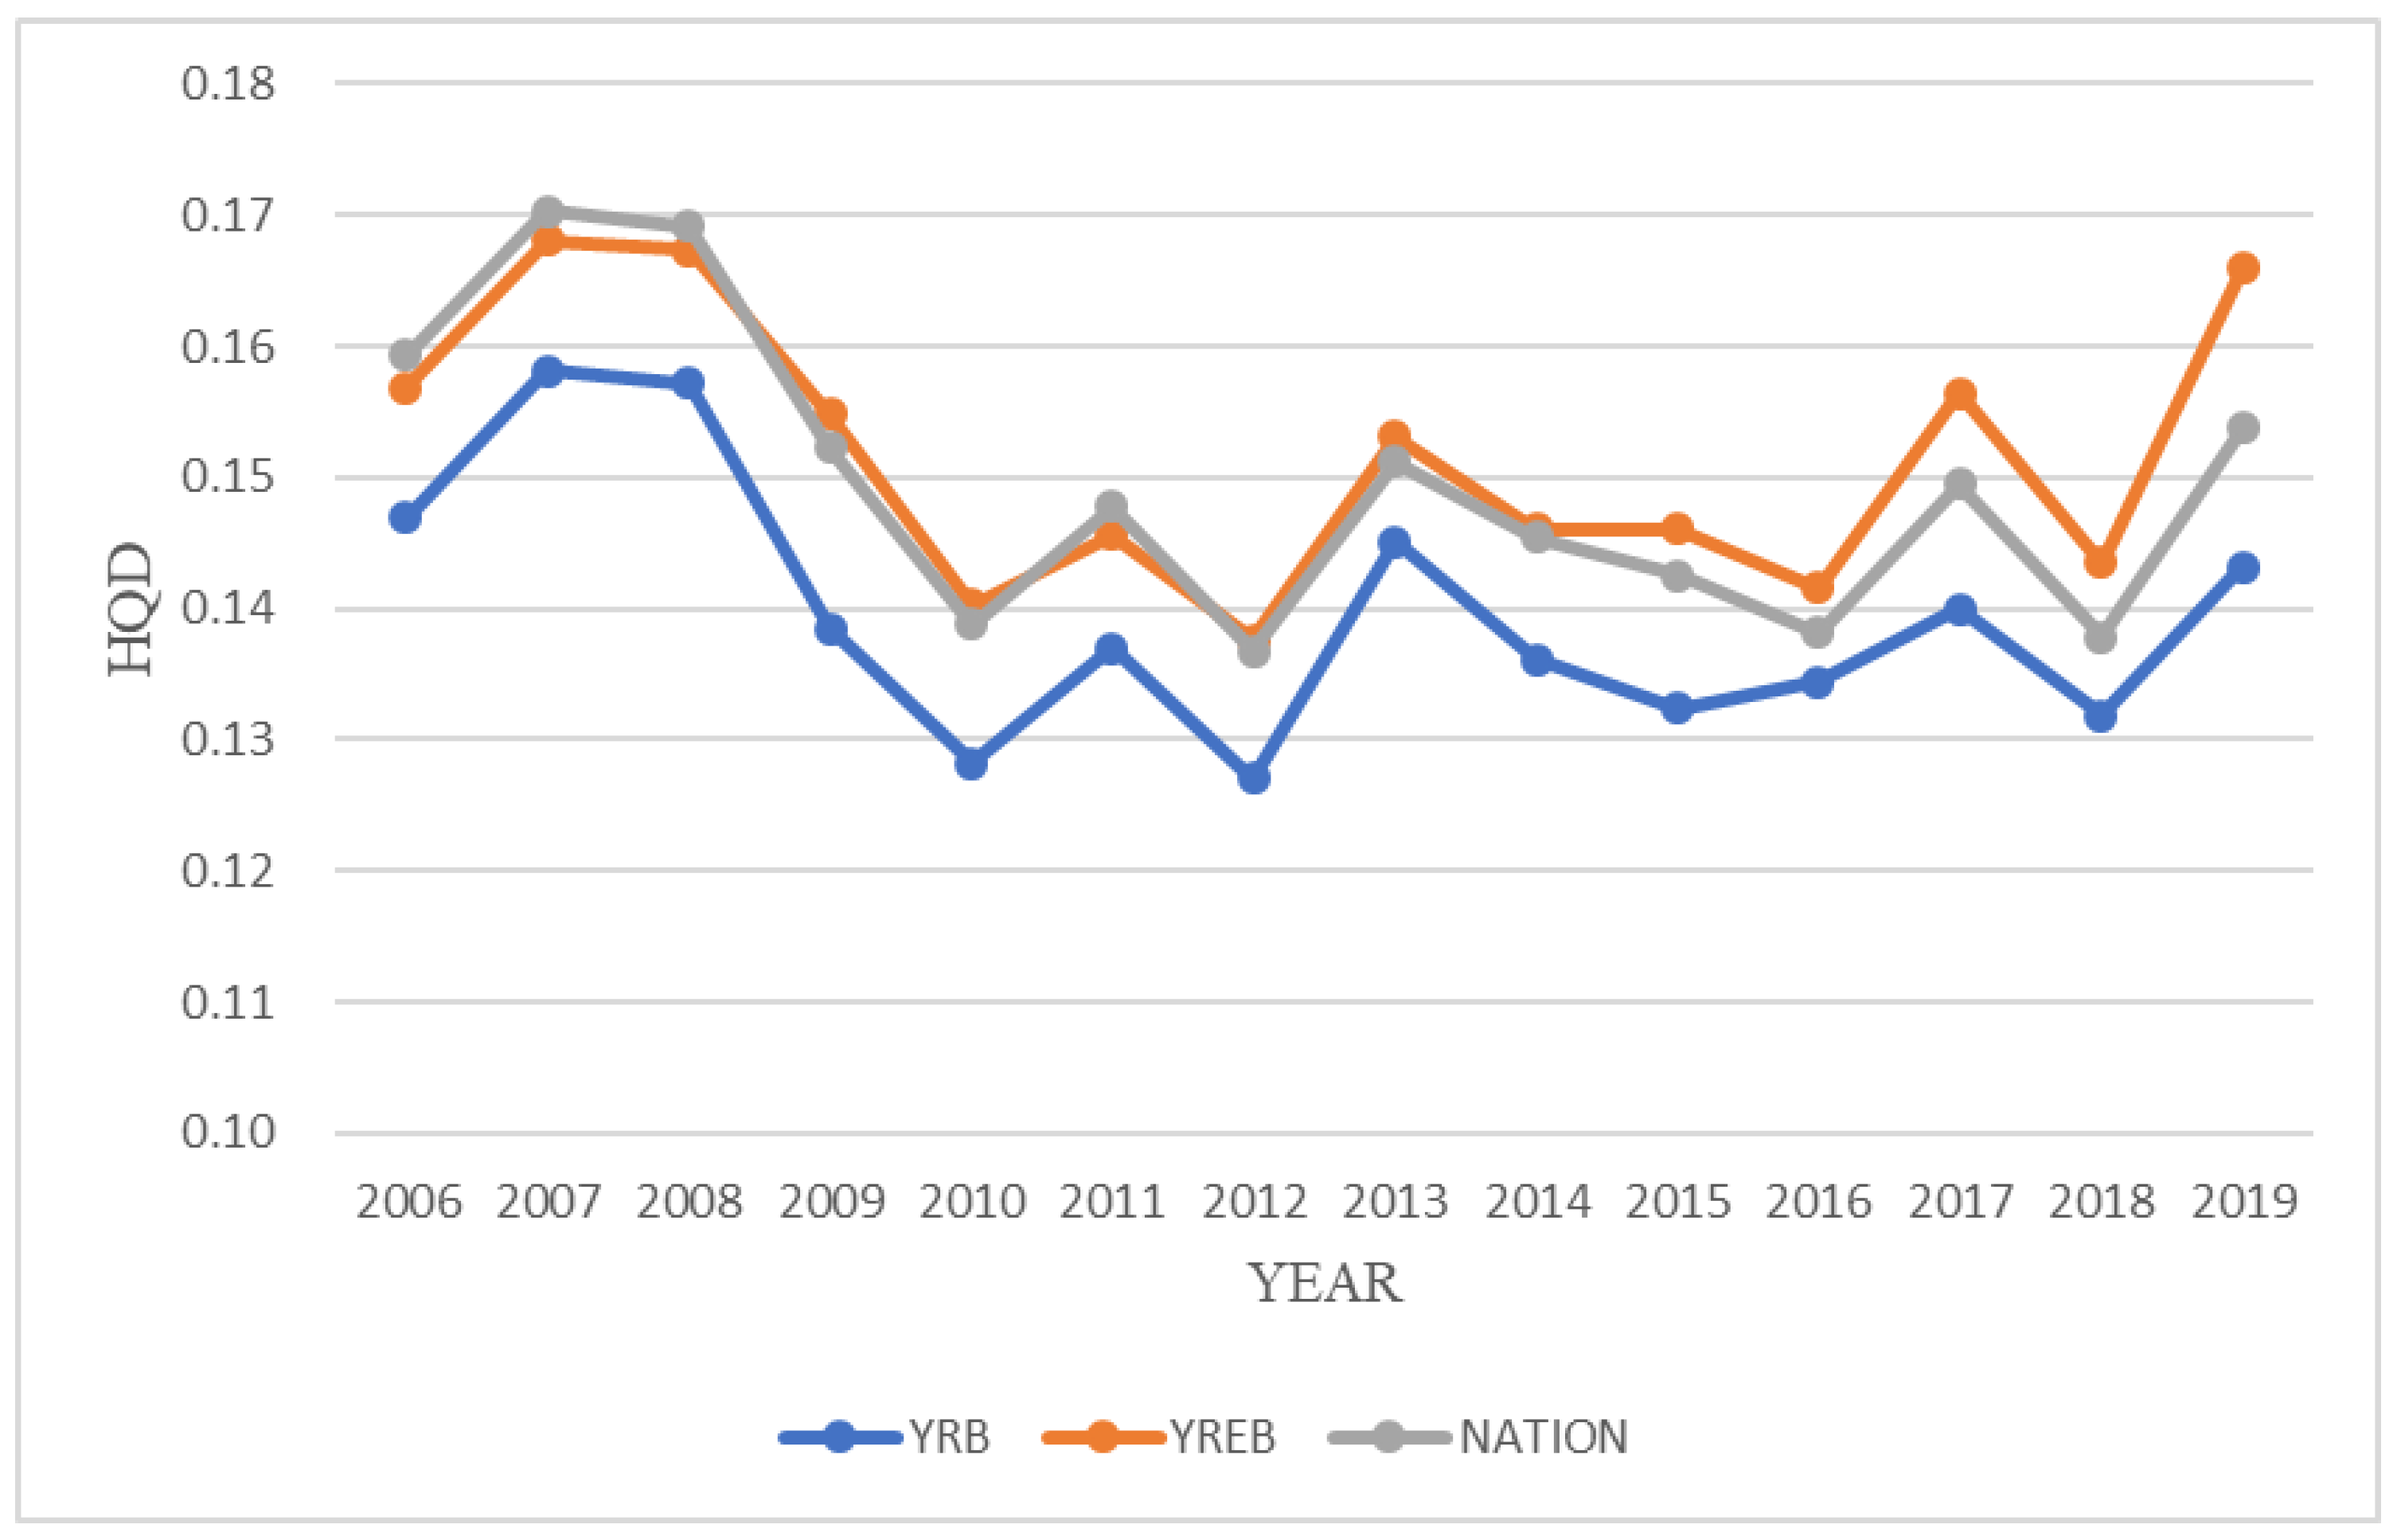
4.1.1. Timing Differences in High-Quality Development
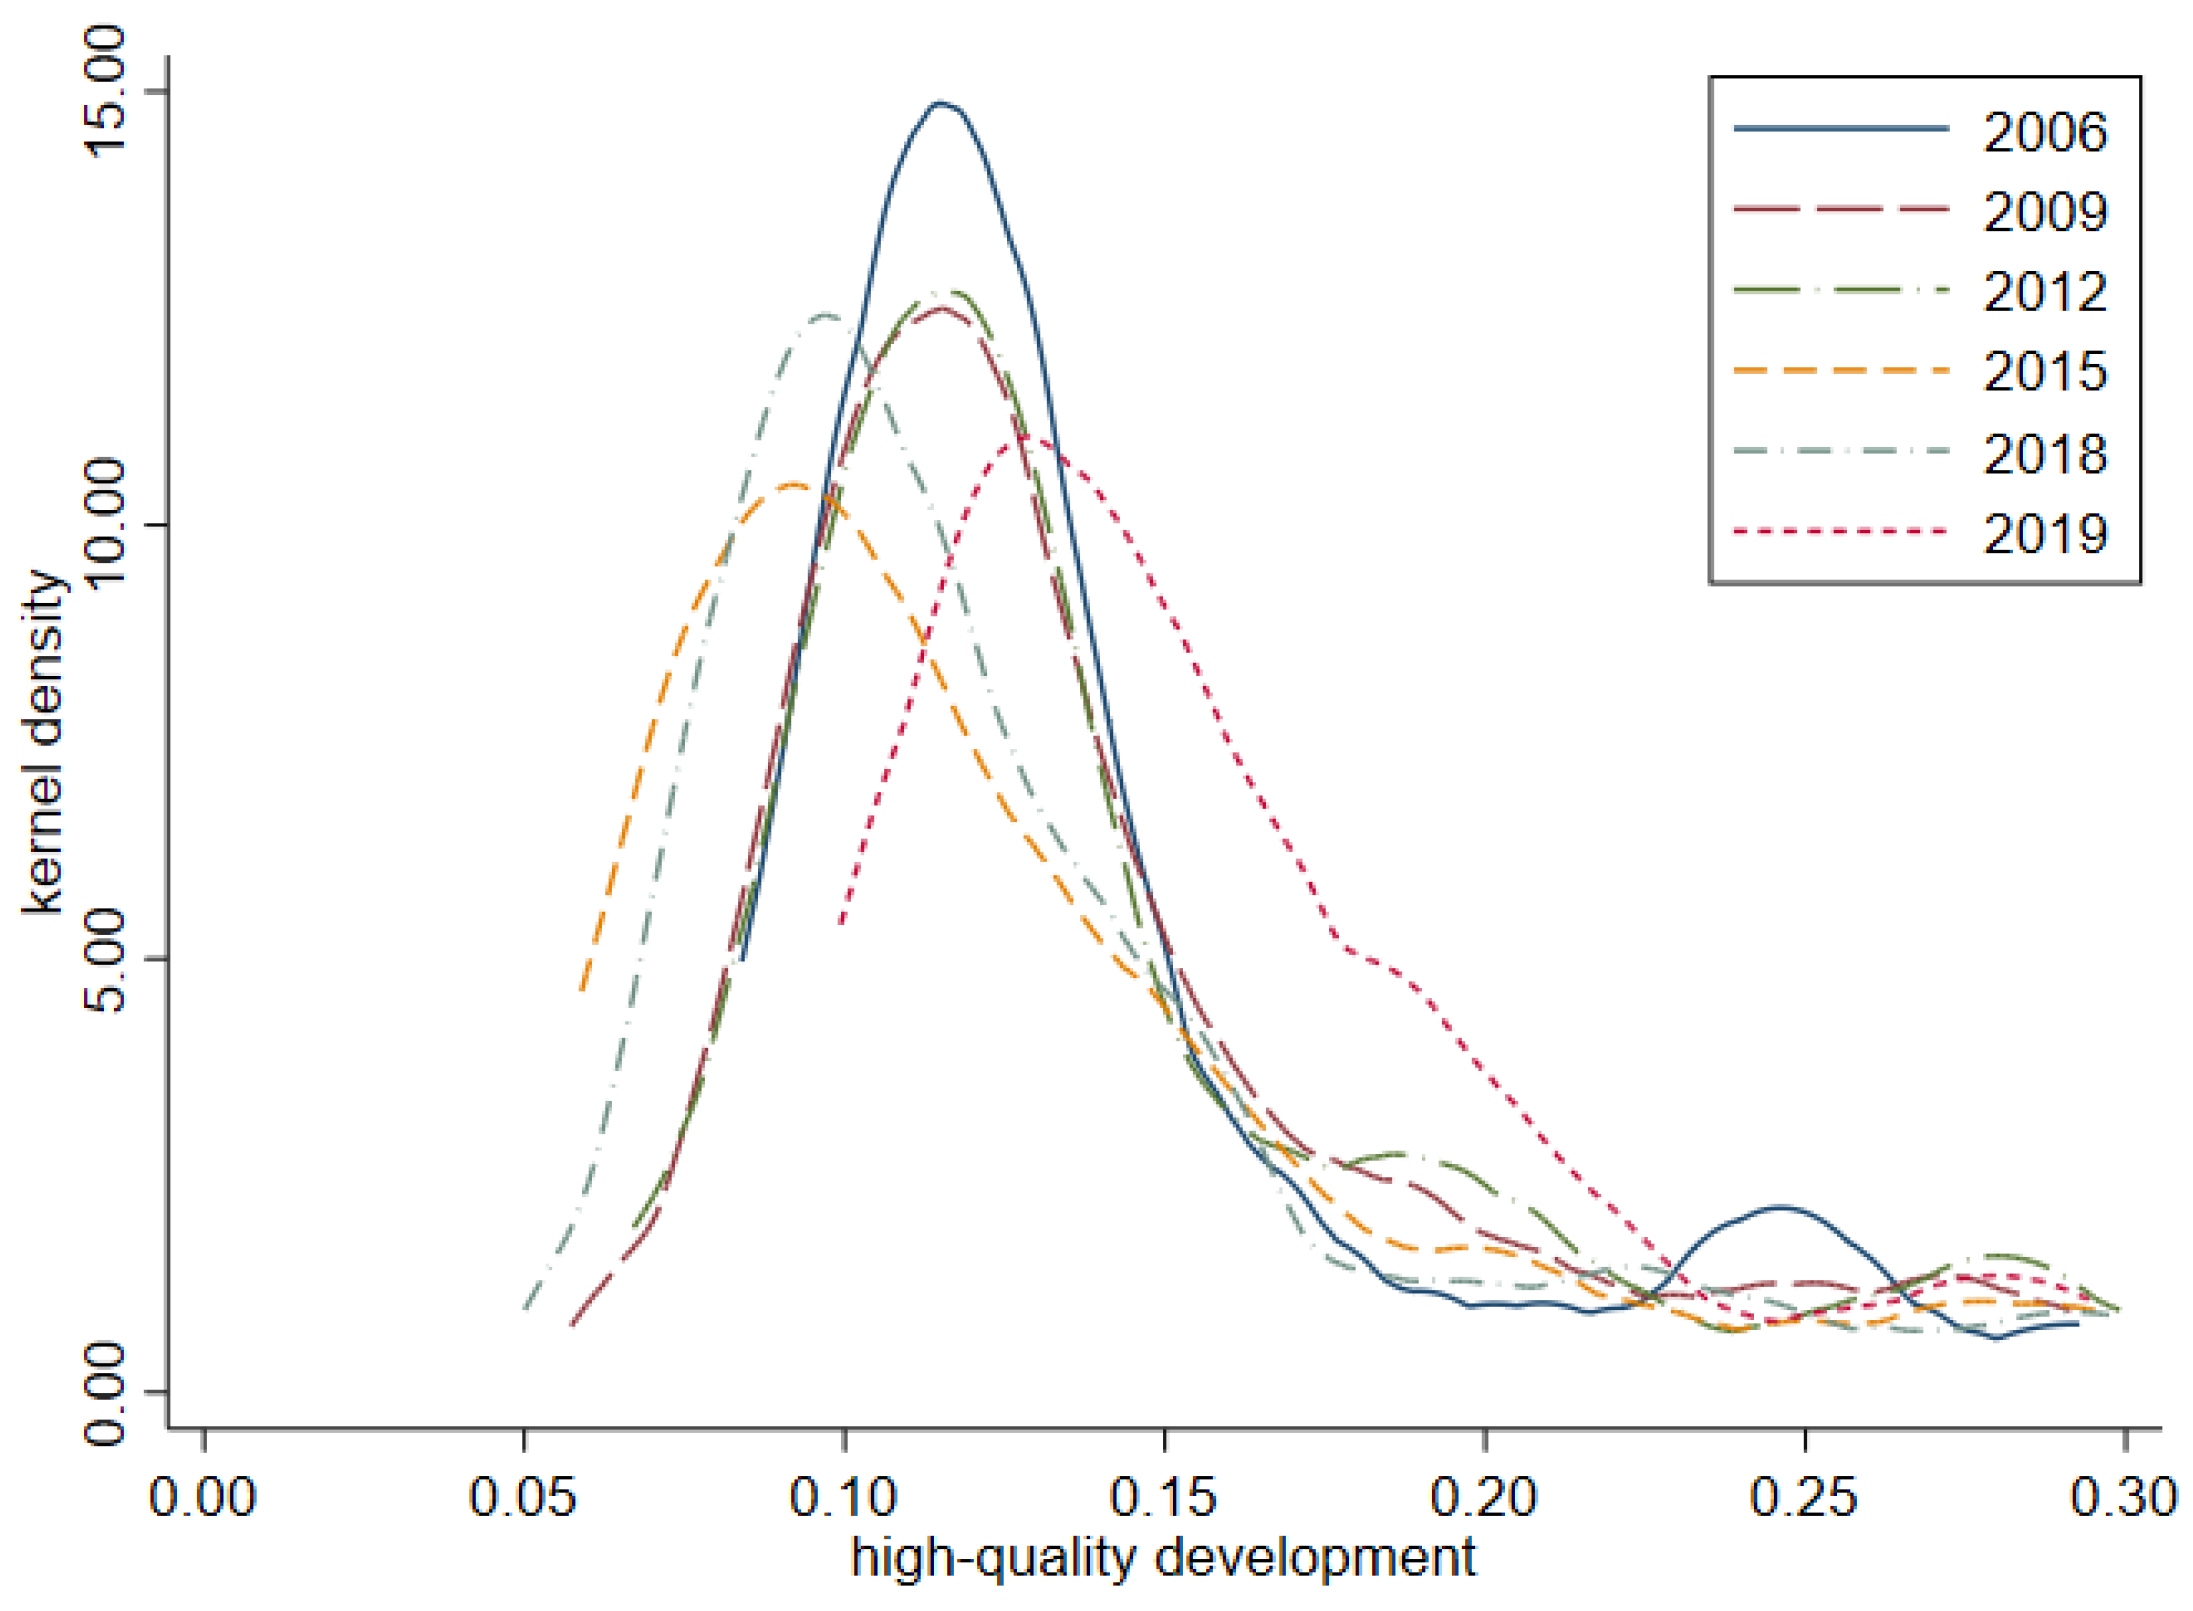
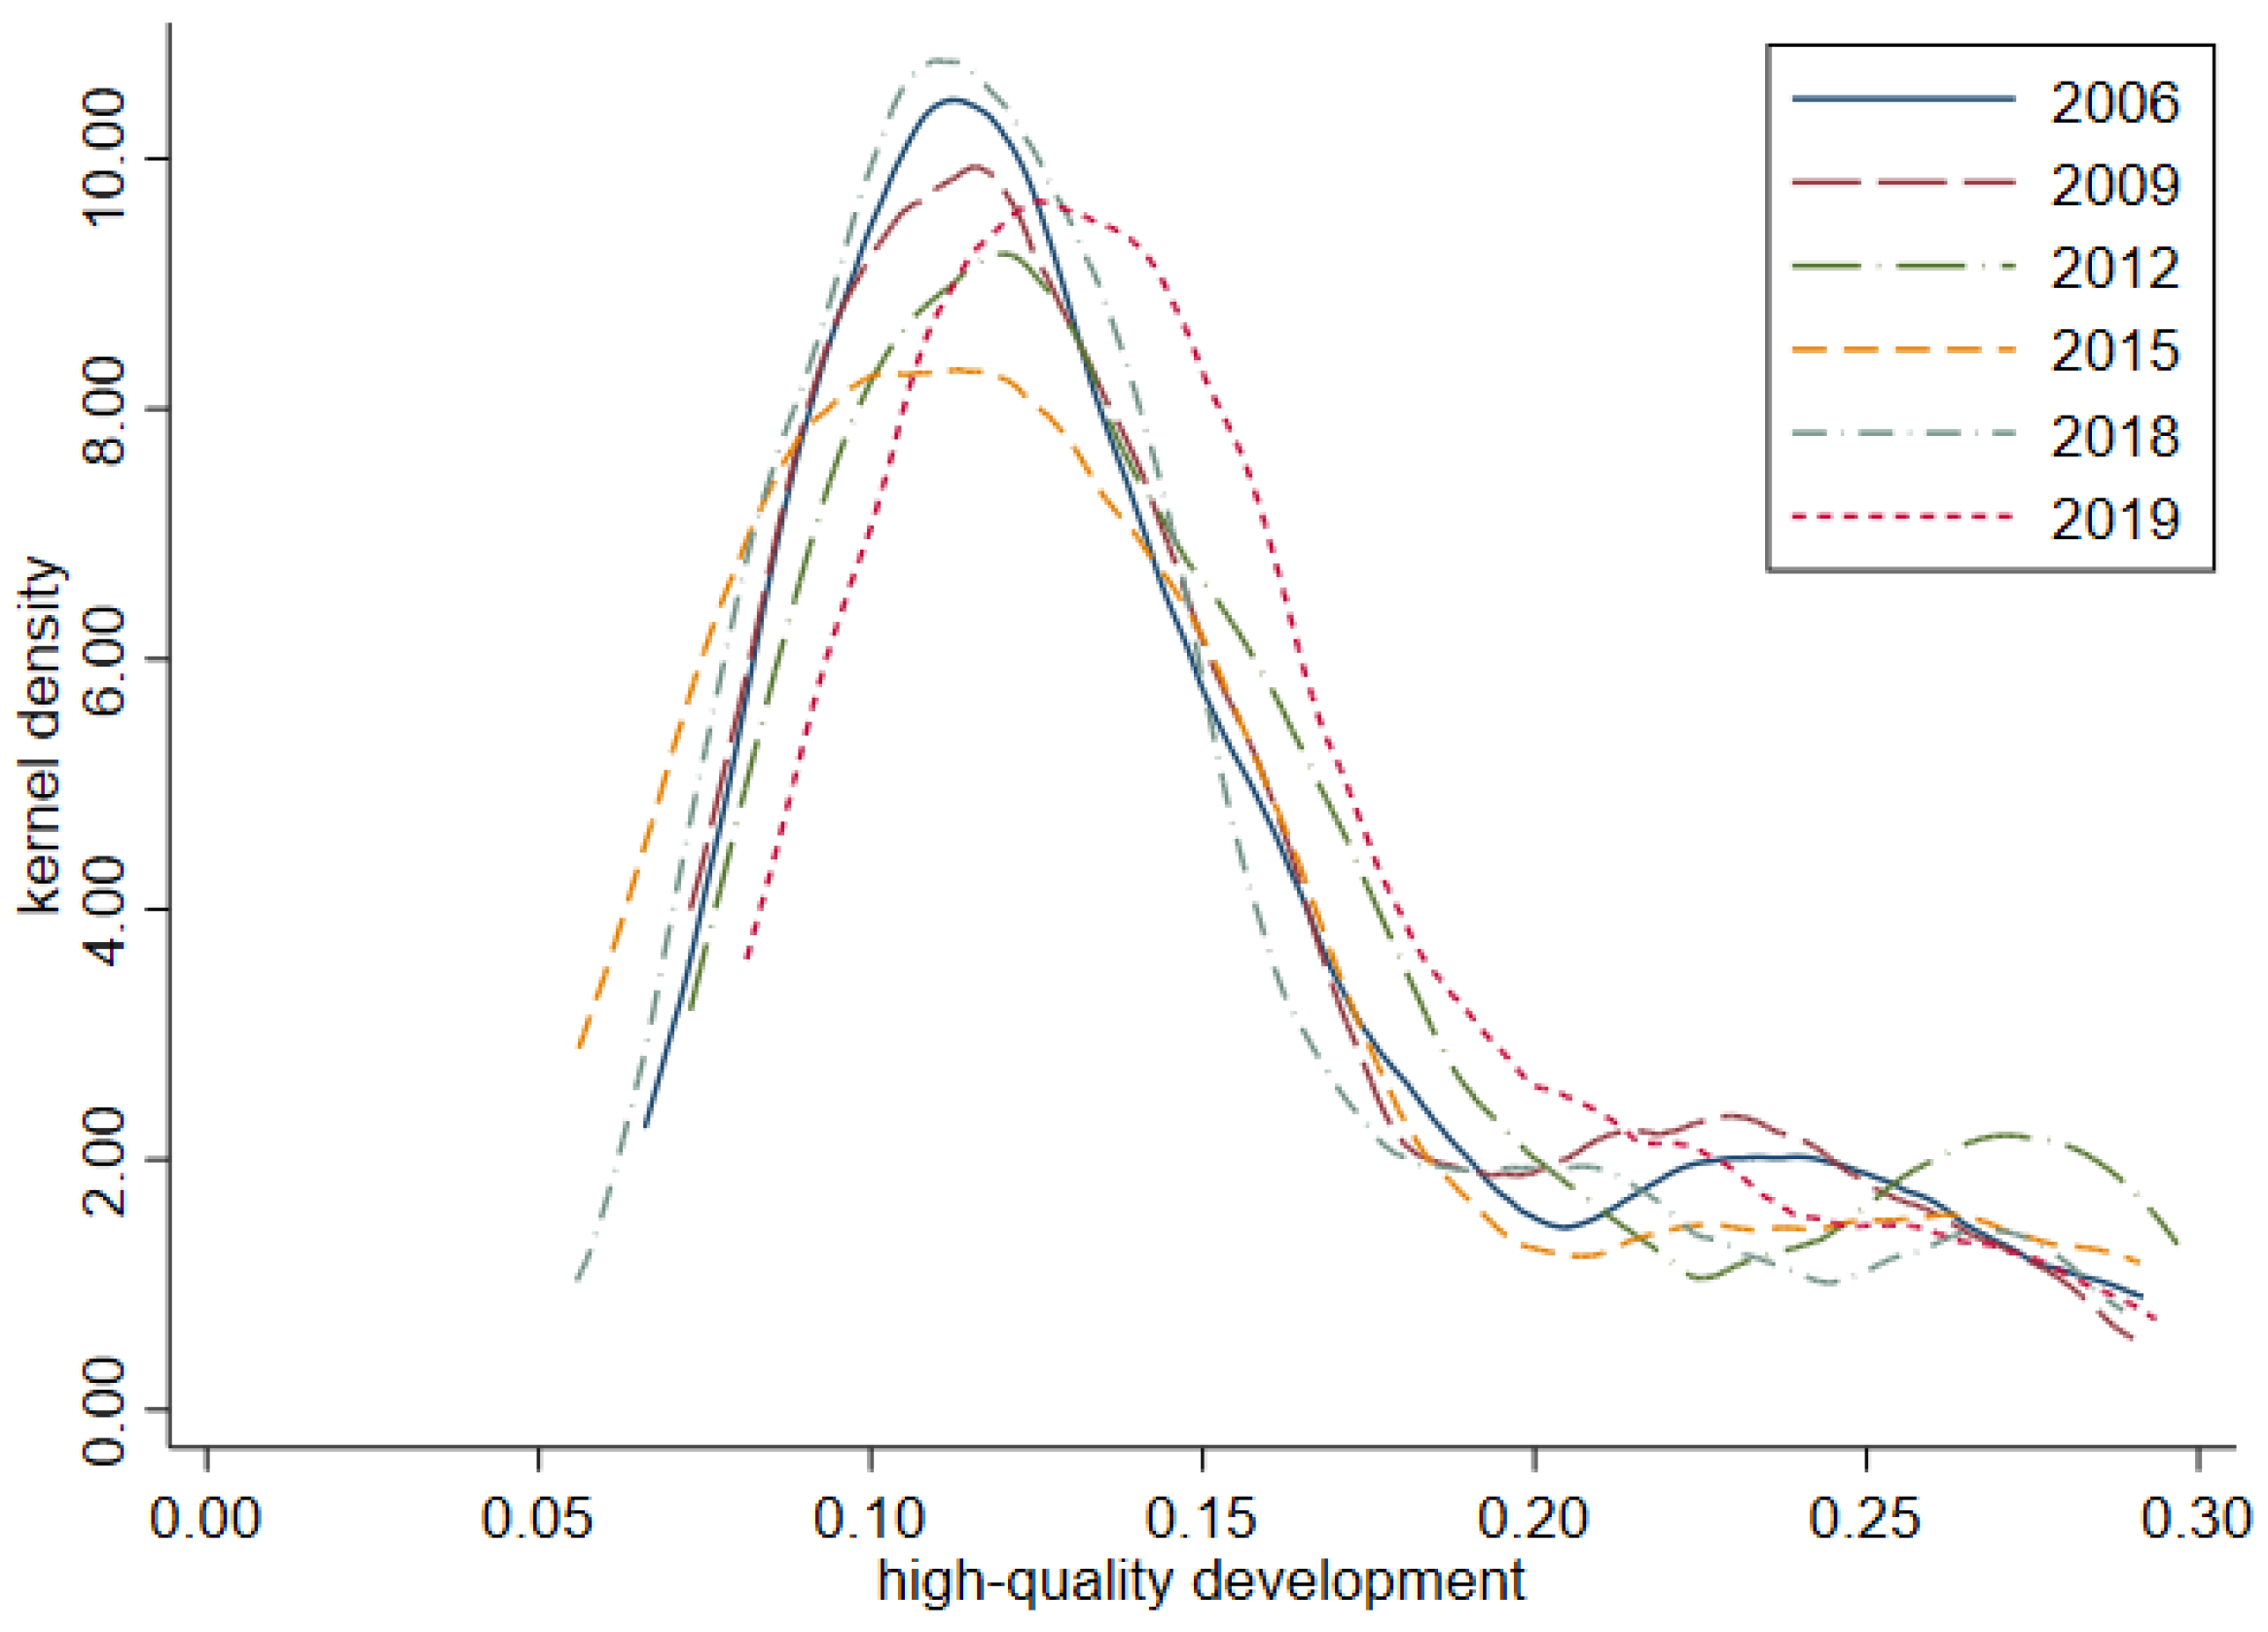
4.1.2. Kernel Density Analysis of High-Quality Development Levels
4.1.3. Spatial Pattern Evolution and Evolution Characteristics of High-Quality Development
4.2. Regression Results and Analysis
5. Discussion
6. Conclusions and Policy Recommendations
Author Contributions
Funding
Data Availability Statement
Conflicts of Interest
References
- Cheng, G.; Li, X.; Zhao, W.; Zhao, W.Z.; Xu, Z.M.; Feng, Q.; Xiao, S.C.; Xiao, H.L. Integrated study of the water–ecosystem–economy in the Heihe River Basin. Natl. Sci. Rev. 2014, 1, 413–428. [Google Scholar] [CrossRef]
- Wang, W.; Shan, C. Sustainable development of basin economy and marine economy. J. Coast. Res. 2020, 115, 602–605. [Google Scholar] [CrossRef]
- Cloern, J.E.; Abreu, P.C.; Carstensen, J.; Chauvaud, L.; Elmgren, R.; Grall, J.; Greening, H.; Johansson, J.O.R.; Kahru, M.; Sherwood, E.T.; et al. Human activities and climate variability drive fast-paced change across the world’s estuarine–coastal ecosystems. Glob. Chang. Biol. 2016, 22, 513–529. [Google Scholar] [CrossRef] [PubMed]
- Zheng, B.; Zhao, J.; You, D. Study on the coupling relationship between water environment and social economy in Ganjiang River basin. Desalin. Water Treat. 2018, 122, 14–19. [Google Scholar] [CrossRef]
- Wang, T.; Jian, S.; Wang, J.; Yan, D. Dynamic interaction of water–economic–social–ecological environment complex system under the framework of water resources carrying capacity. J. Clean. Prod. 2022, 368, 133132. [Google Scholar] [CrossRef]
- Liu, Y.; Zhang, X.; Pan, X.; Ma, X.; Tang, M. The spatial integration and coordinated industrial development of urban agglomerations in the Yangtze River Economic Belt, China. Cities 2020, 104, 102801. [Google Scholar] [CrossRef]
- Jiang, L.; Zuo, Q.; Ma, J.; Zhang, Z. Evaluation and prediction of the level of high-quality development: A case study of the Yellow River Basin, China. Ecol. Indic. 2021, 129, 107994. [Google Scholar] [CrossRef]
- Li, H.; Jiang, Z.; Dong, G.; Wang, L.; Huang, X.; Gu, X.; Guo, Y. Spatiotemporal Coupling Coordination Analysis of Social Economy and Resource Environment of Central Cities in the Yellow River Basin. Discret. Dyn. Nat. Soc. 2021, 2021, 6637631. [Google Scholar] [CrossRef]
- Chen, X.; Li, F.; Wu, F.; Xu, X.; Zhao, Y. Initial water rights allocation of Industry in the Yellow River basin driven by high-quality development. Ecol. Model. 2023, 477, 110272. [Google Scholar] [CrossRef]
- Wu, R.; Possingham, H.; Yu, G.; Jin, T.; Wang, J.; Yang, F.; Zhao, H. Strengthening China’s national biodiversity strategy to attain an ecological civilization. Conserv. Lett. 2019, 12, e12660. [Google Scholar] [CrossRef]
- Sun, J.; Tang, D.; Kong, H.; Boamah, V. Impact of Industrial Structure Upgrading on Green Total Factor Productivity in the Yangtze River Economic Belt. Int. J. Environ. Res. Public Health 2022, 19, 3718. [Google Scholar] [CrossRef]
- Chen, Y.; Fu, B.; Zhao, Y.; Wang, K.; Zhao, M.M.; Ma, J.; Wu, J.; Xu, C.; Liu, W.; Wang, H. Sustainable development in the Yellow River Basin: Issues and strategies. J. Clean. Prod. 2020, 263, 121223. [Google Scholar] [CrossRef]
- Zhang, Z.; Hu, Z.; Zhong, F.; Cheng, Q.; Wu, M. Spatio-Temporal Evolution and Influencing Factors of High Quality Development in the Yunnan–Guizhou, Region Based on the Perspective of a Beautiful China and SDGs. Land 2022, 11, 821. [Google Scholar] [CrossRef]
- Ma, D.; Zhu, Q. Innovation in emerging economies: Research on the digital economy driving high-quality green development. J. Bus. Res. 2022, 145, 801–813. [Google Scholar] [CrossRef]
- Zhang, S.; Zhong, Q.; Cheng, D.; Xu, C.; Chang, Y.; Lin, Y.; Li, B. Coupling Coordination Analysis and Prediction of Landscape Ecological Risks and Ecosystem Services in the Min River Basin. Land 2022, 11, 222. [Google Scholar] [CrossRef]
- Hong, Y.; Liu, W.; Song, H. Spatial econometric analysis of effect of New economic momentum on China’s high-quality development. Res. Int. Bus. Financ. 2022, 61, 101621. [Google Scholar] [CrossRef]
- Wang, F.; Wang, R.; He, Z. The impact of environmental pollution and green finance on the high-quality development of energy based on spatial Dubin model. Resour. Policy 2021, 74, 102451. [Google Scholar] [CrossRef]
- Li, Q. Evaluation Method of Economic Growth Quality of Tourism-Driven Real Estate Based on AHP. Wirel. Commun. Mob. Comput. 2022, 2022, 7252544. [Google Scholar] [CrossRef]
- Hayat, A. Foreign direct investments, institutional quality, and economic growth. J. Int. Trade Econ. Dev. 2019, 28, 561–579. [Google Scholar] [CrossRef]
- Jing, F.Z.; Zhao, H. Research on coupling relationship between environmental quality and regional economic growth based on VAR model. Clust. Comput. 2019, 22, 5881–5891. [Google Scholar] [CrossRef]
- Song, Y.; Liu, H. Internet development, economic level, and port total factor productivity: An empirical study of Yangtze River ports. Int. J. Logist. Res. Appl. 2020, 23, 375–389. [Google Scholar] [CrossRef]
- Wu, Y.; Zhang, S. Research on the evolution of high-quality development of China’s provincial foreign trade. Sci. Program. 2022, 2022, 3102157. [Google Scholar] [CrossRef]
- Zhang, J.; Fu, X.; Morris, H. Construction of indicator system of regional economic system impact factors based on fraction-al differential equations. Chaos Solitons Fractals 2019, 128, 25–33. [Google Scholar] [CrossRef]
- Reyes-Riveros, R.; Altamirano, A.; De, F.; Rozas-Vásquez, D.; Vieli, L.; Meli, P. Linking public urban green spaces and human well-being: A systematic review. Urban For. Urban Green. 2021, 61, 127105. [Google Scholar] [CrossRef]
- Li, J.; Sun, W.; Li, M.; Meng, L. Coupling coordination degree of production, living and ecological spaces and its influencing factors in the Yellow River Basin. J. Clean. Prod. 2021, 298, 126803. [Google Scholar] [CrossRef]
- Li, W.; Yi, P. Assessment of city sustainability—Coupling coordinated development among economy, society and environment. J. Clean. Prod. 2020, 256, 120453. [Google Scholar] [CrossRef]
- Chimeli, A.; Braden, J. Total factor productivity and the environmental Kuznets curve. J. Environ. Econ. Manag. 2005, 49, 366–380. [Google Scholar] [CrossRef]
- Hafner, K. Growth-instability frontier and industrial diversification: Evidence from European gross value added. Pap. Reg. Sci. 2019, 98, 799–824. [Google Scholar] [CrossRef]
- Ding, Y.; Zhang, H.; Tang, S. How does the digital economy affect the domestic value-added rate of Chinese exports? J. Glob. Inf. Manag. JGIM 2021, 29, 71–85. [Google Scholar] [CrossRef]
- Ren, X.; Yang, S. Technological innovation, industrial structure upgrading and high-quality economic development: Analysis based on the measurement of independent effects and synergistic effects. East China Econ. Manag. 2020, 11, 72–80. [Google Scholar]
- Guo, F.; Wang, J. Measuring the development of China’s digital financial inclusion: Index compilation and spatial characteristics. China Econ. Q. Int. 2020, 4, 1401–1418. [Google Scholar]
- Ge, H.; Wu, F. Digital economy empowers high-quality economic development: Theoretical mechanism and empirical evidence. Nanjing J. Soc. Sci. 2021, 1, 24–33. [Google Scholar]
- Ercolani, M.; Wei, Z. An empirical analysis of China’s dualistic economic development: 1965–2009. Asian Econ. Pap. 2011, 10, 1–29. [Google Scholar] [CrossRef]
- Wang, P.; Wu, J. Impact of environmental investment and resource endowment on regional energy efficiency: Evidence from the Yangtze River Economic Belt, China. Environ. Sci. Pollut. Res. 2022, 29, 5445–5453. [Google Scholar] [CrossRef]
- Li, T.; Liao, G. The heterogeneous impact of financial development on green total factor productivity. Front. Energy Res. 2020, 8, 29. [Google Scholar] [CrossRef]
- Zhang, J.; Lu, G.; Skitmore, M.; Ballesteros-Pérez, P.A. critical review of the current research mainstreams and the influencing factors of green total factor productivity. Environ. Sci. Pollut. Res. 2021, 28, 35392–35405. [Google Scholar] [CrossRef] [PubMed]
- Ren, S.; Li, X.; Yuan, B.; Li, D.; Chen, X. The effects of three types of environmental regulation on eco-efficiency: A cross-region analysis in China. J. Clean. Prod. 2018, 173, 245–255. [Google Scholar] [CrossRef]
- Li, B.; Liu, Z. Measurement and evolution of high-quality development level of marine fishery in China. Chin. Geogr. Sci. 2022, 32, 251–267. [Google Scholar] [CrossRef] [PubMed]
- Li, X.; Lu, Y.; Huang, R. Whether foreign direct investment can promote high-quality economic development under environmental regulation: Evidence from the Yangtze River Economic Belt, China. Environ. Sci. Pollut. Res. 2021, 28, 21674–21683. [Google Scholar] [CrossRef]
- Yang, W.; Zhang, Z. Comparative Study on Ecological Total Factor Productivity between the Yellow River Basin and the Yangtze River Economic Belt. J. Manag. 2020, 33, 26–37. [Google Scholar]
- Fang, L.; Wang, L.; Chen, W.; Sun, J.; Cao, Q.; Wang, S.; Wang, L. Identifying the impacts of natural and human factors on ecosystem service in the Yangtze and Yellow River Basins. J. Clean. Prod. 2021, 314, 127995. [Google Scholar] [CrossRef]
- Yang, Q.; Xu, Q. Comparative Study on Green Efficiency of Water Resources between the Yangtze River Economic Belt and the Yellow River Basin. Rev. Econ. Manag. 2022, 38, 49–62. [Google Scholar]
- Cui, X.; Cai, T.; Deng, W.; Zheng, R.; Jiang, Y.; Bao, H. Indicators for Evaluating High-Quality Agricultural Development: Empirical Study from Yangtze River Economic Belt, China. Soc. Indic. Res. 2022, 164, 1101–1127. [Google Scholar] [CrossRef]
- Yu, S.; Lu, H. Relationship between urbanization and pollutant emissions in transboundary river basins under the strategy of the Belt and Road Initiative. Chemosphere 2018, 203, 11–20. [Google Scholar] [CrossRef]
- Geng, W.; Li, Y.; Zhang, P.; Yang, D.; Jing, W.; Rong, T. Analyzing spatio-temporal changes and trade-offs/synergies among ecosystem services in the Yellow River Basin, China. Ecol. Indic. 2022, 138, 108825. [Google Scholar] [CrossRef]
- Xiong, Y.; Xu, W.; Lu, N.; Huang, S.; Wu, C.; Wang, L.; Kou, W. Assessment of spatial–temporal changes of ecological environment quality based on RSEI and GEE: A case study in Erhai Lake Basin, Yunnan province, China. Ecol. Indic. 2021, 125, 107518. [Google Scholar] [CrossRef]
- Xin, Y.; Liu, X. Coupling driving factors of eco-environmental protection and high-quality development in the yellow river basin. Front. Environ. Sci. 2022, 10, 951218. [Google Scholar] [CrossRef]
- Li, X.; Tan, Y.; Tian, K. The Impact of Environmental Regulation, Industrial Structure, and Interaction on the High-Quality Development Efficiency of the Yellow River Basin in China from the Perspective of the Threshold Effect. Int. J. Environ. Res. Public Health 2022, 19, 14670. [Google Scholar] [CrossRef] [PubMed]
- Zha, Q.; Liu, Z.; Song, Z.; Wang, J. A study on dynamic evolution, regional differences and convergence of high-quality economic development in urban agglomerations: A case study of three major urban agglomerations in the Yangtze river economic belt. Front. Environ. Sci. 2022, 10, 1012304. [Google Scholar] [CrossRef]
- Tang, R. A study of the effects and mechanisms of the digital economy on high-quality tourism development: Evidence from the Yangtze River Delta in China. Asia Pac. J. Tour. Res. 2022, 27, 1217–1232. [Google Scholar] [CrossRef]
- Chen, Y.; Zhu, M.K.; Lu, J.L.; Zhou, Q.; Ma, W.B. Evaluation of ecological city and analysis of obstacle factors under the background of high-quality development: Taking cities in the Yellow River Basin as examples. Ecol. Indic. 2020, 118, 106771. [Google Scholar] [CrossRef]
- Yuan, X.Y.; Li, S.R.; Li, Z.P. Setting standards for urban development: Review of the construction of urban high-quality development evaluation system. J. Xi’an Jiaotong Univ. Soc. Sci. 2021, 41, 18–24. [Google Scholar]
- Cooke, P. The role of research in regional innovation systems: New models meeting knowledge economy demands. Int. J. Technol. Manag. 2004, 28, 507–533. [Google Scholar] [CrossRef]
- Miao, C.; Duan, M.; Zuo, Y.; Wu, X. Spatial heterogeneity and evolution trend of regional green innovation efficiency--an empirical study based on panel data of industrial enterprises in China’s provinces. Energy Policy 2021, 156, 112370. [Google Scholar] [CrossRef]
- Ma, D.; Zhang, J.; Wang, Z.; Sun, D. Spatio-Temporal Evolution and Influencing Factors of Open Economy Development in the Yangtze River Delta Area. Land 2022, 11, 1813. [Google Scholar] [CrossRef]
- Chen, M.; Gong, Y.; Lu, D.; Ye, C. Build a people-oriented urbanization: China’s new-type urbanization dream and Anhui model. Land Use Policy 2019, 80, 1–9. [Google Scholar] [CrossRef]
- Sun, C.; Tong, Y.; Zou, W. The evolution and a temporal-spatial difference analysis of green development in China. Sustain. Cities Soc. 2018, 41, 52–61. [Google Scholar] [CrossRef]
- Cunha-Zeri, G.; Guidolini, J.; Branco, E.; Omettoa, J. How sustainable is the nitrogen management in Brazil? A sustainability assessment using the Entropy Weight Method. J. Environ. Manag. 2022, 316, 115330. [Google Scholar] [CrossRef]
- Ding, L.; Yang, Y.; Wang, L.; Calin, A. Cross Efficiency Assessment of China’s marine economy under environmental governance. Ocean Coast. Manag. 2020, 193, 105245. [Google Scholar] [CrossRef]
- Fu, L.; Liu, B.; Zhu, Z.; Cao, J.; Sun, C.; Yu, Z. Analysis of the coupling coordinated development and evolutionary trend of digital economy and ecological environment. Front. Environ. Sci. 2022, 10, 1006354. [Google Scholar] [CrossRef]
- An, X.; Li, Y.; Wang, L.; Dong, G.; Dai, B.; Liang, M. The Spatial and Temporal Distribution of High-Quality Urbanization Development in Yellow River Basin Provinces. Sustainability 2022, 14, 10355. [Google Scholar] [CrossRef]
- Chen, X.; Liu, X.; Zhu, Q. Comparative analysis of total factor productivity in China’s high-tech industries. Technol. Forecast. Soc. Chang. 2022, 175, 121332. [Google Scholar] [CrossRef]
- Gao, D.; Li, G.; Yu, J. Does digitization improve green total factor energy efficiency? Evidence from Chinese 213 cities. Energy 2022, 247, 123395. [Google Scholar] [CrossRef]
- Zhang, D.; Mohsin, M.; Rasheed, A.; Chang, Y.; Taghizadeh-Hesary, F. Public spending and green economic growth in BRI region: Mediating role of green finance. Energy Policy 2021, 153, 112256. [Google Scholar] [CrossRef]
- Zeng, S.; Shu, X.; Ye, W. Total Factor Productivity and High-Quality Economic Development: A Theoretical and Empirical Analysis of the Yangtze River Economic Belt, China. Int. J. Environ. Res. Public Health 2022, 19, 2783. [Google Scholar] [CrossRef]
- Yang, N.; Sun, X.; Qi, Q. Impact of factor quality improvement on agricultural carbon emissions: Evidence from China’s high-standard farmland. Front. Environ. Sci. 2022, 10, 989684. [Google Scholar] [CrossRef]
- An, D.; Shen, C.; Yang, L. Evaluation and Temporal-Spatial Deconstruction for High-Quality Development of Regional Marine Economy: A Case Study of China. Front. Mar. Sci. 2022, 9, 916662. [Google Scholar] [CrossRef]
- Yang, N.; Liu, Z.; Lin, Y.; Yang, Y. Does environmental regulation improve public health? Evidence from China’s Two Control Zones policy. Front. Public Health 2023, 11, 1059890. [Google Scholar] [CrossRef]
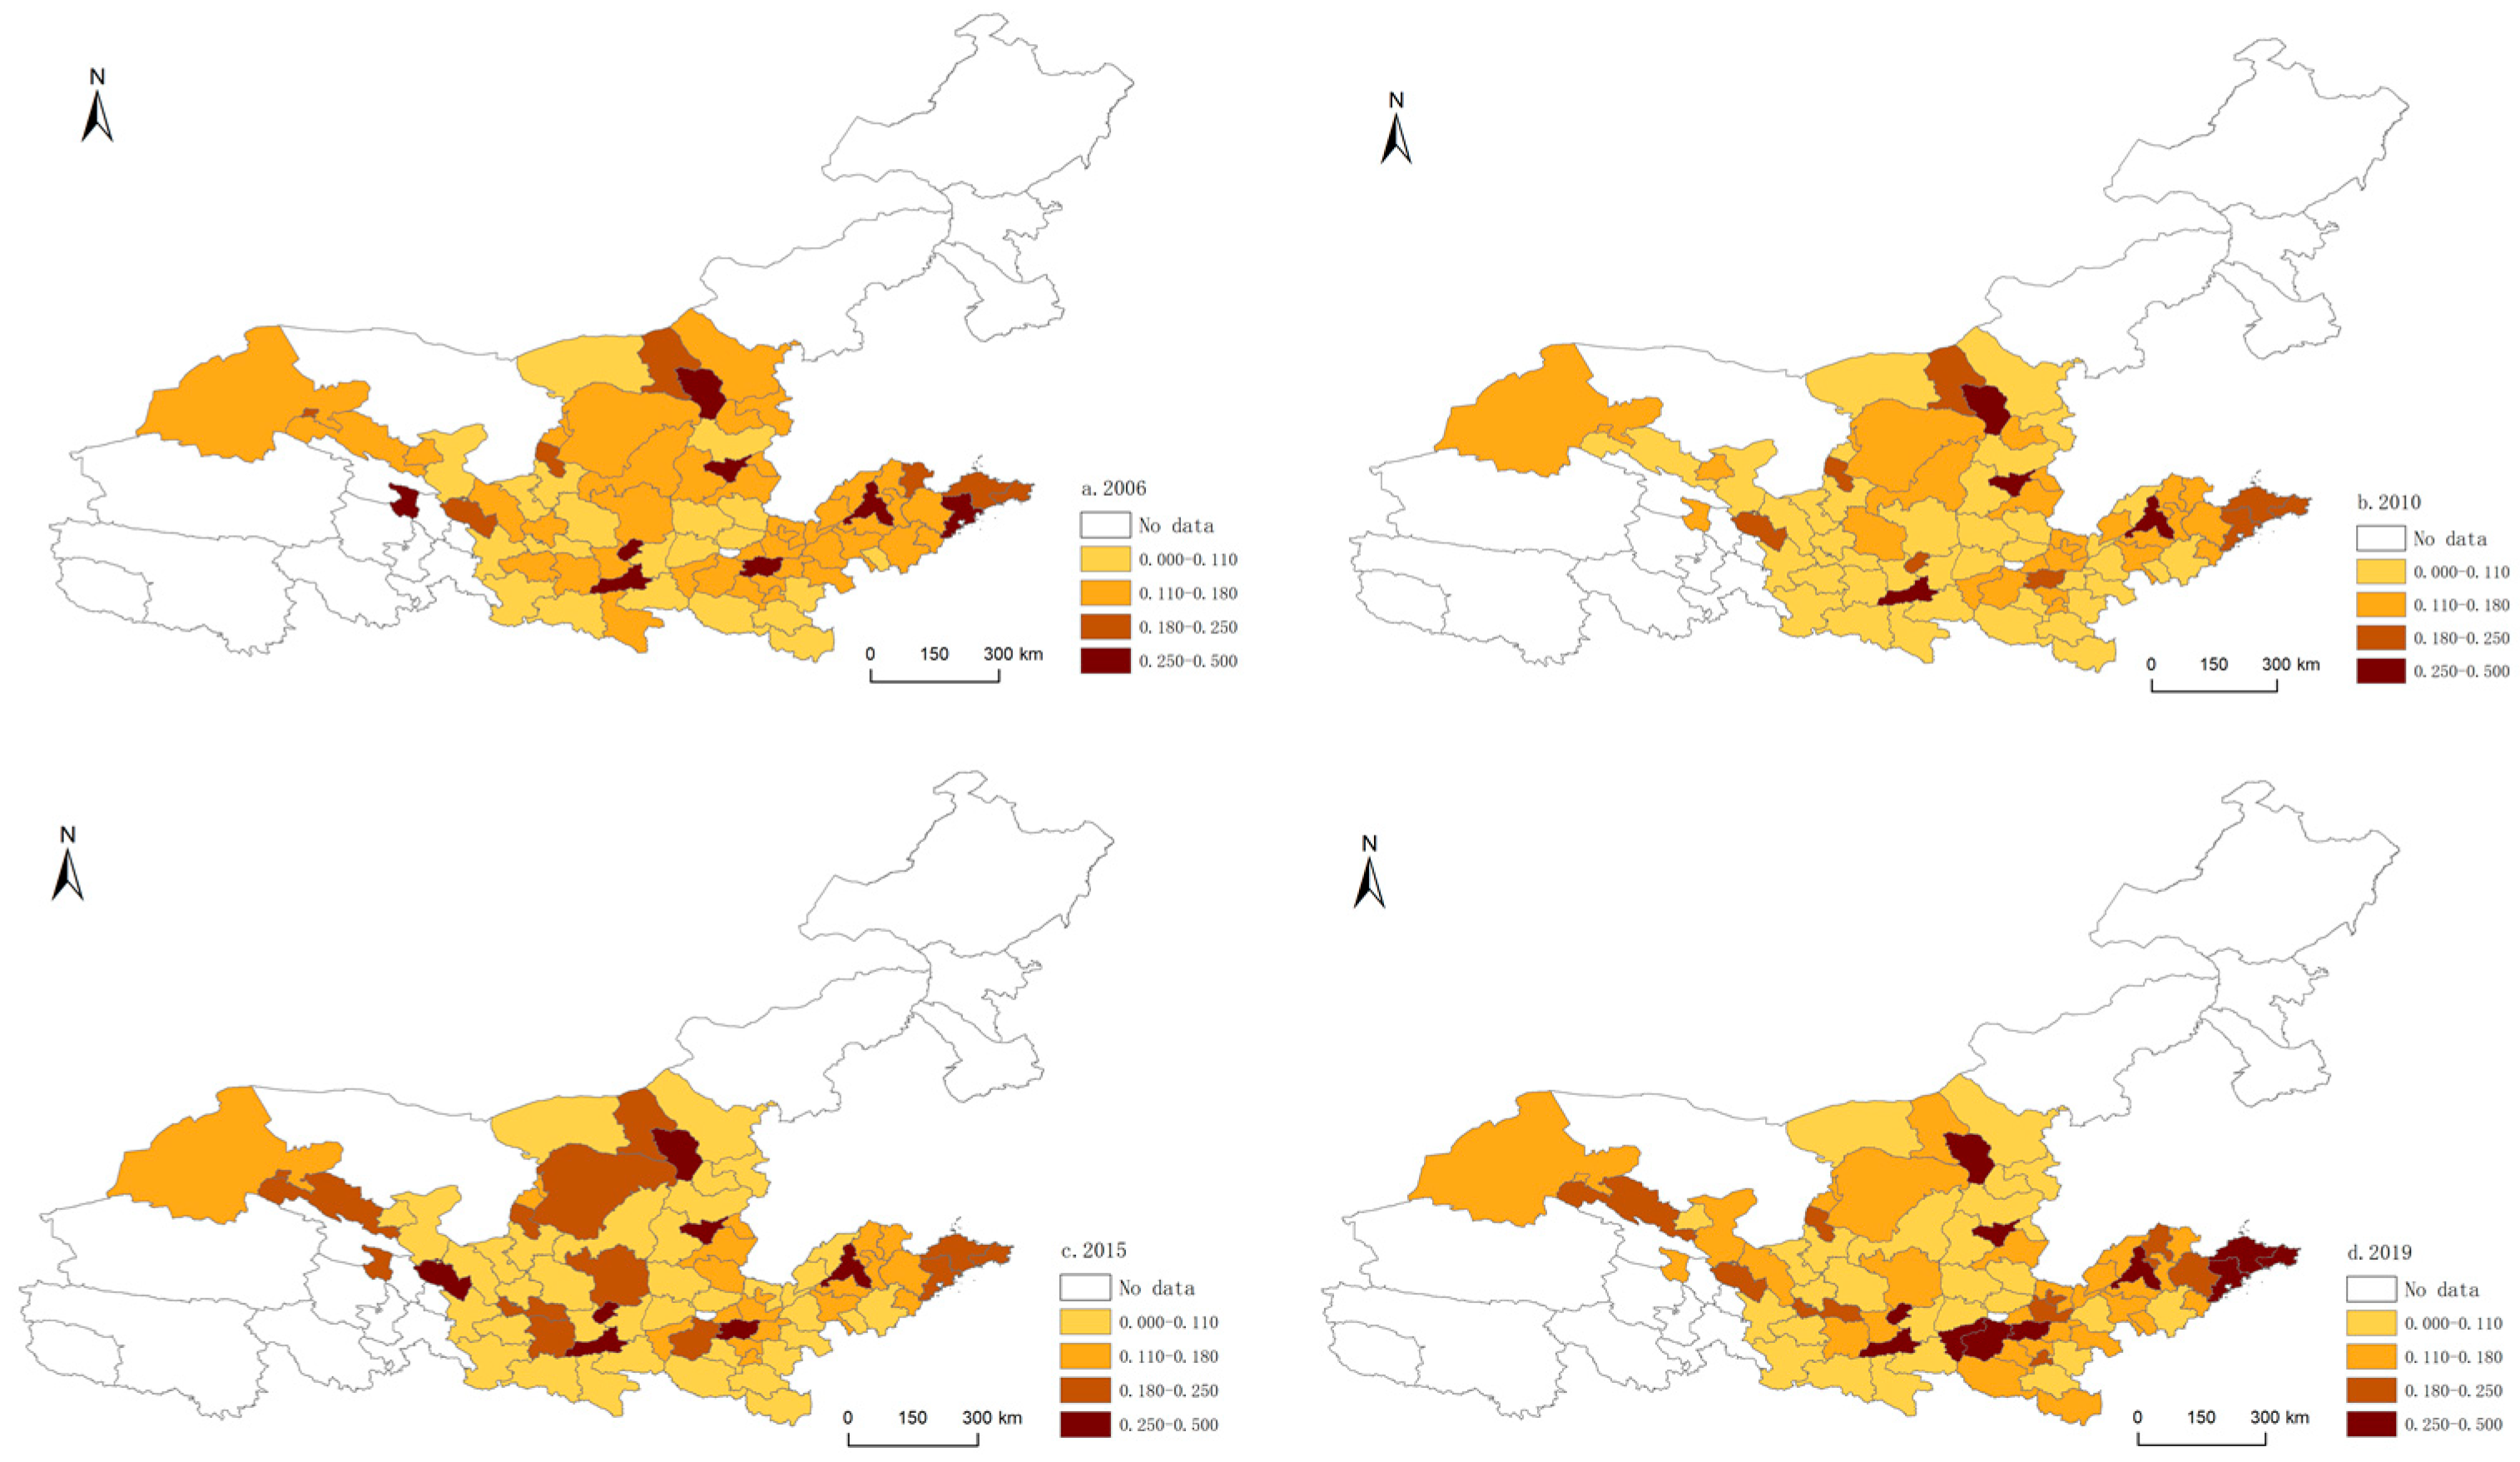
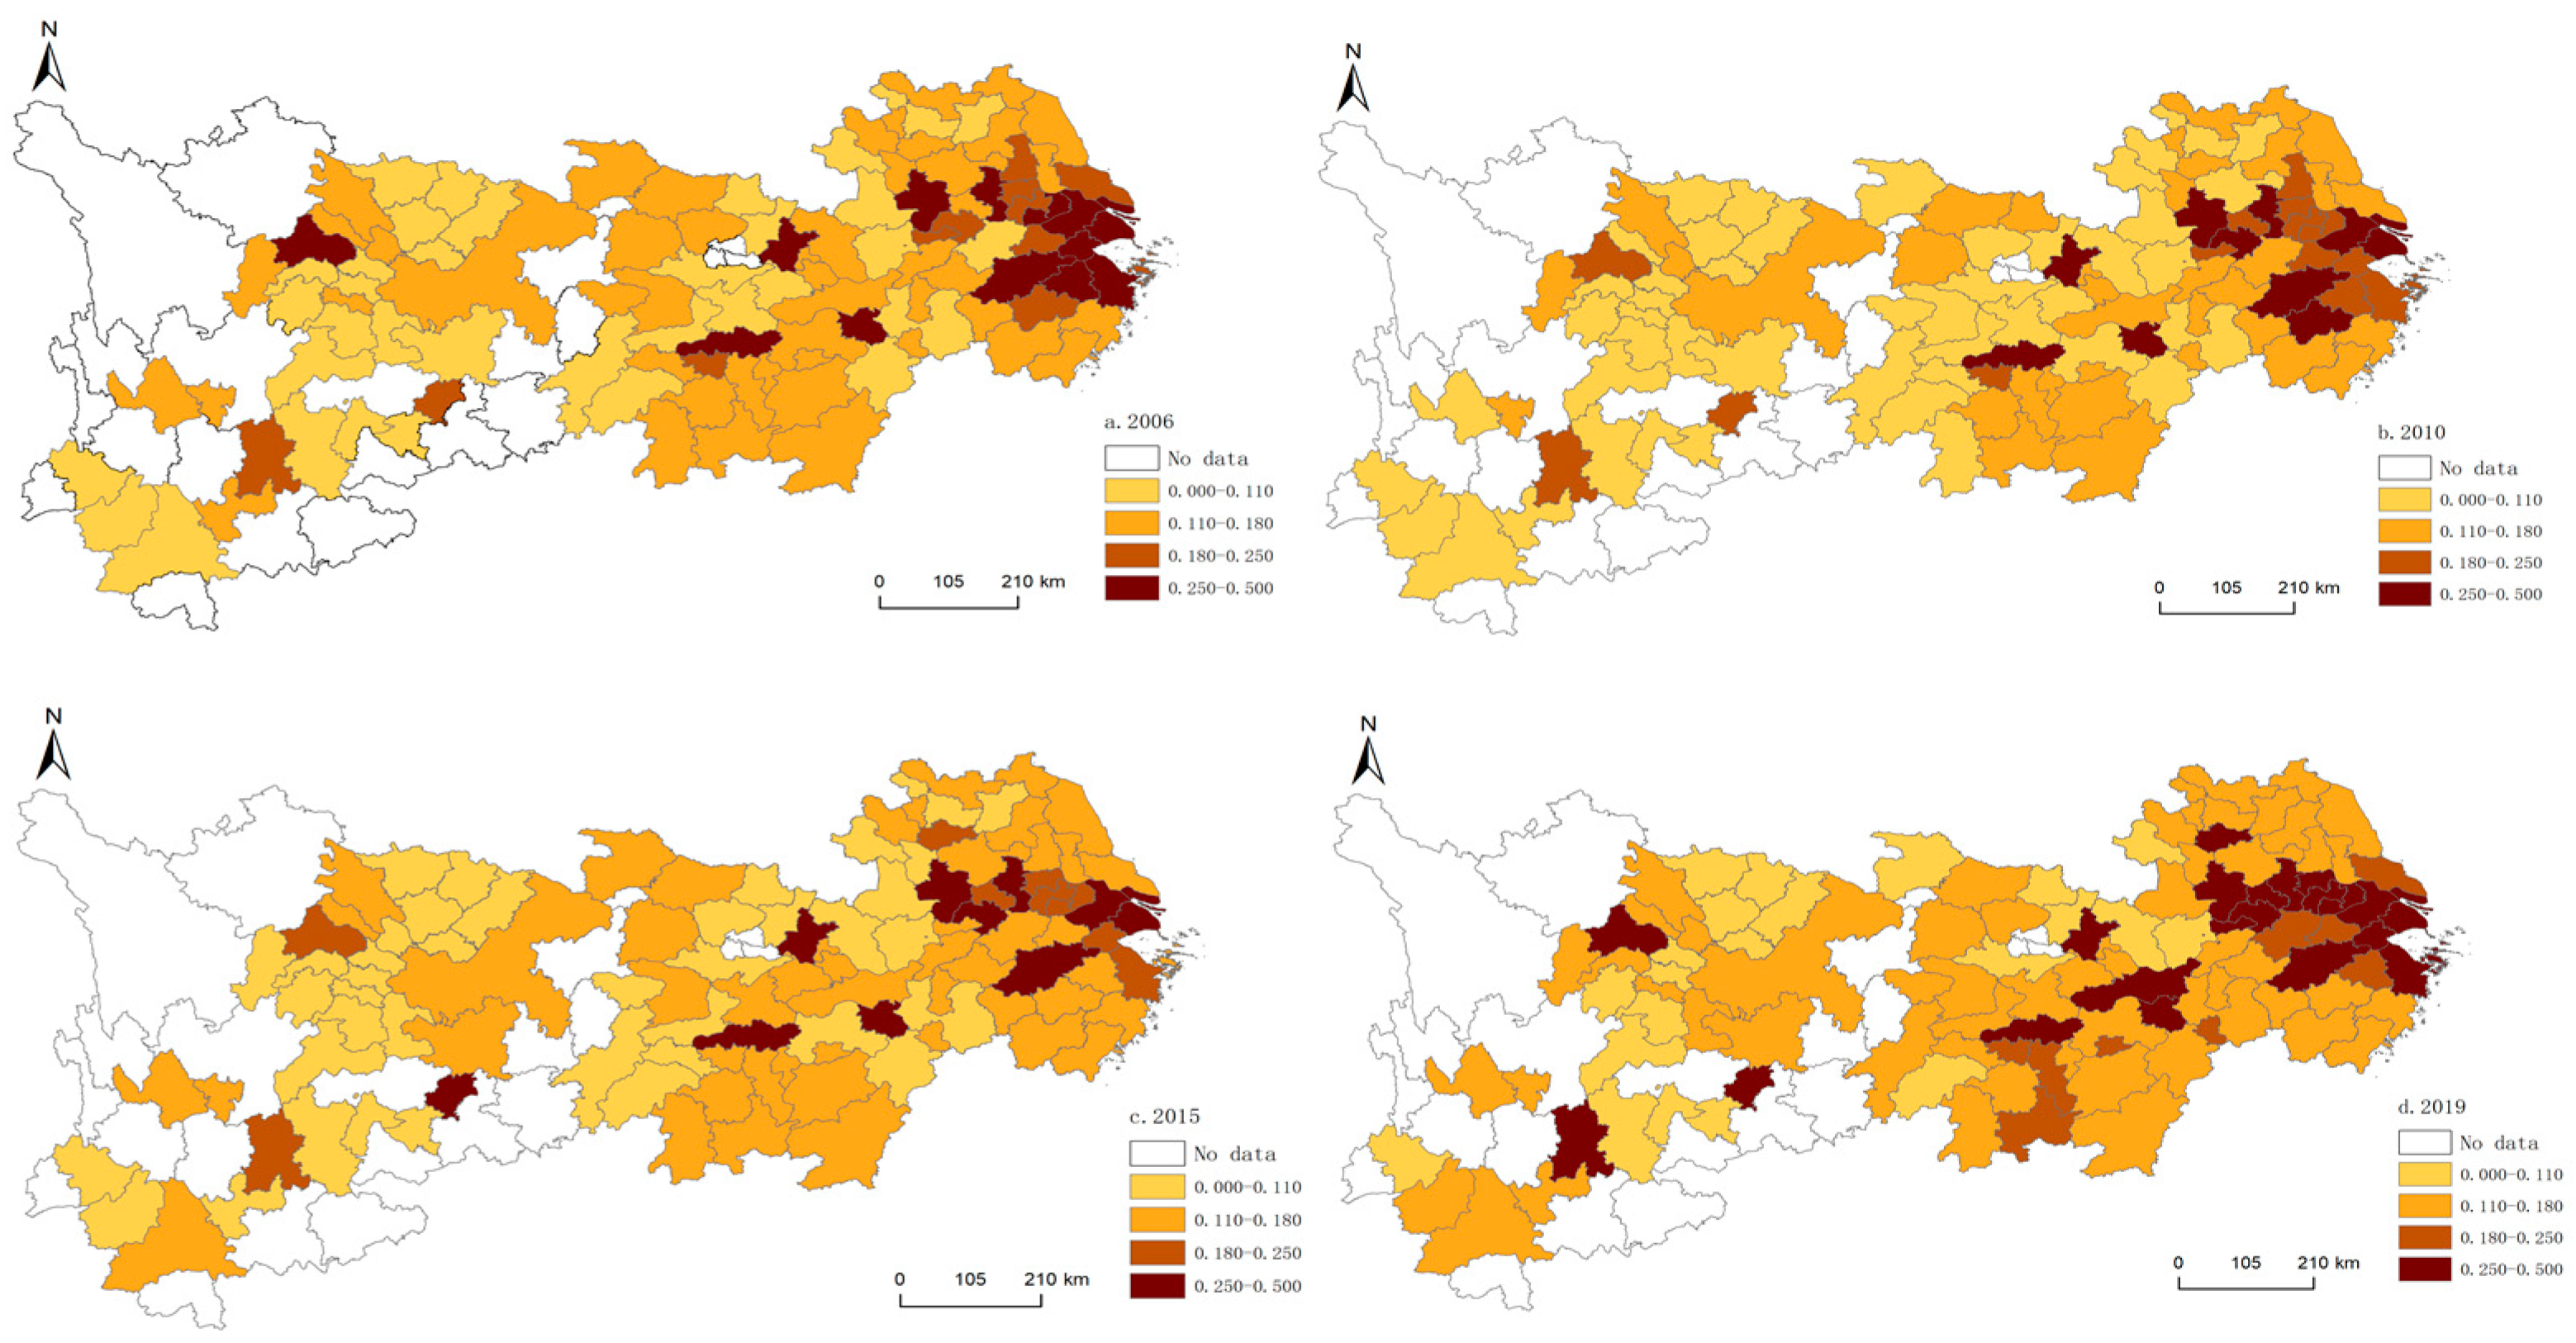
| Criterion Layer | Element Layer | Indicator Layer | Unit | Indicator Attribute |
|---|---|---|---|---|
| HQD | Innovation-driven development progress | Number of students in ordinary institutions of higher learning per 10,000 people | per capita | + |
| Proportion of science and technology expenditure of total financial expenditure | % | + | ||
| Proportion of education expenditure of total financial expenditure | % | + | ||
| Proportion of scientific and technological personnel of all employees | % | + | ||
| Coordinated | Urbanization rate | % | + | |
| development | Advanced industrial structure index | % | + | |
| Industrial structure rationalization index | % | − | ||
| Proportion of tertiary industry output value of regional GDP | % | + | ||
| Green | Urban green area coverage | % | + | |
| development | Harmless treatment rate of domestic waste | t/CNY 10,000 | − | |
| Discharge amount of wastewater per unit output | kWh/CNY 10,000 | − | ||
| Emission of sulfur dioxide per unit output | % | + | ||
| Proportion of total import and export of regional GDP | % | + | ||
| Development for global progress | Proportion of total import and export of regional GDP | CNY | + | |
| Proportion of foreign investment of regional GDP | % | + | ||
| Development for the benefit of all | Number of beds in medical and health institutions per 10,000 people | + | ||
| Bus ownership per 10,000 people | + | |||
| Public library collection per 10,000 people | + |
| Variable | Variable Definitions | Mean | SD | Min | Max |
|---|---|---|---|---|---|
| HQD | High-quality development | 0.15 | 0.07 | 0.05 | 0.64 |
| HUM | Human capital | 177.45 | 231.42 | 0.28 | 1310.74 |
| URB | Urbanization level | 0.52 | 0.16 | 0.15 | 1.00 |
| FDI | Foreign direct investment | 0.02 | 0.03 | 0.01 | 0.69 |
| GDP | Economic scale | 41,972.53 | 30,114.51 | 2755 | 215,488 |
| IND | Industrialization level | 0.48 | 0.11 | 0.12 | 0.91 |
| Year | Yellow River Basin | Yangtze River Economic Belt | ||||||
|---|---|---|---|---|---|---|---|---|
| All | Upstream | Midstream | Downstream | All | Upstream | Midstream | Downstream | |
| 2006 | 0.147 | 0.148 | 0.138 | 0.151 | 0.157 | 0.118 | 0.145 | 0.197 |
| 2007 | 0.158 | 0.153 | 0.153 | 0.165 | 0.168 | 0.125 | 0.153 | 0.214 |
| 2008 | 0.157 | 0.153 | 0.153 | 0.163 | 0.167 | 0.124 | 0.151 | 0.214 |
| 2009 | 0.139 | 0.137 | 0.130 | 0.145 | 0.155 | 0.118 | 0.140 | 0.196 |
| 2010 | 0.127 | 0.127 | 0.123 | 0.132 | 0.140 | 0.106 | 0.126 | 0.179 |
| 2011 | 0.137 | 0.130 | 0.133 | 0.145 | 0.146 | 0.114 | 0.133 | 0.181 |
| 2012 | 0.128 | 0.137 | 0.139 | 0.154 | 0.138 | 0.127 | 0.142 | 0.210 |
| 2013 | 0.145 | 0.123 | 0.126 | 0.131 | 0.153 | 0.114 | 0.123 | 0.168 |
| 2014 | 0.136 | 0.131 | 0.133 | 0.142 | 0.146 | 0.123 | 0.133 | 0.175 |
| 2015 | 0.132 | 0.129 | 0.127 | 0.138 | 0.146 | 0.111 | 0.133 | 0.184 |
| 2016 | 0.134 | 0.138 | 0.124 | 0.139 | 0.142 | 0.114 | 0.134 | 0.169 |
| 2017 | 0.140 | 0.133 | 0.132 | 0.150 | 0.156 | 0.126 | 0.145 | 0.189 |
| 2018 | 0.132 | 0.125 | 0.124 | 0.142 | 0.143 | 0.120 | 0.134 | 0.169 |
| 2019 | 0.149 | 0.135 | 0.131 | 0.157 | 0.166 | 0.134 | 0.160 | 0.195 |
| Variable | Yellow River Basin | Yangtze River Economic Belt | ||||||
|---|---|---|---|---|---|---|---|---|
| (1) | (2) | (3) | (4) | (5) | (6) | (7) | (8) | |
| All | Upstream | Midstream | Downstream | All | Upstream | Midstream | Downstream | |
| LnHUM | 0.014 *** | 0.012 *** | 0.014 *** | 0.025 *** | 0.007 ** | 0.002 | 0.004 | 0.014 ** |
| (0.002) | (0.003) | (0.002) | (0.007) | (0.003) | (0.002) | (0.003) | (0.006) | |
| URB | 0.042 | 0.073 *** | −0.330 *** | −0.038 | 0.052 * | −0.037 | 0.025 | 0.092 |
| (0.027) | (0.015) | (0.087) | (0.087) | (0.030) | (0.039) | (0.035) | (0.070) | |
| FDI | 0.356 *** | 0.850 *** | 0.253 *** | 0.586 *** | 0.358 *** | 0.216 *** | 0.260 *** | 0.902 *** |
| (0.096) | (0.086) | (0.030) | (0.090) | (0.095) | (0.023) | (0.075) | (0.065) | |
| LnGDP | 0.025 *** | 0.013 | 0.057 *** | 0.020 *** | 0.043 *** | 0.044 *** | 0.011 | 0.035 *** |
| (0.007) | (0.011) | (0.016) | (0.006) | (0.010) | (0.010) | (0.013) | (0.011) | |
| IND | −0.058 *** | −0.004 | −0.122 *** | −0.071 ** | 0.005 | −0.079 *** | −0.025 | 0.018 |
| (0.021) | (0.030) | (0.042) | (0.035) | (0.021) | (0.020) | (0.032) | (0.041) | |
| Constant | −0.158 ** | −0.05 | −0.282 ** | −0.113 | −0.329 *** | −0.236 ** | 0.027 | −0.282 *** |
| (0.064) | (0.102) | (0.124) | (0.071) | (0.090) | (0.094) | (0.126) | (0.090) | |
| Observations | 1092 | 336 | 294 | 462 | 1512 | 434 | 504 | 574 |
Disclaimer/Publisher’s Note: The statements, opinions and data contained in all publications are solely those of the individual author(s) and contributor(s) and not of MDPI and/or the editor(s). MDPI and/or the editor(s) disclaim responsibility for any injury to people or property resulting from any ideas, methods, instructions or products referred to in the content. |
© 2023 by the authors. Licensee MDPI, Basel, Switzerland. This article is an open access article distributed under the terms and conditions of the Creative Commons Attribution (CC BY) license (https://creativecommons.org/licenses/by/4.0/).
Share and Cite
Wang, Y.; Yang, N. Differences in High-Quality Development and Its Influencing Factors between Yellow River Basin and Yangtze River Economic Belt. Land 2023, 12, 1461. https://doi.org/10.3390/land12071461
Wang Y, Yang N. Differences in High-Quality Development and Its Influencing Factors between Yellow River Basin and Yangtze River Economic Belt. Land. 2023; 12(7):1461. https://doi.org/10.3390/land12071461
Chicago/Turabian StyleWang, Yiwei, and Ningze Yang. 2023. "Differences in High-Quality Development and Its Influencing Factors between Yellow River Basin and Yangtze River Economic Belt" Land 12, no. 7: 1461. https://doi.org/10.3390/land12071461
APA StyleWang, Y., & Yang, N. (2023). Differences in High-Quality Development and Its Influencing Factors between Yellow River Basin and Yangtze River Economic Belt. Land, 12(7), 1461. https://doi.org/10.3390/land12071461


