Article

Interaction between the Cultural and Entertainment Industry and Urban Development in Xi’an: A Case Study

1
School of Geography and Tourism, Shaanxi Normal University, Xi’an 710119, China
2
School of Tourism, Bohai University, Jinzhou 121000, China
3
School of Statistics, Renmin University of China, Beijing 100872, China
*
Authors to whom correspondence should be addressed.
Land 2023, 12(7), 1445; https://doi.org/10.3390/land12071445
Submission received: 15 June 2023 / Revised: 17 July 2023 / Accepted: 18 July 2023 / Published: 20 July 2023
(This article belongs to the Special Issue Geospatial Data in Land Suitability Assessment)

Abstract

:
The cultural and entertainment industry (CEI) actively promotes the economy. Xi’an is a comprehensive pilot city of China’s cultural system reform. The characteristics of the staged changes and regional differentiation of the interaction between the CEI and urban development from 2000 to 2020 were studied by selecting seven districts in Xi’an. We used an expansion intensity index, equal-fan analysis, and coordination model. This analysis revealed the mechanism of the interaction between the CEI and urban development. We found that both the CEI and urban development mainly expand to northeast and southwest, while the expansion synchronicity of the CEI and urban development differs in various directions. The coordination between the CEI and urban development shows a pronounced “center-edge” feature. In other words, the closer to the city center, the stronger the coordination between them. The city guides the layout of the CEI through the agglomeration of elements. Meanwhile, the CEI promotes the reconstruction of urban space in turn, through its production. The study’s findings may enrich the theory of coordinated development of the CEI and urban development. Furthermore, it provides a scientific basis for formulating the layout and development patterns of the CEI in Xi’an and other developing cities worldwide.

1. Introduction

The cultural and entertainment industry (CEI), as an important subsector of the creative industry, is oriented by human cultural consumption demands [1]. It can be closely related to residents’ yearning for a better life. Moreover, it can foster new economic growth points [2]. The evolution of the CEI has a substantial impact on the shaping of urban space [3]. For policymakers, creative industries, including the CEI, have become a top priority in the policy agendas of major cities around the world [4]. Correspondingly, in terms of academic research, the development of the CEI as a means to promote economic and urban development has received extensive attention in the field of urban geography and economic geography in the world [5,6].
China is no exception in recognizing the importance of creative industries in its development agenda. Since the beginning of the twenty-first century, the Chinese government has actively participated in the development of the creative industry, including the CEI [7]. The growth of the urban cultural economy has been included in the development agenda of almost all provinces and cities. Thus, it has also become the primary target of intercity competition [8]. Xi’an is an important cultural and economic center in China. As one of the famous historical and cultural cities, Xi’an has a long history and rich cultural heritage, which provide a solid foundation for the development of the CEI and tourism. Since 2000, with the support of Chinese government policies, Xi’an has entered a period of rapid urbanization. The output value of the cultural tourism industry increases annually, causing the industry to establish itself as one of the pillar industries of Xi’an [9]. Within this industry, cultural experience and entertainment play vital roles, contributing significantly to its overall development [10,11]. However, as cities enter the stage of accelerated development, problems such as unbalanced urban and rural development, unequal distribution of cultural resources, and uncoordinated resident income gradually emerge. Despite the rapid expansion of the urban area in Xi’an since 2000 [12], the CEI remains primarily concentrated in the central area of the city [13]. These discrepancies result in unmet cultural needs among residents living on the outskirts, limiting sustainable and healthy CEI and urban development. In April 2022, the “Xi’an Metropolitan Area Development Plan” was officially approved, marking the fifth metropolitan area development plan in China and the first in northwest China. This plan will bring significant changes to Xi’an’s urban planning and spatial structure. Given this context, it becomes essential to swiftly address the challenge of coordinating CEI and urban development, constructing urban cultural spaces, and resolving imbalances and inadequacies in the development of cultural resources. To address these issues, understanding how the CEI, as a cultural carrier, interacts with urban development is crucial in order to accurately align the CEI within the context of rapid urban development and urban spatial reconstruction. Therefore, it is necessary to investigate the spatial interaction between the CEI and urban development, as well as their underlying mechanisms.
This analysis differs from previous research analyzing the interaction between the CEI and urban development in major world cities [14,15]. Most research has investigated this interaction in a free market, primarily focused on the social and economic factors that affect their interaction. We have conducted our analysis from a geographical perspective, with a particular emphasis on the spatial distribution and patterns of interaction of the CEI. The geographical perspective of analysis enables us to gain a deeper understanding of the macro-level laws governing the CEI and urban development, empowering us to more effectively allocate CEI resources across different socio-economic backgrounds and drive urban growth. In addition, for ideological reasons, the creative industry, including the CEI, is one of the most strictly regulated and protected sectors in China [16]. The behavior of the government is reflected in urban planning. Meanwhile, the results of urban planning are shown in the existing spatial patterns. Therefore, we reflect on these differences in the context of urban China and to what extent they influence and reshape our understanding of the relationship between the CEI and urban development from a geographical perspective.
Three literature types are relevant to our work: research dealing with the spatial pattern of the CEI, the CEI’s effects, and the interaction between the CEI and urban development. We present a review of these studies below.
The first type of literature is composed of studies that investigate the spatial pattern of the CEI. Some have studied the distribution characteristics of the CEI. Some studies indicated that the spatial distribution pattern of the CEI tends to exhibit clustering behavior. For example, C. Grodach argued that the art industry in the United States is susceptible to broader economic changes, leading to fluctuations. Between 1980 and 2000, there was widespread growth in the art industry, but from 2000 to 2010, the growth rate slowed considerably and became concentrated in a few metropolitan areas [17]. E. Currid and S. Williams compared the art, fashion, music, and design industries in Los Angeles and New York City and found similar clustering patterns across these diverse cities, where sub-sectors tended to collocate in similar ways [18]. Nevertheless, there are exceptions to this pattern. For example, L. Deng and J. Wu argued that Shanghai’s entertainment space underwent a transitional process of transforming from scattered locations to aggregation, followed by radial expansion between 1984 and 1949 [19]. Additionally, some studies have examined the factors influencing the spatial layout of the CEI. These factors can be summed up as the creative class [20], financial and insurance institutions, buildings, security company density, housing rent, the distance to the nearest scenic spot [21], specialization, urbanization, production structure externalities [14], and specific institutional strategies [22]. It is important to consider that the development of a city itself is a significant factor that influences the spatial layout of the CEI. Moreover, policy instruments can overcome geographical constraints to shape the CEI’s layout. For example, Ribeiro et al. argued that there was a positive correlation between urbanization and formal cultural employment in Brazil [14]. A. Cole argued that the layout of animated feature-film production in Europe could overcome the geographical constraints through extra-local project ecologies [22]. Research demonstrates that the distribution of the CEI is not always concentrated or diffused, and the factors affecting the spatial layout of different types of CEIs vary across regions. Therefore, in this study, we primarily focus on exploring the dynamic evolution of the CEI’s spatial distribution over a long period rather than its static distribution at a given time point. By integrating the characteristics of urban development, we examine the evolution and interaction between the CEI and urban development from two perspectives: external expansion and internal growth.
The second type of literature is composed of studies that investigate the effects of the CEI. The prevailing view is that the CEI can promote the development of urban economy. For example, A. Markusen and G. Schrock argued that artists make significant contributions to the economy, which are often underestimated due to inadequate statistical methods. The artistic dividend brought by artists not only fosters local economic growth, but also creates a vibrant arts community. Such communities have the potential to attract new businesses and talented individuals to the area [23]. Y. Zhu designed a model to study the role of the cultural industry in social development and demonstrated that the cultural tourism industry can indeed promote social-economic development [24]. Furthermore, several studies have indicated that urban space plays a role in the process of the CEI fostering economic development. For example, A. Betlej and T. Kacerauskas employed interviews to analyze the impact of cultural urban space on the economic outcomes of Lublin. They argued that Lublin achieved innovative urban space through cultural activities, thereby facilitating the city’s sustainable development [25]. S. He proposed that in response to the capital accumulation crisis, Shanghai creatively reconstructed the built environment and engaged in long-term land development speculation [26]. Previous studies have confirmed the close relationship between the CEI, urban space, and the social economy. However, most studies tend to analyze specific sectors within the CEI or focus on the micro-level shaping of urban creative spaces. In contrast, our approach distinguishes itself from these studies by adopting a macro perspective. We focus on the pattern of CEI growth and expansion and consider its spatial effects, that is, the possible interaction of the CEI and urban areas.
The third type of literature is composed of studies that investigate the relationship between the CEI and urban development. The interaction between the two has been widely discussed [27]. Researchers generally agree that the CEI tends to be concentrated in central cities with developed economies, where financial and service centers also serve as cultural and creative hubs [28]. On the one hand, the well-developed infrastructure, transportation network, and open and inclusive creative environment provided by developed cities are conducive to the formation and development of the CEI. On the other hand, creative industries, including the CEI, promote urban development with their strong economic driving ability [15,29]. This mutually beneficial relationship between the CEI and urban development is particularly evident in metropolises, where a good urban environment plays a crucial role. However, unlike metropolises, small cities also have CEI interactions with urban development. Some researchers have sought to explore how cultural and creative industries have emerged from small, suburban, rural, and remote areas and are linked to a series of social, economic, and technological changes unique to these places [30,31,32]. For example, C. Gibson found that the CEI is also thriving in a number of smaller and remote cities in Australia, as these cities have successfully developed niche markets. These cities are integrated into the global economic network through niche markets, and in turn, the markets contribute to the development of the city [32]. These studies indicate that the CEI can interact with both large and small cities, and the mechanisms of these interactions are different. After learning from the experience of the world’s leading cities, some developing countries plan the urban layouts of their creative industries, including the CEI, in advance. In doing so, they attempt to promote urban and social development with their strong economic driving capacity. However, the layout of the CEI may be influenced by other factors, such as urban planning, which differs from the experience of the world’s leading cities. Therefore, considering the above situation, we comprehensively analyzed the interaction and mechanism of the CEI and urban development in developing countries.
In this study, we first analyzed the characteristics of spatial–temporal change from two aspects of external expansion and internal growth, selecting seven districts of Xi’an as the research area and using the expansion intensity index, equal-fan analysis, and coordination model. Then, we reveal the interaction mechanism between the CEI and urban development from 2000 to 2020. The purpose of this study is: (1) to identify the characteristics of the spatial and temporal change of the CEI and urban development; (2) to investigate whether consistency exists in the temporal and spatial development of the CEI and urban centers, and (3) to reveal the mechanism of the interaction between the CEI and urban development. This study’s findings provide theoretical references for the formulation of the layout and development patterns of the CEI. Moreover, it offers useful support for the scientific promotion of the coordinated development of the CEI and urban centers in Xi’an, China, and other developing regions and countries worldwide.

2. Materials and Methods

2.1. Research Area

Xi’an is the capital of Shaanxi Province. It is the largest center of science and technology, finance, and trade in northwest China. As an important transportation hub, Xi’an is the starting point of the development of the western region and “One Belt, One Road” in China. The historical and cultural heritage of Xi’an provides a solid foundation for the development of the creative industry and tourism. In 2020, the output value of Xi’an’s creative industry accounted for more than 12% of its GDP, becoming the city’s core source of competitiveness. The business revenue of the CEI in Xi’an increased from 60.18 million yuan in 2014 to 3034.99 million in 2020. People’s spending on culture and entertainment has been increasing annually. In 2020, Xi’an residents spent 2380 yuan per capita on culture and entertainment, accounting for 10.7% of their per capita living expenses. Xi’an is a typical single-center city. Since 2000, Xi’an has entered a period of rapid urbanization, establishing new state-level districts successively, and tending toward development into a multi-center city. The built-up area has expanded from 187 km2 in 2000 to 701 km2 in 2020.
In this study, the integrity of administrative units and the availability of statistical data were fully considered. Seven districts in Xi’an were selected, with 63 sub-district offices, covering an area of 1239.24 km2 and accounting for 11.53% of the total area of Xi’an (Figure 1). In 2020, the permanent resident population in the research area was 5,996,300, accounting for 46.08% of the total city population. The GDP of the research area was 796.293 billion yuan (79.47% of the city’s total). To reveal the characteristics of change and the mechanism of interaction of the CEI and urban development in Xi’an, this study discusses the spatial–temporal pattern of the CEI and urban development in the research area and the characteristics and mechanism of the spatial–temporal interaction of the two from the aspects of external expansion and internal growth at the level of the grid.

2.2. Data Sources and Processing

2.2.1. Data Sources

In this study, we selected data from 2000, 2010, and 2020. This is because the evolution of the CEI and urban development does not rapidly change in a short period of time. Therefore, data with a 10-year period can better reflect the long-term spatial evolution characteristics of the CEI and urban development. In addition, Xi’an has entered the stage of rapid urbanization since 2010. The speed of social and economic development is relatively fast. Therefore, taking 2010 as the segmentation point of the research period can better compare and analyze the characteristics of interaction between the CEI and urban development in the two periods.
(1)
Data on the CEI come from a list of point of interest (POI) data from 2000 to 2020 released by the official website of TianYanCha (https://www.tianyancha.com/). The POI attributes specifically include enterprise name, date of establishment, business status, address, and other information. Based on the available research results and the Classification of Culture and Related Industries (2018) released by the National Bureau of Statistics of China, the POIs of the CEI were divided into eight industry types: bars, cafés, cinemas, dance halls, tea bars, fitness centers, Internet cafés, and parks. The POIs were screened, cleaned, and classified. Finally, 4323 POIs were obtained.
(2)
Data on urban development come from the nighttime light data released by the National Centers for Environmental Information (https://www.ngdc.noaa.gov/) and the Colorado School of Mines’ academic department website (https://payneinstitute.mines.edu/eog/), including Defense Meteorological Satellite Program-Operational LinescanSystem (DMSP-OLS) data for 2000 and 2010 and National Polar-Orbiting Partnership—Visible Infrared Imaging Radiometer Suite (NPP-VIIRS) data for 2020. In this study, the stable light image composite of the nighttime light data was selected. The stable light image composite was created by further cleaning up the ephemeral light sources such as wildfires, lightning, and fishing boats. The pixel value of the stable light image composite represents the average of all light intensity values observed on cloud-free days in a calendar year from temporally stable sources such as cities, towns, villages, industrial sites, and persistent gas flares. The pixel value has 6-bit radiometric quantification levels, ranging from 0 to 63 [33]. Areas without cloud-free observations in a calendar year are indicated by the value of 255. The grid cell size of these image composites is 30 arc second (approximately 1 km), oversampled from the original DMSP-OLS smooth mode observations at a spatial resolution of 2.7 km [34].

2.2.2. Data Processing

Nighttime light and urban built-up areas are highly correlated [35]. Therefore, this study used nighttime light data to extract the built-up areas in 2000, 2010, and 2020. In addition, it analyzed the external morphological evolution characteristics of Xi’an’s urban expansion. The DMSP-OLS nighttime light data collected by the same sensor in different years were not comparable with each other due to a lack of calibration [36,37]. Therefore, the nighttime light data needed to be processed.
This study processed the data with reference to Wei’s method using Pseudo Invariant Features (PIFs) [38]. The theoretical assumption of this method is the irreversibility of urbanization. In general, once an area changed from rural to urban, it would remain urban [39]. For mature built-up areas, the intensity of nighttime light from them would not vary too much over time. Such areas are denoted as PIFs. Therefore, we can calculate the correction term of the nighttime light value between different years using PIFs. The nighttime light data of different years were normalized by using the correction term to achieve time comparability. Wei et al. adopted the geometric mean method to evaluate the spatial accuracy of their study’s results and proved that the spatial accuracy was higher than that of similar studies [38]. Xie and Weng used the Kappa index and geometric mean to evaluate the accuracy of an urban area calculated using the Pseudo Invariant Feature method and also proved the validity of the results [40].
In our study, the year 2000 was chosen as the reference year. This is because in a short period of time, the area of urbanization usually becomes larger over time and is irreversible. Therefore, mature built-up areas in the earliest years of the study period can be regarded as PIFs. By comparing the remote sensing images of seven districts in Xi’an and the statistics of the built-up area, the threshold values of nighttime light data in 2000 were determined to be 54. The threshold values of nighttime light data in 2010 and 2020 calculated by using PIFs were 62 and 21, respectively. The areas with nighttime light values larger than the threshold values were considered built-up. By comparing the statistics, built-up area errors extracted by this method in 2000, 2010, and 2020 were 3.56%, 1.44%, and 1.10%, respectively.

2.3. Research Methods

2.3.1. Equal-Fan Analysis Method

Equal-fan analysis is an effective method to study the characteristics of urban development in different directions [41]. The equal-fan analysis method takes a specified point as the center of the circle and selects an appropriate radius to divide the research area into several equal sectors [42]. In this study, due to the shape of the research area being relatively regular, the geometric center of the research area was used as the circle’s center. An appropriate radius was chosen so that the circle covered the whole research area. Due to the dense distribution of township-level administrative regions in Xi’an, the fine division of the research area was conducive to the analysis of the evolution direction and characteristics of objects. Therefore, referring to previous studies [41,43], the research area was divided into 16 equal-angle sectors. Then, the expansion of the CEI and urban built-up areas in each sector at different times was counted.

2.3.2. Expansion Intensity Index

Comparing and analyzing the variations in urban expansion speed in different spatial directions is the most common method used to describe their differing growth. To be comparable, the spatial differentiation of urban expansion is expressed by calculating the expansion intensity index (EII) in different directions.
The EII is the ratio of the expanded area of the urban built-up area to the total area in a certain period of time. It is used to characterize the expansion of urban built-up areas in different periods [44]. Similarly, the EII of the CEI is the ratio of the increased to total POIs in a certain period of time. It characterizes the expansion of the CEI’s development at different time periods. In this study, the measured EII of the CEI and urban development were plotted on the radar map of expansion direction, and a comparative analysis was conducted. The calculation formula is as follows:
E I I u = Δ S Z × Δ t × 100 ,
E I I c = Δ P Q × Δ t × 100 ,
where EIIu denotes the expansion of urban development; EIIc denotes the expansion of the CEI; Z denotes the total area of the research area; Q denotes the total number of POIs for the CEI in the research area in 2020; ΔS denotes the expanded area of the urban built-up area during that time period; ΔP denotes the increased POIs during the time period; and Δt denotes the time span of the period.

2.3.3. Coordination Model

The coordination model can reflect the extent of coordination between the evolution of the two variables. Therefore, the model can be used to reveal the interaction between the CEI and urban development. In this study, the research area is divided into 1364 1 km × 1 km grids. The coordination coefficient between the night light value and the density of the CEI in each grid was calculated by using the coordination model. Excluding the grids without data, 464 grids of different coordination types were obtained. The formula of the coordination model is:
O = ( C R + U R ) / 2 C R 2 + U R 2 ,
where O denotes the coordination coefficient and CR and UR denote the annual growth rates of the POIs and nighttime lighting values, respectively; the closer O is to 1, the higher the coordination between the two, and the closer O is to 0, the lower the coordination between the two. With reference to existing studies, the coordination between the CEI and urban development is divided into different types according to the calculation results of O (Table 1).

3. Results

3.1. Interaction between CEI Expansion and Urban Expansion

3.1.1. Characteristics of CEI Expansion and Urban Expansion

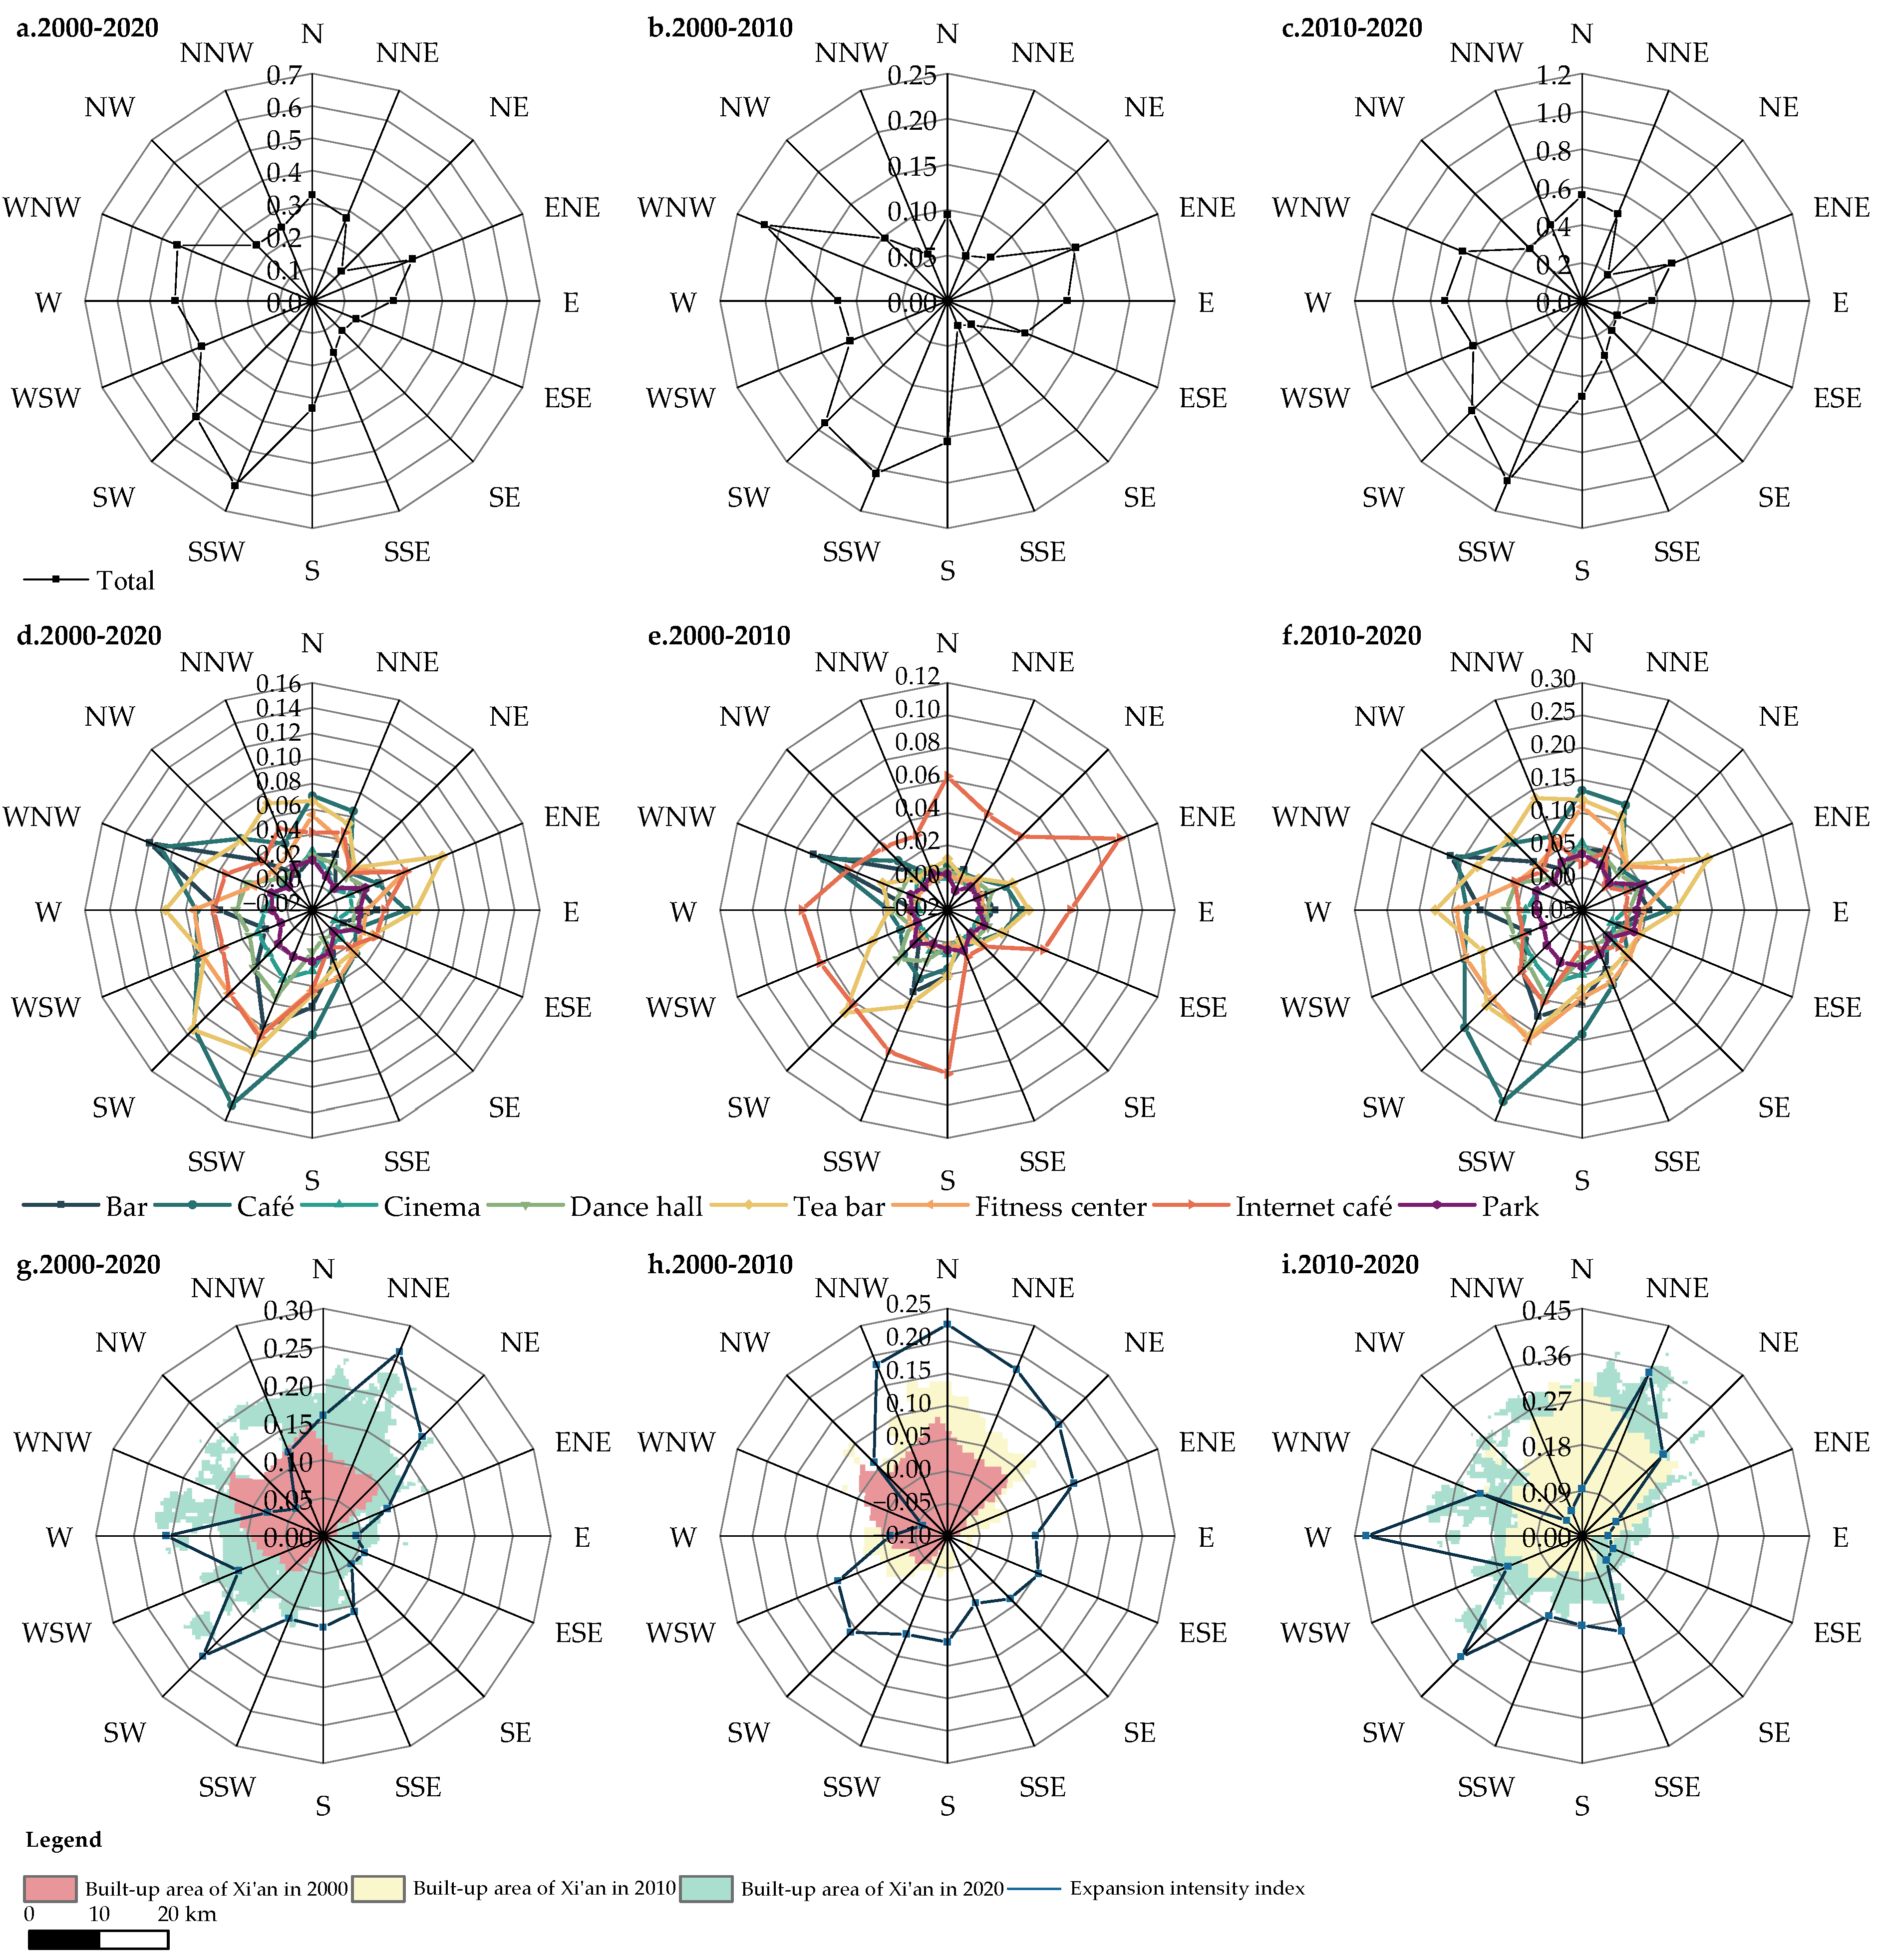
Concerning the expansion of the CEI, the CEI mainly grew in the direction of west-southwest. The expansion’s extent varied in different directions. From 2000 to 2020, the CEI generally expanded to the southwest, west, and east, especially to the SSW and SW. In contrast, the CEI barely expanded in the NE and SE directions (Figure 2a). This indicated that the development of Xi’an’s CEI is not balanced, as the cultural and entertainment center may be moving to the southwest and west of Xi’an. Specifically, from 2000 to 2010, the CEI primarily expanded toward the WNW and SSW. However, according to the EIIc in most other directions, growth was less than 0.1, especially towards the SSE and SE (Figure 2b). This may be because the social and economic environment in the northwest and southwest of Xi’an was conducive to the development of the CEI. From 2010 to 2020, SSW was still the main direction of CEI expansion. In contrast, CEI expansion toward the WNW and ENE was no longer significant. The CEI was still barely expanding in the NE and ESE (Figure 2c). This indicates that the factors affecting CEI expansion may have changed. Moreover, the direction of CEI expansion during this period was basically the same as that from 2000 to 2020, mainly towards SSW and SW. Meanwhile, the EIIc from 2010 to 2020 was higher than that from 2000 to 2020. The lines of equivalent value of EIIc were more compact, and the values changed faster. This may indicate that 2010–2020 was a period of rapid development of the CEI in Xi’an. It established the main CEI development direction to some extent.
The EIIc of different types in different periods varied significantly, and the types with greater EIIc values had stronger spatial directionality. As a whole, the EIIc values of parks, cinemas, dance halls, and Internet cafés from 2000 to 2020 were small. Specifically, the EIIc values of parks, cinemas, and fitness centers from 2000 to 2010 were small, and the expansion had no obvious directionality (Table 2, Figure 2e). This may be due to the fact that parks and cinemas are generally invested in by public institutions and state-owned enterprises. They are characterized by large-scale, wide-ranging services, so they are relatively few in number. In addition, residents’ health awareness is relatively weak, and there are relatively few occupational diseases and little obesity, so the demand for fitness centers is small. In the SE and ESE directions, the development of the Qujiang District and the emergence and agglomeration of a large number of high-end businesses made the land price high, which was not suitable for the survival and development of Internet cafés. In contrast, dance halls and tea bars expanded in the SW direction, with tea bars expanding in a more pronounced manner, primarily in the Xiaozhai and Dianzicheng districts. Bars and cafés expanded in the NW direction, mainly on the “Bar” and “Coffee and Leisure” streets on Defu Lane of the Nanyuanmen District. The expansion of bars was most obvious, excluding the SE and SSE directions. The expansion of these types of CEIs may be influenced by agglomeration effects, as characteristic communities have been formed. From 2010 to 2020, no directionality was evident for the expansion of parks and cinemas. This may be due to the large service radius of the park and cinema and the relatively long construction period of the park. However, it is worth noting that compared to the previous period, the park had expanded towards the ENE. This may be because the eastern part of Xi’an is in the Chanba Ecological Area, and its construction environment is more conducive to the layout of the parks. The situation is much the same for cafés. Cafés have expanded significantly in the direction of the SSW, which may be due to the demand generated by the large number of expatriate employees in the area. The EIIc of Internet cafés decreased significantly (Table 2, Figure 2f), which was mainly influenced by government regulation and reduced demand. In 2007, in order to prevent the impact of virtual currencies on the real economic and financial order, fourteen ministries and commissions of the Chinese government jointly issued the Notice on Further Strengthening the Management of Internet Cafés and Online Games. In accordance with the notice, the Chinese government implemented strict regulations that effectively prevented the establishment of new Internet cafés and placed a cap on the total number of existing ones. To sum up, the main types of CEI expansion have changed from a combination of Internet cafés, dance halls, tea bars, and bars to a combination of cafés, tea bars, fitness centers, and bars. The CEI may be more likely to be distributed in areas that match its function. The ability of Internet cafés to promote the development of the CEI has been significantly weakened. Meanwhile, the fitness center has become one of the most important business units of CEI development.
Concerning urban expansion, the built-up area of Xi’an primarily expanded in the NE–SW line. The expansion direction of the built-up area varied significantly in different periods. From 2000 to 2020, the built-up area mainly expanded in the directions of the NNE, SW, W, and NE (Figure 2g), with EIIu values of 0.26%, 0.22%, 0.21%, and 0.18%, respectively. This may be due to the establishment of the Xi’an International Trade & Logistics Park and the Xi’an Hi-tech Industries Development Zone. In the directions of the E, NW, SE and ESE, the expansion of the built-up area was minimal. In the E, SE, and ESE directions, this can be attributed to developed agriculture and township enterprises that have agglomerated in the Dizhai, Hongqi, and Dazhao Township streets and the large number of laid-off workers and migrant workers gathered in Fangzhicheng Street and Dengjiapo Street connecting the area to the city center, with relatively low per capita income level and quality of living environment, which were not conducive to the expansion of built-up areas. Additionally, in the NW direction, the abundance of ancient sites meant that the urban expansion was limited by site protection, so the built-up area in this direction did not expand significantly.
Specifically, Xi’an’s built-up area primarily expanded in the N, NNW, NNE, and NE directions from 2000 to 2010, with EIIu values of 0.23%, 0.19%, 0.18%, and 0.14%, respectively (Figure 2h), which were mainly due to the development of the Xi’an Economic & Technological Development Zone in this direction. During this period, the Xi’an Economic & Technological Development Zone was upgraded to an international development zone. A series of measures, such as preferential policies and infrastructure construction, introduced by the government, greatly increased the built-up area of the zone.
From 2010 to 2020, the built-up area mainly expanded toward the W, NNE, SW, and NE (Figure 2i), with EIIu values of 0.43%, 0.35%, 0.34%, and 0.23%, respectively. The built-up area expanded in the NE direction to the Xi’an International Trade & Logistics Park and in the SW direction to the Xixian New Area and the Xi’an Hi-tech Industries Development Zone. During this period, the promulgation and implementation of a series of policies was an important factor in the expansion of built-up areas. In 2010, the planning of the Xi’an International Trade & Logistics Park was approved by the National Development and Reform Commission. Relying on the China–Europe freight train, the inland port model was established, enterprises were introduced, and the Olympic sports center and conference center were built. In 2011, the master plan of the Xixian New Area was officially approved in order to break the pattern of a single center city in the west of China, trying to build the new district into the new center of Xi’an. In 2012, the first foreign investment project of 10 billion CNY, the Korea Samsung Electronics memory chip project, settled in the Xi’an Hi-tech Industries Development Zone. The arrival of leading enterprises prompted the rapid development of the semiconductor industry chain and led to the settlement of world top 500 enterprises; therefore, the Xi’an Hi-tech Industries Development Zone was able to develop rapidly.

3.1.2. Synchronization of CEI Expansion and Urban Expansion

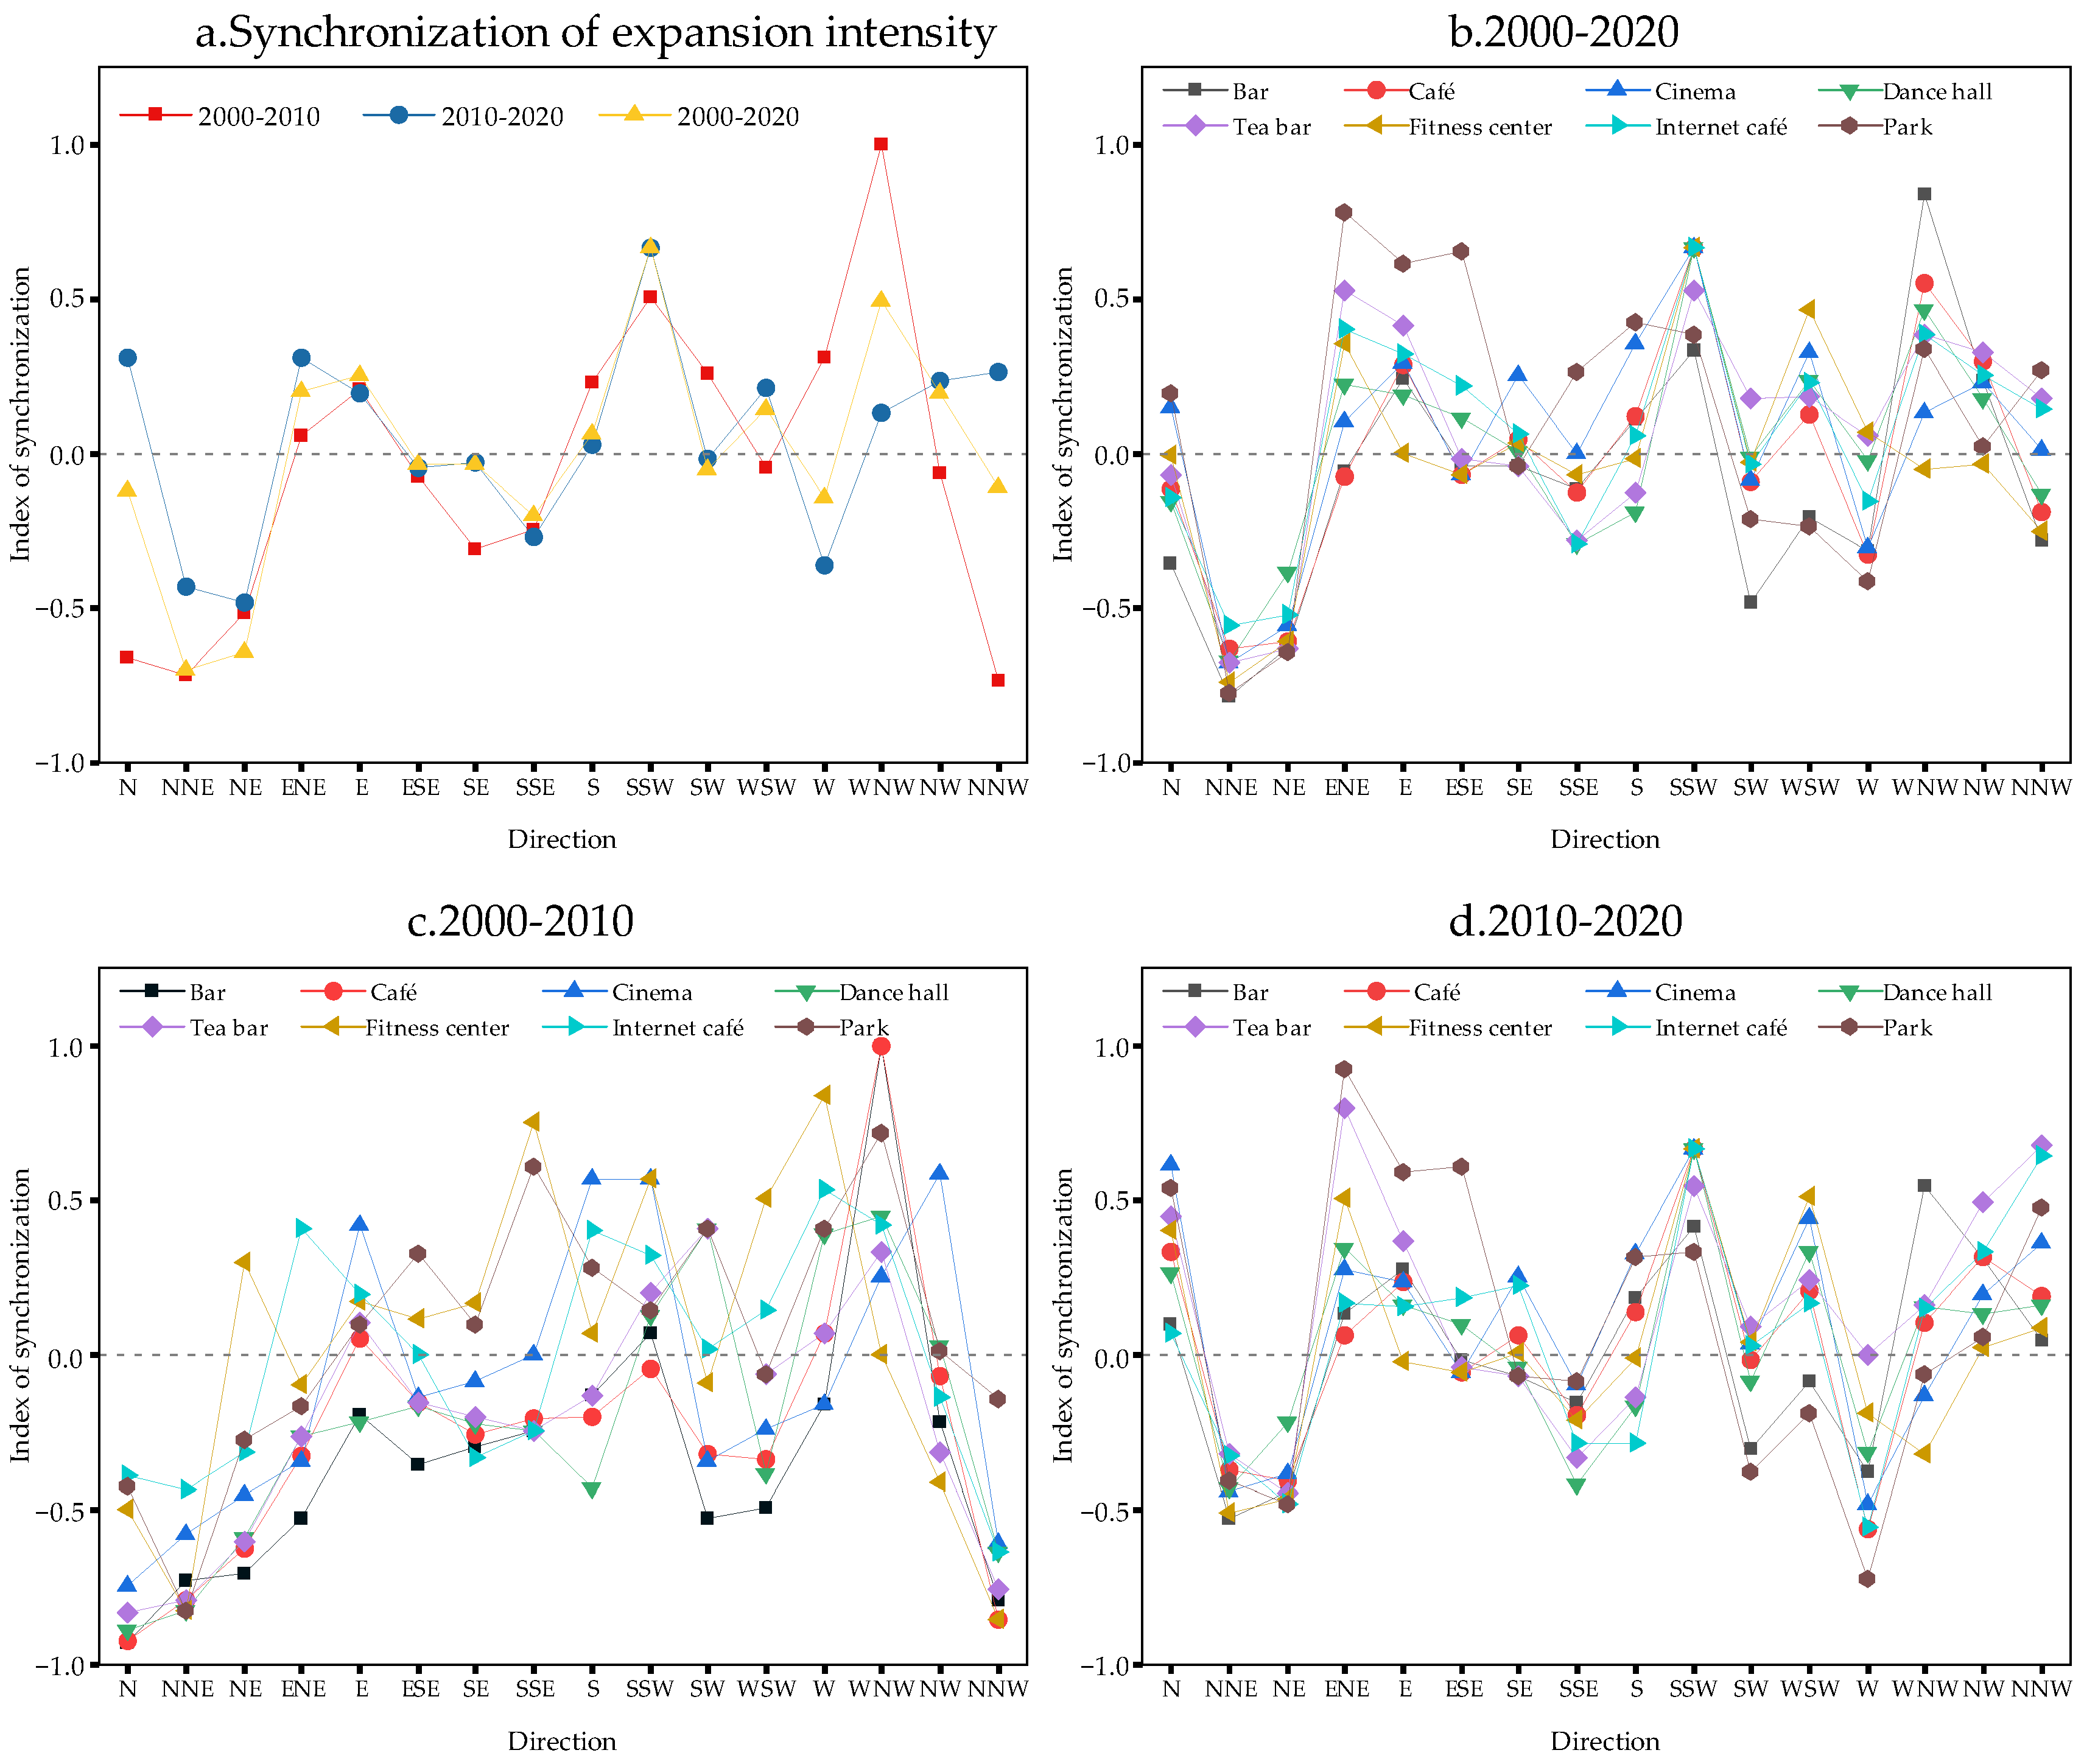
Calculate the result of the standardized EIIc minus the standardized EIIu to measure the synchronization of the CEI and urban expansion. The closer the result is to 0, the more synchronized the CEI is with urban expansion. A result larger than 0 indicates that the expansion speed of the CEI is faster than that of urban development. The result is less than 0, indicating that the urban expansion speed is faster than that of the CEI. The radar plot was stretched in all directions relative to the horizontal axis to compare and analyze the synchronization of the expansion of the CEI and urban development (Figure 3).
Overall, the expansion intensity of the CEI and urban development were poorly synchronized. The values are distributed on both sides of the zero-scale line (Figure 3a), indicating that the mechanism of interaction between the CEI and urban development is different in different directions. From 2000 to 2010, only the results for the ESE, WSW, NW, and ENE directions were close to 0, and absolute values were less than 0.1. These values indicate that the expansion speeds of the CEI and urban development in these four directions are relatively close. The CEI may basically match the local cultural and entertainment needs. However, in these four directions, the speeds of CEI expansion and the urban expansion are both relatively slow, indicating that the local social and economic environment may limit the generation of residents’ cultural and entertainment demands. New cultural and entertainment demands need to be created to enhance the vitality of the area. The EIIu values were relatively large in directions of the SE, SSE, NNW, NNE, N, and NE, indicating that urban expansion is proceeding relatively faster than CEI expansion in these directions. This may be attributed to two situations. One is the policy-driven rapid expansion of urban built-up areas, which is manifested in the establishment of new districts in the northeast of the city. The other is that in economically underdeveloped areas, the material needs of residents should be met first, and then cultural and entertainment needs can be generated, which is reflected in the lagging development of the CEI in the southeastern suburbs of the city. Furthermore, the EIIc values were relatively large in directions of the W, WNW, SW, SSW, S, and E, indicating that CEI expansion is proceeding relatively faster than urban expansion in these directions. From 2010 to 2020, only the results of the ESE, SE, S, and SW directions were close to 0, and the absolute values were less than 0.1. This indicates that the expansion rates of the CEI and urban development in the southern half of the study area were more synchronized. In contrast, the synchronization of the two in the remaining directions was poor. The calculated results of the NNE, NE, SSE, and W directions were less than 0, indicating that the speed of urban expansion was relatively fast. In the remaining directions, the calculated results were greater than 0, indicating that the social and economic environment was relatively sound, and the CEI had begun to develop rapidly. Combining the two time periods, the calculated results in the NE, E, ESE, and SSE were similar in the two periods, indicating that the simultaneous expansion of the CEI and urban expansion does not mean that the local social economy is more developed. In our study, these areas may have limited CEIs and urban expansion due to poor socioeconomic environments, resulting in lower quality synchronicity between the two. Moreover, in the second half of the study period, the CEI expanded faster in more directions, indicating that the construction of mature built-up areas was conducive to the development of the CEI.
Concerning the consistency between CEI types and urban expansion in different time periods, from 2000 to 2020, CEI expansion was mainly driven by parks, fitness centers, and tea bars. Moreover, the CEI expanded faster than urban development (Figure 3b). The same types of CEIs developed at varying speeds in different directions. Specifically, from 2000 to 2010, CEI expansion was primarily driven by Internet cafés, parks, cinemas, and fitness centers. Moreover, its speed was faster than urban expansion, except toward the N, NNE, and NNW. In the same direction, CEI types expanded at different speeds. Most CEI types expanded at a slower speed than urban development (Figure 3c). From 2010 to 2020, CEI expansion was mainly driven by cinemas, parks, and tea bars and was faster than that of urban development. Compared with the situation from 2000 to 2010, relatively few differences were found in the expansion speed of CEI types in the same direction. The above situation shows that in the process of urban development, giving priority to the layout of parks and cinemas may quickly shape the cultural and entertainment space, so as to promote urban development. Furthermore, the influence of Internet cafés in shaping the cultural and entertainment space has significantly declined. In the future, more fitness centers may be needed to enhance the cultural and entertainment landscape.
Overall, the expansion speeds of most CEI types were faster than those of urban development (Figure 3d). Parks and cinemas have been the primary types driving CEI expansion. In the process of urban development, giving priority to the layout of parks and cinemas may quickly shape the cultural and entertainment space, so as to promote urban development. Internet cafés played a strong driving role in the early stage of CEI expansion, even in the directions where their speed was slower than urban development. In the late stages of CEI expansion, although the expansion speed of Internet cafés was faster than that of urban development in most directions, it was gradually surpassed by other CEI types. The influence of Internet cafés in shaping the cultural and entertainment space has significantly declined. In the future, more tea bars may be needed to enhance the cultural and entertainment landscape.

3.2. Interaction between CEI Growth and Urban Growth

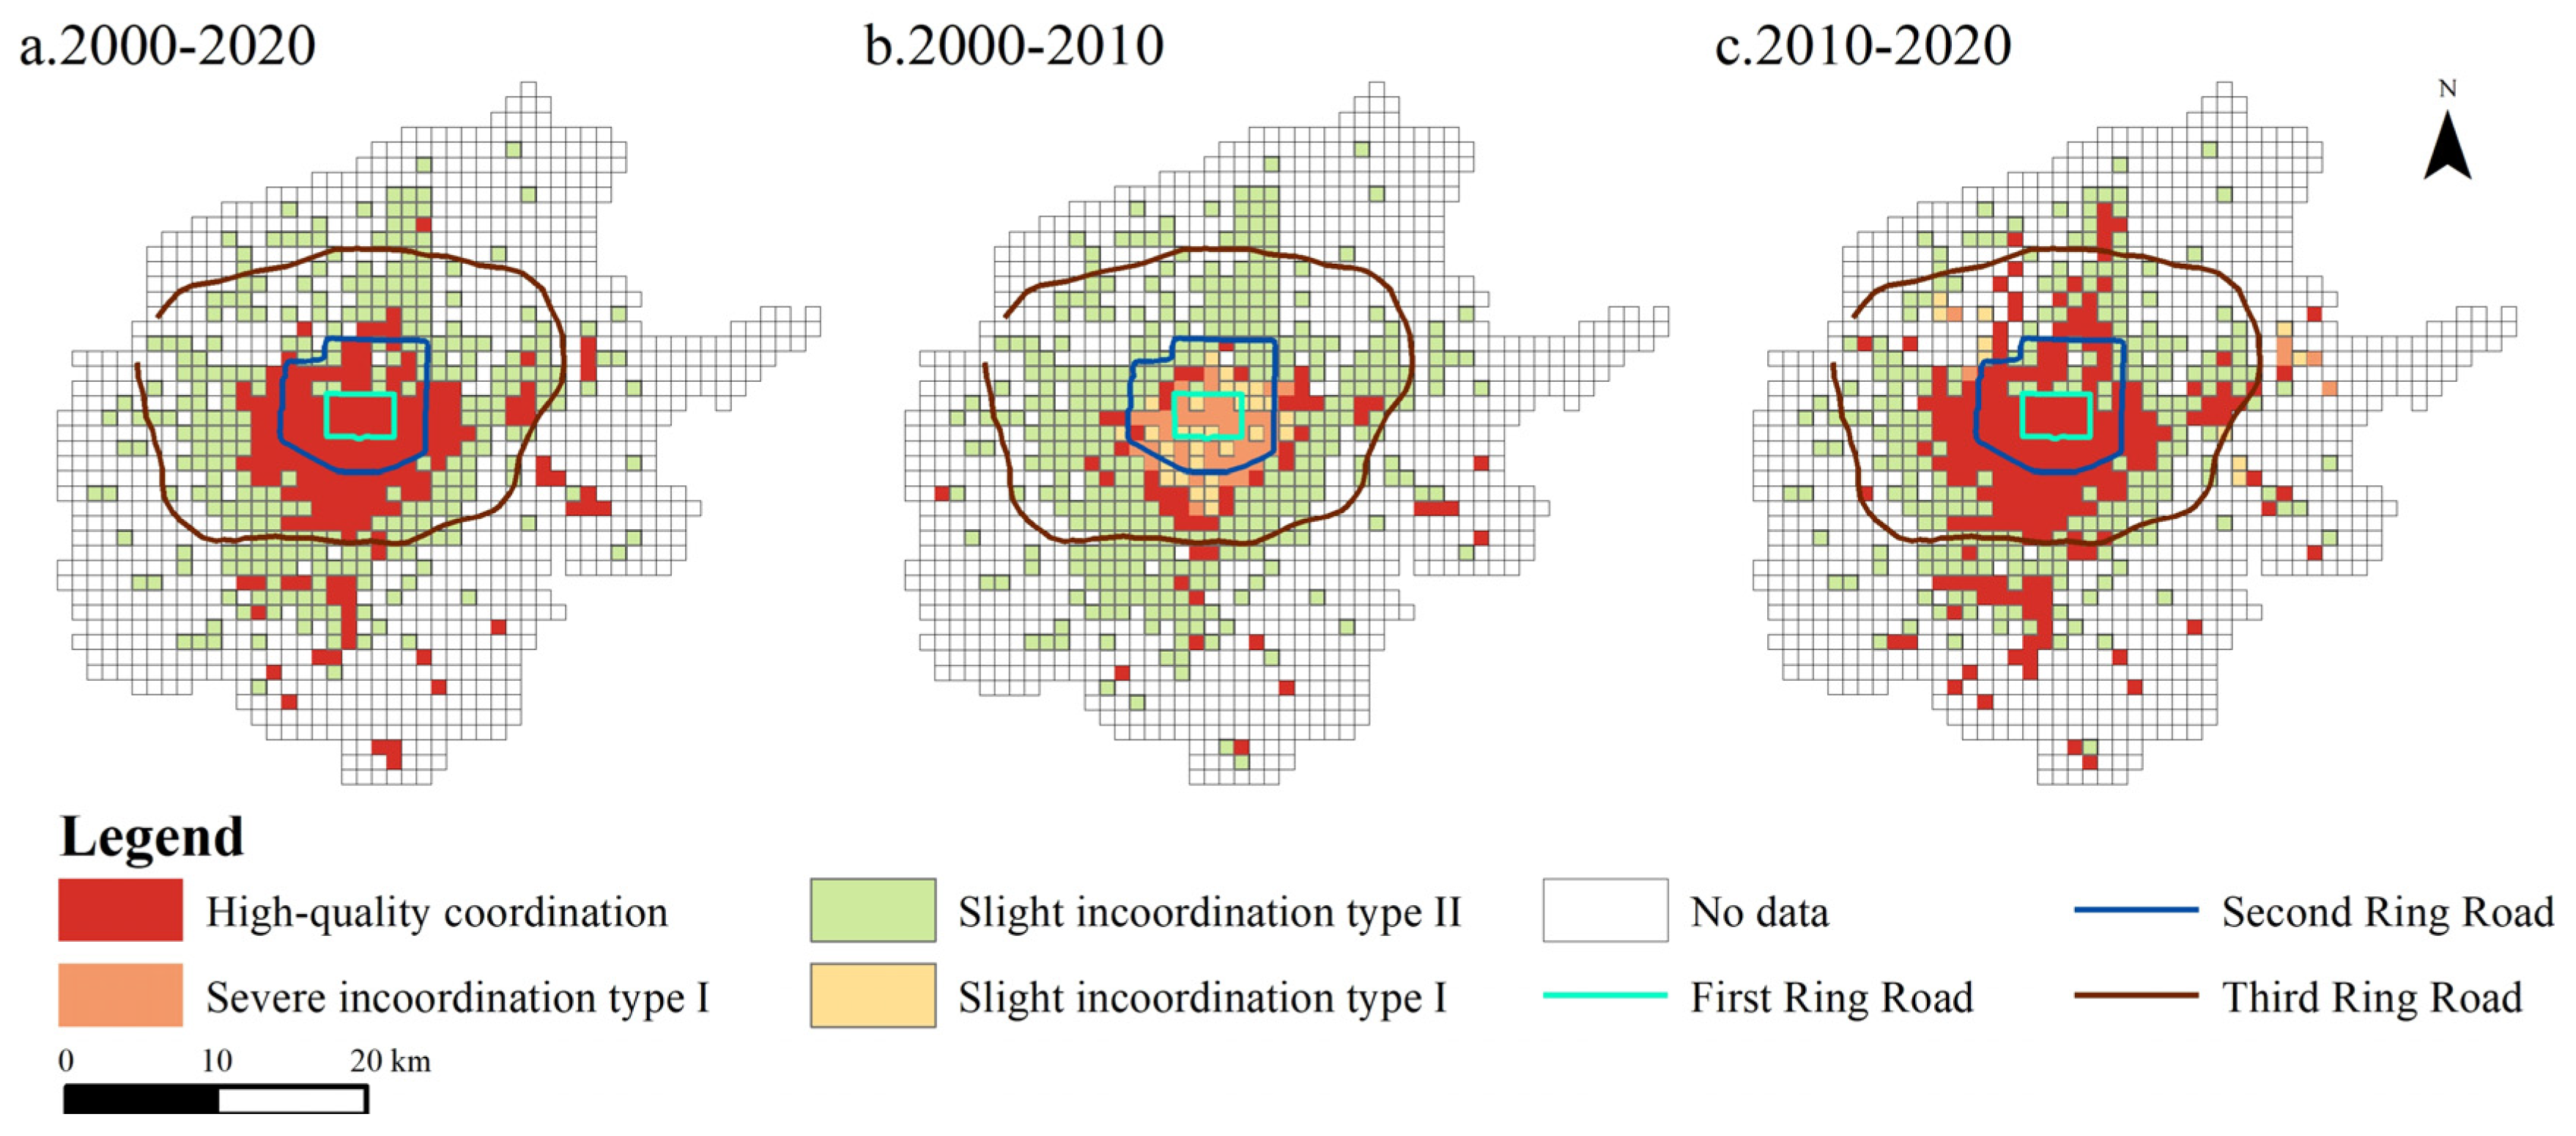
In general, CEI and urban growth show a coordinated or slightly uncoordinated state. The closer to the city center, the stronger the coordination between the two; the CEI in areas far from the city center grew slowly and its development lagged. From 2000 to 2020, the CEI and urban growth in Xi’an in some areas displayed High-quality coordination, and Slight incoordination Type Ⅱ and Slight incoordination Type Ⅱ accounted for 62.07% of the total number of grids. The High-quality coordination grids were concentrated within the second ring road of Xi’an. They extended to the third ring road to the south. Meanwhile, the Slight incoordination Type Ⅱ grids were concentrated at the periphery of the High-quality coordination grids (Figure 4a). This pattern shows that the CEI and urban growth have reached a desirable synergistic state within the city center. However, the CEI still needs further growth in peripheral areas.
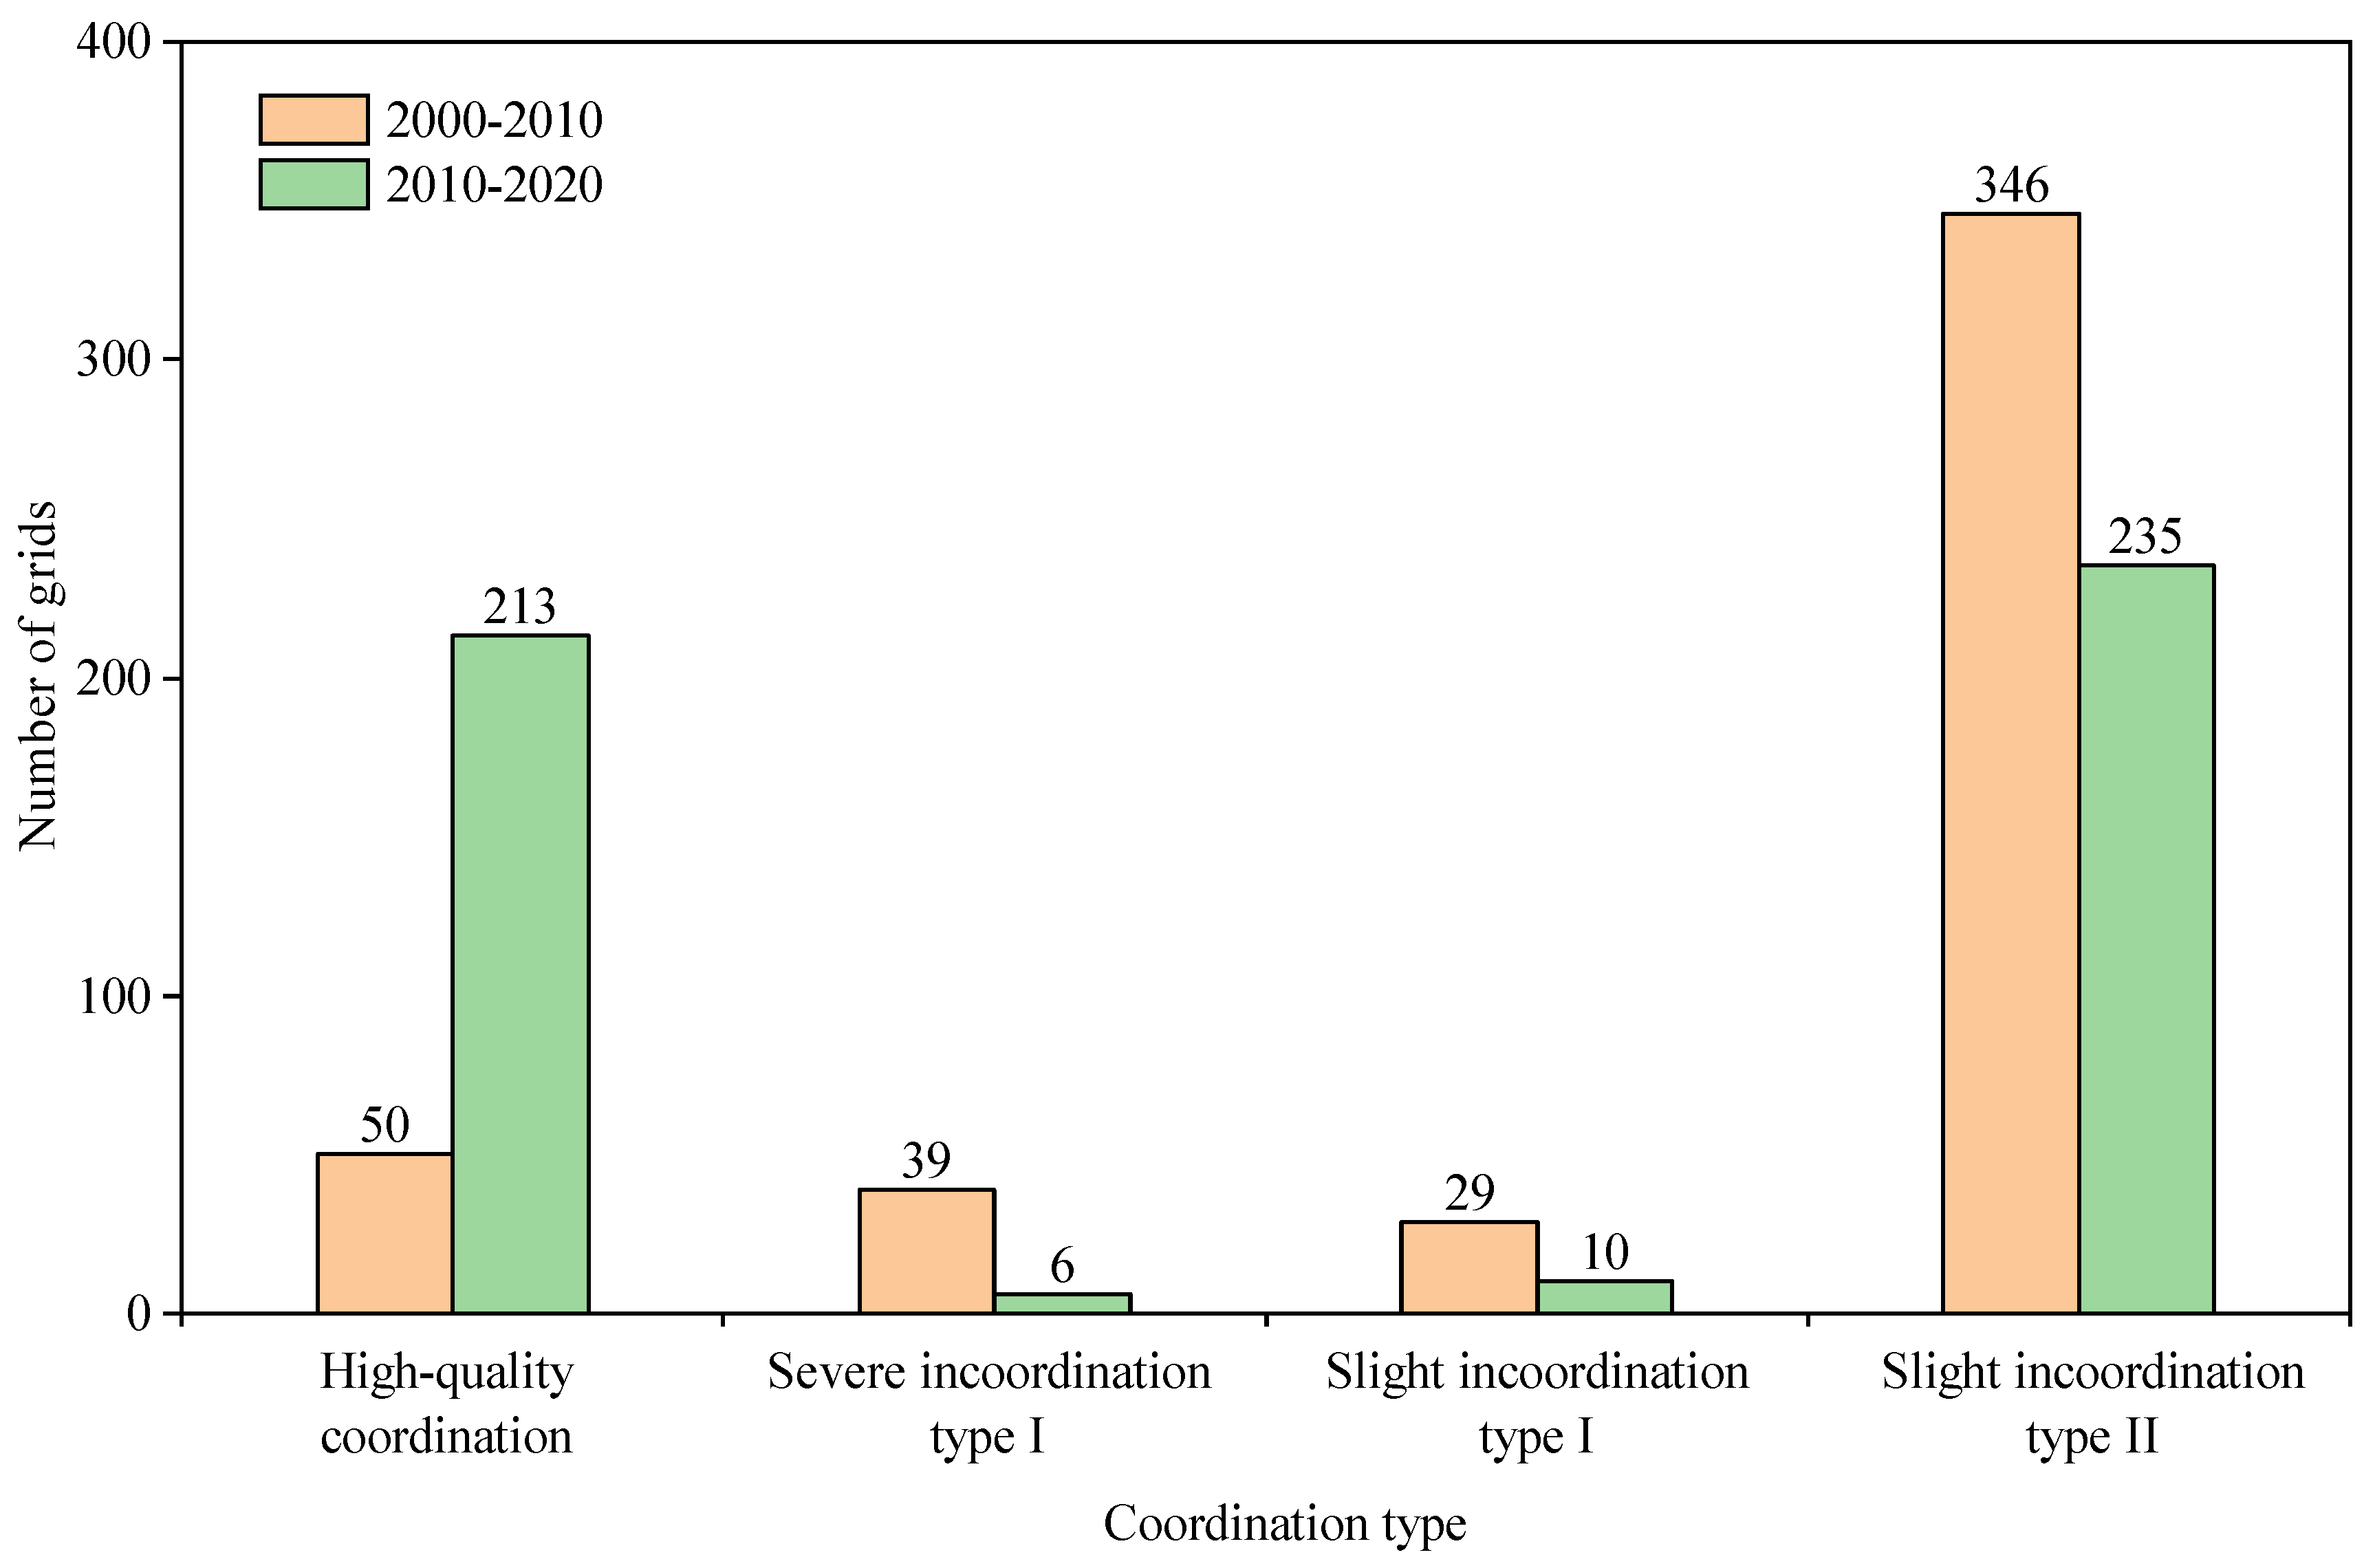
Specifically, from 2000 to 2010, the coordination type of the CEI and urban growth in Xi’an was mainly Slight incoordination Type Ⅱ. No Severe incoordination Type Ⅱ or Low-quality coordination were found (Figure 5). CEI growth showed slight incoordination with urban growth. Room for further growth of the CEI remains. The Type I classes of Severe incoordination and Slight incoordination were predominant within the second ring road of Xi’an, indicating that the CEI was developing rapidly in the city center and its growth speed was ahead of the urban growth. As the distance from the city center increased, High-quality coordination and Slight incoordination Type Ⅱ were distributed (Figure 4b), indicating that in the city’s periphery, the farther away from the city center, the CEI developed more slowly or even slower than the urban growth. From 2010 to 2020, the internal coordination relationship was dominated by High-quality coordination and Slight incoordination Type Ⅱ, indicating that the CEI and the urban growth were in a coordinated or slightly uncoordinated state (Figure 5). High-quality coordination was concentrated in the downtown area and extended in the south–north direction. In contrast, Slight incoordination Type Ⅱ was concentrated in the downtown area’s periphery (Figure 4c), indicating that the CEI growth in the downtown area was faster than urban growth. However, as the distance from the downtown area increased, the CEI’s growth tended to slow down and then lag behind the speed of urban development.
Comparing the coordinated relationship between the growth of the CEI and urban growth in different periods, it was found that with the growth of the CEI and urban growth, the downtown area underwent a transformation process from Severe/Slight incoordination Type I to High-quality coordination, while the peripheral area of the city underwent a transformation process from Slight incoordination Type Ⅱ to High-quality coordination. The above results show that in the first decade, the mature social and economic environment of the city center was conducive to the development of the CEI, and the development of the CEI drove the development of the city in the latter decade. Meanwhile, in peripheral areas of the city, the development of the CEI still needs to be driven by urban development. However, in general, CEI and urban development in most areas of Xi’an tend to be coordinated. In addition, the distribution of the coordination types of the CEI and urban growth from 2010 to 2020 resembled 2000 to 2020. This result suggests that CEI and urban development have entered a period of rapid growth from 2010 to 2020, basically establishing their overall growth pattern from 2000 to 2020.
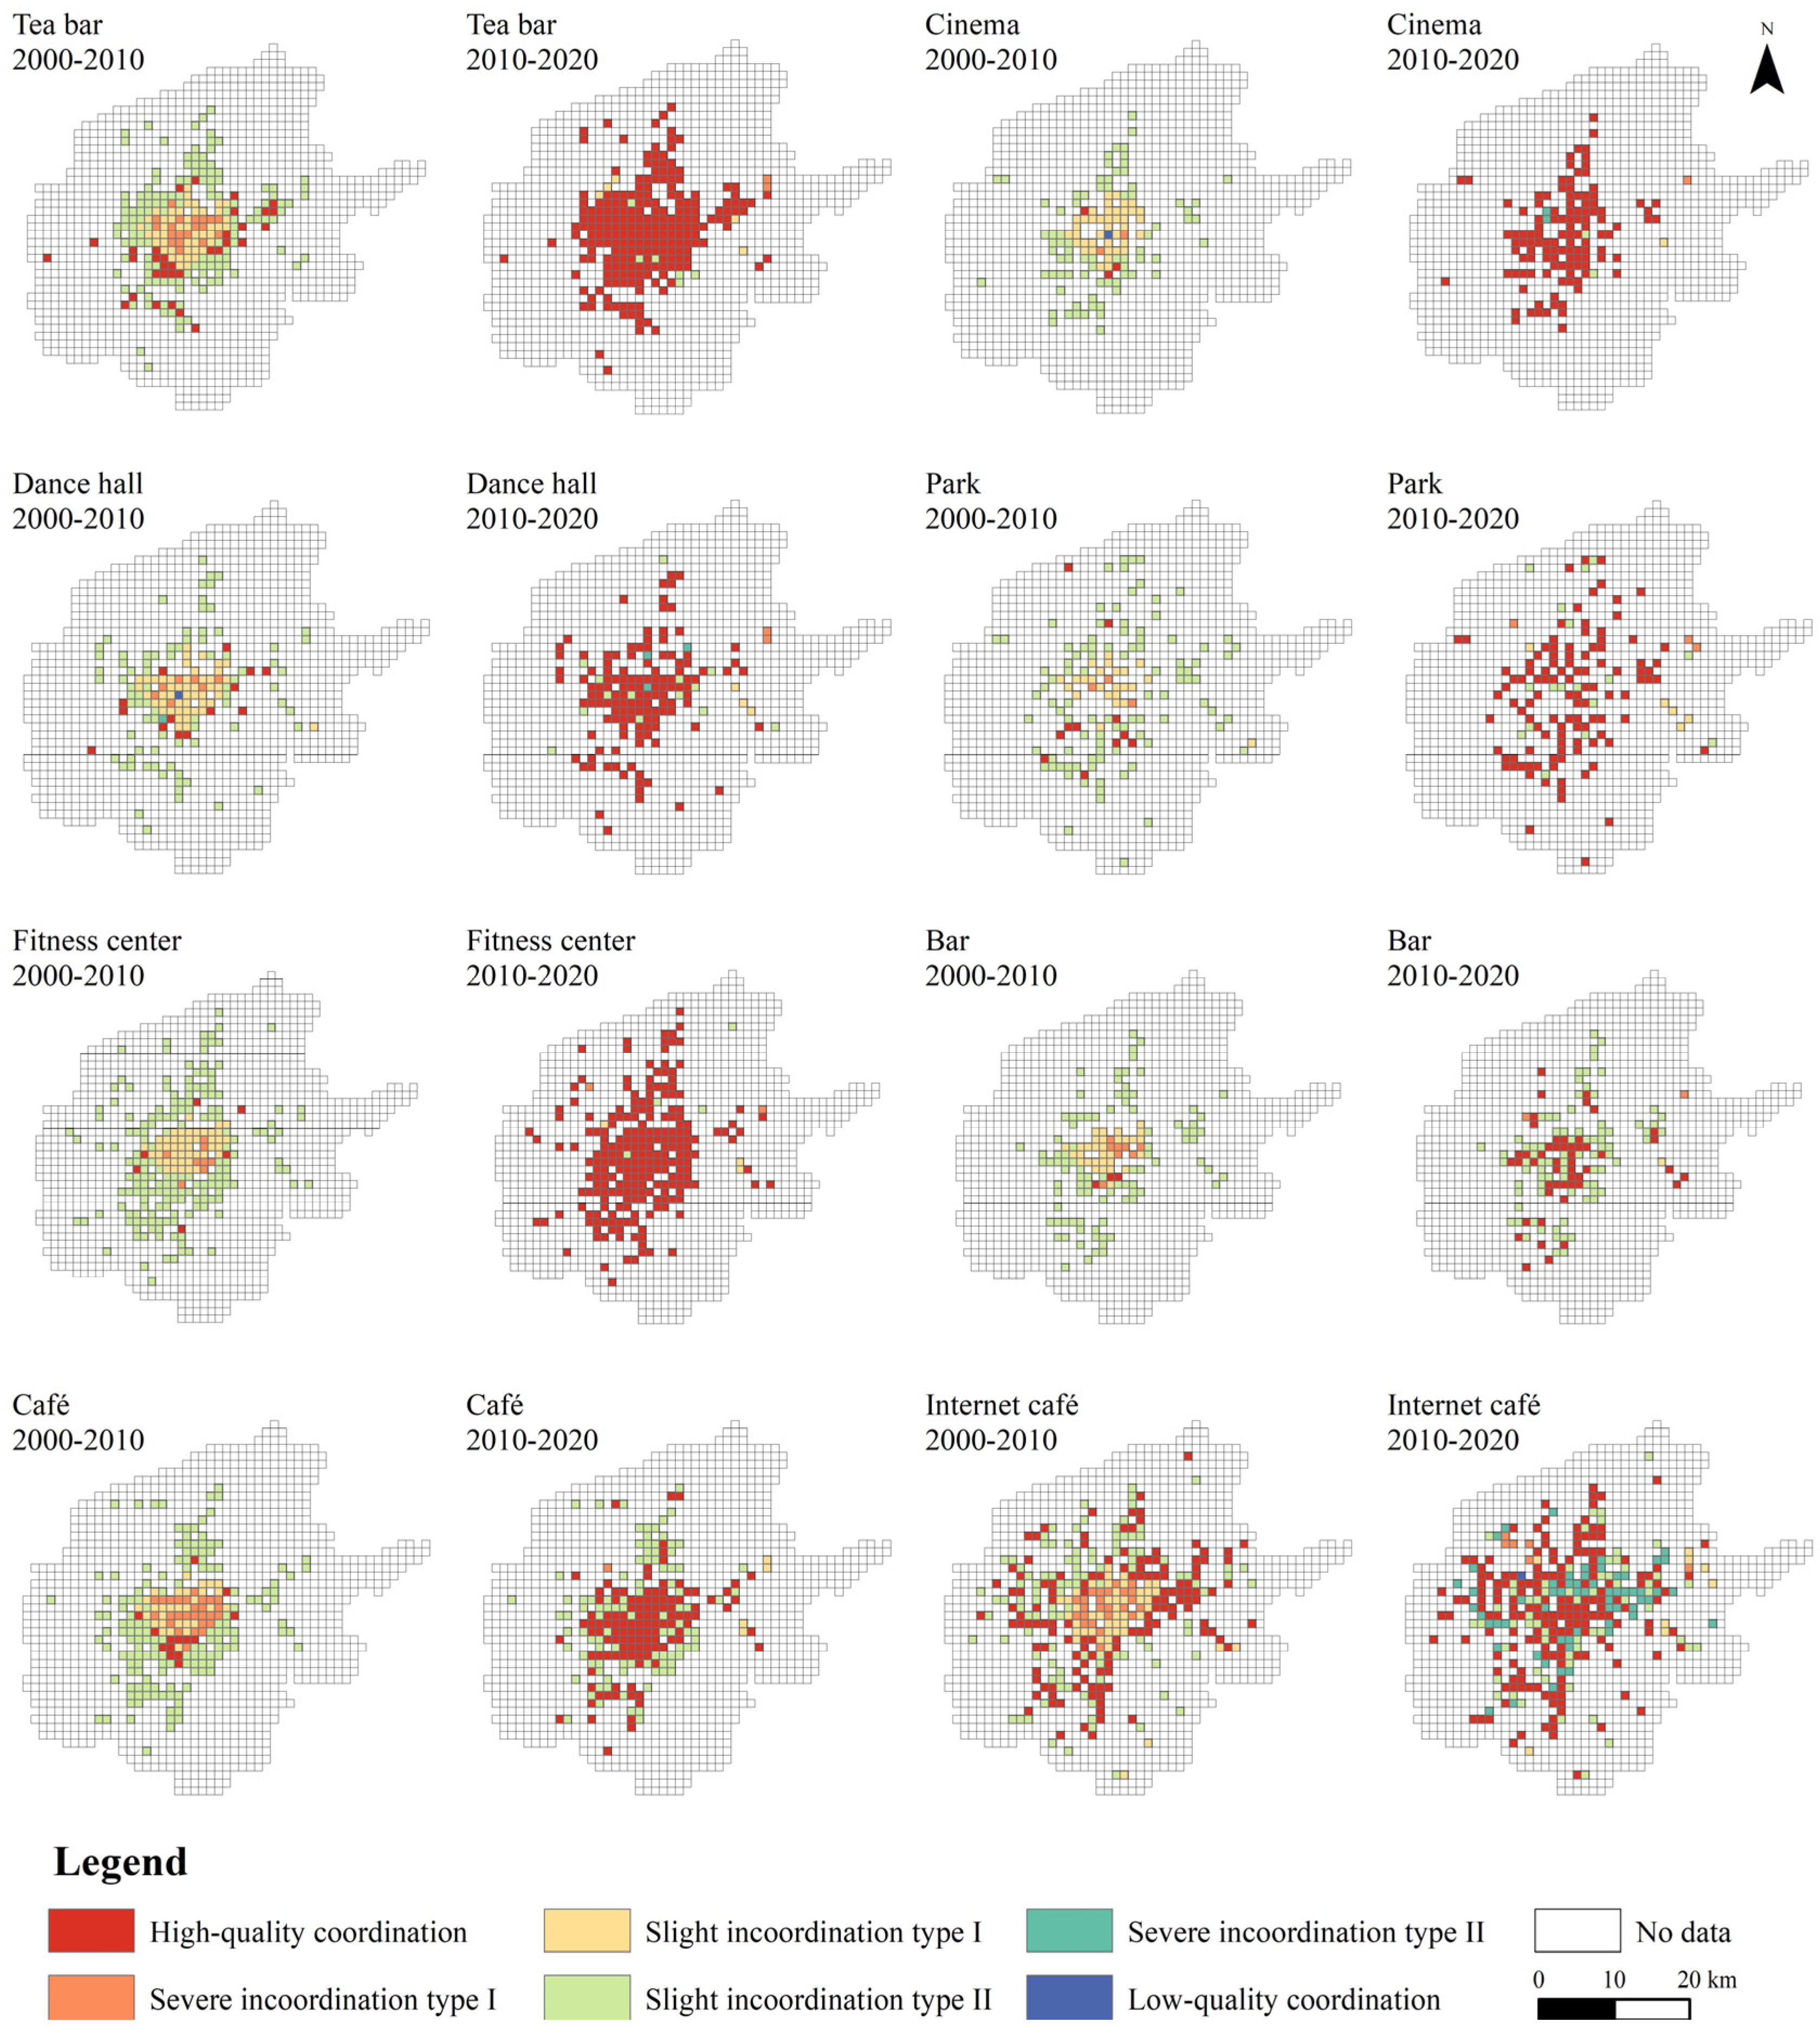
Further analysis was performed on the coordination between the growth of CEI types and urban development (Figure 6). In general, excluding Internet cafés, which have produced a decline, the development of the remaining industry types was coordinated with urban growth. Specifically, from 2000 to 2010, the closer to the city center, the more rapid the growth of CEI types and the stronger the driving effect. For tea bars, cafés, and Internet cafés, these effects were relatively strong.
Excluding Internet cafés, each industry type was dominated by the Slight incoordination Type Ⅱ in the peripheral areas of the city, indicating that the growth of these industries in the region was slower than urban development. Compared with other industry types, Internet cafés were more dispersed and more flexible in terms of location. Thus, their development was less constrained by the distance from the city center. In the peripheral areas of the city, the growth rate of Internet cafés was lower than that of the city center. However, their growth rate has reached a coordinated state with that of urban development. Compared with other industry types, Internet cafés demonstrated considerable power to drive urban growth. Between 2010 and 2020, other industry types exhibited High-quality coordination. Parks showed a more scattered distribution. This scattering was related to their larger scale, site selection principles, and other factors. Bars exhibited more areas of Slight incoordination Type Ⅱ, indicating that their growth was lagging relative to other industries. Internet cafés showed more areas of Severe incoordination Type Ⅱ. These areas were scattered close to the city center, indicating an obvious decline of Internet cafés in the city center. In contrast, in the peripheral areas of the city center, they exhibited Severe incoordination and Slight incoordination Type I, indicating that Internet cafés in this area were declining further. The remaining industry types displayed High-quality coordination in the city center. Thus, they formed a coordinated development with urban growth.
Excluding Internet cafés, comparing the coordination between the CEI and urban growth in different periods, the development patterns of other industry types were essentially identical. That is, at the early stages of development, the industries in the downtown area progressed from Severe/Slight incoordination Type I to High-quality coordination. In the peripheral areas of the city, Internet cafés evolved from High-quality coordination to Severe incoordination Type Ⅱ. In contrast, other industry types progressed from Slight incoordination type Ⅱ to High-quality coordination. In the city center, CEI growth had a specific driving effect on urban development. However, in the peripheral areas of the city center, urban development has driven the growth of the CEI to some extent.

4. Discussion

4.1. Mechanism of the Influence of Urban Development on CEI

The urban function pattern guides the layout of the CEI (Figure 7). The urban function pattern refers to the embodiment and layout of various functions of the city and their corresponding physical exteriors in the urban territory. On a macroscopic scale, Xi’an’s urban function pattern showed an obvious single centrality [45]. The downtown area carried diversified and integrated urban functions and attracted talent and capital. Moreover, the surrounding area also accumulated high-quality consumer groups and developed transportation networks. Therefore, in the first decade, the CEI tended to be preferentially laid out in the traditional inner-city area and was ahead of urban development. This is consistent with the results of M. Yin’s study [27]. With the saturation of industries and population, traffic congestion, rising land prices, and government policy implementations [46], the population and industries in the downtown area gradually spread out to form a sub-level economic agglomeration [47]. Policy is the main factor for Xi’an’s urban expansion [12], which is different from other urban expansion types, which are mainly driven by terrain, population, economy, industry, investment, and transportation [48,49,50]. Under strong policies, sub-level economic agglomeration can quickly build a sound social and economic environment. Therefore, in the first decade, Xi’an was driven by policies to establish new districts to disperse the functions and population of the central urban area. The improvement of infrastructure and functions in this area provided a new environment for development, which guided the CEI layout. This is similar to the results of de Santana Ribeiro’s study [14]. That is, urbanization is one of the factors affecting CEI distribution. For example, the establishment of the Xi’an Economic & Technological Development Zone caused the built-up area of the city to expand northward (Figure 2h). In addition, the relocation of the Xi’an Municipal Government and the construction of the North Railway Station enabled the zone to share some of the functions of the downtown area [51]. However, the new economy core failed to provide a good environment for CEI development in the early stages, so it did not expand significantly to the north (Figure 2b). With improving infrastructure and increasing population density, the CEI gradually spread out to the north (Figure 2c). Thus, CEI expansion was faster than that of the built-up urban area in this direction (Figure 3a).
Specifically, the functional orientations of different new zones contributed to the obvious functional characteristics of CEI distribution. The CEI is a comprehensive concept. According to different classification standards, the CEI can be divided into various types. For example, bars, cafés, and tea bars meet the material needs of consumers. In comparison, cinemas, dance halls, fitness centers, Internet cafés, and parks meet the experiential needs of consumers. Various industries provide products with different functions and characteristics. When the area’s main function within the city is aligned with industry characteristics, the CEI will be established there. For example, the Chanba Ecological Area was established in 2004 to improve the environment and enhance the comprehensive carrying capacity of the city through watershed management and ecological construction. The ecological functions performed in this area fit with the industrial characteristics of parks to a certain extent. Thus, the parks expand toward the east (Figure 2f). Moreover, combining POI data, the number of parks in the CEI in the Chanba Ecological Area was relatively large. The Xi’an High-tech Industries Development Zone focuses on the development of optoelectronics, automobiles, intelligent manufacturing, biomedicine, and new materials and energy. It has introduced many foreign enterprises [52]. The cultural backgrounds of these enterprises have led to the predominance of cafés in the CEI. At the same time, cafés and other cultural and entertainment venues provided opportunities for rest and socializing/face-to-face interactions between employees, improving the dissemination and learning of tacit knowledge, beneficial to the development of enterprises [53].

4.2. Mechanism of CEI Influence on Urban Development

The CEI mainly affects the functional pattern of the city by meeting the needs of consumers and carrying out spatial production (Figure 7). The results demonstrate that the CEI was established in the downtown area in the early stages of development. The speed of industry growth was faster than that of city development (Figure 4). Therefore, urban development may not be the main reason for the growth of the CEI. In this period, the interaction between the two is primarily reflected in the CEI’s influence on urban development. In the early stage of development, combined with Xi’an’s social system and historical environment, the CEI developed mainly by meeting consumers’ needs for culture and entertainment. It impacted the urban environment through the production of cultural and entertainment space.
Foreign tourists and local residents demand cultural activities and entertainment. On the one hand, the Third Plenary Session of the 11th CPC Central Committee in 1978 developed the reform strategy of gradually shifting from a single planned economy to a planned commodity economic system. Thus, the free trade market was liberated [54]. Based on a profound history and minority culture, Xi’an has made great efforts to develop tourism, attracting many foreign tourists and generating many cultural and entertainment needs [55]. On the other hand, after the reform and opening up, the proportion of the market economy system has gradually expanded, and local residents in Xi’an now shop in a “modern” way. Various consumer demands led to the establishment of various types of comprehensive commercial buildings, especially in the area of the Bell Tower business circle, where many commercial buildings have changed, promoting CEI development.
The CEI influences the functional pattern of the city through the production of cultural and entertainment space. Parks and cinemas have been the primary types driving CEI expansion. Especially in the outer areas of the city, the priority layout of parks can attract a large number of people in a large range, contribute to the formation of cultural and entertainment spaces, and then promote the construction of the local urban environment. This is similar to the results of Lisa Benton-Short’s study [56]. That is, parks contribute to the construction of urban cultural space, thus enhancing the vitality of the city. Moreover, in the first decade, the CEI developed rapidly in the central city. Substantial demand for cultural and entertainment experiences prompted the government to promote the construction of suitable venues. In the early 21st century, the Xi’an government successively issued the Master Plan of Xi’an Urban Construction (1995–2010) and the Strategic Outline of Xi’an for Building an Export-Oriented City to address a series of social and urban problems occurring in the last round of old city reconstruction, such as disputes over ownership, occupation of public space, destruction of historical context, and so on. These measures have created a favorable social and economic environment. Meanwhile, the government led the construction of many antique buildings in the Bell Tower business circle. Cultural and entertainment space was produced through the transformation of land function and the relocation of inefficient enterprises in this construction process. These steps changed the functional pattern of the urban center by creating a good environment for the development of the CEI. Xi’an enhanced the external influence and attraction of the city through cultural construction. A significant influx of CEIs made their way into the city, attracting a substantial number of visitors seeking recreational activities. This surge in demand has led to the diversification of cultural and entertainment preferences, thereby fostering the growth of the CEI within the city center. As a result, a well-established and stable cultural and entertainment hub has emerged. This series of influences prompted the drastic change in urban spatial structure.
In summary, the CEI and urban development interact [23]. For the CEI, residents’ demands are the fundamental guide. In addition, road networks, policy, financial infrastructure, and other factors are critical. They affect industrial development and spatial layout [21]. For urban development, the production of CEI space is important for spatial reconfiguration. In addition, the inflow of talent, capital, and knowledge attracted by the agglomeration economy of the CEI injects new vitality into industry. This creative energy, in turn, improves the urban spatial structure and forms a virtuous cycle.

4.3. Limitation and Prospects

Industrial layout and urban development are important research areas in human geography. This study explored the characteristics of spatial–temporal differentiation and the mechanism of the CEI and urban development’s interaction across seven districts in Xi’an. The study’s findings provide support to researchers in urban and regional development. However, please note that the comprehensive study on the CEI and urban development’s interaction is insufficient.
Limited by privacy protection and data availability, this study did not use quantitative analytic methods to examine the economic relationship between the CEI and urban development. To compensate for this omission, this study qualitatively analyzed the interaction mechanism between the CEI and urban development based on the real-life situation of the study area. Performing a quantitative analysis of the economic relationship between these at the macro level is challenging because of the large, complex network interaction. This problem can be further investigated at the micro level through questionnaire interviews. Such a study would describe this interaction in a more accurate and detailed way. However, the universality and representativeness of the selected interview objects must be rigorously demonstrated to ensure the results’ scientific accuracy.
In this study, only the quantity of POIs was used in the CEI analysis. Whether the scales and service radii of the different types of CEIs have an impact on the interaction between business and urban development was not analyzed. Parks, for example, are relatively large in scale and relatively small in number. They are not as flexible as other forms of business (such as cafés) due to the way they operate. However, due to the large service radius of the park, even a small number can still meet most of the cultural and entertainment needs. In contrast, for CEI types with smaller service radii, only a larger number can meet the cultural and entertainment needs of consumers. Therefore, the relationship between scale, quantity, and service radius and its influence on the interaction between the CEI and urban development should also be fully investigated. However, such an analysis should be based on abundant research. In this study, we analyzed the relative differences in the interactions between the same type of CEI and urban development in different directions. Therefore, the results may compensate for the lack of analysis based on the quantity of POIs. In the comparative analysis between different business forms, the analysis of quantity was combined with the real-life situation and supported by other literature to develop conclusions.
Different operation properties of enterprises may determine their service radii, service quality, attraction, and so on. For example, for cinemas and parks as public institutions and cafés as individual businesses, different interaction modes exist between them and urban development. Even for different entities within a particular CEI type, individual situations may be quite different. For example, some cafés are small self-employed coffee shops, while others are national chain coffee enterprises or even listed in foreign countries. This study did not create a detailed classification and analysis of the properties of different CEI types. In addition, brand and cultural effects must be taken into account. For example, for cafés of the same scale, consumers may be more inclined to choose well-known brands. Similarly, for popular parks of the same scale, cultural heritage or regional uniqueness will be more attractive. These situations also need to be analyzed in depth and detail.
In this study, the interaction mechanism between the CEI and urban development is discussed from the macro level. The main factors affecting the relationship between them are preliminarily determined. These results lay a foundation for further quantitative analysis. In future studies, quantification of the influence of relevant factors on the interaction between the two is necessary. An analysis of the interaction between the two at the micro level using the questionnaire survey method should also be performed. By analyzing the macro and micro, objective and subjective, and quantitative and qualitative aspects, an in-depth analysis of the agglomeration and dispersion modes of influencing factors and the spatial–temporal interaction mechanism will be possible. These strategies are helpful for accurately identifying regional problems. The results could provide a more targeted and systematic decision-making reference for scholars to explore the path of the coordinated development of the industry and city. They could yield an effective decision-making reference for CEI layout and rational development of urban space in different regions.

5. Conclusions

Using the expansion intensity index, equal-fan analysis, and coordination model, we analyzed the rules of spatial–temporal change and the spatial differentiation patterns of the interaction between the CEI and urban development in Xi’an from 2000 to 2020. The analysis revealed the mechanism of their interaction. The specific implications of the conclusions obtained from the analysis of the interaction mechanism are detailed in the results analysis section of the article. Three major findings were produced:
(1)
The CEI and urban development in Xi’an are characterized by consistency and variability in external expansion. The CEI and urban development expanded in the northeast–southwest direction, but the synchronization of their expansion varied greatly in different directions. Economically underdeveloped regions may limit both the CEI and urban development, making it easier for both to reach a state of low-quality coordination. However, in most directions, the two developed at very different speeds, mainly because the expansion rate of the CEI was faster. In the early stage of urban development, the priority layout of parks and cinemas may be conducive to the shaping of cultural and entertainment space.
(2)
The CEI and urban development in Xi’an are characterized by “center-edge” internal coordination. The relationship between CEI growth and urban growth was coordinated. The closer to the downtown area, the more obvious the coordination between the two became. In the downtown area, the mature social and economic environment was conducive to the development of the CEI, and the development of the CEI drove the development of the city in the latter decade. However, in peripheral areas of the city, the development of the CEI needed to be driven by urban development. The CEI and urban development entered a period of rapid growth from 2010 to 2020, basically establishing their overall growth pattern from 2000 to 2020.
(3)
The CEI and urban development in Xi’an mutually promote each other. The urban functional pattern guides the CEI layout. Moreover, the CEI’s spatial pattern promotes the reconfiguration of urban space. Various functional patterns of cities attract different elements, such as human resources, capital, information, and policies, to gather and provide an environment for CEI development. The production of cultural and entertainment venues as a means of renewal reconstructs urban space and continuously improves a city’s spatial structure. Thus, the CEI and urban development interact to form a virtuous cycle.

Author Contributions

Conceptualization, H.Y., D.X. and Y.S.; Data curation, H.Y.; Formal analysis, H.Y., H.L., X.C. and Y.M.; Funding acquisition, D.X.; Investigation, H.Y.; Methodology, H.Y.; Project administration, D.X. and Y.S.; Resources, H.Y.; Software, H.Y., H.L., X.C. and Y.M.; Supervision, D.X. and Y.S.; Validation, H.Y., D.X. and Y.S.; Visualization, H.Y., H.L., X.C. and Y.M.; Writing—original draft, H.Y.; Writing—review & editing, H.Y., D.X. and Y.S. All authors have read and agreed to the published version of the manuscript.

Funding

This research was funded by the National Natural Science Foundation of China, grant number 41971204.

Data Availability Statement

Data will be made available on request.

Conflicts of Interest

The authors declare no conflict of interest.

References

  1. Xun, Y.; Shi, W.; Liu, T. Research on the Structural Characteristics of Entertainment Industrial Correlation in China: Based on Dual Perspective of Input-Output and Network Analysis. Complexity 2021, 2021, 6426123. [Google Scholar] [CrossRef]
  2. Hall, P. Creative cities and economic development. Urban Stud. 2000, 37, 639–649. [Google Scholar] [CrossRef]
  3. Evans, G. Creative Cities, Creative Spaces and Urban Policy. Urban Stud. 2009, 46, 1003–1040. [Google Scholar] [CrossRef] [Green Version]
  4. Landry, C. The Creative City: A Toolkit for Urban Innovators; Oxford University Press: Oxford, UK, 2000. [Google Scholar]
  5. Scott, A.J. The Cultural Economy of Cities: Essays on the Geography of Image-Producing Industries; SAGE Publications Ltd.: Thousand Oaks, CA, USA, 2000. [Google Scholar]
  6. Markusen, A. Urban development and the politics of a creative class: Evidence from a study of artists. Environ. Plan. A 2006, 38, 1921–1940. [Google Scholar] [CrossRef] [Green Version]
  7. Ren, X.; Sun, M. Artistic Urbanization: Creative Industries and Creative Control in Beijing. Int. J. Urban Reg. Res. 2012, 36, 504–521. [Google Scholar] [CrossRef]
  8. Webster, D.; Muller, L.; Cai, J. The emerging cultural economy in Chinese cities: Early dynamics. Int. Dev. Plan. Rev. 2011, 33, 343–369. [Google Scholar] [CrossRef]
  9. Fan, T.; Xue, D. Spatial correlation of cultural industry and tourism industry in Shaanxi Province, China: LISA analysis based on coordination model. Asia Pac. J. Tour. Res. 2020, 25, 967–980. [Google Scholar] [CrossRef]
  10. Chambers, E. Tourism and Culture: An Applied Perspective; State University of New York Press: Albany, NY, USA, 1997. [Google Scholar]
  11. Hughes, G. The cultural construction of sustainable tourism. Tour. Manag. 1995, 16, 49–59. [Google Scholar] [CrossRef]
  12. Wang, X.; Xiao, F.; Zhang, Y.; Yin, L.; Lesi, M.; Guo, B.; Zhao, Y. Thirty-year expansion of construction land in Xi’an: Spatial pattern and potential driving factors. Geol. J. 2018, 53, 309–321. [Google Scholar] [CrossRef]
  13. Li, Y.; Xue, D.; Zhang, P.; Song, Y. Spatial structure and accessibility mode of entertainment industries in Xian City. Prog. Geogr. 2022, 41, 797–811. [Google Scholar] [CrossRef]
  14. de Santana Ribeiro, L.C.; Carneiro Rios Lopes, T.H.; Ferreira Neto, A.B.; dos Santos, F.R. Cultural employment growth in Brazilian municipalities. J. Cult. Econ. 2020, 44, 605–624. [Google Scholar] [CrossRef]
  15. Scott, A.J. A World in Emergence: Cities and Regions in the 21st Century; Edward Elgar: Cheltenham, UK; New York, NY, USA, 2012. [Google Scholar]
  16. Su, W. From culture for the people to culture for profit: The PRC’s journey toward a cultural industries approach. Int. J. Cult. Policy 2015, 21, 513–528. [Google Scholar] [CrossRef]
  17. Grodach, C. Mapping the arts: Industry concentrations, distribution, and change in the US, 1980–2010. Int. J. Cult. Policy 2016, 22, 353–375. [Google Scholar] [CrossRef]
  18. Currid, E.; Williams, S. Two Cities, Five Industries: Similarities and Differences within and between Cultural Industries in New York and Los Angeles. J. Plan. Educ. Res. 2010, 29, 322–335. [Google Scholar] [CrossRef] [Green Version]
  19. Deng, L.; Wu, J. A Study on the Spatial Evolution of Public Entertainment Space in Modern Shanghai (1843–1949). China City Plan. Rev. 2018, 27, 62–72. [Google Scholar]
  20. Florida, R. Cities and the Creative Class; Routledge: London, UK, 2004. [Google Scholar]
  21. He, D.; Chen, Z.; Ai, S.; Zhou, J.; Lu, L.; Yang, T. The Spatial Distribution and Influencing Factors of Urban Cultural and Entertainment Facilities in Beijing. Sustainability 2021, 13, 12252. [Google Scholar] [CrossRef]
  22. Cole, A. Distant neighbours: The new geography of animated film production in Europe. Reg. Stud. 2008, 42, 891–904. [Google Scholar] [CrossRef]
  23. Markusen, A.; Schrock, G. The artistic dividend: Urban artistic specialisation and economic development implications. Urban Stud. 2006, 43, 1661–1686. [Google Scholar] [CrossRef]
  24. Zhu, Y. An Economic Model for Studying the Role of Cultural Industries on Social Development in Cross-border Contexts. Emerg. Mark. Financ. Trade 2020, 56, 1581–1600. [Google Scholar] [CrossRef]
  25. Betlej, A.; Kacerauskas, T. Urban Creative Sustainability: The Case of Lublin. Sustainability 2021, 13, 4072. [Google Scholar] [CrossRef]
  26. He, S. The creative spatio-temporal fix: Creative and cultural industries development in Shanghai, China. Geoforum 2019, 106, 310–319. [Google Scholar] [CrossRef]
  27. Yin, M.; Derudder, B. Geographies of cultural industries across the global urban system. Geogr. Compass 2021, 15, e12564. [Google Scholar] [CrossRef]
  28. Hall, P. The World Cities; Weidenfeld and Nicolson: London, UK, 1966. [Google Scholar]
  29. Florida, R. The Rise of the Creative Class; Basic Books: New York, NY, USA, 2002. [Google Scholar]
  30. Waitt, G.; Gibson, C. Creative Small Cities: Rethinking the Creative Economy in Place. Urban Stud. 2009, 46, 1223–1246. [Google Scholar] [CrossRef]
  31. McGregor, A.; Gibson, C. Musical work in a university town: The shifting spaces and practices of DJs in Dunedin. Asia Pac. Viewp. 2009, 50, 277–288. [Google Scholar] [CrossRef] [Green Version]
  32. Gibson, C. Guest EditorialCreative Geographies: Tales from the ‘margins’. Aust. Geogr. 2010, 41, 1–10. [Google Scholar] [CrossRef]
  33. Doll, C. CIESIN Thematic Guide to Night-time Light Remote Sensing and Its Applications. 2008. Available online: https://www.researchgate.net/publication/266160887_CIESIN_Thematic_Guide_to_Night-time_Light_Remote_Sensing_and_its_Applications (accessed on 14 June 2022).
  34. Small, C.; Elvidge, C.D.; Balk, D.; Montgomery, M. Spatial scaling of stable night lights. Remote Sens. Environ. 2011, 115, 269–280. [Google Scholar] [CrossRef]
  35. Croft, T.A. Nighttime images of the earth from space. Sci. Am. 1978, 239, 86–98. [Google Scholar] [CrossRef]
  36. Baugh, K.E.; Elvidge, C.D.; Tilottama, G.; Ziskin, D. Development of a 2009 Stable Lights Product using DMSP-OLS data. Proc. Asia-Pac. Adv. Netw. 2010, 30, 114–130. [Google Scholar] [CrossRef] [Green Version]
  37. Liu, Z.; He, C.; Zhang, Q.; Huang, Q.; Yang, Y. Extracting the dynamics of urban expansion in China using DMSP-OLS nighttime light data from 1992 to 2008. Landsc. Urban Plan. 2012, 106, 62–72. [Google Scholar] [CrossRef]
  38. Wei, Y.; Liu, H.; Song, W.; Yu, B.; Xiu, C. Normalization of time series DMSP-OLS nighttime light images for urban growth analysis with Pseudo Invariant Features. Landsc. Urban Plan. 2014, 128, 1–13. [Google Scholar] [CrossRef]
  39. Zhang, Q.; Seto, K.C. Mapping urbanization dynamics at regional and global scales using multi-temporal DMSP/OLS nighttime light data. Remote Sens. Environ. 2011, 115, 2320–2329. [Google Scholar] [CrossRef]
  40. Xie, Y.; Weng, Q. Updating urban extents with nighttime light imagery by using an object-based thresholding method. Remote Sens. Environ. 2016, 187, 1–13. [Google Scholar] [CrossRef]
  41. Zhou, C.; Gong, H.; Zhang, Y.; Warner, T.A.; Wang, C. Spatiotemporal Evolution of Land Subsidence in the Beijing Plain 2003–2015 Using Persistent Scatterer Interferometry (PSI) with Multi-Source SAR Data. Remote Sens. 2018, 10, 552. [Google Scholar] [CrossRef] [Green Version]
  42. Shang, Z.; Zhang, X.; Zhou, X. Study on urban spatial expansion and external morphology evolution based on RS/GIS: A case of Huai’an City. Econ. Geogr. 2012, 32, 64–70. [Google Scholar]
  43. Chen, J.; Gao, J.; Chen, W. Urban land expansion and the transitional mechanisms in Nanjing, China. Habitat Int. 2016, 53, 274–283. [Google Scholar] [CrossRef]
  44. Ye, Q.; Mo, Z.; Xu, Y. The expansion and driving forces of the functional space land: A case study of Changsha from 1979 to 2014. Geogr. Res. 2019, 38, 1063–1079. [Google Scholar]
  45. Yang, L.; Wang, Y.; Bai, Q.; Han, S. Urban Form and Travel Patterns by Commuters: Comparative Case Study of Wuhan and Xi’an, China. J. Urban Plan. Dev. 2018, 144. [Google Scholar] [CrossRef]
  46. Liu, Y.; Li, H.; Li, W.; Wang, S. Renovation priorities for old residential districts based on resident satisfaction: An application of asymmetric impact-performance analysis in Xi’an, China. PLoS ONE 2021, 16, e0254372. [Google Scholar] [CrossRef]
  47. Yuan, C.; Duan, Y.; Mao, X.; Ma, N.; Zhao, J. Impact of the mixed degree of urban functions on the taxi travel demand. PLoS ONE 2021, 16, e0247431. [Google Scholar] [CrossRef]
  48. de la Luz Hernandez-Flores, M.; Otazo-Sanchez, E.M.; Galeana-Pizana, M.; Roldan-Cruz, E.I.; Razo-Zarate, R.; Gonzalez-Ramirez, C.A.; Galindo-Castillo, E.; Gordillo-Martinez, A.J. Urban driving forces and megacity expansion threats. Study case in the Mexico City periphery. Habitat Int. 2017, 64, 109–122. [Google Scholar] [CrossRef]
  49. Liu, L.; Liu, J.; Liu, Z.; Xu, X.; Wang, B. Analysis on the Spatio-Temporal Characteristics of Urban Expansion and the Complex Driving Mechanism: Taking the Pearl River Delta Urban Agglomeration as a Case. Complexity 2020, 2020, 8157143. [Google Scholar] [CrossRef]
  50. Osman, T.; Divigalpitiya, P.; Arima, T. Driving factors of urban sprawl in Giza Governorate of Greater Cairo Metropolitan Region using AHP method. Land Use Policy 2016, 58, 21–31. [Google Scholar] [CrossRef]
  51. Xue, D.; Wan, S.; Ma, B.; Chen, R. Spatial Agglomeration of Cultural Industry of Xi’an City Based on Urban Functional Pattern. Sci. Geogr. Sin. 2019, 39, 750–760. [Google Scholar]
  52. Shi, L.; Yu, B. Eco-Industrial Parks from Strategic Niches to Development Mainstream: The Cases of China. Sustainability 2014, 6, 6325–6331. [Google Scholar] [CrossRef] [Green Version]
  53. Lefika, P.T.; Mearns, M.A. Adding knowledge cafes to the repertoire of knowledge sharing techniques. Int. J. Inf. Manag. 2015, 35, 26–32. [Google Scholar] [CrossRef]
  54. Gong, Y. Correctly Interpreting the Relationship between Two Historical Periods before and after the Reform and Opening Up in China. Int. Crit. Thought 2022, 12, 271–286. [Google Scholar] [CrossRef]
  55. Zhang, X.; Sun, G. The Analysis of the Time and Space on the Development of Tour ism Economy in Xi’an. J. Shangluo Univ. 2006, 2006, 50–55. [Google Scholar]
  56. Benton-Short, L. Rethinking urban parks: Public space and cultural diversity. Ann. Assoc. Am. Geogr. 2006, 96, 853–855. [Google Scholar] [CrossRef]
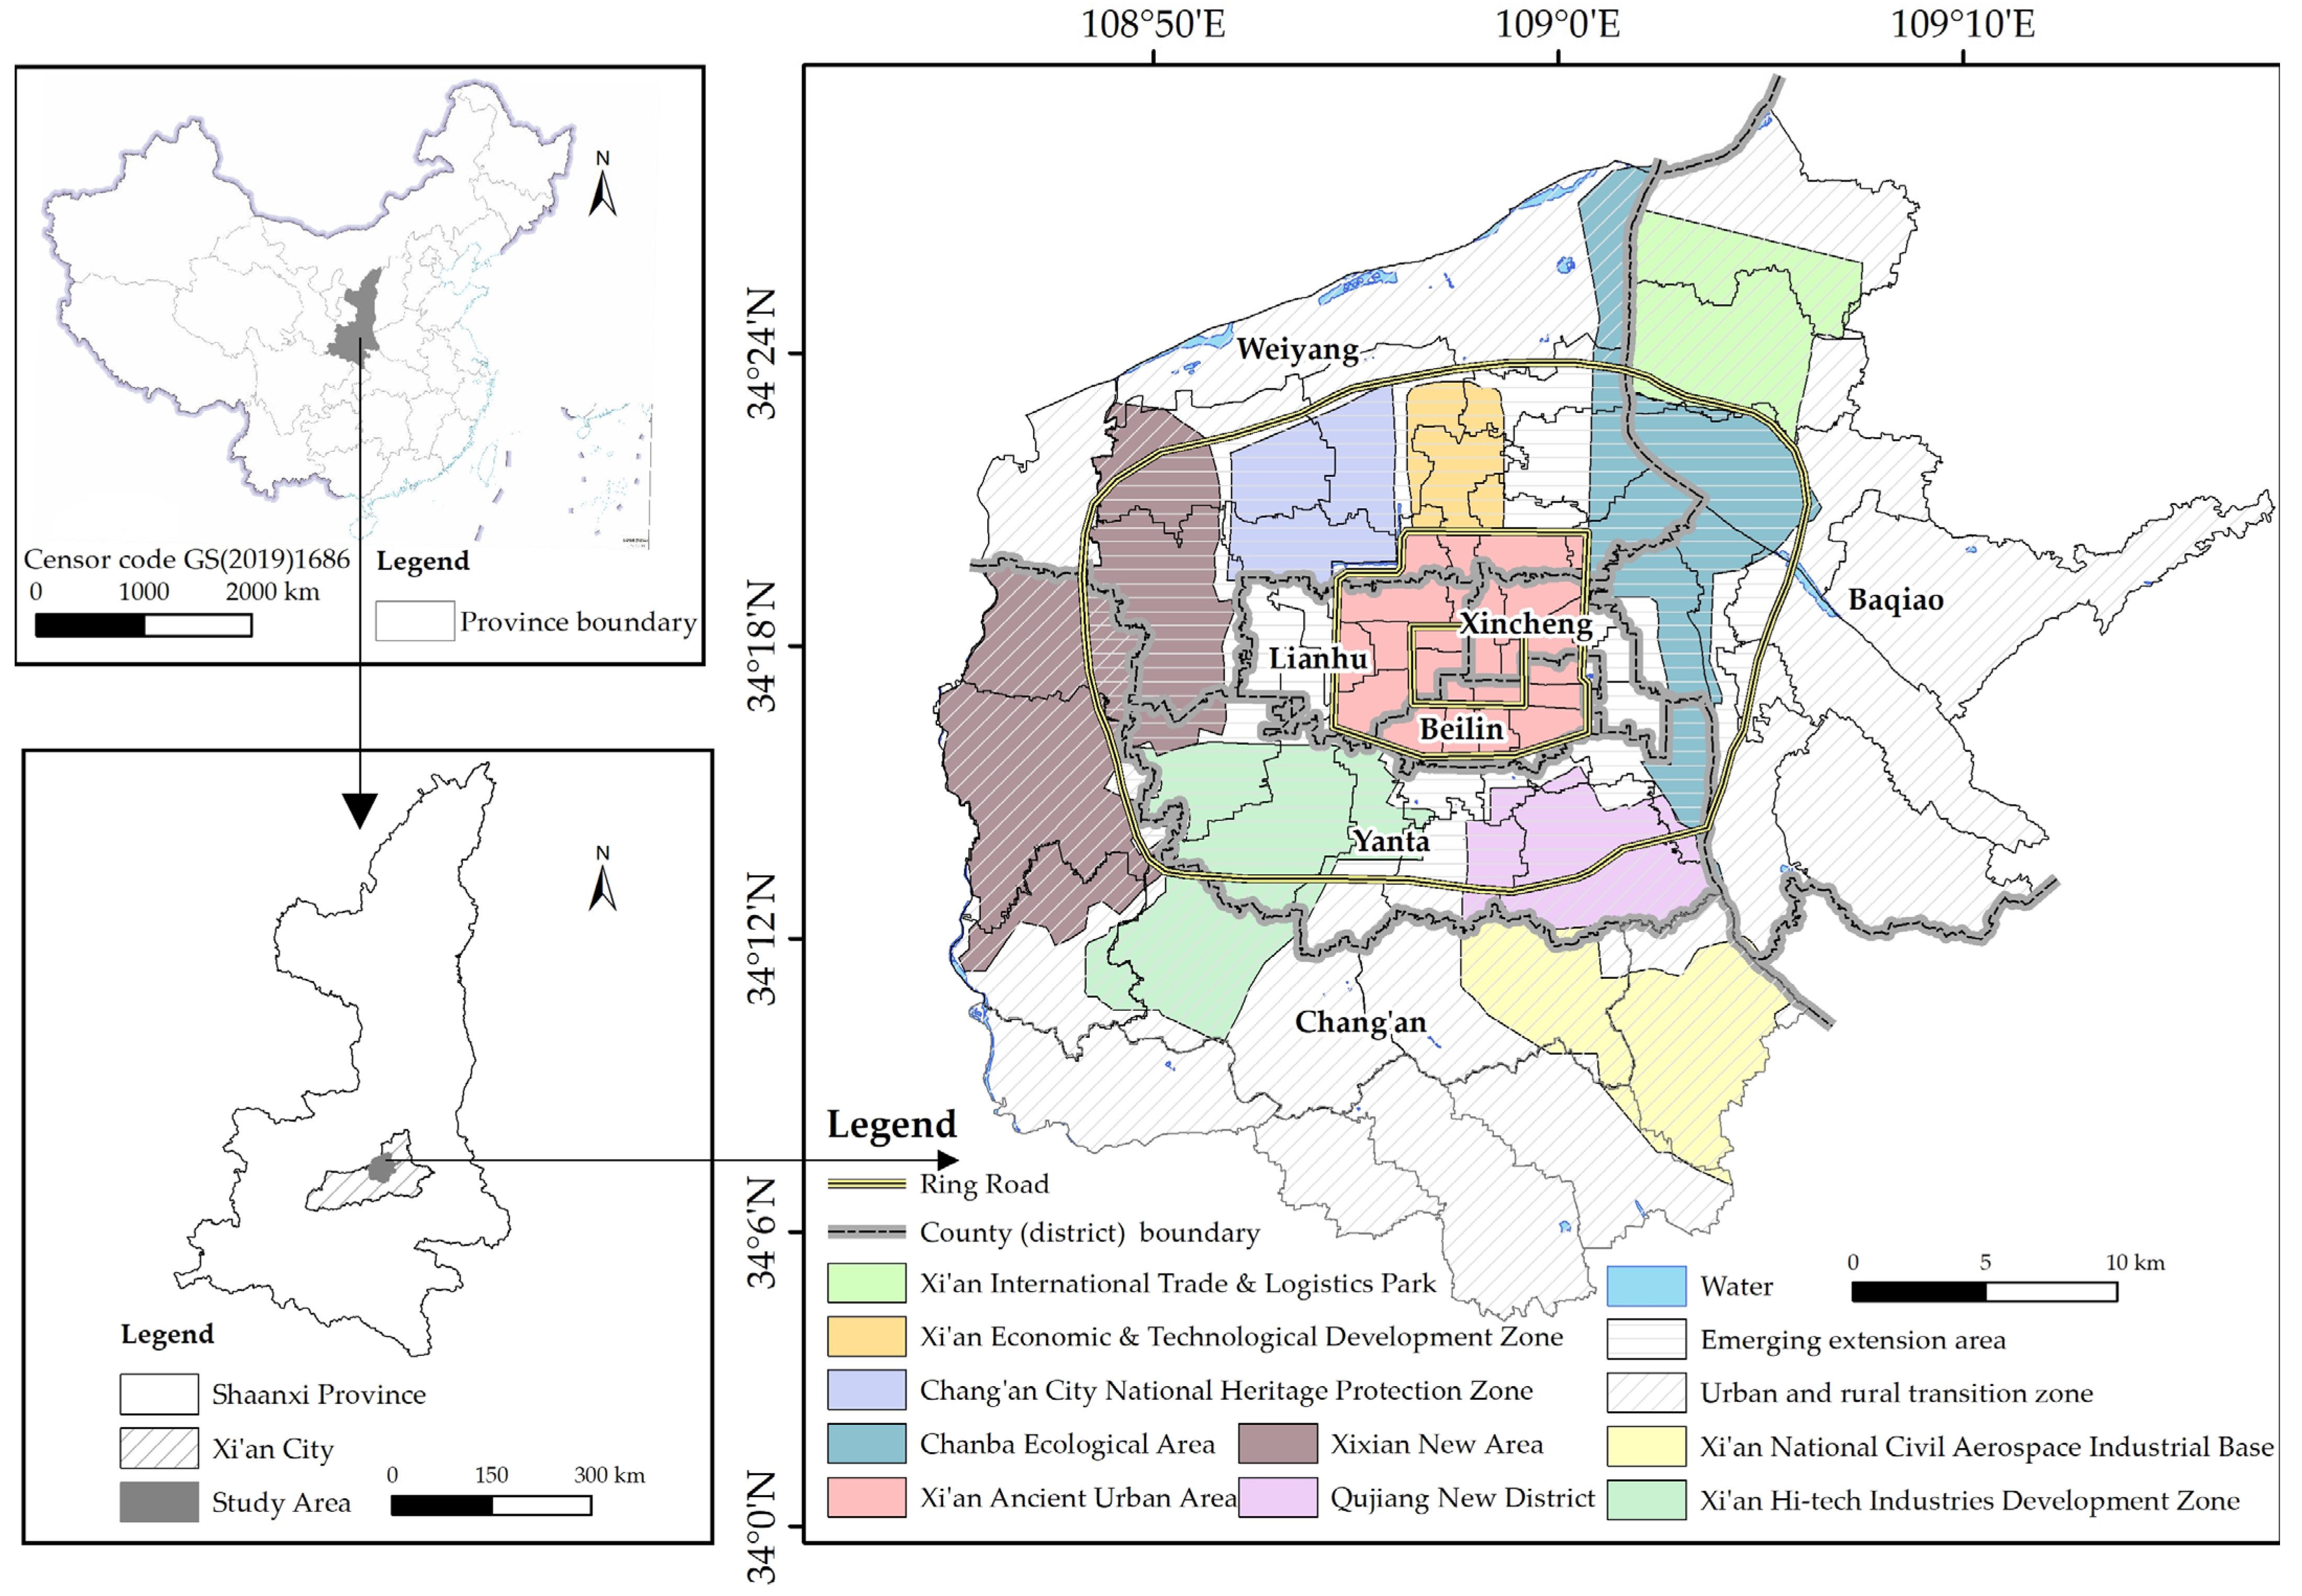
Figure 1. Location of the research area. The Chinese map is created based on the standard map, with approval number GS (2019)1686, downloaded from the standard map service website of the National Administration of Surveying, Mapping, and Geoinformation, with the unmodified base map.
Land 12 01445 g001
Figure 2. The spatial expansion of the CEI and the built-up area. (ac) The spatial expansion of the CEI in different periods; (df) The spatial expansion of different types of CEIs in different periods; (gi) The spatial expansion of the built-up area in different periods.
Land 12 01445 g002
Figure 3. Synchronization of the expansion intensity between the CEI and built-up area in Xi’an, 2000-2020. (a) Synchronization between the CEI and built-up area; (bd) Synchronization between different types of CEIs and the built-up area in different periods.
Land 12 01445 g003
Figure 4. Distribution of coordination types between the CEI and urban development in Xi’an.
Land 12 01445 g004
Figure 5. Number of grids of coordination types of the CEI and urban development in Xi’an, 2000–2020.
Land 12 01445 g005
Figure 6. Distribution of coordinations of CEI types with urban development in Xi’an from 2000 to 2020.
Land 12 01445 g006
Figure 7. Mechanism of interaction between the CEI and urban development.
Land 12 01445 g007
Table 1. Nighttime lighting and civic industry density coordination type division.
TypeConditionsMeaning
High-quality coordination 0 . 8   <   O     1 . 0 ,   C R     U R   >   0 The number of POIs and the value of nighttime light are increasingly coordinated. The CEI and urban development are improving in a synergistic manner.
Severe incoordination Type I 0     O   <   0 . 5 ,   C R   >   U R The number of POIs is poorly coordinated with the value of nighttime light. The CEI is growing faster than the urban area.
Slight incoordination Type I 0 . 5     O   <   0 . 8 ,   C R   >   U R The number of POIs is slightly uncoordinated with the value of nighttime light. The CEI is growing faster than the urban area.
Slight incoordination Type Ⅱ 0 . 5     O   <   0 . 8 ,   C R   <   U R The number of POIs is slightly uncoordinated with the value of nighttime light. The city is growing faster than the CEI.
Severe incoordination Type Ⅱ 0     O   <   0 . 5 ,   C R   <   U R The number of POIs is poorly coordinated with the value of nighttime light. The city is growing faster than the CEI.
Low-quality coordination 0 . 8   <   O     1 . 0 ,   C R     U R   <   0 The number of POI and the value of nighttime light decline in coordination. The CEI and urban development are in a state of synergistic decline.
Table 2. Average values of the expansion indices of each CEI industry type in Xi’an.
PeriodBarCaféCinemaDance HallTea BarFitness CenterInternet CaféPark
2000–20200.03510.06430.01660.02370.06380.04520.04590.0145
2000–20100.01110.01660.00140.00800.01980.00250.05190.0022
2000–20200.05910.11190.03180.03950.10790.08790.03990.0267
Disclaimer/Publisher’s Note: The statements, opinions and data contained in all publications are solely those of the individual author(s) and contributor(s) and not of MDPI and/or the editor(s). MDPI and/or the editor(s) disclaim responsibility for any injury to people or property resulting from any ideas, methods, instructions or products referred to in the content.