Article

Evolution of Ecosystem Service Values and the Response to Landscape Pattern Change in the Huaihe River Eco-Economic Belt

1
School of Urban and Environmental Sciences, Huaiyin Normal University, Huai’an 223300, China
2
Key Research Base of Philosophy and Social Sciences in Jiangsu Universities—Research Institute of Huaihe River Eco-Economic Belt, Huai’an 223300, China
*
Author to whom correspondence should be addressed.
Land 2023, 12(7), 1405; https://doi.org/10.3390/land12071405
Submission received: 13 May 2023 / Revised: 5 July 2023 / Accepted: 10 July 2023 / Published: 13 July 2023

Abstract

:
Land use change has serious impacts on the structure, function, and layout of the landscape pattern, which significantly affects ecosystem service values (ESVs). Based on land use data over a 10-year interval from 1980 to 2020, this study analyzed the evolution characteristics of ESVs and landscape ecological security in the Huaihe River Eco-Economic Belt using the equivalent factor method (EFM) and landscape pattern indices. The results show that the following: (1) The ESVs of the Huaihe River Eco-Economic Belt has increased by approximately 4% in the past 40 years, primarily characterized by increases in the values of services associated with the water environment (water supply, purifying environment, and hydrological regulation) and decreases in the values of services not associated with the water environment (food production, raw material production, gas conditioning, climate control, soil conservation, nutrient cycle maintenance, and biodiversity). (2) The landscape indices of landscape division index, edge density, marginal entropy, fractal dimension index, and Shannon’s diversity index have shown increasing trends, and human activities in the study area are more widespread and fragmented. (3) Landscape fragmentation significantly reduced the values of non-water services, but the increase in the values of water-related services masked the impact of landscape fragmentation on the total ESVs. The EFM overestimated the ESVs of the water environment, such as hydrological regulation in areas with a large expansion of the water area, which may introduce uncertainties in the results.

1. Introduction

The concept of ecosystem services has gained widespread recognition among scientists, policymakers, and the public over the past few decades. Ecosystem services are the benefits that natural ecosystems directly or indirectly provide to humans [1,2,3]. Ecosystem services encompass various types of services, such as provisioning services (e.g., food, water, and timber), regulating services (e.g., climate regulation, pollination, and water purification), supporting services (e.g., nutrient cycling and soil formation), and cultural services (e.g., recreation, aesthetic values, and spiritual values) [1]. However, irrational land use practices have caused a series of ecological problems, such as decreased biodiversity and increased environmental pollution, directly leading to a decline in the capacity of ecosystem services [4,5]. Therefore, the evaluation of ecosystem services is crucial for making informed decisions related to land use planning, conservation, and natural resource management. The recognition of the value of ecosystem services has led to a growing interest in quantifying their economic value, as well as their social and ecological importance [6,7]. Meraj et al. [8] argued that understanding the economic value of ecosystem services is essential for making informed decisions on the allocation of resources and designing effective policies and management strategies. Wainger et al. [9] found that understanding the economic value of ecosystem services can help in prioritizing conservation efforts and improving natural resource management. As a “bridge” connecting the natural and human societies, scientifically quantifying and evaluating ecosystem service values (ESVs) is of great significance to protecting the ecological environment, land resource planning, and regional sustainable development.
The ESVs, as an important indicator reflecting the regional ecological development trend and ecological value, has been extensively studied. ESVs evaluation methods mainly include the functional value assessment method (FVAM) and equivalent factor method (EFM) [10,11]. The FVAM involves measuring the economic value of an ecosystem service by assessing the costs that would be incurred if the service were to be lost or replaced. However, the calculation process of this method is complicated because it involves a series of complex equations, and its accuracy remains to be improved as the results may significantly vary. Moreover, it is only suitable for small spatial scales [12,13,14]. In contrast, the EFM involves assigning a monetary value to a given unit of a particular ecosystem service, known as an “equivalent factor”. In this method, different ecosystem functions are classified, and different types of equivalent value coefficients are constructed for each category of ecological service functions based on standardized quantification, thereby evaluating the distribution of regional ecosystem services [15,16,17]. The EFM allows for the quantification of different ecosystem services based on their economic or social values, which can be compared and aggregated to provide a comprehensive evaluation of the overall value of an ecosystem [18]. This method is easy to use, requires fewer data, provides highly comparable results, and applies to large-scale ecosystem evaluations. Additionally, the EFM can help to identify trade-offs and facilitate informed decision-making in ecosystem management and conservation [19,20]. Therefore, it is currently the main method for evaluating ESVs. EFM has been applied at different spatial scales, such as river basins [21,22], provinces [23,24], regions [25,26], and cities [27,28].
A landscape pattern refers to the spatial configuration and arrangement of various land cover types in a landscape. It has been shown to have significant impacts on ecosystem services [29]. On the one hand, different types of landscape structures provide diverse ecosystem services and, accordingly, form different types, quantities, and qualities of ESVs. On the other hand, changes in landscape patterns can change the structure and function of ecosystems, thus affecting service supply and even leading to spatiotemporal changes in ESVs. For example, a diverse landscape with a mixture of different land cover types provides a wide range of habitats and resources for a variety of plant and animal species, which in turn can enhance ecosystem services, such as pollination, pest control, and water regulation [30,31]. In contrast, a landscape dominated by a single land cover type, such as a monoculture crop field, may have lower biodiversity and reduced capacity to provide ecosystem services. In addition, landscape patterns can also affect the spatial distribution and connectivity of ecosystem services. For example, a fragmented landscape with isolated patches of natural habitats may reduce the ability of species to move between habitats, leading to reduced pollination or seed dispersal [32]. Conversely, a landscape with well-connected natural areas may support higher levels of ecosystem services by allowing species to move freely and exchange resources across the landscape. Furthermore, the size and shape of different land cover patches can also influence ESVs. Larger patches of natural habitats can support greater biodiversity and provide more ecosystem services than smaller patches, while the shape of patches can affect their accessibility and suitability for different species.
Research has shown that changes in landscape patterns can have significant effects on the provision of ecosystem services, as different landscape structures provide different types and quantities of ESVs. Grêt-Regamey et al. [33] demonstrated the potential impact of landscape pattern changes on the provision of ecosystem services, emphasizing the significance of ongoing fragmentation for the value of species-rich habitats’ ecosystem services. Wang et al. [34] examined the connections between landscape patterns and ecosystem services. They highlighted that decreasing landscape fragmentation and increasing patch shape irregu-larity negatively impact water retention, carbon storage, and biodiversity conservation. Wen and Li [35] pointed out that increasing diversity and decreasing fragmentation are conducive to the growth of ESVs in high-value landscape types, whereas regions with concentrated low-value landscape types exhibit the opposite tendency. Shao and Wu [36] pointed out that the fragmentation factor has a weak effect and explanatory power on the overall and various types of ecosystem services, while patch density and aggregation degree show strong and sustained effects on various services. Zheng et al. [37] pointed out that the ESVs is positively correlated with the contagion index and negatively correlated with the Shannon diversity index, and that changes in landscape patterns caused by human activities can reduce ESVs. Therefore, understanding the relationship between landscape patterns and ESVs is important for land use planning and conservation efforts, as it can help identify areas of high ecological value and guide the development of management strategies that promote sustainable use of natural resources.
The Huaihe Ecological Economic Belt is one of the regions with the greatest development potential in China. However, as basin planning and the influence of natural conditions have been neglected for a long time, its economic development level and ecological environment are significantly different from those of other economic belts. Based on landscape ecology theory and EFM, this paper presents an analysis of the spatial-temporal evolution of ESVs and landscape indices, as well as of the impact of landscape indices on regional ESVs. The results are expected to provide a scientific basis for ESVs evaluation and protection, sustainable economic development, and construction of an environmentally friendly, efficient, and regionally integrated ecological economic belt.

2. Study Area, Data, and Methods

2.1. Study Area

According to the development plan of the Huaihe River Ecological Economic Belt released by the State Council in 2018, the Huaihe River Eco-Economic Belt relies on the main stream of the Huaihe River, the first-level tributaries, and the Yishui, Sulao, and Sihu watersheds, covering 26 cities in Hubei, Shandong, Henan, Anhui, and Jiangsu provinces, as well as three counties—Tongbai, Suixian, and Dawu. The ecological economic belt has superior location conditions in central-eastern China, where major national railways, such as the Beijing-Shanghai high-speed railway, and highways, such as the Changchun-Shenzhen intersection, connect upstream and downstream areas and link it with the Yangtze River Economic Belt. In 2019, the region had a permanent population of 163 million, accounting for 11.69% of the total population of China. The natural conditions in the area are excellent, with mainly plain terrain and mountainous and hilly areas in the west, southwest, and northeast, and lakes mainly distributed at the confluence of the Huaihe River and its tributaries (Figure 1). The region is characterized by a well-developed water system with many lakes, making it suitable for aquaculture and animal husbandry. Additionally, the region boasts abundant mineral resources and serves as an important coal and energy base in eastern China. At the same time, the region is plagued by severe industrial and agricultural pollution, a fragile ecological environment, and a large gap in economic development compared with regions such as the Yangtze River Delta and the Pearl River Delta.

2.2. Data and Methods

Land use data were obtained from the Resource and Environment Science Data Center of the Chinese Academy of Sciences (http://www.resdc.cn/, accessed on 20 January 2023). This study used land use data from 1980, 1990, 2000, 2010, and 2020. ESVs and landscape pattern indices were calculated at a grid scale using ArcGIS Fishnet models, dividing the study area into 1320 15 km × 15 km grid.
ESVs estimation was mainly based on the EFM used by Xie et al. [38]. The equivalent factor value of a unit ESVs represents the economic value of the annual natural grain yield per hectare at the national average yield. This value is equivalent to 1/7 of the market value of the national per-unit grain yield [39,40]. Data on the planting area and yield of rice, wheat, corn, soybeans, and potatoes in all cities and counties in this region were obtained from statistical yearbooks of Jiangsu, Anhui, Henan, Hubei, and Shandong provinces during the selected time period. These data were combined with the average grain prices in these areas to obtain the unit value of the equivalent factor of the ESVs of 1506 Yuan/hm2. Then, the ESVs per unit area was calculated (Table 1).
ESVs was calculated as follows:
E S V s = A k × V C k E S V f = A k × V C f k
where ESVs represents the ecological system service value, Ak represents the area of the kth ecosystem type, VCk represents the ecological value coefficient, ESVf represents the ESVs of a single ecosystem type, and VCfk represents the coefficient of the ESVs of the single ecosystem.
At present, there are over a hundred types of landscape indices, which can be roughly divided into core area indices, aggregation degree indices, area edge indices, shape indices, diversity indices, and complexity indices. Considering the high correlation between landscape indices of the same type, this study selected one landscape index from each category (Table 2), and the selected indices were calculated using the R package “landscapemetrics” [41]. The effect of the landscape index on ESVs was estimated using the correlation coefficient, with a significance level of 0.05.

3. Results

3.1. Temporal and Spatial Changes in Ecosystem Service Values

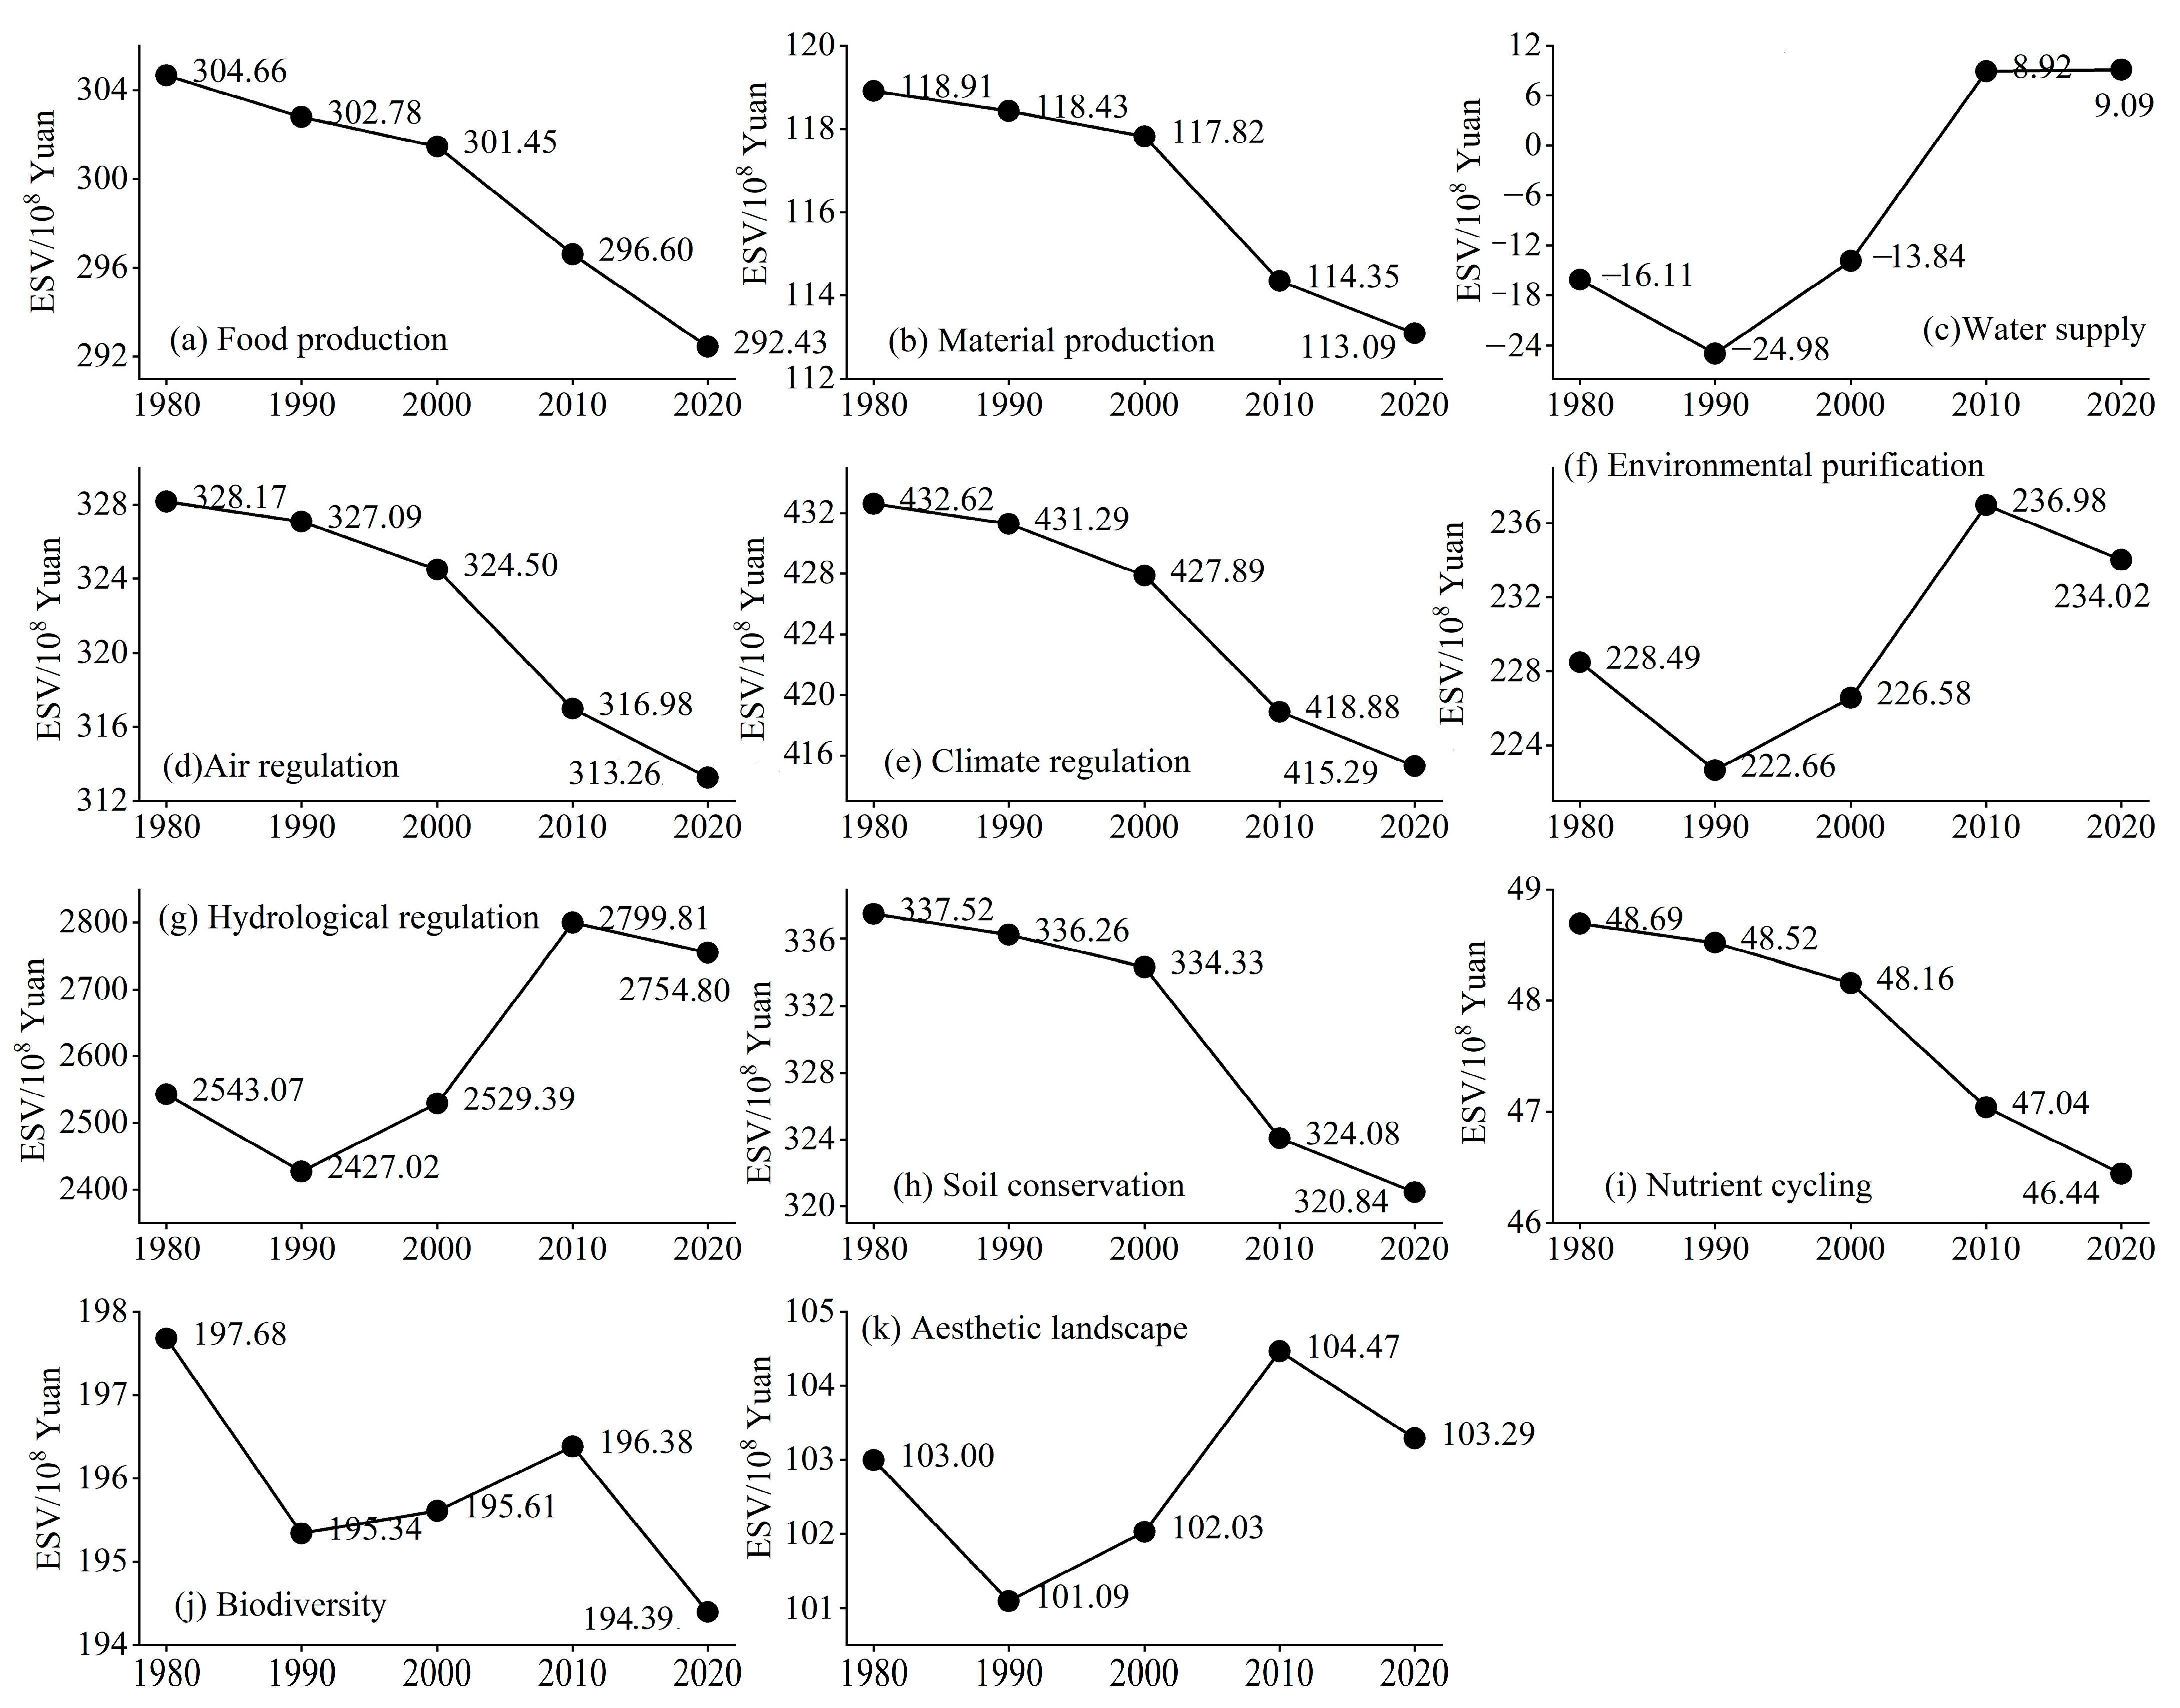
From the perspective of temporal changes (Figure 2), changes in the ESVs could be roughly divided into two categories: the first category has shown a decreasing trend in food production, raw material production, gas regulation, climate regulation, soil conservation, maintenance of nutrient cycling, and biodiversity; the second category has shown an increasing trend in water supply, environmental purification, hydrological regulation, and aesthetic landscape, which are closely related to changes in the water environment. From the perspective of land use changes, the significant increase in the water area in the Huaihe River Eco-Economic Belt has led to a significant increase in the ESVs related to the water environment.
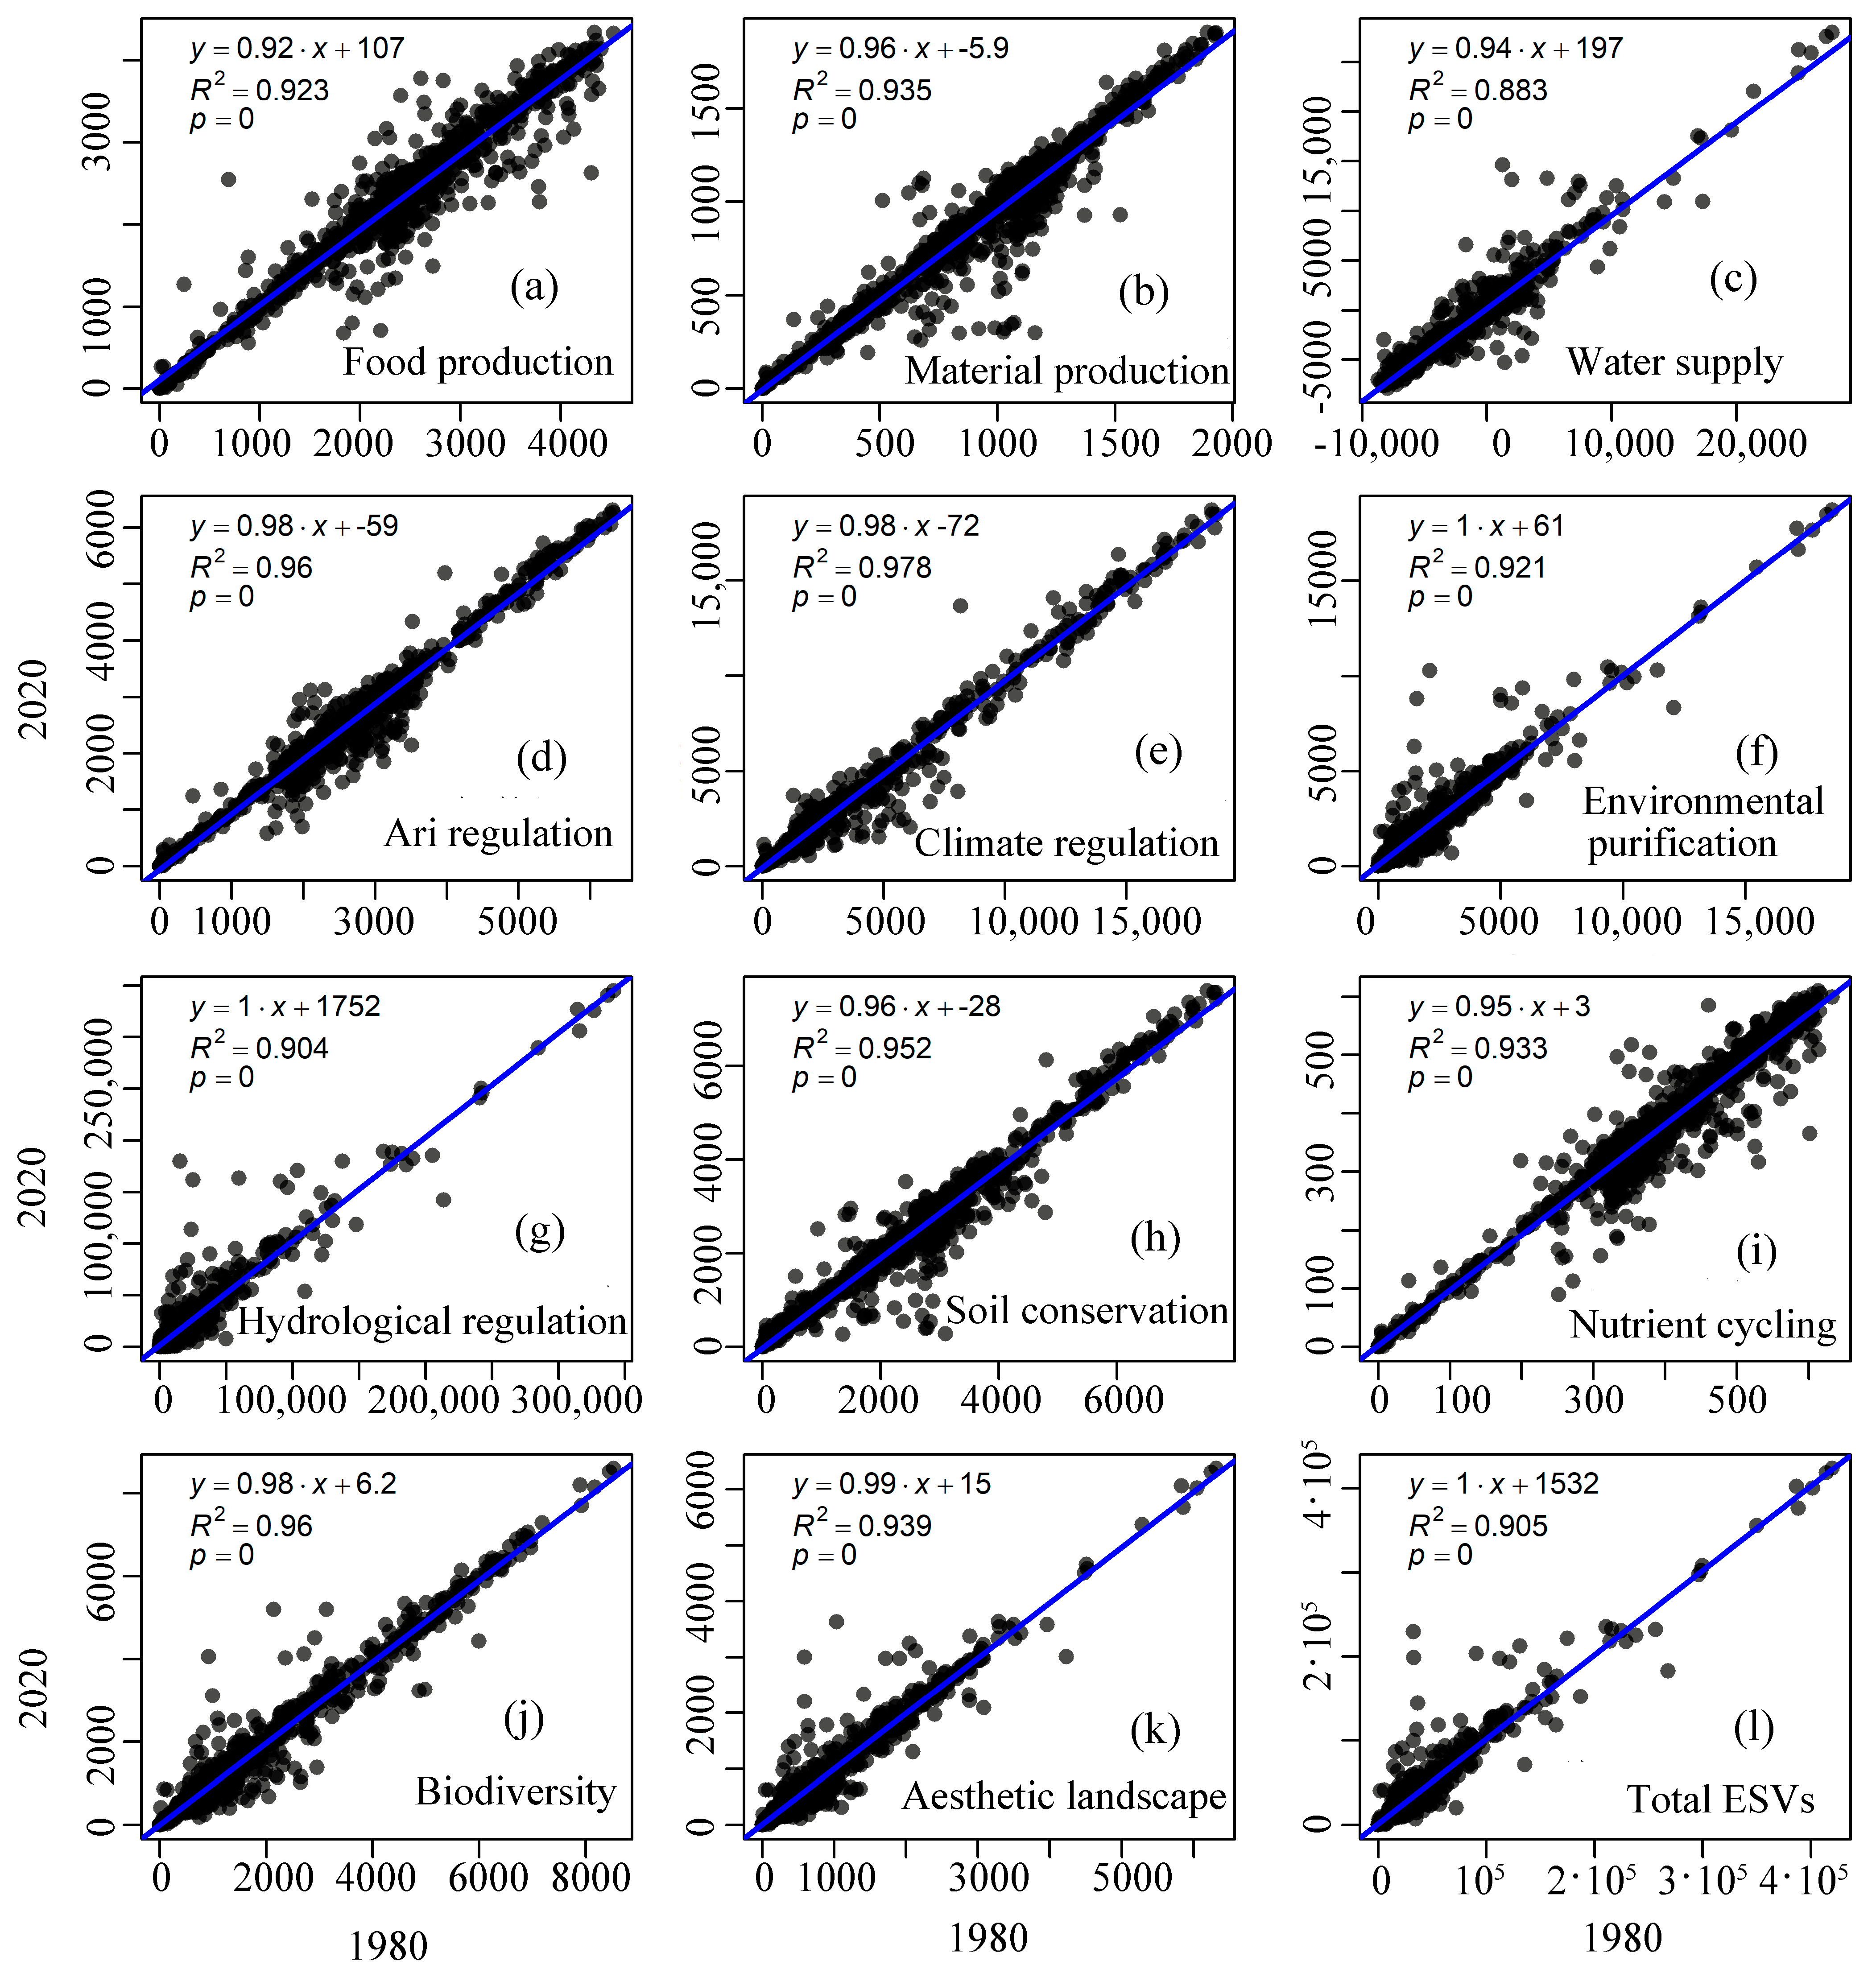
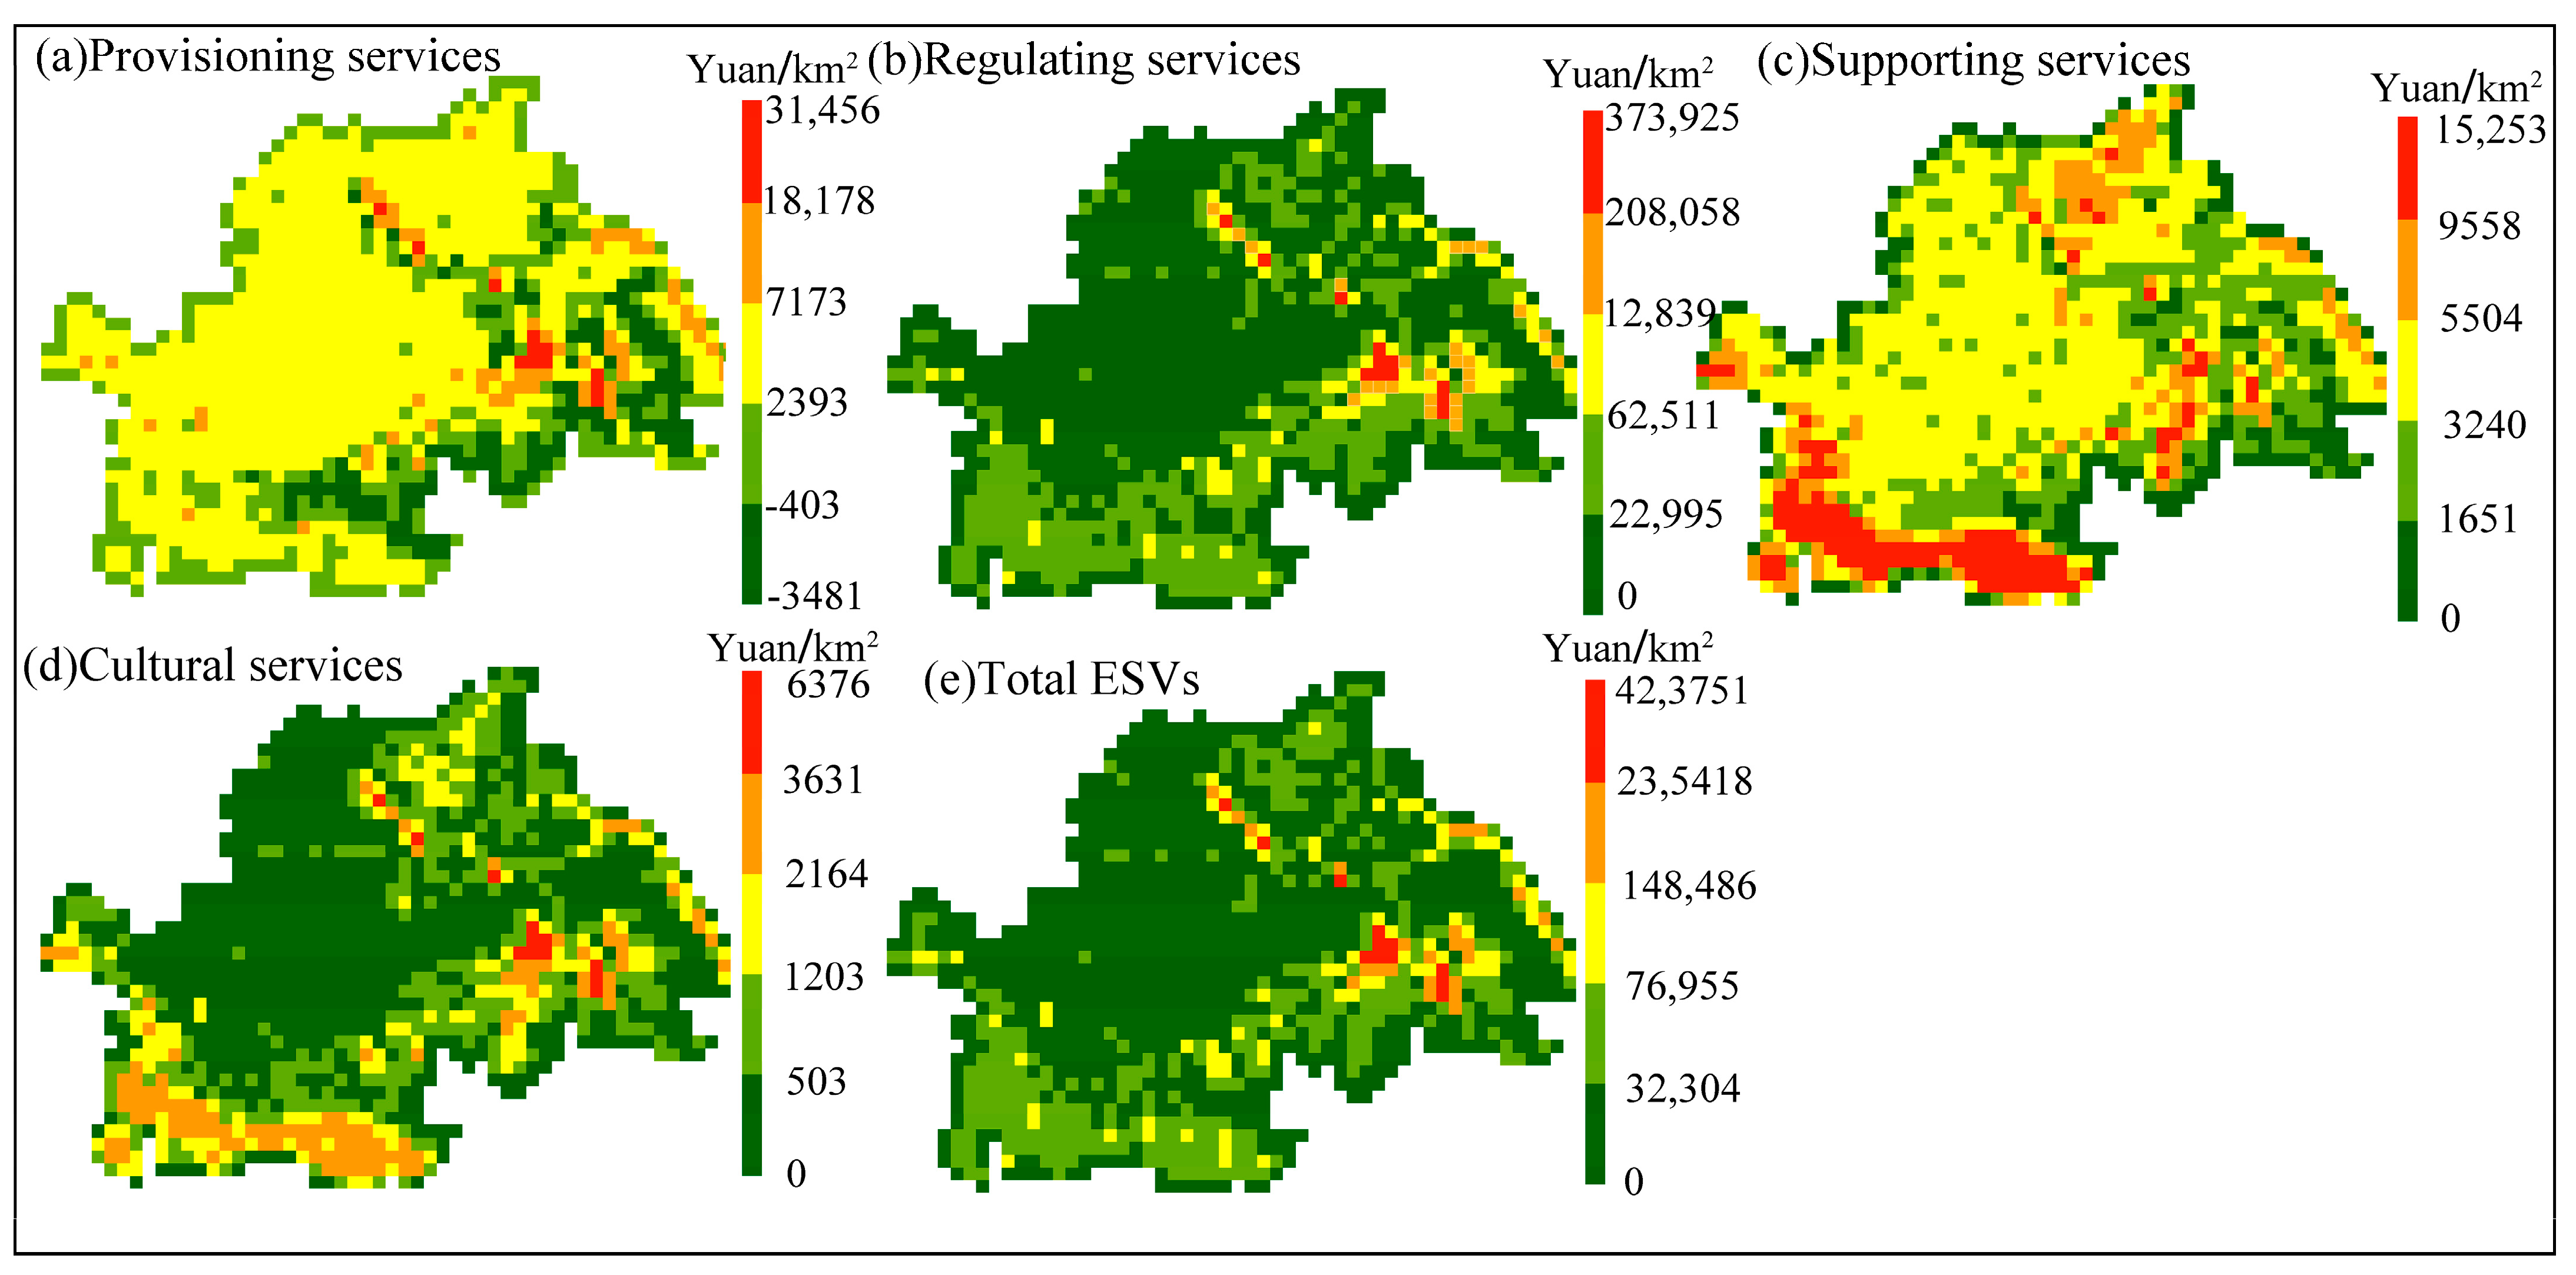
At the grid scale, ESVs showed high similarity between different years. Taking 1980 and 2020 as examples, all coefficients except for the coefficient of determination of water supply, which was 0.88, were above 0.9 (Figure 3). This indicates that the spatial distribution of ESVs remained stable between different periods. In terms of spatial distribution, the provisioning services of the water area showed the largest distribution, whereas the provisioning services of the paddy field showed the lowest distribution owing to high water consumption (Figure 4). Regulating services, supporting services, and cultural services showed the largest distribution primarily in the water area, forest, and grassland, and the smallest distribution in drylands. As the ESVs of all areas were calculated on the basis of land use data, the spatial distribution of provisioning services, regulating services, supporting services, and cultural services was highly correlated with the spatial distribution of land use types (Figure 1).

3.2. Changes in the Total ESVs and Proportion of Ecological Services

The value of provisioning services in the Huaihe River Eco-Economic Belt increased from CNY 407.45 billion in 1980 to CNY 414.61 billion in 2020. The value of regulating services increased from CNY 3532.35 billion in 2020 to CNY 3717.37 billion in 2020, and that of cultural services increased from CNY 103 billion in 1980 to CNY 103.29 billion in 2020 (Table 3). The value of supporting services showed a decreasing trend, from CNY 583.89 billion in 1980 to CNY 561.678 billion in 2020, as they did not involve the ESVs of the water environment. With the increase in the water area in the study area, the total ESVs increased significantly, from CNY 4626.69 billion in 1980 to CNY 4769.95 billion in 2020.
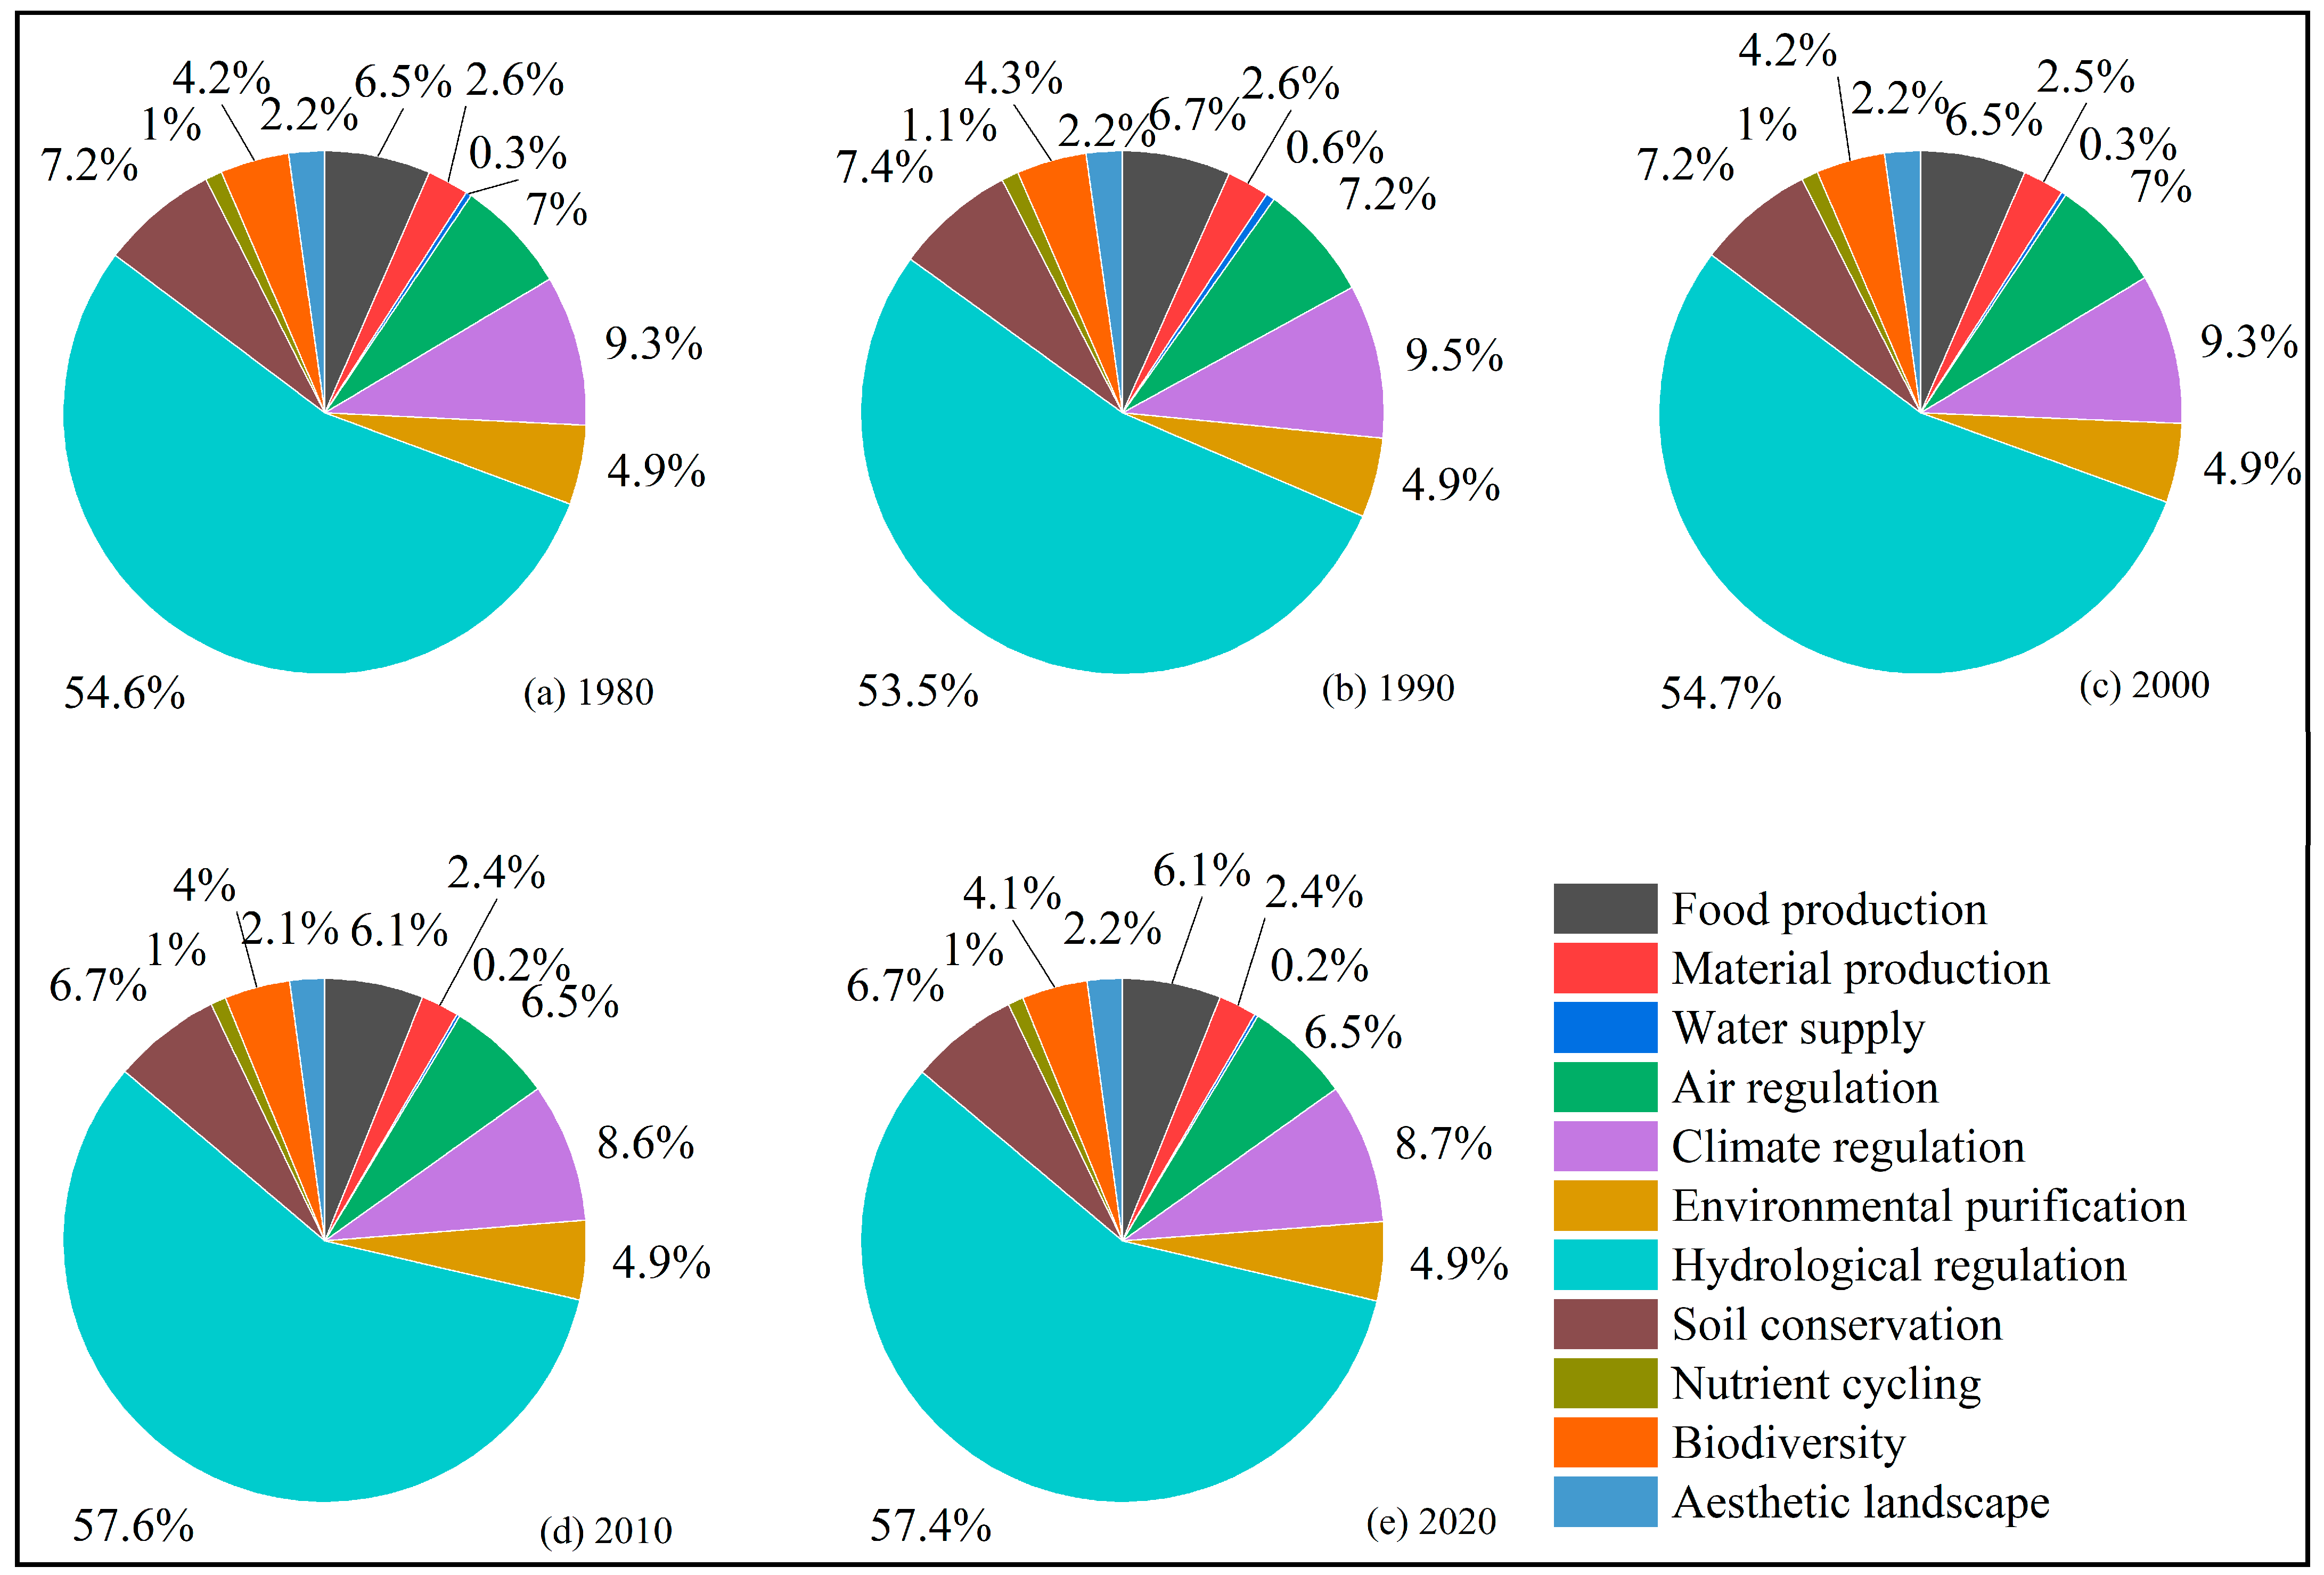
In terms of the proportion of ecological services, both provisioning services and cultural services showed a decreasing trend, but the decrease was not significant. The proportion of supporting services decreased from 12.63% in 1980 to 11.71% in 2020, mainly due to the decreasing proportion of soil conservation and biodiversity (Figure 5). The proportion of regulatory services increased from 76.35% in 1980 to 77.49% in 2020, mainly due to the increase in the proportion of hydrological regulation (Figure 5), with hydrological regulation services increasing from 54.6% in 1980 to 57.4% in 2020.

3.3. Changes in Landscape Indices

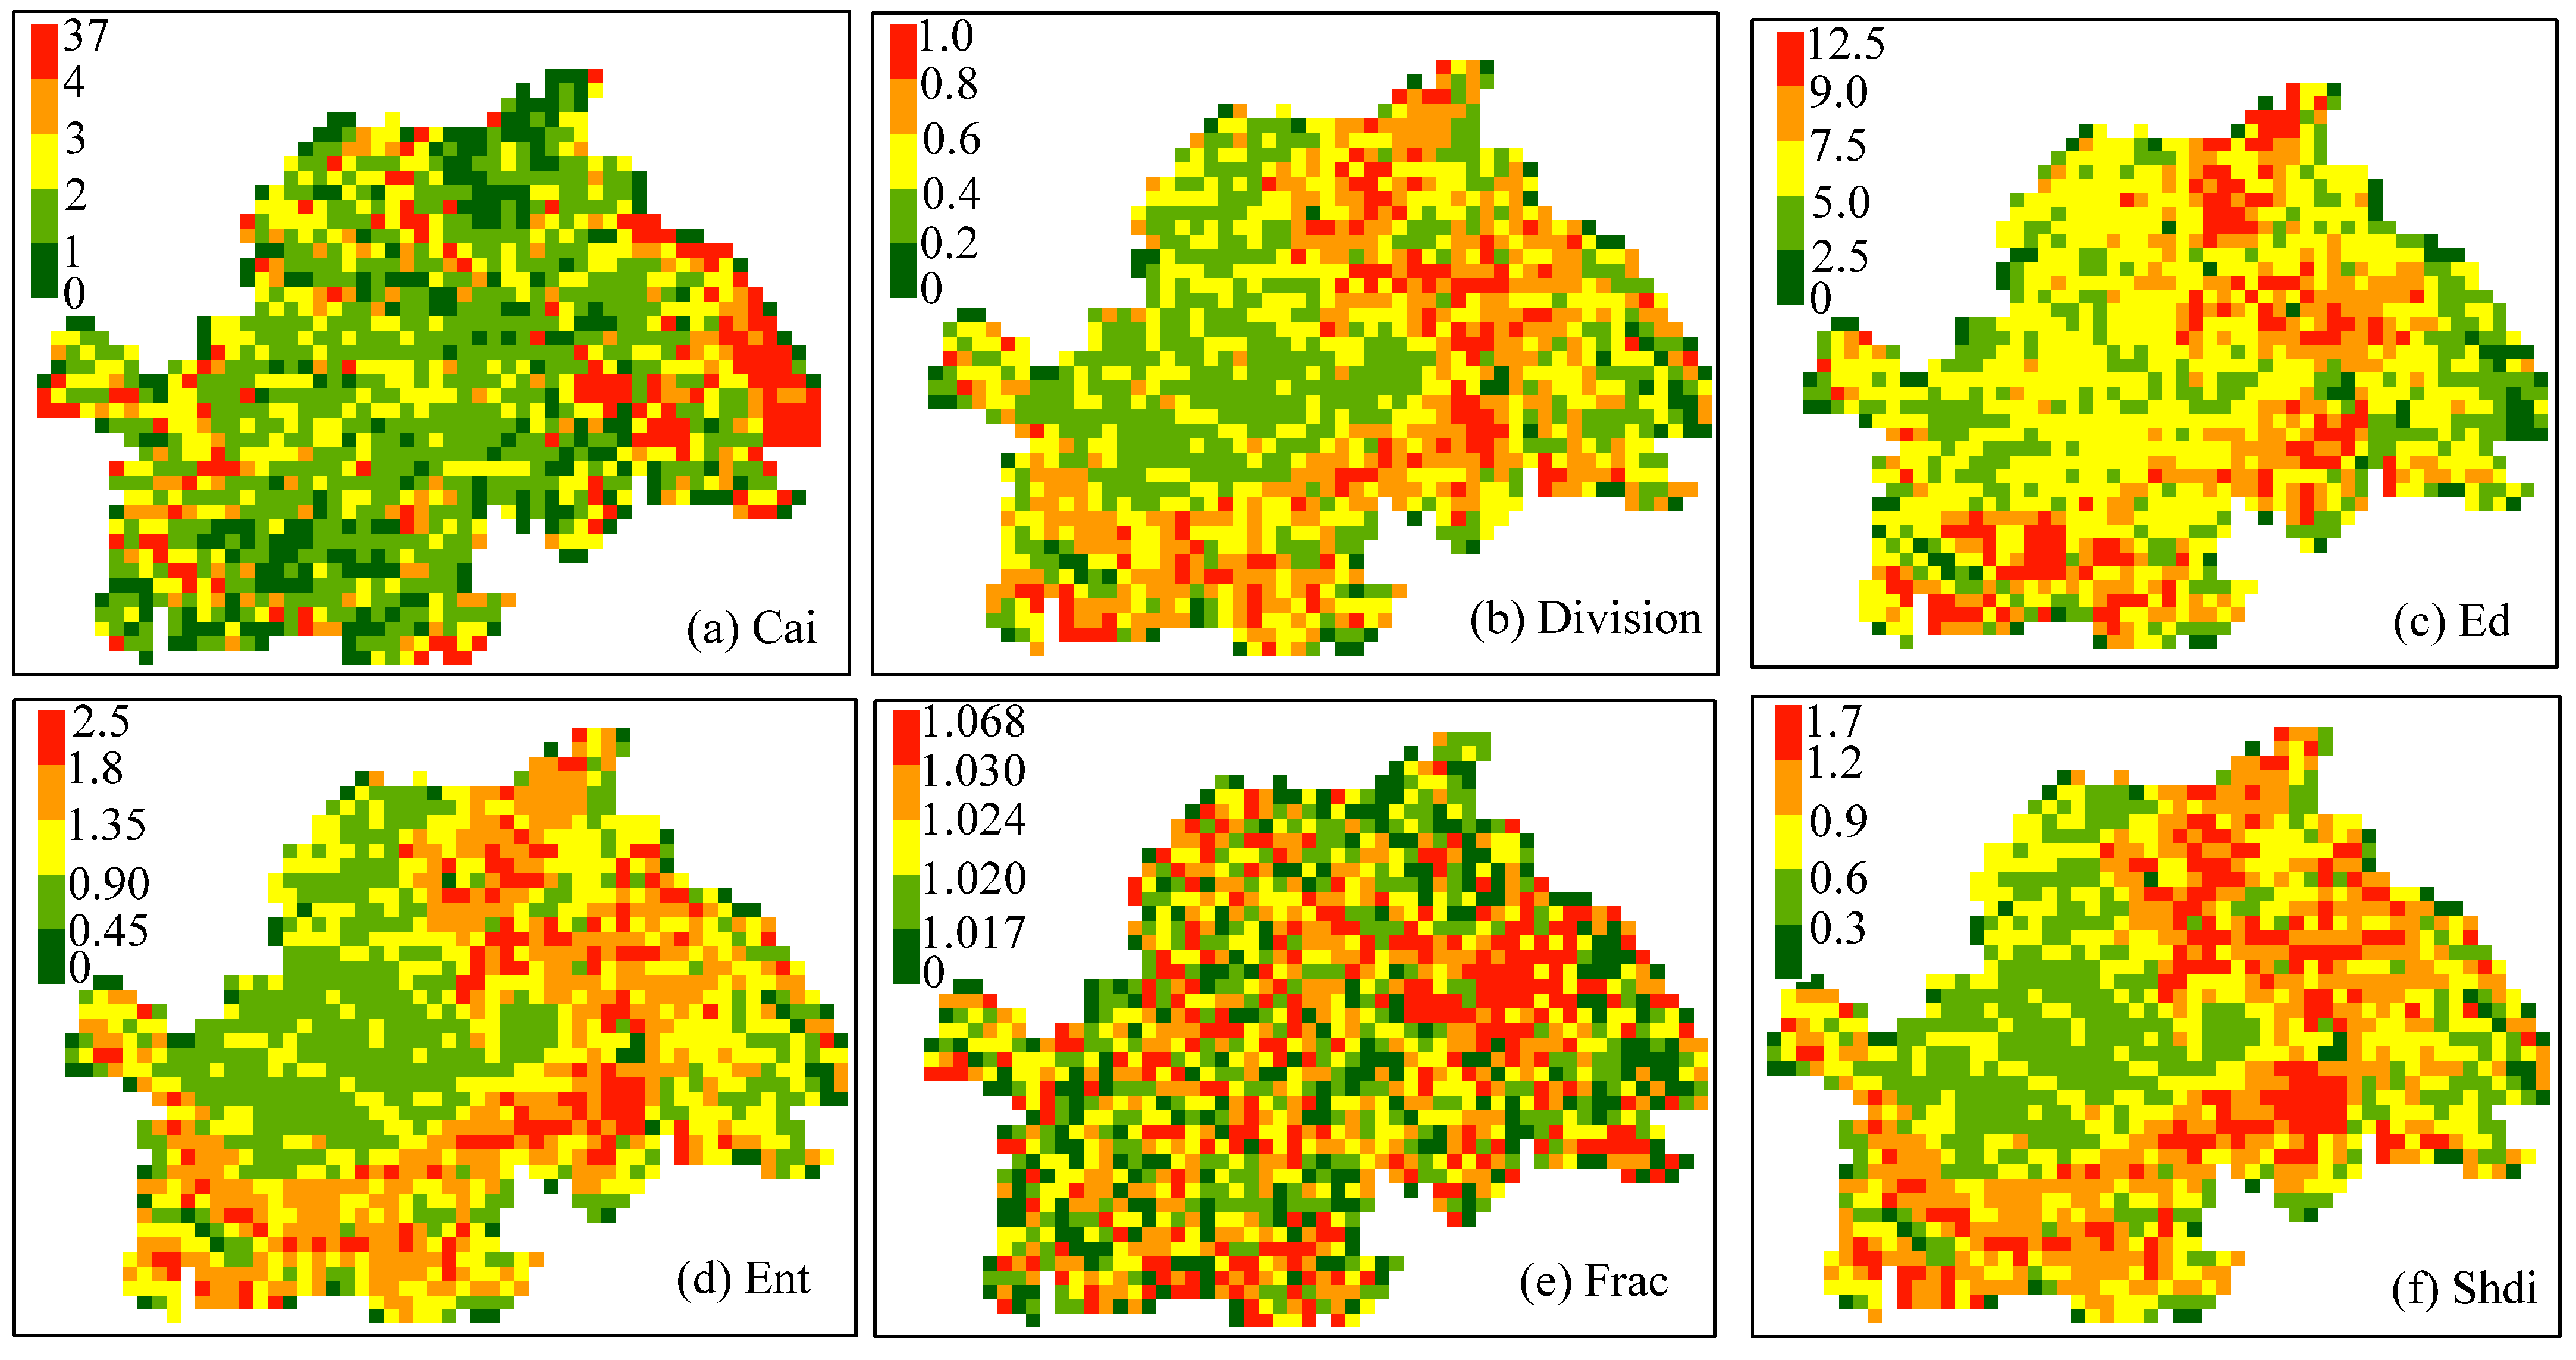
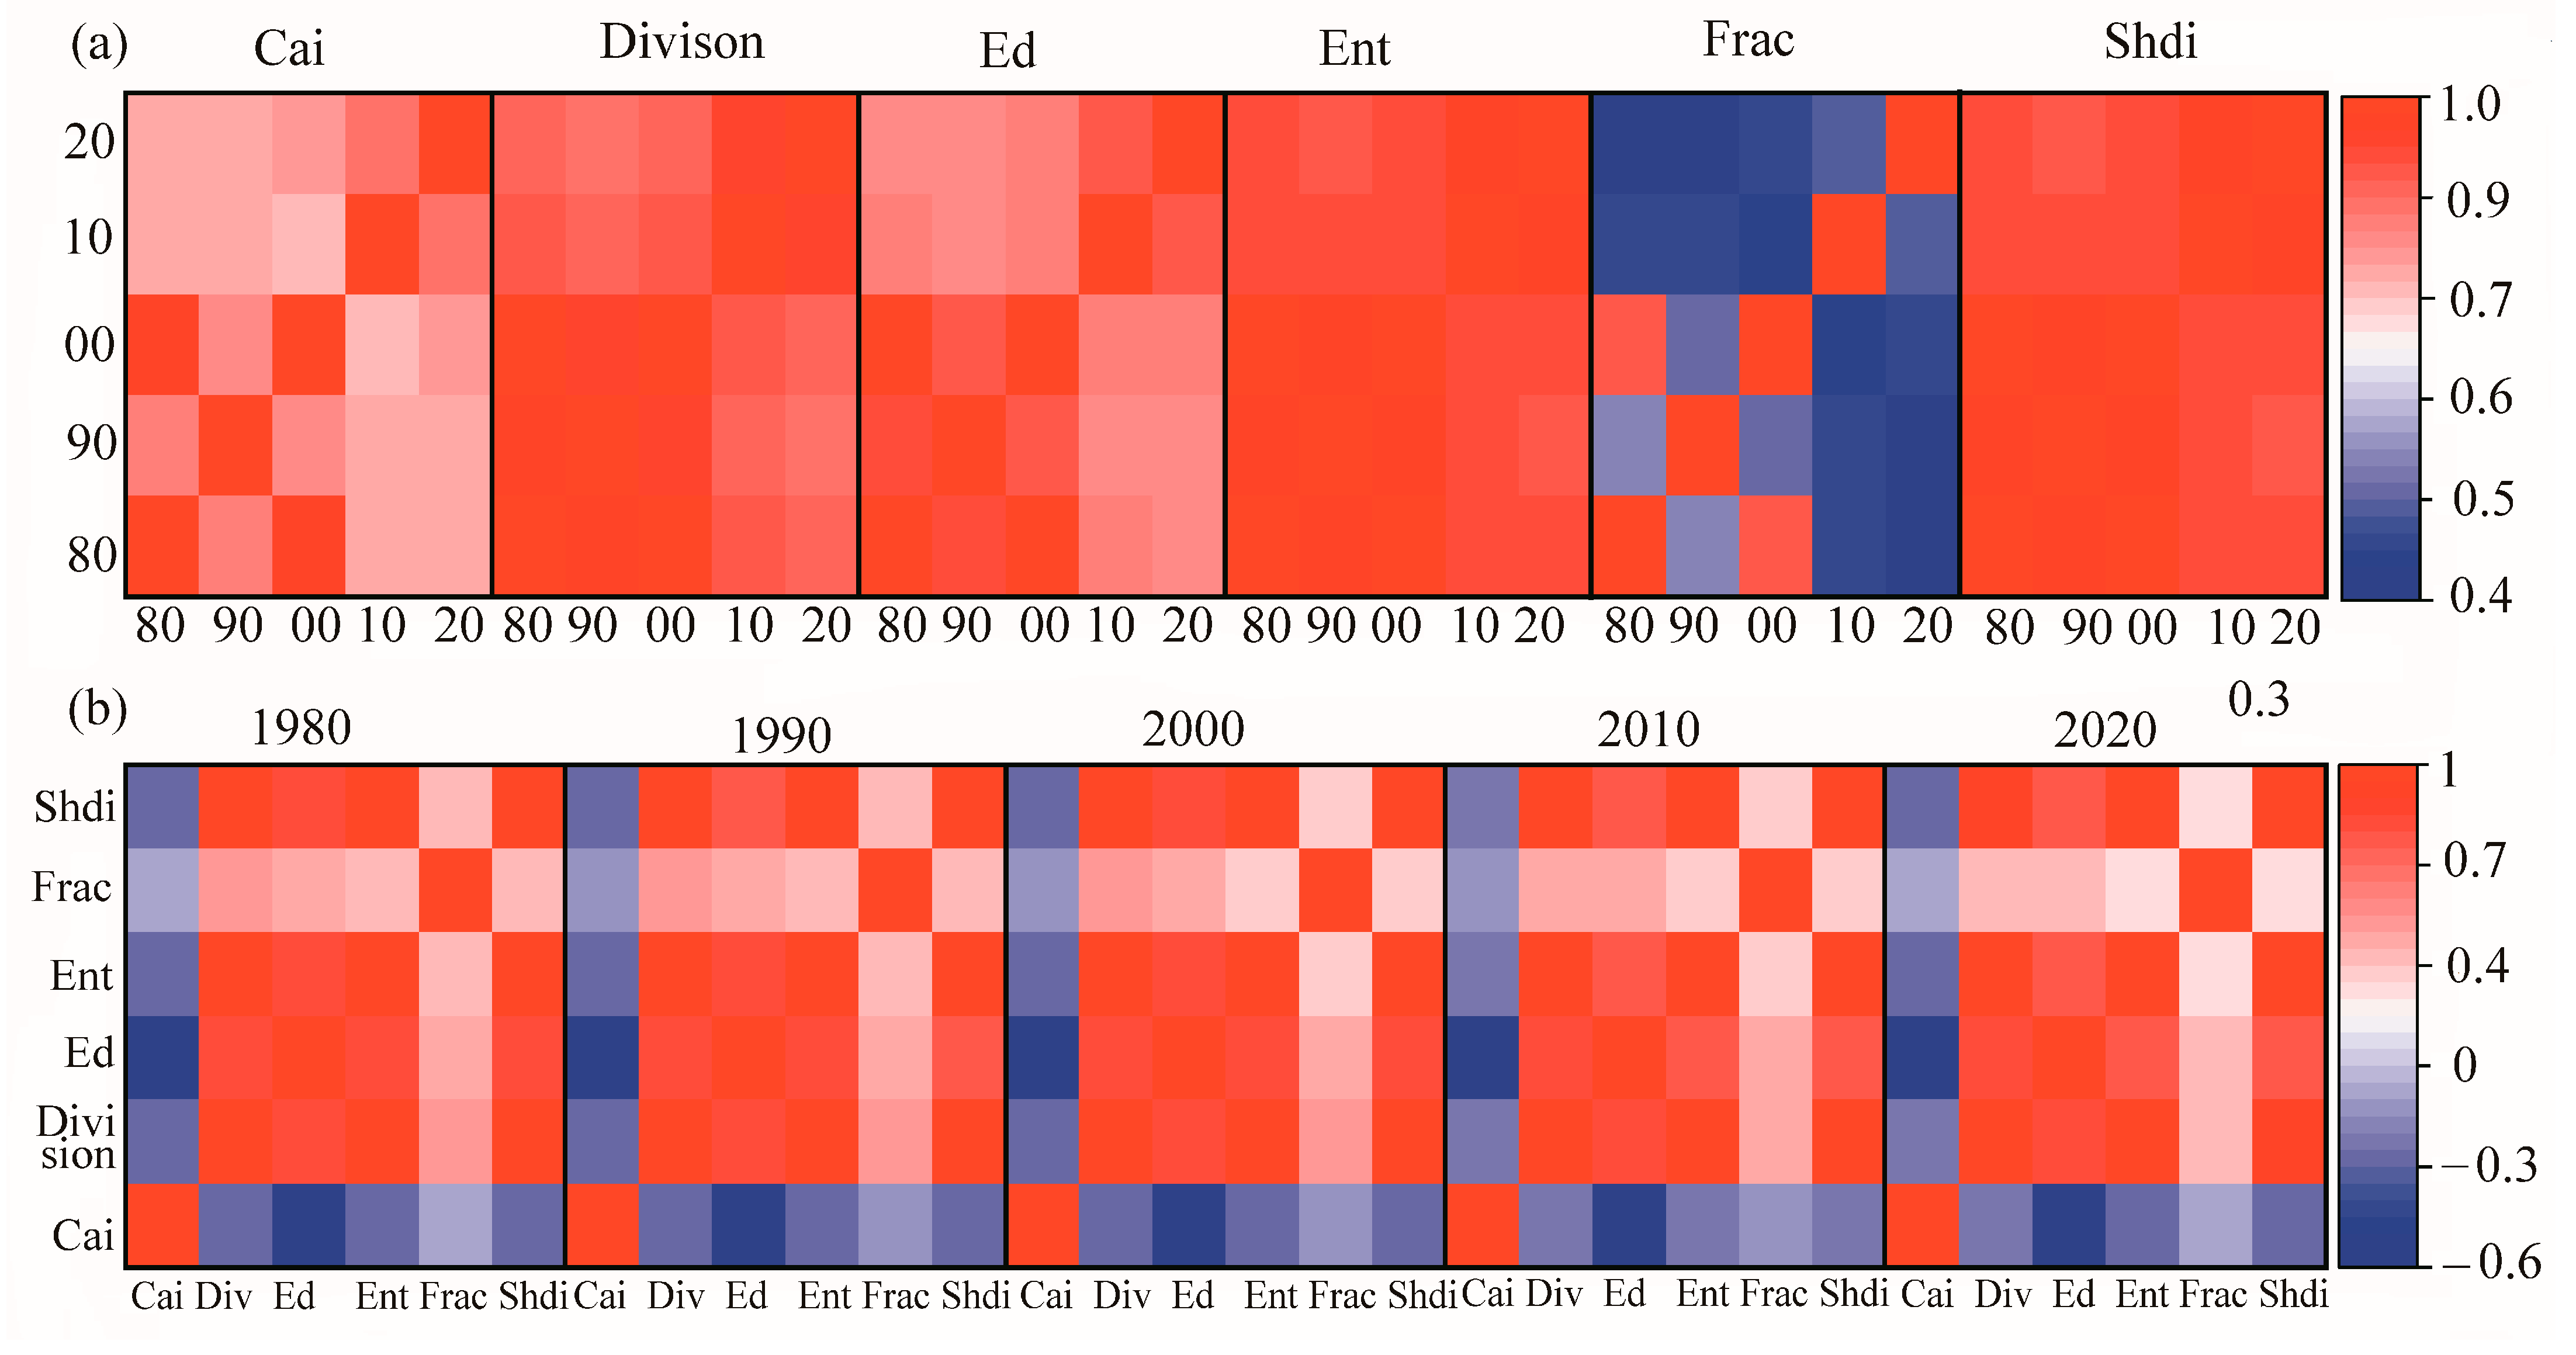
At the raster scale, high Cai was mainly distributed in the eastern coastal areas and major lake regions (Hongze Lake area). High Division was mainly associated with forests, grasslands, paddy fields, and water bodies, with low fragmentation for drylands (Figure 6). Division gradually increased over time, indicating an increase in patch isolation. The spatial and temporal trends of Ed, Ent, Frac, and Shi were similar to those of Division (Figure 6 and Figure 7, and Table 4), indicating that the degree of landscape fragmentation in the study area was being exacerbated. As shown in Figure 8a, the same indices presented high similarity among different years, indicating that although landscape fragility was increasing, the overall distribution pattern of landscape ecological security did not change. The correlation of Frac between different periods was relatively low (Figure 8a), which may be related to its complex calculation process. In addition to Cai, different indices also presented a high correlation (Figure 8b), indicating a significant correlation between the indices despite their classification under different landscape categories. All landscape indices showed an increasing trend in the study area (Table 4), indicating that the impact of human activities on the study area became increasingly evident and landscape fragmentation was being aggravated.
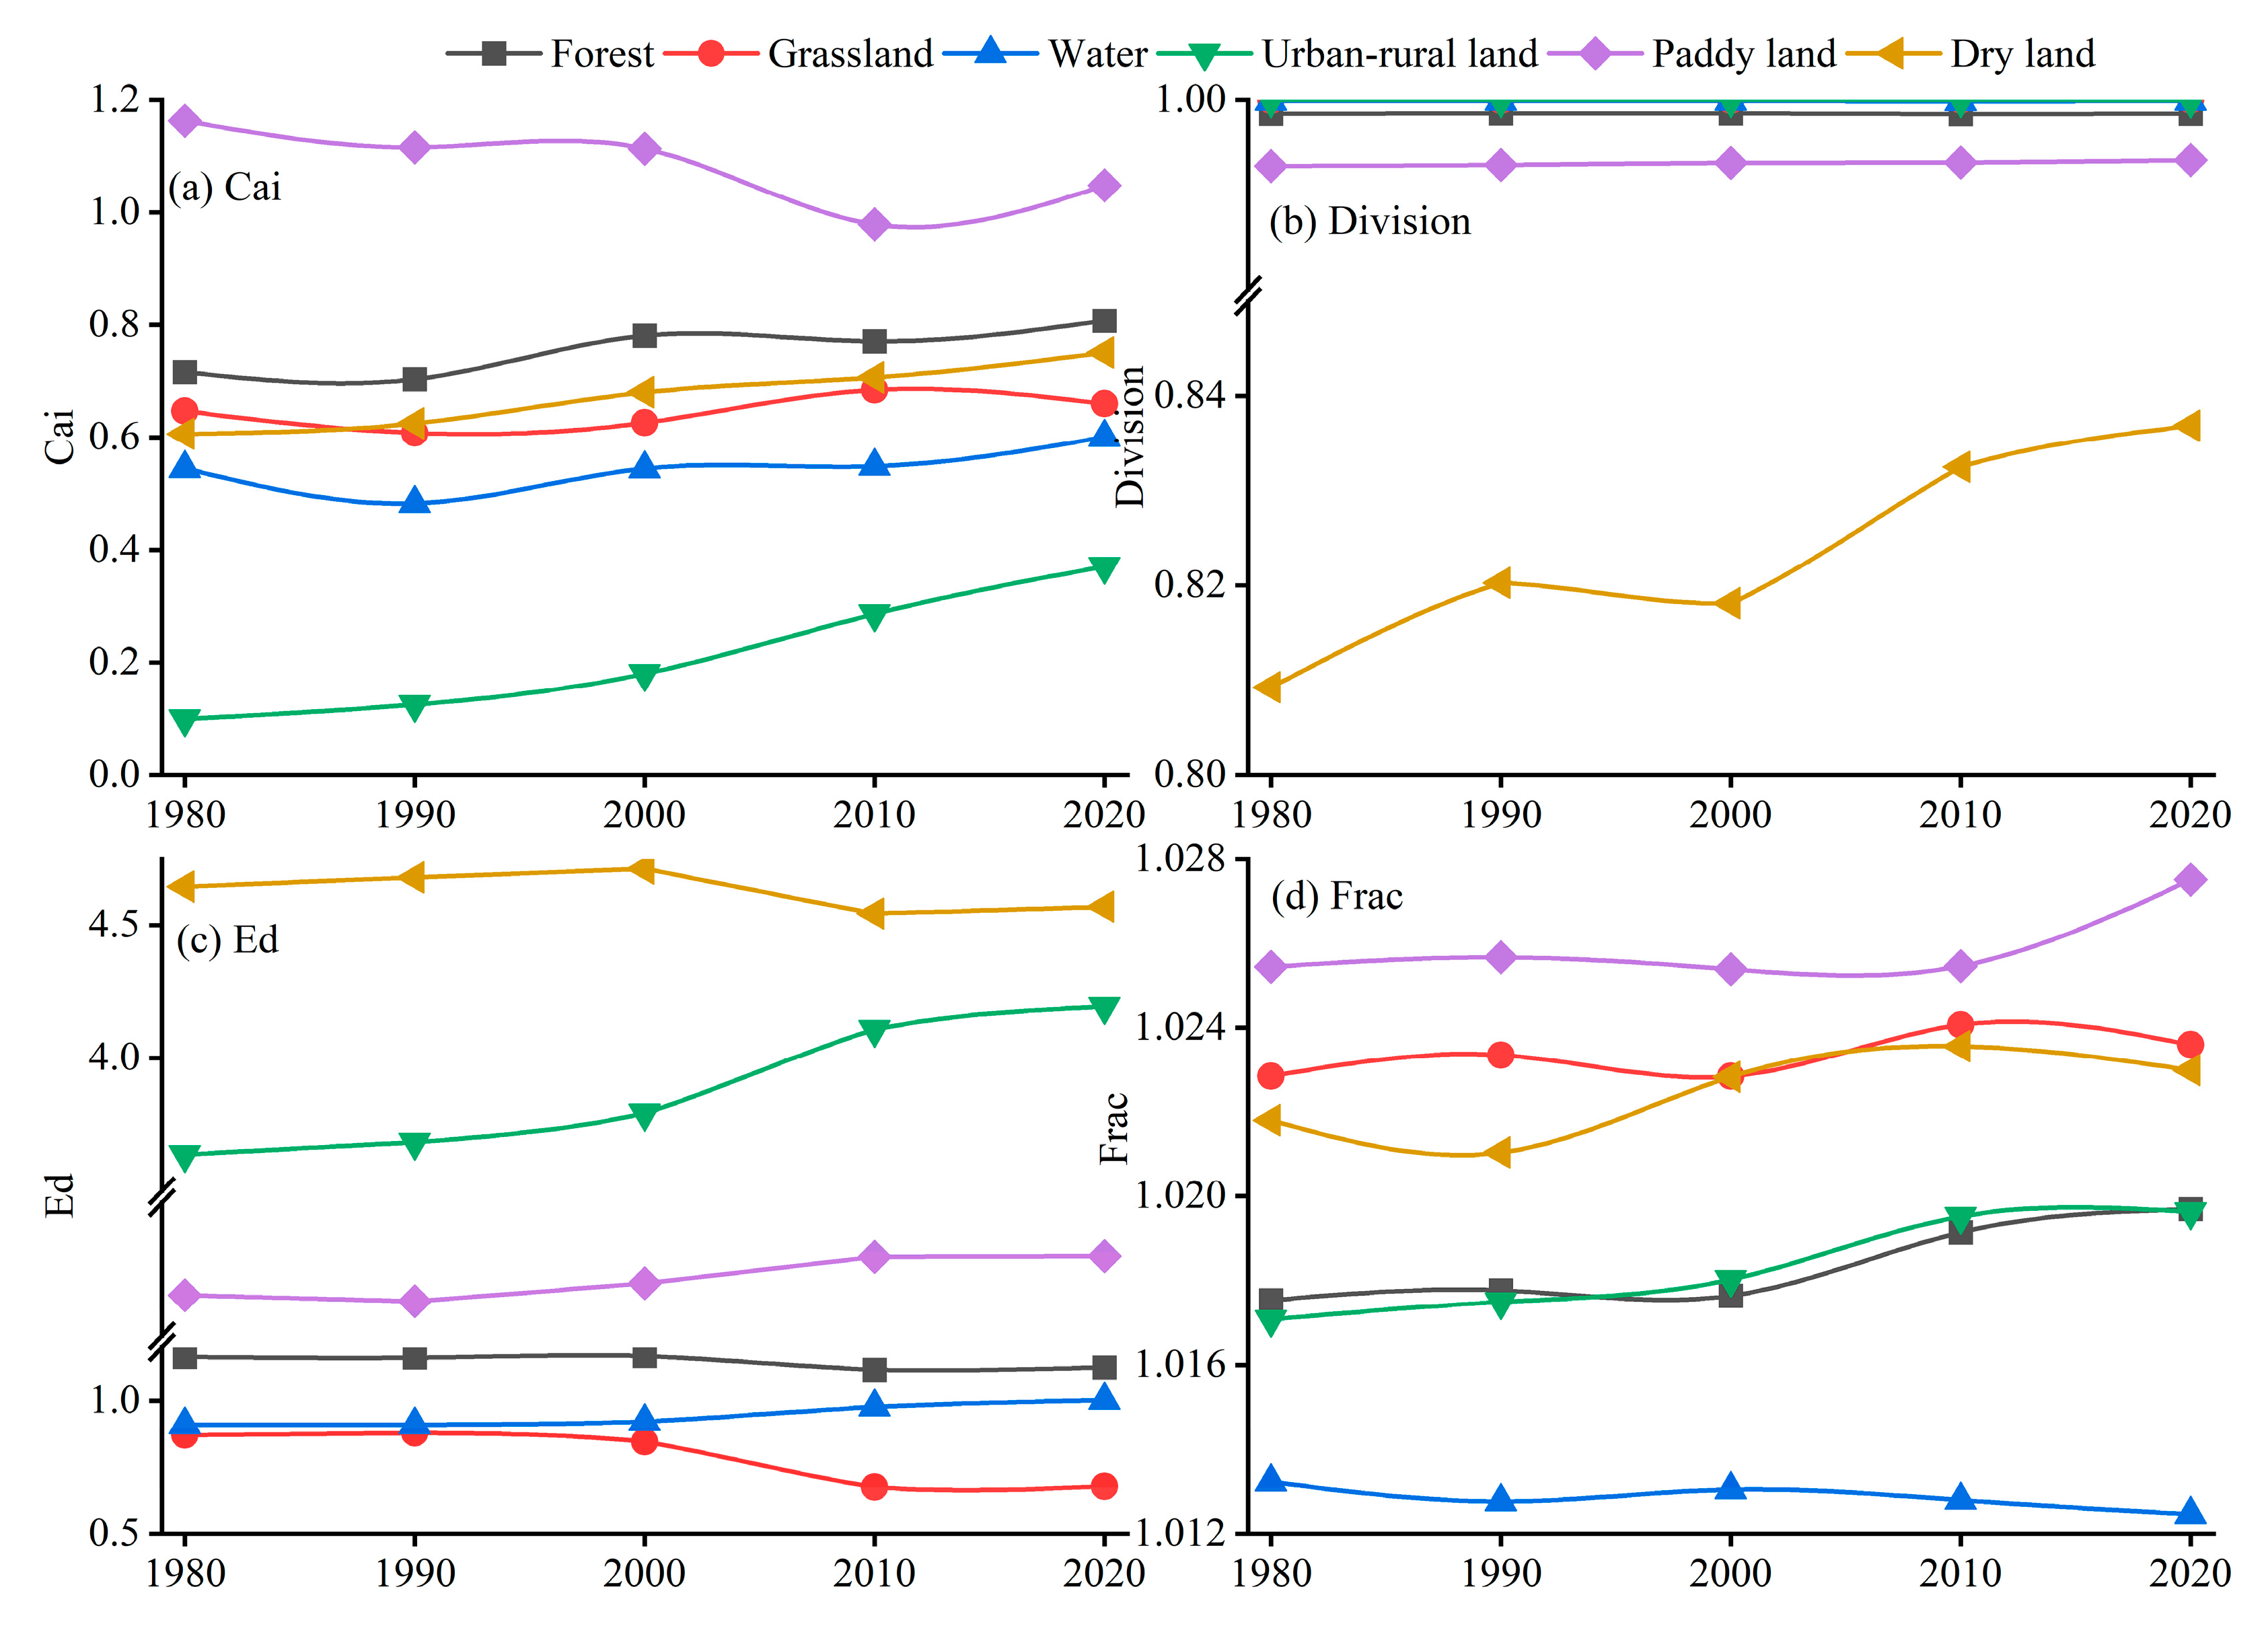
The change in the landscape index at the class scale is shown in Figure 9. Water has the lowest Division, indicating higher continuity and cohesion compared with other landscape elements. Forests and water exhibit an increasing trend in the Cai and Fd, suggesting an increase in the size, distribution, and shape complexity of their core areas. The Division and Ed show a slight decrease, implying blurred boundaries for forests and water. This may be due to both artificial and natural factors, resulting in an increased transition zone and reduced degree of separation. Drylands have a larger Cai and Fd compared with other land use types, indicating a larger area and relatively connected core areas within the overall landscape. Drylands and grasslands show increasing trends in the Cai, Division, and Fd, reflecting increased complexity and variability in dryland and grassland landscapes. The Ed for drylands and grasslands exhibits a decreasing trend, suggesting reduced boundaries between them and other landscape types, possibly due to human activities or natural succession. Notably, drylands demonstrate a significant increase in the Division, indicating a significant increase in landscape fragmentation over a certain period. Paddy fields exhibit higher Ed and lower Division compared with other land use types, indicating more boundaries and relatively less fragmentation within their interior. The increase in Division, Ed, and Fd of paddy fields likely reflects increased complexity and variability in the paddy field landscape, while the decrease in the Cai may suggest weakened connectivity within the paddy fields. Urban-rural land exhibits the lowest Cai, indicating a lack of clear and contiguous core areas, consisting instead of scattered small patches. The increasing trends in Cai, Ed, and Fd may reflect enhanced concentration and complexity within the urban-rural land, while the slight decrease in the Division may indicate a slight improvement in internal connectivity within the urban-rural land.

3.4. Impact of Landscape Pattern Indices on Ecosystem Service Values

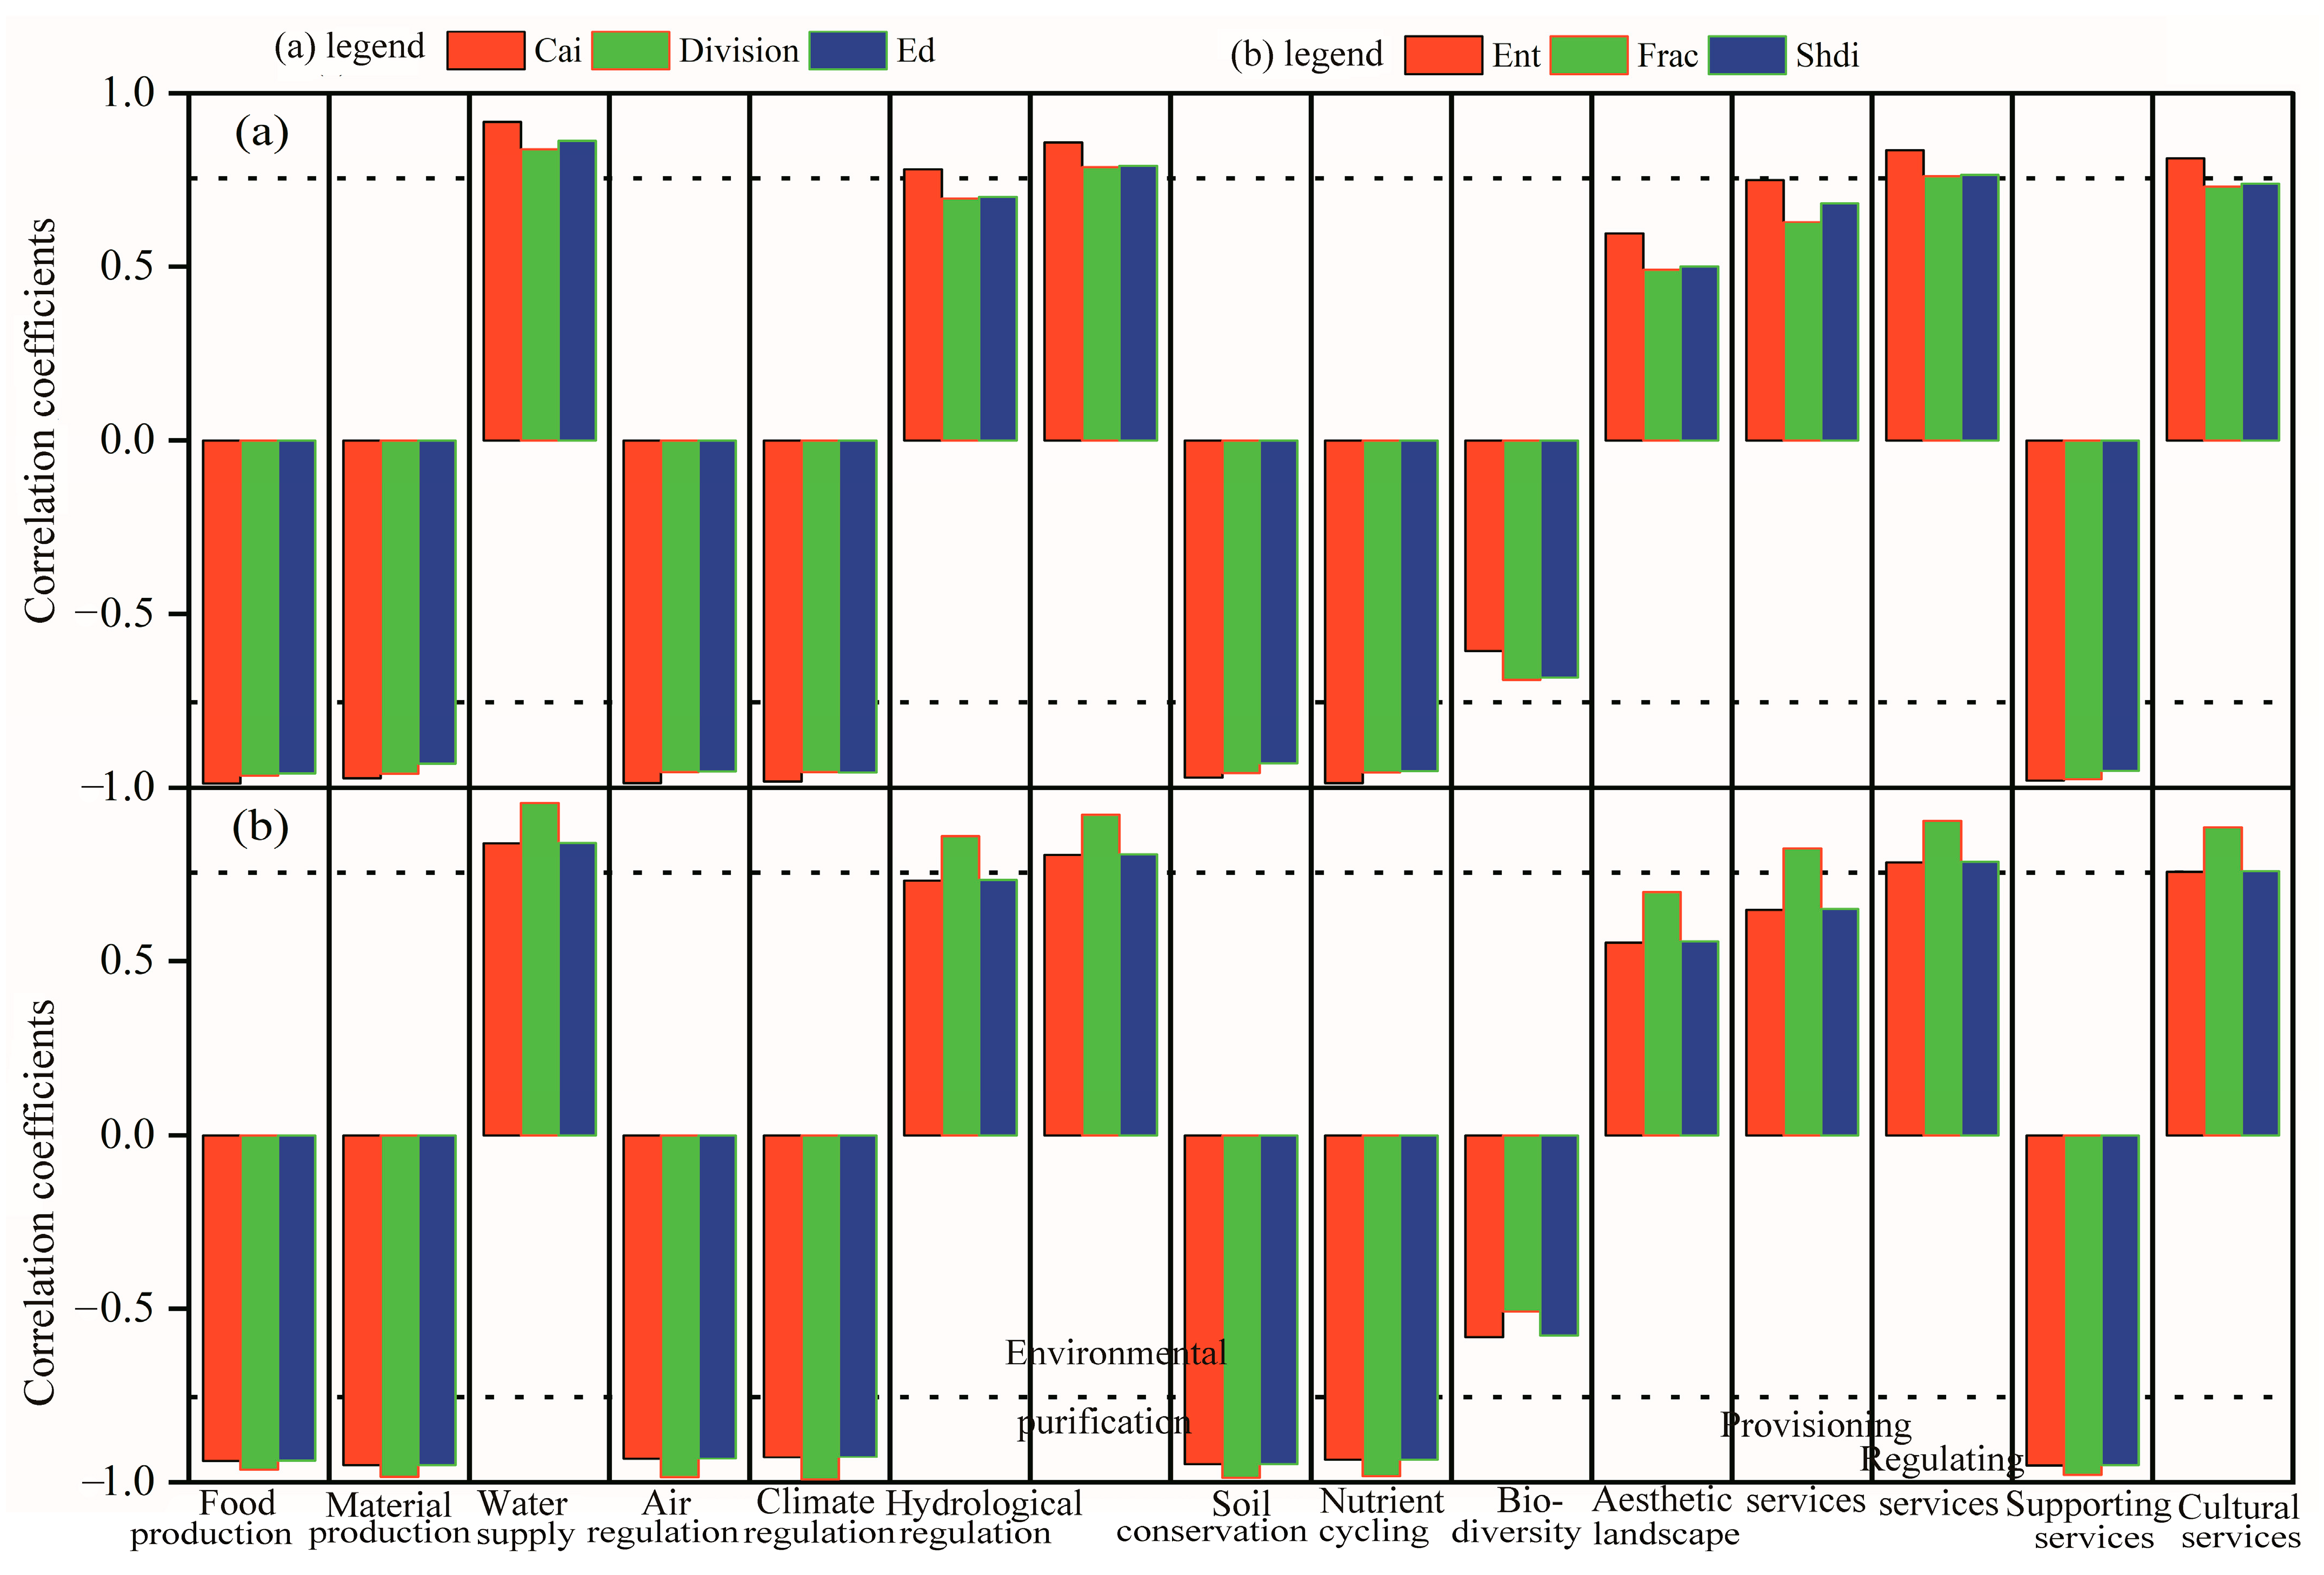
The values of both food and raw material production showed a significant negative correlation with landscape indices, indicating that landscape fragmentation can reduce their values (Figure 10). Similarly, landscape fragmentation could significantly weaken the functions of gas regulation, climate regulation, soil conservation, and nutrient cycling. Landscape indices showed a significant or insignificant positive correlation with ESVs related to the water environment (such as water supply, environmental purification, and hydrological regulation). Nevertheless, this may mean that these values were increased not by landscape fragmentation but rather by the increase in the water area of the study area due to global changes. Similarly, the positive correlation between landscape indices and provisioning services, regulating services, and aesthetic landscape services is attributable to the increase in the water area, which not only increased ESVs but also masked the loss of ESVs caused by landscape fragmentation.

4. Discussion

On the whole, ESVs in the Huaihe River Eco-Economic Belt showed an increasing trend, increasing from CNY 462.669 billion in 1980 to CNY 479.695 billion in 2020. Among the four services, regulating services had the largest proportion, accounting for over 75% in all years. From the ESVs trend, ecosystem services can be divided into two categories: services related to the water environment and services not related to the water environment. The values of services not related to the water environment, such as food production, raw material production, gas regulation, climate regulation, soil conservation, nutrient cycling maintenance, and biodiversity, showed a continuous downward trend, which was related to the reduction in forests, grasslands, and farmland. Between 1980 and 2020, the areas of drylands, grasslands, and paddy fields decreased by 7057 km2, 2708 km2, and 1874 km2, respectively, with most of them being converted to urban and rural land, resulting in a rapid decrease in the value of services not related to the water environment. The values of services related to the water environment, such as water resource supply, hydrological regulation, and environmental purification, showed a trend of rapid increase, mainly due to the increase in the water area. From 1980 to 2020, the water area increased from 13,613 km2 to 14,949 km2—an increase of nearly 9%. At the same time, hydrological regulation in the Huaihe River Eco-Economic Belt accounted for more than 50% of the ESVs, which also led to a significant increase in the total ESVs. Previous studies have shed light on the changes in ecosystem services and land use within this region. For instance, Fu et al. [43] found similar trends in the Huaihe River basin, with regulating services dominating the ESVs and services related to the water environment exhibiting an upward trajectory. This aligns with our findings that regulating services accounted for over 75% of the ESVs in all years and that services related to the water environment experienced a rapid increase. Furthermore, a study conducted by Sang et al. [44] explored the causes of land use change in the Huaihe River Eco-Economic Belt. They identified factors such as urbanization, agricultural expansion, and deforestation as significant drivers of land use change. These findings support our analysis, which indicates that the reduction in forests, grasslands, and farmland due to conversion to urban and rural land contributed to the decline in the value of services not related to the water environment.
With the acceleration of urbanization, large grassland and farmland areas have been transformed, and the landscape of the study area has become fragmented. The analysis revealed increasing trends of landscape indices, such as Division, Ed, Ent, Frac, and Shdi, from both spatial and temporal perspectives, indicating that the landscape pattern of the study area has the characteristics of fragmentation and heterogeneity. This may have a serious impact on the ecological environment. From the analysis of ESVs, with the fragmentation of the landscape, biodiversity in the economic zone has sharply declined, and the functions of soil conservation, nutrient cycling maintenance, and climate regulation are being lost. The relevant analysis also shows that the fragmentation of the landscape significantly reduces the value of services not related to the water environment, exerting serious effects on the ecological environment. Su et al. [45] investigated the effects of land use change on biodiversity and ecosystem services in a similar context. Their findings demonstrated the negative consequences of landscape fragmentation on the provision of ecosystem services, aligning with our results. Gutierrez-Arellano and Mulligan [46] investigated the effects of landscape fragmentation on ecosystem services in a similar context. Their findings demonstrate that landscape fragmentation negatively affects the provision of ecosystem services, leading to reduced ecological functionality. Additionally, Qi et al. [47] conducted a study on the causes of land use change and the associated impacts on ecosystem services. They found that urbanization and deforestation were significant drivers of landscape fragmentation and subsequent degradation of ecosystem services. Zhuang et al. [48] conducted a comprehensive analysis of land use change and its impacts on ecosystem services in the Huaihe River Eco-Economic Belt. Their findings highlighted the significant influence of urbanization, industrial development, and agricultural intensification on ecosystem services and emphasized the need for sustainable land management practices. Additionally, the fragmentation of the landscape is positively correlated with the ESVs, which is attributable to the increase in the ESVs by the increase in the water area. At the same time, this also conceals the signal of the loss of ESVs caused by the fragmentation of the landscape. Therefore, it is extremely necessary to analyze each type of ecosystem service separately because the total service value will mask the signal of a sharp decline in individual ecosystem services.
Although the ESVs has increased by approximately 4% from 1980 to 2020, it does not indicate an improvement in the ecological environment of the study area. The landscape index also illustrates this issue. The ecological environment of the study area is becoming fragmented, and functions such as biodiversity are being lost. This seemingly contradictory conclusion may be related to the equivalence factor of the ESVs. Although the ESVs Table of Xie et al. [38] was corrected using statistical data, the value of hydrological regulation still accounts for over 50% of all 11 ecosystem services, and the increase in the water area leads to a sharp increase in the value of ecosystem services related to the water environment, which masks signals of decreases in the values of other services not related to the water environment. The equivalent factor method is widely used owing to its advantages of simple operation and comparable results. However, this study revealed that using the same correction factor for each ESVs can introduce large uncertainties in the results. The assumption of equal weighting of ecosystem services may oversimplify the complexity of ecological systems, as different services may have varying degrees of importance and interconnections [49]. Moreover, using a single correction factor for each ESVs can introduce large uncertainties in the results, especially when regional variations in ecological characteristics and land use dynamics are not considered [50]. To address these limitations, regionalization of equivalent factors has been proposed as a way to capture the unique ecological contexts and land use patterns of specific regions [51]. By incorporating region-specific data and considering the relative importance of different ecosystem services, a more accurate and nuanced evaluation of ESVs can be achieved [52]. Therefore, the regionalization of equivalent factors remains the main obstacle to the evaluation of ESVs.
In our study, it is important to acknowledge that we only analyzed the relationship between landscape metrics and ecosystem services at the landscape level, which includes various land covers. Our analysis specifically focused on investigating the influence of landscape indices on ecological service values at the landscape scale, which introduces a degree of uncertainty into the findings. For future research, it is essential to explore the connection between the landscape matrix and ecological service values at the class level to obtain a more comprehensive understanding of their interrelationships.

5. Conclusions

In this study, the ESVs of the Huaihe River Eco-Economic Belt was estimated using the EFM based on land use data. Through the estimation, the change characteristics and relationships of landscape pattern indices were analyzed. The following main conclusions can be drawn from the results:
(1) The ESVs of the Huaihe Eco-Economic Belt has significantly increased, from CNY 462.69 billion in 1980 to CNY 476.95 billion in 2020. In terms of the proportion of ecological services, provisioning services, regulating services and cultural services show an increasing trend, while supporting services show a decreasing trend. The values of ecosystem services not related to the water environment, such as food and raw material generation, gas regulation, climate regulation, soil conservation, nutrient cycling, and biodiversity, show a downward trend, while the ecosystem services related to the water environment, such as water resource supply, environmental purification, hydrological regulation, and aesthetic landscapes, show an increasing trend.
(2) The spatial patterns of Division, Ed, Ent, Fd, and Shdi show high consistency, with high-value areas mainly distributed in forests, grasslands, paddy fields, and water bodies, and low-value areas mainly located in drylands. The landscape index of the Huaihe Eco-Economic Belt is increasing both temporally and spatially, and landscape fragmentation in the study area is intensifying. Water exhibits higher continuity and coherence, with forests and water showing an increasing trend in the size, distribution, and shape complexity of their core areas. Drylands and grasslands experience increased complexity and variability, accompanied by reduced boundaries. Paddy fields have more boundaries and relatively less fragmentation within their interior. Urban-rural land lacks clear and contiguous core areas but displays enhanced concentration and complexity, with a slight improvement in internal connectivity.
(3) Landscape fragmentation significantly reduces food and raw material production, gas regulation, climate regulation, soil conservation, nutrient cycling, and biodiversity. The landscape index is positively correlated with the total ESVs (provisioning services, regulating services and cultural services, water resource supply, environmental purification, and hydrological regulation), which is related to the increasing water areas covering the loss of ESVs caused by landscape fragmentation.

Author Contributions

Conceptualization, Z.L. and Z.W.; methodology, Z.W.; software, H.W.; validation, H.W. and Z.W.; formal analysis, Z.L.; investigation, Z.L.; resources, Y.P.; data curation, R.F.; writing—original draft preparation, Z.W.; writing—review and editing, Z.W.; visualization, H.W.; supervision, H.W.; project administration, Y.P.; funding acquisition, H.W. All authors have read and agreed to the published version of the manuscript.

Funding

This research was funded by the Ministry of Education Humanities and Social Sciences General Project of China (grant number: 21YJCZH156), Natural Science Foundation of the Jiangsu Higher Education Institutions of China (grant number: 20KJD170003), and Jiangsu College Student Innovation and Entrepreneurship Training Program (grant number: 202210323047Y, 202310323028Z).

Data Availability Statement

The data that support the findings of this study are available from the corresponding author upon reasonable request.

Acknowledgments

The authors would like to thank three reviewers who participated in the review.

Conflicts of Interest

The authors declare no conflict of interest.

References

  1. Millennium Ecosystem Assessment. Ecosystems and Human Well-Being: Synthesis; Island Press: Washington, DC, USA, 2005; Available online: https://www.millenniumassessment.org/documents/document.356.aspx.pdf (accessed on 4 May 2023).
  2. Daily, G.C. Nature’s Services: Societal Dependence on Natural Ecosystems; Island Press: Washington, DC, USA, 1997. [Google Scholar]
  3. Costanza, R.; d’Arge, R.; de Groot, R.; Farber, S.; Grasso, M.; Hannon, B.; Limburg, K.; Naeem, S.; O’Neill, R.V.; Paruelo, J.; et al. The value of the world’s ecosystem services and natural capital. Nature 1997, 387, 253–260. [Google Scholar] [CrossRef]
  4. Foley, J.A.; DeFries, R.; Asner, G.P.; Barford, C.; Bonan, G.; Carpenter, S.R.; Chapin, F.S.; Coe, M.T.; Daily, G.C.; Gibbs, H.K.; et al. Global consequences of land use. Science 2005, 309, 570–574. [Google Scholar] [CrossRef] [Green Version]
  5. Daily, G.C.; Polasky, S.; Goldstein, J.; Kareiva, P.M.; Mooney, H.A.; Pejchar, L.; Ricketts, T.H.; Salzman, J.; Shallenberger, R. The value of nature and the nature of value. Science 2000, 289, 395–396. [Google Scholar] [CrossRef] [PubMed] [Green Version]
  6. Tallis, H.; Kareiva, P.; Marvier, M.; Chang, A. An ecosystem services framework to support both practical conservation and economic development. Proc. Natl. Acad. Sci. USA 2008, 105, 9457–9464. [Google Scholar] [CrossRef]
  7. Costanza, R.; de Groot, R.; Sutton, P.; van der Ploeg, S.; Anderson, S.J.; Kubiszewski, I.; Farber, S.; Turner, R.K. Changes in the global value of ecosystem services. Glob. Environ. Change 2014, 26, 152–158. [Google Scholar] [CrossRef]
  8. Meraj, G.; Singh, S.K.; Kanga, S.; Islam, S.M.N. Modeling on comparison of ecosystem services concepts, tools, methods and their ecological-economic implications: A review. Model. Earth Syst. Environ. 2022, 8, 15–34. [Google Scholar] [CrossRef]
  9. Wainger, L.A.; King, D.M.; Mack, R.N.; Price, E.W.; Maslin, T. Can the concept of ecosystem services be practically applied to improve natural resource management decisions? Ecol. Econ. 2010, 69, 978–987. [Google Scholar] [CrossRef]
  10. Zhao, X.; Wang, J.; Su, J.; Sun, W. Ecosystem service value evaluation method in a complex ecological environment: A case study of Gansu Province, China. PLoS ONE 2021, 16, e0240272. [Google Scholar] [CrossRef]
  11. Yang, Y.; Song, G.; Lu, S. Study on the ecological protection redline (EPR) demarcation process and the ecosystem service value (ESV) of the EPR zone: A case study on the city of Qiqihaer in China. Ecol. Indic. 2020, 109, 105754. [Google Scholar] [CrossRef]
  12. Xie, G.; Zhang, C.; Zhen, L.; Zhang, L. Dynamic changes in the value of China’s ecosystem services. Ecosyst. Serv. 2017, 26, 146–154. [Google Scholar] [CrossRef]
  13. Chen, H.; Yan, W.; Li, Z.; Wende, W.; Xiao, S.; Wan, S.; Li, S. Spatial patterns of associations among ecosystem services across different spatial scales in metropolitan areas: A case study of Shanghai, China. Ecol. Indic. 2022, 136, 108682. [Google Scholar] [CrossRef]
  14. Boithias, L.; Terrado, M.; Corominas, L.; Ziv, G.; Kumar, V.; Marqués, M.; Acuña, V. Analysis of the uncertainty in the monetary valuation of ecosystem services—A case study at the river basin scale. Sci. Total Environ. 2016, 543, 683–690. [Google Scholar] [CrossRef] [PubMed]
  15. Jia, Y.; Liu, Y.; Zhang, S. Evaluation of agricultural ecosystem service value in arid and semiarid regions of northwest China based on the equivalent factor method. Environ. Process. 2021, 8, 713–727. [Google Scholar] [CrossRef]
  16. Kang, N.; Hou, L.; Huang, J.; Liu, H. Ecosystem services valuation in China: A meta-analysis. Sci. Total Environ. 2022, 809, 151122. [Google Scholar] [CrossRef]
  17. Wang, Z.; Cao, J.; Zhu, C.; Yang, H. The impact of land use change on ecosystem service value in the upstream of Xiong’an new area. Sustainability 2020, 12, 5707. [Google Scholar] [CrossRef]
  18. Daily, G.C.; Polasky, S.; Goldstein, J.; Kareiva, P.M.; Mooney, H.A.; Pejchar, L.; Ricketts, T.H.; Salzman, J.; Shallenberger, R. Ecosystem services in decision making: Time to deliver. Front. Ecol. Environ. 2009, 7, 21–28. [Google Scholar] [CrossRef] [Green Version]
  19. Nelson, E.; Mendoza, G.; Regetz, J.; Polasky, S.; Tallis, H.; Cameron, D.R.; Chan, K.M.A.; Daily, G.C.; Goldstein, J.; Kareiva, P.M.; et al. Modeling multiple ecosystem services, biodiversity conservation, commodity production, and tradeoffs at landscape scales. Front. Ecol. Environ. 2009, 7, 4–11. [Google Scholar] [CrossRef]
  20. Bagstad, K.J.; Semmens, D.J.; Waage, S.; Winthrop, R.; Jaworski, D. Ecosystem services valuation to support decisionmaking on public lands—A case study of the San Pedro River watershed in Arizona. J. Environ. Manag. 2013, 117, 211–221. [Google Scholar]
  21. Zhou, Z.; Sun, X.; Zhang, X.; Wang, Y. Inter-regional ecological compensation in the Yellow River Basin based on the value of ecosystem services. J. Environ. Manag. 2022, 322, 116073. [Google Scholar] [CrossRef]
  22. Yu, H.; Chen, C.; Shao, C. Spatial and temporal changes in ecosystem service driven by ecological compensation in the Xin’an River Basin, China. Ecol. Indic. 2023, 146, 109798. [Google Scholar] [CrossRef]
  23. Xing, L.; Xue, M.; Wang, X. Spatial correction of ecosystem service value and the evaluation of eco-efficiency: A case for China’s provincial level. Ecol. Indic. 2018, 95, 841–850. [Google Scholar] [CrossRef]
  24. Wen, Y.; Li, H.; Zhang, X.; Li, T. Ecosystem services in Jiangsu province: Changes in the supply and demand patterns and its influencing factors. Front. Env. Sci. 2022, 10, 931735. [Google Scholar] [CrossRef]
  25. Luo, Q.; Zhou, J.; Li, Z.; Yu, B. Spatial differences of ecosystem services and their driving factors: A comparation analysis among three urban agglomerations in China’s Yangtze River Economic Belt. Sci. Total Environ. 2020, 725, 138452. [Google Scholar] [CrossRef] [PubMed]
  26. Kang, L.; Jia, Y.; Zhang, S. Spatiotemporal distribution and driving forces of ecological service value in the Chinese section of the “Silk Road Economic Belt”. Ecol. Indic. 2022, 141, 109074. [Google Scholar] [CrossRef]
  27. Xing, L.; Zhu, Y.; Wang, J. Spatial spillover effects of urbanization on ecosystem services value in Chinese cities. Ecol. Indic. 2021, 121, 107028. [Google Scholar] [CrossRef]
  28. Li, Y.; Zhan, J.; Liu, Y.; Zhang, F.; Zhang, M. Response of ecosystem services to land use and cover change: A case study in Chengdu City. Resour. Conserv. Recy. 2018, 132, 291–300. [Google Scholar] [CrossRef]
  29. Raudsepp-Hearne, C.; Peterson, G.D.; Bennett, E.M. Ecosystem Service Bundles for Analyzing Tradeoffs in Diverse Landscapes. Proc. Natl. Acad. Sci. USA 2010, 107, 5242–5247. [Google Scholar] [CrossRef]
  30. Ricketts, T.H.; Daily, G.C.; Ehrlich, P.R.; Michener, C.D. Economic Value of Tropical Forest to Coffee Production. Proc. Natl. Acad. Sci. USA 2004, 101, 12579–12582. [Google Scholar] [CrossRef]
  31. Kremen, C.; Williams, N.M.; Thorp, R.W.; Toyama, N. Crop Pollination from Native Bees at Risk from Agricultural Intensification. Proc. Natl. Acad. Sci. USA 2002, 99, 16812–16816. [Google Scholar] [CrossRef]
  32. Fahrig, L. Effects of Habitat Fragmentation on Biodiversity. Annu. Rev. Ecol. Evol. Syst. 2003, 34, 487–515. [Google Scholar] [CrossRef] [Green Version]
  33. Grêt-Regamey, A.; Rabe, S.E.; Crespo, R.; Lautenbach, S.; Ryffel, A.; Schlup, B. On the importance of non-linear relationships between landscape patterns and the sustainable provision of ecosystem services. Landsc. Ecol. 2014, 29, 201–212. [Google Scholar] [CrossRef]
  34. Wang, H.; Zhang, M.; Wang, C.; Wang, K.; Wang, C.; Li, Y.; Zhou, Y. Spatial and temporal changes of landscape patterns and their effects on ecosystem services in the huaihe river basin, China. Land 2022, 11, 513. [Google Scholar] [CrossRef]
  35. Wen, J.; Li, R. Temporal and spatial evolution of ecosystem service value and its response to landscape pattern change in Guizhou Province, China. Chin. J. Appl. Ecol. 2022, 33, 3075–3086. (In Chinese) [Google Scholar]
  36. Shao, D.; Wu, D. Analysis on the effect of landscape fragmentation on ecosystem service value: A case study of Suzhou. Resour. Environ. Yangtze Basin 2020, 29, 2436–2449. (In Chinese) [Google Scholar]
  37. Zheng, B.; Huang, Q.; Tao, L.; Xu, X.; Ye, H. Landscape pattern change and its impacts on the ecosystem services value in southern Jiangxi Province. Acta Ecol. Sin. 2021, 41, 5940–5949. (In Chinese) [Google Scholar]
  38. Xie, G.; Zhang, C.; Zhang, L.; Zhao, Y. Improvement of the evaluation method for ecosystem service value based on per unit area. J. Nat. Resour. 2015, 30, 1243–1254. (In Chinese) [Google Scholar]
  39. Su, K.; Wei, D.; Lin, W. Evaluation of ecosystem services value and its implications for policy making in China–A case study of Fujian province. Ecol. Indic. 2020, 108, 105752. [Google Scholar] [CrossRef]
  40. Pan, N.; Guan, Q.; Wang, Q.; Sun, Y.; Li, H.; Ma, Y. Spatial differentiation and driving mechanisms in ecosystem service value of arid region: A case study in the middle and lower reaches of Shule River Basin, NW China. J. Clean. Prod. 2021, 319, 128718. [Google Scholar] [CrossRef]
  41. Hesselbarth, M.H.; Kuemmerle, T. landscapemetrics: An open-source R tool to calculate landscape metrics. Ecography 2018, 41, 1623–1632. [Google Scholar] [CrossRef] [Green Version]
  42. Nowosad, J.; Stepinski, T.F. Information theory as a consistent framework for quantification and classification of landscape patterns. Landsc. Ecol. 2019, 34, 2091–2101. [Google Scholar] [CrossRef] [Green Version]
  43. Fu, Y.; He, G.; Zhao, S.; Li, J. Spatio-Temporal evolution and simulation prediction of ecosystem service value in Huaihe River Basin. Pol. J. Environ. Stud. 2023. [Google Scholar] [CrossRef] [PubMed]
  44. Sang, S.; Wu, T.; Wang, S.; Yang, Y.; Liu, Y.; Li, M.; Zhao, Y. Ecological safety assessment and analysis of regional spatiotemporal differences based on earth observation satellite data in support of SDGs: The case of the huaihe river basin. Remote Sens. 2021, 13, 3942. [Google Scholar] [CrossRef]
  45. Su, S.; Xiao, R.; Jiang, Z.; Zhang, Y. Characterizing landscape pattern and ecosystem service value changes for urbanization impacts at an eco-regional scale. Appl. Geogr. 2012, 34, 295–305. [Google Scholar] [CrossRef]
  46. Gutierrez-Arellano, C.; Mulligan, M. A review of regulation ecosystem services and disservices from faunal populations and potential impacts of agriculturalization on their provision, globally. Nat. Conserv. 2018, 30, 1–39. [Google Scholar] [CrossRef] [Green Version]
  47. Qi, Z.F.; Ye, X.Y.; Zhang, H.; Yu, Z.L. Land fragmentation and variation of ecosystem services in the context of rapid urbanization: The case of Taizhou city, China. Stoch. Environ. Res. Risk Assess. 2014, 28, 843–855. [Google Scholar] [CrossRef]
  48. Zhuang, Z.; Li, C.; Hsu, W.L.; Gu, S.; Hou, X.; Zhang, C. Spatiotemporal changes in the supply and demand of ecosystem services in China’s Huai River basin and their influencing factors. Water 2022, 14, 2559. [Google Scholar] [CrossRef]
  49. Jiang, W.; Wu, T.; Fu, B. The value of ecosystem services in China: A systematic review for twenty years. Ecosyst. Serv. 2021, 52, 101365. [Google Scholar] [CrossRef]
  50. Xie, L.; Wang, H.; Liu, S. The ecosystem service values simulation and driving force analysis based on land use/land cover: A case study in inland rivers in arid areas of the Aksu River Basin, China. Ecol. Indic. 2022, 138, 108828. [Google Scholar] [CrossRef]
  51. Yang, Q.; Meng, G.T.; Gu, L.P.; Fang, B.; Zhang, Z.H.; Cai, Y.X. A systematic review on the methods of Grassland Ecosystem Services value assessment. Ecol. Sci. 2021, 40, 210–217. (In Chinese) [Google Scholar]
  52. Zhang, B.; Wang, Y.; Li, J.; Zheng, L. Degradation or restoration? the temporal-spatial evolution of ecosystem services and its determinants in the Yellow River Basin, China. Land 2022, 11, 863. [Google Scholar] [CrossRef]
Figure 1. Study area and land use in 2020.
Land 12 01405 g001
Figure 2. Change of ecosystem service values between 1980 and 2020. (a): change of food production; (b): change of material production; (c): change of water supply; (d): change of air regulation; (e): change of climate regulation; (f): change of environmental purification; (g): change of hydrological regulation; (h): change of soil conservation; (i): change of nutrient cycling; (j): change of biodiversity; (k): change of aesthetic landscape.
Land 12 01405 g002
Figure 3. Correlation of the ecosystem service value between 1980 and 2020 at the grid scale. (a): correlation between 1980 and 2020 for food production; (b): the correlation between 1980 and 2020 for material production; (c): correlation between 1980 and 2020 for water supply; (d): correlation between 1980 and 2020 for air regulation; (e): correlation between 1980 and 2020 for climate regulation; (f): correlation between 1980 and 2020 for environmental purification; (g): correlation between 1980 and 2020 for hydrological regulation; (h): correlation between 1980 and 2020 for soil conservation; (i): correlation between 1980 and 2020 for nutrient cycling; (j): correlation between 1980 and 2020 for biodiversity; (k): correlation between 1980 and 2020 for aesthetic landscape; (l): correlation between 1980 and 2020 for total ESVs.
Land 12 01405 g003
Figure 4. Spatial distribution of ecosystem service values in 2020. (a): spatial distribution of provisioning service values in 2020; (b): spatial distribution of regulating service values in 2020; (c): spatial distribution of supporting service values in 2020; (d): spatial distribution of cultural service values in 2020; (e): spatial distribution of total ESVs values in 2020.
Land 12 01405 g004
Figure 5. Proportion and change in the values of different ecosystem services from 1980 to 2020. (a): proportion of different ecosystem service values in 1980; (b): proportion of different ecosystem service values in 1990; (c): proportion of different ecosystem service values in 2000; (d): proportion of different ecosystem service values in 2010; (e): proportion of different ecosystem service values in 2020.
Land 12 01405 g005
Figure 6. Spatial distribution of landscape index at the grid scale in 2020. (a): spatial distribution of Cai at the grid scale in 2020; (b): spatial distribution of Division at the grid scale in 2020; (c): spatial distribution of Ed at the grid scale in 2020; (d): spatial distribution of Ent at the grid scale in 2020; (e): spatial distribution of Frac at the grid scale in 2020; (f): spatial distribution of Shi at the grid scale in 2020.
Land 12 01405 g006
Figure 7. Change of landscape index at the grid scale. (a): change of Cai from 1980 to 2020; (b): change of Division from 1980 to 2020; (c): change of Ed from 1980 to 2020; (d): change of Ent from 1980 to 2020; (e): change of Frac from 1980 to 2020; (f): change of Shdi from 1980 to 2020; CI is the 95% confidence interval.
Land 12 01405 g007
Figure 8. Correlation coefficients of different landscape indices. (a): the same index in different years; (b): different indices in the same year.
Land 12 01405 g008
Figure 9. Change of landscape index at the class level. (a): change of Cai from 1980 to 2020; (b): change of Division from 1980 to 2020; (c): change of Ed from 1980 to 2020; (d): change of Frac from 1980 to 2020).
Land 12 01405 g009
Figure 10. The correlation coefficient between different landscape indices and ecosystem service values. (a): correlation coefficient for Cai, Division and Ed; (b): correlation coefficient for Ent, Frac, Shdi; dotted line indicates significance at the 0.05 level.
Land 12 01405 g010
Table 1. Equivalence table of ESVs of Huaihe River Eco-Economic Belt (Yuan/hm2).
DrylandsPaddy LandForestGrasslandWaterUrban LandUnused
Land
Provisioning servicesFood production12802048380452120500
Materials production60213687367034600
Water supply regulation30396045236912,48300
Regulating
services
Air regulation10091671287223421159030
Climate regulation54285885956197344800
Environmental1512562519204883570151
Hydrological purification407409656244540153,956045
Supporting
services
Soil conservation155115349728541400030
Nutrient cycling18128626721810500
Biodiversity196316318525983840030
Cultural servicesAesthetic landscapes90136139711442846015
Table 2. Selected landscape indices and their definitions.
IndexCalculationEcological MeaningCategory
Mean of core area index
(Cai)
Cai = mean (CAI[patchij])
CAI [patchij] refers to the core area index of each patch (or land cover type) in a landscape.
Cai is the percentage of a patch’s area that is comprised of core habitat. When there is no core habitat within a patch, Cai = 0, and as the proportion of core habitats within a patch increases, Cai approaches 100.Core area metric
Landscape division index
(Division)
D i v i s i o n = ( 1 i = 1 m j = 1 n ( a i j A ) 2 )
Here, aij represents the area of a patch in square meters, while A represents the total landscape area in square meters. A division value of 0 indicates that there is only one patch, while a division value of 1 implies that all patches consist of a single cell.
This is used to reveal the degree of isolation of individual patches in a landscape type. The larger the value, the higher the patch isolation, the weaker the ability to resist risks, and the lower the landscape security.Aggregation metric
Edge density (Ed) E d = E A × 10 , 000
Here, E represents the total length of the edge in the landscape, measured in meters, while A represents the total area of the landscape in square meters. This index represents the length of the edge between a patch of a particular landscape component per unit area and the adjacent heterogeneous patches.
Ed is a measure of the complexity of landscape components and reflects the degree of fragmentation of landscape components. Smaller values indicate fewer and larger patches of landscape components, enhanced connectivity of landscape components, and reduced landscape fragmentation. Larger values indicate more patches of components in contact with adjacent heterogeneous patches, resulting in complex edges and distinct fragmentation.Area and Edge metric
Fractal dimension
(Fd)
F d = 2 ln ( P i k ) / ln ( A i )
Fd represents the fractal dimension, Pi represents the perimeter of the patch, and Ai represents the area of the patch.
Fd is a theoretical value between 1.0 and 2.0, and the higher the value, the more unstable the spatial structure. In ecological terms, as the fractal dimension increases, the edges of patches become more complex and are more susceptible to human disturbance.Shape metric
Shannon’s diversity index
(Shdi)
S h d i = i = 1 N [ p i ln ( P i ) ]
Pi represents the proportion of the area of patch type i in the landscape, and this index ranges from Shdi ≥ 0.
When there is only one patch in the entire landscape, the value of Shdi is 0. With the increase in patch types and the balanced distribution of their areas in the landscape, the value of Shdi increases. The higher the value of Shdi, the more diverse the patch types in a landscape system, the higher the degree of fragmentation, and the greater the uncertainty.Diversity metric
Marginal entropy index
(Ent)
Measure the diversity of landscapes, as detailed in reference [42]The marginal entropy index is an indicator commonly used to evaluate the level of landscape fragmentation. It is typically utilized to analyze the spatial distribution and proportion of various patch types within a landscape. It reflects the complexity of patch boundaries and the spatial relationships between patches. The higher the value, the more fragmented the landscape structure and the lower the stability of the ecosystem.Complexity metric
Table 3. Ecosystem service value and its proportion in different years.
YearESVs (108 Yuan)Percentage (%)
Provisioning ServicesRegulating ServicesSupporting ServicesCultural ServicesTotal
ESVs
Provisioning ServicesRegulating ServicesSupporting ServicesCultural Services
1980407.453532.35583.89103.004626.698.8176.3512.622.23
1990396.233408.06580.12101.094485.508.8375.9812.932.25
2000405.433508.35578.10102.034593.918.8376.3712.582.22
2010419.883772.66567.50104.474864.518.6377.5511.672.15
2020414.613717.37561.68103.294796.958.6477.4911.712.15
Table 4. Changes in the landscape index of the Huaihe River Eco-Economic Belt.
Metric19801990200020102020
Cai0.350.360.400.460.53
Division0.800.810.810.820.83
Ed6.716.746.836.876.95
Ent2.052.062.052.082.09
Frac1.021.021.021.021.02
Shdi1.421.431.431.451.45
Disclaimer/Publisher’s Note: The statements, opinions and data contained in all publications are solely those of the individual author(s) and contributor(s) and not of MDPI and/or the editor(s). MDPI and/or the editor(s) disclaim responsibility for any injury to people or property resulting from any ideas, methods, instructions or products referred to in the content.