Abstract
The official establishment of China’s national parks marks a new stage in the construction of China’s ecological civilization system. National parks systematically protect the areas with the richest biodiversity and the most complete ecosystem processes in China. This is beneficial not only for China’s natural conservation work, but also for the world’s response to environmental issues, such as climate change. Based on remote sensing images of land use in the four periods 1990, 2000, 2010, and 2020, this study calculated the land use changes in each national park during the corresponding period. Using the Plus model LEAS module, the driving factors of land use change in the national parks were studied and explored. In addition, the study used the InVEST model carbon storage module, using remote sensing images from different periods and the corresponding carbon pools of each national park as the basic data for model operation, to obtain the carbon storage changes in each national park over the past 30 years. Based on the hotspot analysis function, the hotspot areas of carbon storage changes in the national parks in the past 30 years were determined. Consequently, based on the CARS module of the PLUS model, the carbon storage in Northeast Tiger and Leopard National Park in 2030 was estimated under different scenarios. Research suggested that, except for Sanjiangyuan National Park where grassland is the main land use type, the other four national parks are all dominated by forests, and the expansion and changes in the main land use types were due to human activities. In the past 30 years, the carbon storage in China’s national park ecosystem has mainly shown a trend of first increasing and then gradually decreasing. Based on the changes in carbon storage in the national park, restoration scenarios were simulated for the core protected and generally controlled areas of Northeast Tiger and Leopard National Park. Under the ideal scenario, the highest value of carbon storage would be achieved by 2030, which would be 7,468,250 t higher than that in 2020. The present study provides a reference for the regional management of China’s national parks and further confirms that the implementation of the national park system can enhance China’s ability to achieve carbon peaking and neutrality goals.
1. Introduction
The increasingly prominent impact of human activities on the environment, especially on climate change, has brought about significant issues that endanger humanity, such as extreme weather and sea level rise [1]. In response to climate change, the Paris Agreement in 2015 set a long-term temperature target of controlling the global average temperature rise at 2 °C and limiting it to 1.5 °C by the end of the 21st century. China’s greenhouse gas emissions account for 26% of the world’s total [2]. As the first developing country to submit a national development plan, the Chinese government promised to reach peak carbon dioxide emissions by 2030 and is striving to achieve carbon neutrality by 2060 [3]. One of the important tasks currently being carried out in China to achieve carbon peaking and neutrality goals is strengthening the ecological carbon sequestration capacity, enhancing forest resource cultivation, carrying out land-greening actions, continuously increasing forest area and storage, strengthening ecological protection and restoration, and enhancing the carbon sequestration capacity of natural ecosystems.
Since 1872, when the United States established Yellowstone National Park as the first national park in the world, the concept of national parks has been continuously developed and improved in countries around the world [4]. National parks protect typical ecosystems, protect regional culture, are sites for scientific research, accommodate ecotourism, and are educational for the public to lean about the environment. Internationally, more than 200 countries have established their own national parks and have constantly developed multi-source connotations, with national parks representing the essence of the national land space [5]. For example, there are 62 national parks in the United States, covering a total area of 230,000 square kilometers, and Japan has established 29 national parks throughout the country, covering about 5% of its land area. Since the establishment of the People’s Republic of China, China has gradually realized the importance of ecological, environmental protection and has established multiple types of nature reserves, including nature reserves, forest parks, wetland parks, etc. [6]. China strives to comprehensively protect all kinds of ecosystems, with more than 11.8 thousand nature reserves [7], but in the process of exploration, problems such as the overlapping of multiple types of nature reserves and multi-management have also emerged, seriously reducing the effectiveness of protection [8]. Based on the above background, China issued the “Overall Plan for Establishing a National Park System” in 2017. Scholars from all walks of life created top-level designs for the concept and system planning of national parks [9]. In 2019, the “Guiding Opinions on Establishing a Nature Reserve System with National Parks as the Main Body” laid the direction for China’s grand goal of establishing the world’s largest national park system [10].
The establishment of a national park system is an important part of the construction of China’s ecological civilization system. National parks have systematically protected important ecoregions and effectively protected the authenticity and integrity of the natural ecology and natural and cultural heritage through migration, ecological restoration, and other means, while enhancing the regional carbon sink capacity, which contributes to the mitigation of global climate change as well as the loss of biodiversity [11,12]. Since May 2023, work on the first five national parks has steadily progressed, especially in terms of ecological protection, with varying degrees of progress and a gradual increase in the effectiveness of ecological protection.
The main impact of human activities on the environment is to change the land use, thus affecting climate change and changing ecosystem service functions [13]. Land cover information is crucial for environmental change studies, land resource management, sustainable development, and has many social benefits [14]. At present, the application of remote sensing satellite data for analyzing land use change is the most intuitive and effective method and has generated multiple data types. At the same time, a variety of measurement models for ecosystem service functions have been developed. Among them, utilization of the InVEST model provides scientific support for land use and spatial development decisions [15]. The model is widely used in the detection of ecosystem services, such as habitat quality, water production, soil conservation, carbon storage, etc. The scale of these studies covers watersheds at provincial, national, and global levels [16,17,18]. In the initial stage of research on the services of national park systems, the focus was mainly on the quantification of service value, and the research was mainly focused on the forest or wetland ecosystems of national parks. The development of 3S technology has also helped to strengthen the detection of the responsiveness of national park ecosystem services to natural changes and human activities. Changes in the land use patterns of national parks have also received attention from scholars. For example, Palomo and Muhammed researched Doniana National Park in Spain and Bel Mountains National Park in Ethiopia, respectively, both finding characteristics such as habitat fragmentation and regional patch reduction. Changes in the spatial structure of the landscape ecology affected the related ecosystem services, such as reductions in energy and food supplies, and weakened climate regulation, water and soil conservation, and other services [19,20]. A series of studies on the first batch of Chinese national parks and pilot parks, among which Chen’s systematic study on the habitat quality of five officially established national parks was based on land use data and the InVEST model [21] and a trend analysis over a 40-year time series was conducted. Pu conducted a systematic study on the changes in the ecosystem service value caused by land use changes in the Gansu area of Qilian Mountain National Park from 2000 to 2019 [22].
Scholars from various countries, such as Lutz, have carried out related research on the carbon storage in national park ecosystems and estimated the above-ground carbon content of Yosemite, Sequoia, and King’s Canyon National Parks [23]. Dimobe estimated the above-ground carbon storage in W National Park in Burkina Faso and linked the carbon density with structure, species diversity, and specific functional characteristics [24]. Chimner quantified how the soil carbon storage between wet meadows and peatland changed in Huascarán National Park in Peru [25]. Pache evaluated the carbon storage and sequestration of Retezat National Park (RNP) in Romania over a specific time frame and estimated the economic value of carbon sequestered in the ecosystem within the national park [26]. Kowiyou Yessoufou quantified the carbon storage of tree diversity (approximately 500 species) in Kruger National Park (KNP; approximately two million hectares) [27]. M. Marchetti analyzed the biomass data of forests in Italian national parks and found that the average forest carbon storage and carbon sink per unit area in the national parks were relatively higher than those of the entire national territory [28]. Chinese scholars Zou and Deng et al. have carried out corresponding research on the pilot projects of two national parks, Qilian Mountains and Qianjiangyuan, and conducted regional carbon stock accounting [29,30]. However, existing research on the carbon storage or ecosystem service functions of national park ecosystems is mostly based on the current situation, and the grasp of future development trends is not sufficient. Combining land use prediction models for scenario simulation can broaden the perspective of national park management work and enhance scientific guidance for national park planning and development.
Natural reserves dominated by national parks are of great significance for maintaining biodiversity and improving ecosystem service functions [31]. At present, at least 30% of the earth has been protected, and the focus is on areas where biodiversity is particularly important [32]. The construction of China’s national park system has effectively protected the most valuable ecosystems, and regional ecological restoration is carried out based on the national park management method. Improving the corresponding ecosystem carbon sequestration function not only affects a certain region but also has a global impact. Studying the response of land use change and ecosystem carbon storage in Chinese national parks can provide scientific and guiding suggestions for the management of China’s national park ecosystem and the adjustment of internal land use policies, thereby helping to achieve carbon peaking and carbon neutrality goals [29].
This study first explored the changes in land use types in each national park from 1990 to 2020 using the LULC transfer matrix. On this basis, we used the plus (patch-generating land use simulation) model to identify the factors influencing land use change in the past 30 years and explored the underlying causes of land use change. Based on the InVEST carbon storage module, the carbon storage was estimated for each national park in the corresponding year and for each category. Finally, we applied the function of spatial statistics in hotspot analysis to judge the hotspots of carbon stock degradation and improvement in each national park. Based on the degradation and zoning of the park, the study used the CARS module of the PLUS model to estimate the restoration of carbon stocks in the ecosystem of Northeast Tiger and Leopard National Park, and the results confirmed that the establishment of China’s national parks will contribute to the realization of the “double carbon goal.” The study will also contribute to land use development and management planning policies for each national park.
2. Materials and Methods
2.1. The Study Area
National parks have the greatest biodiversity and ecological integrity [31]. The first batch of national parks in China are nationally representative and ecologically significant, including not only as the cherished habitats of animals and plants, but also as significant ecological source areas. Among them, Sanjiangyuan National Park is the first national park in China and the largest national park in the world. It is located in Qinghai Province, with an adjusted total area of 19 × 104 km2. As the source catchment area of the Yangtze River, the Yellow River, and the Lancang River, known as the “China Water Tower”, it is an important freshwater source in China and even Asia, known as the “alpine biological germplasm resource bank”. It is also one of the most sensitive regions for the global climate change response [33]. Its ecosystem service functions, natural landscape, and biodiversity have a conservation value of national and global significance. Giant Panda National Park mainly protects the giant panda, an endemic species in China, and the establishment of Giant Panda National Park is conducive to enhancing the connectivity, coordination, and integrity of the giant panda habitat and realizing the stable reproduction of the giant panda population. Giant Panda National Park is located in the western region of China, spanning Sichuan, Gansu, and Shaanxi provinces, with a planned area of 2.2 × 10⁴ km2 [34]. Hainan Tropical Rainforest National Park, located in Hainan Province, with a planned area of 4269 km2, is the main habitat of Hainan gibbons, which are national-level protected animals in China. The Hainan tropical rainforest is a globally important gene pool of germplasm resources, an important area for tropical biodiversity conservation in China, and one of the hotspots for global biodiversity conservation [35]. Wuyi Mountain National Park, straddling Jiangxi and Fujian provinces, is a World Man and Biosphere Reserve and a World Natural and Cultural Heritage National Park, with a planned area of 1280 km2 [36]. North Tiger and Leopard National Park is located at the junction of Jilin and Heilongjiang provinces, and it is the most abundant, active, and important settlement and breeding area for northeast tiger and leopard populations in China; it is also an important wildlife area and one of the richest areas of biodiversity in the temperate zone of the Northern Hemisphere, with a planned area of 1.41 × 10⁴ km2 [37]. The distribution of the five national parks is shown in Figure 1.
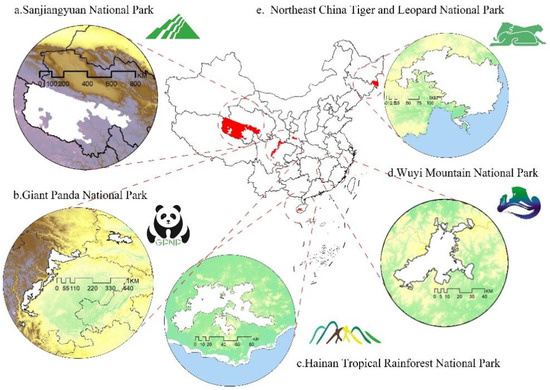
Figure 1.
A map of China’s first national parks.
A systematic discussion on land use changes and carbon storage in the first batch of national parks over the past 30 years can clarify the key areas for ecological management in these five national parks, providing scientific support for regional control and spatial delineation.
2.2. Data and Processing
Remote sensing images of land use were the basis of this research. At present, China and the world have formed a variety of data products. According to the research year and precision requirements, the land use-type data in this study were selected from Professor Huang Xin’s team at Wuhan University, China. The results are the first annual Chinese land cover CLCD dataset derived from Landsat produced on the GEE platform [38]. The resolution of the dataset is 30 m, the overall accuracy of the product is 79.31%, and the research scope is from 1985 to 2020. Compared with the current land use dataset, this dataset not only has obvious advantages in spatial and temporal resolution, but it also improves space–time consistency. In this study, the four years of 1990, 2000, 2010, and 2020 were selected, and the land use types were classified into nine types: farmland, forest, shrub, grassland, water, ice and snow, barren, impervious, and wetland.
The study area boundaries were vectorized according to the planning map of each national park, and the corresponding land use in each year was obtained by the GIS. At the same time, the study selected a total of 11 land use change drivers among socio-economic and transportation factors to identify the drivers of land use change in the national parks over 30 years. The data sources are shown in (Table 1). The corresponding carbon density of each national park was derived from existing research data, and the calculation was tailored according to the corresponding geographical area, forming the basis of the InVEST model calculation.

Table 1.
Drivers of land use change.
2.3. Methods
This study was mainly based on historical land use data, as well as on model simulations to derive the corresponding results; the main process is shown in Figure 2.
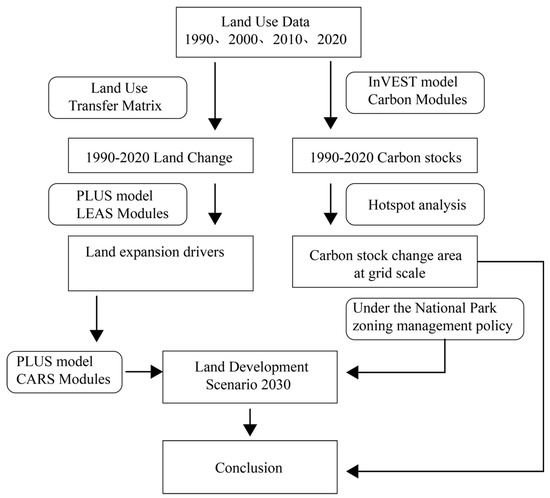
Figure 2.
The study flow chart.
2.3.1. Land Use Change Analysis
The land use transfer matrix can describe the structural characteristics and change process of regional land use in comprehensive detail and can reflect the change direction within land use types. By taking the area of land use type as the vector in the transfer matrix, the pattern characteristics and spatio–temporal evolution of regional land use types within a certain time interval can be revealed [39,40]. The formula is:
where: S represents the area; i and j represent the land use types at the beginning and end of the study period, respectively; N is the total number of land use types; and Sij is the area of land use transfer from type i to type j during the study period.
In this study, the land transfer matrix was used to determine the direction of various types of land use transfer. The research nodes were selected from 1990 and 2020 to identify the situation of overall land use change. At the same time, the results were visualized by forming a chord chart based on the transfer data.
2.3.2. Land Use Change Drivers and Scenario Simulation Analysis
As the main influencing factor causing the change in regional carbon stocks, variation in land use type will alter the composition and functions of the ecosystem. It also has a certain effect on the carbon fixation capacity of the vegetation and soil, thus affecting the level of regional carbon storage and then affecting regional climate change. The study of the change in regional land use status effectively analyzes its impact on carbon stock variation [41,42].
Numerous experts and scholars have used various models to simulate the relationship between land use change and carbon stocks. The Plus (patch-generating land use simulation) model is a land use simulation model with higher simulation accuracy and more realistic measurement of landscape patterns [43]. The model integrates transformation analysis strategies for excavating the driving mechanisms of land use change. Furthermore, the advantageous part of the pattern analysis strategy, based on the emergent probability and competition mechanism combined with the seed growth mechanism and a multi-objective algorithm, is that it can more accurately analyze the land use change and reflect a more realistic landscape state. Currently, few studies have applied the model for the quantitative assessment of carbon stocks in national park ecosystems [44].
The Plus (patch-generating land use simulation) model mainly consists of the LEAS (land expansion analysis strategy) and CARS (CA model based on multiple random patch seeds) modules. The LEAS module extracts the land use expansion from the initial stage to the final stage, uses the random forest classification (RFC) algorithm to mine the change probability and inertia probability of land use types, and explores the relationship between the driving force and land use. The calculation formula is:
where: x is a vector composed of multiple drivers, hn(x) is the predicted type of the nth decision tree of vector x; the value of d is 0 or 1, where 1 indicates the presence of other land use types converted to that k land use type and 0 indicates other transformations; M is the total number of decision trees; and I is the indicator function of the set of decision trees.
The CARS module is mainly a multi-class random patch seed-based CA model, which simulates the spatial variation of complex natural geographic phenomena. The CARS module is designed to meet future land use needs by influencing local land use competition and driving land use volume changes through an adaptive factor. The module consists of two main parts, the feedback mechanism of macro demand and local competition, which mainly generates multiple types of random patch seeds, which in turn stimulates the calculation of the overall probability, , of land use type k:
where: represents the growth probability of raster i for land use type k; is the effect of future demand for land use type k and an adaptive driving coefficient that depends on the gap between the amount of land use and demand for land use type k in period t for the iterated land use type k; and t denotes the neighborhood effect of raster i, the proportion of land use type k covered in the next neighborhood.
The PLUS model evolves patches of multiple land use types by calculating the overall probability process of land use type through the trend of decreasing the seed thresholds of multi-class random patches. When the neighborhood effect of land use k is equal to 0, the overall probability is:
where: r is a random value ranging from 0 to 1; and is the newly generated land threshold value for the newly generated land use type k patches.
2.3.3. The Ecosystem Carbon Stocks Change Analysis
The InVEST model is also called the integrated valuation of ecosystem services and tradeoff assessment model [45]. The model was developed by Stanford University, the Nature Conservancy (TNC), and the World Wildlife Fund (WWF). Its purpose is to realize the spatialization and visualization of ecosystem service capacity, so that natural capital can be easily incorporated into the decision-making system and economic factors can be organically combined with environmental protection. The assessment units of the InVEST model are vegetation cover types or land use types, and the average carbon density of each carbon pool is multiplied by the area of each assessment unit to estimate the ecosystem carbon stock of the area. In the ecosystem carbon stock estimation model, the aboveground biogenic carbon is the ecosystem carbon stock of all living vegetation, the below-ground biogenic carbon is the ecosystem carbon stock in the root system of living plants, the soil carbon pool refers to the organic carbon in the soil, and dead organic carbon refers to the carbon storage in withered and dead plants [46,47].
Ecosystem carbon stocks in the InVEST model are calculated as follows:
where: TC is total carbon, Ci is the carbon stock of different land use types, Si is the area of corresponding land use types, where , , , are the carbon stocks of the above-ground part of the ecosystem, the below-ground part of the ecosystem, the dead organic ecosystem, and the soil ecosystem, respectively, the unit is (t/hm2).
The carbon density parameters in this study were mainly derived from the reference documents of each research area and referred to the carbon storage module parameters of the InVEST model to distinguish the carbon densities of different ecosystem and vegetation types (Table 2).
Table 2.
National Park Carbon Intensity Data Source.
2.3.4. The Spatial Hotspots Detection Method
Hotspot analysis can determine the location of statistically significant high and low values in a geographical region by aggregating sample values that are close to each other based on the calculated distance. This is a measure of spatial autocorrelation from a local perspective [55]. This study used hotspot analysis to identify the spatial clustering of high and low values in the carbon stock change data. In this case, when the local sum was significantly different from the expected local sum, and the difference was too large to be the product of random selection, a statistically significant Z-score was generated. A feature with a high Z-score and a small p-value indicated a significant hotspot (high value cluster).
A statistically significant hotspot is a location surrounded by other samples with high values (the reverse applies to cold spots). In addition, this tool helped to identify hot and cold spots with different levels of significance, so that priorities could be set according to the actual situation and requirements. The formula for the GetisOrd Gi* statistic is as follows [56,57,58]:
where: xj is the attribute value for feature j; wij is the spatial weight between features i and j; and n is equal to the total number of features. Also:
3. Results
3.1. Analysis of Change in Land Use Type
The land use transfer sankey diagram clearly showed the direction and extent of land use change in each national park from 1990 to 2020 (Figure 3). Grassland (80.55%) and barren land (14.65%) were the main types of land use in Sanjiangyuan National Park in 2020, and quasi switching between them was the main direction of land use change in this national park. Over the past 30 years, the area of grassland had decreased by 3.14 × 10⁵ hm2, and the barren land had increased by194.15 hm2. Land use types within Giant Panda National Park had been dominated by farmland (1.19%), forest (85.22%), and grassland (10.67%), and the interchange between land use types was slightly more complex than in other national parks. Between 1990 and 2020, the type of land use within this national park was mostly converted from farmland to forest. In addition, shrubland and grassland had also been transformed into forest land to a certain extent, and the forest land area had increased by 692.70 hm2. Hainan Tropical Rainforest National Park, Wuyi Mountain National Park, and Northeast Tiger and Leopard National Park were all dominated by forest and farmland as the main land use types, the proportions of forest within each national park in 2020 were 97.42%, 99.39%, and 94.56%, respectively, and the proportions of farmland were 1.57%, 0.41%, and 4.66%, respectively. The forest in Hainan National Park had increased by 7.43 hm2 and the forest in Northeast Tiger and Leopard National Park had increased by 7.03 hm2 during the past 30 years, but the forest in Wuyi Mountain National Park had decreased slightly and farmland had increased by 0.33 hm2.
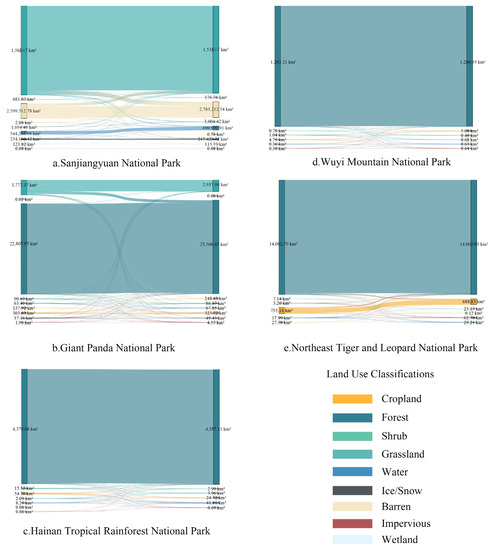
Figure 3.
The land use transfer sankey map for national parks in China, 1990–2020.
3.2. Analysis of Land Use Expansion Drivers
This article selected the land use types with the largest amount of land use expansion in five national parks to detect the driving forces of their changes and conducted a driving ranking study based on the LEAS module of the Plus model. The driving factors of land change were mainly based on previous studies, and relevant analysis was carried out with socio-economic, physical geography, and other factors, including population density (POP), GDP, DEM, slope, annual average precipitation (PRE), annual average temperature (TEM), soil type, distance from the water system, distance from the railroad, distance from the highway, and distance from a government site [59,60].
In Sanjiangyuan National Park from 1990 to 2020, the grassland had a large number of land use changes. According to the detection results, we could see that the distance from a government site and the distance from the railroad were the driving factors that had a greater impact on the expansion of grassland. The distance from a government site and the distance from the railroad accounted for 19.1% and 14.5%, respectively, of the overall expansion contribution. Based on the results of the mapping of the sprawling area, we could see that the sprawling part of the grassland mainly followed an inverse trend regarding the distance from a government site. The major type of land use change in Giant Panda National Park was forest land, which had expanded 2222 km2 in 30 years. Moreover, the internal elevation and regional temperature were the main influencing factors on the expansion of forest land, accounting for 25.5% and 21.8% of the overall contribution of the influencing factors, respectively, and the expansion of forest land was partially concentrated in the relatively low-elevation area.
The expansion of the water area in Hainan Tropical Rainforest National Park was large, mainly because of the water renovation work in the west of Hainan Island, in which the silted part was dredged. The elevation factor contributed 18.4% of the influence on water body expansion, and water expansion was mainly located in the area with lower elevation. Both Wuyi Mountain National Park and Northeast Tiger and Leopard National Park had a large variety of changes in their forest areas. The expansion of forest land in the former was mainly influenced by the internal slope of the park. The slope accounted for 33.2% of the overall contribution, with the main expansion concentrated in the lower slope areas. The expansion of forest land in the latter was partly driven by human influences, with distance from the railroad and regional GDP ranked higher, and the two drivers accounting for 13.5% and 11.6% of the contribution, respectively. GDP represents the degree of aggregation of the population to a certain extent. Moreover, the expansion map showed that parts of the forest land close to the railroad had a large expansion, which was mainly because natural forest protection projects have been carried out in Northeast China in the past 30 years and commercial logging has been stopped. Protective measures such as closing mountains and cultivating forests have been undertaken in areas with great damage to the original forest (Figure 4).
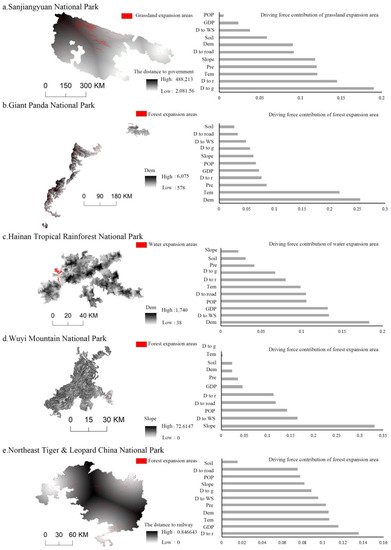
Figure 4.
Ranking the drivers of land use change in China’s national parks (D to road means the distance from the road; D to g means the distance to a government site; D to WS means the distance to the water system; D to r means the distance to the railroad).
3.3. Analysis of Annual Changes in Carbon Stocks
Changes in the type and quantity of land use have brought about changes in the carbon stocks of national park ecosystem services. The study measured carbon stocks in each national park for the years 1990, 2000, 2010, and 2020, and the results are presented in Table 3. The correlation between the area of a national park and its ecosystem carbon stocks was detected using the Pearson test, and the results showed that the correlation coefficient was 0.973, which was significant and positive, indicating, to a certain extent, that a wider ecological space should be considered in the establishment of national parks in the future.
Table 3.
National park carbon stocks from 1990 to 2020 (unit: 1 × 10⁴ t).
The present study also analyzed the overall carbon stock distribution of each national park in 2020 at the pixel scale (Figure 5). The results showed that the carbon stocks in the south of Sanjiangyuan National Park were relatively high, and the high carbon stocks in Giant Panda National Park were concentrated in the southeast. The lower carbon stock areas in Hainan Tropical Rainforest National Park and Northeast Tiger and Leopard National Park were in watersheds and human gathering areas, while the carbon stocks in Wuyi Mountain National Park were more homogeneous compared to those of the other four national parks. The study estimated the carbon stocks for the corresponding land use types within each national park in 2020 (Figure 6). We could see that, except for Sanjiangyuan National Park, which had the highest valuation of carbon stocks in grassland, the other four national parks all had larger shares of carbon stocks in forests. The five national parks had their top three carbon stocks in total carbon stocks in farmland, forest, and grassland.
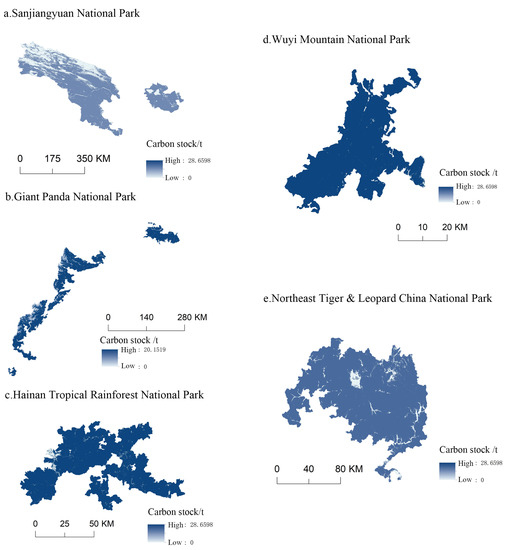
Figure 5.
China’s national park carbon stocks in 2020.
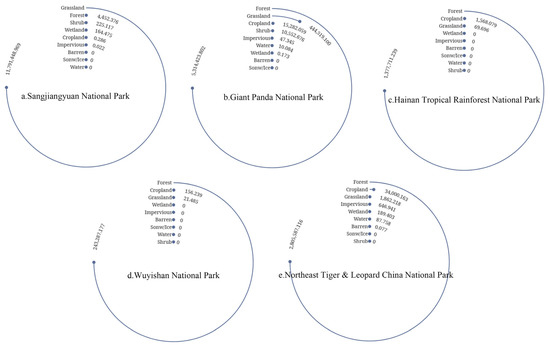
Figure 6.
Carbon stocks in different land use types in national parks in 2020.
3.4. Analysis of Hotspot Areas of Carbon Stock Change
The study explored the change in carbon stocks in national parks from 1990 to 2020 at the scale of a 1 km grid and analyzed the cold and hotspots of carbon stock change (Figure 7) in order to facilitate the formulation of regional space management plans for national parks.
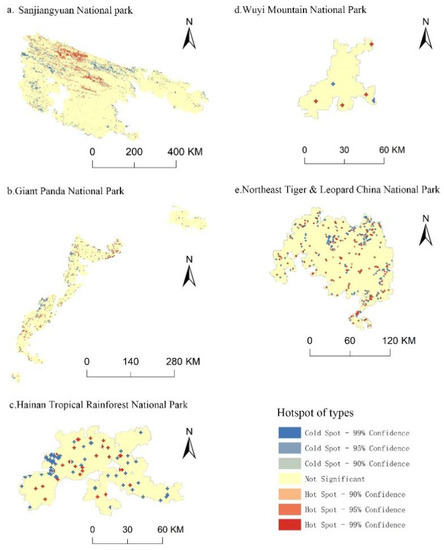
Figure 7.
Hotspots of carbon stock changes from 1990–2020 at the 1 km grid scale.
According to the hotspot analysis results, the areas where the carbon stocks of Sanjiangyuan National Park had increased in the past 30 years were mainly concentrated in the middle and north of the park, centralized within the boundaries of the Yangtze River Source Park. The carbon storage reduction area was mainly concentrated on the west side of the park, namely the Hoh Xili area. The areas of change in carbon stocks in Giant Panda National Park were relatively scattered, and the reduction area of carbon reserves was located in the northwest of the park at a high altitude. The carbon reserves in Hainan National Park changed in the west as the reduction concentration area, while areas of increased carbon stocks were concentrated in the central part of the park. Compared with other national parks, Wuyi Mountain National Park had less overall carbon storage change, and the increased carbon stock area was in the south of the park. The carbon stocks in Northeast Tiger and Leopard National Park did not change much from 1990 to 2020. In the past 30 years, the reduction areas of carbon reserves were mainly concentrated in the urban agglomeration area, which was located in the central north of the park in the Wangqing Forestry Bureau area of Jilin Province.
4. Discussion
4.1. Factors Influencing Land Use Expansion and Carbon Stock Change
The 11 driving factors of land use expansion in the national parks selected in the study could be summarized into three levels: natural environment, transportation location, and socio-economic factors. Sanjiangyuan National Park is a sparsely populated area with a low population density. Population and economic indicators had little impact on grassland expansion. However, grassland expansion was mainly affected by transportation location. This factor was a negative indicator. The further away from government sites and roads, the more significant the grassland expansion. The elevation of Giant Panda National Park is relatively high, and expansion of its forest land was mainly influenced by natural factors such as DEM, TME, and PRE. As a terrain condition, elevation directly or indirectly determines the distribution of meteorological factors such as regional precipitation and temperature, as well as vegetation types, thereby affecting spatiotemporal changes in carbon storage. The expansion of the tropical rainforest water body in Hainan was mainly due to the combined effect of DEM and distance from the water body. The Changhua River, the second largest river in Hainan Province, ran through the expansion area of the water body, expanding from the high altitude area to the low altitude area from east to west, and finally flowing into the South China Sea, which was naturally convenient for the expansion of the water body. The change in land use in Mount Wuyi National Park was less than that in other national parks. The carbon storage in the forest ecosystem occupied a dominant position in the region. The expansion of forest land was mainly in the slope area, and the low slope was more conducive to the growth of vegetation roots. The regional distribution of forest land expansion in Northeast Tiger and Leopard National Park was more balanced than that in other national parks, and the contribution of various driving factors was also more balanced. Except for the soil type factor, the forest land expansion could be said to be influenced by the combined effects of natural conditions, transportation location, and socio-economic impact.
All five national parks have experienced varying degrees of ecological space expansion, and the natural conditions were the fundamental and decisive factors for the expansion of various types of spaces in national parks. As a terrain condition, elevation directly or indirectly determines the spatial differentiation of regional precipitation and soil texture, and to a certain extent determines vegetation productivity and community composition, which can affect the spatiotemporal differentiation of carbon storage. Therefore, the impact of natural factors on the expansion of ecological spaces accounted for a considerable proportion among various factors. Secondly, transportation location was the main driving factor for the evolution of spatial patterns. The larger the value, the longer the time, the farther the distance, and the less convenient life and production. The better the transportation location, the more convenient it is for the exchange of people, logistics, information, and capital flows between regions, thereby enhancing the connectivity between regions. Therefore, the better the transportation location, the more conducive it is to the expansion of construction space, while the worse the transportation location, the more conducive it is to the expansion of ecological space. At the same time, the social economy was an important driving factor for the evolution of spatial patterns. Population density, as the main characteristic factor among socio-economic factors, can to some extent reflect the socio-economic situation of a region. With the acceleration of urbanization, densely populated areas will inevitably need more construction space to meet people’s living and production needs. Generally speaking, areas with higher population density will have faster socio-economic development and higher land use efficiency. As a result, a large amount of high-carbon-density arable land, forest land, and grassland in the region will be transferred to low-carbon-density construction land, forming low-carbon storage areas; therefore, the expansion of construction space is closely related to population mobility. On the contrary, areas with more frequent human activities are less conducive to restoration of the ecological environment, while areas with fewer human activities are more prone to ecological space expansion. Overall, land use change was the result of the comprehensive effects induced by socio-economic and natural environmental factors, but socio-economic development determined the structure, degree, rate, and direction of change in the land use landscape. Natural environmental factors were long-term, fundamental influencing factors.
4.2. The Improvement of the National Park System Will Promote the “Double Carbon” Goal
In 2021, China officially established five national parks, marking a new stage in China’s nature conservation work. The trends in carbon stock change between 1990 and 2020 in the five national parks were different, but most of them were consistent with the carbon stocks decreasing from 1990 to 2000, increasing from 2000 to 2010, and decreasing from 2010 to 2020. The reason for this was the introduction of national policies such as China’s “Natural Forest Protection Project Implementation Plan” in 1998 and China’s growing awareness of the need for ecological protection. The promotion of afforestation and reforestation policies slowed down the deterioration of the ecological environment. Studies have shown that 25% of global greenfield growth was contributed by China [61].
However, with the development needs of the economy, farmland and construction land continue to encroach on original ecological land, and climate change impacts vegetation in ecologically fragile areas, while the carbon storage in national parks is gradually decreasing. In Sanjiangyuan National Park from 2010 to 2020, grassland decreased by 2528.8 km2, while water increased by 646.2 km2, and unused land increased by 2542.5 km2. Under unique high altitude, drought, and cold conditions, the productivity of grasslands is low, and the ecosystem is unstable, sensitive, and fragile. The combined interference of human and natural factors (such as excessive cultivation and grazing and global climate change) can easily lead to grassland degradation and seriously reduce the production and service functions of grasslands. A large amount of land in Hainan Tropical Rainforest National Park was converted into cultivated land during 2010–2020. Cultivated land increased by 42.7 km2, forest land decreased by 38.0 km2, shrubland and grassland both decreased. Meanwhile, land use in Wuyi Mountain National Park changed less. During 2010–2020, impervious land slightly increased by 0.28 km2, and shrubland decreased by 0.33 km2, which was similar to the scenario in Northeast Tiger and Leopard National Park. Cultivated land area in the region had decreased by 26.5 km2, and forest land had decreased by 29.4 km2. During this period, a large amount of construction land was developed, increasing by 18.2 km2, which to some extent weakened the carbon sequestration capacity in the region.
Following the implementation and promotion of national park-related policies, the original nature reserves at all levels within the national parks are now integrated and consolidated, and environmental protection measures such as ecological relocation and return of farmland to forest or grassland are undertaken in the core protected areas within the national parks. This will further enhance the overall ecological service functions of the national parks, and the carbon storage capacity of the national park’s ecosystem will be continuously improved. At the end of 2022, the release of the “National Park Spatial Layout Plan” was a major achievement in the construction of China’s ecological civilization system, which has important guiding significance for promoting the high-quality development of China’s national parks and building the world’s largest national park system. The Spatial Layout Program initially selected 49 national parks for nationwide spatial planning and will be continuously revised. This indicates that the more efficient ecosystem service areas in China will carry out more comprehensive and systematic conservation work, which will also enhance nationwide ecosystem carbon stocks and contribute to the achievement of the “double carbon” goal.
4.3. Key Regional Control Measures and Effectiveness Estimates
According to the actual situation, the planning process of China’s national parks has carried out zoning designs with different degrees of protection, basically covering core protected areas and generally controlled areas. To improve the ecosystem service functions of the national parks and protect the integrity of their ecosystems, ecological migration relocation, ecological restoration, and expansion of wildlife habitat space are the main protection means in the core protected areas of the national parks. This study identified areas of carbon stock reduction in the national parks, which can facilitate the implementation of targeted control measures in each national park (Figure 8).
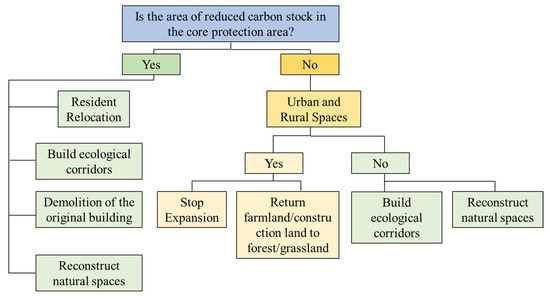
Figure 8.
Spatial control measures in China’s national parks.
This study took Northeast Tiger and Leopard Park as an example and, based on the PLUS (patch-generating land use simulation) model CARS (CA model based on multiple random patch seeds) module, selected the natural, economic, and social impact factors for the generally controlled areas (population gathering areas) of the park. Through the land use changes in 2010 and 2020, land use in 2030 was predicted under natural development and ecological protection scenarios. At the same time, the development of the core protected areas and generally controlled area (potential habitats for tigers and leopards) was envisaged for carbon storage under the ideal scenario mode, which would further demonstrate the establishment of the national park system and its contribution to the realization of China’s dual carbon goals. The zoning map and impact factors of Northeast Tiger and Leopard Park are shown in Figure 9.
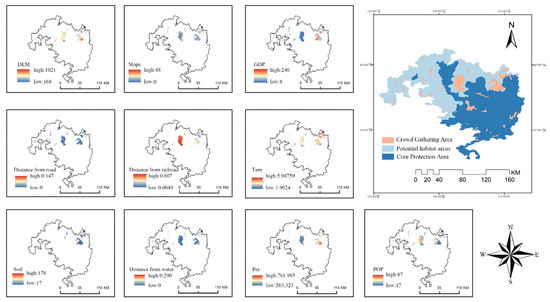
Figure 9.
A map of the drivers of land change in the zoning and population gathering areas of Northeast Tiger and Leopard National Park.
The study first predicted the land uses in 2020 and compared the simulation accuracy with the actual land uses. The Kappa coefficient in the study was 0.797 > 0.7, which met the research accuracy requirements with high consistency. Based on this, the land use prediction under the natural development mode was conducted with the same simulation coefficient. The ecologically protected mode was mainly based on the environmental protection requirements in combination with the national park management requirements, that is, stopping the expansion of construction land and increasing the growth rate of ecological land compared to that in the natural development scenario; this article set a 30% increase in the probability of construction land and farmland returning to ecological land. The land use prediction diagram is shown in Figure 10.
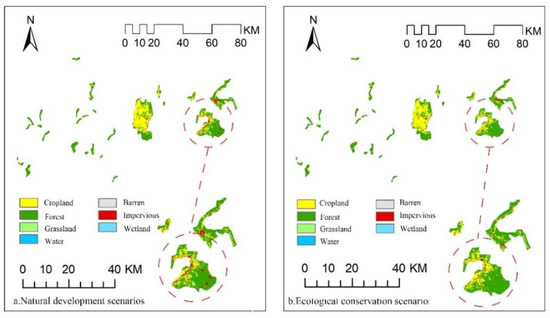
Figure 10.
Projected land use scenarios for 2030 in Northeast Tiger and Leopard National Park.
According to China’s national park management measures, this study set up core protected areas and generally controlled areas (potential habitats of tigers and leopards) where farmland and construction land were converted to ecological land and set up an ideal scenario of returning to forest land and grassland. For the population gathering areas, this scenario simulated the ecological protection requirements under the natural development model in 2030 and was based on national park management. The accounting results of carbon storage in different regions are shown in Table 4. The results showed that under our scenario, the carbon storage in the ecosystem of Northeast Tiger and Leopard National Park significantly increased compared with that in 2020, and could reach maximum carbon storage in nearly 30 years under ideal conditions. Achieving the vision of establishing nearly 50 Chinese national parks and implementing the concept of ecological conservation will further help to realize the beautiful goals of carbon peaking and neutrality.
Table 4.
Northeast Tiger and Leopard National Park 2030 Development Scenario (unit: 1 × 10⁴ t).
4.4. Innovations and Limitations
The study systematically explored the main changes in land types in Chinese national parks over the past 30 years, and for the first time, the Plus model was used to detect these changes and their corresponding driving factors in various national parks. On this basis, the InVEST model was used to calculate the changes in the ecosystem service carbon stocks of the corresponding national parks, clarifying the basic trends in carbon stock changes, and, based on spatial hotspot analysis, the key areas of carbon stock changes in the Chinese national parks over the past 30 years were identified. Based on zoning management, ecological management, and control of the national park, the study took the land development forecast of Northeast Tiger and Leopard National Park in 2030 as an example to calculate the carbon reserves under two scenarios. Exploring the future development model through research can help to formulate land use and zoning control policies for national parks and also help to clarify the development direction of national parks in order to help achieve carbon peaking and neutrality goals. There are still some limitations to this study. Firstly, the research was mainly based on land use classification data, which have a certain degree of uncertainty. In addition, the research was mainly based on the InVEST model, which has advantages in spatial representation. However, most of the carbon pool data in the carbon module came from past experience, and the data have a certain degree of uncertainty. At present, it is necessary to further accurately calculate the carbon density of each national park area to improve the accuracy of research. The driving mechanisms underlying the decline in carbon storage in various national parks in the past decades still need to be further explored in order to better enhance the regional carbon storage in national parks, further enhance the carbon sequestration capacity, and help to achieve carbon peaking and neutrality goals. This is urgent and important work for future research.
5. Conclusions
Based on the CLCD dataset, combined with the use of the Plus model and the InVEST model carbon storage module, the study systematically evaluated five national parks officially established in China for the first time and clarified the land use changes and their corresponding carbon stock changes between 1990 and 2020. The core conclusions of the study are as follows:
- (1)
- Land use in the national parks has changed over the past 30 years, mainly due to the combined effects of natural conditions and human activities, and the expansion of arable and construction lands has led to different degrees of degradation of the ecosystem services in the national parks.
- (2)
- In the past 10 years, the carbon stocks within the planning areas of the national parks have been decreasing, especially in Sanjiangyuan National Park. The study identified the hot and cold spots of carbon stock changes in each national park at the scale of a 1 km grid and formulated different scheme frameworks for core protected areas and generally controlled areas, based on the zoning planning of the national parks.
- (3)
- Based on the envisioned restoration framework, a 2030 ecosystem restoration scenario was conducted for Northeast Tiger and Leopard National Park. The optimal scenario showed that the park’s ecosystem carbon stocks will recover to their highest level within the last 30 years, increasing by 7,468,250 t compared to the recorded level in 2020.
- (4)
- The results show that the establishment of national parks has laid a good foundation for the improvement of regional ecological quality, and the construction of national parks can further contribute to the achievement of China’s carbon peaking and neutrality goals.
Author Contributions
Conceptualization, S.W. and D.X.; methodology, S.W. and S.S.; software, S.W. and M.S.; validation, S.W. and S.H.; formal analysis, S.W. and S.X.; investigation, S.W.; resources, D.X.; data curation, S.W.; writing—original draft preparation, S.W; writing—review and editing, S.W. and H.B.; visualization, S.W.; supervision, D.X.; project administration, D.X.; funding acquisition, D.X. All authors have read and agreed to the published version of the manuscript.
Funding
This research was supported by the Fundamental Research Funds for the Central Universities, Northeast Forestry University (2572018CP06).
Data Availability Statement
Not applicable.
Acknowledgments
The authors are particularly grateful to all researchers and institutes for providing data for this study. The authors are also very grateful to the editors and reviewers for their comments and suggestions for improving this study.
Conflicts of Interest
The authors declare no conflict of interest.
References
- Rayner, N.A.; Parker, D.E.; Horton, E.B.; Folland, C.K.; Alexander, L.V.; Rowell, D.P.; Kent, E.C.; Kaplan, A. Global analyses of sea surface temperature, sea ice, and night marine air temperature since the late nineteenth century. J. Geophys. Res. 2003, 108, 4407. [Google Scholar] [CrossRef]
- Li, L.S.; Hui, J.C.; Quan, S.G. Will China achieve its 2060 carbon neutral commitment from the provincial perspective? Adv. Clim. Chang. Res. 2022, 13, 169–178. [Google Scholar]
- Zhong, R.; He, Q.; Qi, Y. Digital Economy, Agricultural Technological Progress, and Agricultural Carbon Intensity: Evidence from China. Int. J. Environ. Res. Public Health 2022, 19, 6488. [Google Scholar] [CrossRef] [PubMed]
- Yang, R. Evolution and experience of the National Park System of the United States. Chin. Landsc. Arch. 2001, 1, 62–64. (In Chinese) [Google Scholar]
- Yang, R. Discussion on the trend of worldwide national park Movement. Chin. Landsc. Arch. 2003, 7, 10–15. (In Chinese) [Google Scholar]
- Peng, Y.; Fan, J.; Xing, S.; Cui, G. Overview and classification outlook of natural protected areas in mainland China. Biodivers. Sci. 2018, 26, 315–325. [Google Scholar] [CrossRef]
- Tang, X.P.; Luan, X.F. Developing a Nature Protected Area System Composed Mainly of National Parks. For. Resour. Manag. 2017, 6, 1–8. (In Chinese) [Google Scholar]
- Tonghui, M.; Cai, L.; Guangchun, L. The spatial overlapping analysis for China’s natural protected area and countermeasures for the optimization and integration of protected area system. Biodivers. Sci. 2019, 27, 758–771. [Google Scholar] [CrossRef]
- Wang, J.H.Z. National parks in China: Parks for people or for the nation? Land Use Policy 2019, 81, 825–833. [Google Scholar] [CrossRef]
- Zhao, W.J. Beginning: China’s national park system. Natl. Sci. Rev. 2022, 9, 150. [Google Scholar] [CrossRef]
- Pringle, R.M. Upgrading protected areas to conserve wild biodiversity. Nature 2017, 546, 91–99. [Google Scholar] [CrossRef] [PubMed]
- Hoffmann, S.; Irl, S.D.H.; Beierkuhnlein, C. Predicted climate shifts within terrestrial protected areas worldwide. Nat. Commun. 2019, 10, 4787. [Google Scholar] [CrossRef] [PubMed]
- Burkhard, B.; Kroll, F.; Nedkov, S.; Müller, F. Mapping ecosystem service supply, demand and budgets. Ecol. Indic. 2012, 21, 17–29. [Google Scholar] [CrossRef]
- Chen, J.; Liao, A.; Cao, X.; Chen, L.; Chen, X.; He, C.; Han, G.; Peng, S.; Lu, M.; Zhang, W.; et al. Global land cover mapping at 30m resolution: A POK-based operational approach. ISPRS J. Photogramm. Remote Sens. 2015, 103, 7–27. [Google Scholar] [CrossRef]
- Posner, S.; Verutes, G.; Koh, I.; Denu, D.; Ricketts, T. Global use of ecosystem service models. Ecosyst. Serv. 2016, 17, 131–141. [Google Scholar] [CrossRef]
- Gou, M.; Li, L.; Ouyang, S.; Wang, N.; La, L.; Liu, C.; Xiao, W. Identifying and analyzing ecosystem service bundles and their socioecological drivers in the Three Gorges Reservoir Area. J. Clean. Prod. 2021, 307, 127208. [Google Scholar] [CrossRef]
- Tang, L.; Ke, X.; Zhou, T.; Zheng, W.; Wang, L. Impacts of cropland expansion on carbon storage: A case study in Hubei, China. J. Environ. Manag. 2020, 265, 110515. [Google Scholar] [CrossRef]
- Zhu, L.; Song, R.; Sun, S.; Li, Y.; Hu, K. Land use/land cover change and its impact on ecosystem carbon storage in coastal areas of China from 1980 to 2050. Ecol. Indic. 2022, 142, 109178. [Google Scholar] [CrossRef]
- Palomo, I.; Martín-López, B.; Zorrilla-Miras, P.; García Del Amo, D.; Montes, C. Deliberative mapping of ecosystem services within and around Doñana National Park (SW Spain) in relation to land use change. Reg. Environ. Chang. 2013, 14, 237–251. [Google Scholar] [CrossRef]
- Muhammed, A.; Elias, E. Class and landscape level habitat fragmentation analysis in the Bale mountains national park, southeastern Ethiopia. Heliyon 2021, 7, e07642. [Google Scholar] [CrossRef]
- Chen, X.; Yu, L.; Cao, Y.; Xu, Y.; Zhao, Z.; Zhuang, Y.; Liu, X.; Du, Z.; Liu, T.; Yang, B.; et al. Habitat quality dynamics in China’s first group of national parks in recent four decades: Evidence from land use and land cover changes. J. Environ. Manag. 2023, 325, 116505. [Google Scholar] [CrossRef] [PubMed]
- Pu, L.; Lu, C.; Yang, X.; Chen, X. Spatio-Temporal Variation of the Ecosystem Service Value in Qilian Mountain National Park (Gansu Area) Based on Land Use. Land 2023, 12, 201. [Google Scholar] [CrossRef]
- Lutz, J.A.; Matchett, J.R.; Tarnay, L.W.; Smith, D.F.; Becker, K.M.L.; Furniss, T.J.; Brooks, M.L. Fire and the Distribution and Uncertainty of Carbon Sequestered as Aboveground Tree Biomass in Yosemite and Sequoia & Kings Canyon National Parks. Land 2017, 6, 10. [Google Scholar]
- Dimobe, K.; Kuyah, S.; Dabré, Z.; Ouédraogo, A.; Thiombiano, A. Diversity-carbon stock relationship across vegetation types in W National park in Burkina Faso. For. Ecol. Manag. 2019, 438, 243–254. [Google Scholar] [CrossRef]
- Chimner Rodney, A.; Resh Sigrid, C.; Hribljan John, A.; Battaglia, M.; Bourgeau-Chavez, L.; Bowser, G.; Lilleskov Erik, A. Mountain wetland soil carbon stocks of Huascarán National Park, Peru. Front. Plant Sci. 2023, 14, 1048609. [Google Scholar] [CrossRef]
- Pache, R.-G.; Abrudan, I.V.; Niță, M.-D. Economic Valuation of Carbon Storage and Sequestration in Retezat National Park, Romania. Forests 2021, 12, 43. [Google Scholar] [CrossRef]
- Yessoufou, K. Potential carbon stock in the Kruger National Park, South Africa. Bot. Lett. 2017, 164, 425–432. [Google Scholar] [CrossRef]
- Marchetti, M.; Sallustio, L.; Ottaviano, M.; Barbati, A.; Corona, P.; Tognetti, R.; Zavattero, L. Carbon sequestration by forests in the National Parks of Italy. Plant Biosyst. 2012, 146, 1001–1011. [Google Scholar] [CrossRef]
- Zou, W.T.; He, Y.J.; Ye, B.; Zhao, X.D.; Xu, D.Y.; Xiao, R.G.; Duan, Y.X. Study on carbon storage of ecosystem in Qianjiangyuan national park based on InVEST model. J. Central South Univ. For. Technol. 2021, 41, 120–128. (In Chinese) [Google Scholar]
- Deng, Z.; Ding, W.G.; Pu, X.T.; Lyu, Y.J.; Wang, Y.l. Spatial-temporal Distribution of Carbon Storage in Qilian Mountain National Park Based on InVEST Model. Bull. Soil Water Conserv. 2022, 42, 324–334,396. [Google Scholar]
- Xu, W.; Xiao, Y.; Zhang, J.; Yang, W.; Zhang, L.; Hull, V.; Wang, Z.; Zheng, H.; Liu, J.; Polasky, S.; et al. Strengthening protected areas for biodiversity and ecosystem services in China. Proc. Natl. Acad. Sci. USA 2017, 114, 1601–1606. [Google Scholar] [CrossRef] [PubMed]
- Peng, Q.; Yang, R.; Cao, Y.; Wang, F.; Hou, S.; Tseng, T.H.; Wang, X.; Wang, P.; Zhao, Z.; Yu, L.; et al. One-third of lands face high conflict risk between biodiversity conservation and human activities in China. J. Environ. Manag. 2021, 299, 113449. [Google Scholar] [CrossRef] [PubMed]
- Ma, T.; Swallow, B.; Zhong, L.; Xu, K.; Sang, W.; Jia, L. Local perspectives on social-ecological transformation: China’s Sanjiangyuan National Park. Environ. Dev. Sustain. 2022, 1–21. [Google Scholar] [CrossRef]
- Xu, Y.; Liu, R.; Xue, C.; Xia, Z. Ecological Sensitivity Evaluation and Explanatory Power Analysis of the Giant Panda National Park in China. Ecol. Indic. 2023, 146, 109792. [Google Scholar] [CrossRef]
- Li, L.; Tang, H.; Lei, J.; Song, X. Spatial autocorrelation in land use type and ecosystem service value in Hainan Tropical Rain Forest National Park. Ecol. Indic. 2022, 137, 108727. [Google Scholar] [CrossRef]
- He, S.; Su, Y.; Cheng, H. Coordinating community resource use and conservation: An institutional diagnostic practice in the Wuyishan National Park. J. Environ. Manag. 2022, 317, 115508. [Google Scholar] [CrossRef]
- Zhu, H.; Zhang, Y.; Chen, Y.; Zhao, M.; Bo, C. Constructing a Model of Government Purchasing of Ecological Services: Evidence from China’s Northeast Tiger and Leopard National Park. Land 2022, 11, 1737. [Google Scholar] [CrossRef]
- Yang, J.; Huang, X. The 30 m annual land cover dataset and its dynamics in China from 1990 to 2019. Earth Syst. Sci. Data 2021, 13, 3907–3925. [Google Scholar] [CrossRef]
- Li, C.; Yang, M.; Li, Z.; Wang, B. How Will Rwandan Land Use/Land Cover Change under High Population Pressure and Changing Climate? Appl. Sci. 2021, 11, 5376. [Google Scholar] [CrossRef]
- Yang, H.; Zhong, X.; Deng, S.; Nie, S. Impact of LUCC on landscape pattern in the Yangtze River Basin during 2001–2019. Ecol. Inform. 2022, 69, 101631. [Google Scholar] [CrossRef]
- Amundson, R.; Berhe, A.A.; Hopmans, J.W.; Olson, C.; Sztein, A.E.; Sparks, D.L. Soil science. Soil and human security in the 21st century. Science 2015, 348, 1261071. [Google Scholar] [CrossRef] [PubMed]
- Deng, L.; Liu, G.B.; Shangguan, Z.P. Land-use conversion and changing soil carbon stocks in China’s ‘Grain-for-Green’ Program: A synthesis. Glob. Chang. Biol. 2014, 20, 3544–3556. [Google Scholar] [CrossRef] [PubMed]
- Liang, X.; Guan, Q.; Clarke, K.C.; Liu, S.; Wang, B.; Yao, Y. Understanding the drivers of sustainable land expansion using a patch-generating land use simulation (PLUS) model: A case study in Wuhan, China. Comp. Environ. Urban Syst. 2021, 85, 101569. [Google Scholar] [CrossRef]
- Han, P.; Xiang, J.; Zhao, Q. Spatial differentiation and scenario simulation of cultivated land in mountainous areas of Western Hubei, China: A PLUS model. Environ. Sci. Pollut. Res. Int. 2023, 30, 52804–52817. [Google Scholar] [CrossRef]
- Nelson, E.; Mendoza, G.; Regetz, J.; Polasky, S.; Tallis, H.; Cameron, D.; Chan, K.M.A.; Daily, G.C.; Goldstein, J.; Kareiva, P.M.; et al. Modeling multiple ecosystem services, biodiversity conservation, commodity production, and tradeoffs at landscape scales. Front. Ecol. Environ. 2009, 7, 4–11. [Google Scholar] [CrossRef]
- Zhao, M.; He, Z.; Du, J.; Chen, L.; Lin, P.; Fang, S. Assessing the effects of ecological engineering on carbon storage by linking the CA-Markov and InVEST models. Ecol. Indic. 2019, 98, 29–38. [Google Scholar] [CrossRef]
- Jiang, W.; Deng, Y.; Tang, Z.; Lei, X.; Chen, Z. Modelling the potential impacts of urban ecosystem changes on carbon storage under different scenarios by linking the CLUE-S and the InVEST models. Ecol. Modell. 2017, 345, 30–40. [Google Scholar] [CrossRef]
- Zhang, F.W.; Li, H.Q.; Li, W.Q.; Wang, J.; Yi, L.; Luo, F.; Zhang, G.; Wang, C.; Yang, Y.; Li, Y.; et al. The spatial pattern and regional classifications of topsoil organic carbon and total nitrogen density based on boosted regression trees in the Sanjiangyuan National Park. Acta Ecol. Sin. 2022, 42, 5593–5602. (In Chinese) [Google Scholar]
- Ma, S. Analysis of the Spatial Pattern of Ecosystem Services Based on the In VEST Model: A Case Study of the Giant Panda National Park. Master’s Thesis, Shanghai Normal University Master of Philosophy, Shanghai, China, 2020. (In Chinese). [Google Scholar]
- Yang, H.; Li, Y.D.; Ren, H.; Luo, T.S.; Chen, R.L.; Liu, W.J.; Chen, D.X.; Xu, H.; Zhou, Z.; Lin, M.X.; et al. Soil organic carbon density and influencing factors in tropical virgin forests of Hainan Island, China. Chin. J. Plant Ecol. 2016, 40, 292–303. (In Chinese) [Google Scholar]
- Wang, W.J. Reserve Estimation. Spatio temporal Distribution and Its Influencing Factors of Soil Organic Carbon in Fujian Province. China. Geoscience 2019, 33, 1295. (In Chinese) [Google Scholar]
- Wu, W.B.; Huang, C.F.; Zheng, D.X.; Chen, X.W.; Zhang, S.J.; Kang, H.J.; Miao, S.H. Analysis of Characteristic of Forest Carbon Storage and Destinyin Fujian Province. J. Sichuan Agricult. Univ. 2016, 34, 298–303. (In Chinese) [Google Scholar]
- Guo, S.P. Analysis on carbon stock and potential carbon sequestration in Heilongjiang Province. For. Eng. 2011, 27, 9–11+16. (In Chinese) [Google Scholar]
- Wang, X.C.; Qi, G.; Yu, D.P.; Zhou, L.; Dai, L.M. Carbon storage density and distribution in forest ecosystems in Jilin Province of Northeast China. Chin. J. Appl. Ecol. 2011, 22, 2013–2020. (In Chinese) [Google Scholar]
- Ord, J.K.; Getis, A. Local spatial autocorrelation statistics: Distributional issues and an application. Geogr. Anal. 1995, 27, 286–306. [Google Scholar] [CrossRef]
- Xu, H.; Croot, P.; Zhang, C. Discovering hidden spatial patterns and their associations with controlling factors for potentially toxic elements in topsoil using hot spot analysis and K-means clustering analysis. Environ. Int. 2021, 151, 106456. [Google Scholar] [CrossRef] [PubMed]
- Xu, H.; Demetriades, A.; Reimann, C.; Jimenez, J.J.; Filser, J.; Zhang, C.; Team, G.P. Identification of the co-existence of low total organic carbon contents and low pH values in agricultural soil in north-central Europe using hot spot analysis based on GEMAS project data. Sci. Total Environ. 2019, 678, 94–104. [Google Scholar] [CrossRef] [PubMed]
- Tran, D.X.; Pla, F.; Latorre-Carmona, P.; Myint, S.W.; Caetano, M.; Kieu, H.V. Characterizing the relationship between land use land cover change and land surface temperature. ISPRS J. Photogram. Remote Sens. 2017, 124, 119–132. [Google Scholar] [CrossRef]
- Wu, W.; Zeng, H.; Guo, C.; You, W.; Xu, H.; Hu, Y.; Wang, M.; Liu, X. Spatial heterogeneity and management challenges of ecosystem service trade-offs: A case study in Guangdong Province, China. Environ. Manag. 2023, 26, 1–17. [Google Scholar] [CrossRef]
- Xu, W.J.; Song, J.X.; Long, Y.Q.; Mao, R.C.; Tang, B.; Li, B.J. Analysis and simulation of the driving mechanism and ecological effects of land cover change in the Weihe River basin, China. J. Environ. Manag. 2023, 344, 118320. [Google Scholar] [CrossRef]
- Chen, C.; Park, T.; Wang, X.; Piao, S.; Xu, B.; Chaturvedi, R.K.; Fuchs, R.; Brovkin, V.; Ciais, P.; Fensholt, R.; et al. China and India lead in greening of the world through land-use management. Nat. Sustain. 2019, 2, 122–129. [Google Scholar] [CrossRef]


Disclaimer/Publisher’s Note: The statements, opinions and data contained in all publications are solely those of the individual author(s) and contributor(s) and not of MDPI and/or the editor(s). MDPI and/or the editor(s) disclaim responsibility for any injury to people or property resulting from any ideas, methods, instructions or products referred to in the content. |
© 2023 by the authors. Licensee MDPI, Basel, Switzerland. This article is an open access article distributed under the terms and conditions of the Creative Commons Attribution (CC BY) license (https://creativecommons.org/licenses/by/4.0/).