
A Framework Using Open-Source Software for Land Use Prediction and Climate Data Time Series Analysis in a Protected Area of Portugal: Alvão Natural Park

 ,
,  ,
,  ,
,  ,
, 
Abstract
1. Introduction
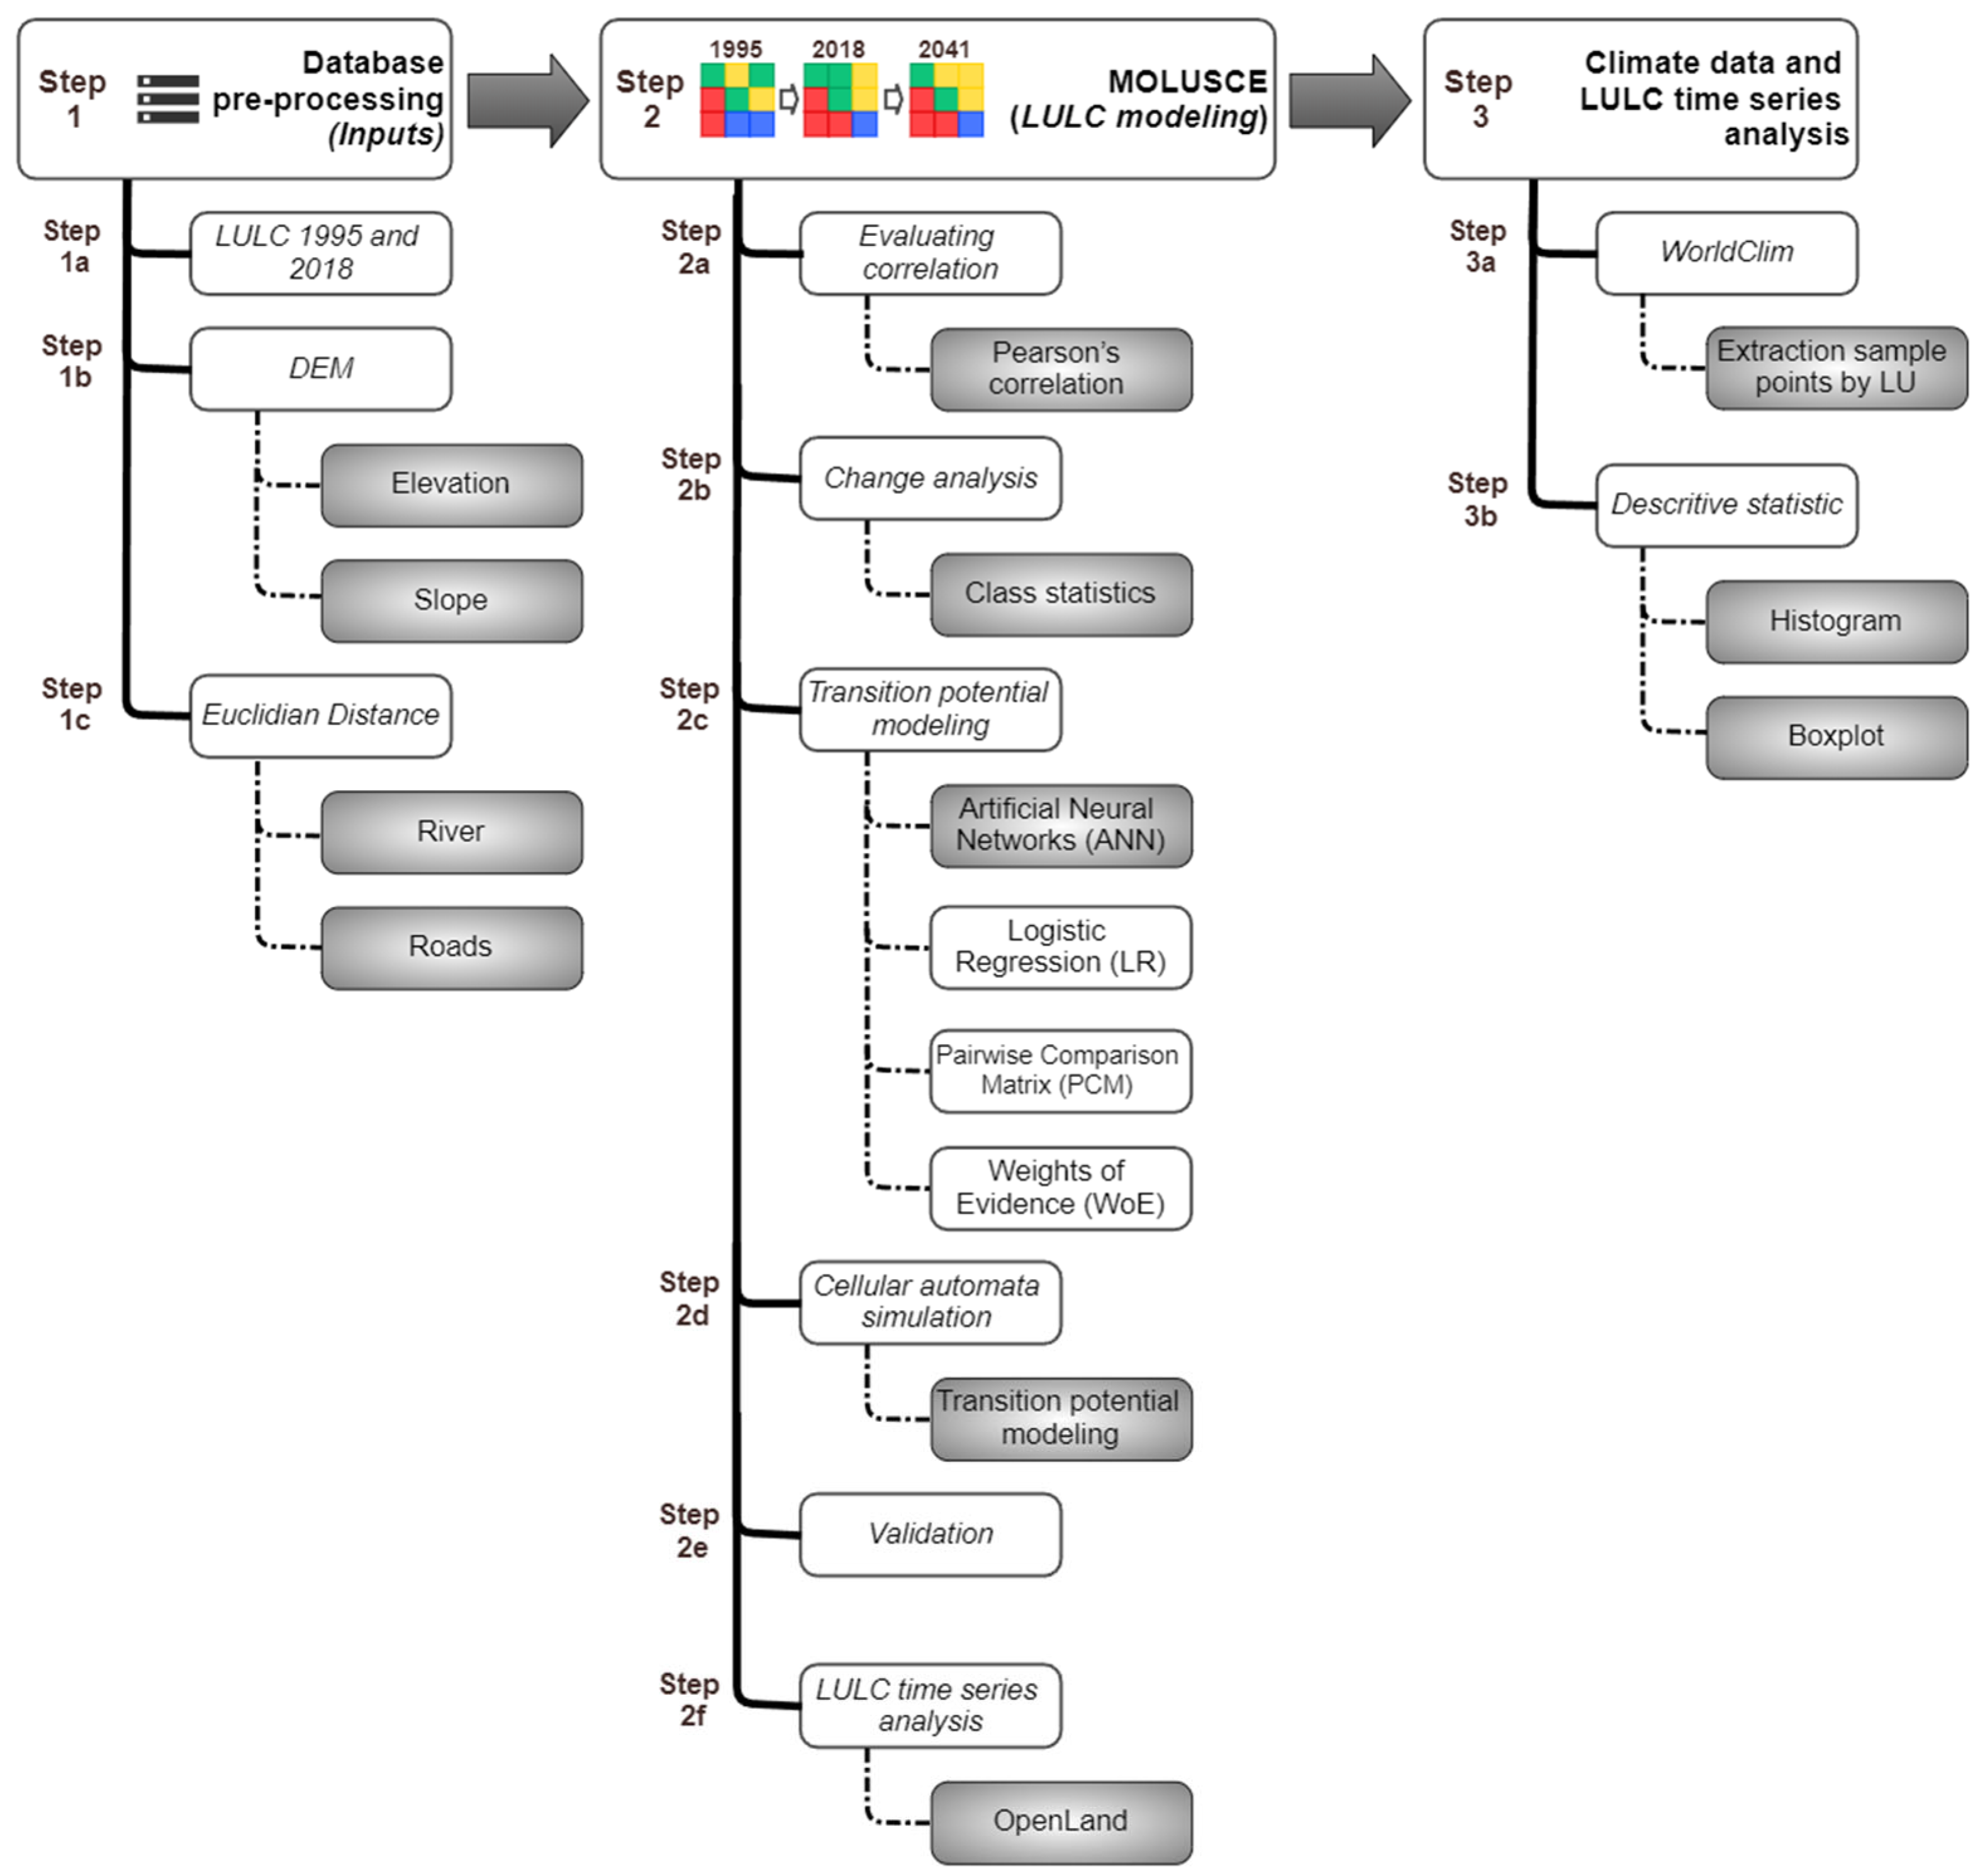
2. Materials and Methods
2.1. Inputs
2.2. Evaluating Correlation
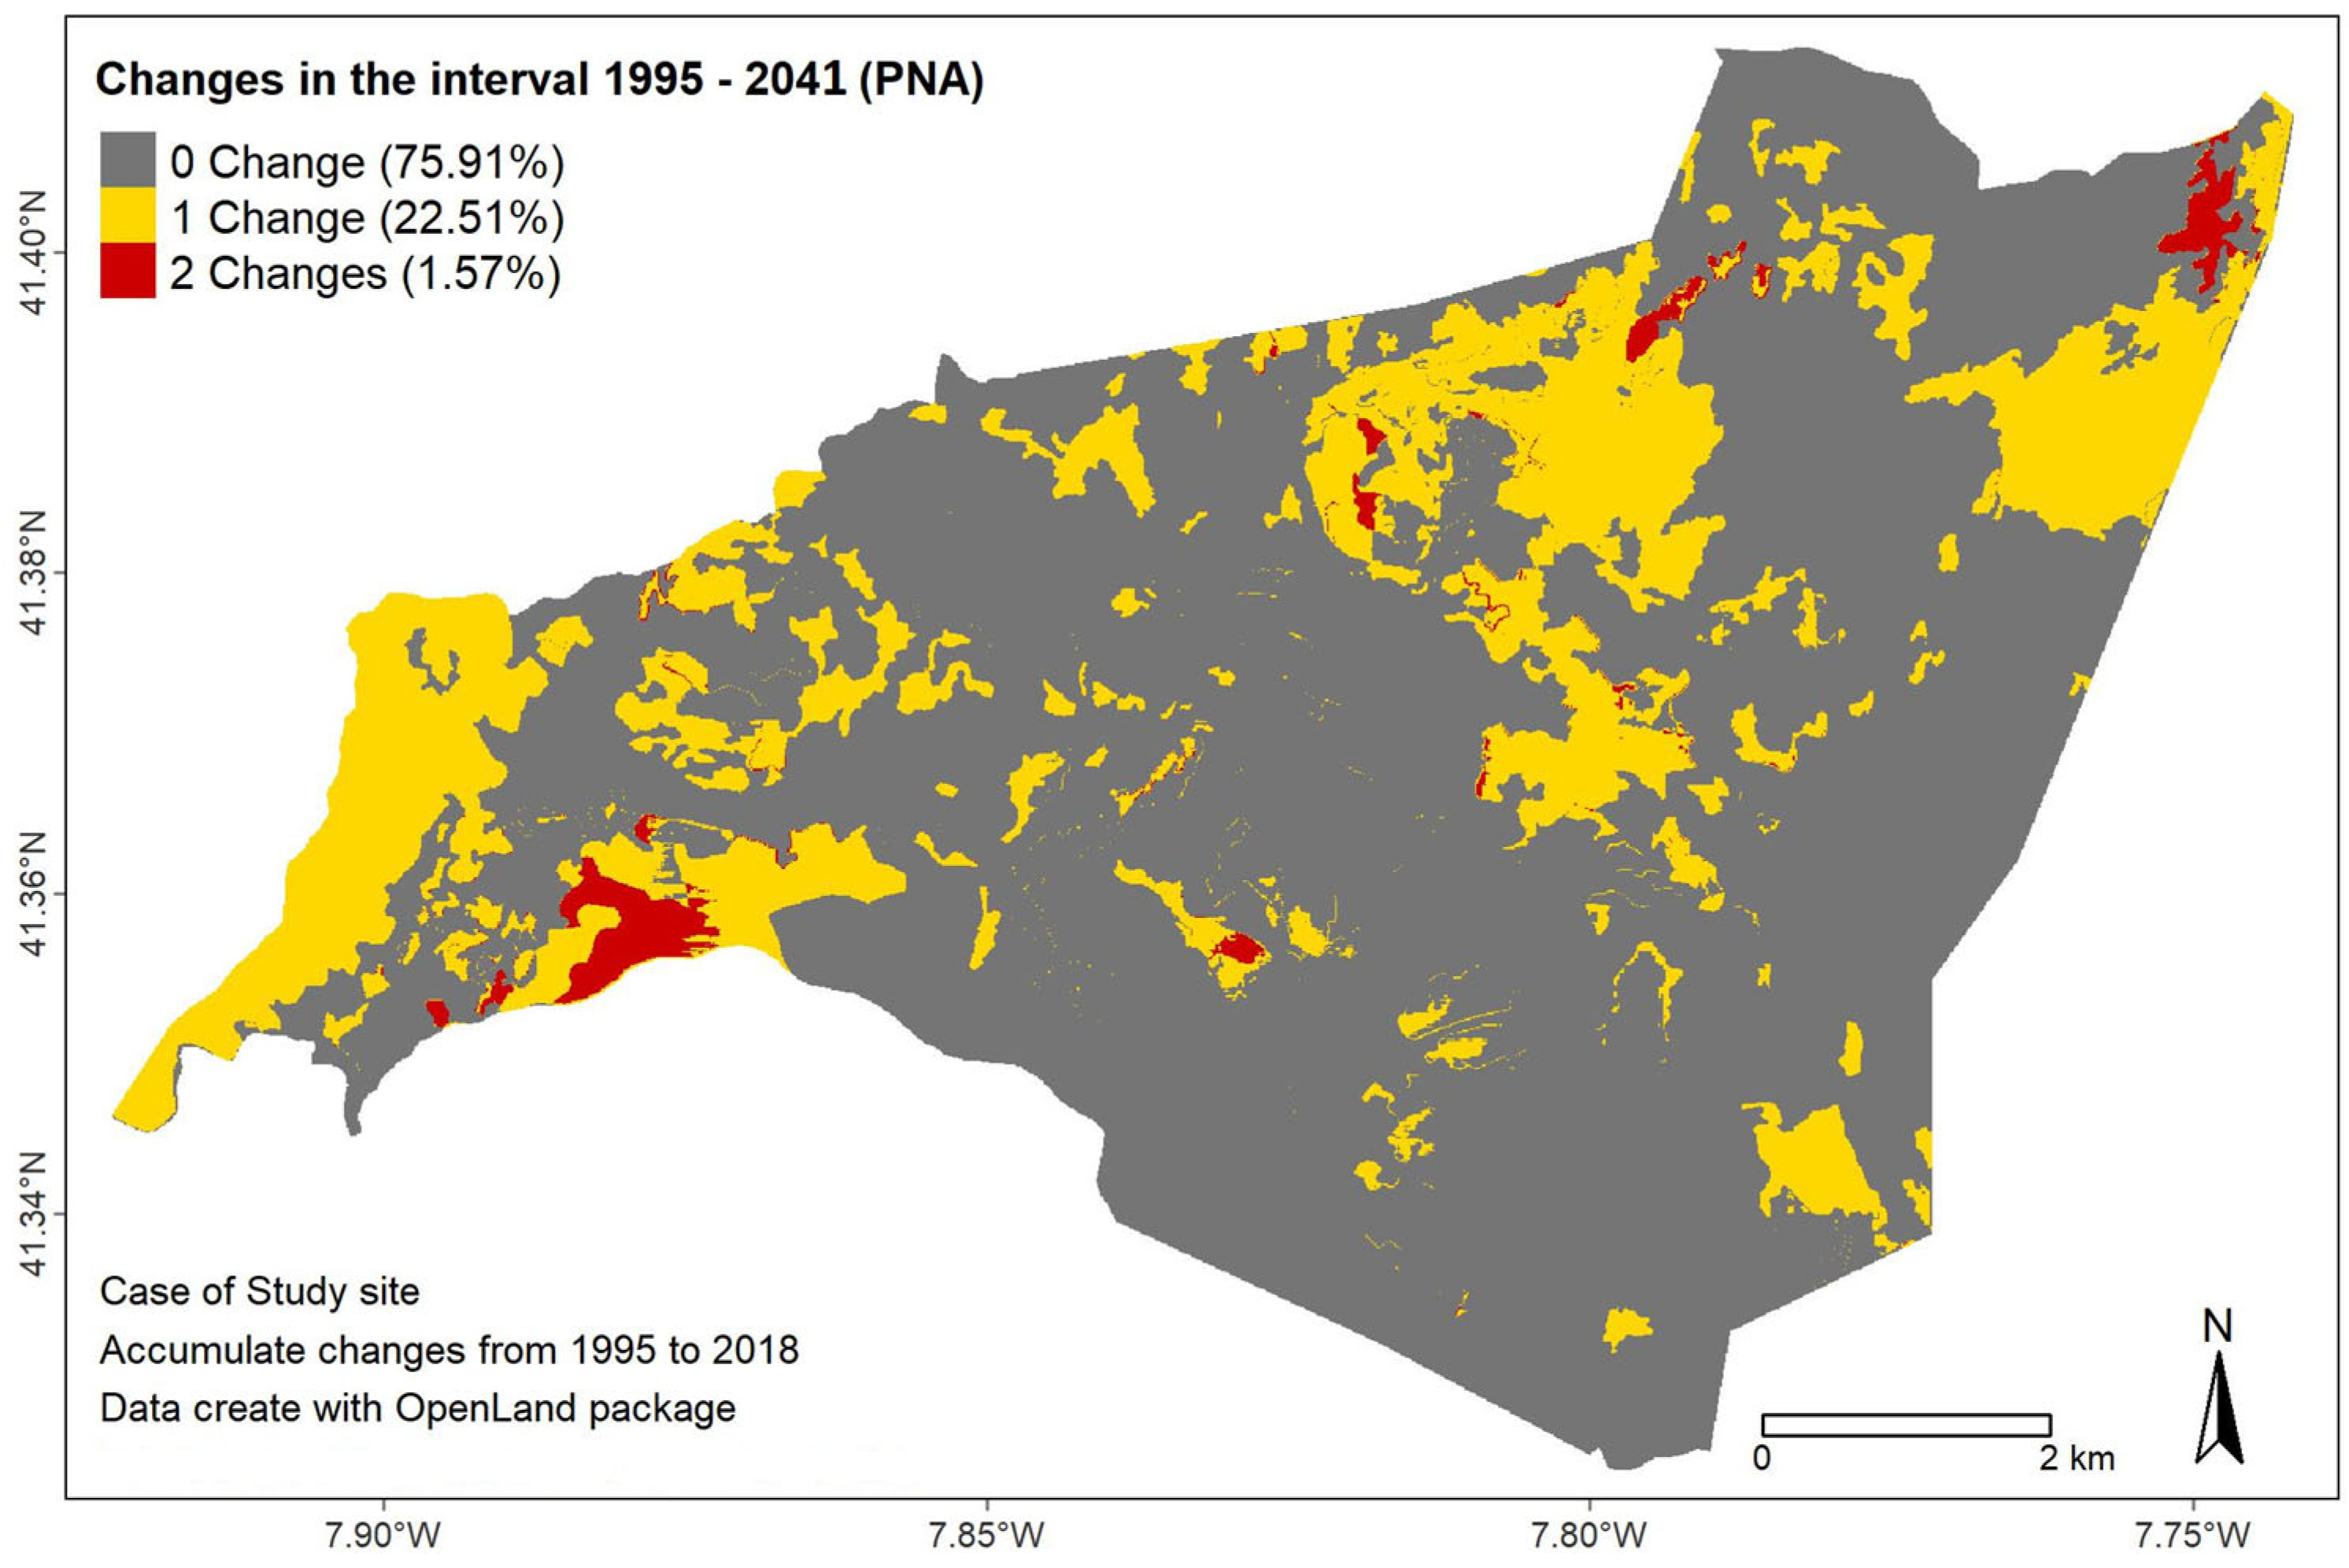
2.3. Change Analysis
2.4. Transition Potential Modeling
- -
- Neighborhood, that defines the number of pixels neighboring to the central pixel. For this analysis, we set the size to 1, which is equivalent to a 3 × 3 matrix.
- -
- Learning rate, momentum, and maximum iterations which define the model learning parameters. Among these parameters, the learning rate determines the speed of the model learning; large rates enable fast but unstable learning that results in spikes in the graph, whereas small rates provide stable but slow learning. We set the values to 0.001 for the learning rate, 100 for maximum iterations, and 0.005 for momentum.
- -
- Hidden layers, which is a list of numbers (n1, n2, n3…, nk), where n1 is the number of neurons in the first hidden layer, n2 is the number of neurons in the second, and so on up to nk, which is the number of neurons in the last hidden layer. For this research, we set the value to 10 for the hidden layers.
2.5. Cellular Automata Simulation and Validation
2.6. LULC Time Series Analysis
2.7. Climate Data and LULC Time Series Analysis
3. Results
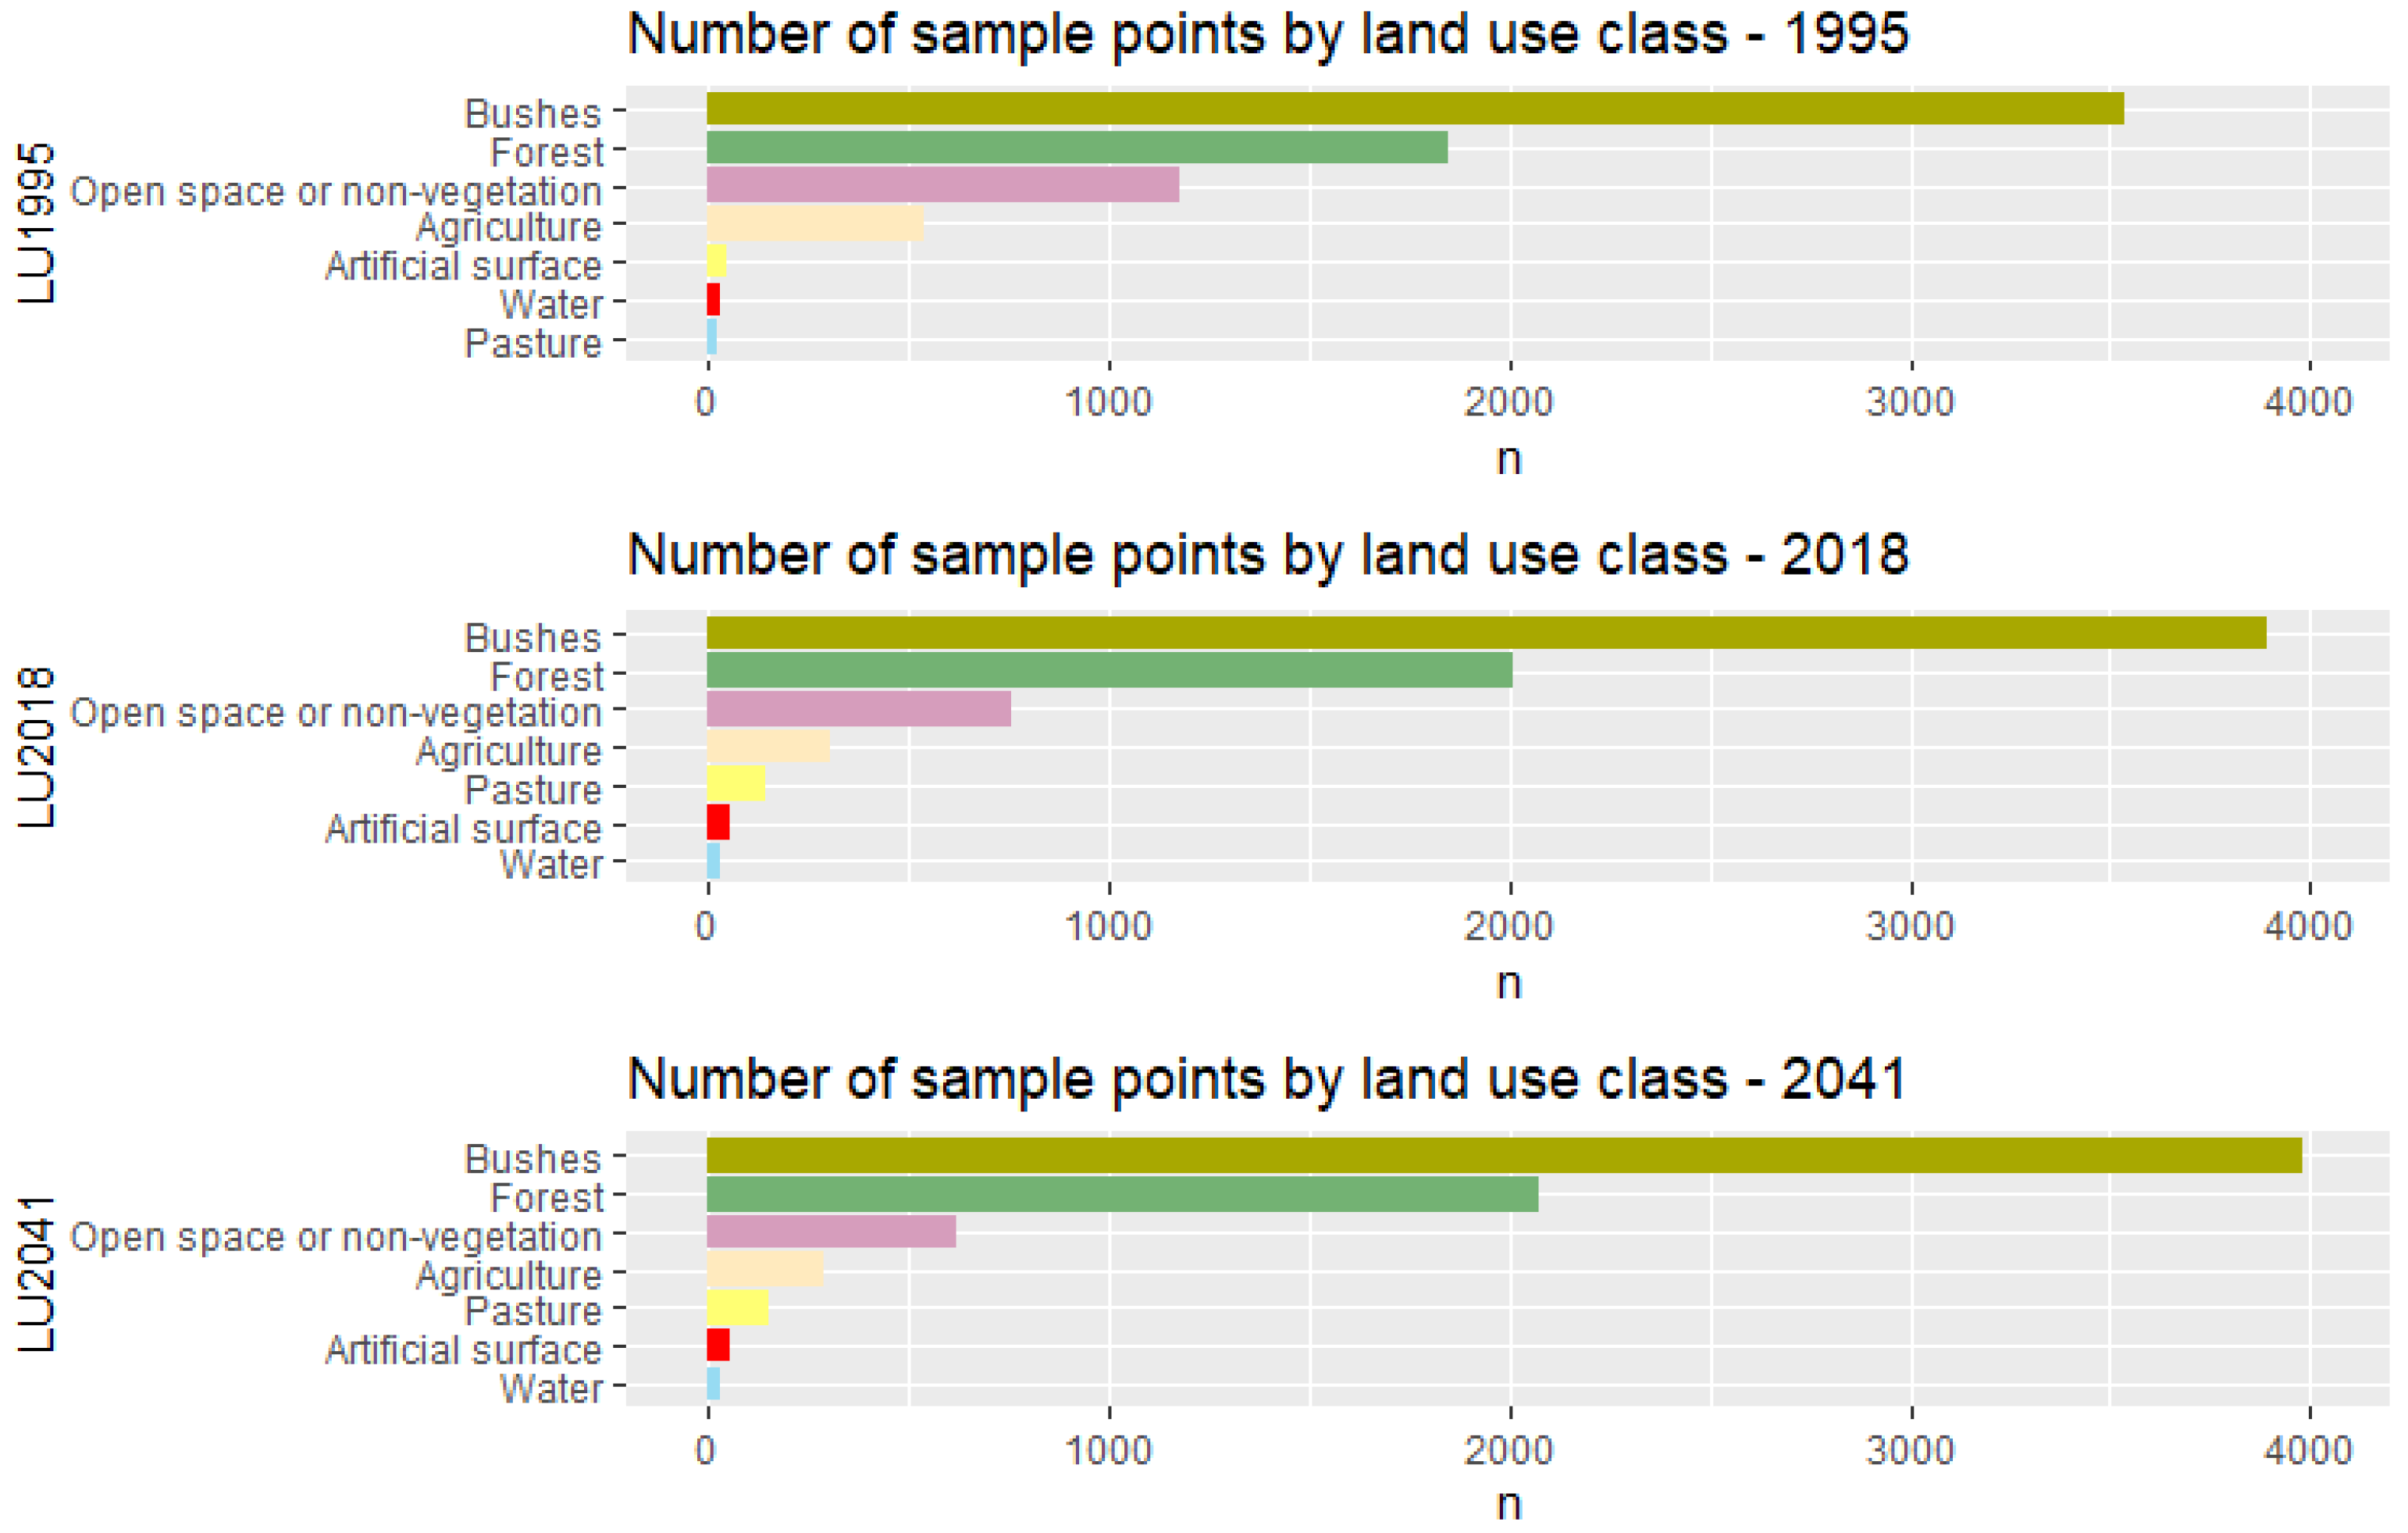
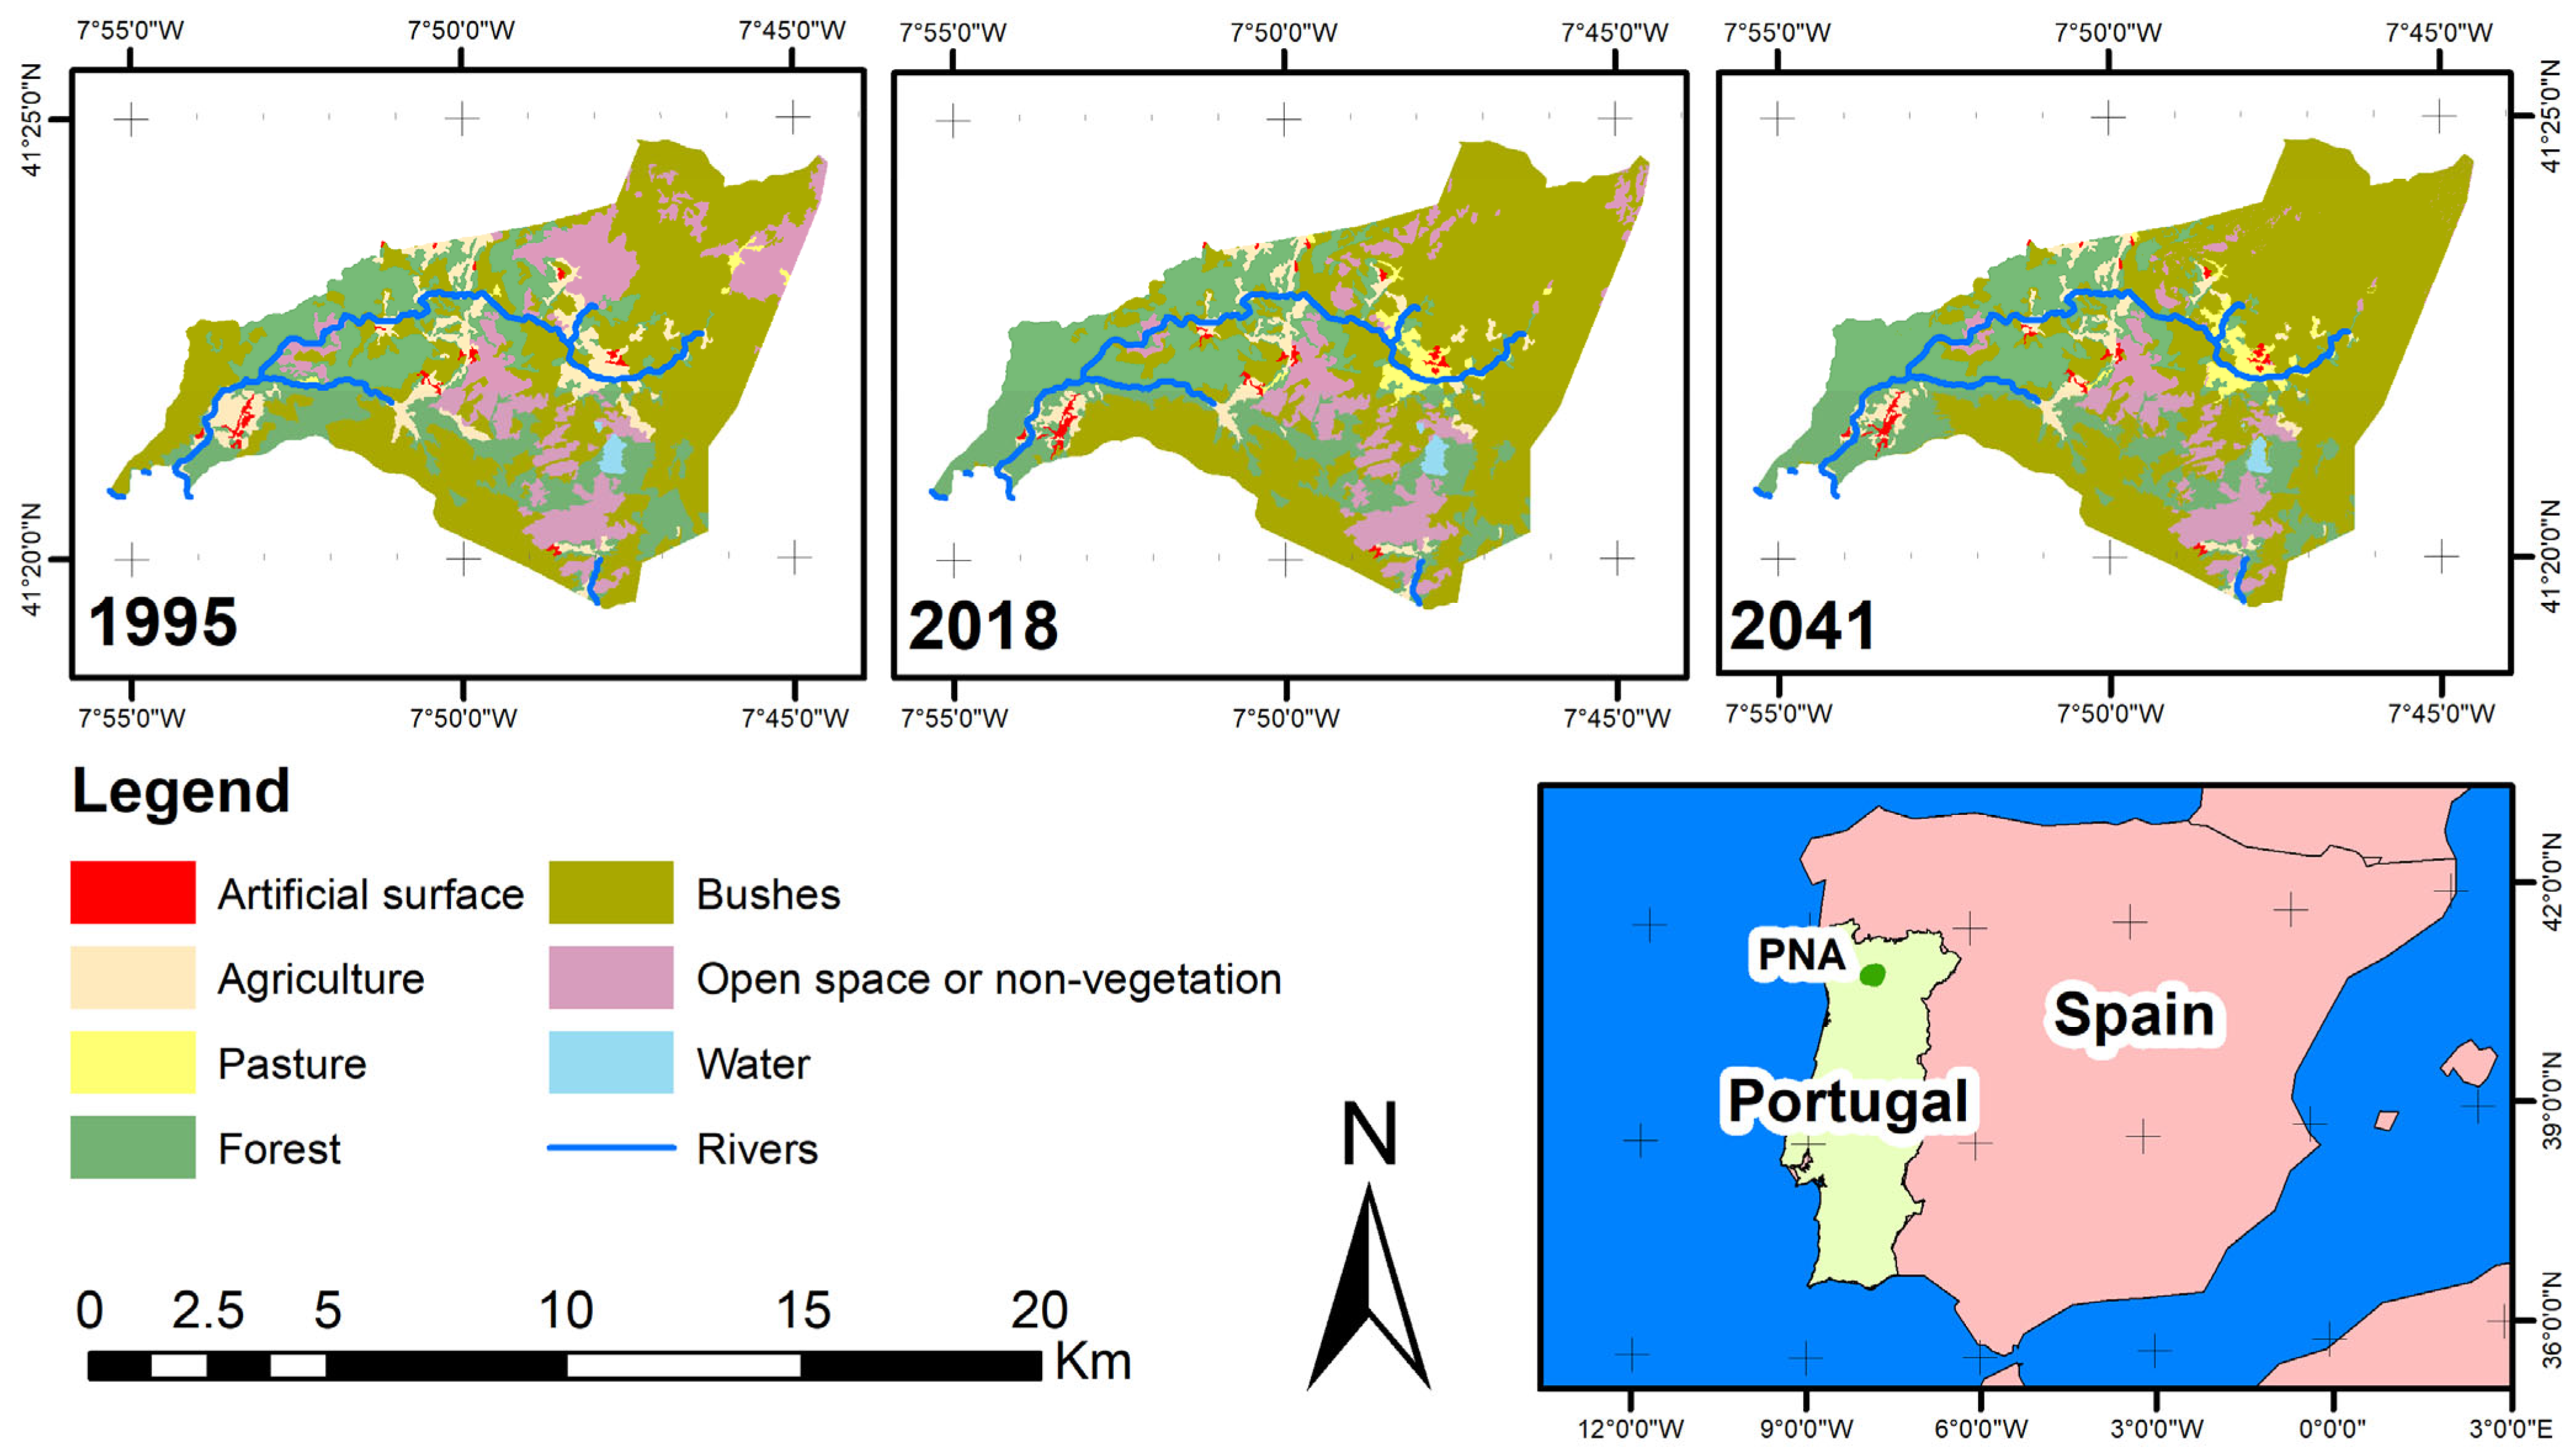
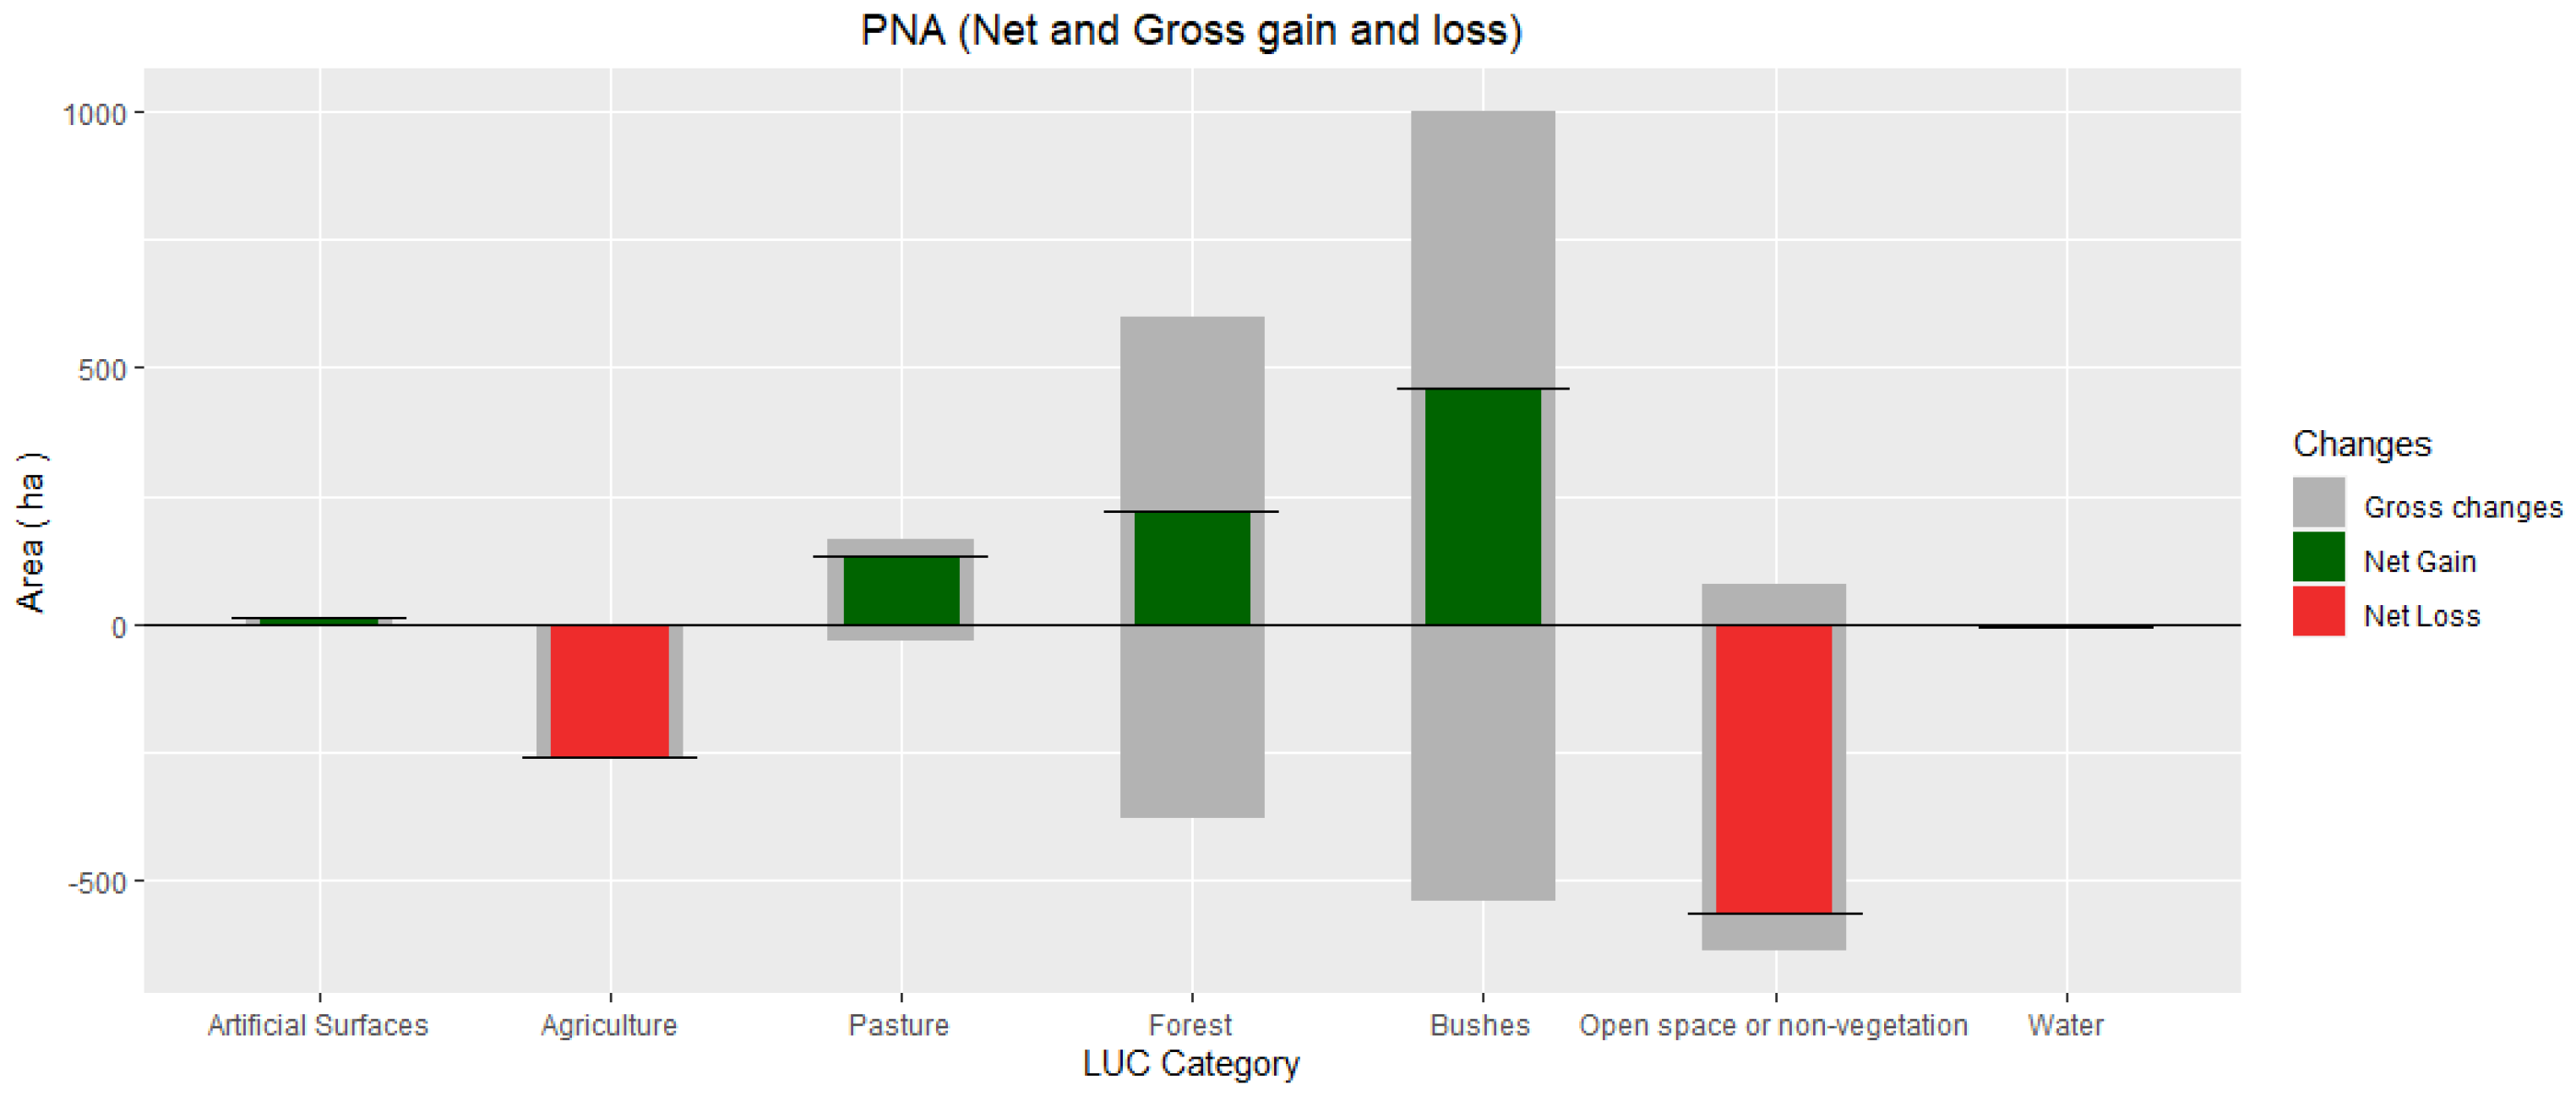
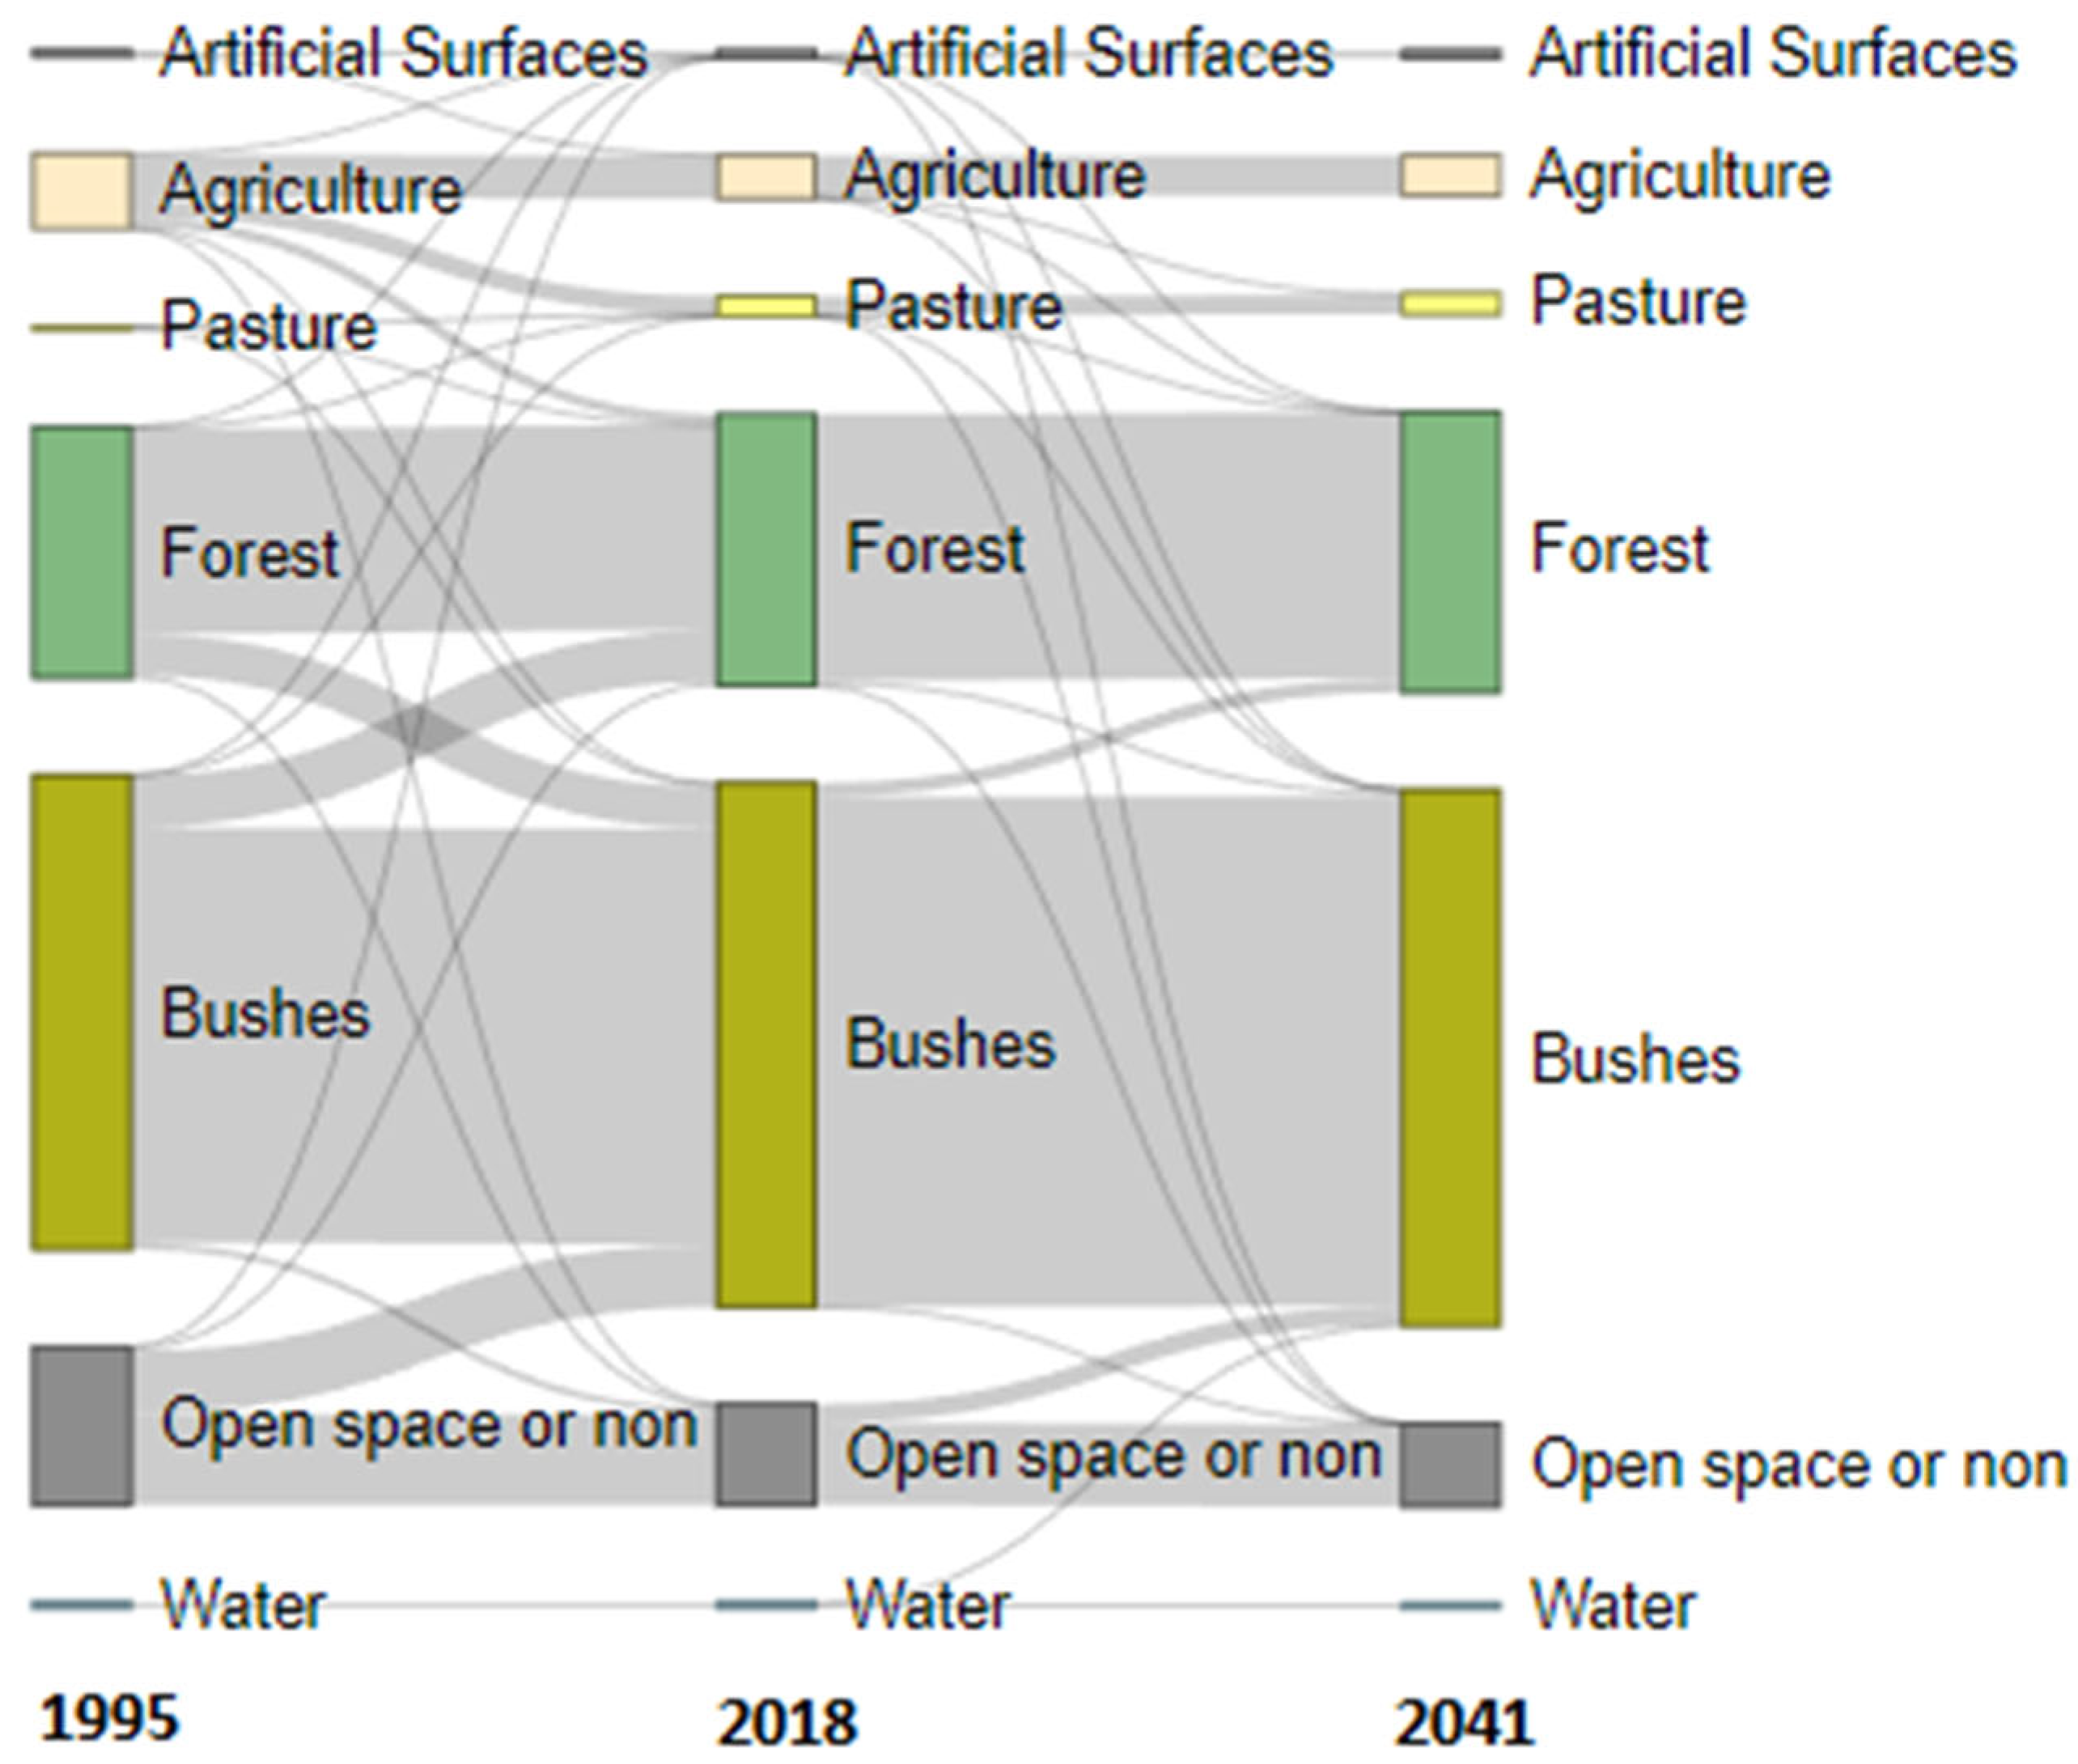
3.1. LULC
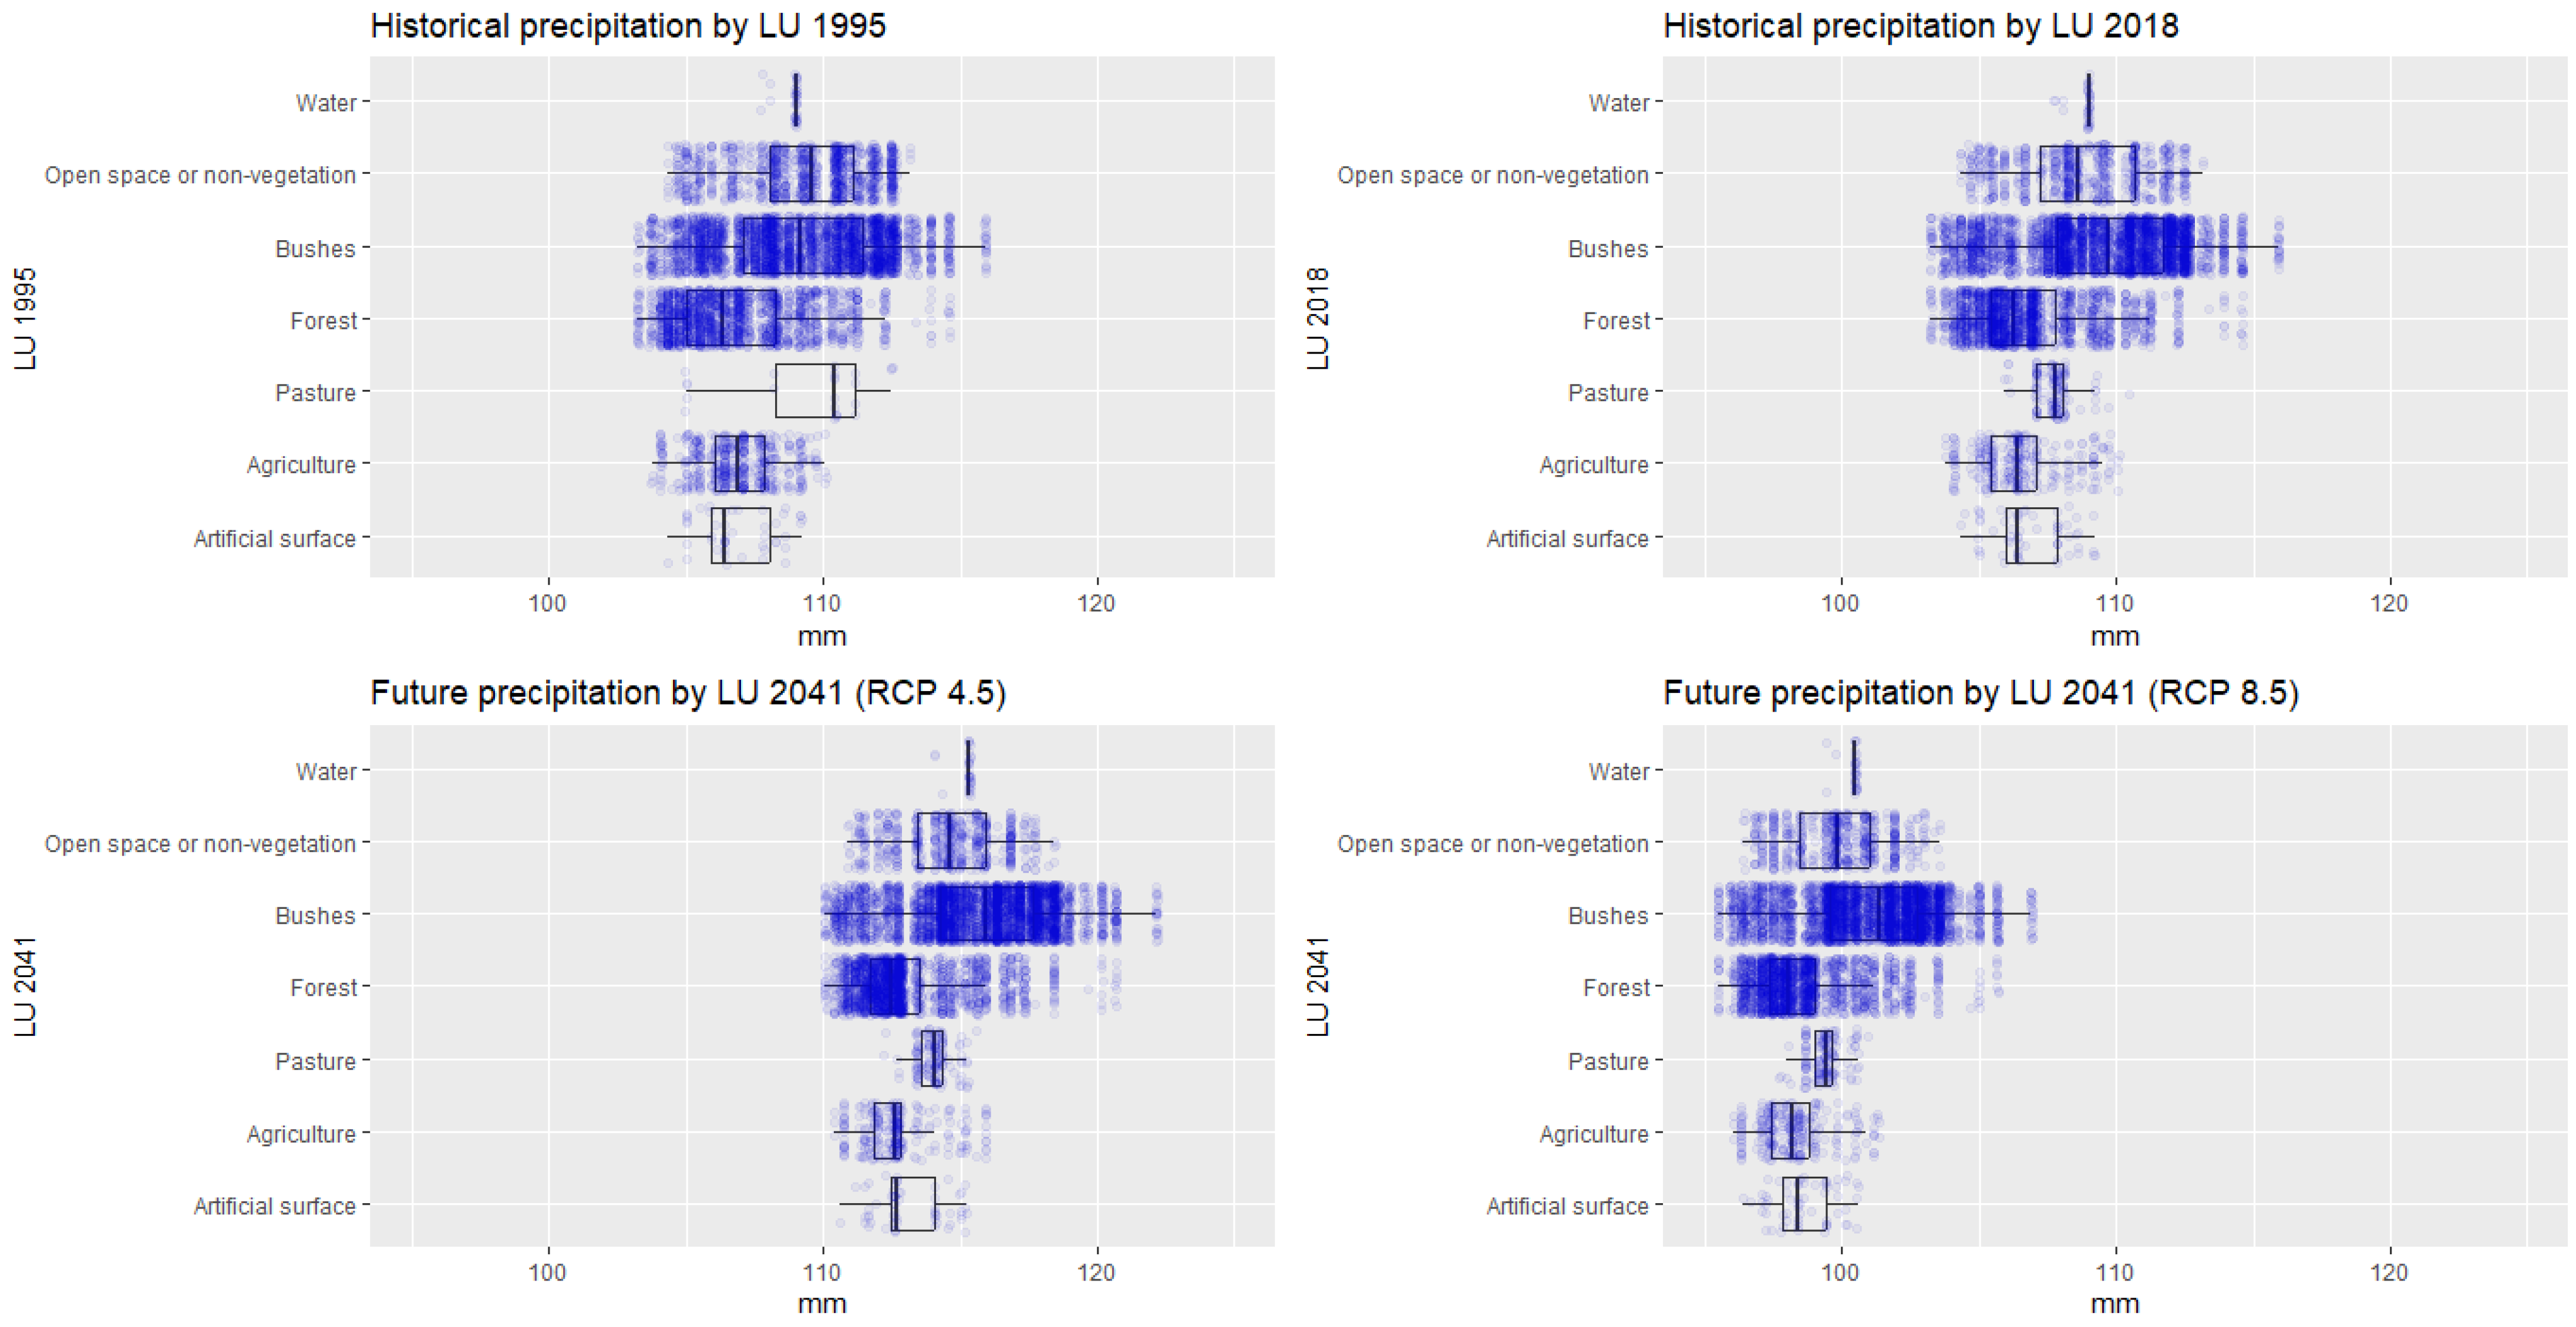
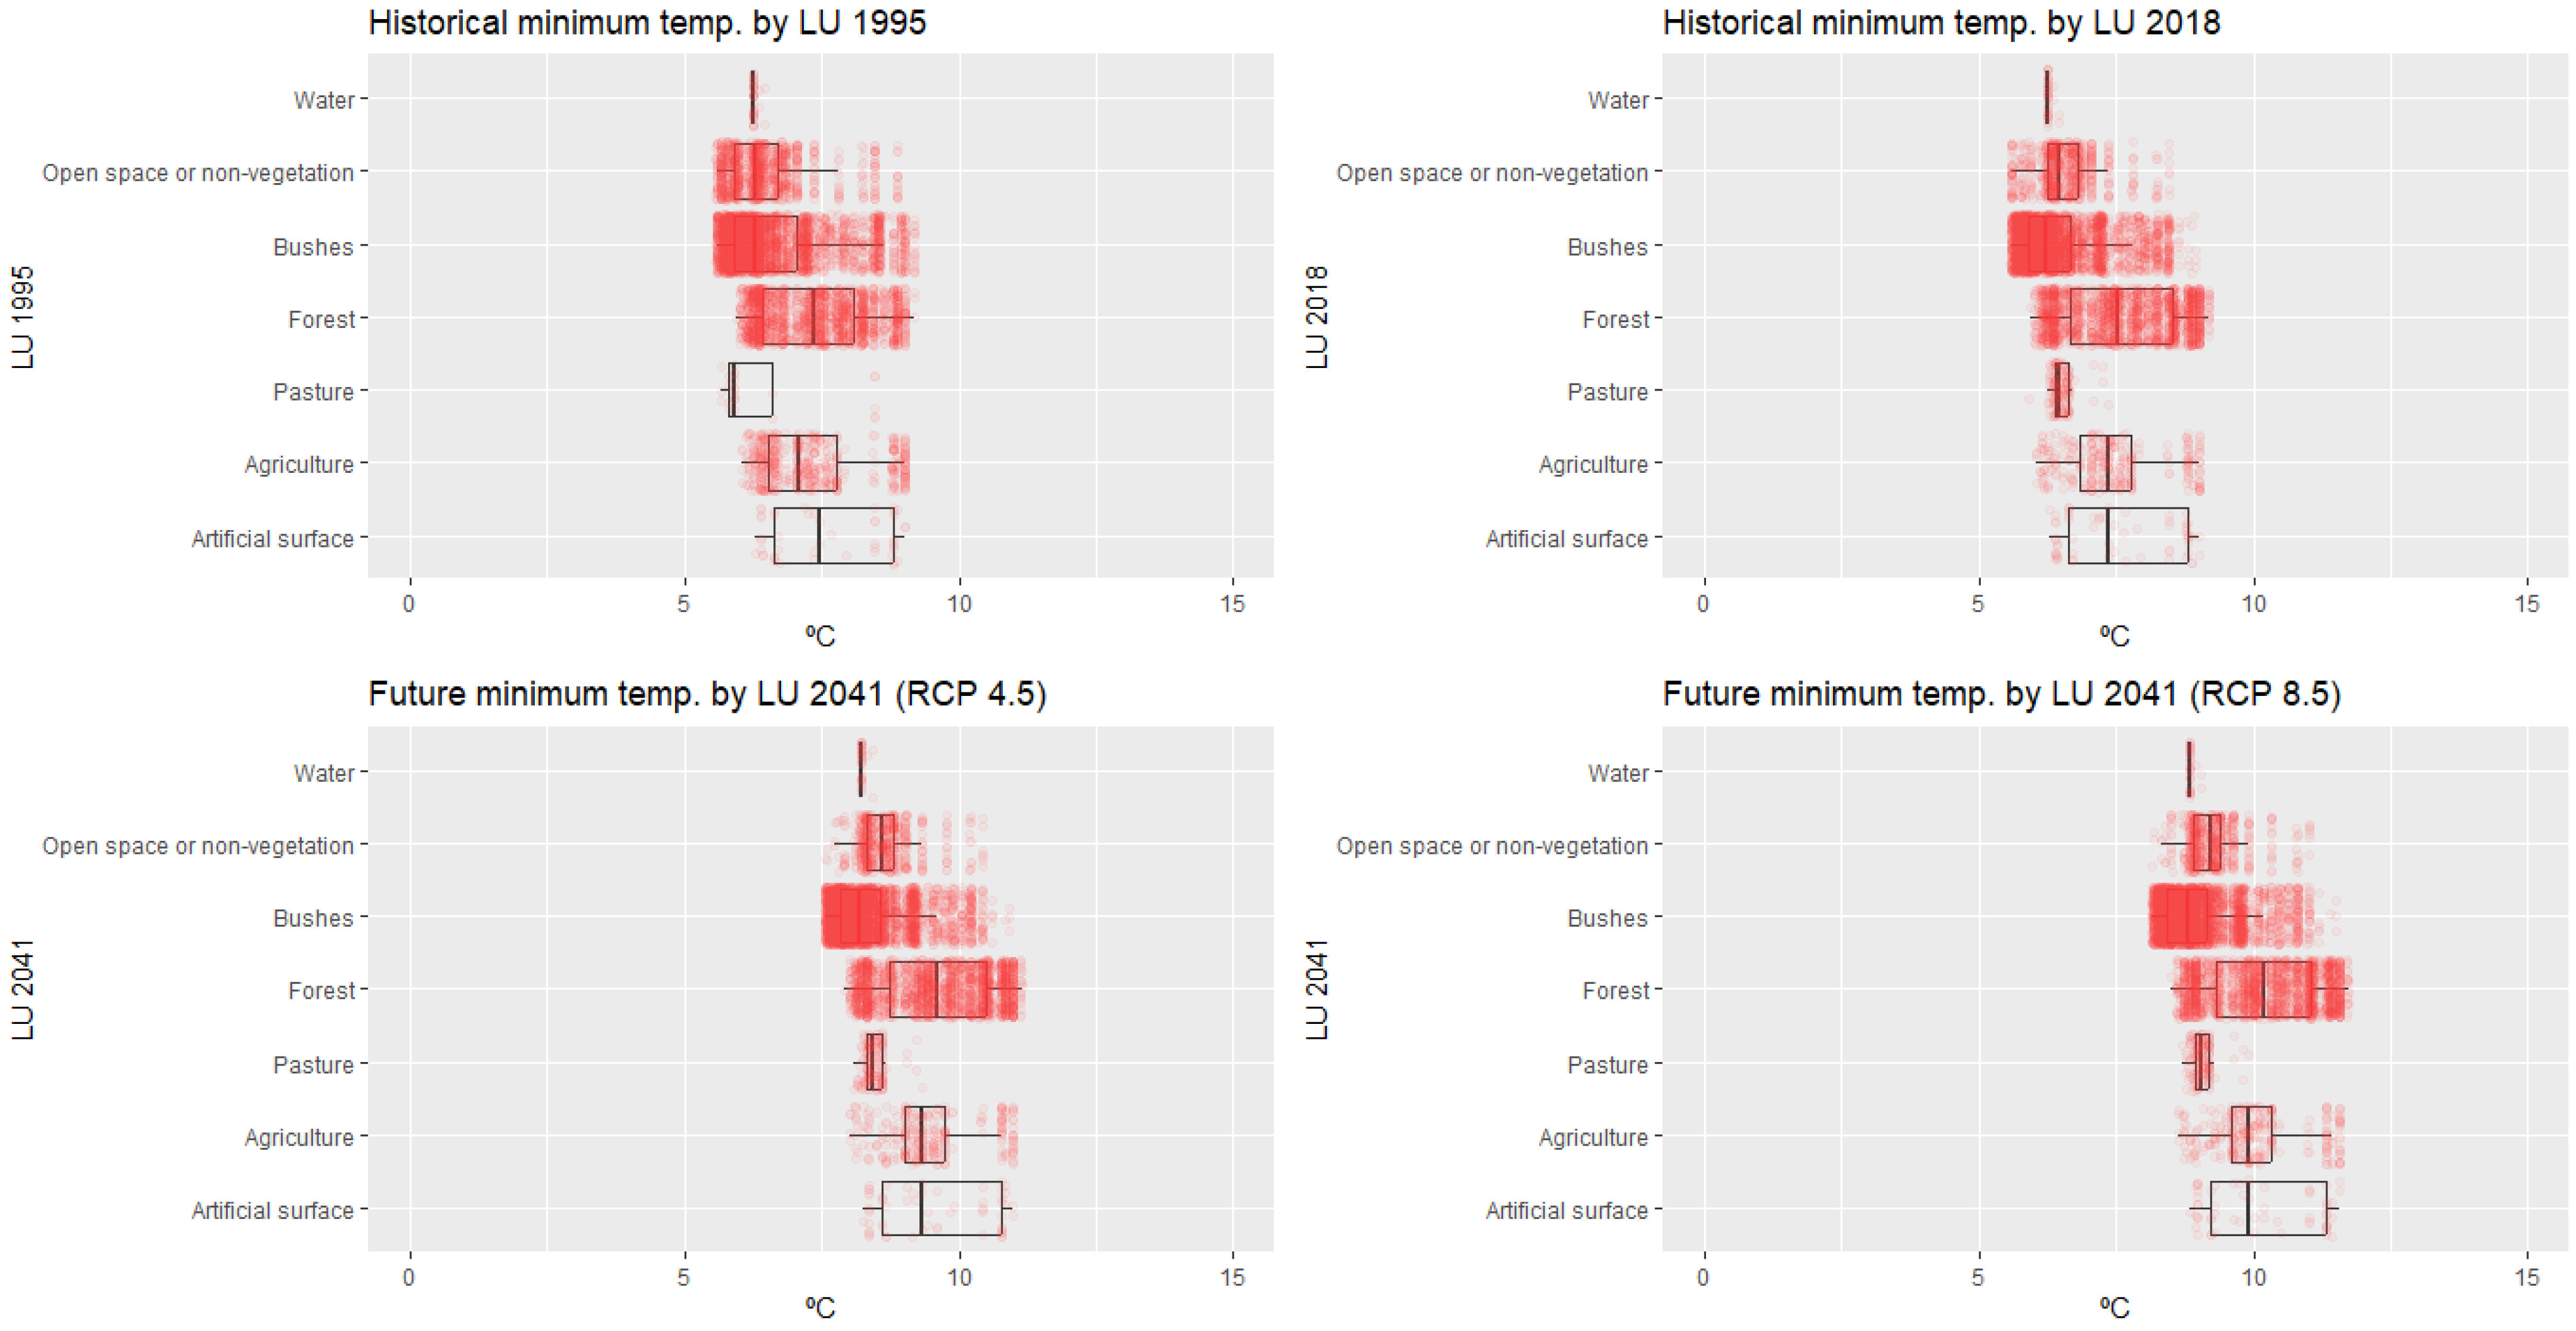
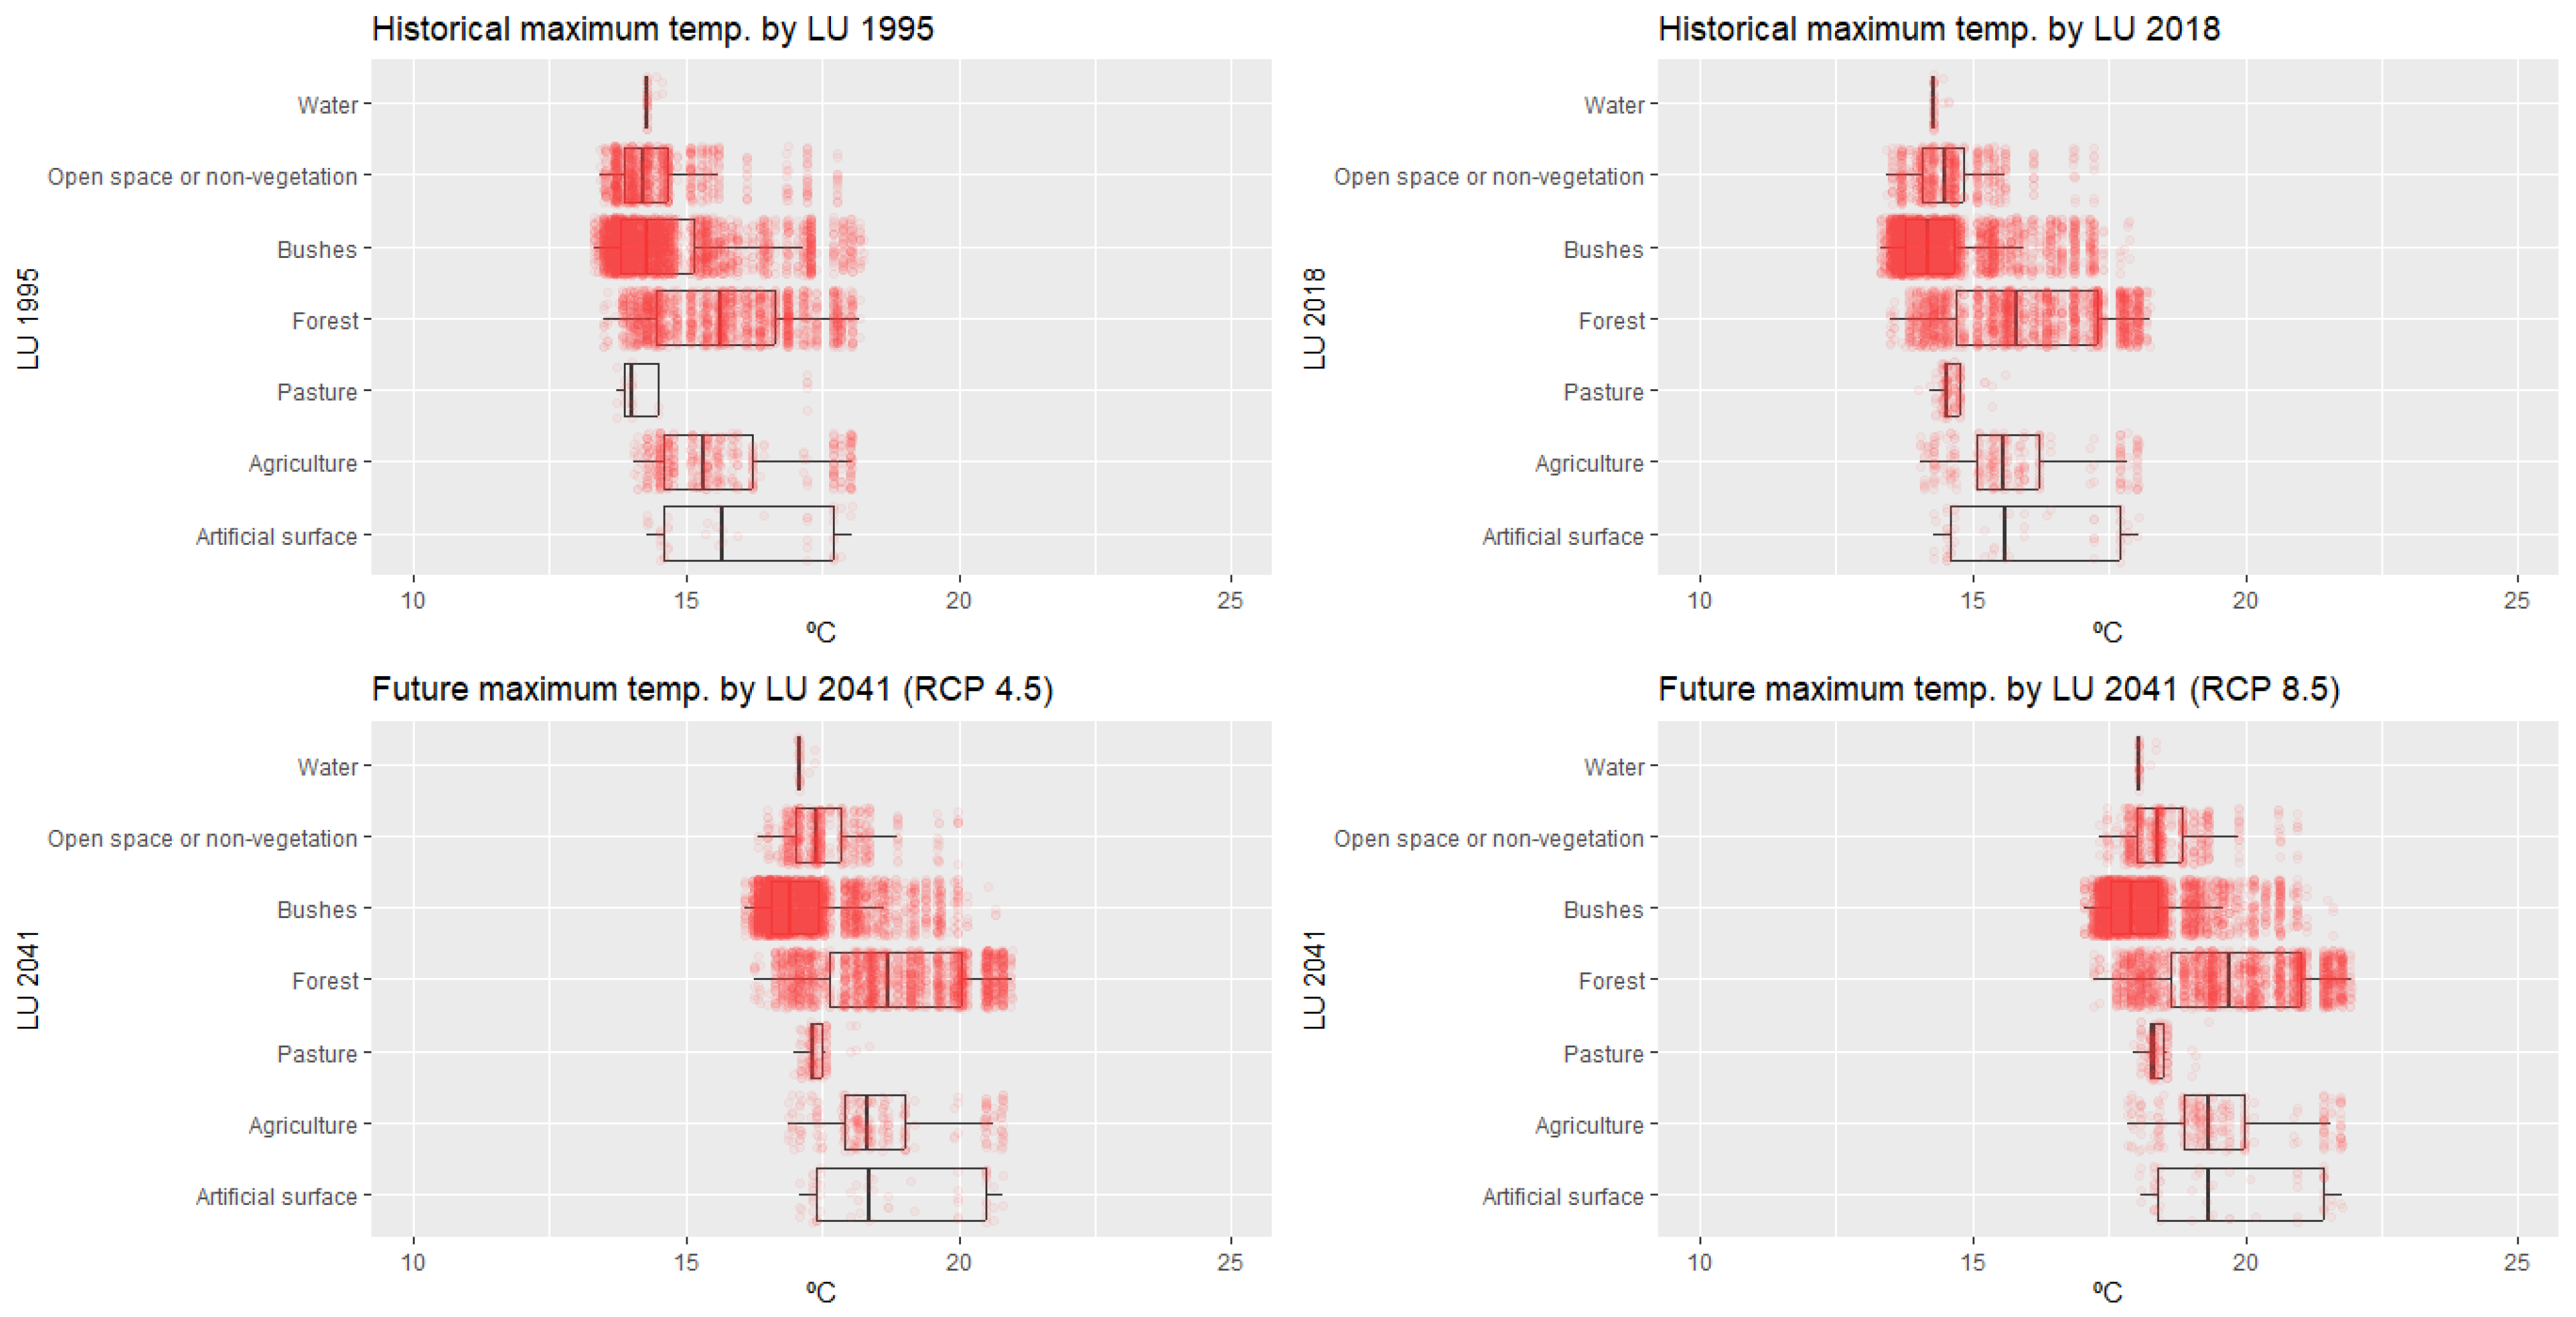
3.2. Climate Historical and Future Data by Land Use Classes in 1995, 2018, and 2041
4. Discussion
5. Conclusions
Supplementary Materials
Author Contributions
Funding
Data Availability Statement
Conflicts of Interest
References
- UN. The Millennium Development Goals Resport; UN: New York, NY, USA, 2015.
- Sobhani, P.; Esmaeilzadeh, H.; Barghjelveh, S.; Sadeghi, S.M.M.; Marcu, M.V. Habitat Integrity in Protected Areas Threatened by LULC Changes and Fragmentation: A Case Study in Tehran Province, Iran. Land 2021, 11, 6. [Google Scholar] [CrossRef]
- Ervin, J.; Sekhran, N.; Gidda, S.; Vergeichik, M.; Mee, J. PAs for the 21st Century: Lessons from UNDP/GEF’s Portfolio; UNDP: New York, NY, USA, 2010. [Google Scholar]
- Watson, J.E.M.; Dudley, N.; Segan, D.B.; Hockings, M. The Performance and Potential of Protected Areas. Nature 2014, 515, 67–73. [Google Scholar] [CrossRef] [PubMed]
- Convention on Biological Diversity. COP 10 Decision X/2: Strategic Plan for Biodiversity 2011–2020; Convention on Biological Diversity: Montreal, QC, Canada, 2010. [Google Scholar]
- Melillo, J.M.; Lu, X.; Kicklighter, D.W.; Reilly, J.M.; Cai, Y.; Sokolov, A.P. Protected Areas’ Role in Climate-Change Mitigation. Ambio 2016, 45, 133–145. [Google Scholar] [CrossRef]
- Silva, R.M.d.; Lopes, A.G.; Santos, C.A.G. Deforestation and Fires in the Brazilian Amazon from 2001 to 2020: Impacts on Rainfall Variability and Land Surface Temperature. J. Environ. Manag. 2023, 326, 116664. [Google Scholar] [CrossRef] [PubMed]
- Folharini, S.d.O.; de Melo, S.N.; Cameron, S.R. Effect of Protected Areas on Forest Crimes in Brazil. J. Environ. Plan. Manag. 2022, 65, 272–287. [Google Scholar] [CrossRef]
- da Silva, R.F.B.; de Castro Victoria, D.; Nossack, F.Á.; Viña, A.; Millington, J.D.A.; Vieira, S.A.; Batistella, M.; Moran, E.; Liu, J. Slow-down of Deforestation Following a Brazilian Forest Policy Was Less Effective on Private Lands than in All Conservation Areas. Commun. Earth Environ. 2023, 4, 111. [Google Scholar] [CrossRef]
- Kleemann, J.; Zamora, C.; Villacis-Chiluisa, A.B.; Cuenca, P.; Koo, H.; Noh, J.K.; Fürst, C.; Thiel, M. Deforestation in Continental Ecuador with a Focus on Protected Areas. Land 2022, 11, 268. [Google Scholar] [CrossRef]
- Dietz, J.; Treydte, A.C.; Lippe, M. Exploring the Future of Kafue National Park, Zambia: Scenario-Based Land Use and Land Cover Modelling to Understand Drivers and Impacts of Deforestation. Land Use Policy 2023, 126, 106535. [Google Scholar] [CrossRef]
- Yangouliba, G.I.; Zoungrana, B.J.-B.; Hackman, K.O.; Koch, H.; Liersch, S.; Sintondji, L.O.; Dipama, J.-M.; Kwawuvi, D.; Ouedraogo, V.; Yabré, S.; et al. Modelling Past and Future Land Use and Land Cover Dynamics in the Nakambe River Basin, West Africa. Model. Earth Syst. Environ. 2022, 9, 1651–1667. [Google Scholar] [CrossRef]
- Mingarro, M.; Lobo, J.M. European National Parks Protect Their Surroundings but Not Everywhere: A Study Using Land Use/Land Cover Dynamics Derived from CORINE Land Cover Data. Land Use Policy 2023, 124, 106434. [Google Scholar] [CrossRef]
- Kubacka, M.; Żywica, P.; Vila Subirós, J.; Bródka, S.; Macias, A. How Do the Surrounding Areas of National Parks Work in the Context of Landscape Fragmentation? A Case Study of 159 Protected Areas Selected in 11 EU Countries. Land Use Policy 2022, 113, 105910. [Google Scholar] [CrossRef]
- Sohl, T.L.; Claggett, P.R. Clarity versus Complexity: Land-Use Modeling as a Practical Tool for Decision-Makers. J. Environ. Manag. 2013, 129, 235–243. [Google Scholar] [CrossRef]
- Halmy, M.W.A.; Gessler, P.E.; Hicke, J.A.; Salem, B.B. Land Use/Land Cover Change Detection and Prediction in the North-Western Coastal Desert of Egypt Using Markov-CA. Appl. Geogr. 2015, 63, 101–112. [Google Scholar] [CrossRef]
- Manandhar, R.; Odeh, I.; Ancev, T. Improving the Accuracy of Land Use and Land Cover Classification of Landsat Data Using Post-Classification Enhancement. Remote Sens. 2009, 1, 330–344. [Google Scholar] [CrossRef]
- Singh, S.K.; Mustak, S.; Srivastava, P.K.; Szabó, S.; Islam, T. Predicting Spatial and Decadal LULC Changes Through Cellular Automata Markov Chain Models Using Earth Observation Datasets and Geo-Information. Environ. Process. 2015, 2, 61–78. [Google Scholar] [CrossRef]
- Lantman, J.v.S.; Verburg, P.H.; Bregt, A.; Geertman, S. Core Principles and Concepts in Land-Use Modelling: A Literature Review. In Land-Use Modelling in Planning Practice; Koomen, E., Borsboom-van Beurden, J., Eds.; GeoJournal Library, Springer: Berlin/Heidelberg, Germany, 2011; Volume 101, pp. 35–57. ISBN 978-94-007-1821-0. [Google Scholar]
- Kindu, M.; Schneider, T.; Teketay, D.; Knoke, T. Changes of Ecosystem Service Values in Response to Land Use/Land Cover Dynamics in Munessa–Shashemene Landscape of the Ethiopian Highlands. Sci. Total Environ. 2016, 547, 137–147. [Google Scholar] [CrossRef] [PubMed]
- Nelson, E.; Sander, H.; Hawthorne, P.; Conte, M.; Ennaanay, D.; Wolny, S.; Manson, S.; Polasky, S. Projecting Global Land-Use Change and Its Effect on Ecosystem Service Provision and Biodiversity with Simple Models. PLoS ONE 2010, 5, e14327. [Google Scholar] [CrossRef]
- Fick, S.E.; Hijmans, R.J. WorldClim 2: New 1-km Spatial Resolution Climate Surfaces for Global Land Areas. Int. J. Climatol. 2017, 37, 4302–4315. [Google Scholar] [CrossRef]
- Panagos, P.; Ballabio, C.; Meusburger, K.; Spinoni, J.; Alewell, C.; Borrelli, P. Towards Estimates of Future Rainfall Erosivity in Europe Based on REDES and WorldClim Datasets. J. Hydrol. 2017, 548, 251–262. [Google Scholar] [CrossRef] [PubMed]
- Pan, Z.; He, J.; Liu, D.; Wang, J. Predicting the Joint Effects of Future Climate and Land Use Change on Ecosystem Health in the Middle Reaches of the Yangtze River Economic Belt, China. Appl. Geogr. 2020, 124, 102293. [Google Scholar] [CrossRef]
- Guo, M.; Ma, S.; Wang, L.-J.; Lin, C. Impacts of Future Climate Change and Different Management Scenarios on Water-Related Ecosystem Services: A Case Study in the Jianghuai Ecological Economic Zone, China. Ecol. Indic. 2021, 127, 107732. [Google Scholar] [CrossRef]
- Hürlimann, M.; Guo, Z.; Puig-Polo, C.; Medina, V. Impacts of Future Climate and Land Cover Changes on Landslide Susceptibility: Regional Scale Modelling in the Val d’Aran Region (Pyrenees, Spain). Landslides 2022, 19, 99–118. [Google Scholar] [CrossRef]
- Andrews, M.B.; Ridley, J.K.; Wood, R.A.; Andrews, T.; Blockley, E.W.; Booth, B.; Burke, E.; Dittus, A.J.; Florek, P.; Gray, L.J.; et al. Historical Simulations with HadGEM3-GC3.1 for CMIP6. J. Adv. Model. Earth Syst. 2020, 12, 919–933. [Google Scholar] [CrossRef]
- Buck, O.; Niyogi, D.K.; Townsend, C.R. Scale-Dependence of Land Use Effects on Water Quality of Streams in Agricultural Catchments. Environ. Pollut. 2004, 130, 287–299. [Google Scholar] [CrossRef] [PubMed]
- Yu, S.; Xu, Z.; Wu, W.; Zuo, D. Effect of Land Use Types on Stream Water Quality under Seasonal Variation and Topographic Characteristics in the Wei River Basin, China. Ecol. Indic. 2016, 60, 202–212. [Google Scholar] [CrossRef]
- Wang, G.; Xu, Z.; Zhang, S. The Influence of Land Use Patterns on Water Quality at Multiple Spatial Scales in a River System. Hydrol. Process. 2014, 28, 5259–5272. [Google Scholar] [CrossRef]
- Pijanowski, B.C.; Brown, D.G.; Shellito, B.A.; Manik, G.A. Using Neural Networks and GIS to Forecast Land Use Changes: A Land Transformation Model. Comput. Environ. Urban Syst. 2002, 26, 553–575. [Google Scholar] [CrossRef]
- Silva, L.P.E.; Xavier, A.P.C.; da Silva, R.M.; Santos, C.A.G. Modeling Land Cover Change Based on an Artificial Neural Network for a Semiarid River Basin in Northeastern Brazil. Glob. Ecol. Conserv. 2020, 21, e00811. [Google Scholar] [CrossRef]
- Nasiri, V.; Darvishsefat, A.A.; Rafiee, R.; Shirvany, A.; Hemat, M.A. Land Use Change Modeling through an Integrated Multi-Layer Perceptron Neural Network and Markov Chain Analysis (Case Study: Arasbaran Region, Iran). J. For. Res. 2019, 30, 943–957. [Google Scholar] [CrossRef]
- Isik, S.; Kalin, L.; Schoonover, J.E.; Srivastava, P.; Graeme Lockaby, B. Modeling Effects of Changing Land Use/Cover on Daily Streamflow: An Artificial Neural Network and Curve Number Based Hybrid Approach. J. Hydrol. 2013, 485, 103–112. [Google Scholar] [CrossRef]
- Folharini, S.; Oliveira, R. Utilização Do Land Change Modeler® Na Modelação Prospetiva Do Uso e Cobertura Do Solo Na Microrregião de Santos, Brasil Para o Ano de 2022. GOT J. Geogr. Spat. Plan. 2020, 19, 57–73. [Google Scholar] [CrossRef]
- Abbas, Z.; Yang, G.; Zhong, Y.; Zhao, Y. Spatiotemporal Change Analysis and Future Scenario of LULC Using the CA-ANN Approach: A Case Study of the Greater Bay Area, China. Land 2021, 10, 584. [Google Scholar] [CrossRef]
- Saputra, M.H.; Lee, H.S. Prediction of Land Use and Land Cover Changes for North Sumatra, Indonesia, Using an Artificial-Neural-Network-Based Cellular Automaton. Sustainability 2019, 11, 3024. [Google Scholar] [CrossRef]
- Tolentino, F.M.; de Lourdes Bueno Trindade Galo, M. Selecting Features for LULC Simultaneous Classification of Ambiguous Classes by Artificial Neural Network. Remote Sens. Appl. Soc. Environ. 2021, 24, 100616. [Google Scholar] [CrossRef]
- Baig, M.F.; Mustafa, M.R.U.; Baig, I.; Takaijudin, H.B.; Zeshan, M.T. Assessment of Land Use Land Cover Changes and Future Predictions Using CA-ANN Simulation for Selangor, Malaysia. Water 2022, 14, 402. [Google Scholar] [CrossRef]
- Rahman, M.T.U.; Tabassum, F.; Rasheduzzaman, M.; Saba, H.; Sarkar, L.; Ferdous, J.; Uddin, S.Z.; Zahedul Islam, A.Z.M. Temporal Dynamics of Land Use/Land Cover Change and Its Prediction Using CA-ANN Model for Southwestern Coastal Bangladesh. Environ. Monit. Assess. 2017, 189, 565. [Google Scholar] [CrossRef]
- Exavier, R.; Zeilhofer, P. OpenLand: Software for Quantitative Analysis and Visualization of Land Use and Cover Change. R J. 2020, 12, 359. [Google Scholar] [CrossRef]
- Santos, F.D.D.; Miranda, P. Alterações Climáticas em Portugal. Cenários, Impactos, e Medidas de Adaptação; Gradiva: Lisboa, Portugal, 2006. [Google Scholar]
- Rees, P.; Carrilho, M.-J.; Peixoto, J.; Durham, H.; Kupiszewski, M. Internal Migration and Regional Population Dynamics in Europe: Portugal Case Study; University of Leeds: Leeds, UK, 1998. [Google Scholar]
- Lewis, J.; Williams, A. Portugal: The Decade of Return. Geography 1985, 70, 178–182. [Google Scholar]
- Calix, T. Territorial Asymmetries and Resilience in Portugal: The Low Density Areas of the Northwest. In New Cities and Migration: An international Debate; Bologna, R., Ed.; Dipartimento di Architettura, Università degli Studi di Firenze: Firenze, Italy, 2017. [Google Scholar]
- Warner, K.; Hamza, M.; Oliver-Smith, A.; Renaud, F.; Julca, A. Climate Change, Environmental Degradation and Migration. Nat. Hazards 2010, 55, 689–715. [Google Scholar] [CrossRef]
- Konapala, G.; Mishra, A.K.; Wada, Y.; Mann, M.E. Climate Change Will Affect Global Water Availability through Compounding Changes in Seasonal Precipitation and Evaporation. Nat. Commun. 2020, 11, 3044. [Google Scholar] [CrossRef]
- Dai, A.; Zhao, T.; Chen, J. Climate Change and Drought: A Precipitation and Evaporation Perspective. Curr. Clim. Chang. Rep. 2018, 4, 301–312. [Google Scholar] [CrossRef]
- Kaczan, D.J.; Orgill-Meyer, J. The Impact of Climate Change on Migration: A Synthesis of Recent Empirical Insights. Clim. Chang. 2020, 158, 281–300. [Google Scholar] [CrossRef]
- Verburg, P.H.; Alexander, P.; Evans, T.; Magliocca, N.R.; Malek, Z.; Rounsevell, M.D.; van Vliet, J. Beyond Land Cover Change: Towards a New Generation of Land Use Models. Curr. Opin. Environ. Sustain. 2019, 38, 77–85. [Google Scholar] [CrossRef]
- Cai, Y.; Guan, K.; Lobell, D.; Potgieter, A.B.; Wang, S.; Peng, J.; Xu, T.; Asseng, S.; Zhang, Y.; You, L.; et al. Integrating Satellite and Climate Data to Predict Wheat Yield in Australia Using Machine Learning Approaches. Agric. For. Meteorol. 2019, 274, 144–159. [Google Scholar] [CrossRef]
- Bai, Y.; Ochuodho, T.O.; Yang, J. Impact of Land Use and Climate Change on Water-Related Ecosystem Services in Kentucky, USA. Ecol. Indic. 2019, 102, 51–64. [Google Scholar] [CrossRef]
- Li, X.; Yeh, A.G.-O. Neural-Network-Based Cellular Automata for Simulating Multiple Land Use Changes Using GIS. Int. J. Geogr. Inf. Sci. 2002, 16, 323–343. [Google Scholar] [CrossRef]
- Majumder, M. Artificial Neural Network. In Feasibility Model of Solar Energy Plants by ANN and MCDM Techniques; Springer: Berlin/Heidelberg, Germany, 2015; pp. 49–54. [Google Scholar]
- Muhammad, R.; Zhang, W.; Abbas, Z.; Guo, F.; Gwiazdzinski, L. Spatiotemporal Change Analysis and Prediction of Future Land Use and Land Cover Changes Using QGIS Molusce Plugin and Remote Sensing Big Data: A Case Study of Linyi, China. Land 2022, 11, 419. [Google Scholar] [CrossRef]
- Costa, A.C.; Santos, J.A.; Pinto, J.G. Climate Change Scenarios for Precipitation Extremes in Portugal. Theor. Appl. Climatol. 2012, 108, 217–234. [Google Scholar] [CrossRef]
- de Lima, M.I.P.; Santo, F.E.; Ramos, A.M.; Trigo, R.M. Trends and Correlations in Annual Extreme Precipitation Indices for Mainland Portugal, 1941–2007. Theor. Appl. Climatol. 2015, 119, 55–75. [Google Scholar] [CrossRef]
- Pereira, S.C.; Carvalho, D.; Rocha, A. Temperature and Precipitation Extremes over the Iberian Peninsula under Climate Change Scenarios: A Review. Climate 2021, 9, 139. [Google Scholar] [CrossRef]
- Vicente-Serrano, S.; Trigo, R.; López-Moreno, J.; Liberato, M.; Lorenzo-Lacruz, J.; Beguería, S.; Morán-Tejeda, E.; El Kenawy, A. Extreme Winter Precipitation in the Iberian Peninsula in 2010: Anomalies, Driving Mechanisms and Future Projections. Clim. Res. 2011, 46, 51–65. [Google Scholar] [CrossRef]
- Andrade, C.; Santos, J.; Pinto, J.; Corte-Real, J. Large-Scale Atmospheric Dynamics of the Wet Winter 2009–2010 and Its Impact on Hydrology in Portugal. Clim. Res. 2011, 46, 29–41. [Google Scholar] [CrossRef]
- de Lima, M.I.P.; Santo, F.E.; Ramos, A.M.; de Lima, J.L.M.P. Recent Changes in Daily Precipitation and Surface Air Temperature Extremes in Mainland Portugal, in the Period 1941–2007. Atmos. Res. 2013, 127, 195–209. [Google Scholar] [CrossRef]
- Soares, P.M.M.; Lima, D.C.A. Water Scarcity down to Earth Surface in a Mediterranean Climate: The Extreme Future of Soil Moisture in Portugal. J. Hydrol. 2022, 615, 128731. [Google Scholar] [CrossRef]
- Guerreiro, S.B.; Kilsby, C.G.; Fowler, H.J. Rainfall in Iberian Transnational Basins: A Drier Future for the Douro, Tagus and Guadiana? Clim. Chang. 2016, 135, 467–480. [Google Scholar] [CrossRef]


| LU 1995 | LU 2018 | LU 2041 | |
|---|---|---|---|
| Bushes | 3538 | 3894 | 3983 |
| Forest | 1846 | 2008 | 2072 |
| Open space or non-vegetation | 1183 | 760 | 624 |
| Agriculture | 542 | 310 | 289 |
| Artificial surface | 47 | 146 | 156 |
| Water | 37 | 62 | 61 |
| Pasture | 24 | 37 | 32 |
| Total | 7217 | 7217 | 7217 |
| Road Distance | Slope | Elevation | River Distance | |
|---|---|---|---|---|
| Road distance | -- | −0.496 | 0.672 | 0.181 |
| Slope | -- | −0.523 | −0.333 | |
| Elevation | -- | 0.650 | ||
| River distance | -- |
| Classes | 1995 | 2018 | 2041 | Difference 1995–2018 | Difference 2018–2041 | Difference 1995–2041 |
|---|---|---|---|---|---|---|
| Artificial surface | 45.14 | 58.82 | 57.03 | 13.68 | −1.79 | 11.89 |
| Agriculture | 561.14 | 323.61 | 302.53 | −237.53 | −21.08 | −258.61 |
| Pasture | 26.56 | 153.61 | 159.27 | 127.06 | 5.66 | 132.72 |
| Forest | 1864.86 | 2018.94 | 2086.70 | 154.08 | 67.76 | 221.84 |
| Bushes | 3526.49 | 3896.19 | 3989.86 | 369.70 | 93.67 | 463.37 |
| Open space or non-vegetation | 1178.73 | 751.74 | 614.95 | −426.99 | −136.79 | −563.78 |
| Water | 35.38 | 35.38 | 28.31 | 0.00 | −7.07 | −7.07 |
Disclaimer/Publisher’s Note: The statements, opinions and data contained in all publications are solely those of the individual author(s) and contributor(s) and not of MDPI and/or the editor(s). MDPI and/or the editor(s) disclaim responsibility for any injury to people or property resulting from any ideas, methods, instructions or products referred to in the content. |
© 2023 by the authors. Licensee MDPI, Basel, Switzerland. This article is an open access article distributed under the terms and conditions of the Creative Commons Attribution (CC BY) license (https://creativecommons.org/licenses/by/4.0/).
Share and Cite
Folharini, S.; Vieira, A.; Bento-Gonçalves, A.; Silva, S.; Marques, T.; Novais, J. A Framework Using Open-Source Software for Land Use Prediction and Climate Data Time Series Analysis in a Protected Area of Portugal: Alvão Natural Park. Land 2023, 12, 1302. https://doi.org/10.3390/land12071302
Folharini S, Vieira A, Bento-Gonçalves A, Silva S, Marques T, Novais J. A Framework Using Open-Source Software for Land Use Prediction and Climate Data Time Series Analysis in a Protected Area of Portugal: Alvão Natural Park. Land. 2023; 12(7):1302. https://doi.org/10.3390/land12071302
Chicago/Turabian StyleFolharini, Saulo, António Vieira, António Bento-Gonçalves, Sara Silva, Tiago Marques, and Jorge Novais. 2023. "A Framework Using Open-Source Software for Land Use Prediction and Climate Data Time Series Analysis in a Protected Area of Portugal: Alvão Natural Park" Land 12, no. 7: 1302. https://doi.org/10.3390/land12071302
APA StyleFolharini, S., Vieira, A., Bento-Gonçalves, A., Silva, S., Marques, T., & Novais, J. (2023). A Framework Using Open-Source Software for Land Use Prediction and Climate Data Time Series Analysis in a Protected Area of Portugal: Alvão Natural Park. Land, 12(7), 1302. https://doi.org/10.3390/land12071302