Article

Changes in the Spatial Distribution of the Employed Population in the Yangtze River Delta Region since the 21st Century: An Analysis and Discussion Based on Census Data

Institute of Urban and Demographic Studies, Shanghai Academy of Social Sciences, Shanghai 200020, China
Land 2023, 12(6), 1249; https://doi.org/10.3390/land12061249
Submission received: 16 May 2023 / Revised: 15 June 2023 / Accepted: 16 June 2023 / Published: 19 June 2023
(This article belongs to the Special Issue Regional Sustainable Development of Yangtze River Delta, China II)

Abstract

:
Focusing on the Yangtze River Delta region, the spatial distribution and change characteristics of the employed population were assessed by selecting three time points: 2000, 2010 and 2020. Firstly, a correlation was established between population employment statistics and spatial units of administrative divisions to analyze the spatial distribution characteristics of the employed population in general and by industry; secondly, the changing characteristics of the spatial distribution of the employed population over time, including the migration of the centroid and density changes, were analyzed; thirdly, a systematic clustering approach was adopted to carry out a typological analysis of 41 cities in the Yangtze River Delta from three perspectives: industrial structure, time stage and spatial level. It was found that (1) regional differences within the Yangtze River Delta are still significant, but are narrowing; (2) different cities or regions show different characteristics of development stages, and late-developing regions can learn from early developing regions; (3) metropolitan areas are still the main areas of employment concentration, and the spatial distribution of employment in some cities is beginning to suburbanize.

1. Introduction

Since entering the 21st century, urban agglomerations have become hotspots for population concentration and the growth of employment activities in China. According to census data, in 2020, the five provinces and three directly administered municipalities where the Beijing–Tianjin–Hebei Region, Yangtze River Delta, and Pearl River Delta are located accounted for one-third of China’s employed population. The employed population growth in major cities within these regions is also generally higher than the national average. From 2000 to 2020, the employed population in the three cities of Beijing, Tianjin, and Shijiazhuang in the Beijing–Tianjin–Hebei region grew by 21.3%; in the four cities of Shanghai, Nanjing, Hangzhou, and Hefei in the Yangtze River Delta region, it grew by 61.2%; and in the nine cities of Guangzhou, Shenzhen, etc., in the Pearl River Delta region, it grew by 75.2%.
This study focuses on the Yangtze River Delta (YRD) region, a densely populated and economically active area encompassing Shanghai, Jiangsu, Zhejiang, and Anhui. The YRD region has a land area of about 360,000 km2, accounting for less than 4% of the country. According to 2020 data, the region has a total population of 235.21 million people and a GDP of RMB 24.4694 trillion, accounting for 16.3% and 22.5% of national total, respectively. The region has created a large degree of economic scale with a relatively small land area, which can be attributed in large part to the labor creation of the vast employed population. Due to the high level of economic and social development in the YRD region, many cities in the region are able to provide more attractive employment opportunities and are among the priority areas for the majority of the employed population to consider for career development.
It is worth noting that there are significant differences in the spatial characteristics of urban and rural areas and the level of economic development in the YRD region, which will affect the spatial distribution characteristics of the employed population to a certain extent. Additionally, after the initial rapid development, urbanization and economic growth in the YRD region have entered a new stage, characterized by a higher level of development but a lower growth rate. This has also resulted in differences in the temporal characteristics of employed population changes. Therefore, the main objective of this study is to discover the spatial and temporal characteristics of employment in the YRD region since the 21st century, with the aim of providing research support for the region’s spatially optimized development in the new era.
In terms of identifying the spatial distribution characteristics of the employed population, the amount of literature available is relatively more focused on the city and metropolitan area scales, with relatively few studies at the larger regional and national scales. Typical studies at the city and metropolitan area scales include, for example, the work of Richard Shearmur et al. (2002), who used Canadian statistics to analyze the spatial structure of employment in four metropolitan areas: Toronto, Montreal, Vancouver, and Ottawa-Hull [1]; William J. Coffey et al. (2002), who used workplace data to study the spatial variation in employment of several business services in the Montreal region of Canada during 1981–1996 [2]; Mehdi Alidad et al. (2018) analyzed the spatial distribution characteristics of employment in the Tehran metropolitan area [3]; Wang Bo et al. (2011) identified the spatial distribution characteristics of employment in different industries in Nanjing based on ArcGIS kernel density analysis [4]; Zhan Dongsheng et al. (2017) conducted an empirical analysis of the spatial structure of employment and residence in urban areas of Beijing from a sub-industry perspective based on business enterprise registration data and census data [5]; Zuo Wei et al. (2017) investigated and analyzed the commonalities and differences in the spatial distribution of the employment of migrant workers of different genders in the main urban area of Nanjing [6]; Li Pengfei (2019) analyzed the spatial layout characteristics of employment in Shenyang based on cell phone signaling data [7]; Sun Chen et al. (2016) analyzed the overall distribution characteristics of new jobs and the spatial distribution characteristics of specific industries, such as real estate, based on job posting information [8]; and Wang Hui et al. (2014) combined statistical and survey data to compare the characteristics of the overall employment space and the employment space of the mobile population in Nanjing [9,10].
Typical studies at regional and national scales include the work of: Xin Lao et al. (2013), who analyzed and compared the characteristics of employment density distribution in two regions, the Yangtze River Delta and the Pearl River Delta, using data from economic census [11]; Enrico Marelli (2004), who analyzed the employment distribution among the main production sectors in 145 regions of the European Union during 1983–1997 and found that differences in employment structure may be more pronounced within countries [12]; and Wang Zhenbo et al. (2007), who analyzed the spatial distribution characteristics of the employed population in China using 2000 census data, and summarized six types of employment spatial patterns based on the spatial distribution characteristics of employment by industry [13]. Most of the studies have been conducted using the attributes of industries, occupations, employment positions contained within the statistical data of the population census, economic census, and sample surveys, in combination with administrative division data, to analyze spatial distribution and change characteristics using the GIS platform. Some city-scale studies in recent years have started to use data such as cell phone signaling and network reviews. These are explorations of positive significance, but there are limitations to their application due to the limited individual attributes that can be reflected by such data.
The structural characteristics of the spatial distribution of employment comprise a hot topic of interest in such studies. It is common to conduct cross-regional and cross-temporal dimensional analysis based on employment-related data to summarize the spatio-temporal patterns of employment spatial distribution changes. Peter Gordon et al. (1986) and Kenneth A. Small et al. (1994) found a trend that was characteristic of population and employment polycentric dispersion in Los Angeles during the 1970s [14,15]; William J. Coffey et al. (2001) found an important role for business services and manufacturing in the polycentric process of Montreal [16]; Richard Shearmur et al. (2002) found three different patterns of development in the spatial structure of employment in four Canadian metropolitan areas [1]; William J. Coffey et al. (2002) found evidence of decentralization in a relative sense in Montreal [2]; Catherine Baumont et al. (2004) found significant monocentric characteristics in the spatial distribution of population and employment in the urban agglomeration of Dijon, France [17]; Klaus Desmet et al. (2005) found industrial differences in the characteristics of the changing spatial distribution of jobs in the United States, with a relative concentration of employment in the service sector [18]; Rachel Guillain (2006) analyzed the spatial distribution of employment in the Île-de-France region in 1978 and 1997 and found a process of suburbanization of employment in Paris and its surrounding regions [19]; Lijing Dong et al. (2008) found the obvious spatial suburbanization of employment in Shenyang [20]; Zeng Haihong et al. (2010) found that the spatial agglomeration of advanced service sectors in Shenzhen has been strengthened [21]; Liz Rodríguez-Gámez et al. (2012) analyzed the employment centers in Hermosillo, Mexico, and found that the monocentric model is still significant, but that the role of the central business district has changed [22]; Sun Bindong et al. (2014) analyzed the evolutionary characteristics of the spatial structure of employment in Shanghai in 1996, 2004 and 2008 and found that the spatial polycentricity of both employment and population was increasing [23]; Jae Ik Kim et al. (2014) found a spatial polycentric structure of employment in Seoul, with the emerging Gangnam sub-center becoming the largest employment center in Seoul [24]; and Chen Chen (2014) found a significant suburbanization of manufacturing employment in China between 2000 and 2010, with a clear tendency for the service sector to cluster in central cities [25]. Studies have been conducted to analyze the evolution of the spatial distribution of the employed population, both in general and in specific industry. The research results indicate that the spatial evolution of the employed population may differ significantly in different cities, regions, development stages, and industries.
The spatial characteristics of different regions have a crucial impact on the layout and development of employment due to their different development situations [26]. Several scholars have discussed various factors that affect the spatial and temporal distribution of employment, including industry, innovation, housing, public service support, and transportation. Regarding industrial factors, Xu Xianglong (2009) and Sun Tieshan et al. (2014) explored the influence of industrial structure on employment structure and distribution [27,28]. Regarding the factor of innovation, Michael Fritsch et al. (2011), Matthias Buerger (2012), and Chang Jifa et al. (2018) found that innovation activities have a general or localized promotional effect on employment [29,30,31]. In terms of residential factors, William Levernier et al. (1994) found that housing cost and quality are important determinants of population and employment distribution [32]. Sun Tieshan et al. (2015), Zhan Dongsheng et al. (2013), and Wang Bei et al. (2020) explored the spatial relationship between employment and residence in Beijing, highlighting characteristics such as industrial differences, circle differentiation, and agglomeration and dispersion [33,34,35]. Regarding the public service factor, Jia Yanfei et al. (2008) and Han Li et al. (2019) identified the key influence of public services on the spatial layout of employment [36,37]. Concerning transportation factors, Harry J. Holzer et al. (2003), Jiao Huafu et al. (2011), Stephen J. Appold (2015), and Wang De. et al. (2020) studied the significant effects of transportation costs and convenience on employment distribution, with public transportation exhibiting a more pronounced boosting effect in metropolitan regions [38,39,40,41]. Some scholars have tried to use some quantitative analysis methods to assess the coupling degree between the spatial distribution of population and regional development patterns to further propose policy recommendations in order to promote the enhancement of coordination between them [42,43,44,45,46].
Based on the purpose of this study and the literature analysis, three hypotheses are proposed for the spatial and temporal changes of the employed population in the YRD region, which will be the focus of the subsequent empirical study: (1) cities (regions) at different levels of economic development have significant differences in the industrial structure of the employed population; (2) the early employed population changes characteristics exhibited in relatively developed cities (regions) may occur in relatively backward cities (regions) after a certain period of time; and (3) the employed population (in general or within certain industry categories) in some large cities may show significant diffusion to the suburbs.

2. Materials and Methods

2.1. Data

The use of census data by administrative division to conduct spatial analysis of the distribution of the employed population is a common practice in existing studies [3,13,25]. The data required for this study include (1) census data on the employed population by industry and county, and (2) spatial data on administrative divisions at the county level. The time points of all data include 2000, 2010 and 2020. The spatial scope of this study includes one directly administered municipality (Shanghai) and three provinces (Jiangsu, Zhejiang, and Anhui) in the YRD region. This study was conducted in a total of 41 municipalities and prefecture-level cities in the region.
Data on the employed population were obtained from the Chinese population census by county [47,48,49]. This information contains statistics specifically focused on the employment of the population in each county. It should be noted that the statistics on employment are contained within the long-form data of the population census. Unlike the full data, the sample of the long-form data is about 10% of the full data, and the sampling rate is basically the same in all counties. There are two classifications of the employed population in the census data, namely, by occupation and by industry. This study uses data classified by industry. The specific classification differs slightly in the three years, but is generally consistent. The industry categories of the employed population included in the primary, secondary, and tertiary industries are shown in Table 1.
Regarding the data of county administrative divisions, this study was conducted based on the GIS database to sort out the data. The basic spatial units are municipal districts, county-level cities, and counties in the YRD region. This study considers changes in administrative divisions, such as county boundary adjustments and county mergers, during the period from 2000 to 2020.

2.2. Methods

This study uses ArcGIS 10.5 platform to carry out the spatial analysis of the data.
First, the association is established between population employment statistics and spatial units of administrative divisions, the basic characteristics of spatial distribution of employed population data are analyzed, and the changes in the centroids of the population are identified using spatial statistical analysis tools.
Secondly, density statistical analysis of the spatial distribution of the employed population is carried out to compare the variation in density distribution characteristics of different years. Since there a certain amount of adjustment of county administrative divisions takes place between different years, if the density statistics of different years are directly calculated as the difference, there will be a certain distortion of analysis results within the range of divisional adjustment. In this study, based on the attempted basis of existing studies, the analysis method of focal statistics is used to assess mean of the density statistics results in a certain range (Figure 1), which can achieve the effect of smoothing the density analysis results [25]. The benefits of smoothing the original density raster data for calculation processing include two aspects: one is to avoid abrupt changes in the values of density changes at the adjustment of administrative boundaries; the second is to consider that there is a certain radius activity range of human employment activities in space, that there is a certain interaction of the employed population on both sides of the administrative boundaries, and that the smoothing calculation of spatial values is closer to the reality. According to general experience, the daily employment activities of people generally do not exceed 20 km, and 20 km is selected as the search radius for focal statistical analysis in this study [25].
In addition, the data of each city are extracted and analyzed. The object of this study is cities at the prefecture level and above, whose spatial scope includes the concepts of central urban and municipal jurisdiction areas. The central urban area is generally the urban area where the city government is located, i.e., the urbanized area with the city center as the center of the circle, while the municipal jurisdiction area is all the areas within the administrative boundaries of the city, including the counties and county-level cities under its jurisdiction, in addition to the municipal district where the central urban area is located. There are significant differences in urbanization, industry, employment and other characteristics between the two spatial scopes, and so it is necessary to extract the relevant data from these two spatial scopes for each city separately for analysis. Using the spatial analysis tool in ArcGIS, the data of 41 city locations were extracted as central urban area data based on the focal statistical analysis results of the density raster. According to the administrative boundaries of 41 cities, the data of counties, county-level cities and municipal districts under their jurisdiction are aggregated as the data at the spatial level of municipalities. It should be noted that the boundaries of the prefectures and higher-level administrative areas of Shanghai, Jiangsu and Zhejiang were not adjusted during the period 2000–2020, but that some prefecture-level boundaries in Anhui province had scope for among themselves. For example, the counties of Chaohu City were assigned to Hefei City, Ma’anshan City, and Wuhu City; Shou County in Lu’an City was assigned to Huainan City; and Zongyang County in Anqing City was assigned to Tongling City. In order to ensure the consistency of spatial scope, the data of prefecture-level cities in Anhui Province at the three time points of 2000, 2010 and 2020 were uniformly counted according to the scope of 2020 when comparing the municipal data. Finally, clustering analysis was carried out. Systematic clustering in SPSS was used to classify and identify the data performance of 41 cities from the perspectives of industrial structure, time stage change, and spatial change.

3. Results

3.1. Changes in the Spatial Distribution Characteristics of the Employed Population

3.1.1. Spatial Distribution Characteristics of the Employed Population in 2020

  • Resident population density
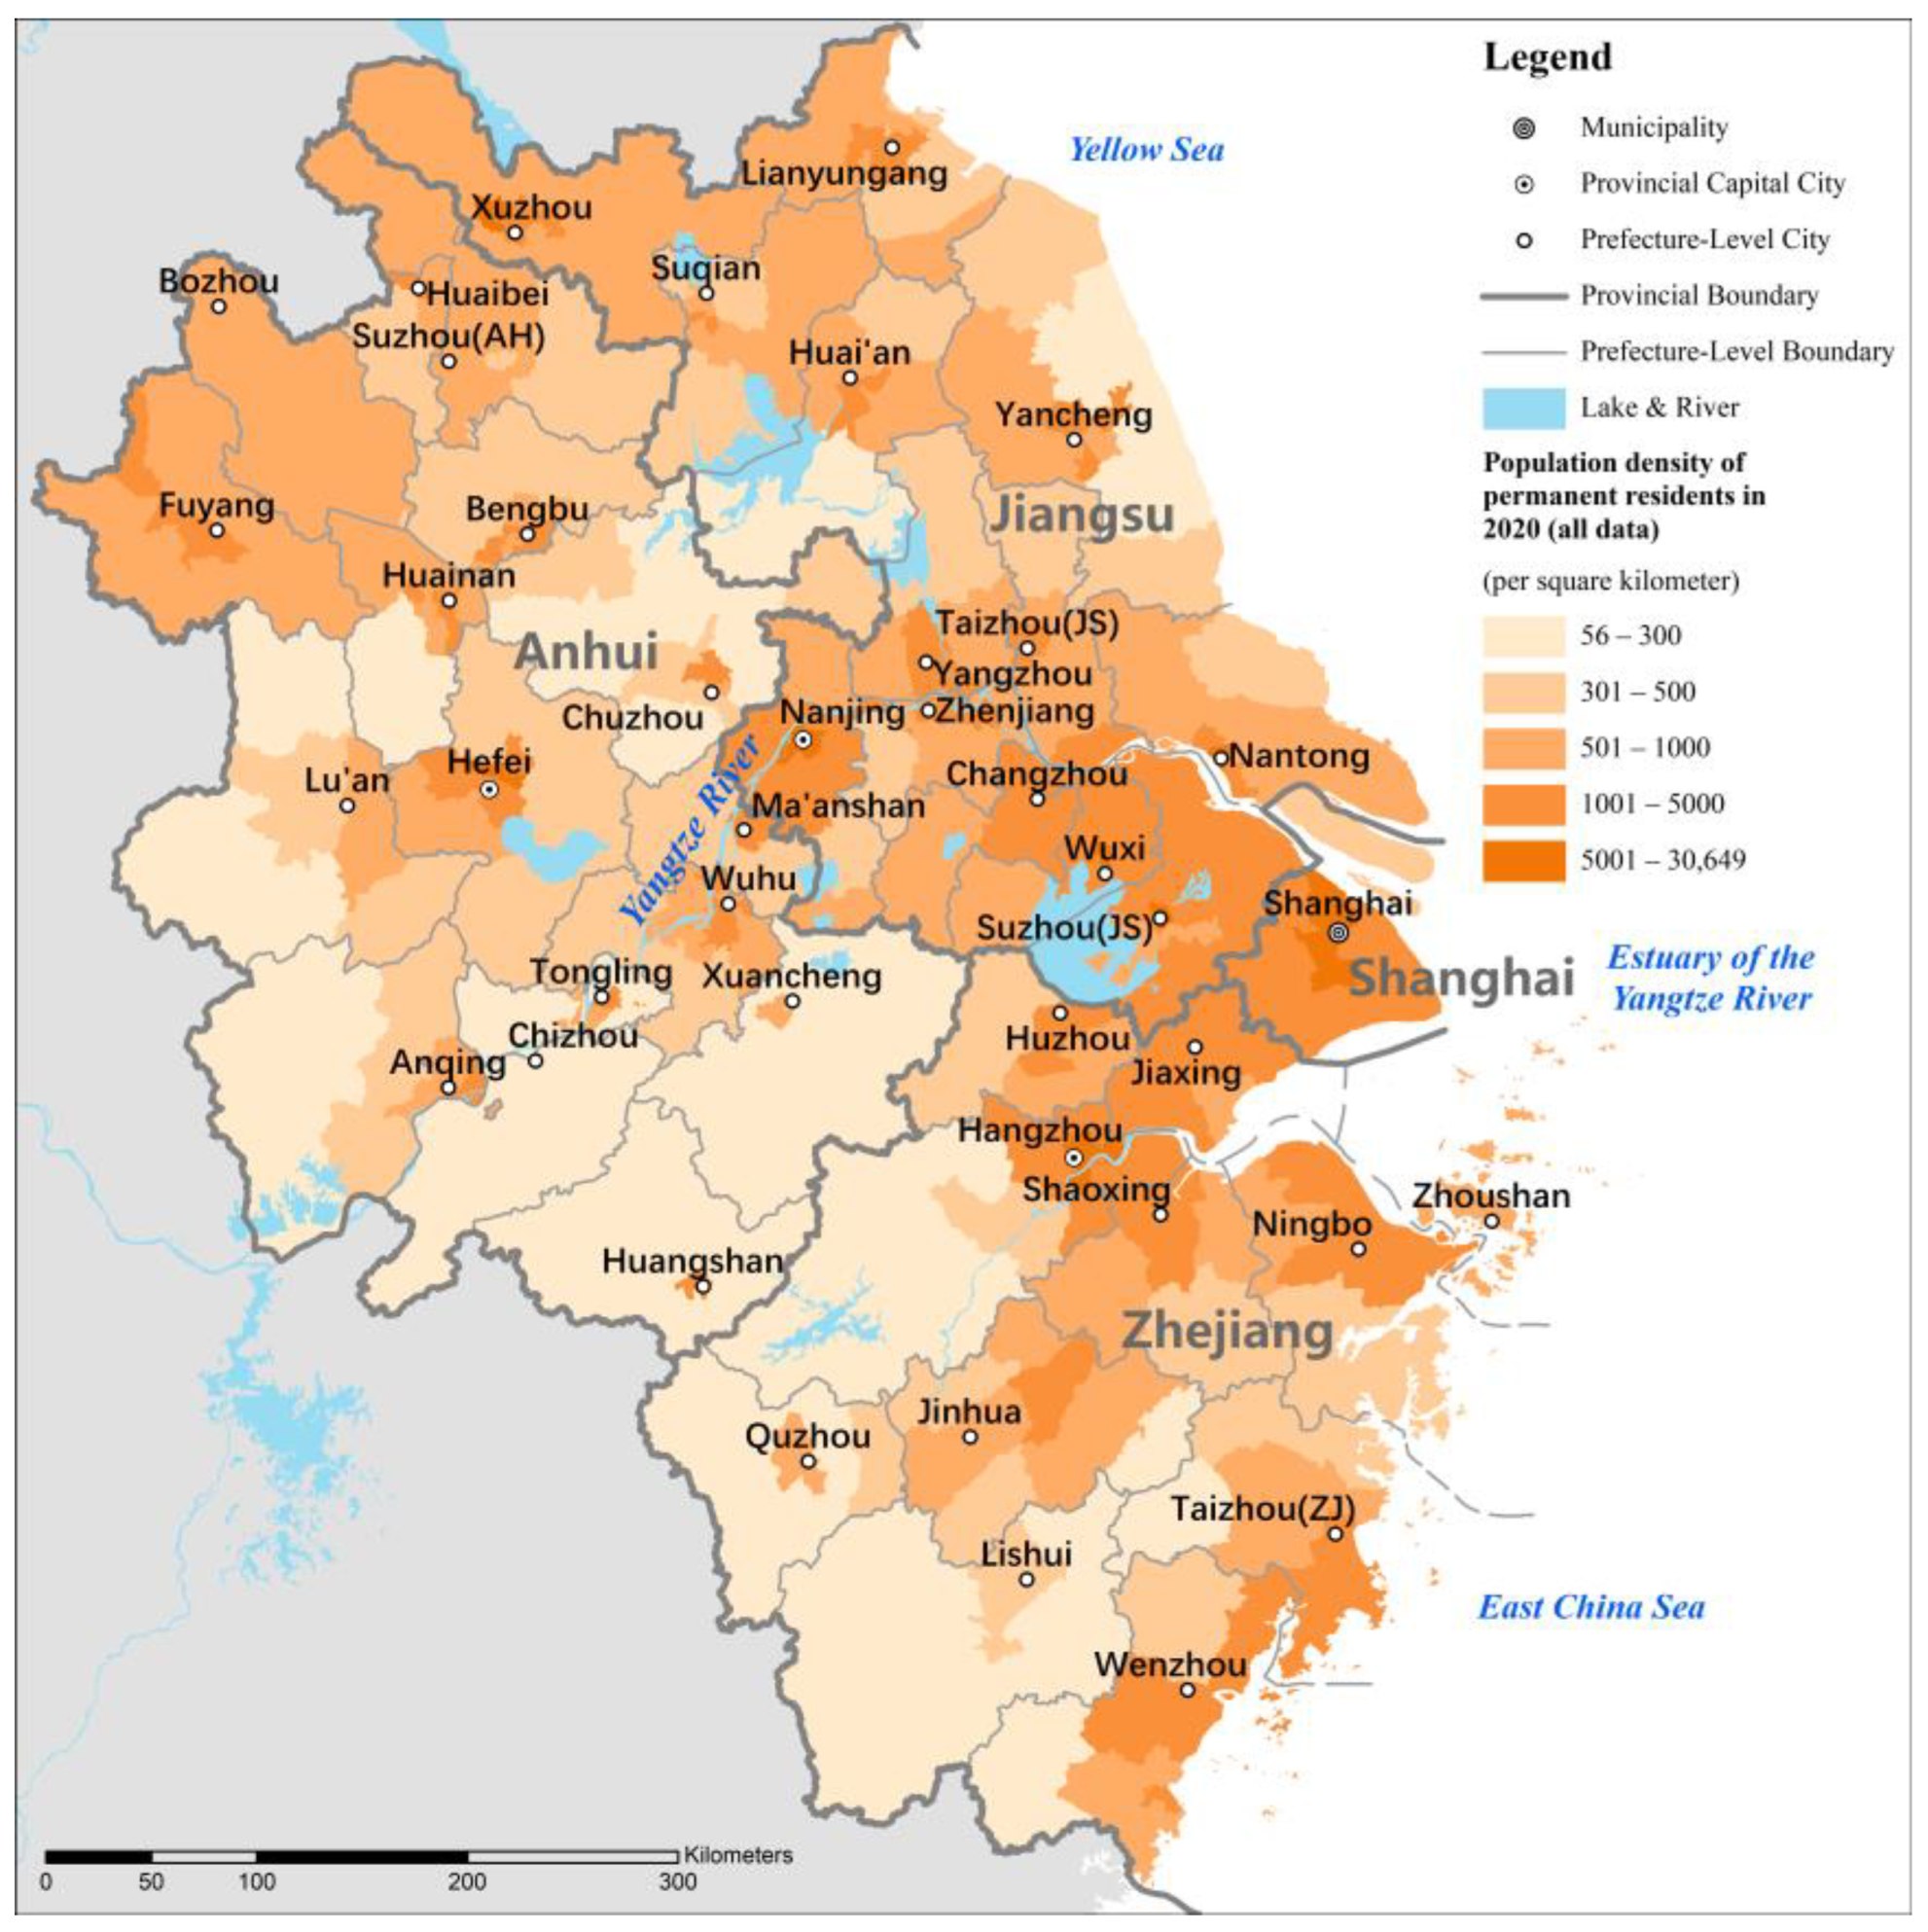
Determined from the spatial density distribution of the resident population (Figure 2), the central urban areas of each city are the areas with high resident population density, with Shanghai, Nanjing, Hangzhou and Hefei being particularly prominent. The contiguous areas with high resident population densities include the Taihu Plain area, consisting of Shanghai and southeastern Jiangsu and northern Zhejiang, which generally reaches more than 1000 people per square kilometer. These areas are also the core areas of the YRD. In addition, the contiguous areas with the second highest resident population density include the coastal areas around Wenzhou and Taizhou in Zhejiang, the area around Jinhua in central Zhejiang, the areas around Ma’anshan, Wuhu, Tongling and Anqing along the Yangtze River in Anhui, the area in northwestern Anhui and the area in northern Jiangsu, etc. The regions with lower resident population density include the south of Anhui Province and southwestern Zhejiang Province, and the topography of these regions is mainly mountainous.
  • Employed population density
The spatial density distribution of the employed population (Figure 3, note that the employed population is derived from the long-form data of the census and is 10% of the total sample) shows a more clustered spatial density distribution compared to that of the resident population. The employed population is more concentrated in the Taihu Plain region consisting of Shanghai, southeastern Jiangsu, and northern Zhejiang, showing the attractiveness of the core region of the YRD for employment. Directly administered municipality and provincial capitals are the heartlands of employment concentration. In other regions, except for the central urban areas of prefecture-level cities where employed population is relatively concentrated, the density is generally low. In regions such as northern Jiangsu and northern Anhui, where the density of resident population is high, the density of employed population is significantly low, which shows that these regions are less attractive for employment.
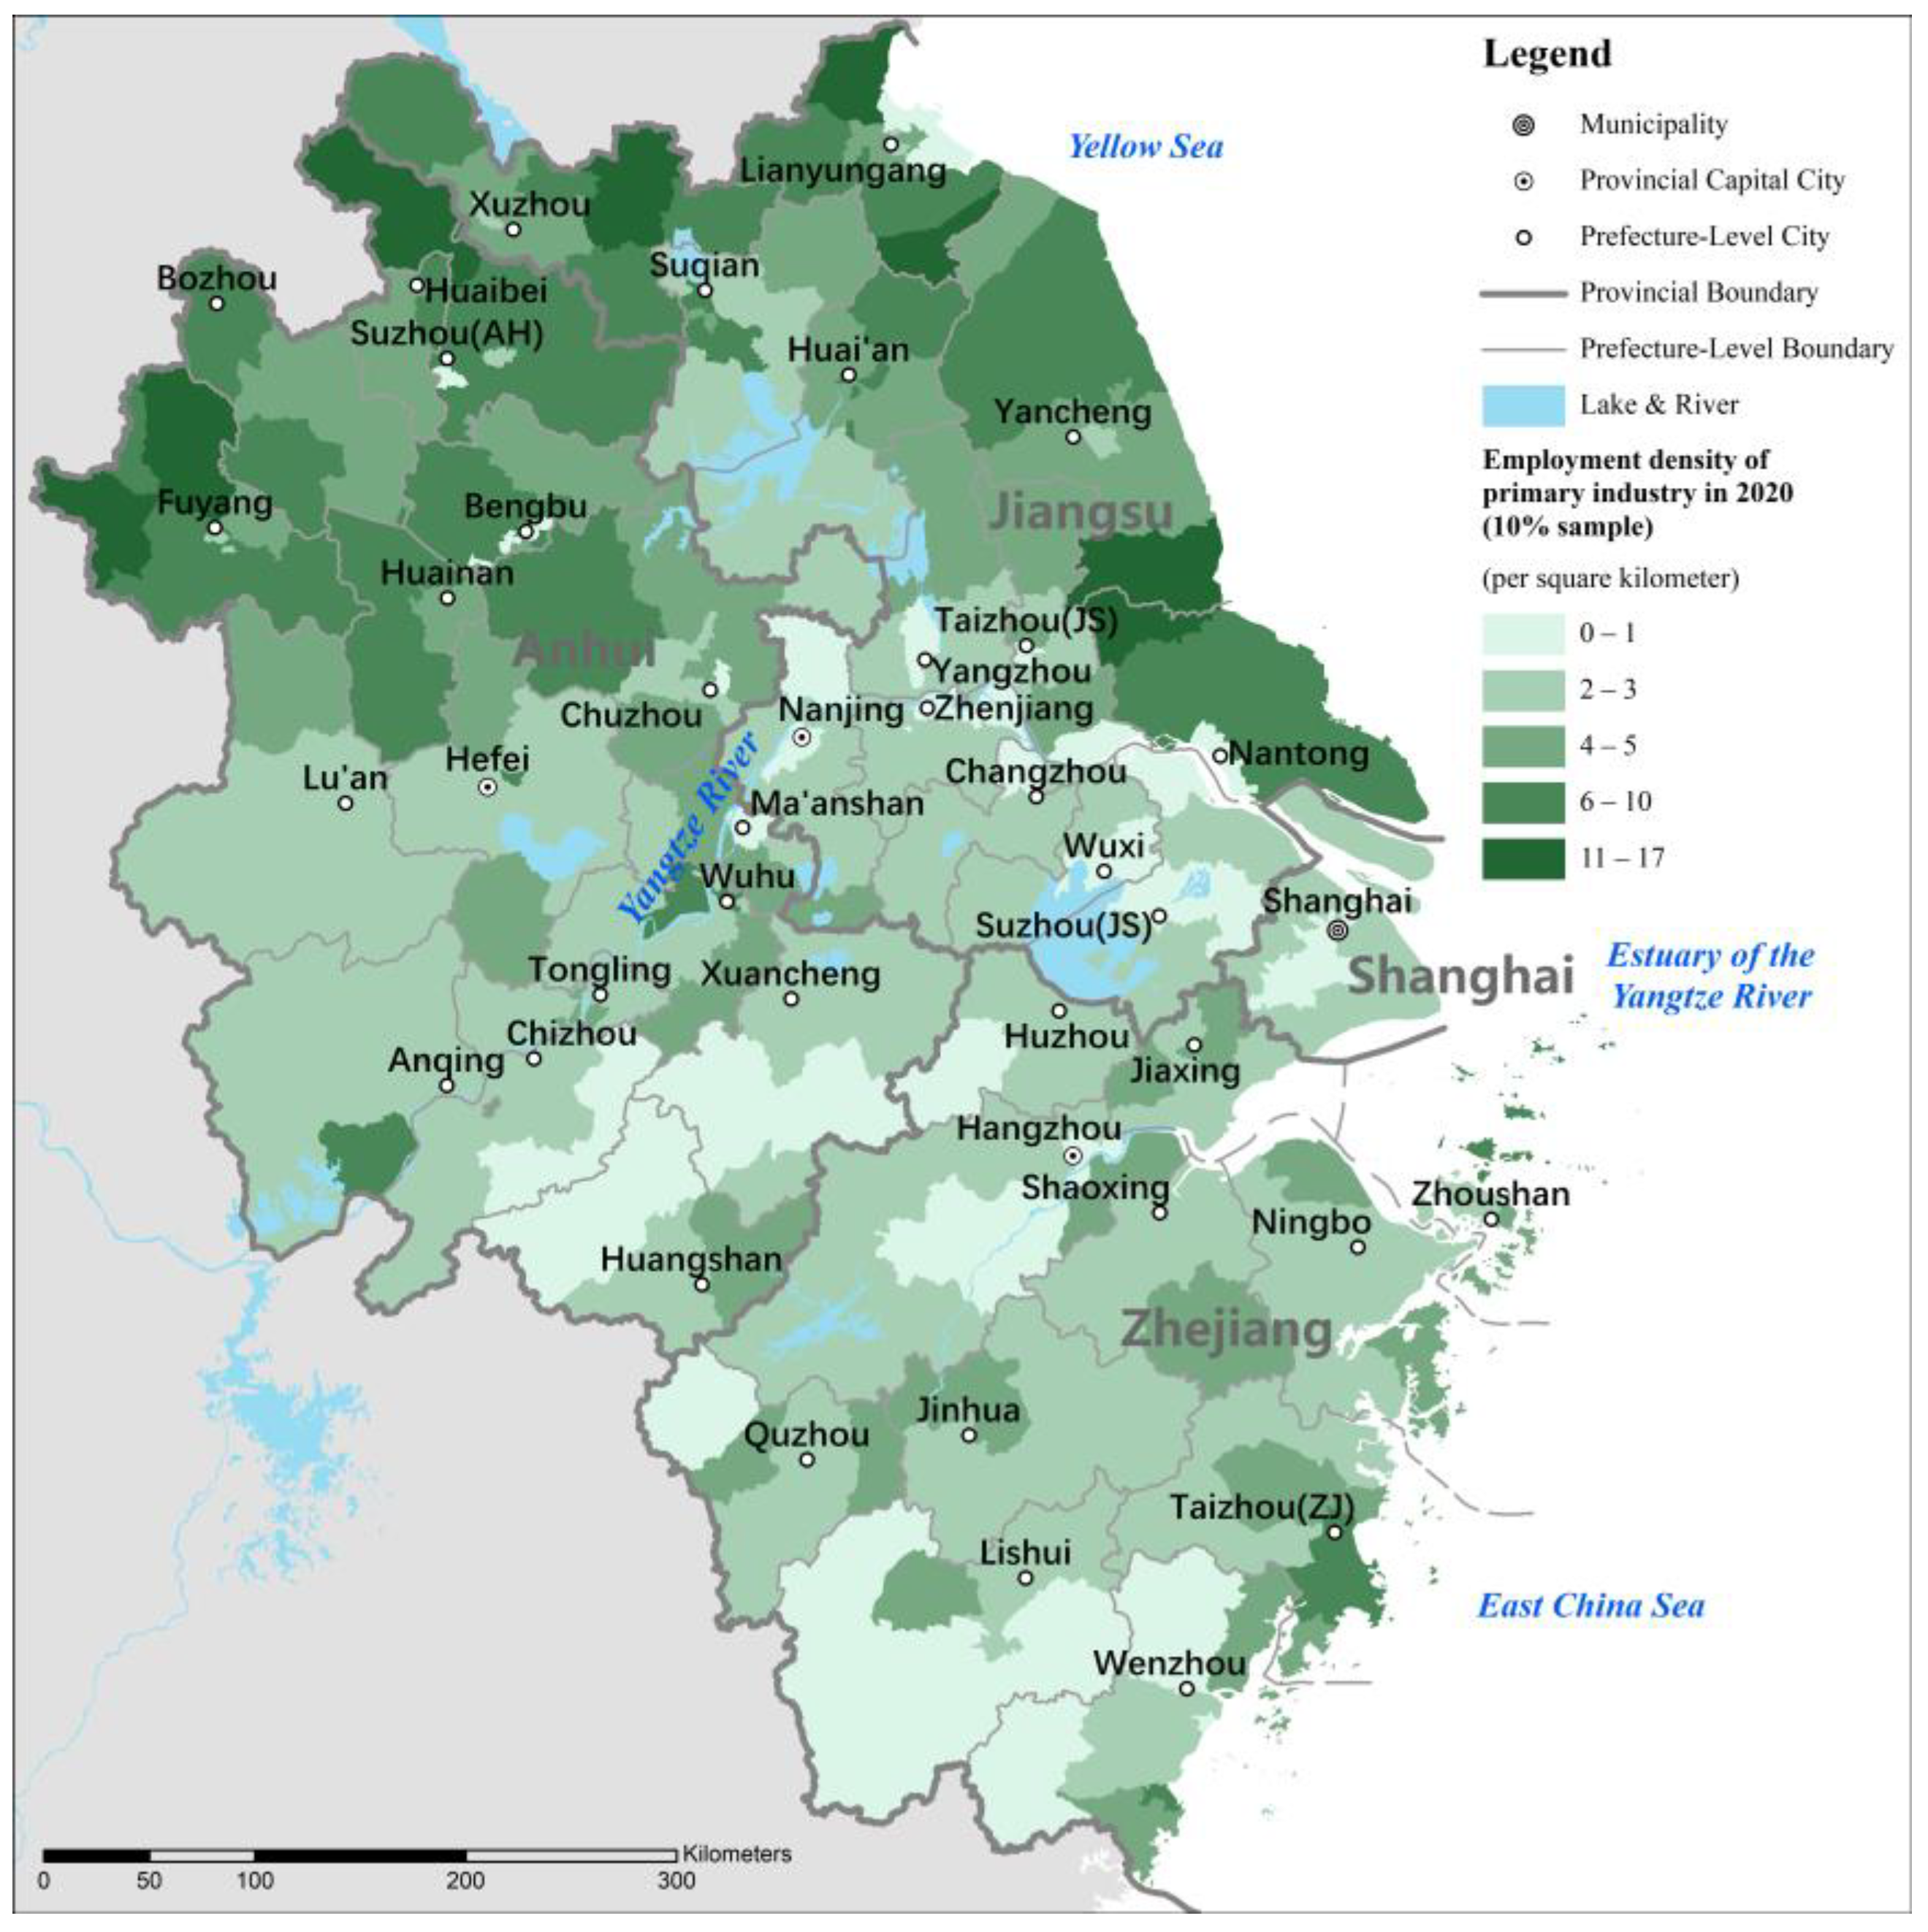
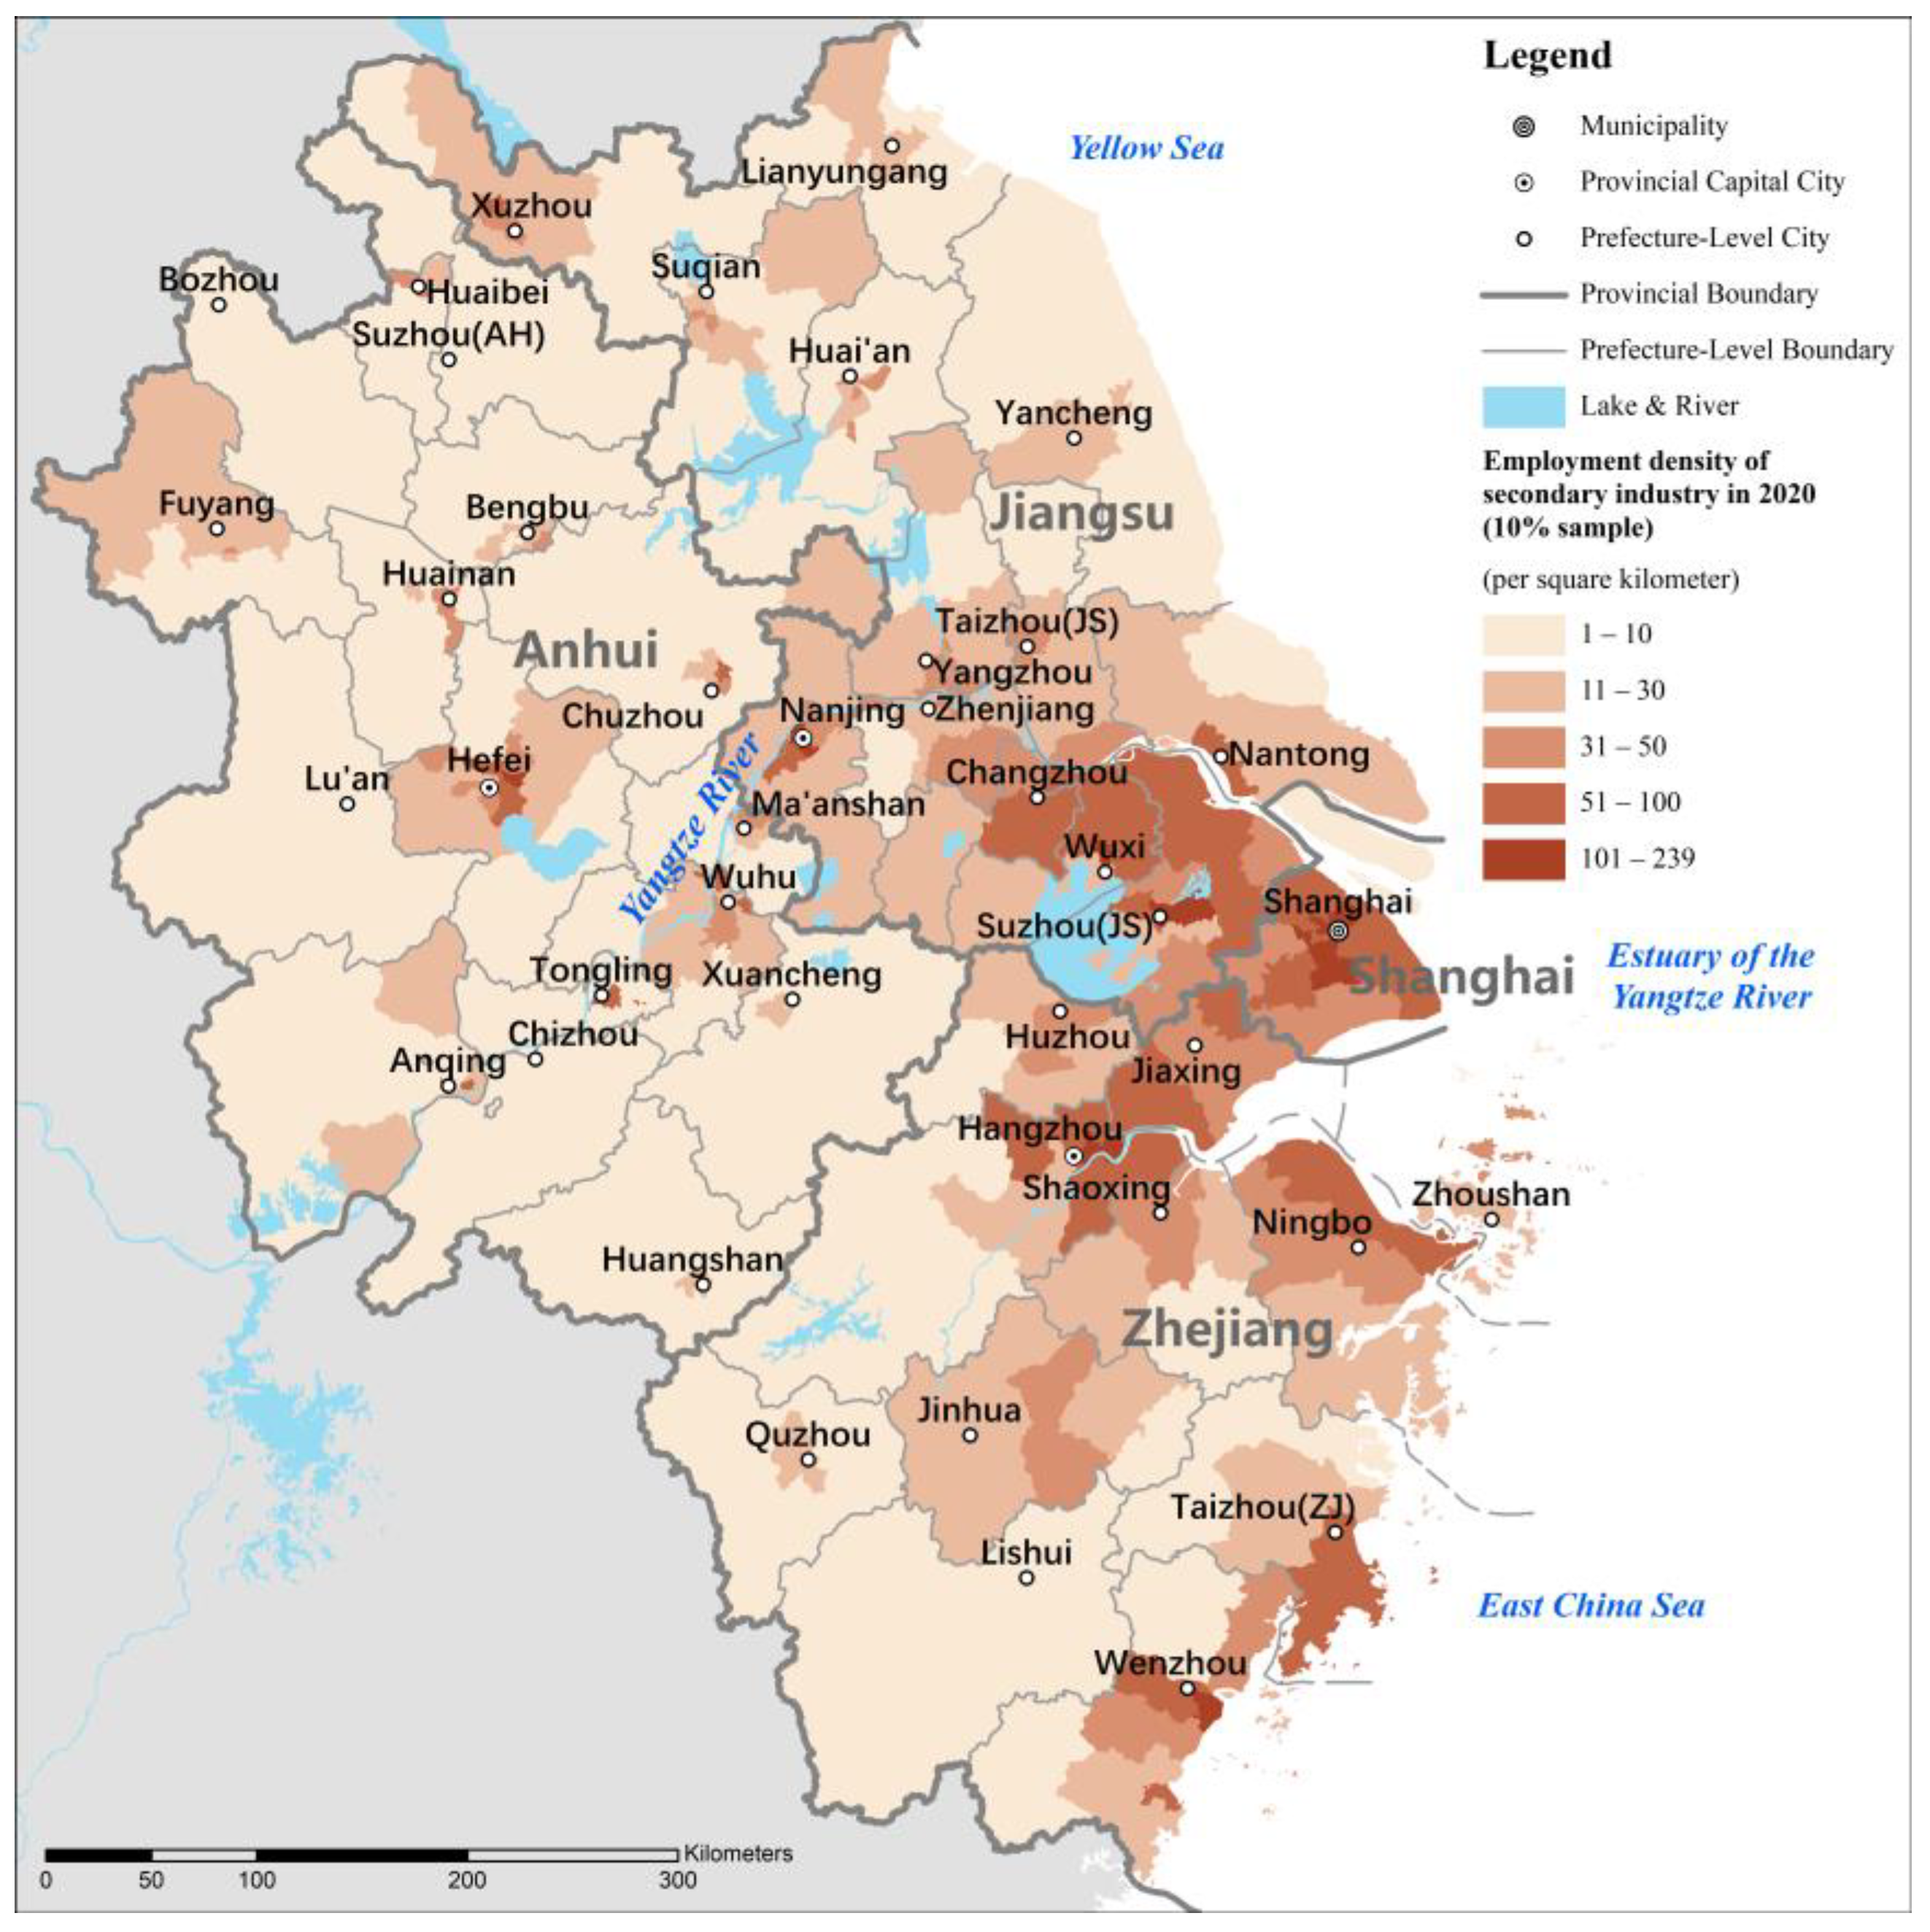
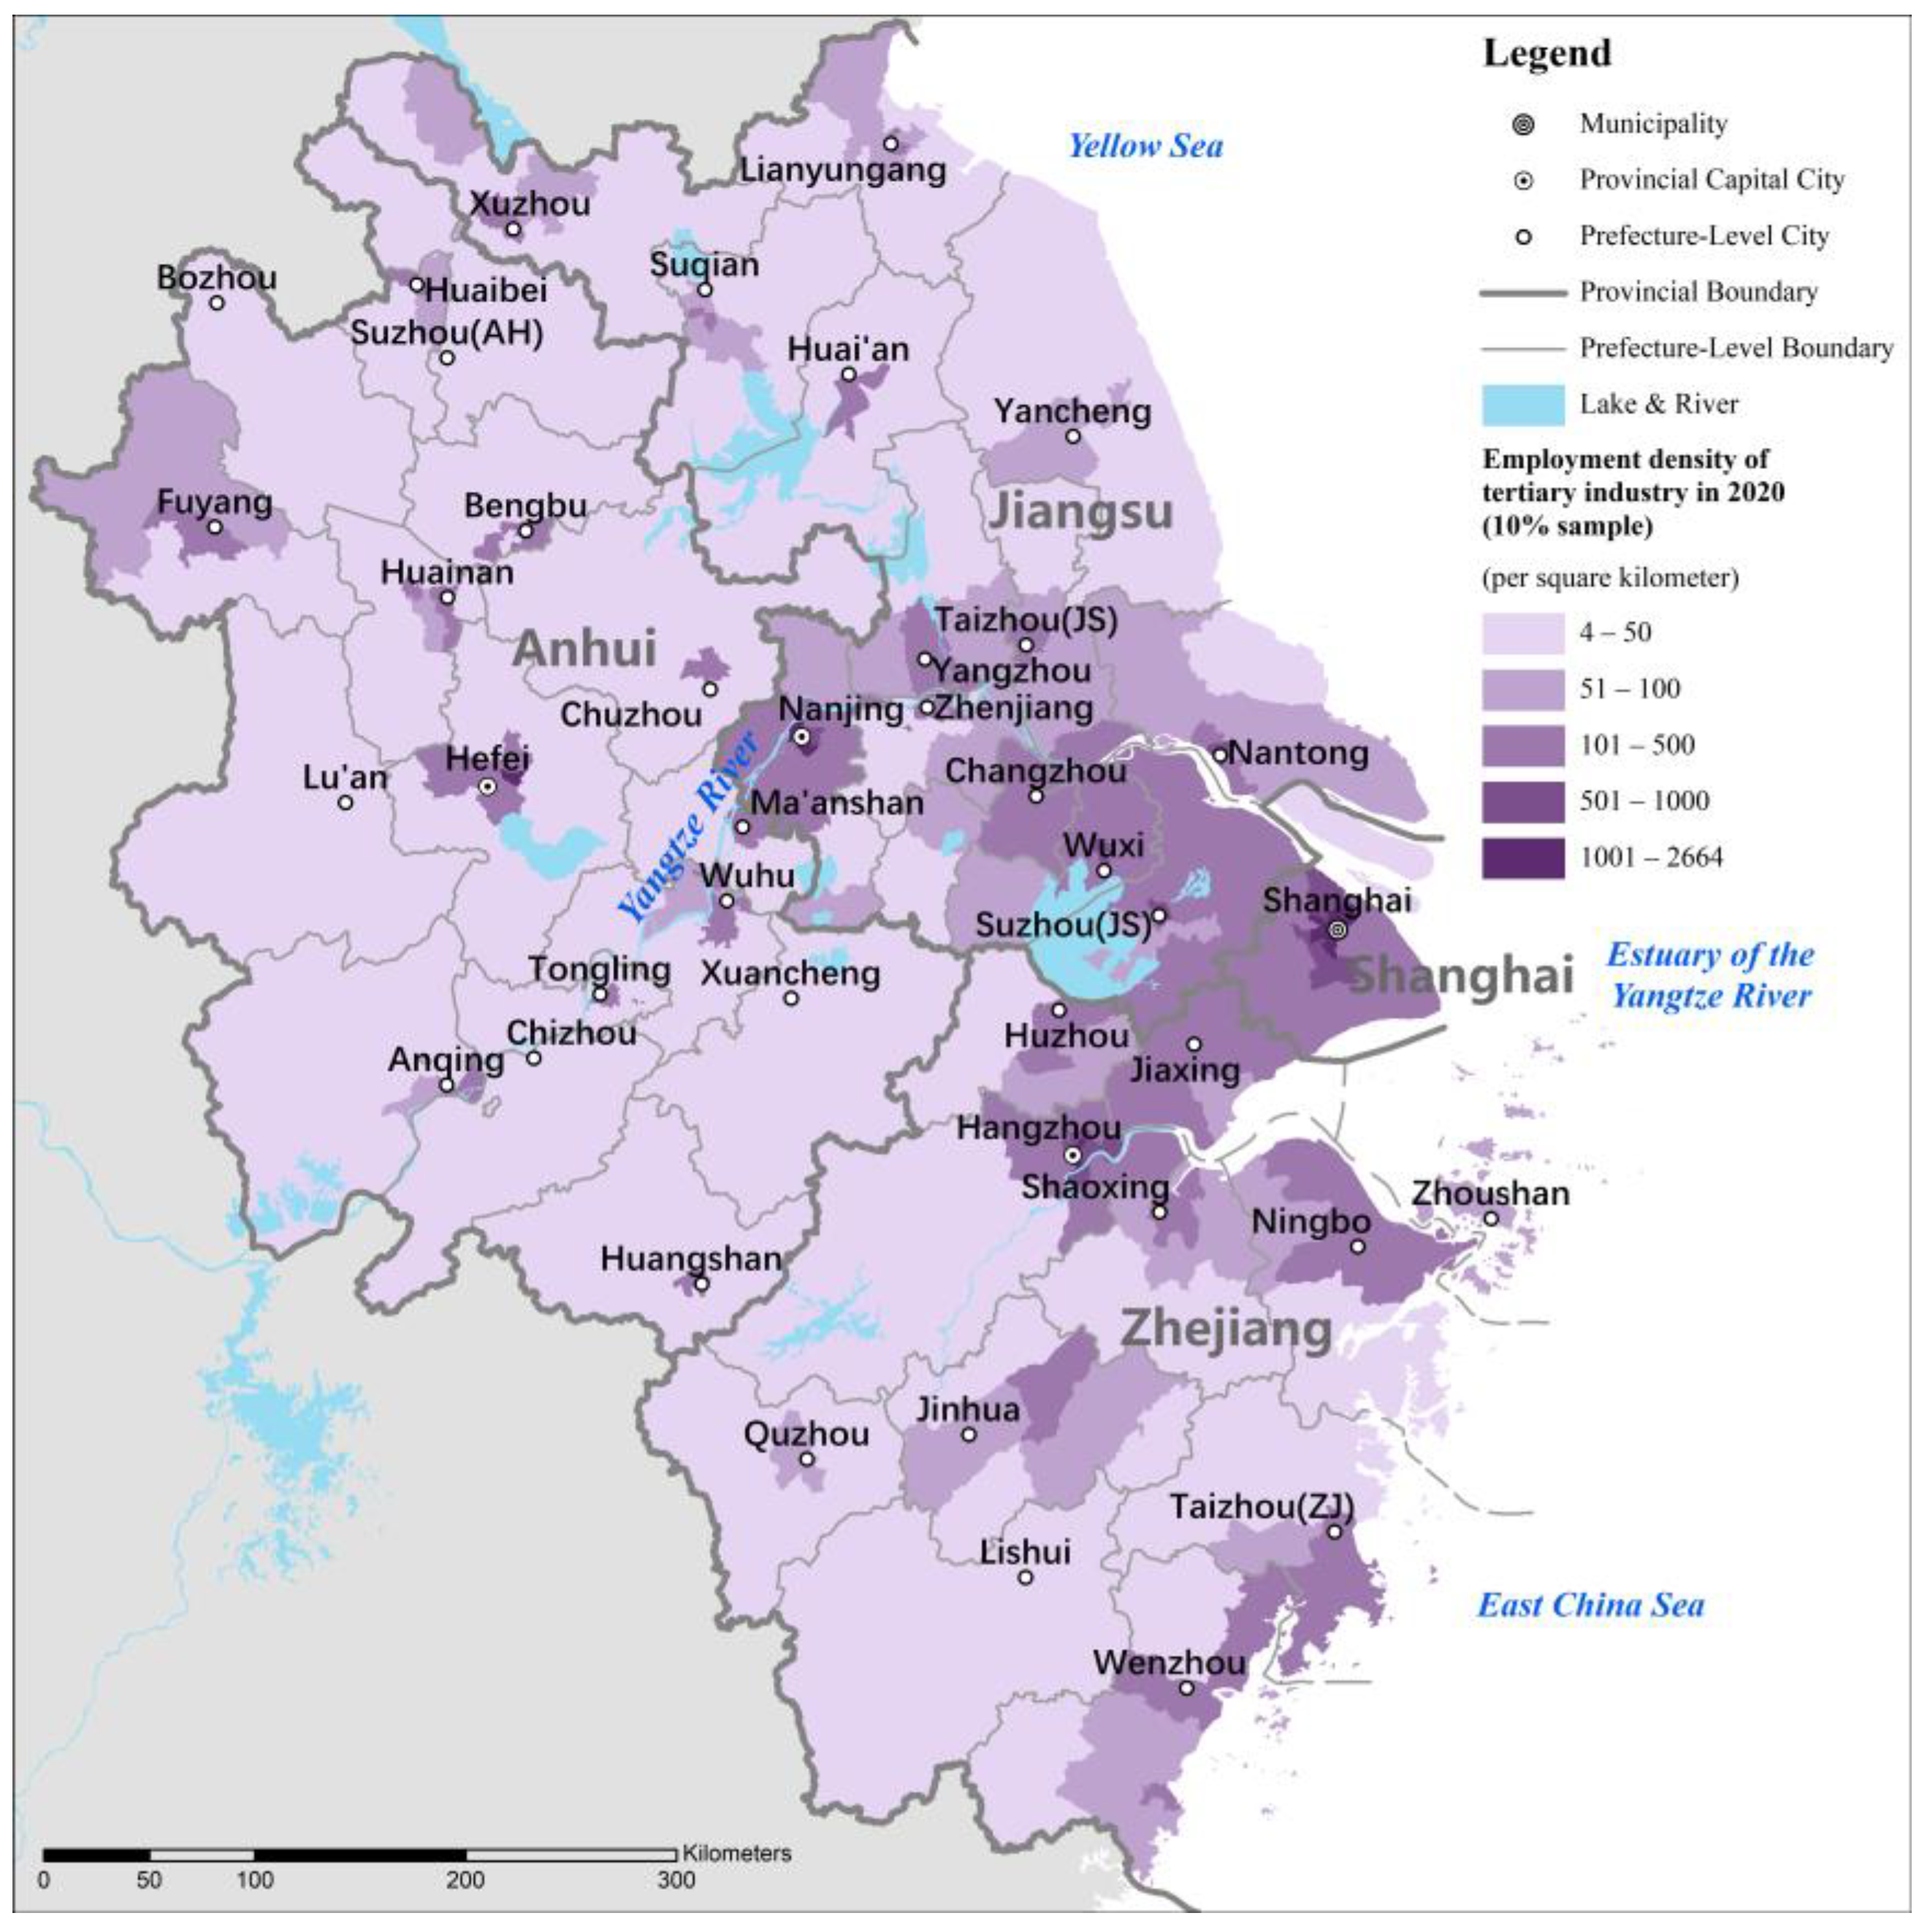
The spatial density analysis of the employed population is carried out separately in the primary, secondary and tertiary industries. The spatial density distribution of the primary industry is shown. The regions with a higher spatial density of the employed population in the primary industry include northern and eastern Jiangsu, and northern Anhui, indicating that more people are engaged in agriculture, forestry, animal husbandry and fishery industries in these regions (Figure 4). The regions with higher spatial density of the employed population in the secondary industry include Shanghai, south-central Jiangsu, northern Zhejiang and the eastern coastal areas, indicating that these regions have employ more people in manufacturing, construction and other industries (Figure 5). The spatial density distribution characteristics of the employed population in the tertiary industry are generally similar to those in the secondary industry, although the employed population in the tertiary industry is more centrally distributed in the centers and surrounding areas of major cities (Figure 6).

3.1.2. Changes in the Centroids of the Spatial Distribution of the Employed Population from 2000 to 2020

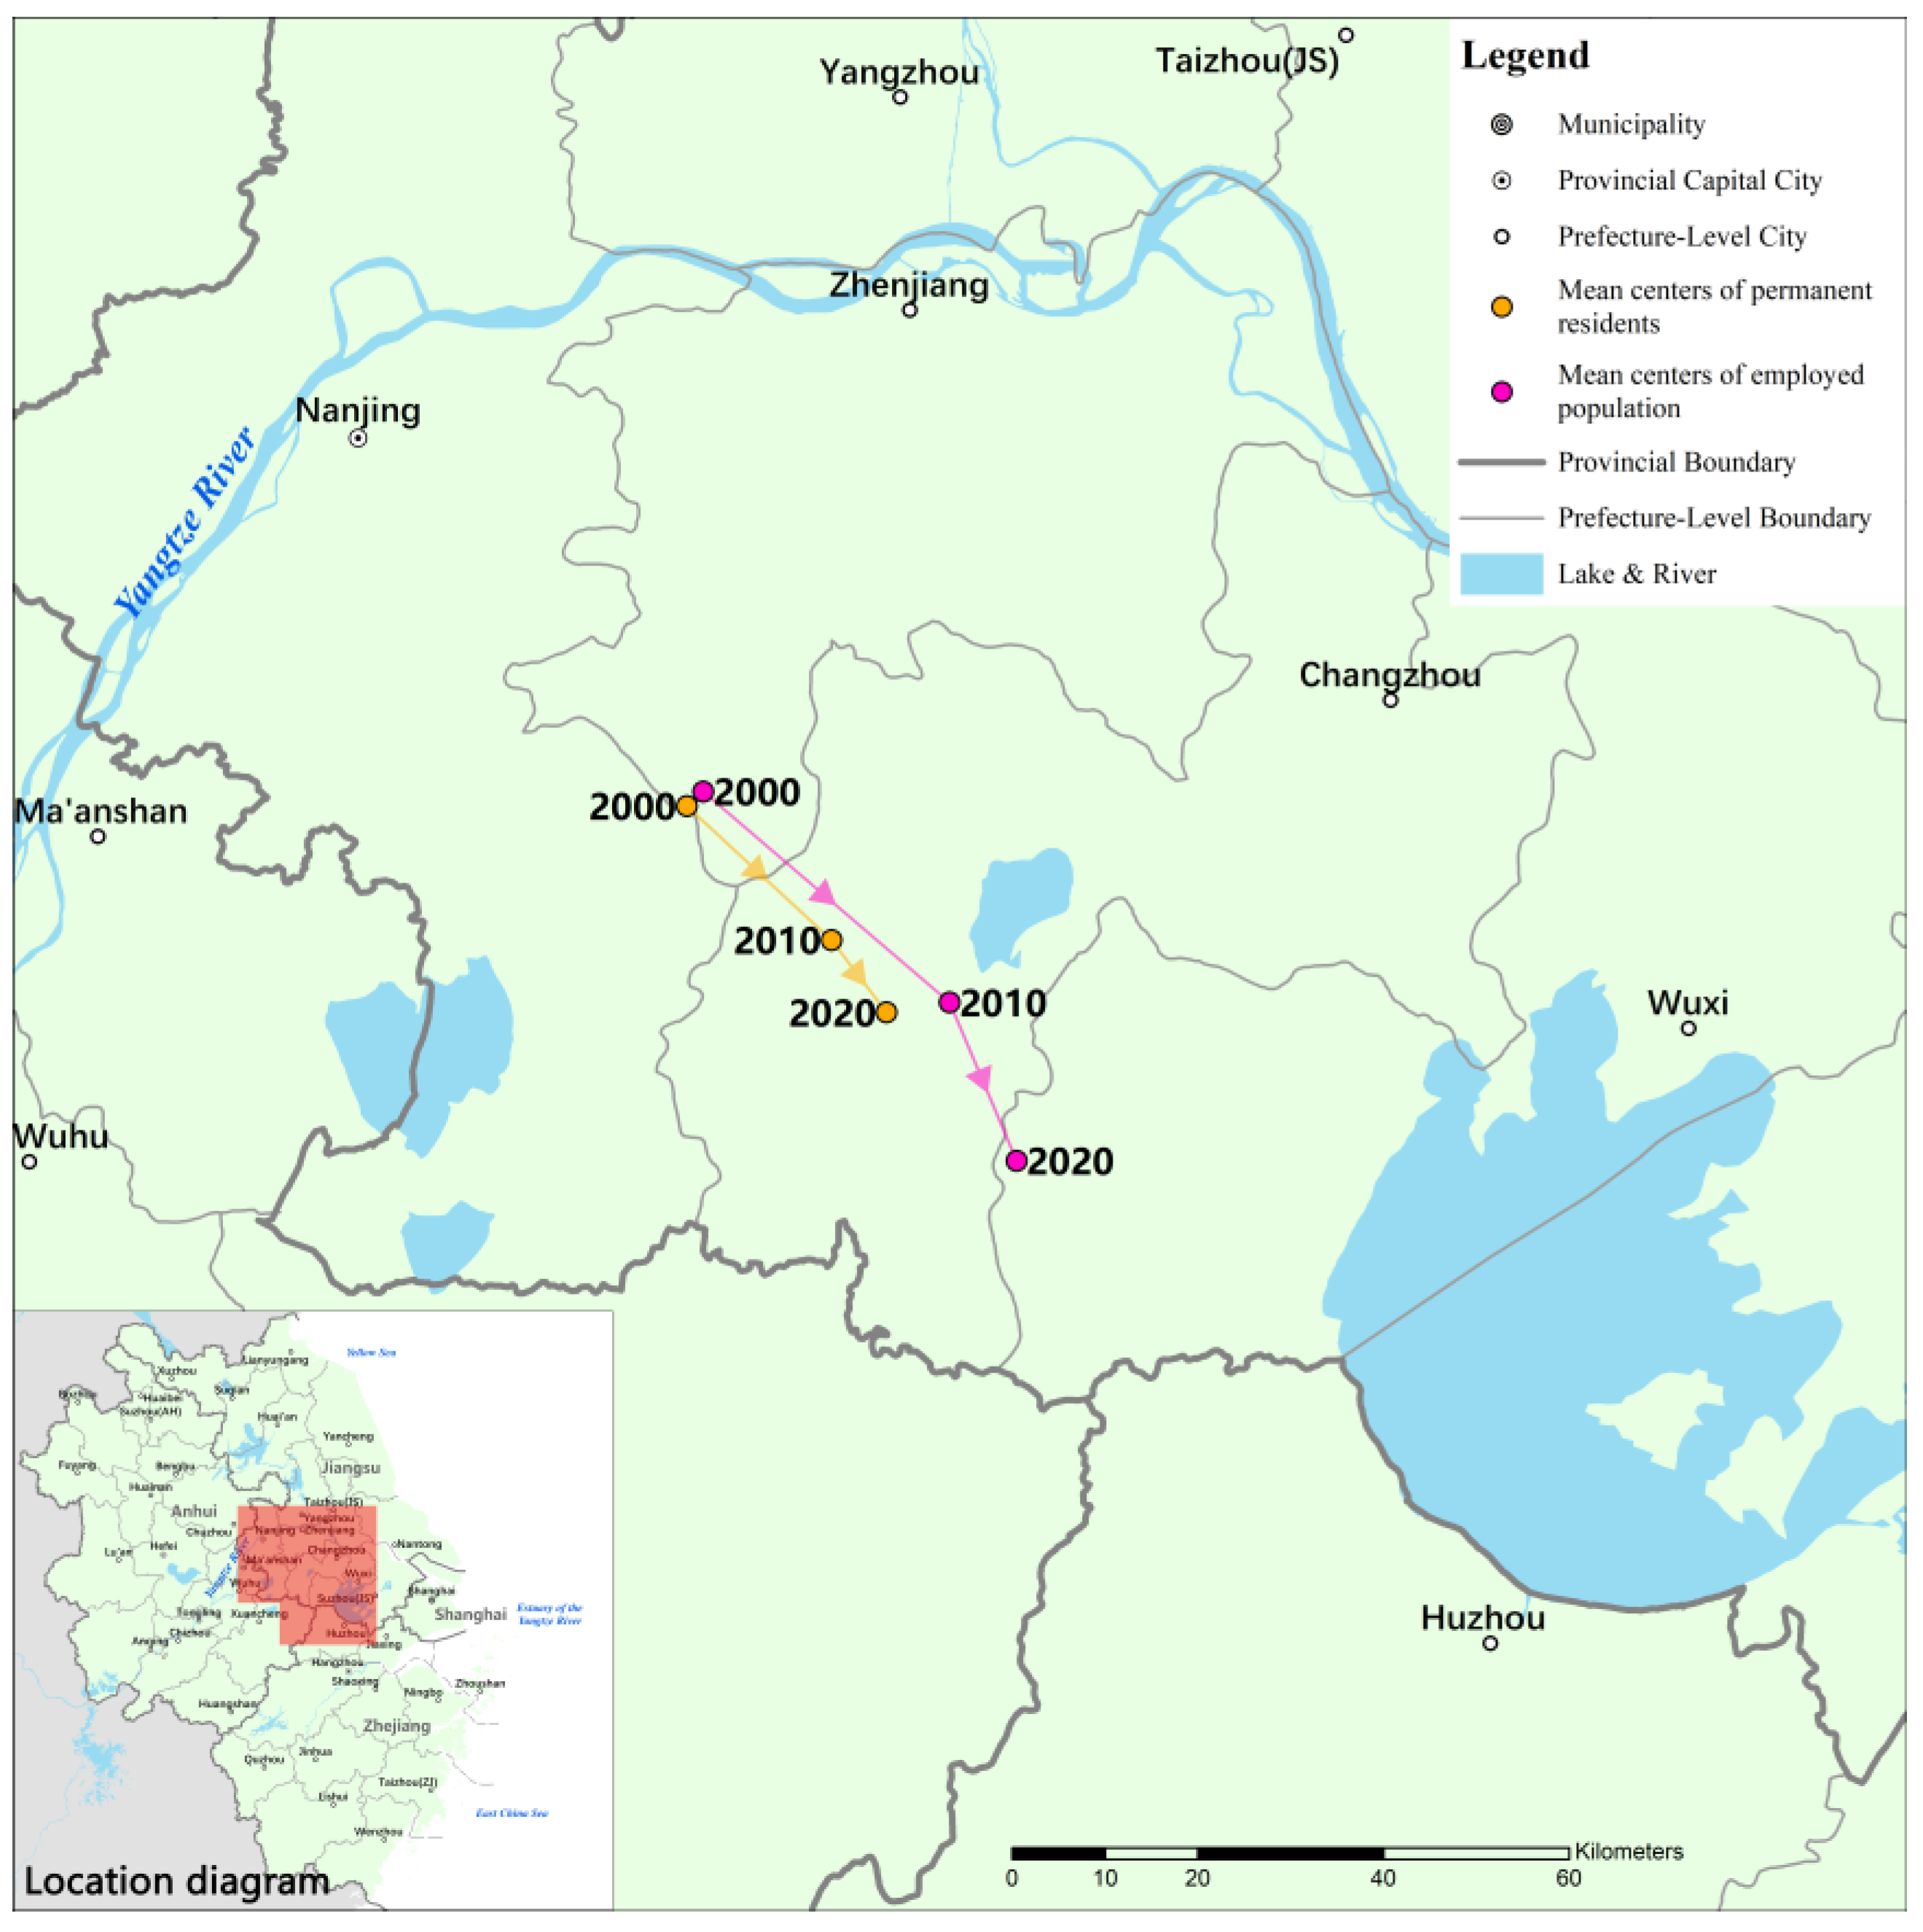
Based on the spatial extent of the YRD, the centroids of the spatial distribution of the resident and employed populations at three time points in 2000, 2010, and 2020 were calculated, and the results are shown in Figure 7. In general, the centroids of both resident and employed populations are distributed in the central part of the YRD region, specifically in the southwestern part of Jiangsu Province. Specifically, the centroid of the employed population is more to the east than the centroid of the resident population, indicating that the eastern coastal region of the YRD is more attractive for employment.
Moreover, the changes in the position of the centroids are compared for the three years. It can be observed that the centroids of both the resident and employed populations shifted towards the southeast, with the centroids of the employed population moving a greater distance. This indicates that during the period from 2000 to 2020, there was a clear tendency for the population in the YRD region to move in the southeast direction. Comparing the two time periods, it can be found that the centroid of population moved less in the later decade (2010–2020) than in the earlier decade (2000–2010), which indicates that the trend of southeastward migration of resident and employed population in the YRD region has begun to slow down in recent years. This phenomenon indicates that the balanced development strategy of the YRD region has begun to show results. In recent years, some cities in the western and northern parts of the YRD region (e.g., Hefei) have developed faster and become more attractive methods of population clustering.

3.1.3. Changes in the Spatial Distribution Density of the Employed Population from 2000 to 2020

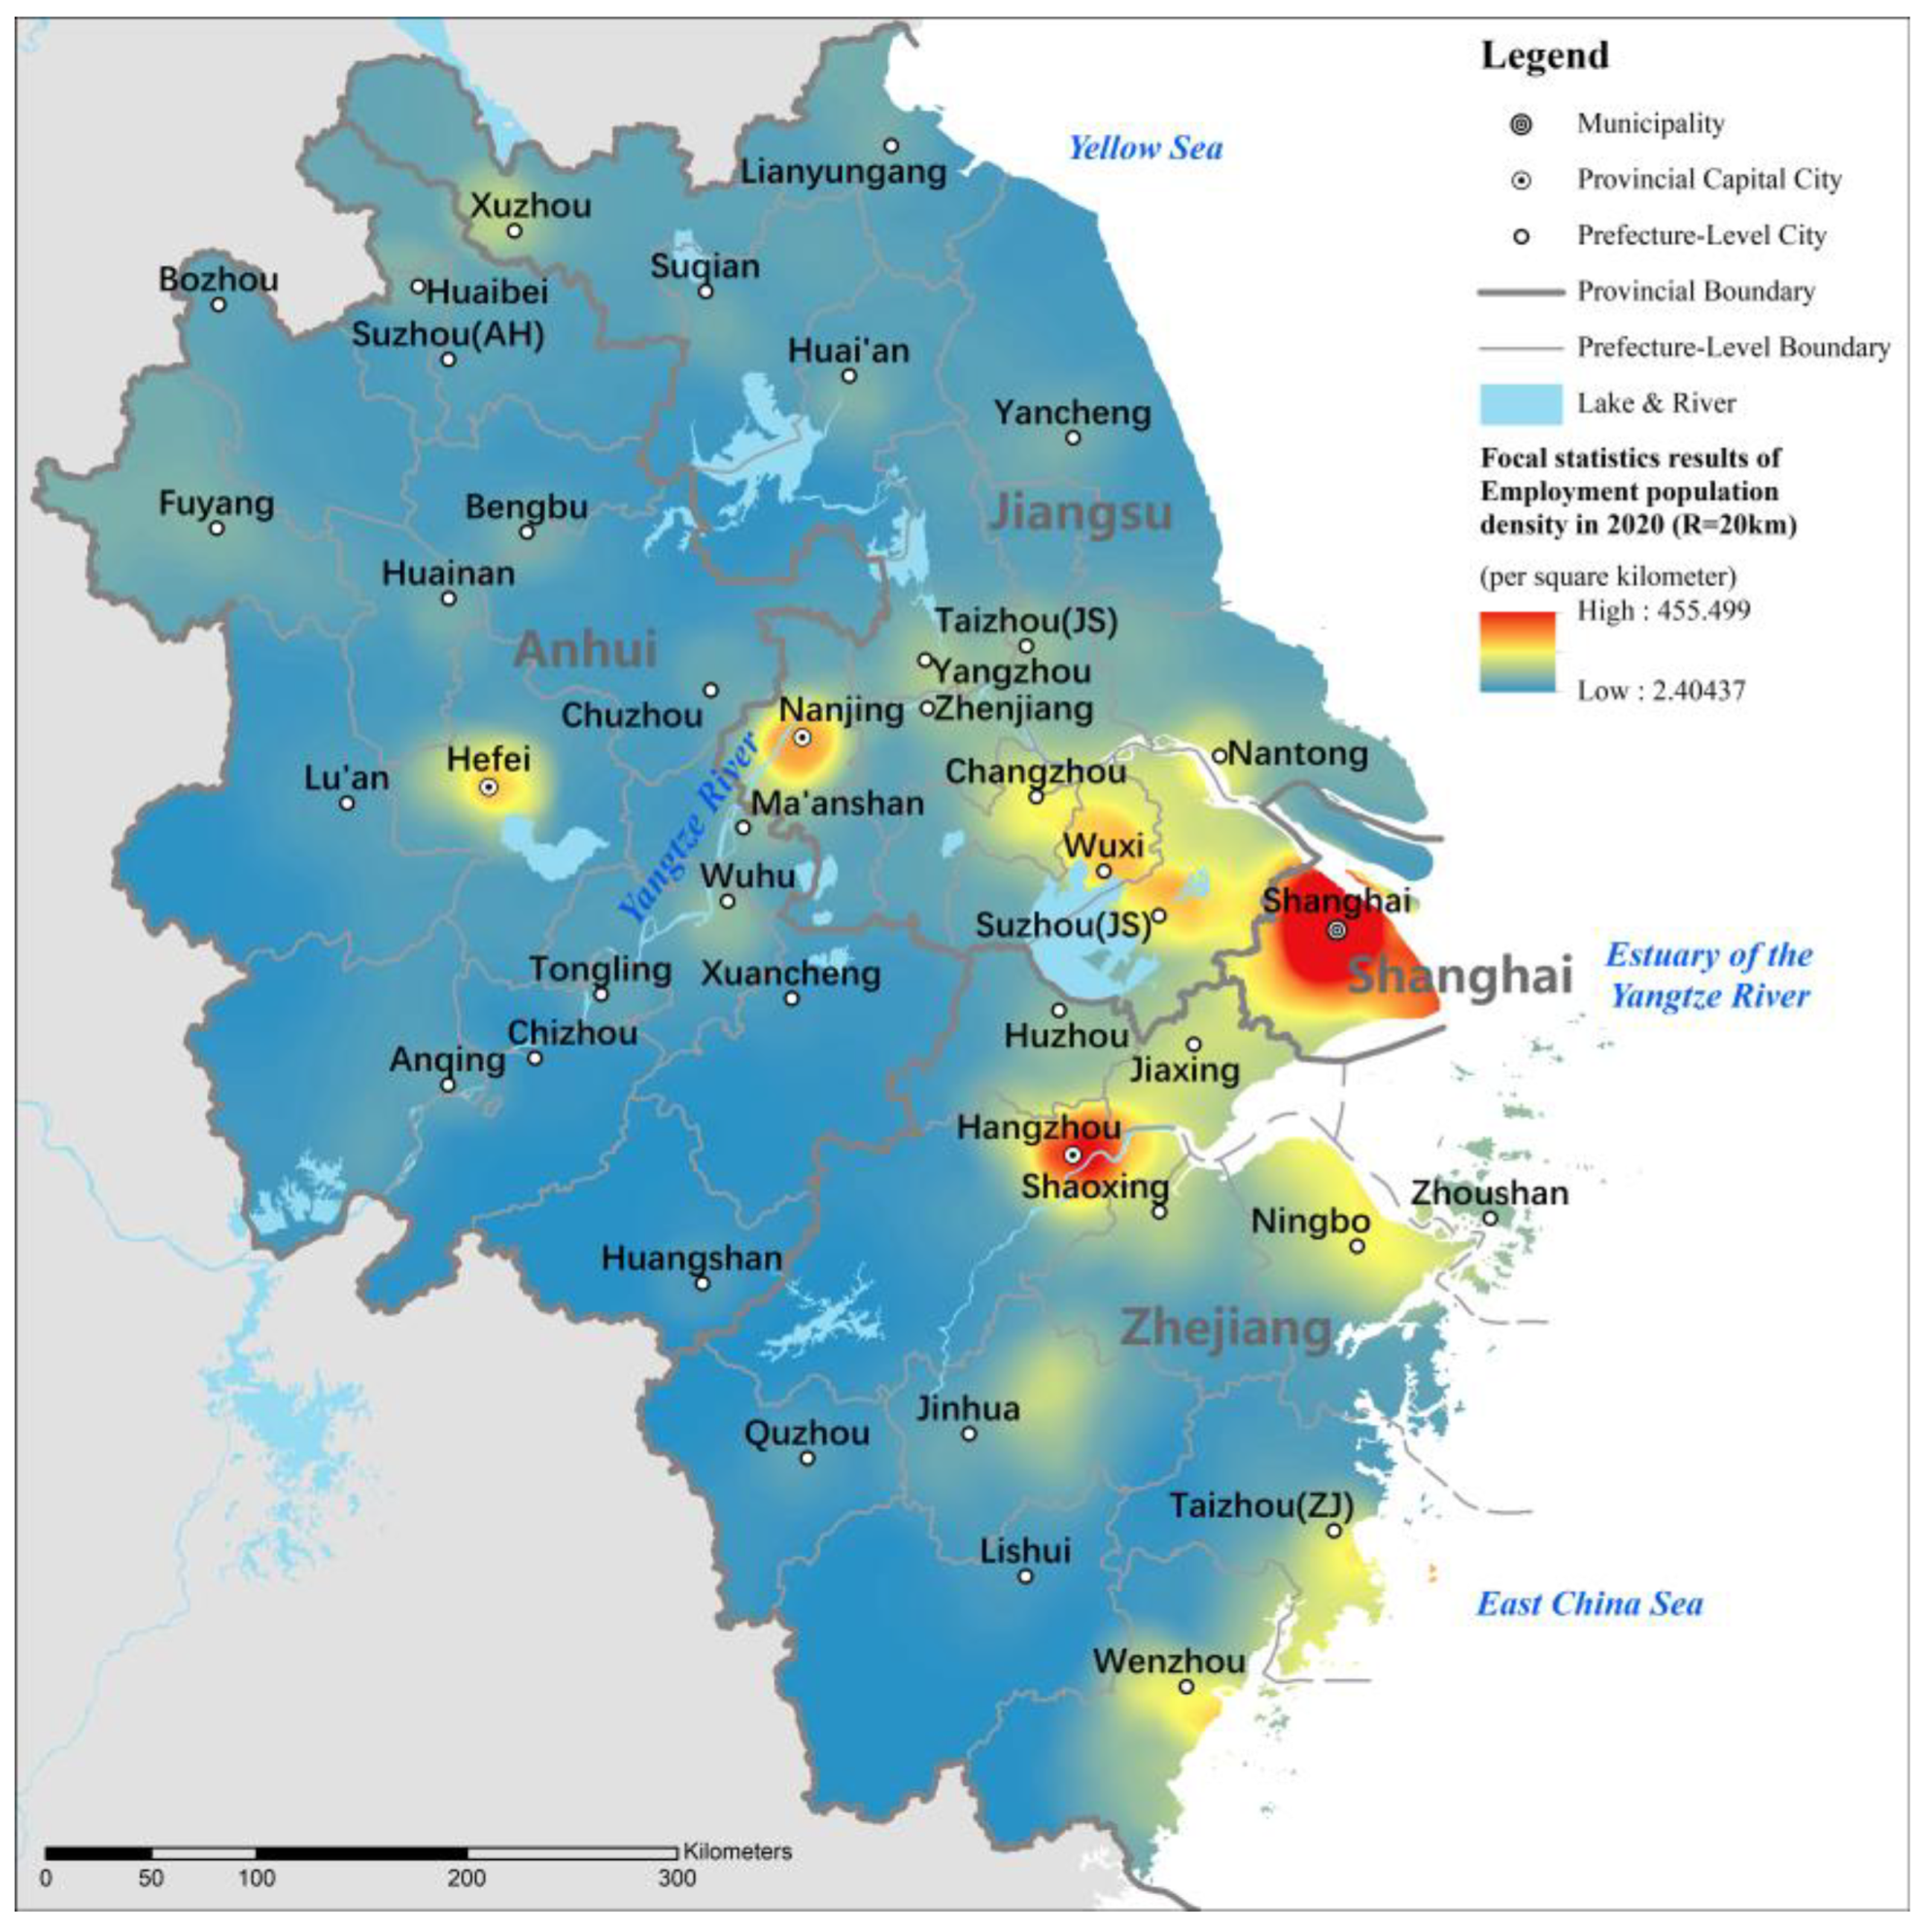
The results of the focal statistical analysis based on spatial density (the results for 2020 are shown in Figure 8) were used to carry out the analysis of the changes in the spatial distribution of the employed population during the period from 2000 to 2020.
  • Changes in employed population density
In general, the employed population is mainly clustered in the core regions of the YRD, namely Shanghai, southern Jiangsu, and northern Zhejiang (Figure 9). In addition, the more obvious regions with increasing employed population density include Hefei in Anhui Province, Wenzhou-Taizhou coastal area in Zhejiang Province, and Jinhua surrounding area in Zhejiang Province. Regions with significant decreases in employed population density include northern Anhui, as well as northern and central Jiangsu. This feature indicates that relatively developed areas and areas around large cities have the advantage of attracting a concentration of employment.
  • Changes in density of employed population in different industrial sectors
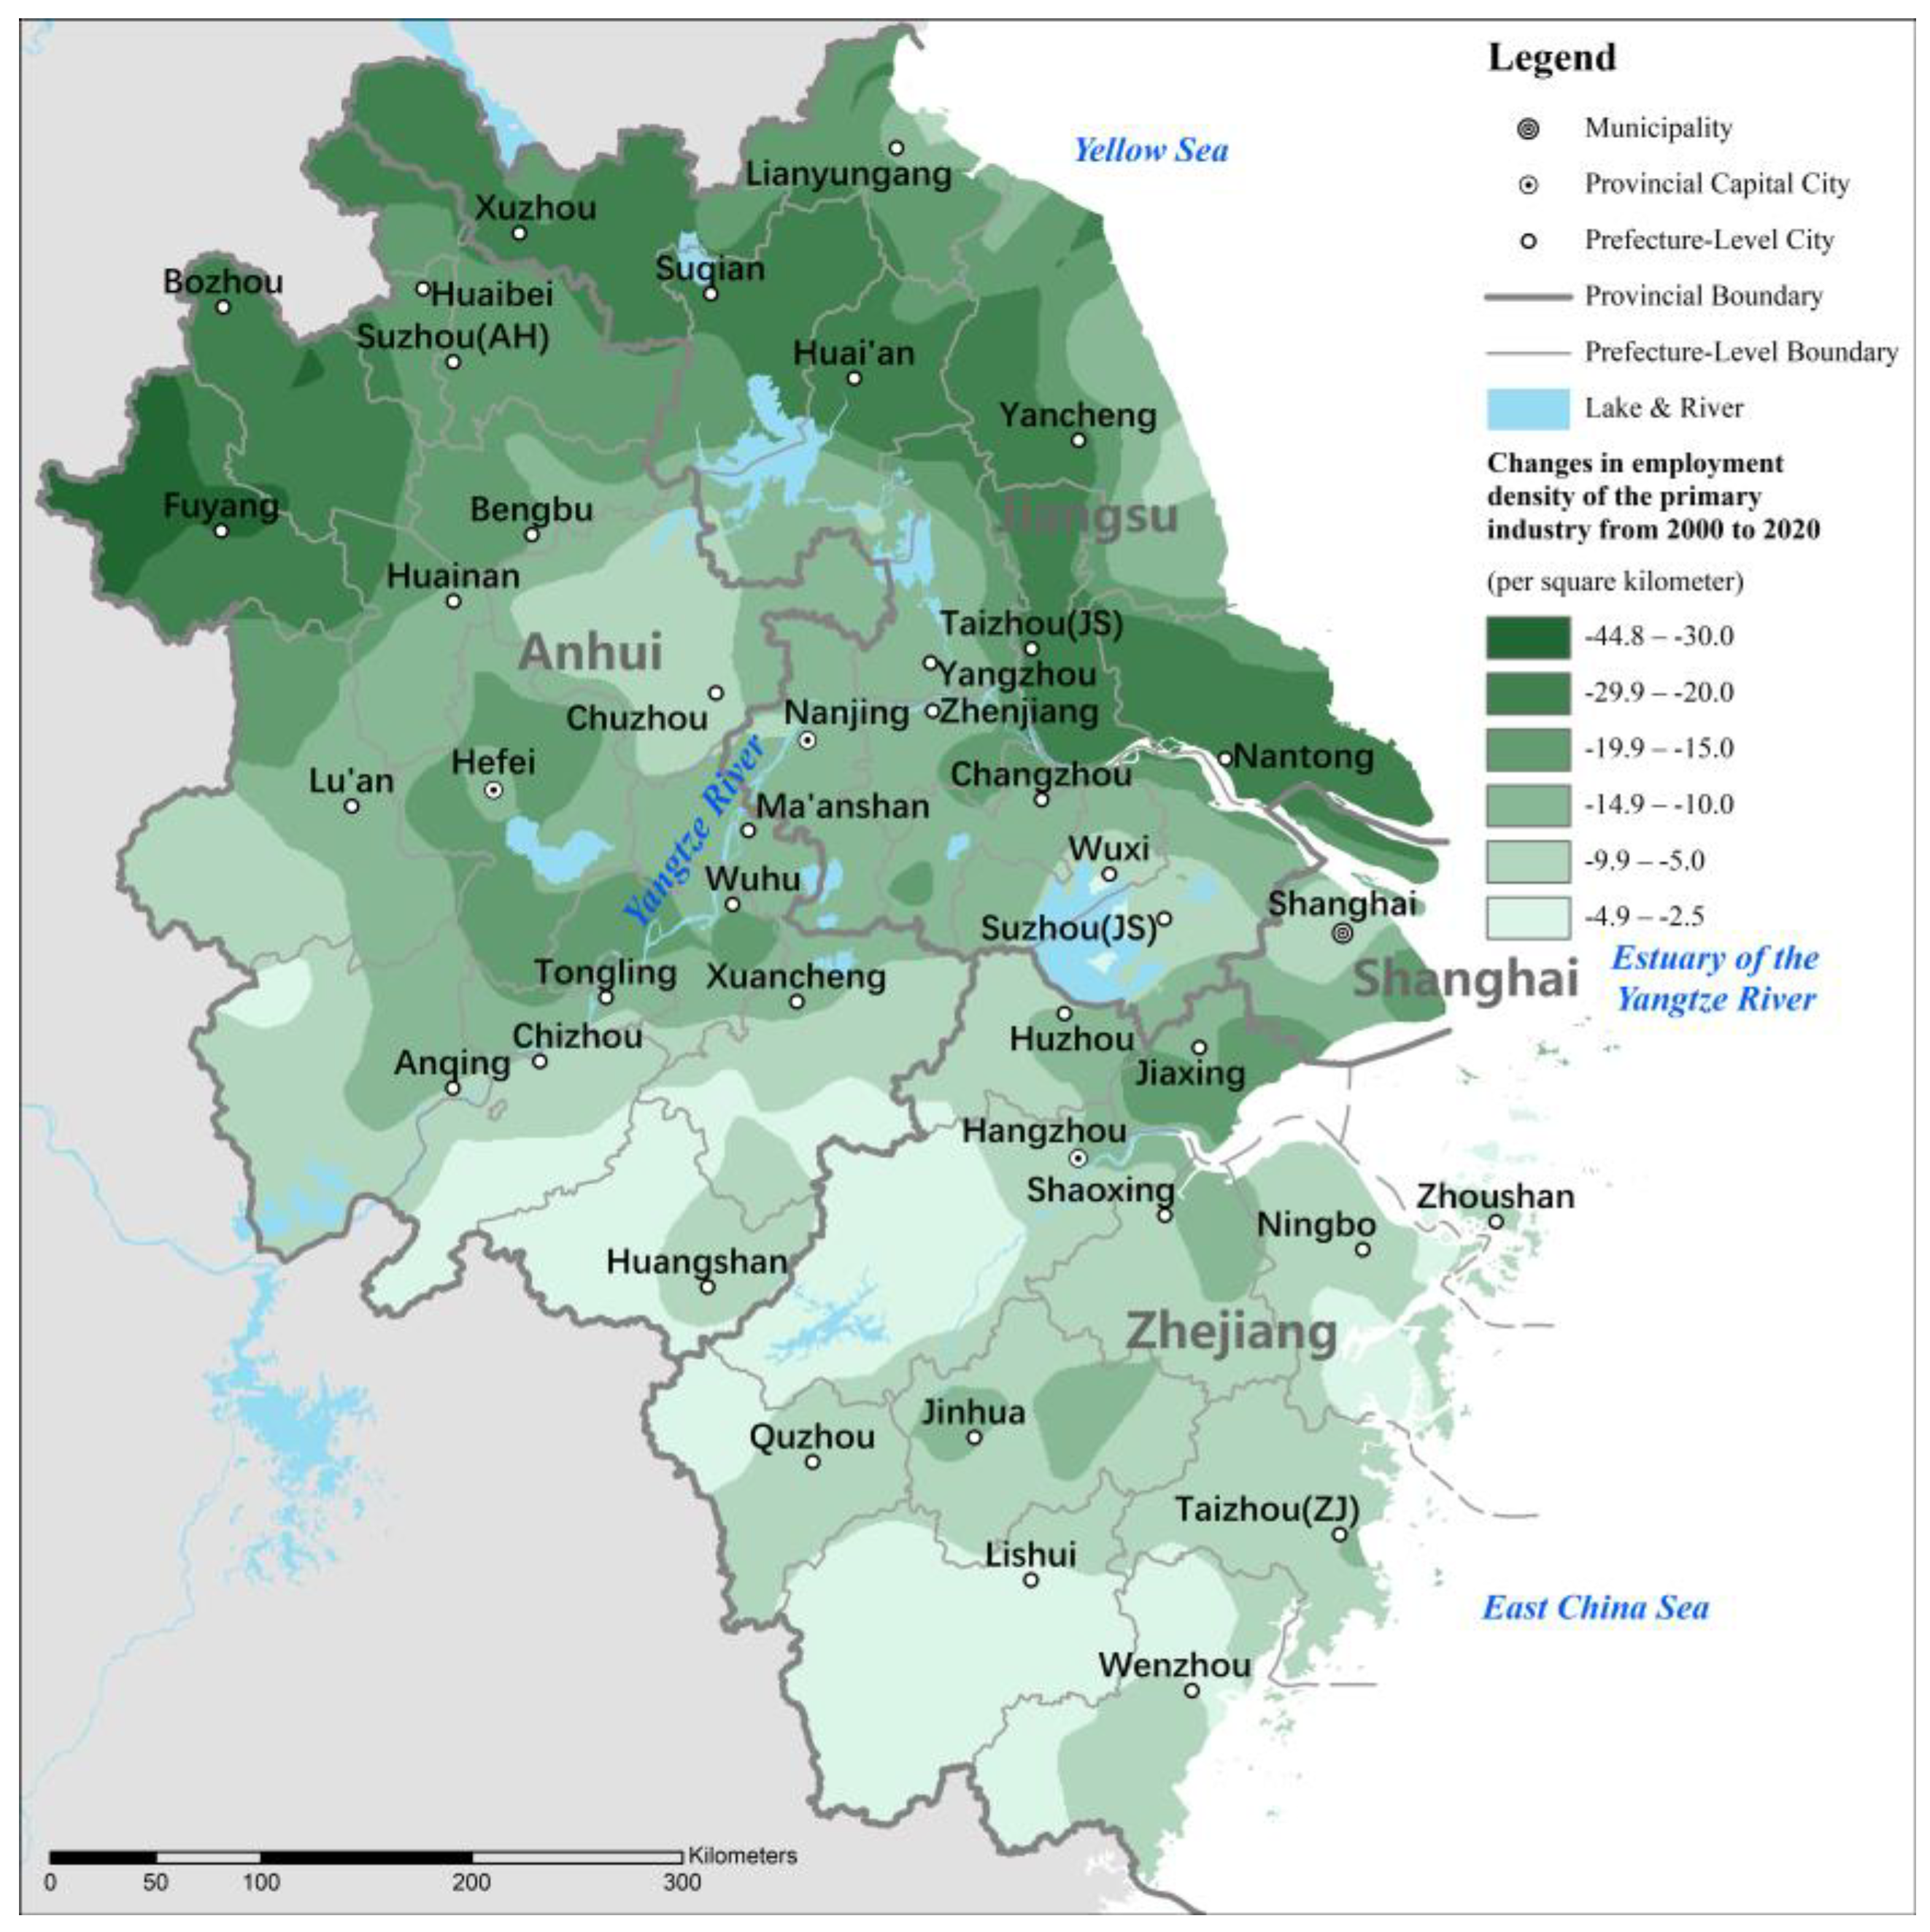
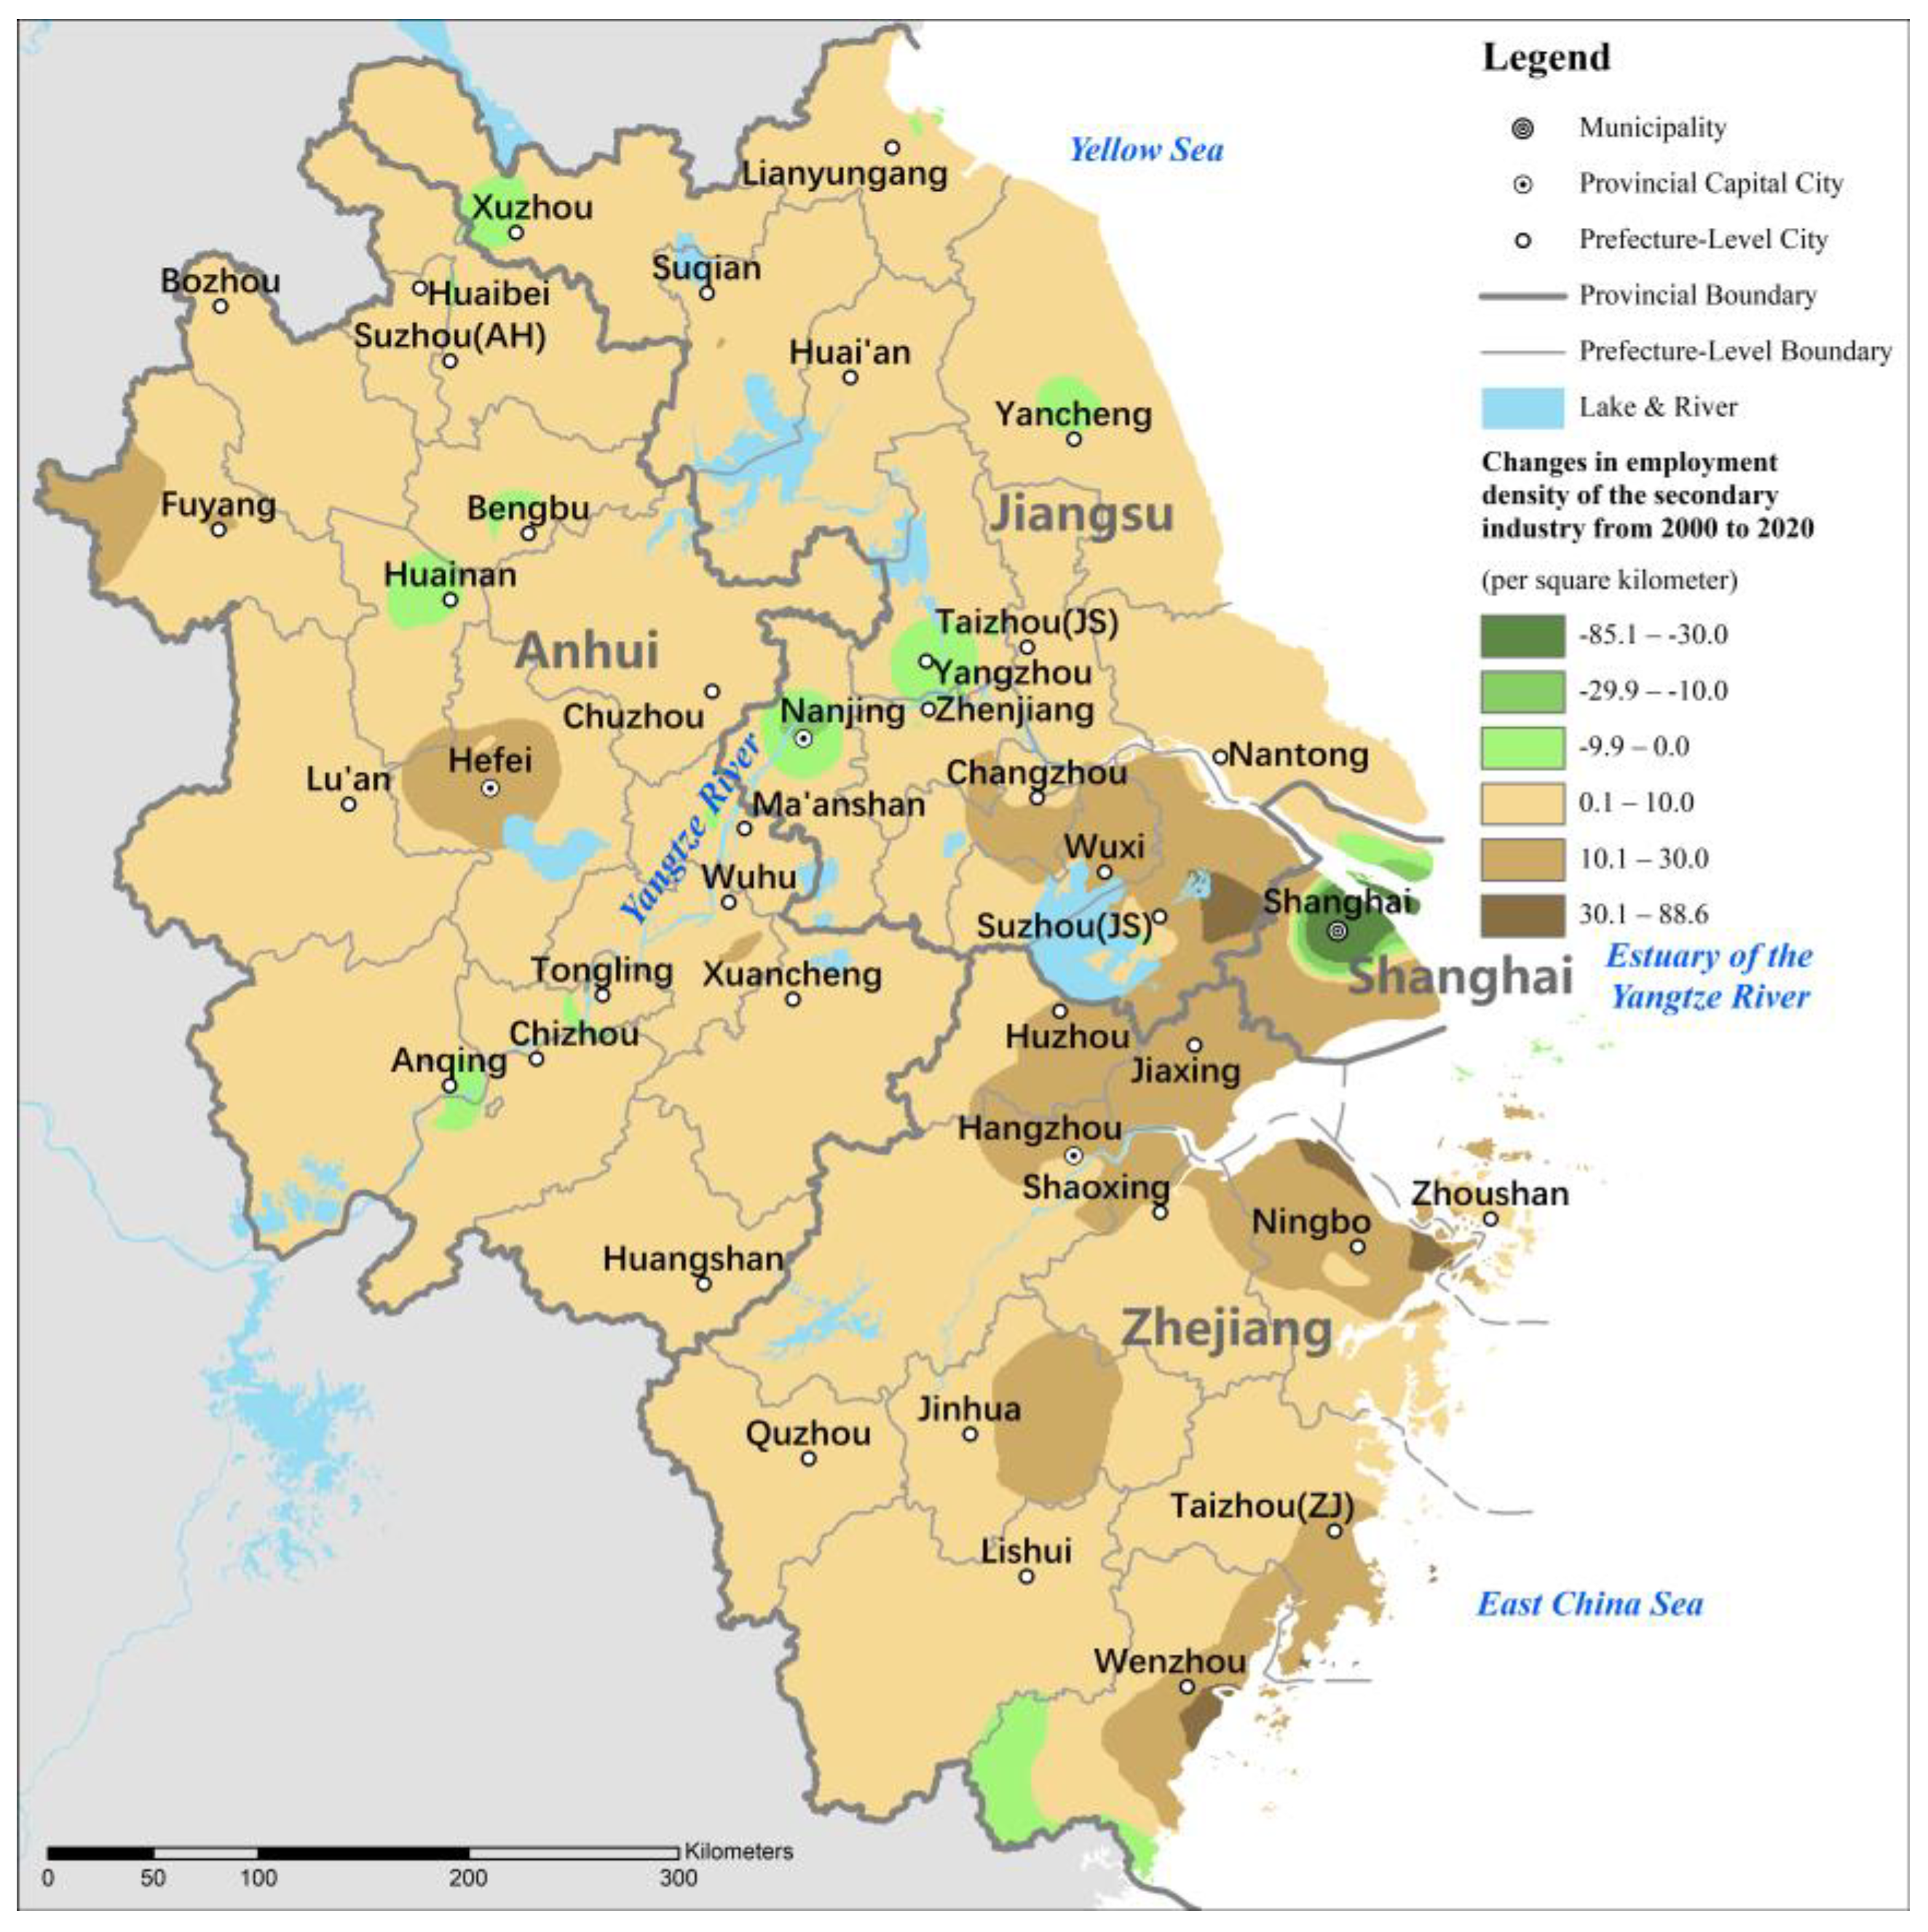
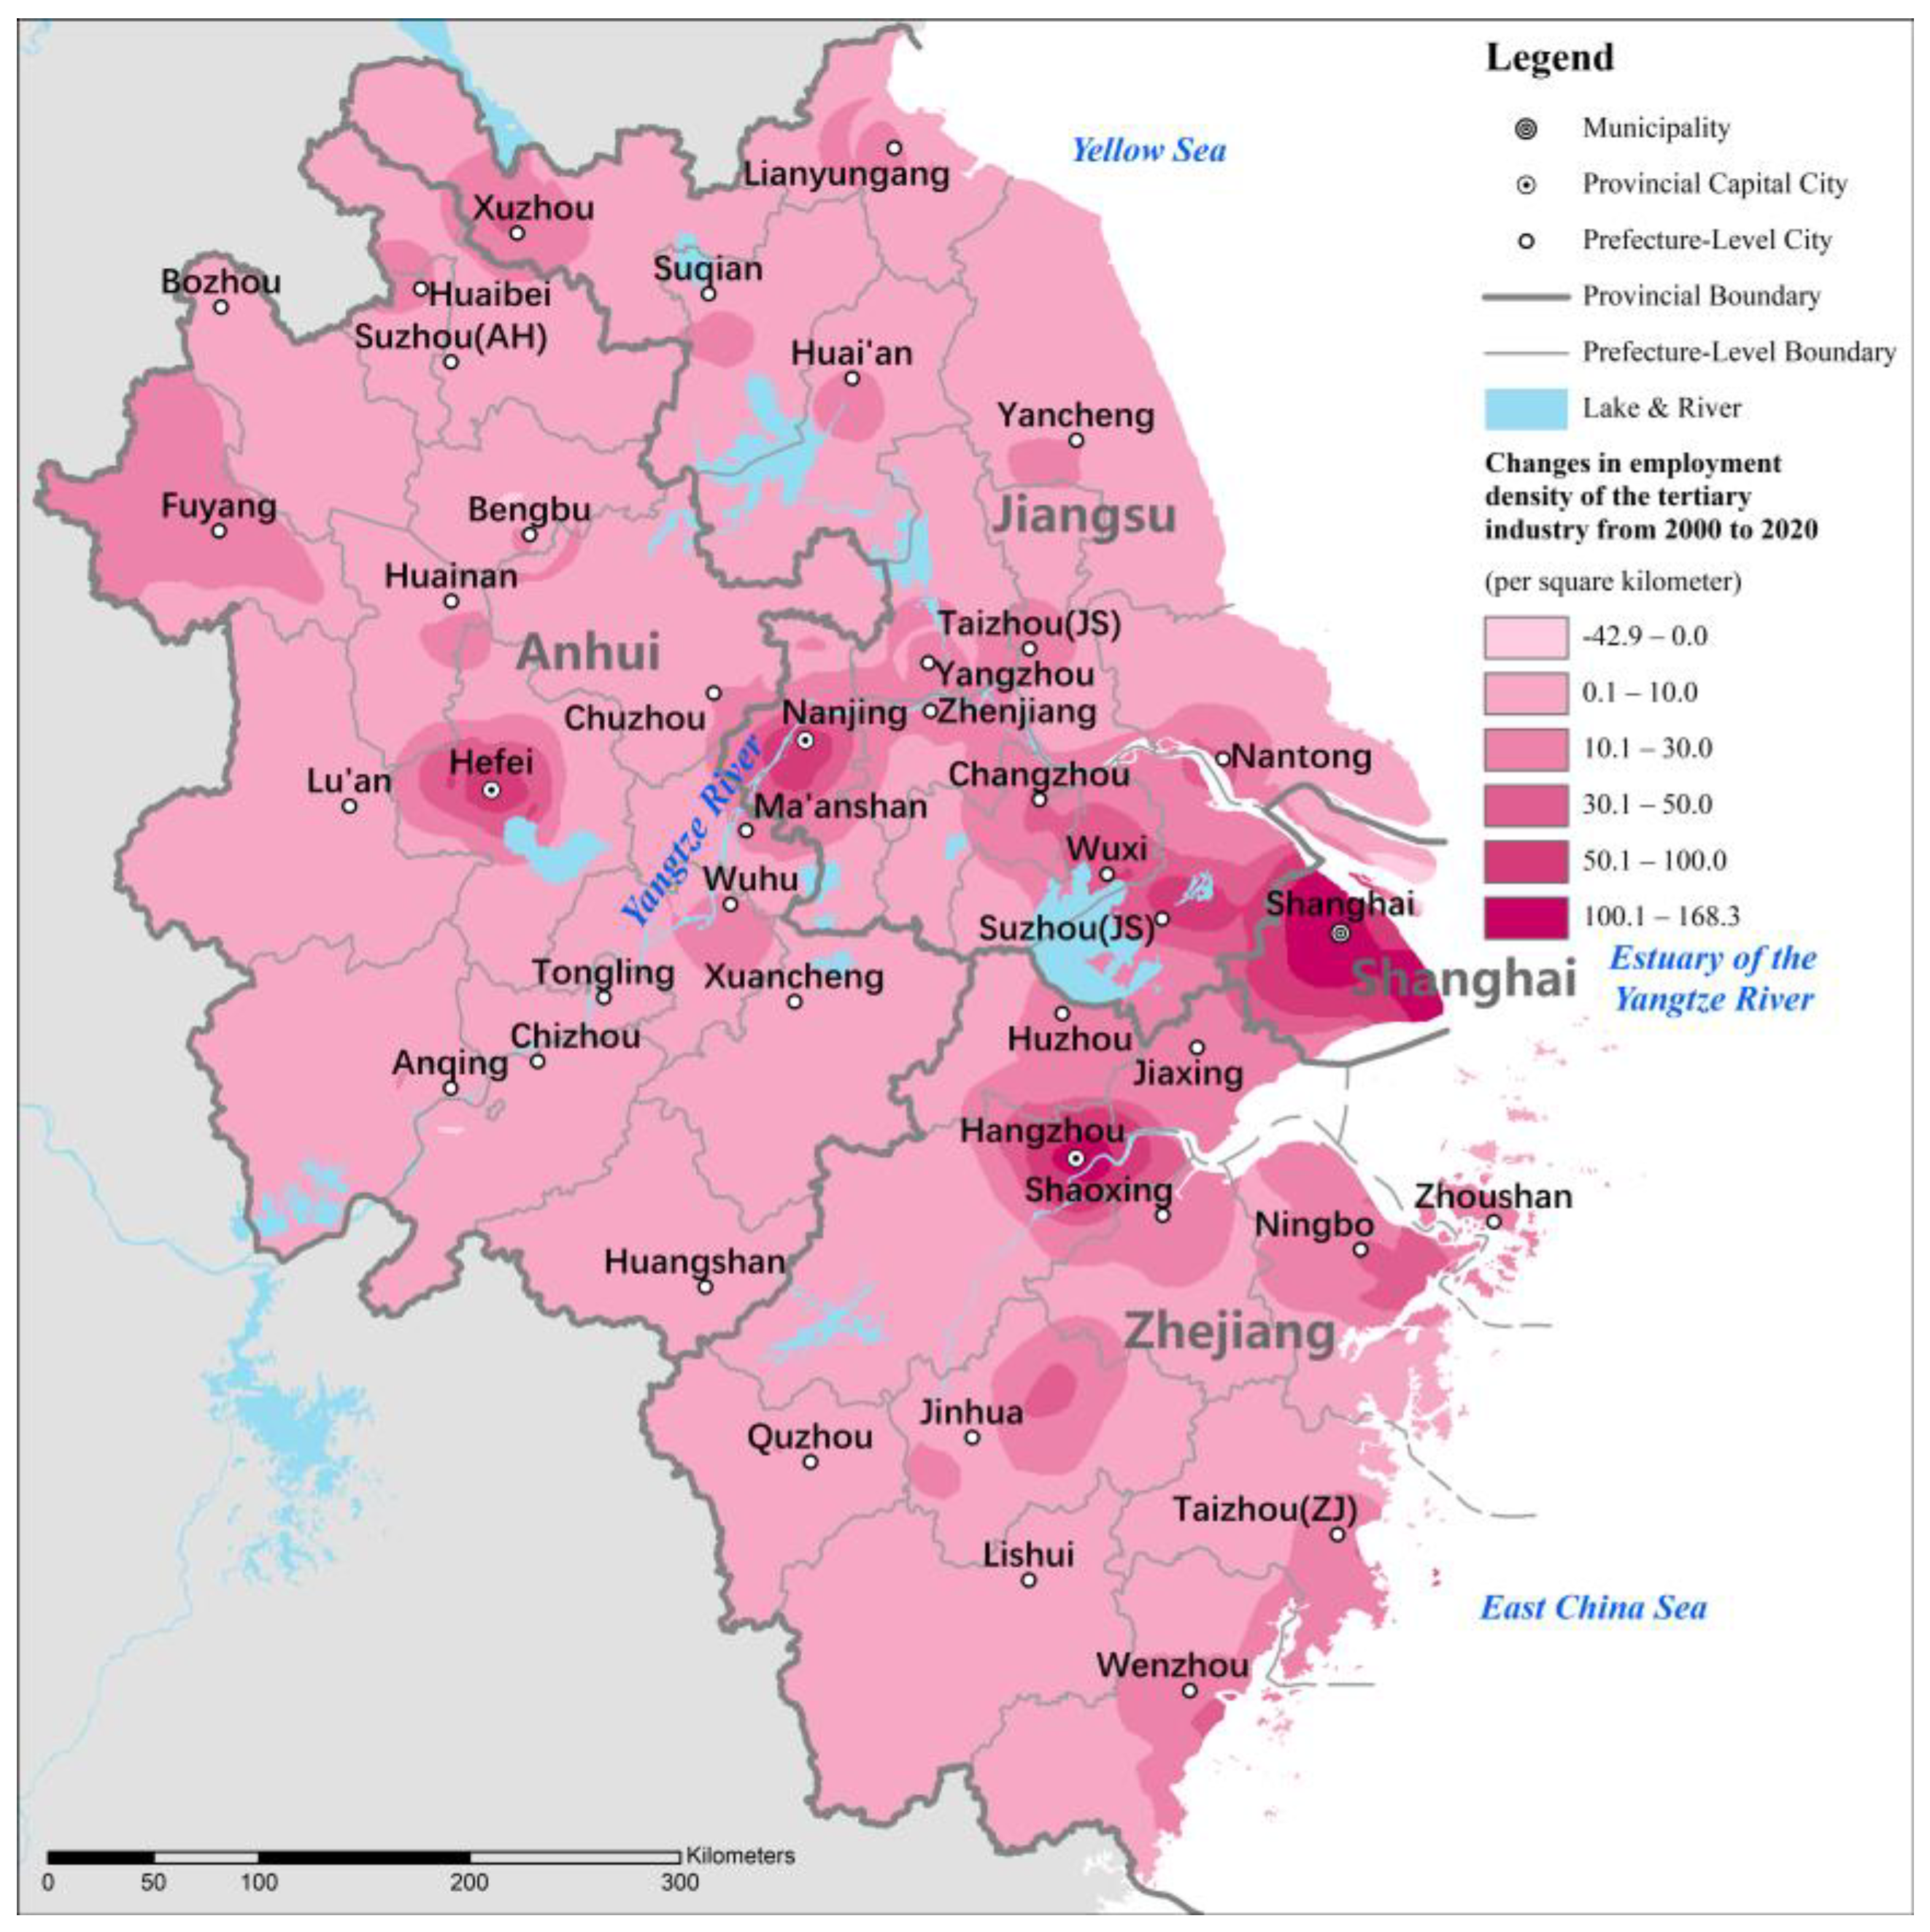
The employed population in the primary sector is characterized by a decrease across almost the entire YRD region (Figure 10). This phenomenon indicates that the level of urbanization in the YRD region continues to increase. Specifically, the regions with the most significant decreases are northern Anhui and north-central Jiangsu. These regions are relatively late-developing regions in the YRD region, and more people employed in the primary industry have moved to the core region for employment in the secondary and tertiary industries in recent years. The change in the density of secondary industry employment shows a trend of significant increasing in some regions and significant decreasing in some regions (Figure 11). The regions that significantly increased include southeastern Jiangsu, northern Zhejiang, southeastern coastal Zhejiang, central Zhejiang, and Hefei, Anhui. The regions that significantly decreased include the central urban areas of Shanghai, Nanjing and Xuzhou. Among them, the degree of decrease in Shanghai was particularly prominent. This phenomenon indicates that the development of secondary industry shows different characteristics in different regions. In cities with earlier development such as Shanghai and Nanjing, their central areas have started to take the lead in deindustrialization. In recent years, the areas around major cities with better locational development conditions have become hot spots for the development of the secondary industry. The employment density of the tertiary industry has grown more significantly in the central areas of major cities and the surrounding areas (Figure 12). The four cities with the most prominent growth are Shanghai and the three provincial capitals: Nanjing, Hangzhou, and Hefei. This phenomenon indicates that large cities with higher administrative levels have outstanding advantages in attracting service sector employment.

3.2. Cluster Analysis of Change Characteristics Based on 41 Cities

A cluster analysis was conducted on the characteristics of employed population changes in 41 cities in the YRD region. Systematic clustering in SPSS is used to carry out the analysis and discussion from three perspectives: industrial structure, time period, and spatial level. The clustering method was average linkage (between groups) method using Euclidean distance measurement. Based on the tree genealogy map obtained from the analysis (Figure 13), the classification and branching relationships of the 41 cities were identified, and the main categories were mapped into a visual map for subsequent analysis and interpretation.

3.2.1. Cluster by Industry Structure

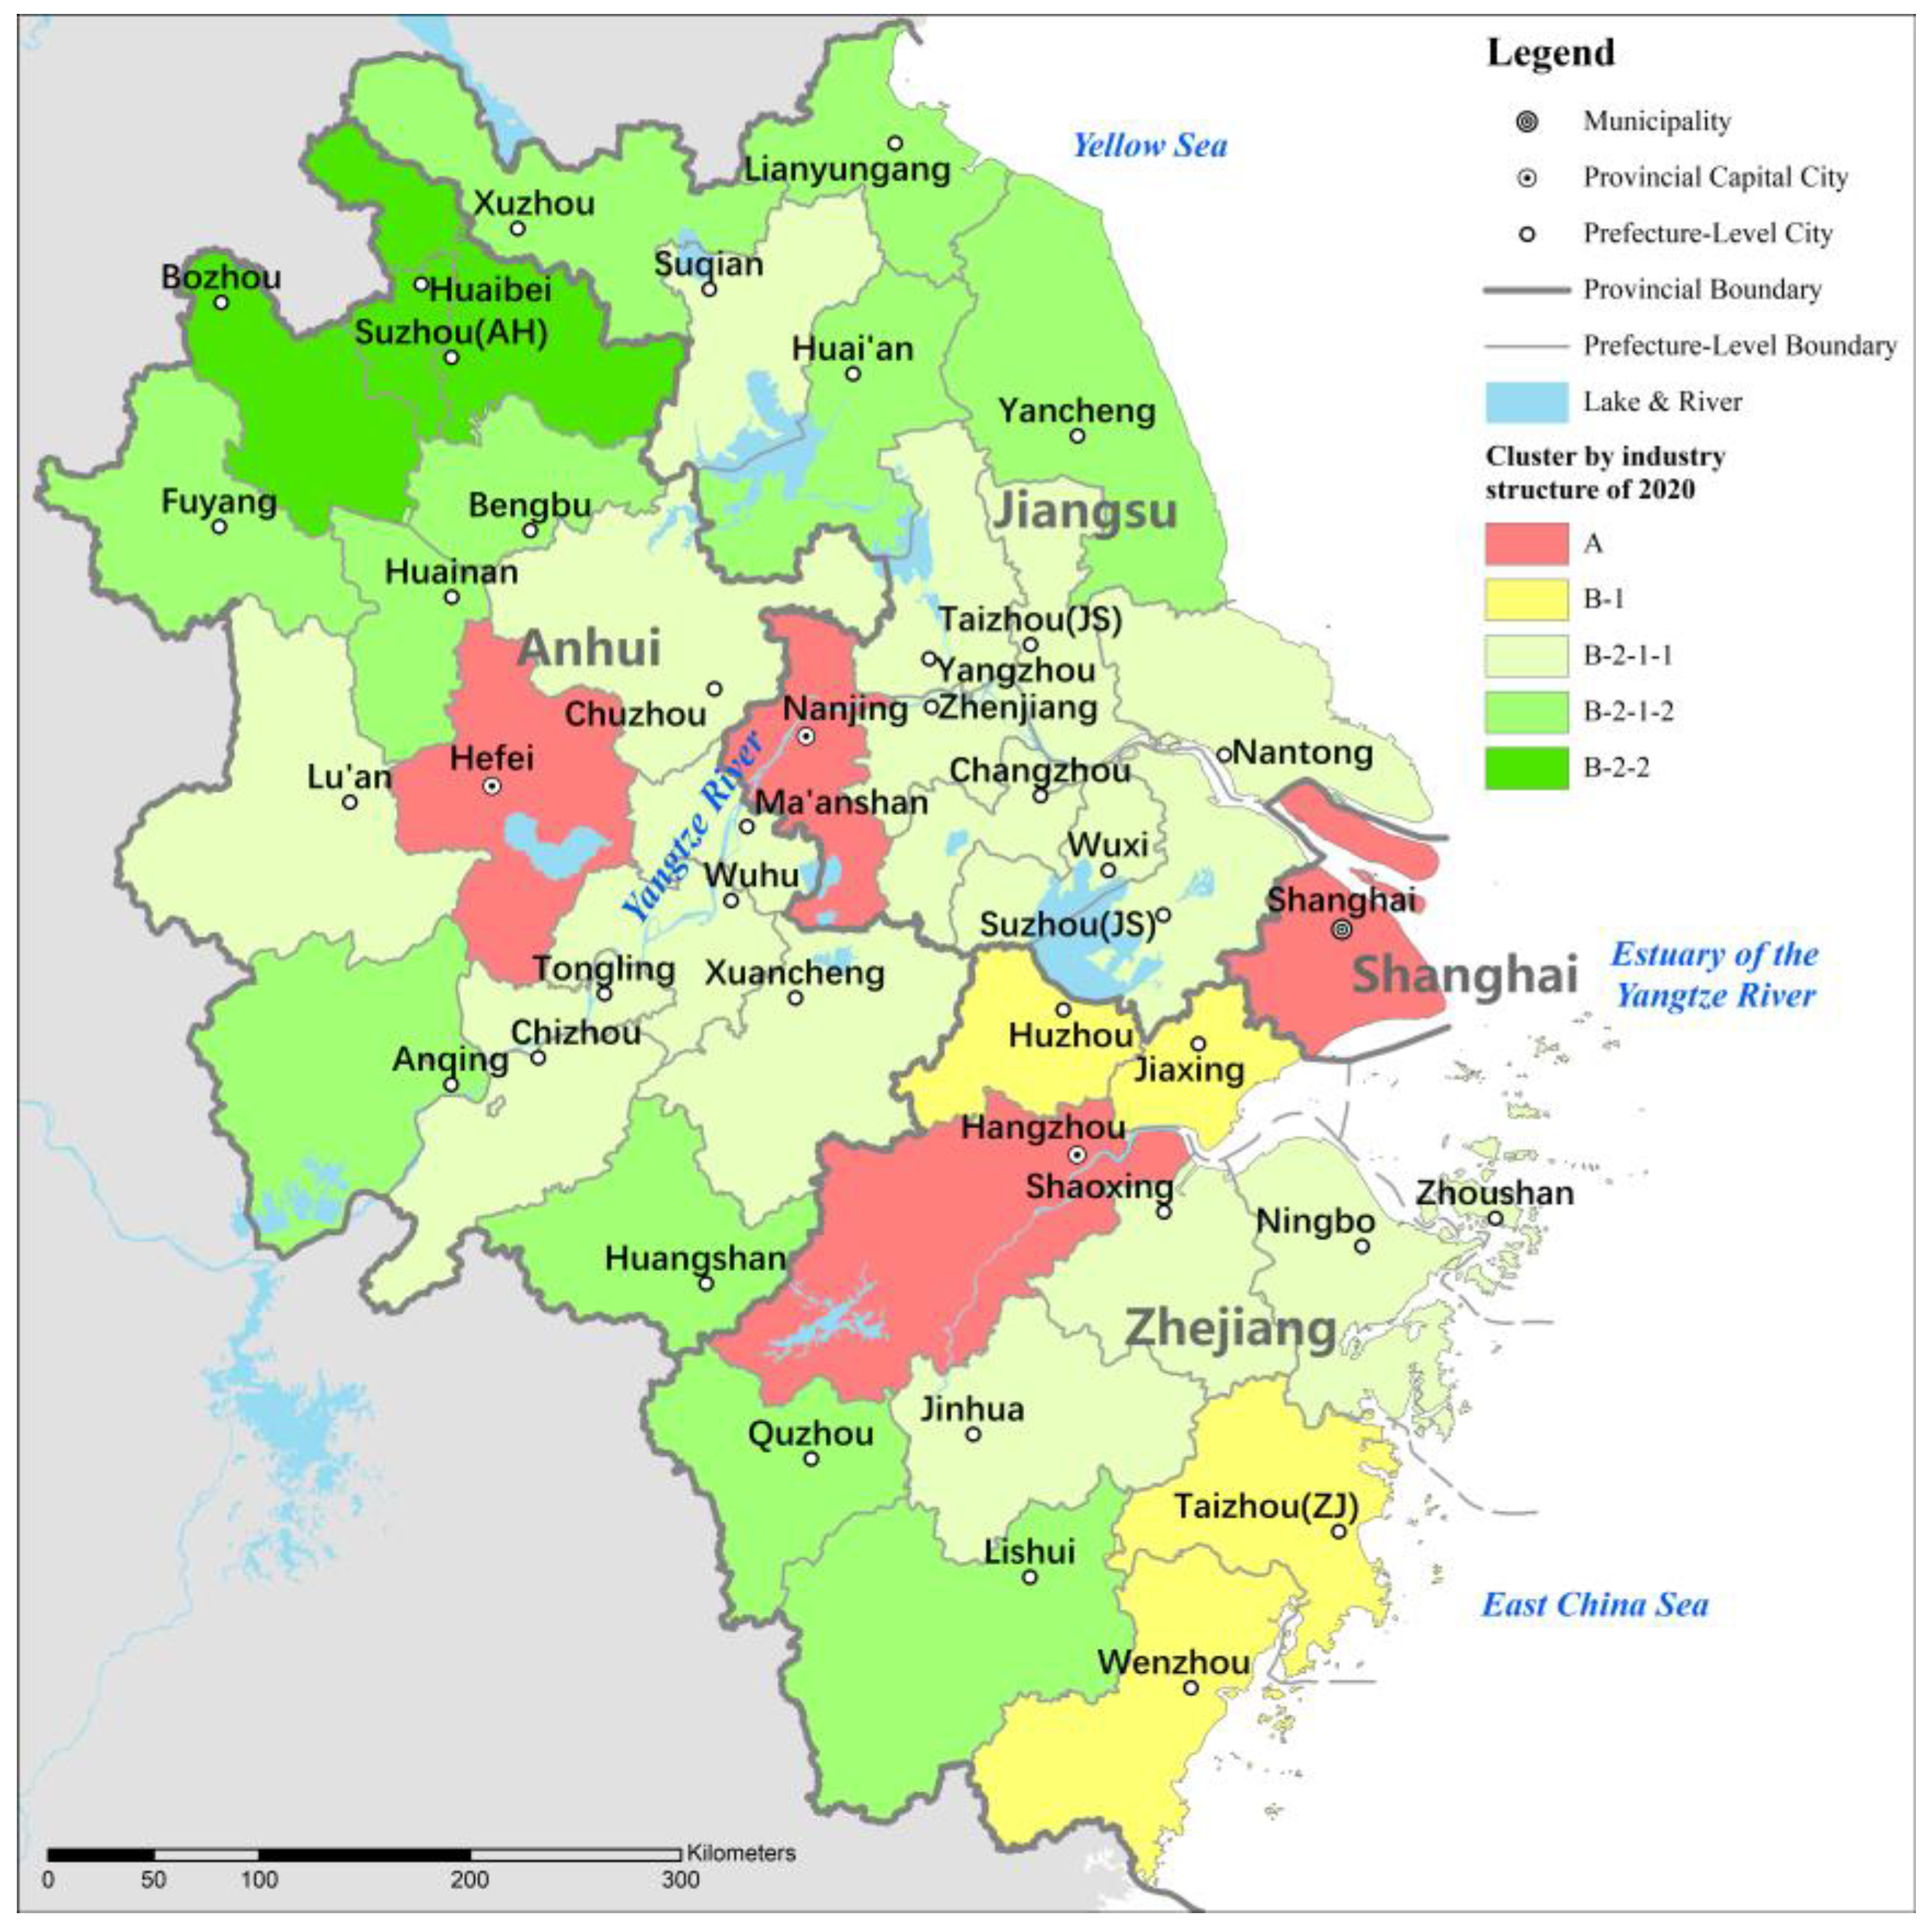
First, the types of employed population structures in various industries in the 41 urban centers in 2020 are analyzed. The following indicators were selected as variables for analysis: (1) the proportion of employed population in primary industry; (2) the proportion of employed population in secondary industry; and (3) the proportion of employed population in tertiary industry. The results of the analysis are shown in Figure 13. Based on the tree genealogy chart, the 41 cities were classified into 5 categories (Figure 14). Category A includes one directly administered municipality of Shanghai, and three provincial capitals, Nanjing, Hangzhou and Hefei. These cities are the most important central cities in the YRD region, and the industrial structure characteristics of their employed population are significantly different from other cities, as shown by the extremely low proportion of the employed population in the primary industry (generally less than 2%), the low proportion in the secondary industry (about 20%, the lowest 4 of 41 cities), and the high proportion in the tertiary industry (more than 70%, the highest 4 of 41 cities). Among the cities in category B, category B-1 includes the 4 cities of Wenzhou, Taizhou, Jiaxing and Huzhou in Zhejiang, which are characterized by a slightly higher rate of employment in the secondary industry than in the tertiary industry; conversely, category B-2 includes 33 cities, which are characterized by a higher employment in the tertiary industry than in the secondary industry. Among the 33 B-2-1 category cities, Suzhou (Jiangsu) and 18 other B-2-1-1 category cities are characterized by a significantly higher proportion of tertiary industries than secondary industries, while the proportion of primary industries is extremely low; Bengbu and 10 other B-2-1-2 category cities are characterized by a significantly higher proportion of tertiary industries than secondary industries, but the proportion of primary industries is still of a certain scale (about 10%). Huaibei, Suzhou and Bozhou, the 3 northern Anhui cities of category B-2-2, have the highest proportion of primary industry among the 41 cities, reaching about 20%.

3.2.2. Cluster by Time Stage

The types of characteristics of changes in the employed population in the 41 urban centers were analyzed for two time periods: 2000–2010 (called the first decade) and 2010–2020 (called the second decade). First, the analysis of the characteristics of the overall change in the employed population was carried out by selecting the following indicators as variables: (1) the growth rate of the employed population from 2000 to 2010 and (2) the growth rate of the employed population from 2010 to 2020. The results of the analysis are shown in Figure 15, and the 41 cities are divided into 7 categories based on the tree spectrum diagram. Category A includes 2 cities, Suzhou (Jiangsu) and Wenzhou (Zhejiang), which are characterized by the extremely fast growth of the employed population (over 70%) in the first decade, but little change in the second decade. Among category B-1 cities, Hangzhou and Hefei of category B-1-1-1 have distinctive characteristics. This shows that they maintain fast growth in both decades, with growth rates of about 40%, reflecting the relatively stable employment growth dynamics of both cities. Huzhou and Chuzhou, 2 B1-1-2 category cities, are characterized by smaller increases in both decades, with the second decade seeing a slightly higher rate than the first decade decade. Shanghai, Ningbo and Wuxi, 10 B-1-2 category cities, are characterized by growth or flat growth in both decades, but with significantly lower growth rates in the second decade than the first decade. Among the B-2 cities, Jinhua and Anqing, 2 B-2-1-1 cities, show a significant decrease in employment in the first decade, but a significant increase in the second decade, reflecting a strong development momentum going forward. The change in employed population in the 20 B-2-1-2 category cities, including Xuzhou, Wuhu and Quzhou, was not significant in the two decades. The 3 B-2-2 category cities, Bozhou, Chizhou and Huai’an, showed little change in the first decade, but decreased significantly in the second decade.
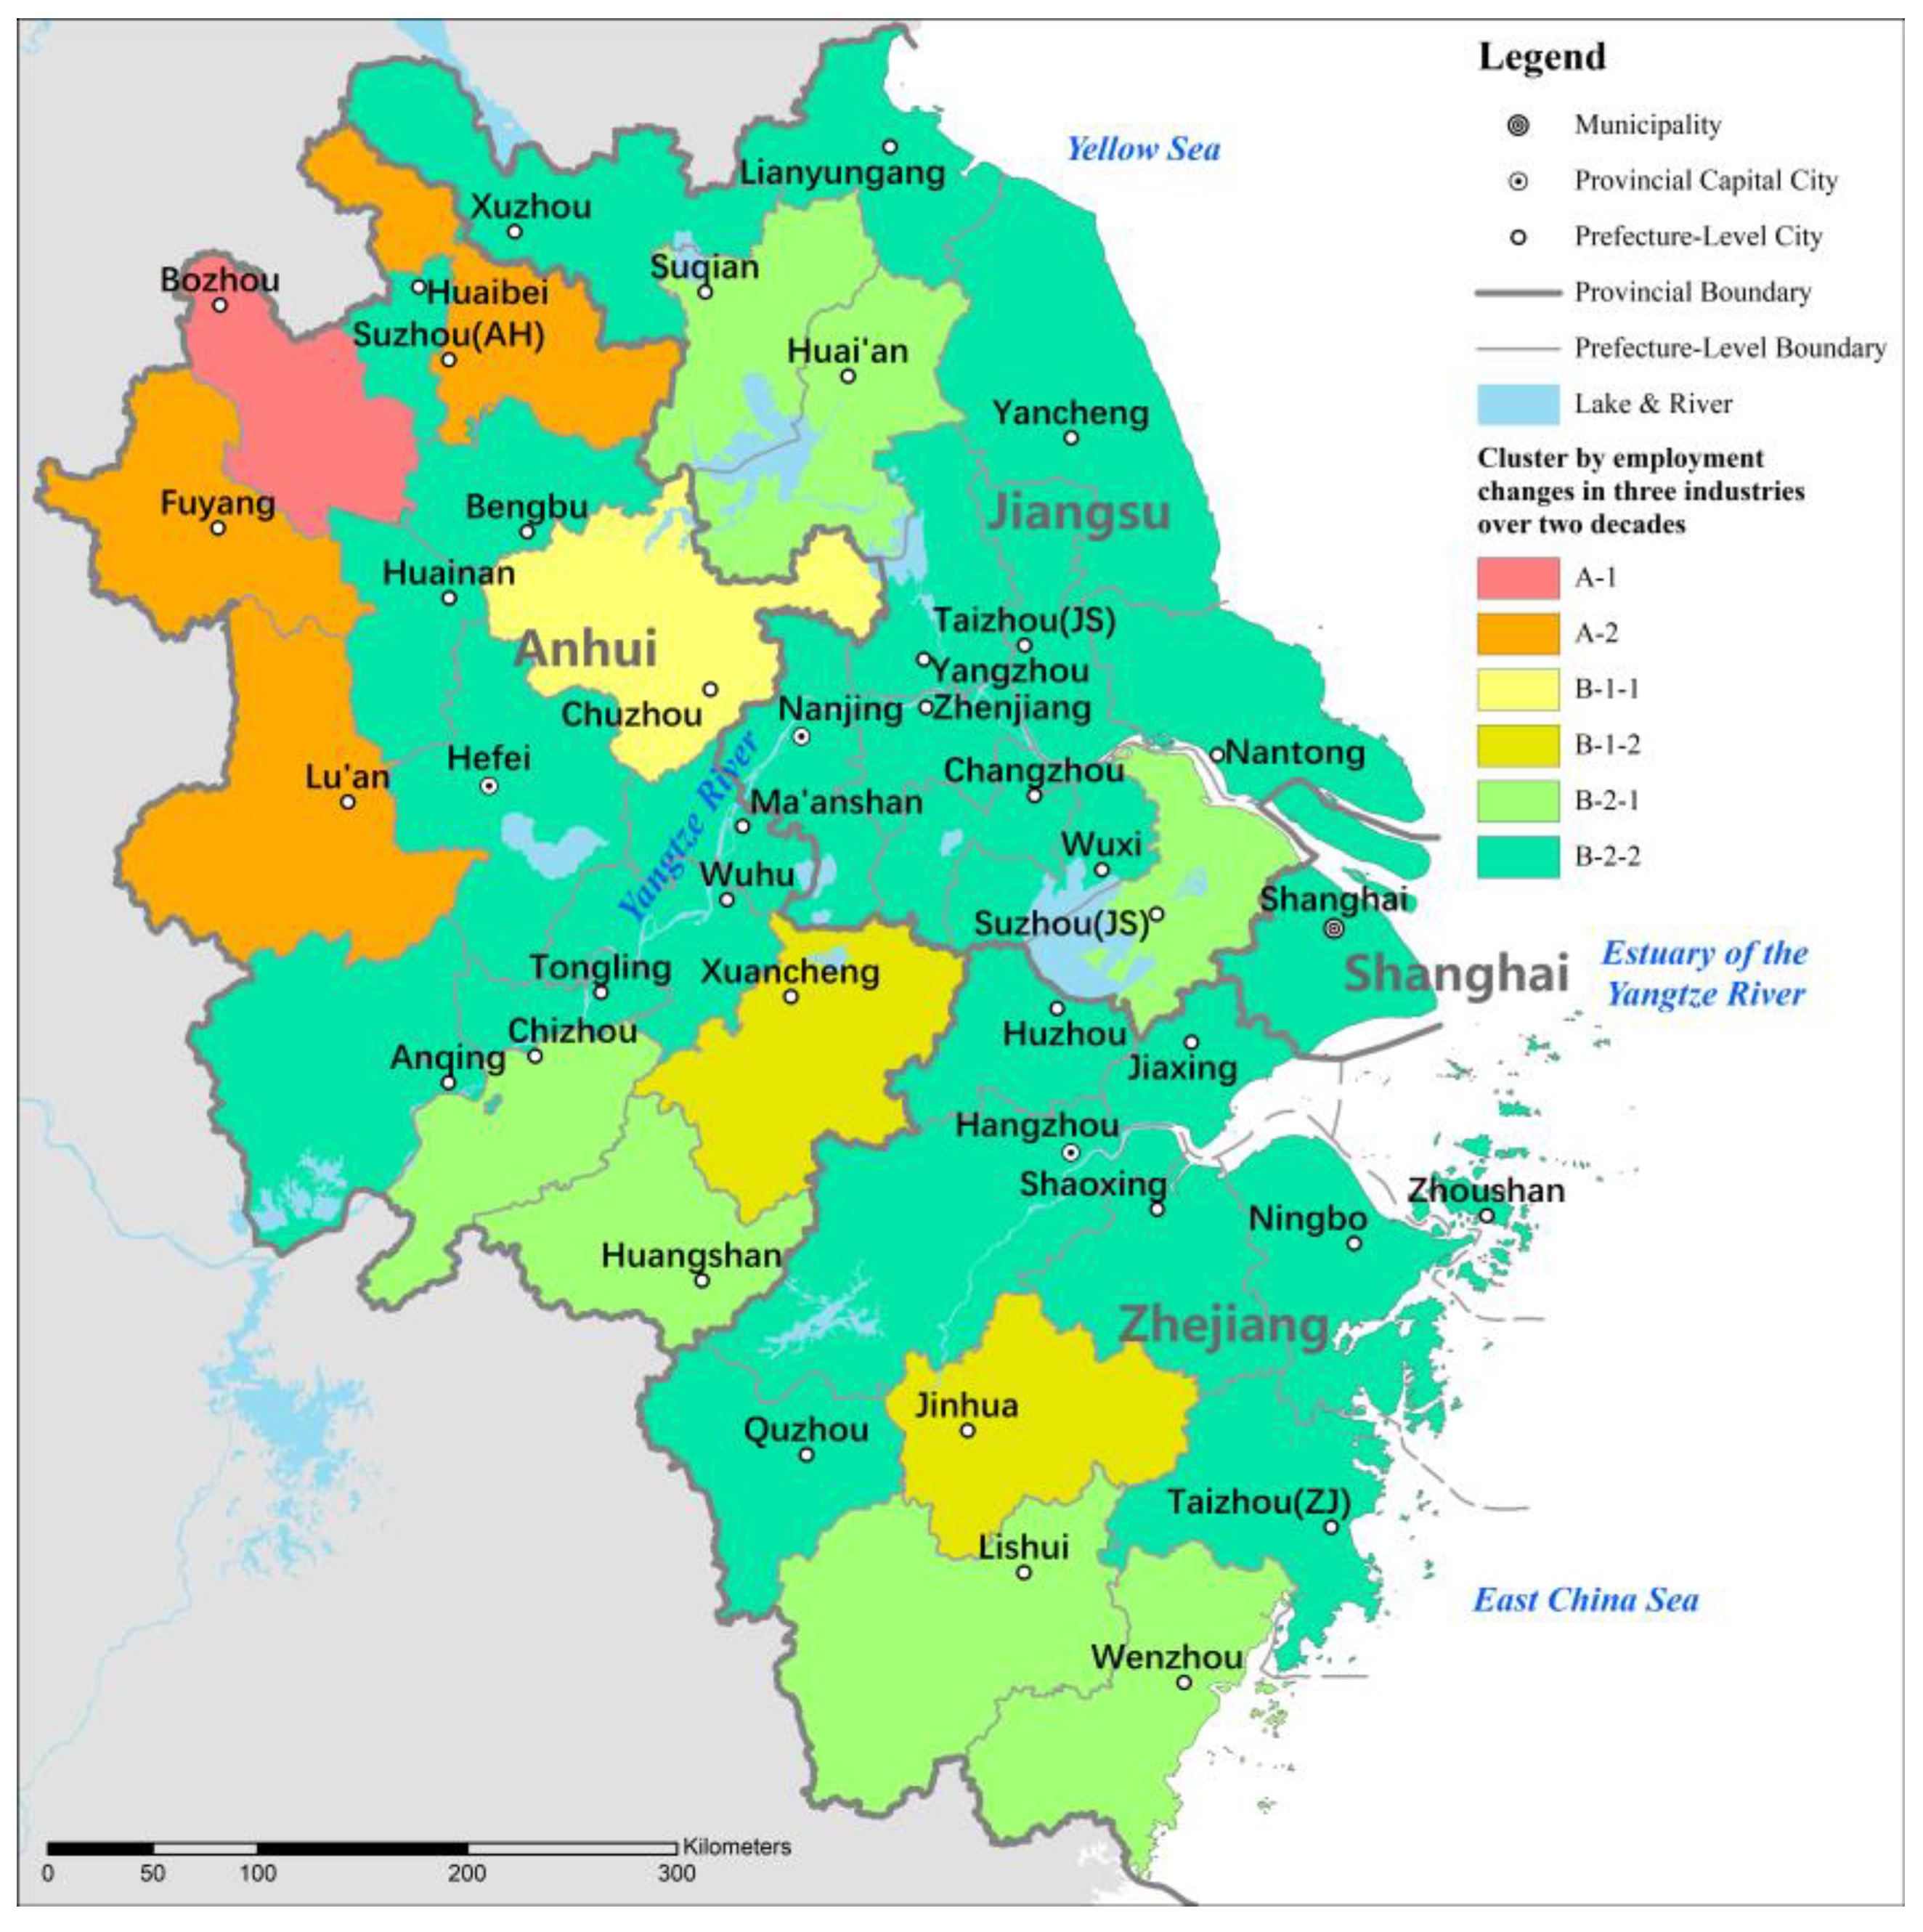
The analysis of the characteristics of the changes of the employed population in the three industries is carried out, and the following indicators are selected as variables for the analysis: (1) the growth rate of the employed population in the primary, secondary and tertiary industry from 2000 to 2010; and (2) the growth rate of the employed population in the primary, secondary and tertiary industry from 2010 to 2020. The results of the analysis are shown in Figure 16, and the 41 cities are divided into 6 categories based on the tree genealogy diagram. Category A includes 4 cities, among which only 1 city, Bozhou, is in category A-1. The city possesses outstanding characteristics, its secondary industry employed population has maintained a high growth rate during the two decades in question, and its total employment growth rate is ranked No. 1 among the 41 cities. Category A-2 includes 3 Anhui cities, Fuyang, Lu’an, and Suzhou, with similar characteristics to Bozhou. The employed population in the secondary industry grew faster, but the increase was significantly lower in the second decade. Among the cities in category B, category B-1-1 includes 1 city, Chuzhou, which is characterized by a significantly higher growth in both secondary and tertiary employment in the second decade than in the first decade, showing better development momentum. Category B-1-2 includes 2 cities, Jinhua and Xuancheng, which are characterized by a significantly higher increase in tertiary employment in the second decade; category B-2-1 includes 7 cities such as Lishui and Huangshan, which are characterized by a significantly higher increase in tertiary employment in the second decade; and category B-2-2 includes 27 cities, such as Bengbu, Changzhou and Quzhou, whose growth rate has been relatively stable in the two decades.

3.2.3. Cluster by Spatial Level

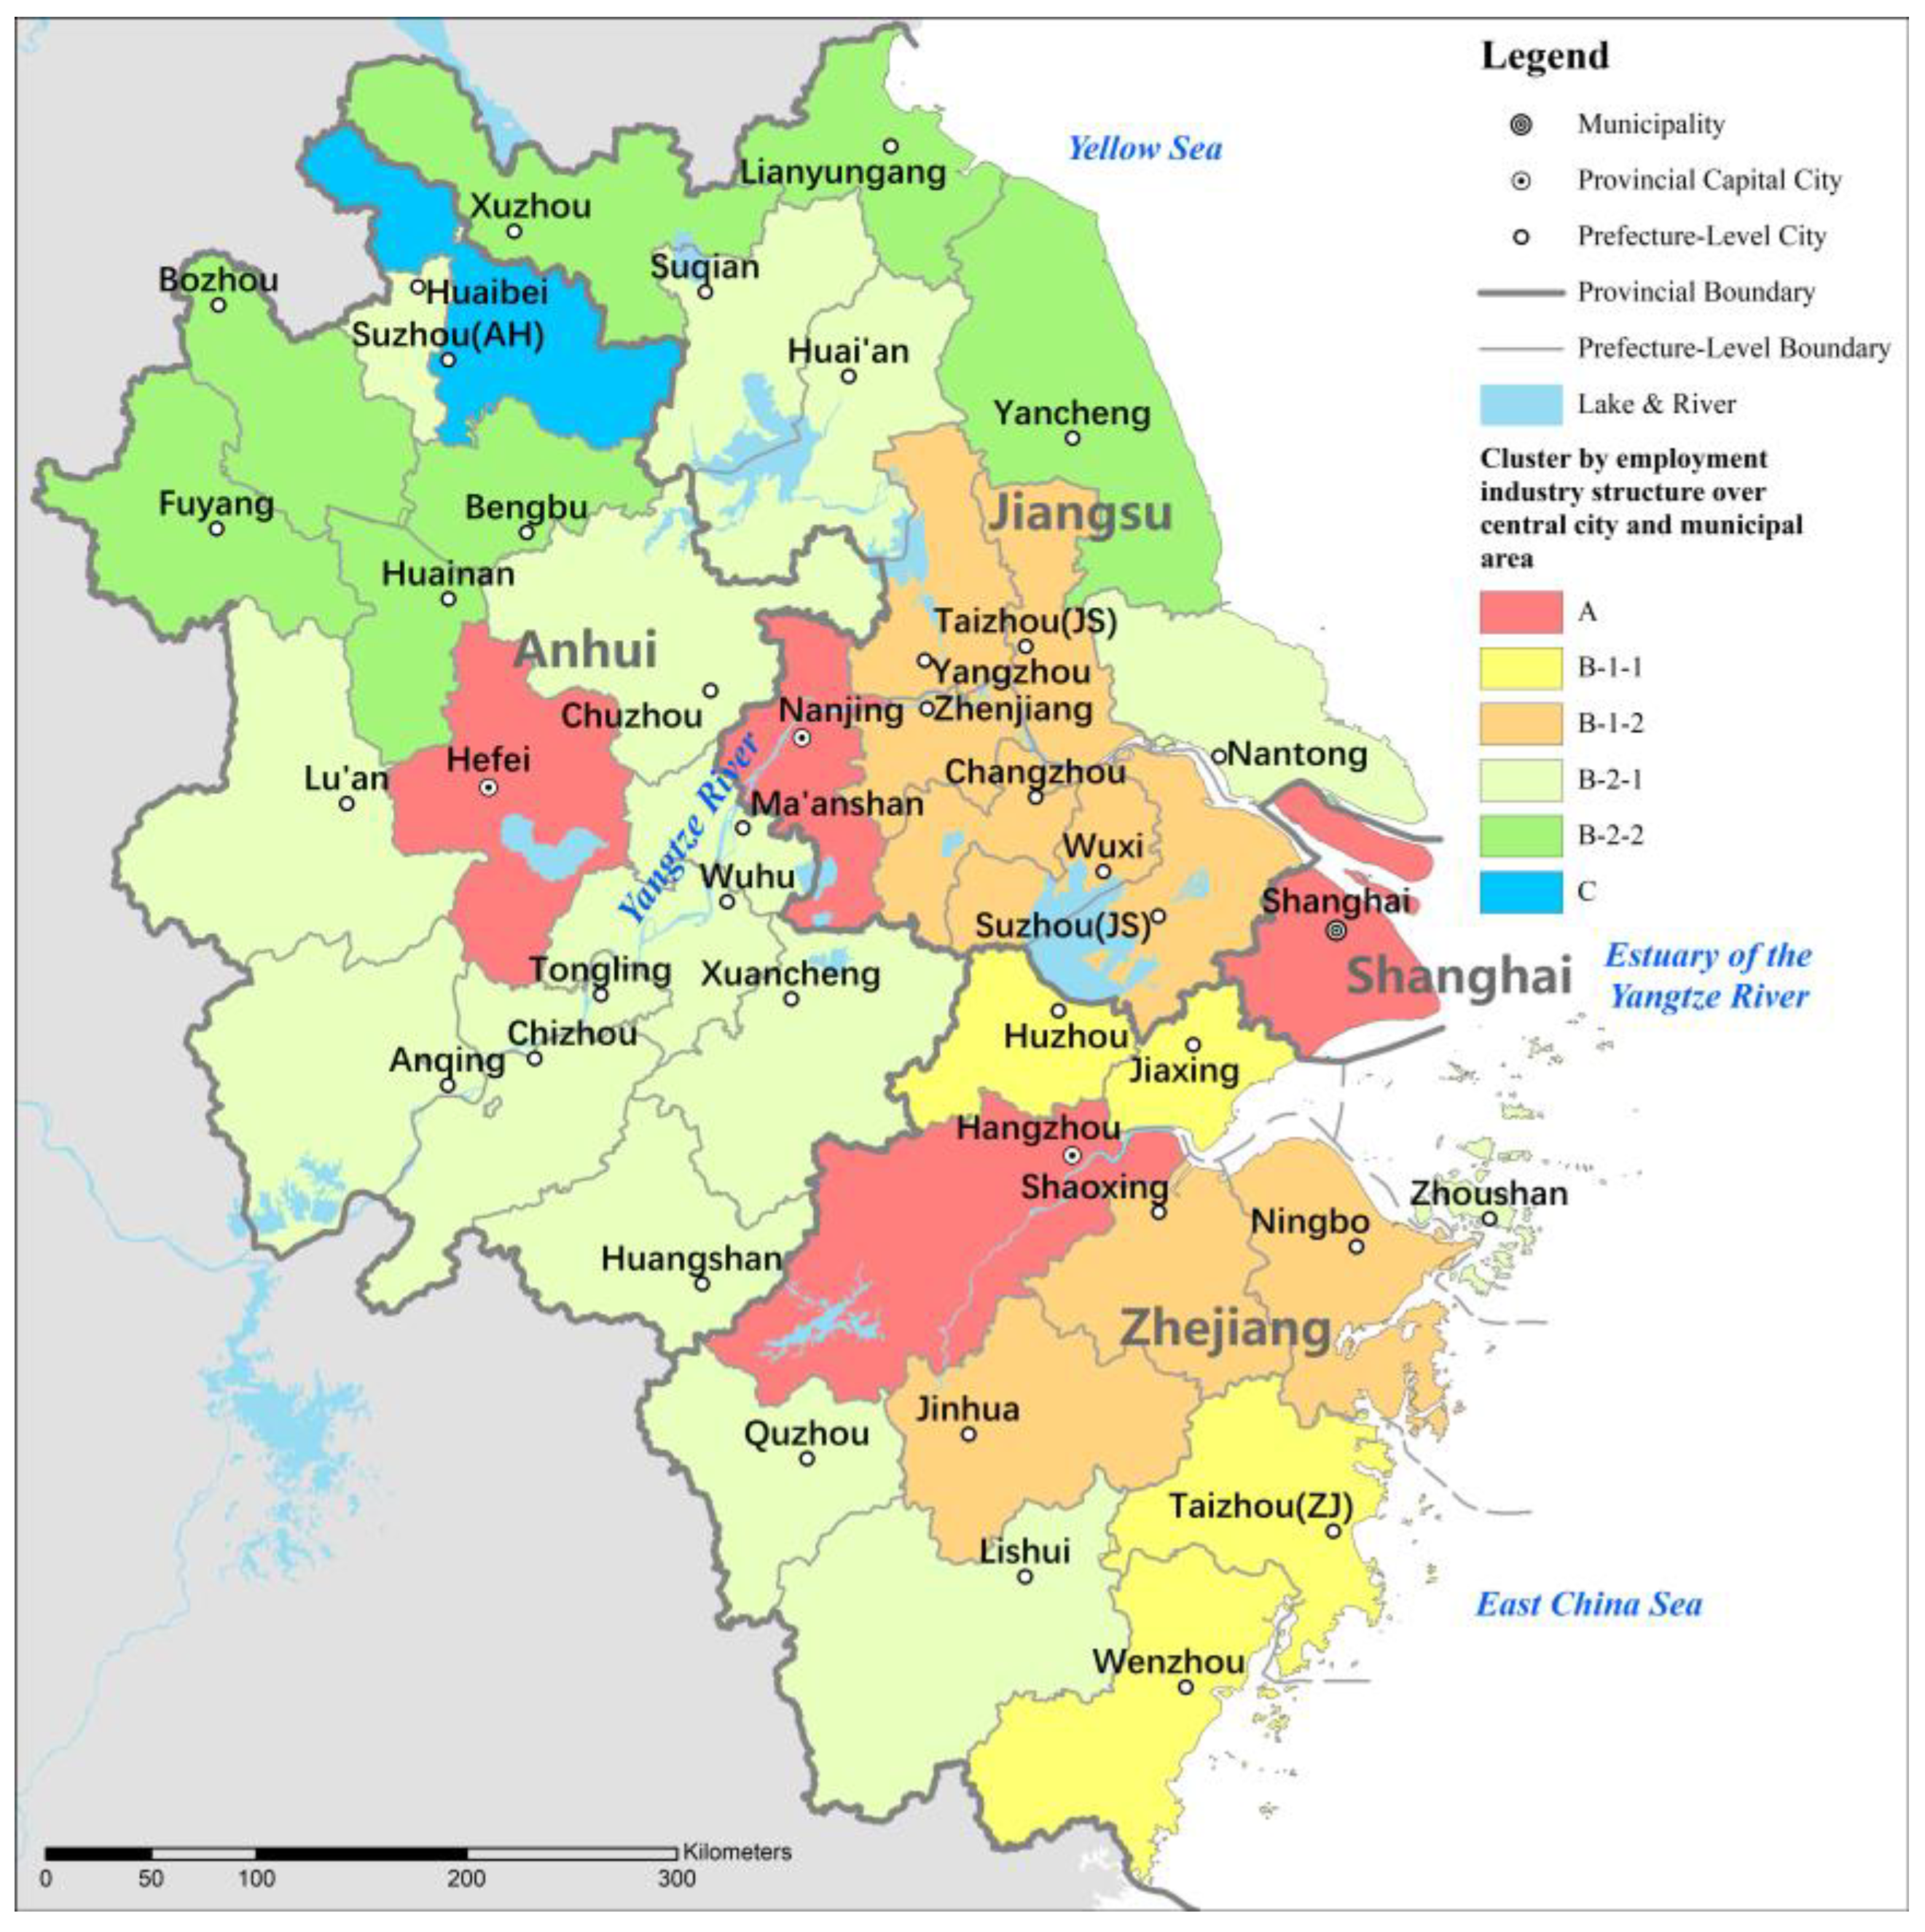
Finally, the characteristics of employed population changes at two spatial-level scales, central urban and municipal jurisdiction area, are analyzed for 41 cities. Firstly, the analysis of the characteristics of the distribution of employment in the three industries in 2020 was carried out, and the following indicators were selected as variables for the analysis: (1) the proportion of primary, secondary and tertiary industry employment in the central urban area; and (2) the proportion of primary, secondary and tertiary industry employment in the municipal jurisdiction area. The results of the analysis are shown in Figure 17, and the 41 cities are divided into 6 categories based on the tree spectrum diagram. Category A includes 2 cities, Suzhou (Jiangsu) and Wenzhou, whose share of tertiary industry employed population is the highest among the 41 cities, regardless of the central urban or the municipal jurisdiction area. Among category B cities, category B-1-1 includes 4 Zhejiang cities, Huzhou, Taizhou, Wenzhou and Jiaxing, whose share of tertiary industry employed population is higher than that of secondary industry, regardless of the central urban or the municipal jurisdiction area; category B-1-2 includes 9 cities, including Ningbo, Wuxi and Shaoxing, which are characterized by a higher proportion of tertiary employment than secondary employment in the central urban area, but with the opposite being true within the municipal jurisdiction area, where the proportion of secondary employment is higher than tertiary employment; and category B-2-1 includes 16 cities, such as Zhoushan, Huangshan and Suqian, which are characterized by a higher proportion of tertiary employment than secondary employment in both the central urban and municipal jurisdiction area. The proportion of the employed population in the tertiary industry is higher than that in the secondary industry in both the central urban and the municipal jurisdiction area; category B-2-2 includes 7 cities such as Xuzhou and Bengbu, which are characterized by the proportion of the employed population in the primary industry, reaching more than 20% within the municipal jurisdiction area, while the proportion of the employed population in the tertiary industry is generally higher than that in the secondary industry. Category C city is Suzhou in Anhui Province, which is characterized by a relatively similar proportion of people employed in primary, secondary and tertiary industries within the municipal jurisdiction area.
An analysis combining spatial level and employed population change characteristics was carried out, and the following indicators were selected as variables for the analysis: (1) employed population growth rate in central urban area from 2000 to 2020; and (2) employed population growth rate in the municipal jurisdiction area from 2000 to 2020. The results of the analysis are shown in Figure 18. A total of 41 cities are classified into 6 categories based on the tree spectrum diagram. In total, 15 cities in category A have the common feature of employed population growth in both the central urban and the municipal jurisdiction area. Among them, Hangzhou and Hefei, which are the top 2 cities in terms of employment growth in the central urban area, are in the A-1-1 and A-1-2 categories, respectively, but Hefei is relatively less prominent in terms of employment growth in the municipal jurisdiction area; the A-2-1 category includes 5 cities, namely Suzhou (Jiangsu), Ningbo, Jiaxing, Wenzhou, and Wuxi, which are characterized by the second highest overall employment growth after Hangzhou and Hefei, while the overall employment growth in the central urban area is slightly higher than that in the municipal jurisdiction area. A-2-2 cities include Shanghai, Nanjing, Shaoxing and 5 other cities, whose employed population growth is generally lower than that of A-2-1, while the levels of employed population growth in the central urban and the municipal jurisdiction area a43 close to each other. In category B, there are 26 cities whose employed population in the central urban or municipal jurisdiction area is generally flat or decreasing. Among them, 12 cities in category B-1, including Wuhu, Quzhou, Nantong, etc., have seen a small increase in employed population in their central urban areas and a small decrease in employed population in their municipal jurisdiction areas. In total, 14 cities in category B-2, including Chizhou, Taizhou (Jiangsu), Bozhou, etc., have seen a significant decrease in employed population in both their central urban and municipal jurisdiction areas.

4. Discussion

The results of the above empirical analysis provide some evidence for the three hypotheses presented in the introduction of this paper, which will be discussed further in this subsection.

4.1. Regional Differences within the YRD Are Still Significant, but They Are Narrowing

On the whole, the economic development of the southeast region of the YRD is more developed compared to the northwest region. The relatively well-developed southeastern region roughly includes Shanghai, southern Jiangsu (cities such as Suzhou, Wuxi, Changzhou, and Nanjing), northern Zhejiang (cities such as Hangzhou, Jiaxing, and Shaoxing), and the southeast coast of Zhejiang (cities such as Ningbo, Taizhou, and Wenzhou). The spatial distribution of the employed population in these regions has the following typical characteristics: (1) a high proportion of the employed population working in secondary and tertiary industries; (2) the continuous agglomeration growth of the employed population in secondary and tertiary industries; and (3) employment has already grown faster in the first decade of the period 2000–2020. In contrast, the western and northern regions of the YRD are relatively underdeveloped, and these regions still maintain a relatively high proportion of employment in the primary sector, with limited ability to gather employment in the secondary and tertiary sectors and a clear tendency for employment to flow out to other regions. The differences in internal characteristics reflected in the YRD region are also present at scales, such as the national scale. For example, Enrico Marelli (2004) found that differences in employment structure are more pronounced inside countries, and Wang Zhenbo et al. (2007) found several different types of spatial patterns of employment in different regions of China [12,13]. However, the differences in characteristics within the Yangtze River Delta region are in fact gradually narrowing. The following evidence supports this view: (1) in the period 2000–2020, the distance that the centroid of the spatial distribution of the employed population moved from northwest to southeast was smaller in the second decade than in the first decade; (2) the regional differences in the structure of the employed population narrowed, the range of values of the proportion of the employed population in the secondary industry in 41 cities (municipal jurisdiction area) changed from [3.1%, 54.2%] in 2000 to [22.8%, 58.4%] in 2020, and the standard deviation of the proportion of the employed population in the primary, secondary and tertiary industries of 41 cities (municipal jurisdiction area) changed from 0.217, 0.152, 0.077 in 2000 to 0.094, 0.091, 0.070 in 2020; and (3) some cities in the northwestern YRD region have had a strong ability to attract employment in recent years, e.g., Hefei City, Anhui Province, ranked 1st and 2nd, respectively, among 41 cities in terms of employment growth in the central urban and municipal jurisdiction area during 2010–2020.

4.2. Different Cities or Regions Show Different Characteristics of Development Stages, and Late-Developing Regions Can Learn from Early Developing Regions

Due to differences in regional development, the development stages of different regions and cities show different characteristics in the spatial distribution of the employed population. According to the results of the previous analysis, the following outcomes are typical: (1) a high proportion of the employed population in the tertiary industry, a significant tendency towards agglomeration, and a significant spreading tendency of the secondary industry employment to the periphery, represented by Shanghai and Nanjing; (2) a high proportion of the employed population in the tertiary industry and a significant tendency of agglomeration of the employed population in both the secondary and tertiary industries, represented by Hangzhou and Hefei; (3) a significant growth of the employed population in the secondary industry in the first decade, but a significant decrease in the second decade, while the employment in the tertiary industry continues to cluster, represented by Suzhou, Jiangsu and Ningbo, Zhejiang; (4) the employment in the secondary industry grows rapidly in the first decade, but is basically stable in the second decade, while the proportion of employment in the tertiary industry begins to exceed that in the secondary industry, represented by Nantong and Wuhu; (5) the employment in primary industry decreases rapidly in the first decade, but the decrease in the second decade is significantly smaller, while the concentration of the population in secondary industry is more significant in the first decade, and the proportion of the employment in secondary industry is moderately low, represented by Yancheng and Lianyungang in Jiangsu; and (6) the proportion of the employment in primary industry is high, but significantly decreases in the second decade, while the proportion of the employed population in the secondary industry is low but the growth is rapid, represented by Bozhou and Suzhou in Anhui. From the stage characteristics of the industrial structure of the employed population and the growth of the agglomeration, it is obvious that these categories of cities are at different stages of development, with category 1 cities being at the highest stage of development in the region.

4.3. Metropolitan Areas Are Still the Main Areas of Employment Concentration, and the Spatial Distribution of Employment in Some Cities Is Beginning to Suburbanize

In general, the larger its size, the more attractive a city is for the concentration of employment. According to China’s city size classification standards, urban area with populations of 10 million or more are considered megacities, populations of 5–10 million are supercities, populations of 3–5 million are type I large cities, populations of 1–3 million are type II large cities, populations of 0.5–1 million are medium cities, and populations of less than 500,000 are small cities. Based on the data of central urban areas, the employed population growth of the 41 cities between 2000 and 2020 was 22.0% for megacities, 68.5% for supercities, 66.4% for type I megacities, 14.4% for type II megacities, 4.0% for medium cities, and 8.2% for small cities. It is clear from this that the employed population in medium and small cities did not grow as much as in other larger cities. The most pronounced growth occurred in supercities and type I large cities, which have urban populations of between 3 and 10 million people. The megacities did not have the highest growth rate, which may be related to the high cost of living due to the shortage of urban space resources. It is worth noting that cities at higher administrative levels also performed better in terms of employment growth due to their advantages in terms of public services and other resources. Overall, the average growth of municipalities, provincial capitals or sub-provincial cities was 63.1%, while the average growth rate of ordinary prefecture-level cities was 12.3%. Looking specifically at the five type I large cities in the region, one of them, the provincial capital (Hefei), experienced a 101.4% increase in employed population, while the other four cities grew by an average of 57.6%. Many cities showed obvious characteristics of a circular structure in the spatial distribution variation in the employed population. In Shanghai and Nanjing, although the employed population grew in general, the growth of the central city is smaller than that of the municipal jurisdiction area, which indicates that the spatial suburbanization of employment was occurring. This phenomenon is similar to the trend of employment dispersion observed in Los Angeles by Kenneth A. Small et al. (1994), and the process of employment suburbanization found in Paris by Rachel Guillain (2006) [14,15,19]. If we look at the employed population in different categories, the secondary industry has shown a decrease in employment in central city areas and an increase in the peripheral areas in many cities; the tertiary industry is still generally clustered in the central city. Similar findings were derived from Klaus Desmet et al.’s (2005) analysis of differences in spatial variation in employment characteristics by industry in the United States and Zeng Haihong et al.’s (2010) analysis of spatial agglomeration characteristics of high-end service industries in Shenzhen [18,21].

5. Conclusions

Focusing on the YRD region, this study selected data from three time points, 2000, 2010 and 2020, to carry out a analysis of the spatial distribution and change characteristics of the employed population. Combined with spatial statistics and cluster analysis, the above characteristics were found to be similar or different in different regions, different types of cities, different time stages, and different industrial fields. This study concludes that: (1) regional differences within the YRD are still large but are narrowing; (2) different cities or regions exhibit different development stage characteristics, and early development regions can provide experience for later development regions; (3) the scale level and administrative level are important factors affecting the changing characteristics of the employed population, and the suburbanization of employment is occurring in large cities with better levels of development, although the characteristics of this vary by industry. These are the main findings of this study, some of which are useful in supporting the vision of the integrated development plan for the YRD region regarding balanced regional development.
Looking ahead, it is likely that the change in the employed population in the YRD region over the next decade or longer, compared to the previous two decades, will not be a simple linear fitting relationship. In other words, the trend of change in the previous 20 years cannot simply be used to predict the characteristics of future change. The main reasons for this include, but are not limited to, the following facts: (1) China’s total population has peaked, the country will begin to experience negative population growth in 2022, and the YRD region will face the same challenge. (2) The population continues to age, while the number of births is declining significantly. The proportion of the population aged 0–19 in the YRD region decreased from 27.8% to 19.6%, and the proportion of the population aged 60 or above increased from 12.3% to 20.3% during 2000 to 2020). (3) Urbanization development tends to stabilize and, after the early rapid development, the urbanization rate in the YRD region reaches 70.8% in 2020, with limited room for future growth. (4) The pattern of large cities in the region is basically stable, existing small- and medium-sized cities have limited abilities to attract employment in future, and the pattern of the urban system might not undergo major changes in a short period of time. (5) Technological innovation changes the future employment mode and the development of artificial intelligence and other emerging industries may bring important impacts on the employment structure, employment scale, the layout of employment places, and the spatial relationship between employment and residence.
Based on the existing research, there are further directions for this research to deepen in the future. Firstly, scholars should refine the spatial units. The current study uses county-level spatial units, which can basically meet the research needs at the regional scale of the YRD. In the future, if data conditions allow, researchers should consider using more accurate spatial unit data (e.g., sub-district or township units) to obtain more accurate results of spatial variability characteristics. Secondly, scholars should refine the industrial categories. The current study divides the industries of the employed population into three major categories: primary industry, secondary industry and tertiary industry. These are the commonly used classifications, and this research has identified significant differences between the secondary and tertiary industries. It is worth noting, however, that there are significant differences between productive and consumer services in the tertiary sector. Within the productive service industry, there may also be significant differences between industries such as finance, information service, R&D, and goods transportation. Therefore, future research can be conducted by further subdividing the industry sectors. Thirdly, this study is an analysis of existing facts and provides limited support for future trend prediction. In the future, trend prediction can be carried out by introducing relevant variable factors in response to the latest situation of population development in order to improve the application value of this study for regional development strategic planning.

Funding

This research was funded by the Shanghai Philosophy and Social Science Planning Youth Project, grant number 2019ECK007.

Data Availability Statement

The census data used in this study can be found in the relevant publications and has already been cited in the text for illustration. The map data required for the study can be found in the atlases of the relevant years.

Conflicts of Interest

The author declares no conflict of interest.

References

  1. Shearmur, R.; Coffey, W.J. A Tale of Four Cities: Intrametropolitan Employment Distribution in Toronto, Montreal, Vancouver, and Ottawa-Hull, 1981–1996. Environ. Plan. A Econ. Space 2002, 34, 575–598. [Google Scholar] [CrossRef]
  2. Coffey, W.J.; Shearmur, R.G. Agglomeration and Dispersion of High-order Service Employment in the Montreal Metropolitan Region, 1981–1996. Urban Stud. 2002, 39, 359–378. [Google Scholar] [CrossRef]
  3. Alidadi, M.; Dadashpoor, H. Beyond Monocentricity: Examining the Spatial Distribution of Employment in Tehran Metropolitan Region, Iran. Int. J. Urban Sci. 2018, 22, 38–58. [Google Scholar] [CrossRef]
  4. Bo, W.; Feng, Z. An Analysis of Spatial Distribution of Urban Employment in Nanjing. Hum. Geogr. 2011, 26, 58–65. [Google Scholar]
  5. Zhan, D.; Zhang, W.; Meng, B.; Dang, Y.; Liu, Q. Spatial Structure of Urban Residence and Employment in Beijing. Sci. Geogr. Sin. 2017, 37, 356–366. [Google Scholar]
  6. Wei, Z.; Xiao, W.; Qiang, H. Analysis on the Differentiation of Employment Space of Migrant Workers from the Perspective of Gender: An Empirical Study on the Main City of Nanjing. City Plan. Rev. 2017, 41, 54–64. [Google Scholar]
  7. Li, P. Detecting the Spatial Characteristics of Urban Employment Using Mobile Phone Signaling Data: A Case Study of Shenyang City. Geomat. World 2019, 26, 25–30. [Google Scholar]
  8. Chen, S.; Feng, Z.; Enyu, C.; Yang, C. Spatial Distribution of New Employment Demand in Nanjing Based on the Data from Zhaopin.com. Econ. Geogr. 2016, 36, 83–90. [Google Scholar]
  9. Hui, W.; Xiao, W.; Hao, Z. A Preliminary Analysis of the Correlation of Migrant Workers′ Employment Spatial Agglomeration and Urban Employment Space: A Case of Nanjing Main City. Hum. Geogr. 2014, 29, 31–39. [Google Scholar]
  10. Hui, W.; Xiao, W.; Zheng, H. A Preliminary Analysis of Spatial Distribution of Employment Spatial in Nanjing Main City. Econ. Geogr. 2014, 34, 115–123. [Google Scholar]
  11. Lao, X.; Shen, W.; Wen, F. A Comparative Research on Employment Density Distribution between Yangtze River Delta and Pearl River Delta. Urban Dev. Stud. 2013, 20, 137–142. [Google Scholar]
  12. Marelli, E. Evolution of Employment Structures and Regional Specialisation in the EU. Econ. Syst. 2004, 28, 35–59. [Google Scholar] [CrossRef]
  13. Wang, Z.; Zhu, C. Employment Spatial Models and Regionalization of China. Acta Geogr. Sin. 2007, 62, 191–199. [Google Scholar]
  14. Gordon, P.; Richardson, H.W.; Wong, H.L. The Distribution of Population and Employment in a Polycentric City: The Case of Los Angeles. Environ. Plan. A 1986, 18, 161–173. [Google Scholar] [CrossRef] [PubMed]
  15. Small, K.A.; Song, S. Population and Employment Densities: Structure and Change. J. Urban Econ. 1994, 36, 292–313. [Google Scholar] [CrossRef] [PubMed] [Green Version]
  16. Coffey, W.J.; Shearmur, R.G. Intrametropolitan Employment Distribution in Montreal, 1981–1996. Urban Geogr. 2001, 22, 106–129. [Google Scholar] [CrossRef]
  17. Baumont, C.; Ertur, C.; Le Gallo, J. Spatial Analysis of Employment and Population Density: The Case of the Agglomeration of Dijon 1999. Geogr. Anal. 2004, 36, 146–176. [Google Scholar] [CrossRef]
  18. Desmet, K.; Fafchamps, M. Changes in the Spatial Concentration of Employment across US Counties: A Sectoral Analysis 1972–2000. J. Econ. Geogr. 2005, 5, 261–284. [Google Scholar] [CrossRef]
  19. Guillain, R.; Le Gallo, J.; Boiteux-Orain, C. Changes in Spatial and Sectoral Patterns of Employment in Ile-de-France, 1978–1997. Urban Stud. 2006, 43, 2075–2098. [Google Scholar] [CrossRef]
  20. Dong, L.; Zhang, P. Spatial Differentiation of Employment Structure in Shenyang City from 1990s. Hum. Geogr. 2008, 23, 32–37. [Google Scholar]
  21. Zeng, H.; Meng, X.; Li, G. Spatial Structure of Employment and Its Evolution in Shenzhen City: 2001–2004. Hum. Geogr. 2010, 25, 34–40. [Google Scholar]
  22. Rodríguez-Gámez, L.; Dallerba, S. Spatial Distribution of Employment in Hermosillo, 1999–2004. Urban Stud. 2012, 49, 3663–3678. [Google Scholar] [CrossRef]
  23. Bindong, S.; Xuhong, W. Spatial distribution and structure evolution of employment and population in Shanghai Metropolitan Area. Acta Geogr. Sin. 2014, 69, 747–758. [Google Scholar]
  24. Kim, J.I.; Yeo, C.H.; Kwon, J. Spatial Change in Urban Employment Distribution in Seoul Metropolitan City: Clustering, Dispersion and General Dispersion. Int. J. Urban Sci. 2014, 18, 355–372. [Google Scholar] [CrossRef]
  25. Chen, C. Changes of the Current Chinese Urban and Rural Employment Space and Extended Discussion. City Plan. Rev. 2014, 38, 72–78. [Google Scholar]
  26. O’Regan, K.M.; Quigley, J.M. Where Youth Live: Economic Effects of Urban Space on Employment Prospects. Urban Stud. 1998, 35, 1187–1205. [Google Scholar] [CrossRef]
  27. Xu, X. Research on the Evolution Characteristics and Interaction Efficiency of Industrial Structure and Employment Structure in Guangdong Province. Acad. Res. 2009, 90–96. [Google Scholar]
  28. Sun, T.; Qi, Y.; Liu, X. Changing Intra-Metropolitan Spatial Distribution of Employment with Economic Restructuring in Beijing Metropolitan Area. Econ. Geogr. 2014, 34, 97–104. [Google Scholar]
  29. Fritsch, M.; Schindele, Y. The Contribution of New Businesses to Regional Employment—An Empirical Analysis. Econ. Geogr. 2011, 87, 153–180. [Google Scholar] [CrossRef]
  30. Buerger, M.; Broekel, T.; Coad, A. Regional Dynamics of Innovation: Investigating the Co-evolution of Patents, Research and Development (R&D), and Employment. Reg. Stud. 2012, 46, 565–582. [Google Scholar]
  31. Chang, J.; Cui, L. The Impact of Technological Innovation and Industrial Structure on Employment—Based on Threshold Effect and Spatial Effect. J. Lanzhou Univ. Financ. Econ. 2018, 34, 35–44. [Google Scholar]
  32. Levernier, W.; Cushing, B. A New Look at the Determinants of the Intrametropolitan Distribution of Population and Employment. Urban Stud. 1994, 31, 1391–1405. [Google Scholar] [CrossRef]
  33. Sun, T. Spatial mismatch between residences and jobs by sectors in Beijing and its explanations. Geogr. Res. 2015, 34, 351–363. [Google Scholar]
  34. Zhan, D.; Meng, B. Spatial clustering analysis of residential and employment distribution in Beijing based on their social characteristics. Acta Geogr. Sin. 2013, 68, 1607–1618. [Google Scholar]
  35. Wang, B.; Wang, L.; Liu, Y.; Yang, B.; Huang, X.; Yang, M. Characteristics of jobs-housing spatial distribution in Beijing based on mobile phone signaling data. Prog. Geogr. 2020, 39, 2028–2042. [Google Scholar] [CrossRef]
  36. Jia, Y.; Zhen, F. Population and Employment Distribution Characters and the Relationships between them for Small Sized Cities: Case Study of Sihong, Jiangsu. Mod. Urban Res. 2008, 54–62. [Google Scholar]
  37. Li, H.; Wei, Y.D.; Wu, Y. Urban Amenity, Human Capital and Employment Distribution in Shanghai. Habitat Int. 2019, 91, 102025. [Google Scholar] [CrossRef]
  38. Holzer, H.J.; Quigley, J.M.; Raphael, S. Public Transit and the Spatial Distribution of Minority Employment: Evidence from a Natural Experiment. J. Policy Anal. Manag. 2003, 22, 415–441. [Google Scholar] [CrossRef] [Green Version]
  39. Jiao, H.; Hu, J. Spatial Match Between Employment and Housing in Wuhu City, Anhui Province of China. Sci. Geogr. Sin. 2011, 31, 788–793. [Google Scholar]
  40. Appold, S.J. The Impact of Airports on US Urban Employment Distribution. Environ. Plan. A Econ. Space 2015, 47, 412–429. [Google Scholar] [CrossRef]
  41. Wang, D.; Li, D.; Fu, Y.Z. Employment space of residential quarters in Shanghai: An exploration based on mobile signaling data. Acta Geogr. Sin. 2020, 75, 1585–1602. [Google Scholar]
  42. Sun, P.J.; Xiu, C.L. Coupling Degree Assessment of the Man-Land Coupling System of the Mining City from the Vulnerability Perspective. Areal Res. Dev. 2010, 29, 75–79. [Google Scholar]
  43. Ren, Y.W.; Cao, W.D.; Zhang, Y.; Su, H.F.; Wang, X.W. Temporal and Spatial Coupling Characteristics of Urbanization and Ecological Environment of Three Major Urban Agglomerations in the Yangtze River Economic Belt. Resour. Environ. Yangtze Basin 2019, 28, 2586–2600. [Google Scholar]
  44. Hong, G.; Lan, C. Coupling Analysis of Urban Construction Land and Urban Population in the Yangtze River Delta. Popul. Soc. 2020, 36, 40–48. [Google Scholar]
  45. Zhou, Y.; Huang, X.; Xu, G.; Li, J. The coupling and driving forces between urban land expansion and population growth in Yangtze River Delta. Geogr. Res. 2016, 35, 313–324. [Google Scholar]
  46. Chen, Q.; Tang, J. The Spatial and Characteristics of Population Evolution and Its Dynamic Mechanism in City-and-Town Concentrated Areas in the Yangtze River Delta. J. Zhejiang Univ. Technol. Soc. Sci. 2009, 8, 27–33. [Google Scholar]
  47. Population Census Office under the State Council; Department of Population and Social Science and Technology Statistics, National Bureau of Statistics. Tabulation on the 2010 Population Census by County; China Statistics Press: Beijing, China, 2003.
  48. Population Census Office under the State Council; Department of Populationand Employment Statistics, National Bureau of Statistics. Tabulation on the 2010 Population Census of the People’s Republic of China by County; China Statistics Press: Beijing, China, 2012.
  49. Office of the Leading Group of the State Council for the Seventh National Population Census. Tabulation on 2020 China Population Census by County; China Statistics Press: Beijing, China, 2022.
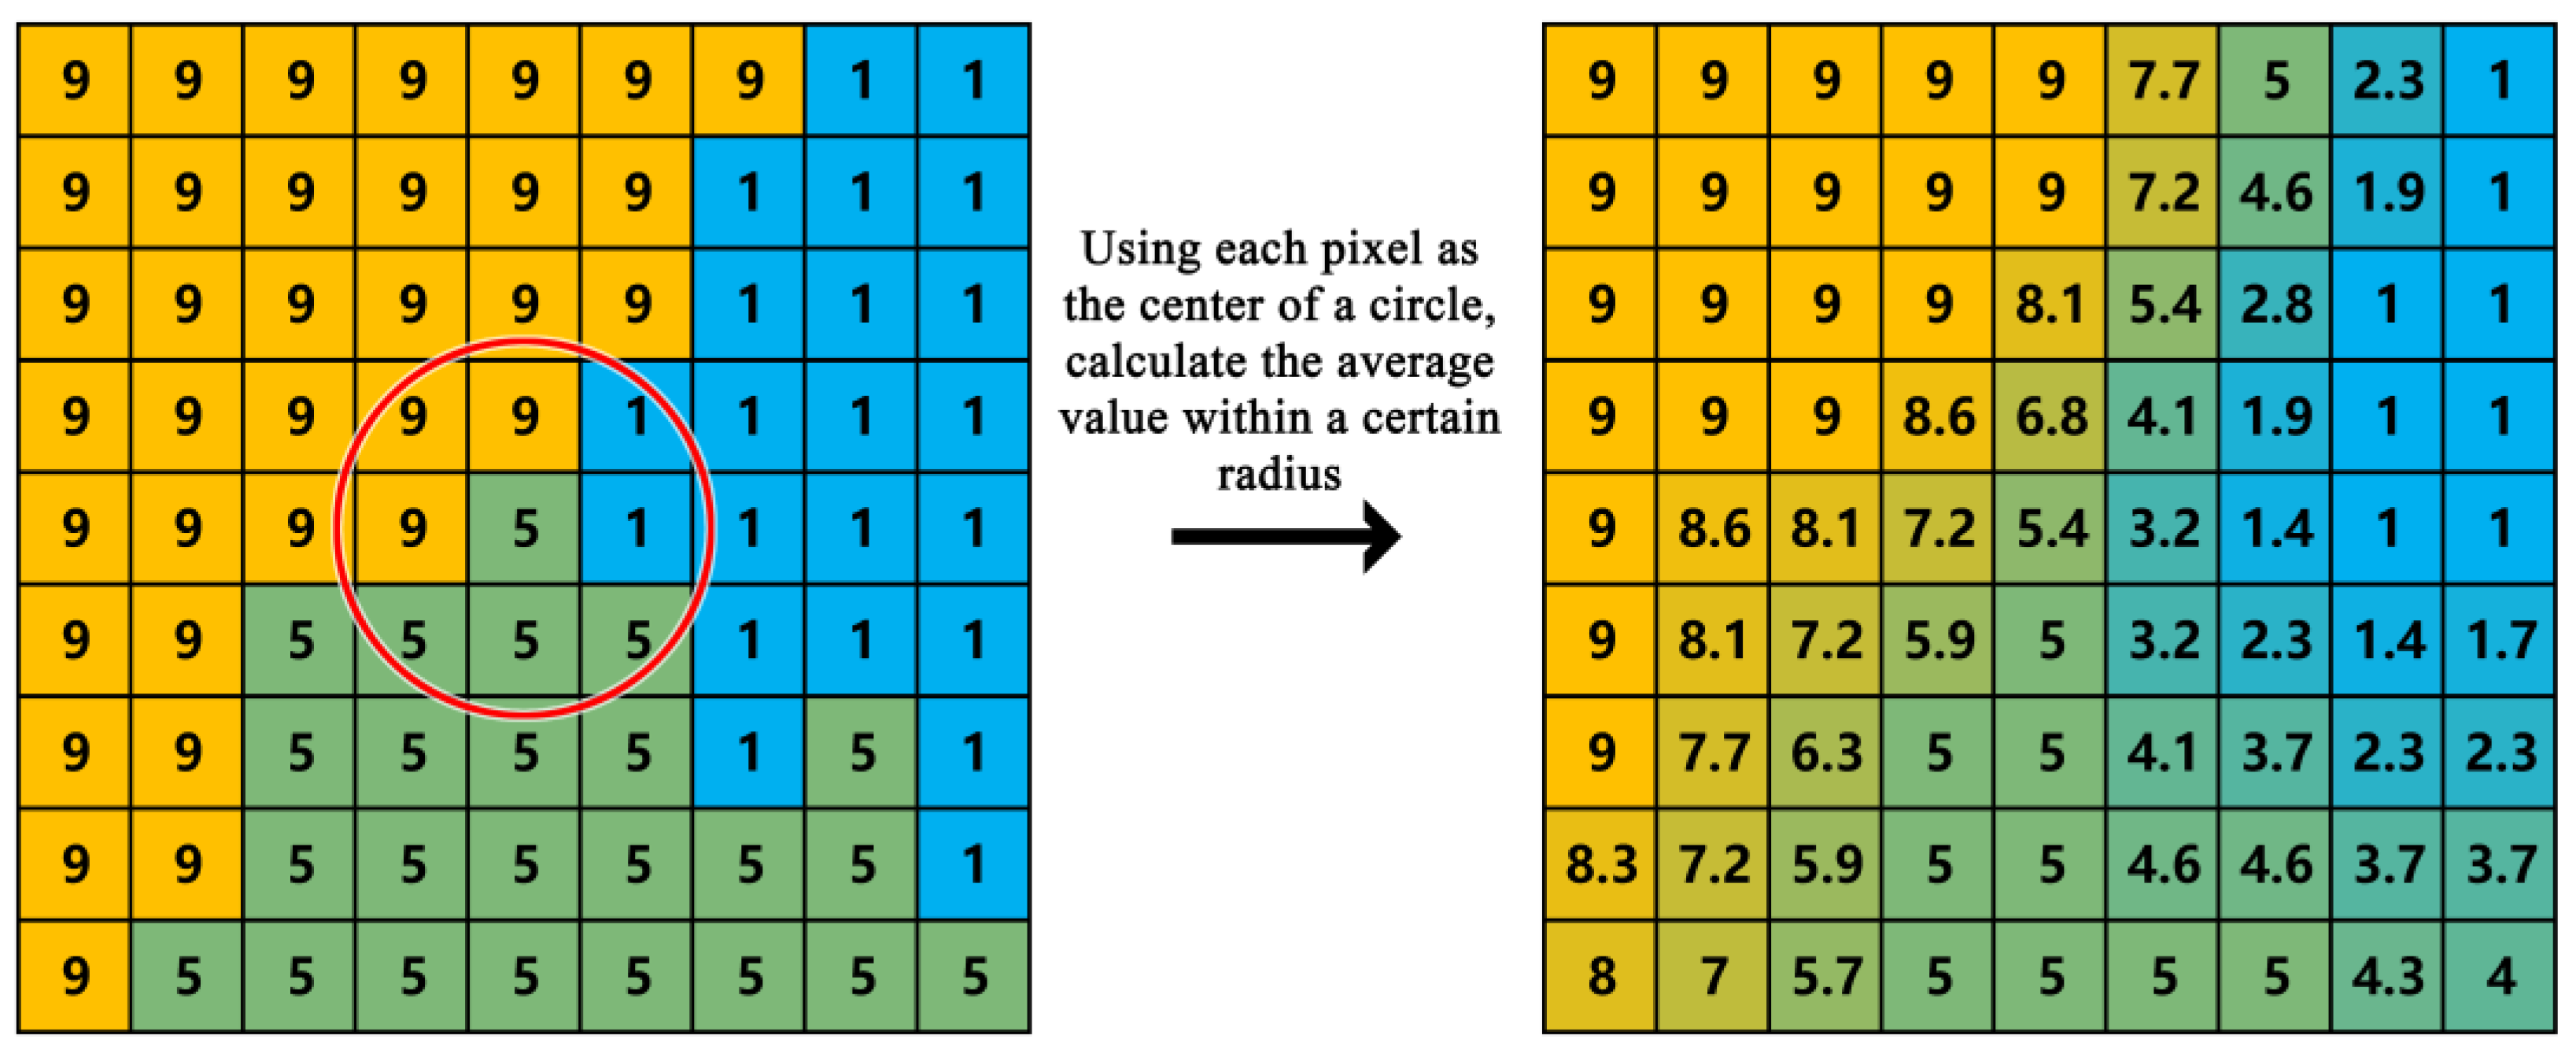
Figure 1. Principles of Focal Statistical Analysis (Source: author’s own processing).
Land 12 01249 g001
Figure 2. Population density of permanent residents in 2020 (all data) (Source: author’s own processing).
Land 12 01249 g002
Figure 3. Employment density of 2020 (long-form data, 10% sample) (Source: author’s own processing).
Land 12 01249 g003
Figure 4. Employment density of primary industry in 2020 (long-form data, 10% sample) (Source: author’s own processing).
Land 12 01249 g004
Figure 5. Employment density of secondary industry in 2020 (long-form data, 10% sample) (Source: author’s own processing).
Land 12 01249 g005
Figure 6. Employment density of tertiary industry in 2020 (long-form data, 10% sample) (Source: author’s own processing).
Land 12 01249 g006
Figure 7. Mean centers of permanent residents and employed population from 2000 to 2020 (Source: author’s own processing).
Land 12 01249 g007
Figure 8. Focal statistics results of Employed population density in 2020 (R = 20 km) (Source: author’s own processing).
Land 12 01249 g008
Figure 9. Changes in employment density from 2000 to 2020 (Source: author’s own processing).
Land 12 01249 g009
Figure 10. Changes in employment density of the primary industry from 2000 to 2020 (Source: author’s own processing).
Land 12 01249 g010
Figure 11. Changes in employment density of the secondary industry from 2000 to 2020 (Source: author’s own processing).
Land 12 01249 g011
Figure 12. Changes in employment density of the tertiary industry from 2000 to 2020 (Source: author’s own processing).
Land 12 01249 g012
Figure 13. Dendrogram using average linkage of Cluster by industry structure of 2020.
Land 12 01249 g013
Figure 14. Map visualization results of industrial structure clustering analysis in 2020 (Source: author’s own processing).
Land 12 01249 g014
Figure 15. Map visualization results of employment changes clustering analysis over two decades of 2000–2010 and 2010–2020 (Source: author’s own processing).
Land 12 01249 g015
Figure 16. Map visualization results of employment industry structure changes clustering analysis over two decades of 2000–2010 and 2010–2020 (Source: author’s own processing).
Land 12 01249 g016
Figure 17. Map visualization results of employment industry structure clustering analysis over central urban and municipal jurisdiction area (Source: author’s own processing).
Land 12 01249 g017
Figure 18. Map visualization results of employment changes clustering analysis based on different spatial levels from 2000 to 2020 (Source: author’s own processing).
Land 12 01249 g018
Table 1. Employed population categories (based on the 2020 census of China).
Industry SectorsIndustry Category of Employed Population
Primary IndustryAgriculture, forestry, animal husbandry and fishery
Secondary IndustryMining; manufacturing; electricity, heat, gas and water production and supply; construction
Tertiary IndustryWholesale and retail trade; transportation, storage and postal services; accommodation and catering; information transmission, software and information technology services; finance; real estate; rental and business services; scientific research and technical services; water, environment and public facilities management; residential services, repairs and other services; Education; health and social work; culture, sports and entertainment; public administration, social security and social organizations; international organizations
Disclaimer/Publisher’s Note: The statements, opinions and data contained in all publications are solely those of the individual author(s) and contributor(s) and not of MDPI and/or the editor(s). MDPI and/or the editor(s) disclaim responsibility for any injury to people or property resulting from any ideas, methods, instructions or products referred to in the content.