Abstract
Infrared (IR) land surface emissivity (LSE) plays an important role in numerical weather prediction (NWP) models through the satellite radiance assimilation. However, due to the large uncertainties in LSE over the desert, many land-surface sensitive channels of satellite IR sensors are not assimilated. This calls for further assessments of the quality of satellite-retrieved LSE in these desert regions. A set of LSE observations were made from field experiments conducted on 16–18 October 2013 along a south/north desert road in the Taklimakan Desert (TD), China. The observed LSEs (EOBS) are thus used in this study as the reference values to evaluate the quality of Combined ASTER MODIS Emissivity over Land (CAMEL) data. Analysis of these data shows four main results. First, the CAMEL datasets appear to sufficiently capture the spatial variations in LSE from the oasis to the hinterland of the TD (this is especially the case in the quartz reststrahlen band). From site 1 at the southern edge of the Taklimakan Desert to site 10 at the northern edge, the measured LSE and the corresponding CAMEL observation in the quartz reststrahlen band first decrease and reach their minimum around sites 4–6 in the hinterland of the Taklimakan Desert. Then, the LSE increases gradually and finally reaches its maximum at site 10, which has a clay ground surface, showing that the LSE is higher at the edges of the desert and lower in the center. Second, the CAMEL values at 11.3 μm have a zonal distribution characterized by a northeast–southwest strike, though such an artifact might have been introduced by ASTER LSE data during the merging process that created the CAMEL dataset. Third, the unrealistic variation of the original EOBS can be filtered out with useful signals, as identified by the first six principal components of the PCA conducted on the laboratory-measured hyperspectral emissivity spectra (ELAB). Fourth, the CAMEL results correlate well with the measured LSE at the 10 observation sites, with the observed LSE being slightly smaller than the CAMEL values in general.
1. Introduction
In recent years, extremely heavy precipitation events in and around the Taklimakan Desert (TD) in China have occurred more frequently than they ever had before [1]. Due to the special geography and land-surface type as well as soil texture, local severe storms (LSSs) that deliver tens of millimeters of precipitation in several hours may induce mountain torrents or debris flows on the hillsides of Mt. Tianshan and Mt. Kunlun around the TD, which lead to economic losses and cause serious casualties. Accurate and timely weather forecasts are thus critical in this region. Numerical weather prediction (NWP) modeling with high temporal and spatial resolutions can be a useful tool to achieve this goal [2].
The accuracy of NWP models highly depends on the initial conditions [2,3,4,5]. Therefore, it is essential that these models incorporate observations of high quality and that have the proper spatial distribution density. However, only seven conventional synoptic stations and three synoptic radars are located in oasis regions around the TD, and there are no meteorological stations in the hinterland of the grand desert regions, an area of 330,000 square kilometers [5]. That is far from the number needed to provide accurate initial conditions. Satellite data can and should be used to fill the data gap in this region [6].
With improvements made to instrumentation and data assimilation technologies, satellite data have played an increasingly important role in improving the NWP [7]. At present, 90% of all assimilated datasets used by operational centers in Europe and the United States consist of satellite data [8]. The use of satellite data has improved the lead time of prediction in the Southern Hemisphere by more than two days and by nearly one day in the Northern Hemisphere [9].
Even with the overwhelming use of satellite measurements by NWP centers, forecasting when and where LSSs are going to form is still challenging [10]. Part of the reason is due to the lack of data depicting the accurate initial conditions at the boundary layer and the land surface [11,12]. Infrared (IR) radiation that is sensitive to the surface may provide the needed information because their weighting functions peak near the surface [13]. In recent years, progress has been made in assimilating IR surface channel radiance values. However, most NWP centers still do not assimilate those radiances, partly due to the complexity of the land surface.
Two important characteristics of the land surface, land surface temperature (LST) and land surface emissivity (LSE), are difficult to estimate accurately, resulting in the limited use of surface channels in assimilation systems [14]. LST and LSE are two important terms in the radiative transfer equation (RTE). Together they characterize how large the surface emission is. This term has a significant contribution to the RTE [15]. LSE is defined as the ratio of energy emitted from natural material to that from an ideal blackbody at the same temperature, which also affects how much atmospheric incoming radiation is reflected back by the surface. This term usually has a minor contribution in the RTE, but it is not negligible, especially when LSE is substantially smaller than 1, i.e., in the desert [12]. Accurately simulating the surface emission and surface reflection with accurate LST and LSE will make it possible to successfully integrate the surface and the water vapor channel radiances in dry conditions, i.e., winter or high terrain [16]. It is possible to simultaneously analyze the LSE and LST in the assimilation system in addition to the temperature and moisture profiles. However, the addition of the unknowns of LSE and LST and the strong correlations between them add significant difficulties to the inversion problem [12].
LSE is one of the inherent physical properties of surface materials [11]. It is not only related to the composition of surface soil materials, surface roughness, and soil moisture [17,18,19] but also to variations in the viewing angle (Li et al., 2010). LSE varies with surface type, making it difficult to accurately characterize [20,21]. In addition to surface channel radiance assimilation, LSE is an important input parameter in many other applications related to the surface [12,22]. In LST inversion, for a typical LST of 300 K, an LSE error of 0.01 will lead to an LST inversion error of approximately 1 K [22]. Accurate LSE is also important for climate models. For example, a broadband surface emissivity error of 0.1 will result in errors of up to 7 W·m−2 in the outgoing longwave radiation estimates, which is much larger than the surface radiative forcing (~2–3 W·m−2) due to an increase in greenhouse gases [12].
Since the launch of the National Aeronautics and Space Administration (NASA) Earth Observing System (EOS) Terra and Aqua satellites, more realistic representations of the IR emissivity spectrum have been developed. For example, the NASA Moderate Resolution Imaging Spectroradiometer (MODIS) MOD11C3 monthly land surface temperature and emissivity products, which have a 5 km spatial resolution using the day/night algorithm [23], have been sufficiently evaluated. However, the MODIS MOD11 products are only available at selected MODIS spectral bands. To expand the spectral coverage and, more importantly, the spectral resolution, a MODIS-based baseline fit emissivity database (BFEMIS) was developed at the University of Wisconsin–Madison using laboratory measurements to fill the spectral gaps [24]. This dataset has been extensively used in research and operational applications. It has been incorporated into the Radiative Transfer for TOVS (RTTOV) model [25]. A Global Emissivity Dataset from Advanced Spaceborne Thermal Emission and Reflection Radiometer (ASTER GED) was also created at the Jet Propulsion Laboratory (JPL) to provide thermal emission emissivity measurements at 100-m resolution [26].
Recently, ASTER GED V4 was incorporated to augment the spectral coverage of the University of Wisconsin (UW) BFEMIS database in critical wavelengths and to stabilize the time dependence of the operational MODIS MOD11 emissivity product. As a result, a new dataset called the Combined ASTER MODIS Emissivity over Land (CAMEL) dataset [21,27] was developed under the NASA Making Earth System Data Records for Use in Research (MEaSUREs) program.
It is emphasized that the previous validation of CAMEL was conducted using satellite products as the reference [12]; this study continues the efforts to compare and validate CAMEL using the highly accurate in situ emissivity measurements in desert regions as the reference instead.
2. Materials and Methods
2.1. LSE Observations from Field Experiments
LSE observations (EOBS) that were collected over 10 locations in the TD from field experiments conducted on 16–18 October 2013 [28] are used as the reference to evaluate CAMEL. The sites were selected along a south/north desert road in TD every 50 km [28] with their exact locations and land-use categories shown in Figure 1 and Table 1. Using a portable Fourier-transform infrared spectrometer (FTIR), which is sensitive to thermal infrared radiance (TIR) and blackbody radiation in cold and warm conditions, and a gold diffuse calibration plate, the LSE was measured in the 8–14 μm part of the spectrum from 10 different sites along a south/north desert road every 50 km [28]. Generally, more than three sets of EOBS were obtained by LSE spectrum measurements at each site, and then their average values were used as the reference to evaluate CAMEL. To obtain a more preferable EOBS with a higher quality, fine and dry weather conditions were selected to conduct the field observation experiments since cloudy weather would increase the observation error and further lower the measurement precision. To rectify the emissivity, the 102F spectrometer must be calibrated by a blackbody once every 10–20 min. Additionally, the cold blackbody temperature was set to be 10 K lower than the surrounding temperature, while the hot blackbody temperature was set 10 K higher than the LST at the same location. The actual temperature of the cold and hot blackbody was measured and saved as soon as possible once the proper blackbody temperature had been initialized. The precision of the blackbody emissivity measurement is ±0.002, with a temperature precision of ±0.1 K, and the error caused by the blackbody is less than 0.004 with such a set-up. The temperature fluctuation range of the interferometer is smaller than 0.1 K, and the error of the blackbody itself is within 0.002 [29]. The overlapping count of the scanning spectrum is usually set to 10 to lower the equipment noise signal interference, and the mean value during the overlap duration is finally used by the interferometer [28].
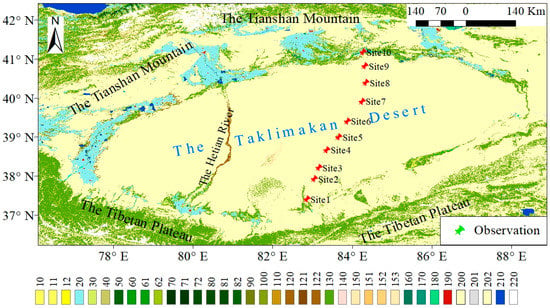
Figure 1.
Locations of field experiments (Table 1) and the land type description in and around the TD. Different surface label indices represent different surface types [30].

Table 1.
Geolocation, altitude, local solar time, and land category of the 10 observation sites.
In the field measurement process, the following three steps were followed to obtain EOBS as accurately as possible. First, the radiation of the cold blackbody and the hot blackbody as well as the diffuse gold plate was measured. Second, thermal radiation was measured vertically with 0° as its zenith angle. Third, the first step was repeated. The diffuse gold plate was 5 × 5 inches in size and was developed by Labsphere, an American company. Its emissivity is approximately 0.04, and the factory calibration value was used in the observation process of field experiments. To avoid any possible negative impact of weather-related variations on the emissivity of the instrument itself that would further impact the precision of the EOBS, the three steps were completed as swiftly as possible, and a single sampling process was hence shortened to within 10 min.
A credible LST measurement method is critical for LSE calibration. A module has been integrated into the 102F spectrometer software, which is capable of fitting the land-surface radiation spectrum from the blackbody radiation spectrum via the Planck function, which can calculate the LST; this is called blackbody fitting for short. It is suggested that the maximum emissivity of the fitting wavelength band in 7.45 to 7.65 μm should be 0.995 for the desert ground surface [29]. The LST obtained by the blackbody fitting method in this wavelength band is quite realistic, with its calculated LSE error generally smaller than 0.008. The fitted LST is thus also used to calculate the emissivity spectra at all wavelengths [29]. The blackbody fitting methodology is efficient and helps to obtain the LST and facilitates the infrared LSE calculation for a wavelength range of 8–14 μm in the TD, which has also been proven by the field experiments referred to in this study.
The FTIR-based emissivity is computed based on the following equation:
where is the surface emissivity of the sample as a function of wavelength (l); is the calibrated radiance of the sample; is the calibrated radiance of the downwelling radiance; and is a Planck function at the sample temperature. The exact locations and surface-type categories of the 10 sites are detailed in Table A1 and Figure 1. Most of the sites are in the inner domain of the TD, while sites 1 and 10 are close to or at the oasis.
The LSE observations (EOBS) from the field experiments are shown in Figure 2, which are the original observations absent any statistical operations, including averaging. The wavelength of the EOBS ranges from 7.89 μm to 14.10 μm, with 416 channels [28]. The general pattern is consistent with the laboratory-measured desert sand LSE spectrum; the LSE decreases with increasing wavelength at approximately 8 μm, reaches a minimum at approximately 9.3 μm, and then increases until reaching the maximum wavelength. Such a pattern is obvious for the first eight sites but much subtler for the last two sites, especially for site 10, which has a clay ground surface. Figure 3 shows 42 sandy hyperspectral emissivity spectra at 416 wavelengths in the infrared region from 7.8942 μm to 14.0964 μm. These hyperspectral spectra were selected from the 123 laboratory emissivity spectra (wavenumber resolution between 2–4 cm−1) used in the UW BFEMIS database (Table A2) [24]. They showed a spectral pattern similar to that of EOBS, which first decreases, reaching their minimum between 8 μm and 9 μm, and then increases until 11 μm. After 11 μm, the spectral variations are subtle.

Figure 2.
The land surface emissivity measurements from the field experiments at 10 observation sites in the TD.
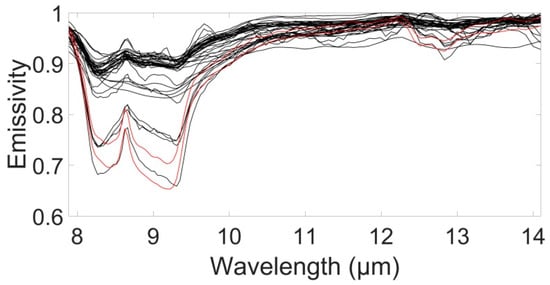
Figure 3.
Forty-two selected laboratory-measured sandy samples from 123 ELAB hyperspectral emissivity spectra. The two red lines show two typical sandy samples.
However, the measured LSE appears to be quite noisy, especially in the longwave region, where LSE is expected to be spectrally smoother [21]. The maximum value of EOBS is even larger than 1.0 for some sites. Such a phenomenon is likely caused by excessive noise in the observing process, which is common in LSE measurements [28]. The sample temperature was measured using thermocouples. The method of using thermocouples to measure sample temperature is not suitable for samples in natural environments with high roughness, poor thermal conductivity, and small thermal inertia, such as soil. The inaccuracy of temperature measurement will directly lead to a large error in the final calculated specific Radiance. To filter out the noise in EOBS, the principal component analysis (PCA) noise filtering method is used [21].
Noise filtering is performed in three steps. In the first step, the 123 laboratory-measured emissivity spectra are used to generate eigenvectors. The eigenvectors are ranked by their importance, i.e., the most important eigenvector or the one explaining the most variances is the first eigenvector. The least important ones are last eigenvectors. They usually explain the noise information. Figure 4 shows that the first four eigenvectors can explain 99.1% of the variance. The first eight can explain 99.8%. In the second step, eigenvectors are used to decompose the EOBS spectra. Each EOBS spectrum can be decomposed to obtain the coefficient for each eigenvector or the eigenvalue. In the last step, to perform noise filtering, one needs to use a certain number of PCs to reconstruct the EOBS. Since the last eigenvectors for noise information are not used, the reconstructed EOBS is noise-filtered.
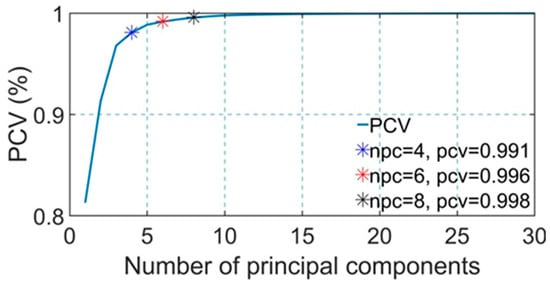
Figure 4.
Percentage of the cumulative variance (PCV) of the 123 selected laboratory measurement sets as a function of the number of principal components (NPC). The legend contains the corresponding PCV values.
Figure 5 shows the residual of the 10 EOBS spectra (the original minus the reconstructed spectra) using different numbers of PCs. When the proper number of eigenvectors is used, the residual should be dominated by noise, thus appearing random. Too few eigenvectors result in loss of signal, and too many result in less noise being filtered. As shown in Figure 5a, when the first 4 PCs are used to filter the EOBS, the maximum residual of the 10 EOBS spectra reach 0.0834 at 7.9372 μm over site 9. The residual becomes 0.0756 at 7.9392 μm over site 9 with the first 6 PCs, and 0.0614 at 7.9392 μm over site 4 with the first 8 PCs. All maximum residuals with different PC numbers occurred at wavelengths between 7.93 μm and 7.94 μm, with two of the three maximum values appearing over site 9 in the clay ground surface soil category. In addition, the majority of all the maximum residuals for the 10 sites appear at wavelengths smaller than 9 μm, and the remaining maximum values appear at wavelengths larger than 13 μm. Such a distribution feature is also presented in Figure 5.
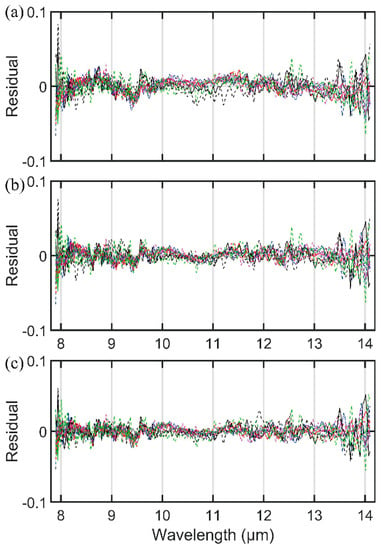
Figure 5.
Residual of the hyperspectral EOBS at the 10 sites in the TD before and after filtering with the first 4 PCs (a) and 6 PCs (b) as well as 8 PCs (c). The residual here means the EOBS before filtering minus the EOBS after filtering.
After noise filtering, the unrealistic spectral variations in the original EOBS from the 10 sites in the TD are not obvious, and unrealistic noise with wavelengths shorter than 8 μm and larger than 14 μm has been successfully filtered out. For example, the original maximum EOBS value of 1.0279 at site 6 was adjusted to 0.9676 after the filtering process was applied. The filtered LSE appears to have more realistic spectra (Figure 6) when compared with the spectra of the two sandy samples from ELAB (solid red lines in Figure 3). As shown in Table 2, the correlation coefficient between the original EOBS and the mean of the two sandy ELAB samples is smaller than that after filtering with the first six ELAB PCs. The mean correlation coefficient of the 10 sites is increased from 0.910 to 0.951, 0.957, and 0.948, with the number of ELAB principal components equal to 4, 6 and 8, respectively, indicating that the filtering of the EOBS brings the LSE spectra closer to the sandy spectra, and the maximum number of PCs allowed is thus finally determined to be 6. This is consistent with Borbas et al. (2018), where the first 6 PCs are also used to derive high spectral resolution emissivity.
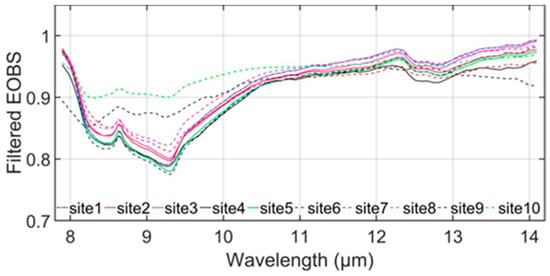
Figure 6.
The 10 new noise-filtered spectra of EOBS with the first 6 ELAB PCs.

Table 2.
Coefficient between ELAB of 42 selected laboratory measured sandy samples and EOBS before (Original) and after (Filtered) noise filtering with first 6 PCs of ELAB used.
2.2. CAMEL ESDR Database
Data from the second version of the CAMEL Earth System Data Record (ESDR) from October 2013 are used in this study, which consist of a monthly global LSE database with a resolution of 5 km [21] and are available at 13 hinge points from 3.6–14.3 μm. CAMEL ESDR was produced by merging the UW-Madison MODIS infrared emissivity dataset (UW BF) and the JPL ASTER Global Emissivity Dataset Version 4 (GEDv4). Out of the 13 hinge points of the CAMEL for October 2013, only 7 overlap with the spectral coverage of EOBS. The wavelengths of these seven hinge points are 8.3 μm, 8.6 μm, 9.1 μm, 10.6 μm, 10.8 μm 11.3 μm, and 12.3 μm, respectively.
The CAMEL imagery at 8.3 μm, 8.6 μm, and 9.1 μm are shown in Figure 7. For these three wavelengths, the TD has a much smaller LSE than the surrounding areas. The minimum values are 0.80 to 0.82. The LSE spatial variations in the TD match well with the surface types, as shown in Figure 1. For example, the regions that the Hetian River runs through, from (37° N, 80° E) to (40° N, 80.5° E), have LSEs larger than those of other areas in all three images. To the east of the Hetian River, a second river, the Keriya River, from (37° N, 81.5° E) to (38.5° N, 82° E), is also visible on the 8.6 μm imagery. The river ends at the Daliyabuyi Oasis, where LSE is also larger than the surrounding desert. Along the eastern half of the southern boundary of the TD, a belt with LSE significantly larger than that of desert sands runs from (37° N, 82.5° E) to (39° N, 87.5° E). This belt is also seen in Figure 1. In addition, many other surface features are recognizable on the CAMEL imagery, such as water reservoirs and snow-covered mountaintops. These results indicate that the CAMEL LSE database is able to capture the spatial variations in the region and correctly distinguish regions with large LSE from those with low LSE.
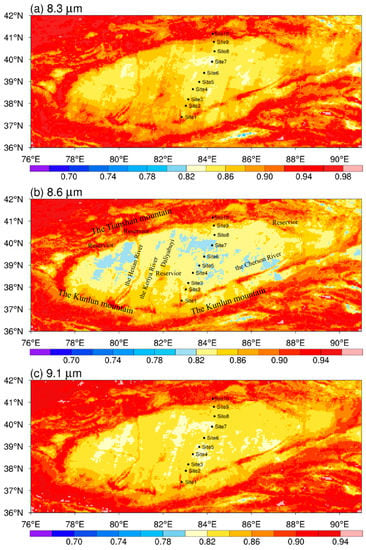
Figure 7.
The CAMEL LSE at 8.3 μm (a), 8.6 μm (b), and 9.1 μm (c) in the TD for October 2013.
It should also be noted that the CAMEL imagery appears to contain some artifacts at 8.3 μm with strips from north-northeast by north (NNE) to south-southwest (SSW) (Figure 7a). Such artifacts are likely due to the low temporal resolution of the ASTER imagery. A wave-like diurnal variation was also shown in LSE in the quartz reststrahlen band [12]. Such temporal variations in LSE are due to diurnal variability in soil moisture content. ASTER has a narrow swath of 60 km and a low revisit rate of 16 days. The lack of more frequent revisits makes it difficult to smooth out the temporal difference, which leads to artifacts such as those shown in Figure 7a in the monthly CAMEL product. The lack of temporal variation in the monthly CAMEL product may pose some difficulties for its applications. This is likely more important around local noon time due to strong evaporation from the top-level soil with high LST.
From site 1 near the southern edge of the Taklimakan Desert to site 10 at the northern edge, Figure 8 shows that the CAMEL LSE derived from wavelengths of 8.3 μm, 8.6 μm and 9.1 μm is higher over the oasis around the TD than over its hinterland. Starting from site 1, the CAMEL LSE first slowly decreases, reaching a minimum around site 7 in the hinterland of the Taklimakan Desert, then increases and finally reaches its maximum at site 10. This U shape is physically consistent with the geography of the region. At both the south and north ends of the 10 sites, there are many oases where the soil is not sandy or not as sandy. Therefore, the LSE at both ends is larger than the sites in the inner desert. The CAMEL from the northern end is larger than that from the southern end because site 10 is much closer to the oasis than site 1. In addition, site 10 has a clay ground surface, while site 1 has a sandy surface. For the three long wavelength bands at 10.8 μm, 11.3 μm, and 12.3 μm, the CAMEL remains almost the same at all 10 observing sites.
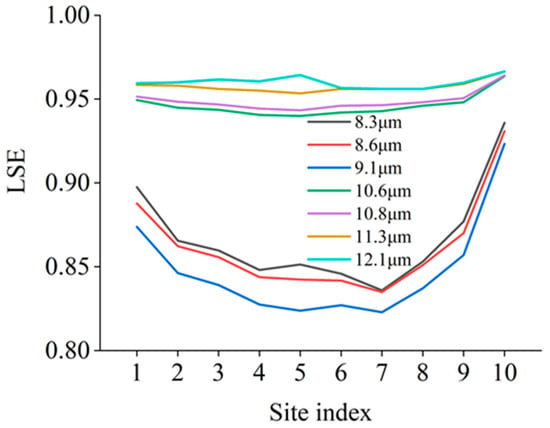
Figure 8.
The CAMEL LSE at the 7 hinge points for the 10 sites in the TD from 16 to 18 October 2013.
Since the EOBS covers 390 wavelengths, the 13 hinge points of the CAMEL ESDR database is expanded to 417 spectral channels (Figure 9) using the software tool provided by the CAMEL team to apply a principal component (PC) regression approach [21]. While the 13 hinge points provide critical spectral information for the LSE, the high spectral resolution (HSR) CAMEL does provide more detailed spectral variations. At all 10 sites, the HSR CAMEL clearly shows a spike of approximately 8.6 μm within the quartz reststrahlen band. Additionally, the dip starting at approximately 12.3 μm is also visible for all 10 sites. The 13 hinge points, on the other hand, do not show such spectral signals. Therefore, the CAMEL HSR will also be used for intercomparison with the measured LSE (EOBS).
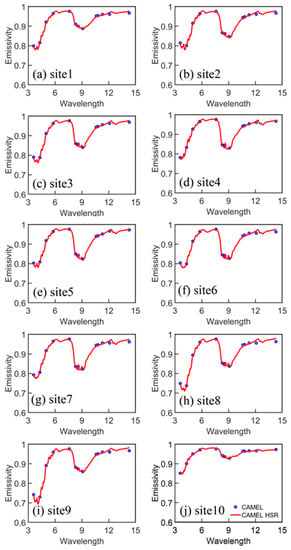
Figure 9.
CAMEL LSE expanded to high spectral resolution spectra from the CAMEL’s 13 hinge point emissivity values.
3. Results
3.1. Comparison between CAMEL and EOBS at Hinge Points in the Quartz Reststrahlen Band
Figure 10 shows the spatial variations in the CAMEL and the corresponding EOBS in the quartz reststrahlen band from sites 1 to 10. As noted previously, the CAMEL shows a U-shaped spatial variation. The CAMEL emissivity from site 1 is substantially larger than that from site 2. Both sites have LSE substantially larger than the inner desert sites, due to the fact that these bands, located in the fundamental vibrational stretching modes in the IR range, often have high reflectance [31] and low emissivity according to Kirchhoff’s law of thermal radiation; they are extremely sensitive to the surface soil quartz contents. The surface soil at site 5 is quicksand, with fine sand accounting for over 98% of the total weight, silt accounting for 1.5%, clay accounting for 0.5%, and the average particle size of fine sand being 136.0 μm. There are two types of surface soils at site 9, namely quicksand and ancient river channel silt. The average particle size of quicksand varies greatly, ranging from 15.6 to 250.0 μm, which is a mixture of extremely fine sand, fine sand, medium silt, and coarse silt. Fine sand accounts for over 93% of the total weight, while silt accounts for 4%, and clay accounts for 0.5%, which is close to the soil composition at observation site 5. The surface silt of ancient river channels is different from quicksand, with fine sand accounting for 77% of the total weight, silt accounting for 10%, and clay accounting for 13%. In the clay surface of observation point 10, fine sand accounts for 73% of the total weight, with silt accounting for 9%, and clay accounting for 18%. The determination of organic matter content in soil at a depth of 0–10 cm shows that quicksand contains 4.3 g/kg of organic matter, and ancient river silt contains 10.5 g/kg of organic matter [32]. Unfortunately, the organic matter content of clay in the Populus euphratica forest was not determined, and its organic matter content should be higher. The soil properties of other observation points on the underlying surface of quicksand are basically the same as those of observation site 5.

Figure 10.
CAMEL LSE (dashed line) and field-measured LSE (EOBS, solid line) at (a) 8.3 μm, (b) 8.6 μm, and (c) 9.1 μm. The bars show the difference of CAMEL compared to EOBS (CAMEL minus EOBS).
However, the U shape from the EOBS is not as profound as that from CAMEL. EOBS at site 1 is only slightly larger than that at site 2. Neither is significantly larger than that from the inner desert. At 8.3 μm, CAMEL is greater than the corresponding EOBS for all sites except site 7 (Figure 10a). The largest discrepancy (0.054) appeared at site 1. For LSE at 8.6 μm, CAMEL values are larger at sites 1, 2, and 10 and smaller at sites 7, 8, and 9. Other sites are similar. The maximum positive difference of 0.03 occurs at site 1, while the maximum negative difference of −0.03 is at site 7. For 9.1 μm, CAMEL is greater than EOBS for the first six sites but comparable for the last four sites. The maximum positive difference of 0.06 again appeared at site 1. In addition, the averaged differences of CAMEL from EOBS (CAMEL minus EOBS) are approximately 0.017, 0.001, and 0.025 for 8.3 μm, 8.6 μm, and 9.1 μm, respectively. Therefore, overall, the CAMEL emissivity is larger than the EOBS emissivity. The largest differences in LSE at all three wavelengths appeared at site 1.
Two possible reasons may contribute to the discrepancies between CAMEL and EOBS. First, CAMEL is an area measurement, while EOBS is a point measurement. CAMEL measurements are more affected by nearby oases. The high LSE from the nearby oasis increases the CAMEL LSE significantly at site 1 and substantially at site 2. The EOBS values at sites 1 and 2 were measured from the sand samples. Therefore, the large discrepancies at sites 1 and 2 are probably an indication that the two measurements are looking at different surface materials in the region. Second, CAMEL is a monthly LSE database based on MODIS and ASTER onboard Terra, which passes over the equator at approximately 10:30 and 22:30 local time. Therefore, CAMEL is the day/night average over one month. It is shown that nighttime LSE is likely larger possibly due to increased soil moisture from absorption [12], although some other previous results also showed that the effect of adsorption on LSE is relatively small, and the daily amplitude of LSE in SEVIRI may also be an artifact from the diurnal cycle of LST [33]. EOBS, on the other hand, is from daytime only and is therefore more likely to be smaller than the results from CAMEL.
3.2. Comparison between EOBS and HSR CAMEL
Comparisons between EOBS and the corresponding HSR CAMEL (Figure 11) offer an opportunity to examine the spectral differences in detail. The spectral variation of EOBS is similar to that of HSR CAMEL at all 10 observation sites. The quartz reststrahlen band is well recognized in both EOBS and CAMEL. The LSE in this quartz reststrahlen band is significantly smaller than or broader than those with wavelengths greater than 9.1 μm. There are two spectral spikes in EOBS in the quartz reststrahlen band, one at approximately 8.6 μm and the other at approximately 9.1 μm. Both spikes are visible at most EOBS sites, with the second spike not as profound. There is only one spike in CAMEL, which has its minimum at a wavelength of approximately 9 μm and is somewhat different from that of EOBS. The LSE decreases at approximately 12.3 μm and then increases at approximately 12.8 μm. This dip is well characterized by both. It is important to note that these spectral spikes and dips are not artificially produced by PCA noise filtering. They are also recognizable from the unfiltered data in Figure 2. At site 8, EOBS fits very well with HSR CAMEL, with their HSR curves almost overlapping with each other. This is consistent with the comparison of the three hinge points at this site shown in Figure 10. The land-use category at this site is recognized as sheer sand and is consistent with the actual situation observed during the field experiments.
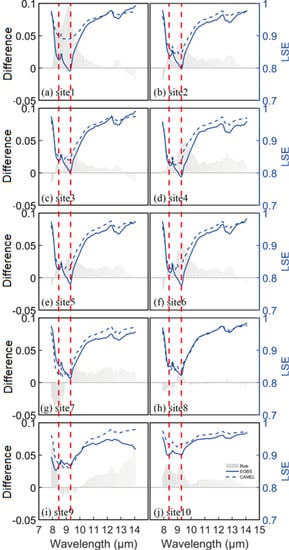
Figure 11.
The HSR CAMEL and EOBS for the 10 sites as well as the difference (CAMEL minus EOBS) between them. EOBS was filtered by using PCA. CAMEL HSR is calculated from the emissivity values at 13 hinge points. The dashed lines indicate the two spectrum spikes in EOBS.
Sites 2–8 are from the inner desert. There are smaller variations in emissivity between sites. The LSE diurnal variations due to diurnal soil moisture variations may cause EOBS to be smaller than CAMEL. Due to the lack of soil moisture observations during October 2013, the 2-m relative humidity and surface skin temperature (Figure 12) from site 5 are examined. Without the dominant factors affecting soil moisture from precipitation, irrigation, and groundwater, air humidity becomes the main factor affecting soil humidity through evaporation and adsorption. Small relative humidity and hot surface skin temperature both favor evaporation and inhibit moisture adsorption from the air to sand particles. Figure 12 shows that the diurnal variation (maximum minus minimum) in the 2-m relative humidity at site 5 can reach 57.0%. At the time EOBS was taken, the 2-m relative humidity was approximately 14.0%, which is much drier than the average value of 31.4%. Similarly, the LST has a diurnal variation as large as 43.0 K. At the time EOBS was taken, the LST was 25.8 K. Although this is not the hottest temperature of the day, it is much warmer than the monthly average of 14.2 K. It is therefore expected that the soil moisture at the time EOBS was taken to be smaller than the monthly average from CAMEL. This is likely the main reason why the EOBS measurements at sites 3–8 are mostly lower than the monthly averaged CAMEL.
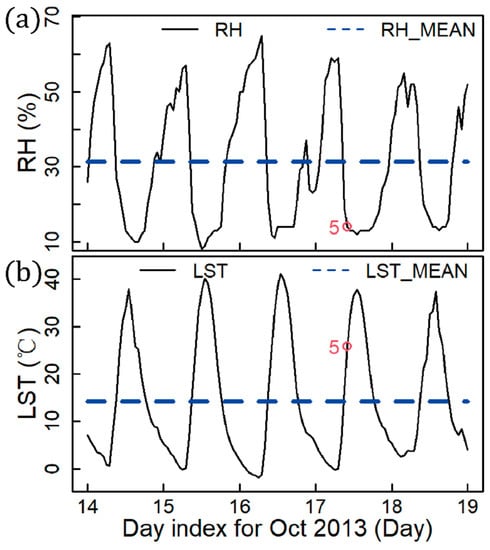
Figure 12.
(a) The 2-m relative humidity (RH) and (b) the ground surface skin temperature (LST) over site 5. The black curve represents the hourly variation in 2-m RH and LST, the blue dotted line represents their mean, and the red circles denote the EOBS measurement time (local solar time) over site 5.
There are obvious differences between the EOBS and CAMEL. Emissivity in the quartz reststrahlen band has differences larger than 0.02. It has the largest differences at 9.1 μm. The longer wavelengths between 11 μm and 14 μm have differences smaller than 0.02. As noted in the previous section, the differences can be attributed to two possible reasons. To further illustrate that the CAMEL measurements at sites near the southern and northern boundaries of the TD are strongly affected by nearby oases, Figure 13 shows the spatial gradient of the CAMEL emissivity at 9.1 μm. Sites 1, 9, and 10 are located in or near areas with obvious spatial gradients. Both sites 1 and 10 have large spatial gradients. Site 1 is occasionally covered by vegetation, namely, Phragmite jeholensis and Populus euphratica, and sites 9 and 10 are occasionally covered by Tamarix ramosissima and Populus euphratica [28]. Thus, the soil samples from these sites are not good representatives of the area. This may lead to smaller EOBS values than CAMEL.
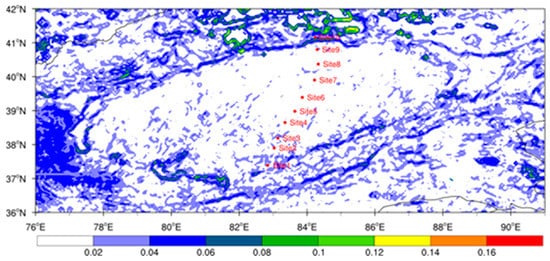
Figure 13.
The one-step spatial gradient (Unit: 1/5000 m) of HSR CAMEL LSE over the TD at 9.1 μm.
4. Discussion
Existing LSE databases are mostly monthly based and are from polar-orbiting satellites. The lack of temporal variations makes it difficult to use those LSE databases for satellite IR surface channel radiance assimilation over deserts. Geostationary imagers, such as the Advanced Geosynchronous Radiation Imager (AGRI), the Advanced Baseline Imager (ABI), and the Spinning Enhanced Visible and Infrared Imager (SEVIRI), all have three longwave bands, one of which is in the quartz reststrahlen band. The high temporal resolution measurements from those imagers will possibly provide useful information on the temporal variations in LSE at high spatial resolution. Geostationary hyperspectral IR sounders, such as the first GIIRS (Geostationary Interferometric Infrared Sounder) on in-orbit Fengyun-4 satellites, the Infrared Sounder (IRS) on the yet to be launched Meteosat Third Generation (MTG) satellite, and the Geostationary and Extended Observations (GeoXO) Sounder (GXS) on the planned GeoXO, will have high spectral resolutions. Sounder measurements will complement the imager measurements with needed LSE spectral information. Together, these geostationary sensors can be used to increase the temporal variations in the existing polar-orbiting, satellite-based LSE database.
Some existing monthly LSE databases also do not account for angular variations, which were discovered and demonstrated previously [34,35]. Some other previous studies also endeavored to develop a model to produce LST with angular LSE and LST corrections [36] or to investigate several IR LSE angular variation models for vegetation canopies [37]. While further efforts are still needed in this study to address angular variations of the existing LSE database, extensive LSE field measurements can be made to comprehensively understand how LSE changes with viewing angles over different desert surface types and in different weather conditions. Quantitatively understanding the angular and temporal variations in desert LSE can be used to develop an IR LSE model. An LSE database with adequate temporal and angular variations will make it possible to assimilate surface channel radiances, which contain important information for the boundary layer. Note that IR LSE models do not yet exist, while IR emissivity models over the ocean have been developed [38].
In addition, experiments similar to those described in this study have shown that the emissivity measurements from CAMEL provide an excellent background for the solution of the inverse problem, which returns results that agree with the measurements from the ground within the limits of instrumental error. Furthermore, the emissivity of the CAMEL database has recently been used to define an index that shows an interesting correlation with evapotranspiration measured from ground stations [39]. Speaking of the inverse problem, thanks to the remarkable quality of the measurements and the appropriate mathematical methods over the last 10 years, the scientific community has overcome the complexity of solving the inverse problem despite the issues of unknown surface emissivity [33].
5. Conclusions
Ten sets of hyperspectral infrared (IR) land surface emissivity (LSE) spectra were obtained from field experiments on 16–18 October 2013. These were measured from 10 sites along a south/north desert road in the Taklimakan Desert (TD). The original EOBS contained strong spectral noise, which was filtered out using principal component analysis. The filtered field-measured LSE (EOBS) was compared with the Combined ASTER MODIS Emissivity over Land (CAMEL) dataset from October 2013.
CAMEL appears to capture the LSE spatial variations well over the TD. From site 1 at the south edge of the TD to site 10 at the north edge, CAMEL in the quartz reststrahlen band shows a U-shaped spatial variation that first decreases, reaches its minimum at site 7, then increases, and reaches the maximum at site 10. Sites near the desert edges have larger LSEs due to the impact of nearby oases. Many of the surface features, such as water reservoirs, rivers, oases, and snow-covered mountaintops, are well characterized in the CAMEL LSE imagery. CAMEL at 8.3 μm shows zonal strips from northeast to southwest. Such artifacts are likely caused by the low temporal resolution of the data in the ASTER LSE database.
The variation pattern from desert to oasis observed from EOBS is not as profound as that from CAMEL. In particular, for the spatial variation from sites 1 to 3, the LSE decrease is not obvious from EOBS. Comparing EOBS with the hyperspectral CAMEL LSE shows differences larger than 0.02 for the quartz reststrahlen band and smaller than 0.02 for wavelengths from 10–14 μm. Two reasons may contribute to these differences. First, CAMEL is an area measurement, while EOBS is a point measurement. Therefore, CAMEL will have larger values where oases are nearby, such as sites 1, 9, and 10. In addition, CAMEL is a monthly averaged database, where day/night measurements from MODIS are both used. EOBS, on the other hand, is measured in the daytime. The high surface skin temperature and low relative humidity in the daytime favor evaporation and inhibit moisture adsorption from air to sand particles. This may lead to a lower measured EOBS than CAMEL. This is consistent with previous studies where LSE diurnal variations were reported as a result of soil moisture diurnal variations.
These results indicate that the LSE in the TD has strong spatial variations, especially near the desert edge. In the inner desert, the LSE spatial variations are not as strong. However, both the desert edge and inner desert may be subject to LSE diurnal variations when soil moisture varies diurnally. For example, strong solar heating during the day may significantly increase the surface skin temperature and decrease the 2-m relative humidity in the daytime. The soil moisture loss, as a result, leads to reduced LSE.
Author Contributions
Conceptualization and investigation: W.H., Z.L., E.E.B., A.M.; data analysis: Y.M., Z.L.; project guidance: W.H., Z.L., A.M.; interpretation: Y.M., Z.L., Y.L.; all authors contributed to the discussion and interpretation of the manuscript; all authors reviewed the manuscript. All authors have read and agreed to the published version of the manuscript.
Funding
This research was funded by the Xinjiang Natural Science Foundation (Grant No. 2022D01A369), National Natural Science Foundation of China (Grant No. 41830968), the Scientific and Technological Innovation Team (Tianshan Innovation Team) project (Grant No. 2022TSYCTD0007), the Fengyun Application Pioneering Project (FY-APP), the S&T Development Fund of IDM (KJFZ202311), and the Flexible Talents Introducing Project of Xinjiang (Grant No. 2021-49).
Data Availability Statement
The EOBS analyzed in the current study are available from the first author on reasonable request.
Acknowledgments
The authors thank Yongqiang Liu in the College of Resource and Environmental Sciences, Xinjiang University, Urumqi, China, for conducting the EOBS field experiments.
Conflicts of Interest
The authors declare no conflict of interest.
Appendix A

Table A1.
Surface label indices and their corresponding land type description.
Table A1.
Surface label indices and their corresponding land type description.
| Label | Land Cover Description |
|---|---|
| 0 | No Data |
| 10 | Cropland, rainfed |
| 20 | Cropland, irrigated or post-flooding |
| 30 | Mosaic cropland (>50%)/natural vegetation (tree, shrub, herbaceous cover) (<50%) |
| 40 | Mosaic natural vegetation (tree, shrub, herbaceous cover) (>50%)/cropland (<50%) |
| 50 | Tree cover, broad-leaved, evergreen, closed to open (>15%) |
| 60 | Tree cover, broad-leaved, deciduous, closed to open (>15%) |
| 70 | Tree cover, needle-leaved, evergreen, closed to open (>15%) |
| 80 | Tree cover, needle-leaved, deciduous, closed to open (>15%) |
| 90 | Tree cover, mixed leaf type (broad-leaved and needle-leaved) |
| 100 | Mosaic tree and shrub (>50%)/herbaceous cover (<50%) |
| 110 | Mosaic herbaceous cover (>50%)/tree and shrub (<50%) |
| 120 | Shrubland |
| 130 | Grassland |
| 140 | Lichens and mosses |
| 150 | Sparse vegetation (tree, shrub, herbaceous cover) (<15%) |
| 160 | Tree cover, flooded, fresh or brackish water |
| 170 | Tree cover, flooded, saline water |
| 180 | Shrub or herbaceous cover, flooded, fresh/saline/brackish water |
| 190 | Urban areas |
| 200 | Bare areas |
| 201 | Consoildated bare areas |
| 202 | Unconsoildated bare areas |
| 210 | Water bodies |
| 220 | Permanent snow and ice |

Table A2.
Laboratory measured soil material list.
Table A2.
Laboratory measured soil material list.
| Index | Material List |
|---|---|
| 1 | leaf of twig |
| 2 | Sliced santa barbara sand stone |
| 3 | Flat rwer washed stone |
| 4 | Soil(Oklahoma), 1st meas. on 11/07/96 (wet sample) |
| 5 | Soil(Oklahoma), 2nd meas. on 11/27/96 (dry) |
| 6 | Soil(Oklahoma), 3rd meas. on 12/04/96 (more dry) |
| 7 | Soil(Oklahoma), 4th meas. on 01/27/97 (very dry) |
| 8 | Sample of surface in Death Valley |
| 9 | Sample of surface in Death Valley |
| 10 | Sample of surface in Death Valley |
| 11 | Sample of surface in Death Valley |
| 12 | Sample of surface in Death Valley |
| 13 | Sample of surface in Death Valley |
| 14 | Soil 88p2535S from Nebraska Soil Lab |
| 15 | Soil Sample of Haliia from Nebraska Soil Lab |
| 16 | Soil 88p2535S from Nebraska Soil Lab |
| 17 | Soil 88p3715S from Nebraska Soil Lab |
| 18 | Soil 88p4643S from Nebraska Soil Lab |
| 19 | Soil 90p3101S from Nebraska Soil Lab |
| 20 | Soil 90P3921S from Nebraska Soil Lab |
| 21 | Soil 90P4172S from Nebraska Soil Lab |
| 22 | Soil 90P4255S from Nebraska Soil Lab |
| 23 | Soil 90P_476S from Nebraska Soil Lab |
| 24 | Leaf of Algerian Ivy (Hedera Canariensis Algerian Ivy) |
| 25 | Leaf of Arailia japonica |
| 26 | Leaf of Bird of Paradise (Strelitzea/Nicolai) |
| 27 | Leaf of Bronze Loquat (eriobotrya) |
| 28 | Leaf of Brazilian Peppertree (schinus terebinthifdias) |
| 29 | Clay Brick (Common) |
| 30 | Soil Sample 1 from Concord, MA |
| 31 | Soil Sample 2 from Concord, MA |
| 32 | Soil Sample 3 from Concord, MA |
| 33 | Leaf of Cypress |
| 34 | Soil Sample 1 from Death Valley, CA |
| 35 | Soil Sample 2 from Death Valley, CA |
| 36 | Soil Sample 3 from Death Valley, CA |
| 37 | Soil Sample 4 from Death Valley, CA |
| 38 | Soil Sample 5 from Death Valley, CA |
| 39 | Soil Sample 6 from Death Valley, CA |
| 40 | Soil Sample 7 from Death Valley, CA |
| 41 | Soil Sample 8 from Death Valley, CA |
| 42 | Soil Sample 9 from Death Valley, CA |
| 43 | Soil Sample 10 from Death Valley, CA |
| 44 | Douglas Fir |
| 45 | Emissivity of Dry Grass (Averaged over 9 Sets) |
| 46 | Emissivity of Dry Grass (Averaged over 9 Sets) |
| 47 | Emissivity of Dry Grass (Averaged over 9 Sets) |
| 48 | Sample of surface in Death Valley |
| 49 | Sample of surface in Death Valley |
| 50 | Sample of surface in Death Valley |
| 51 | Sample of surface in Death Valley |
| 52 | Sample of surface in Death Valley |
| 53 | Fresh leaf of Eucalyptus tree |
| 54 | Leaf of Eucalyptus tree |
| 55 | Leaf of Evergreen Pear (pyrus Kawakami evergreen pear) |
| 56 | Flat River Washed Stone |
| 57 | Sand Sample 1—Goleta Beach (Goleta, CA) |
| 58 | Sand Sample 2—Goleta Beach (Goleta, CA) |
| 59 | Leaf of Green Spruce from Canada |
| 60 | Sample 1—Emissivity of Smooth Ice (Mammoth Lakes) |
| 61 | Sample 2—Emissivity of Smooth Ice (Mammoth Lakes) |
| 62 | Sample 3—Emissivity of Smooth Ice (Mammoth Lakes) |
| 63 | Leaf of India Hawthorne (Raphiolepis India) |
| 64 | Sample 1 of Surface in Koehn, CA |
| 65 | Sample 2 of Surface in Koehn, CA |
| 66 | Sample 4 of Surface in Koehn, CA |
| 67 | Sample 5 of Surface in Koehn, CA |
| 68 | Sample 6 of Surface in Koehn, CA |
| 69 | Leaf of Laurel Tree (ficus microcarpa nitida) |
| 70 | Laurel leaf |
| 71 | Leaf of Laurel (Fresh) |
| 72 | Leaf Magnolia (1st day) |
| 73 | Leaf of Maple (Red Star) |
| 74 | Leaf of Myoporum (myoporum laetum) |
| 75 | Leaf of Naked Coral Tree (Erythrina coraloides) |
| 76 | Leaf of Oak (Face) |
| 77 | oil Sample 1 from Oklahoma |
| 78 | Soil Sample 2 from Oklahoma |
| 79 | Soil Sample 3 from Oklahoma |
| 80 | Soil Sample 4 from Oklahoma |
| 81 | Soil Sample 5 from Oklahoma |
| 82 | Soil Sample 6 from Oklahoma |
| 83 | Soil Sample 7 from Oklahoma |
| 84 | Soil Sample 8 from Oklahoma |
| 85 | Soil Sample 9 from Oklahoma |
| 86 | Soil Sample 10 from Oklahoma |
| 87 | Soil Sample 11 from Oklahoma |
| 88 | Soil Sample 12 from Oklahoma |
| 89 | Soil Sample 13 from Oklahoma |
| 90 | Soil Sample 14444 from Oklahoma |
| 91 | Leaf of Pine (New) |
| 92 | Leaf of Pine (Old) |
| 93 | Sample 1 of Surface from Railroad Valley—Playa |
| 94 | Sample 2 of Surface from Railroad Valley—Playa |
| 95 | Sample 3 of Surface from Railroad Valley—Playa |
| 96 | Sample 4 of Surface from Railroad Valley—Playa |
| 97 | Sample 5 of Surface from Railroad Valley—Playa |
| 98 | Sample 6 of Surface from Railroad Valley—Playa |
| 99 | Sample 7 of Surface from Railroad Valley—Playa |
| 100 | Sample 8 of Surface from Railroad Valley—Playa |
| 101 | Sample 9 of Surface from Railroad Valley—Playa |
| 102 | Sample 10 of Surface from Railroad Valley—Playa |
| 103 | Powder Sample 1 from Railroad Valley |
| 104 | Powder Sample 2 from Railroad Valley |
| 105 | Seawater—Emissivity Averaged Over 18 Sets (Goleta) |
| 106 | Seawater—Emissivity Averaged Over 18 sets (Goleta) |
| 107 | Seawater—Emissivity Averaged Over 10 sets |
| 108 | Leaf of Shiny Xylosma (xylosma corgostum) |
| 109 | Sliced Santa Barbara Sandstone |
| 110 | Emissivity of Salty Soil (Averaged over 9 Sets) |
| 111 | Soil Sample 1 (Page, Arizona) |
| 112 | Soil Sample 2 (Page, Arizona) |
| 113 | Soil Sample 3 (Page, Arizona) |
| 114 | Soil Sample 4 (Page, Arizona) |
| 115 | Soil Sample 5—Non Productive Vegetation (Page, Arizona) |
| 116 | Soil Sample 6 (Page, Arizona) |
| 117 | Soil Sample 7—Hard Pan, Fractured Somewhat (Page, Arizona) |
| 118 | Soil Sample 8—Hard Pan, Ground (Page, Arizona) |
| 119 | Soil Sample 9—Hard Pan, Ground (Page, Arizona) |
| 120 | Sample 1—Emissivity of Ice Snow—Average of 3 Sets (Mammoth Lakes) |
| 121 | Sample 2—Emissivity of Ice Snow (Mammoth Lakes) |
| 122 | Leaf of Sweet Gum (liquidamber styreciflua) |
| 123 | Leaf of Tasmanian Bluegum Eucalyptus (Eucalyptus Globulus) |
The shaded rows indicate the selected 42 desert-related sample.
References
- Guan, X.; Yang, L.; Zhang, Y.; Li, J. Spatial distribution, temporal variation, and transport characteristics of atmospheric water vapor over Central Asia and the arid region of China. Glob. Planet. Chang. 2019, 172, 159–178. [Google Scholar] [CrossRef]
- Bauer, P.; Thorpe, A.; Brunet, G. The quiet revolution of numerical weather prediction. Nature 2015, 525, 47–55. [Google Scholar] [CrossRef] [PubMed]
- Karimian, H.; Li, Q.; Li, C.; Fan, J.; Gong, C.; Jin, L.; Mo, Y. Daily Estimation of Fine Particulate Matter Mass Concentration through Satellite Based Aerosol Optical Depth; ISSC: Paris, France, 2017. [Google Scholar]
- Li, J.; Wang, P.; Han, H.; Li, J.; Zheng, J. On the assimilation of satellite sounder data in cloudy skies in numerical weather prediction models. J. Meteorol. Res. 2016, 30, 169–182. [Google Scholar] [CrossRef]
- Ma, Y.; Mamtimin, A.; Zhang, G. Observation error diagnostics and applicability evaluation of MHS brightness temperatures in RMAPS-CA. Int. J. Remote Sens. 2021, 42, 5626–5647. [Google Scholar] [CrossRef]
- Eyre, J.R.; English, S.J.; Forsythe, M. Assimilation of satellite data in numerical weather prediction. Part I: The early years. Q. J. R. Meteor. Soc. 2020, 146, 49–68. [Google Scholar] [CrossRef]
- Eyre, J.R.; Bell, W.; Cotton, J.; English, S.J.; Forsythe, M.; Healy, S.B.; Pavelin, E.G. Assimilation of satellite data in numerical weather prediction. Part II: Recent years. Q. J. R. Meteor. Soc. 2022, 148, 521–556. [Google Scholar] [CrossRef]
- Xue, J. Scientific issues and perspective of assimilation of meteorological satellite data. Acta Sin. 2009, 67, 903–911. [Google Scholar] [CrossRef]
- McNally, A.P.; Watts, P.D.; Smith, J.A.; Engelen, R.; Kelly, G.A.; Thépaut, J.N.; Matricardi, M. The assimilation of AIRS radiance data at ECMWF. Q. J. R. Meteor. Soc. 2006, 132, 935–957. [Google Scholar] [CrossRef]
- Marshall, L.; Jung, J.; Derber, J.; Chahine, M.; Treadon, R.; Lord, S.; Goldberg, M.; Wolf, W.; Liu, H.; Joiner, J. Improving global analysis and forecasting with AIRS. Bull. Am. Meteorol. Soc. 2006, 87, 891–894. [Google Scholar] [CrossRef]
- Jin, M.; Liang, S. An improved land surface emissivity parameter for land surface models using global remote sensing observations. J. Clim. 2006, 19, 2867–2881. [Google Scholar] [CrossRef]
- Li, Z.; Li, J.; Li, Y.; Zhang, Y.; Schmit, T.J.; Zhou, L.; Goldberg, M.D.; Menzel, W.P. Determining diurnal variations of land surface emissivity from geostationary satellites. J. Geophys. Res. Atmos. 2012, 117, D2330. [Google Scholar] [CrossRef]
- Pavelin, E.G.; Candy, B. Assimilation of surface-sensitive infrared radiances over land: Estimation of land surface temperature and emissivity. Q. J. R. Meteorol. Soc. 2014, 140, 1198–1208. [Google Scholar] [CrossRef]
- Li, Z.; Li, J.; Jin, X.; Schmit, T.J.; Borbas, E.E.; Goldberg, M.D. An objective methodology for infrared land surface emissivity evaluation. J. Geophys. Res. Atmos. 2010, 115, D2230. [Google Scholar] [CrossRef]
- Lin, P.; Chen, Y.; Chen, C.; Liu, C.; Chen, C. Numerical experiments investigating the orographic effects on a heavy rainfall event over the northwestern coast of Taiwan during TAMEX IOP 13. Meteorol. Atmos. Phys. 2011, 114, 35–50. [Google Scholar] [CrossRef]
- Yang, K.; Watanabe, T.; Koike, T.; Xin, L.; Fujii, H.; Tamagawa, K.; Yaoming, M.; Ishikawa, H.; Koike, T. Auto-calibration system developed to assimilate AMSR-E data into a land surface model for estimating soil moisture and the surface energy budget. J. Meteorol. Soc. Jpn. Ser. II 2007, 85A, 229–242. [Google Scholar] [CrossRef]
- Stathopoulou, M.; Cartalis, C.; Petrakis, M. Integrating corine land cover data and landsat tm for surface emissivity definition: Application to the urban area of athens, Greece. Int. J. Remote Sens. 2007, 28, 3291–3304. [Google Scholar] [CrossRef]
- Hulley, G.; Veraverbeke, S.; Hook, S. Thermal-based techniques for land cover change detection using a new dynamic MODIS multispectral emissivity product (MOD21). Remote Sens. Environ. 2014, 140, 755–765. [Google Scholar] [CrossRef]
- Cai, J.; Zhang, Y.; Li, Y.; Liang, X.; Jiang, T. Analyzing the characteristics of soil moisture using gldas data: A case study in eastern China. Appl. Sci. 2017, 7, 566. [Google Scholar] [CrossRef]
- Vogel, R.L.; Liu, Q.; Han, Y.; Weng, F. Evaluating a satellite-derived global infrared land surface emissivity data set for use in radiative transfer modeling. J. Geophys. Res. Atmos. 2011, 116, D0810. [Google Scholar] [CrossRef]
- Borbas, E.; Hulley, G.; Feltz, M.; Knuteson, R.; Hook, S. The combined ASTER MODIS emissivity over land (camel) part 1: Methodology and high spectral resolution application. Remote Sens. 2018, 10, 643. [Google Scholar] [CrossRef]
- Shao, H.; Liu, C.; Li, C.; Wang, J.; Xie, F. Temperature and emissivity inversion accuracy of spectral parameter changes and noise of hyperspectral thermal infrared imaging spectrometers. Sensors 2020, 20, 2109. [Google Scholar] [CrossRef] [PubMed]
- Wan, Z.; Li, Z.-L. A physics-based algorithm for retrieving land-surface emissivity and temperature from EOS/MODIS data. IEEE Trans. Geosci. Remote Sens. 1997, 35, 980–996. [Google Scholar] [CrossRef]
- Seemann, S.W.; Borbas, E.E.; Knuteson, R.O.; Stephenson, G.R.; Huang, H. Development of a global infrared land surface emissivity database for application to clear sky sounding retrievals from multispectral satellite radiance measurements. J. Appl. Meteorol. Clim. 2008, 47, 108–123. [Google Scholar] [CrossRef]
- English, S.J.; Renshaw, R.J.; Dibben, P.C.; Smith, A.J.; Rayer, P.J.; Poulsen, C.; Saunders, F.W.; Eyre, J.R. A comparison of the impact of TOVS and ATOVS satellite sounding data on the accuracy of numerical weather forecasts. Q. J. R. Meteorol. Soc. 2000, 126, 2911–2931. [Google Scholar] [CrossRef]
- Hulley, G.C.; Hook, S.J.; Abbott, E.; Malakar, N.; Islam, T.; Abrams, M. The ASTER global emissivity dataset (aster ged): Mapping earth’s emissivity at 100 meter spatial scale. Geophys. Res. Lett. 2015, 42, 7966–7976. [Google Scholar] [CrossRef]
- Feltz, M.; Borbas, E.; Knuteson, R.; Hulley, G.; Hook, S. The combined aster and modis emissivity over land (camel) global broadband infrared emissivity product. Remote Sens. 2018, 10, 1027. [Google Scholar] [CrossRef]
- Liu, Y.; Ali, M.; Huo, W.; Yang, X.; Liu, X.; Meng, X.; He, Q. Estimation of the land surface emissivity in the hinterland of Taklimakan Desert. J. Mt. Sci. 2014, 11, 1143–1151. [Google Scholar] [CrossRef]
- Korb, A.R.; Dybwad, P.; Wadsworth, W.; Salisbury, J.W. Portable Fourier transform infrared spectroradiometer for field measurements of radiance and emissivity. Appl. Opt. 1996, 35, 1679–1692. [Google Scholar] [CrossRef]
- Li, H.; Liu, Z.; Mamtimin, A.; Liu, J.; Liu, Y.; Ju, C.; Zhang, H.; Gao, Z. A new linear relation for estimating surface broadband emissivity in arid regions based on FTIR and MODIS products. Remote Sens. 2021, 13, 1686. [Google Scholar] [CrossRef]
- Hapke, B. Introduction to the Theory of Reflectance and Emittance Spectroscopy; Cambridge University Press: New York, NY, USA, 1993. [Google Scholar]
- Hook, S.J.; Kahle, A.B. The micro fourier transform interferometer (μFTIR)—A new field spectrometer for acquisition of infrared data of natural surfaces. Remote Sens. Environ. 1996, 56, 172–181. [Google Scholar] [CrossRef]
- Masiello, G.; Serio, C.; De Feis, I.; Amoroso, M.; Venafra, S.; Trigo, I.F.; Watts, P. Kalman filter physical retrieval of surface emissivity and temperature from geostationary infrared radiances. Atmos. Meas. Tech. 2013, 6, 3613–3634. [Google Scholar] [CrossRef]
- Francois, C.; Ottle, C.; Prevot, L. Analytical parametrisation of canopy emissivity and directional radiance in the thermal infrared: Application on the retrieval of soil and foliage temperatures using two directional measurements. Int. J. Remote Sens. 1997, 12, 2587–2621. [Google Scholar] [CrossRef]
- McAtee, B.K.; Prata, A.J.; Lynch, M.J. The angular behavior of emitted thermal infrared radiation (8–12 μm) at a semiarid site. J. Appl. Meteorol. 2003, 42, 1060–1071. [Google Scholar] [CrossRef]
- Ermida, S.; Trigo, I.; DaCamara, C.; Pires, A. A methodology to simulate lst directional effects based on parametric models and landscape properties. Remote Sens. 2018, 10, 1114. [Google Scholar] [CrossRef]
- Pérez-Planells, L.; Niclòs, R.; Valor, E.; Göttsche, F.-M. Retrieval of Land Surface Emissivities Over Partially Vegetated Surfaces From Satellite Data Using Radiative Transfer Models. IEEE Trans. Geosci. Remote Sens. 2022, 60, 1–21. [Google Scholar] [CrossRef]
- Weng, F. Advances in Radiative Transfer Modeling in Support of Satellite Data Assimilation. J. Atmos. Sci. 2009, 64, 3799. [Google Scholar] [CrossRef]
- Torresani, M.; Masiello, G.; Vendrame, N.; Gerosa, G.; Falocchi, M.; Tomelleri, E.; Serio, C.; Rocchini, D.; Zardi, D. Correlation analysis of evapotranspiration, emissivity contrast, and water deficit indices: A case study in four eddy covariance sites in italy with different environmental habitats. Land 2022, 11, 1903. [Google Scholar] [CrossRef]
Disclaimer/Publisher’s Note: The statements, opinions and data contained in all publications are solely those of the individual author(s) and contributor(s) and not of MDPI and/or the editor(s). MDPI and/or the editor(s) disclaim responsibility for any injury to people or property resulting from any ideas, methods, instructions or products referred to in the content. |
© 2023 by the authors. Licensee MDPI, Basel, Switzerland. This article is an open access article distributed under the terms and conditions of the Creative Commons Attribution (CC BY) license (https://creativecommons.org/licenses/by/4.0/).