Article

Combined Modification of Urbanization and Monsoon in Meiyu Precipitation Changes in the Megacity Shanghai, China

1
Key Laboratory of Cities’ Mitigation and Adaptation to Climate Change in Shanghai, Shanghai Regional Climate Center, Shanghai 200030, China
2
Shanghai Typhoon Institute, China Meteorological Administration, Shanghai 200030, China
3
Shanghai Jiading District Meteorological Bureau, Shanghai 201800, China
*
Author to whom correspondence should be addressed.
Land 2023, 12(6), 1216; https://doi.org/10.3390/land12061216
Submission received: 7 May 2023 / Revised: 4 June 2023 / Accepted: 5 June 2023 / Published: 12 June 2023

Abstract

:
The Meiyu season is a typical rainy season in East Asia that is controlled by summer monsoon. Despite extensive research on its impact, it is unclear how urbanization modifies precipitation during the Meiyu season in the background of the monsoon influence. To address this gap, this study investigated the effects of urbanization and monsoon on the modification of precipitation during the Meiyu season (PDM) in the megacity of Shanghai, China. Through homogenization analysis of the original observational data, we assessed the temporal and spatial variation in PDM in Shanghai during two stages of urbanization. Our findings revealed that both total precipitation and extreme daily precipitation during the Meiyu season in Shanghai have significantly increased since 1961. The spatial heterogeneity of PDM has also enhanced during the rapid urban process that has occurred since 1986. The long-term trend of increasing precipitation in Shanghai showed a synchronous variation with the East Asian subtropical summer monsoon (EASM) in 1961–2021. Over the interannual time scale, the significant positive correlation between PDM and EASM during the slow urbanization period (Stage 1: 1961–1985) changed to a non-significant correlation during the rapid urbanization period (Stage 2: 1986–2021), which was associated with the enhanced convective precipitation in Shanghai during the Meiyu season. Urbanization induced more convective precipitation and further weakened the association between PDM and EASM over the central city and nearby areas during Stage 2. The rapid urbanization process also resulted in increased differences in near-surface wind between urban and non-urban areas, which facilitated more PDM over the central city due to the urban friction effect and wind shear in Stage 2. Furthermore, our analysis suggests that the increase in precipitation may be associated with the enhanced coupling of cold air intrusion with the warmer climate background due to the urban heat effect occurring in Stage 2. These findings contribute to a better understanding of how urbanization and monsoons affect PDM in East Asian megacities and serve as a unique reference for climate prediction in this region.

1. Introduction

Meiyu is a major rainy season controlled by East Asian summer monsoon [1,2,3]. It usually refers to the persistent precipitation in June–July in the Yangtze River–Huaihe River Basin in China, South and Central Japan, and South Korea [4]. It is also called Baiu in Japan and Changma in South Korea [5,6]. Different from South Asian summer monsoon precipitation, the East Asian Meiyu is a product of the interaction between warm summer monsoon from low latitudes and cold air intrusions from middle to high latitudes [1,3,7,8,9,10]. Besides the natural variabilities associated with both the external forcing, including El Niño–Southern Oscillation (ENSO [11,12]), Atlantic Multidecadal Oscillation (AMO [13]), Pacific Decadal Oscillation (PDO [14]), and internal processes like Madden-Julian oscillation (MJO [3,15,16]) as well as North Atlantic Oscillation (NAO [17]), the precipitation during East Asian Meiyu season (hereafter referring to June–July) is also impacted by global warming, urbanization, and aerosol effects [4].
With the expansion of urbanization across the globe, urban-rainfall modification has been reported in several studies [18,19,20,21,22,23,24,25]. Even though it is well known that urbanization can affect precipitation, studies varied based on the climate regime and the geographical locations of different cities [20,26,27]. In North China, the rapid urban expansion in Beijing was statistically correlated with summer rainfall reduction in the northeastern areas of the city since 1981 [20]. However, it had a positive effect on the changes in precipitation in autumn [28]. Obvious rain island effects can also be found in both the frequency of catastrophic storms above 100 mm [29] and the intensity of low-temperature rain and snow events in Beijing [30]. For eastern China, a larger precipitation frequency over urban areas took place in Nanjing and a significant enhancement of precipitation occurred in the downwind region of the city in the afternoon [31]. The spatial distribution of the storm frequency in Shanghai and its changing trend presented significant attributes of urban rain-island during its rapid urbanization process [21]. The heavy rainfall days also increased due to urbanization in Guangzhou [32]. The increase in precipitation mainly occurred downwind of the city belt in short-term rainstorm processes in the Yangtze River Delta [33]. Recent studies [24,27] have proved the consistency in spatial distributions of short-duration heavy precipitation with the heat island centers in megacities (Beijing, Shanghai) or city clusters [4,34,35,36]. However, the urban-rainfall modifications in different weather systems are not clear.
Some studies provided evidences that heavy rainfall over monsoon regions is a signature of urban-induced rainfall anomalies. For the Indian monsoon region, urban areas experienced fewer occurrences of light rainfall and significant higher occurrences of intense precipitation compared with nonurban regions during the monsoon season [37]. The rainfall islands parallel to the urban heat islands were also likely seen as coupled monsoon-urban induced effects under the weakened synoptic regime evidenced through monsoon low-level jet over Delhi, India [38]. In East Asian monsoon region, Meiyu is the major rainy season influenced by large-scale monsoon systems. However, the urban effect on rainfall during the Meiyu season is not clear and its related studies are rare. Using climate models, Ma and Zhang [39] studied the impact of urban expansion on large-scale precipitation by taking Meiyu as an example and showed decreased (increased) Meiyu precipitation over the Yangtze River (Huaihe River) basin. Quan et al. [40] suggested that precipitation increased significantly to the south of the Yangtze River due to large-scale urbanization-induced circulation changes. The results of model simulations are rather divergent and large uncertainty exists in assessing the urbanization effects due to differences in the choice of models. Shanghai is located in the lower reach of the Yangtze River Basin of China and is characterized by a distinct subtropic monsoon climate with Meiyu seasons. Shanghai is one of the largest megacities in China and has been experiencing rapid urbanization. It is interesting to evaluate the urbanization-monsoon modification in the PDM by taking the megacity Shanghai as a typical example.
In the present study, we examine the combined modifications of urbanization and monsoon in the change of PDM in Shanghai in 1961–2021. The study focuses on the following three topics: (a) the long-term changes in PDM associated with urbanization; (b) the monsoon influences associated with the long-term change of the PDM and (c) the urbanization effects on the changes in PDM during the two urbanization processes. Various observational and reanalysis products, as well as methods, are described in Section 2. The urbanization process in Shanghai and the homogenization test of PDM are presented in Section 3, and the impacts of monsoon and urbanization on variations in PDM are discussed in Section 4 and Section 5, respectively. A summary and discussion are given in Section 6.

2. Materials and Methods

2.1. Data

Daily precipitation records were collected at Xujiahui (XJH) station from 1874 to 2021 and quality-controlled by Shanghai Meteorological Information Center (SMIC), Shanghai Meteorological Bureau. Daily observations, including precipitation, 2 m surface air temperature (SAT), and 10 m wind in 1961–2021, and the observational hourly precipitation in 1981–2021 were adopted from SMIC to investigate the spatial distribution of meteorological factors in Shanghai. The locations of the 11 basic stations in Shanghai are shown in Figure 1a. Related metadata of the observation history in Shanghai since 1874 and the Meiyu precipitation data in the Middle and Lower Reaches of the Yangtze River from 1885 to 2000 [41] were applied to check the homogeneity of the PDM series in Shanghai. The urbanization factors, including annual population density and paved road area in Shanghai from 1961 to 2021, were acquired from Shanghai Bureau of Statistics (https://tjj.sh.gov.cn/tjnj/index.html, accessed on 10 November 2022) to investigate the urbanization process.
Monthly atmospheric and precipitation reanalysis data from 1961 to 2021, with a 2.5° × 2.5° horizontal resolution, were downloaded from the National Center for Environmental Prediction (NCEP)/National Center for Atmospheric Research (NCAR) Reanalysis (NCEP/NCAR) [42] (https://psl.noaa.gov/data/gridded/data.ncep.reanalysis.html, accessed on 15 December 2022). NCEP reanalysis is not sensitive to urbanization or land-use effects [43] because surface observations over land are not used in the reanalysis [44]. Therefore, the precipitation and its associated atmospheric reanalysis from the NCEP/NCAR were adopted to investigate the impact of urbanization on Meiyu precipitation by comparing it with the surface observations.

2.2. Methods

Homogenization tests of precipitation datasets may be more reliable than the originals for urbanization impact analysis [45]. In the homogenization analysis of the PDM series, the extended version of Penalized Maximal F-test (PMF [46]), i.e., the “PMFred” algorithm [47] in the RHtestV5 software package was adopted to detect the possible change points without a reference series. Since Meiyu is a phenomenon influenced by the large-scale monsoon circulation, the Meiyu data in the Middle and Lower Reaches of the Yangtze River [41] was adopted as a reference series to check the homogeneity of Meiyu precipitation in Shanghai using the Penalized Maximal T-test (PMT) [48] in the RHtestV5 software package. All homogeneity tests in this study were analyzed at the 0.05 significance level.
Both impervious land cover [49,50] and population density were used to identify urban stations in order to decrease the uncertainty due to a single criterion. Following Liang and Ding [24] and Ma et al. [51], the urban stations were defined as having population densities above 3000 km−2 and an impervious fraction ≥0.5 in their surroundings, with a circular area of 10 km2 (i.e., a radius of 1.785 km).
East Asian Subtropical Summer Monsoon Index (ESMI) was computed to investigate the impact of the summer monsoon on PDM. It was calculated as the anomaly of the difference in meridional moisture transport between South China and North China [52]. Positive (negative) ESMI corresponds to a strong (weak) subtropical summer monsoon. The ESMI had a significantly positive correlation with the summer rainfall over the middle and lower reaches of the Yangtze River, especially during the Meiyu season. According to Liang et al. [3], the correlation coefficient between the ESMI and PDM over the middle and lower reaches of the Yangtze River was 0.62 above the 0.01 significance level in the last 40 years (1979–2018).
Ensemble Empirical Mode Decomposition (EEMD [53]) was adopted to obtain the components of PDM over different time scales. EEMD is adaptive and derives optimal frequencies for decomposing data from the data itself, which provides a natural filter to separate components of different timescales [54]. The specific steps can be referred to Liang et al. [55].
Spatially normalized precipitation was used to investigate the spatial differences in the precipitation in Shanghai. It is calculated as follows [21]:
psn,i = (pipa)/σs,
where i denotes the number of the observational station; pi and psn,i are the original and the spatially normalized precipitation respectively; pa and σs represent the spatial average and the standard deviation of precipitation at multi-stations respectively.

3. Urbanization Process in Shanghai and Precipitation Homogenization Test

3.1. Urbanization History in Shanghai

As a coastal megacity in the estuary of the Yangtze River Delta, Shanghai has experienced rapid urbanization since the 1980s. Figure 1a shows the start years when the different observational stations in Shanghai were identified to be urbanized based on population densities ≥ 3000 km−2 and impervious fractions ≥ 0.5. This suggests that urbanization has gradually expanded from the central city (XJH station) to the near suburbs since 1986. There were six urban stations and five nonurban stations in Shanghai in 2021. Pudong (PD) station was the second station urbanized in 2000, followed by Minhang (MH) and Baoshan (BS) in 2008, and Jiading (JD) and Songjiang (SJ) in 2010 and 2021, respectively. Therefore, the urbanization period in Shanghai since 1961 may be divided into the slow urbanization period (1961–1985, hereafter referred to as Stage 1) and the rapid urbanization period (1986–2021, hereafter referred to as Stage 2).
Urbanization is accompanied by increased population density, areas of built roads, etc. As can be seen in Figure 1b, both the population density and the area of paved road in Shanghai has increased steeply since the middle 1980s. The population density and the area of paved roads have been accelerated at 14.9 × 10²/km2/year and 89.4 × 10⁶ m2/year, respectively in Stage 2 (1986–2021), in sharp contrast to the slow urbanization period (Stage 1, i.e., 1961–1985).

3.2. Homogenization Test of Precipitation Series

The PMF test, without a reference series, was used to test homogenization in the PDM series at XJH since the records began in 1874. As shown in Figure 2a, no change point was identified in the precipitation series at XJH during the Meiyu season. Since Meiyu over the middle and lower reaches of the Yangtze River is a large-scale phenomenon influenced by the Asian monsoon system, Meiyu precipitation over the middle and lower reaches of the Yangtze River was also used as a reference series of Meiyu precipitation at XJH. No change point of the Meiyu precipitation series at XJH was identified based on the PMT test by using the reference series (Figure 2b). Therefore, it can be inferred that the precipitation series at XJH during the Meiyu season may be homogeneous based on a century scale. In addition to XJH, similar results were obtained from homogenization tests carried out on the observational precipitation series data collected at the other 10 stations since 1961. By taking the average precipitation series of the 11 stations in Shanghai as an example, no change point was identified based on the PMF test (Figure 2c). Therefore, the original precipitation observations in Shanghai during the Meiyu season can be viewed as homogeneous.

4. Long-Term Changes in PDM Associated with Urbanization

Figure 3 shows the variation in total precipitation and extreme daily precipitation at XJH during the Meiyu seasons in 1874–2021. The annual extreme daily precipitation is defined as the average of the 5% heaviest daily records during the Meiyu season in every year. It can be clearly seen that both total precipitation and extreme daily precipitation exhibited significant (above 0.01 significance level) increasing trends from 1961, while no distinct trends were observed in 1874–1960. The trends of increase in both the total precipitation and extreme daily precipitation at XJH since 1961 are consistent with the trend of increased warming at XJH [55], which is associated with the increase in water vapor based on the Clausius-Clapeyron Equation [56].
In order to investigate the spatial differences in the Meiyu rainfall in Shanghai, Figure 4a,b shows the average PDM during the two urbanization stages in Shanghai. Compared with Stage 1 (the slow urban process, Figure 4a), the increase in PDM varies from 71 mm to 111.8 mm in Shanghai during the rapid urban process (Stage 2, Figure 4b). Meanwhile, the spatial distribution of the PDM transformed from the south-north mode in Stage 1 to the distinct urban island mode in Stage 2. The spatial standard deviation of PDM exhibited a trend of significant (above 0.01 significance level) increase accompanying the increase in PDM in Shanghai (Figure 4c). On average, the spatial standard deviation increased by about 52% in Stage 2 compared with Stage 1. In other words, spatial heterogeneity in PDM increased with the strengthening of PDM during the rapid urban process, with more PDM concentrated in the central urban city.
Further analysis found that the increase in strong convection events (i.e., hourly precipitation greater than 20 mm) contributed to the PDM during Stage 2. As shown in Figure 5a,b, two strong convection events per year usually occurred in Stage 2, with an increase of 50% compared with that in Stage 1. For the spatial distribution (Figure 5c,d), the large value regions of both the frequency and the normalized precipitation of strong convection events transferred from the southeast part of Shanghai in Stage 1 to the central city including XJH and PD stations in Stage 2. In other words, the strong convections during the Meiyu season also exhibited distinct characteristics of urban rain island distribution during the rapid urbanization process.

5. Influence of Monsoon on PDM during Two Different Urbanization Processes

Meiyu over the Yangtze River, including in Shanghai, is strongly influenced by the East Asian subtropical summer monsoon (EASM). What is the impact of the EASM on the PDM in accompanying the development of urbanization in Shanghai? EEMD was adopted to isolate variabilities in the PDM and EASM index (EASMI) at different timescales during the Meiyu seasons in 1961–2021. The long-term trend and interannual components are shown in Figure 6a,b respectively. It can be clearly seen that the long-term trend component of the PDM has a variation that is synchronous with that of the EASM, with their correlation coefficient as high as 0.91 (Figure 6a). Note that the trend of EEMD is nonlinear [53]. The trend of decreasing (increasing) PDM in Shanghai occurred before (after) the mid-1980s, and the amplitude of the trend varied over different periods. The case is similar to the variation in the trend of the EASM. The PDM in Shanghai showed stable increasing trend with the increase of EASM in 1961–2021. It reflects the regional influence of the EASM on PDM at the long-term scale. For the interannual variability, a distinct change took place in the relationship between the PDM in Shanghai and EASM. As shown in Figure 6b, the significant positive correlation (correlation coefficient 0.59 above 0.01 significance level) between the PDM and EASM during Stage 1 changed to a nonsignificant correlation (correlation coefficient 0.24) during Stage 2. This suggests that the relationship between EASM and PDM at the interannual time scale distinctively weakened during the rapid urbanization process.
The interannual component of the reanalyzed precipitation in Shanghai was also adopted to investigate the relationship between two kinds of precipitation (large-scale precipitation and convective precipitation) in PMD with EASM. As shown in Table 1, in Stage 1, both total precipitation during the Meiyu season and its large-scale precipitation component had a significant positive correlation with EASM, while the convective precipitation was not correlated with EASM. The contrary was true in Stage 2, i.e., both total precipitation and the large-scale precipitation component had no significant correlation with EASM. However, the convective precipitation component had a significant relationship with EASM in Stage 2. In other words, in the background of rapid urbanization, the PMD associated with EASM exhibited more convective properties. It may be associated with enhanced atmospheric instability and moisture transportation over Shanghai [24]. The conversion of the precipitation property from large-scale to convective may contribute to the weakening of the relationship between PDM and EASM at the interannual scale.
The spatial distributions of the correlation coefficients between the PDM and EASM during the two stages of urbanization are shown in Figure 7. During Stage 1, with no urban stations, the correlations between PDM and EASM were significant at all stations in Shanghai. However, the significant correlation area was restricted to the northern part (JD, BS, and CM stations) and the southern part (FX station) of Shanghai in Stage 2. The relationship between the PDM and EASM over the central city and nearby suburbs (XJH, PD, MH, and SJ stations) distinctively weakened during Stage 2. This suggests that urbanization effects further weakened the association between PDM and EASM, in addition to the above-mentioned influence of regional convective rainfall at the inter-annual scale.

6. Effects of Urbanization on PDM in Two Different Urbanization Processes

The urban heat island is a well-known urbanization effect. How does the urban heat effect impact PDM? Figure 8 shows the average 2 m surface air temperature (SAT) during the Meiyu season, and its correlation coefficients with the PDM in Shanghai during the rapid urbanization process (Stage 2). Similar to Stage 1 (figure omitted), the PDM is negatively correlated with the SAT during the Meiyu season when the Meiyu usually occurs under the persistent interaction of cold air intrusion and warm air transported by the Asian monsoon. Meanwhile, the coupling of SAT and PDM was strengthened in Stage 2, with an average correlation coefficient of −0.48 between them. The coupling of temperature and PDM further increased over the urban area. As shown in Figure 8, the negative correlations were most significant in the central urban areas (XJH). For the spatial difference in Shanghai, the negative coupling between SAT and PDM was significantly correlated with the average SAT in Shanghai, with a correlation coefficient of −0.67 above the 0.01 significance level). In other words, over the stations with warmer climate backgrounds impacted by the urban heat effect, more PDM occurred when cold air intrusion interacted with the monsoon. This may be associated with more initial water vapor stored in the warmer environment.
Urban friction effect also exerts an impact on precipitation during the Meiyu season. Figure 9a,b shows the spatial distribution of the 10 m wind speed in Shanghai during the Meiyu season in Stage 1 and 2 respectively. It can be clearly seen that the wind speeds were generally decreased in Shanghai during the Meiyu season under the background of fast urbanization compared with Stage 1. Thereinto, the wind speeds were decreased by 1.3 m/s (accounting for 40% of that in Stage 1) at XJH and PD stations over the central city in Stage 2. The amplitude of the weakening of the wind speed was the smallest at the nonurban JS station over the southern suburb of Shanghai. Meanwhile, the urban weak wind phenomenon was obvious over the central city and nearby area in Stage 2, while the relatively weak wind was mainly located over the downwind direction of Shanghai in Stage 1. The urban weak wind distribution was consistent with the urban rainfall island phenomena in both the total PDM (Figure 4b) and its strong convection components (Figure 5b,d). Further analysis shows that the correlation coefficient of the spatial normalized PDM and the wind speed during the Meiyu season in Shanghai was −0.55 and −0.62 in Stage 1 and Stage 2, respectively. This means that the smaller near-surface wind speed, the more PDM in both Stages 1 and 2. Additionally, the rapid urbanization in Stage 2 can contribute to the increased PDM due to the urban friction effect and its related convergence condition.
Figure 10 further shows the wind-rose diagrams of the typical urban (XJH) and nonurban (JS) stations during the two stages. There was little change in the near-surface wind at JS station (nonurban station) during the Meiyu seasons from Stage 1 to Stage 2 (Figure 10b). However, there was an obvious change observed at XJH station with the change from the unurbanized process to the urbanized process. As can be seen in Figure 10a, more quiet wind occurred, and less prevalent wind took place during the urbanized process. By combing Figure 9 and Figure 10, the enhanced difference in both wind speed and direction between the urban station and the outskirt nonurban areas was favorable for the wind shear and its associated rainfall over the central city of Shanghai during the Meiyu season in the rapid urbanization stage.

7. Discussion and Summary

Based on the homogenization test of precipitation in Shanghai, we evaluated the combined impact of urbanization and monsoon on precipitation in Shanghai during the Meiyu season (PDM) by analyzing two different urbanization processes in 1961–2021.
Using the homogenization tests, we confirmed the observational PDM series at the XJH station (over a century) and 10 other stations (since 1961) to be homogeneous. For the long-term change, both total precipitation and extreme daily precipitation during the Meiyu season have significantly increased in Shanghai since 1961. During the rapid urbanization process since 1986, the spatial heterogeneity of PDM has increased with the strengthening of PDM. More PDM is concentrated in the central urban city. Additionally, the strong convection occurring during the Meiyu season has also exhibited an urban rain island distribution throughout the rapid urbanization process.
The long-term increasing trend of PDM shows synchronization with that of the EASM in 1961–2021, demonstrating the influence of EASM on PDM at a regional scale. However, at the interannual time scale, the significant positive correlation between PDM and EASM has changed to a nonsignificant correlation from the slow urbanization process (Stage 1) to the rapid urbanization process (Stage 2). More convective precipitation may contribute to the weakening of the relationship at the interannual time scale.
In the background of rapid urbanization, the urbanization effect may further weaken the association between PDM and EASM over the central city and nearby areas in Shanghai by inducing more convective precipitation. Furthermore, impacted by the urban heat effect in Stage 2, more PDM over the central city and nearby areas in Shanghai is associated with the enhanced coupling of cold air intrusion with the warmer climate background. In addition, the rapid urbanization enhanced the difference in the near-surface wind between the urban station and the outskirt nonurban areas, which facilitated more PDM over the central city of Shanghai by way of increasing wind shear.
As pointed out by Liang et al. [55], a notable inhomogeneous change point in SAT at XJH station occurred in 1954 due to the change of observation schedule in 1954. The observations of precipitation at XJH changed from four times at 1, 7, 13, and 19 o’clock (Beijing time, also hereinafte) per day in 1954–1960 to 2, 8, 14, and 20 o’clock per day after 1960. The homogenization of the daily precipitation record may be influenced by the change of the observation schedule. Due to lack of observations of hourly rainfall before 1980, two random resampling based on the hourly precipitation observed since 1981 were calculated according to the above two different daily observation schedules. It was found that the extreme daily precipitation may be influenced by the observation schedules. By using the observations at 1, 7, 13, and 19 o’clock per day, the extreme daily precipitation defined by the 99.5% percentile during the Meiyu season may be generally underestimated by about 0.8 mm. Considering the small amplitude in the extreme daily precipitation deviation caused by the change of the observation schedule, the long-term change of the extreme daily precipitation in this paper is reasonable.
Besides the thermal and dynamic impact of urbanization on the PDM described in this study, the aerosol effects associated with urbanization may also exert influences on the change in PDM. Jung et al. [57] pointed out that aerosols exerted significant indirect effects in mid-and low-level clouds, resulting in an increase in the cloud particle radius and enhanced precipitation intensity during the Meiyu period in the Yangtze-Huaihe Basin. It is necessary to further study the mechanism of the abnormal activities of Meiyu from the perspective of multi-factor interactions at the multi-scale, including atmospheric chemistry, urbanization, monsoons, and global warming.

Author Contributions

Conceptualization, P.L.; methodology, P.L.; investigation, P.L., Z.Z., W.H., Q.Z. and Y.M.; data curation, W.H. and Q.Z.; writing—original draft preparation, P.L.; writing—review and editing, P.L. and Z.Z. All authors have read and agreed to the published version of the manuscript.

Funding

This research was jointly supported by the National Natural Science Foundation of China (Grant 42175056), the Natural Science Foundation of Shanghai (21ZR1457600), the Shanghai Sailing Program (23YF1440100), the China Meteorological Administration Innovation and Development Project (CXFZ2022J009), the China Meteorological Administration Review Summary Project (FPZJ2023-044), the Open Fund of the Key Laboratory of Cities’ Mitigation and Adaptation to Climate Change in Shanghai, China Meteorological Administration, and the Key Innovation Teams of the China Meteorological Administration (CMA2023ZD03).

Data Availability Statement

Precipitation, 2 m surface air temperature, and 10 m wind observations in Shanghai were obtained from the Shanghai Meteorological Information Center (SMIC), Shanghai Meteorological Bureau. The urbanization factors in Shanghai were obtained from the Shanghai Bureau of Statistics (https://tjj.sh.gov.cn/tjnj/index.html (accessed on 10 November 2022)). Monthly atmospheric and precipitation reanalysis data were downloaded from the National Centers for Environmental Prediction (NCEP)-National Center for Atmospheric Research (NCAR) Reanalysis (NCEP/NCAR) (https://psl.noaa.gov/data/gridded/data.ncep.reanalysis.html (accessed on 15 December 2022)).

Acknowledgments

We thank Zongwei Yan for his thoughtful advice on the homogenization tests, and the reviewers for their suggestions.

Conflicts of Interest

The authors declare no conflict of interest.

References

  1. Tao, S.-Y.; Chen, L.-X. A Review of Recent Research on the East Asian Summer Monsoon in China. In Monsoon Meteorology; Chang, C.P., Krishnamurti, T.N., Eds.; Oxford University Press: Oxford, UK, 1987; pp. 60–92. [Google Scholar]
  2. Ding, Y. Monsoons over China; Atmospheric and Oceanographic Sciences Library; Springer: Dordrecht, The Netherlands, 1994; Volume 16, ISBN 978-94-015-8302-2. [Google Scholar]
  3. Liang, P.; Hu, Z.-Z.; Ding, Y.; Qian, Q. The Extreme Mei-Yu Season in 2020: Role of the Madden-Julian Oscillation and the Cooperative Influence of the Pacific and Indian Oceans. Adv. Atmos. Sci. 2021, 38, 2040–2054. [Google Scholar] [CrossRef]
  4. Ding, Y.; Liang, P.; Liu, Y.; Zhang, Y. Multiscale Variability of Meiyu and Its Prediction: A New Review. J. Geophys. Res. Atmos. 2020, 125, e2019JD031496. [Google Scholar] [CrossRef]
  5. Ninomiya, K.; Muraki, H. Large-Scale Circulations over East Asia during Baiu Period of 1979. J. Meteorol. Soc. Jpn. 1986, 64, 409–429. [Google Scholar] [CrossRef] [Green Version]
  6. Oh, J.-H.; Kwon, W.-T.; Ryoo, S.-B. Review of the Researches on Changma and Future Observational Study (Kormex). Adv. Atmos. Sci. 1997, 14, 207–222. [Google Scholar] [CrossRef]
  7. Ding, Y. Summer Monsoon Rainfalls in China. J. Meteorol. Soc. Jpn. 1992, 70, 373–396. [Google Scholar] [CrossRef] [Green Version]
  8. Ding, Y. Seasonal March of the East Asian Monsoon. In East Asian Monsoon; World Scientific Series on Asia-Pacific Weather and Climate; World Scientific: Singapore, 2004; Volume 2, pp. 3–53. ISBN 978-981-238-769-1. [Google Scholar]
  9. Lau, K.M.; Ding, Y.; Wang, J.-T.; Johnson, R.; Keenan, T.; Cifelli, R.; Gerlach, J.; Thiele, O.; Rickenbach, T.; Tsay, S.-C.; et al. A Report of the Field Operations and Early Results of the South China Sea Monsoon Experiment (SCSMEX). Bull. Amer. Meteor. Soc. 2000, 81, 1261–1270. [Google Scholar] [CrossRef]
  10. Ding, Y.; Liu, Y.; Hu, Z.-Z. The Record-Breaking Mei-Yu in 2020 and Associated Atmospheric Circulation and Tropical SST Anomalies. Adv. Atmos. Sci. 2021, 38, 1980–1993. [Google Scholar] [CrossRef]
  11. Bjerknes, J. A Possible Response of the Atmospheric Hadley Circulation to Equatorial Anomalies of Ocean Temperature. Tellus A Dyn. Meteorol. Oceanogr. 1966, 18, 820–829. [Google Scholar] [CrossRef] [Green Version]
  12. Liang, P.; Hu, Z.Z.; Liu, Y.; Yuan, X.; Li, X.; Jiang, X. Challenges in predicting and simulating summer rainfall in the eastern China. Clim. Dyn. 2019, 52, 2217–2233. [Google Scholar] [CrossRef]
  13. Enfield, D.B.; Mestas-Nuñez, A.M.; Trimble, P.J. The Atlantic Multidecadal Oscillation and Its Relation to Rainfall and River Flows in the Continental U.S. Geophys. Res. Lett. 2001, 28, 2077–2080. [Google Scholar] [CrossRef] [Green Version]
  14. Mantua, N.J.; Hare, S.R.; Zhang, Y.; Wallace, J.M.; Francis, R.C. Pacific Interdecadal Climate Oscillation with Impacts on Salmon Production. Am. Meteorol. Soc. 1997, 78, 1069–1079. [Google Scholar] [CrossRef]
  15. Liang, P.; Lin, H. Sub-seasonal prediction over East Asia during boreal summer using the ECCC monthly forecasting system. Clim. Dyn. 2018, 52, 1007–1022. [Google Scholar] [CrossRef]
  16. Zhu, Z.; Zhou, Y.; Jiang, W.; Fu, S.; Hsu, P. Influence of compound zonal displacements of the South Asia high and the western Pacific. subtropical high on Meiyu intraseasonal variation. Clim. Dyn. 2023, 1–17. [Google Scholar] [CrossRef]
  17. Yan, Y.; Liu, B.; Zhu, C.; Lu, R.; Jiang, N.; Ma, S. Subseasonal forecast barrier of the North Atlantic oscillation in S2S models during the extreme mei-yu rainfall event in 2020. Clim. Dyn. 2022, 58, 2913–2925. [Google Scholar] [CrossRef]
  18. Chen, L.-X.; Zhu, W.; Zhou, X.; Zhou, Z. Characteristics of the Heat Island Effect in Shanghai and Its Possible Mechanism. Adv. Atmos. Sci. 2003, 20, 991–1001. [Google Scholar] [CrossRef]
  19. Wang, X.; Wang, Z.; Qi, Y.; Guo, H. Effect of Urbanization on the Winter Precipitation Distribution in Beijing Area. Sci. China Ser. D Earth Sci. 2009, 52, 250–256. [Google Scholar] [CrossRef]
  20. Zhang, C.L.; Chen, F.; Miao, S.G.; Li, Q.C.; Xia, X.A.; Xuan, C.Y. Impacts of Urban Expansion and Future Green Planting on Summer Precipitation in the Beijing Metropolitan Area. J. Geophys. Res. 2009, 114, D02116. [Google Scholar] [CrossRef]
  21. Liang, P.; Ding, Y.; He, J.-H.; Tang, X. Study of Relationship between Urbanization Speed and. Change in Spatial Distribution of Rainfall over Shanghai. J. Trop. Meteorol. 2013, 19, 475–483. [Google Scholar]
  22. Yang, L.; Tian, F.; Smith, J.A.; Hu, H. Urban Signatures in the Spatial Clustering of Summer Heavy Rainfall Events over the Beijing Metropolitan Region: Urban Modification of Heavy Rainfall. J. Geophys. Res. Atmos. 2014, 119, 1203–1217. [Google Scholar] [CrossRef]
  23. Zhong, S.; Yang, X.-Q. Ensemble Simulations of the Urban Effect on a Summer Rainfall Event in the Great Beijing Metropolitan Area. Atmos. Res. 2015, 153, 318–334. [Google Scholar] [CrossRef]
  24. Liang, P.; Ding, Y. The Long-Term Variation of Extreme Heavy Precipitation and Its Link to Urbanization Effects in Shanghai during 1916–2014. Adv. Atmos. Sci. 2017, 34, 321–334. [Google Scholar] [CrossRef]
  25. Liu, J.; Niyogi, D. Meta-Analysis of Urbanization Impact on Rainfall Modification. Sci Rep 2019, 9, 7301. [Google Scholar] [CrossRef] [Green Version]
  26. Dou, J.; Wang, Y.; Bornstein, R.; Miao, S. Observed Spatial Characteristics of Beijing Urban Climate Impacts on Summer Thunderstorms. J. Appl. Meteorol. Climatol. 2015, 54, 94–105. [Google Scholar] [CrossRef]
  27. Yang, P.; Ren, G.; Yan, P. Evidence for a Strong Association of Short-Duration Intense Rainfall with Urbanization in the Beijing Urban Area. J. Clim. 2017, 30, 5851–5870. [Google Scholar] [CrossRef]
  28. Song, X.; Mo, Y.; Xuan, Y.; Wang, Q.J.; Wu, W.; Zhang, J.; Zou, X. Impacts of Urbanization on Precipitation Patterns in the Greater Beijing–Tianjin–Hebei Metropolitan Region in Northern China. Environ. Res. Lett. 2021, 16, 014042. [Google Scholar] [CrossRef]
  29. Hu, H. Spatiotemporal Characteristics of Rainstorm-Induced Hazards Modified by Urbanization in Beijing. J. Appl. Meteorol. Climatol. 2015, 54, 1496–1509. [Google Scholar] [CrossRef]
  30. Han, Z.; Yan, Z.; Li, Z.; Liu, W.; Wang, Y. Impact of Urbanization on Low-Temperature Precipitation in Beijing during 1960–2008. Adv. Atmos. Sci. 2014, 31, 48–56. [Google Scholar] [CrossRef]
  31. Yang, B.; Zhang, Y.; Qian, Y. Simulation of Urban Climate with High-Resolution WRF Model: A Case Study in Nanjing, China. Asia-Pac. J. Atmos. Sci. 2012, 48, 227–241. [Google Scholar] [CrossRef]
  32. Liao, J.; Wang, X.; Li, Y.; Xia, B. An Analysis Study of the Impacts of Urbanization on Precipitation in Guangzhou. J. Meteorol. Sci. 2011, 31, 384–390. [Google Scholar] [CrossRef]
  33. Wan, H.; Zhong, Z.; Yang, X.; Li, X. Impact of City Belt in Yangtze River Delta in China on a Precipitation Process in Summer: A Case Study. Atmos. Res. 2013, 125–126, 63–75. [Google Scholar] [CrossRef]
  34. Wang, J.; Feng, J.; Yan, Z.; Hu, Y.; Jia, G. Nested High-Resolution Modeling of the Impact of Urbanization on Regional Climate in Three Vast Urban Agglomerations in China: Climate impact of urbanization in China. J. Geophys. Res. 2012, 117, D21103. [Google Scholar] [CrossRef] [Green Version]
  35. Feng, J.; Wang, J.; Yan, Z. Impact of Anthropogenic Heat Release on Regional Climate in Three Vast Urban Agglomerations in China. Adv. Atmos. Sci. 2014, 31, 363–373. [Google Scholar] [CrossRef]
  36. Jiang, X.; Luo, Y.; Zhang, D.-L.; Wu, M. Urbanization Enhanced Summertime Extreme Hourly Precipitation over the Yangtze River Delta. J. Clim. 2020, 33, 5809–5826. [Google Scholar] [CrossRef] [Green Version]
  37. Kishtawal, C.M.; Niyogi, D.; Tewari, M.; Pielke, R.A.; Shepherd, J.M. Urbanization Signature in the Observed Heavy Rainfall Climatology over India. Int. J. Climatol. 2010, 30, 1908–1916. [Google Scholar] [CrossRef] [Green Version]
  38. Chalakkal, J.B.; Mohan, M. Is the Monsoon Climatology Observed over the National Capital Region, Delhi Indicative of an Urban-Monsoon Linkage on Rainfall Modification? Urban Clim. 2022, 46, 101289. [Google Scholar] [CrossRef]
  39. Ma, X.; Zhang, Y. Numerical Study of the Impacts of Urban Expansion on Meiyu Precipitation over Eastern China. J. Meteorol. Res. 2015, 29, 237–256. [Google Scholar] [CrossRef]
  40. Quan, J.; Xue, Y.; Duan, Q.; Liu, Z.; Oleson, K.W.; Liu, Y. Numerical Investigation and Uncertainty Analysis of Eastern China’s Large-Scale Urbanization Effect on Regional Climate. J. Meteorol. Res. 2021, 35, 1023–1040. [Google Scholar] [CrossRef]
  41. Xu, Q.; Yang, Y.-W.; Yang, Q.-M. The Meiyu in Middle-Lower Reaches of Yangtze River during 116 Recent Years (I). Torrential Rain Disaster 2001, 1, 44–53. [Google Scholar]
  42. Kalnay, E.; Kanamitsu, M.; Kistler, R.; Collins, W.; Deaven, D.; Gandin, L.; Iredell, M.; Saha, S.; White, G.; Woollen, J.; et al. The NCEP/NCAR 40-Year Reanalysis Project. Bull. Am. Meteorol. Soc. 1996, 77, 437–471. [Google Scholar] [CrossRef]
  43. Kalnay, E.; Cai, M. Impact of urbanization and landuse change on climate. Nature 2003, 423, 528–531. [Google Scholar] [CrossRef]
  44. Kistler, R.; Kalnay, E.; Collins, W.; Saha, S.; White, G.; Woollen, J.; Chelliah, M.; Ebisuzaki, W.; Kanamitsu, M.; Kousky, V.; et al. The NCEP/NCAR 50-year reanalysis: Monthly means CD-ROM and documentation. Bull. Am. Meteorol. Soc. 2000, 82, 247–267. [Google Scholar] [CrossRef]
  45. Li, Z.; Yan, Z.; Tu, K.; Wu, H. Changes of Precipitation and Extremes and the Possible Effect of Urbanization in the Beijing Metropolitan Region during 1960–2012 Based on Homogenized Observations. Adv. Atmos. Sci. 2015, 32, 1173–1185. [Google Scholar] [CrossRef]
  46. Wang, X.L. Penalized Maximal F Test for Detecting Undocumented Mean Shift without Trend Change. J. Atmos. Ocean. Technol. 2008, 25, 368–384. [Google Scholar] [CrossRef]
  47. Wang, X.L.; Chen, H.; Wu, Y.; Feng, Y.; Pu, Q. New Techniques for the Detection and Adjustment of Shifts in Daily Precipitation Data Series. J. Appl. Meteorol. Climatol. 2010, 49, 2416–2436. [Google Scholar] [CrossRef]
  48. Wang, X.L.; Wen, Q.H.; Wu, Y. Penalized Maximal t Test for Detecting Undocumented Mean Change in Climate Data Series. J. Appl. Meteorol. Climatol. 2007, 46, 916–931. [Google Scholar] [CrossRef]
  49. Gong, P.; Liu, H.; Zhang, M.; Li, C.; Wang, J.; Huang, H.; Clinton, N.; Ji, L.; Li, W.; Bai, Y.; et al. Stable Classification with Limited Sample: Transferring a 30-m Resolution Sample Set Collected in 2015 to Mapping 10-m Resolution Global Land Cover in 2017. Sci. Bull. 2019, 64, 370–373. [Google Scholar] [CrossRef] [PubMed] [Green Version]
  50. Gong, P.; Li, X.; Zhang, W. 40-Year (1978–2017) Human Settlement Changes in China Reflected by Impervious Surfaces from Satellite Remote Sensing. Sci. Bull. 2019, 64, 756–763. [Google Scholar] [CrossRef] [Green Version]
  51. Ma, Y.; Liang, P.; Grimmond, S.; Yang, X.; Lyu, J.; Ding, Y. Three-Dimensional Urban Thermal Effect across a Large City Cluster during an Extreme Heat Wave: Observational Analysis. J. Meteorol. Res. 2022, 36, 387–400. [Google Scholar] [CrossRef]
  52. Liang, P.; Tang, X.; He, J.-H.; Chen, L.-X. An East Asian Subtropical Summer Monsoon Index Defined by Moisture Transport. J. Trop. Meteorol. 2008, 14, 61–64. [Google Scholar]
  53. Wu, Z.; Huang, N.E. Ensemble Empirical Mode Decomposition: A Noise-Assisted Data Analysis Method. Adv. Adapt. Data Anal. 2009, 1, 1–41. [Google Scholar] [CrossRef]
  54. Huang, N.E.; Wu, Z. A Review on Hilbert-Huang Transform: Method and Its Applications. Rev. Geophys. 2008, 46, 1–23. [Google Scholar] [CrossRef] [Green Version]
  55. Liang, P.; Yan, Z.-W.; Li, Z. Climatic Warming in Shanghai during 1873–2019 Based on Homogenised Temperature Records. Adv. Clim. Chang. Res. 2022, 13, 496–506. [Google Scholar] [CrossRef]
  56. Held, I.M.; Soden, B.J. Robust Responses of the Hydrological Cycle to Global Warming. J. Clim. 2006, 19, 5686–5699. [Google Scholar] [CrossRef]
  57. Jung, W.-S.; Panicker, A.S.; Lee, D.-I.; Park, S.-H. Estimates of Aerosol Indirect Effect from Terra MODIS over Republic of Korea. Adv. Meteorol. 2013, 2013, 976813. [Google Scholar] [CrossRef]
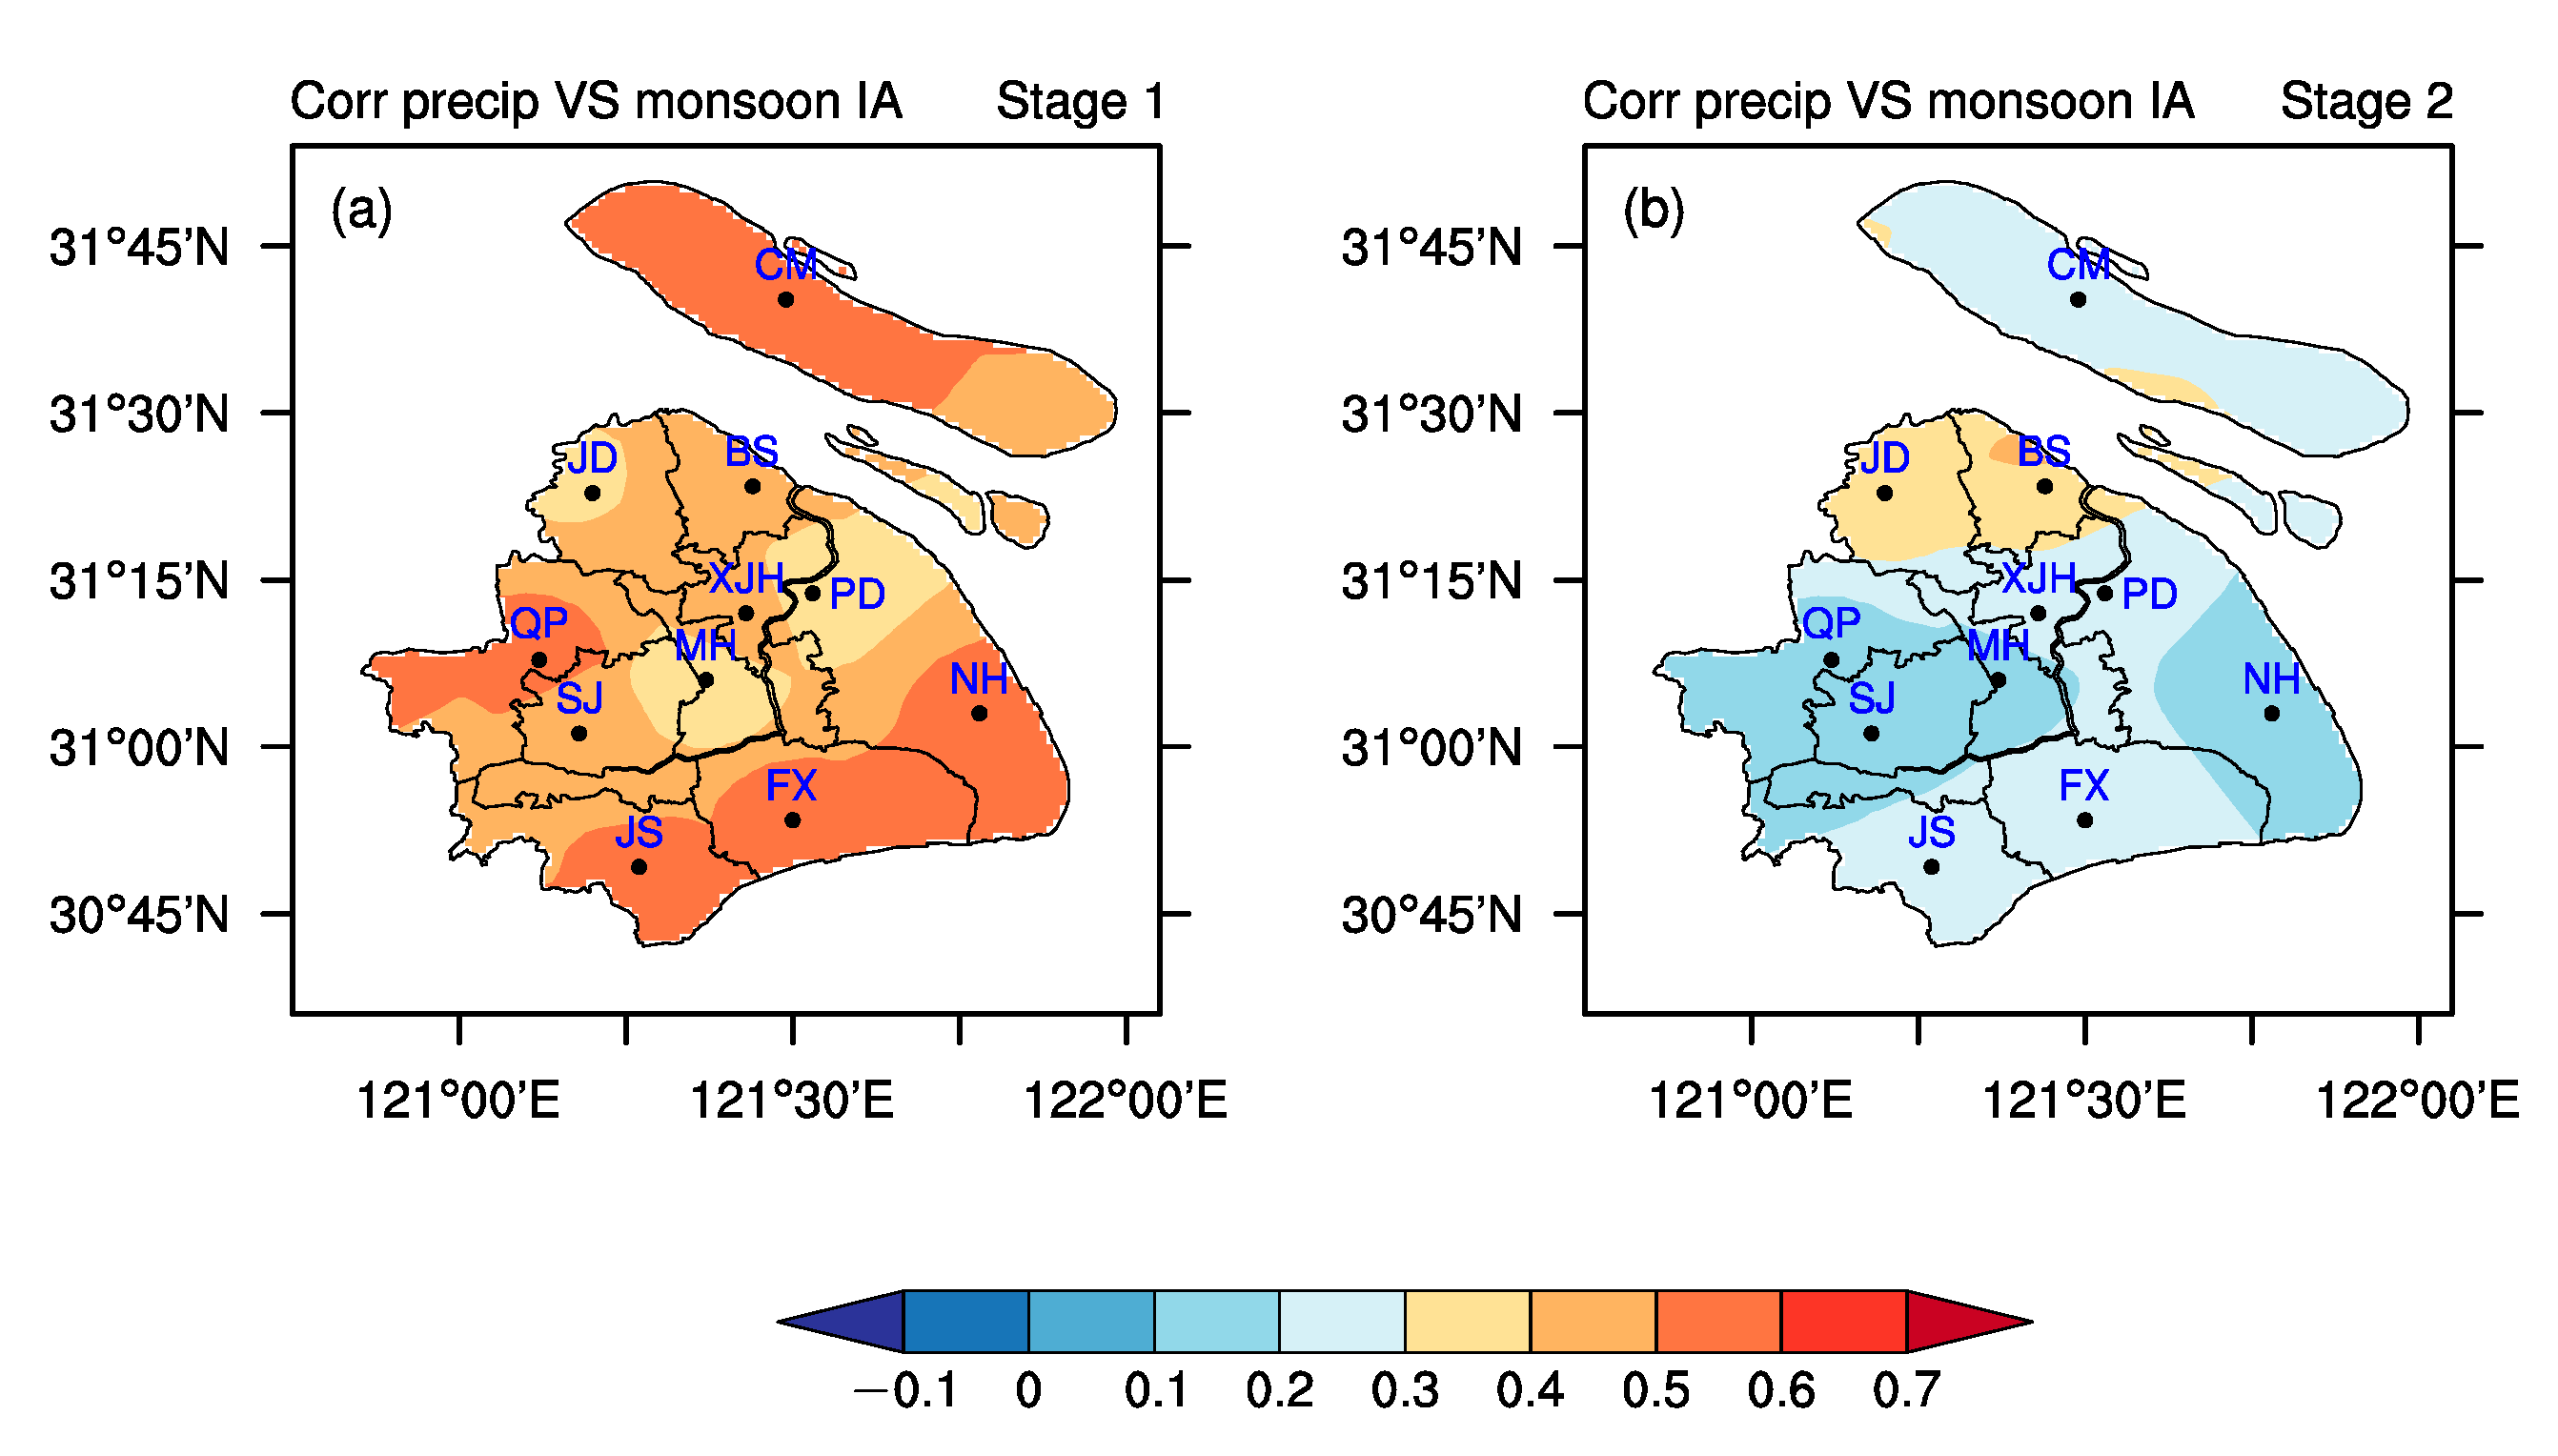
 [Green Version]
Figure 1. Locations of observational stations ((a), different colors denote the urbanized years) and evolution of the urbanization factors including population density (blue line) and paving road area (red line) (b) in Shanghai in 1961–2021.
Land 12 01216 g001
Figure 2. Homogenization test of precipitation series: (a) anomalies of normal transformed PDM at XJH in 1874–2021 (Red line denotes the regression fit using the PMF test); (b) anomalies of normal transformed Meiyu precipitation series at XJH in 1885–2001 with reference series of Meiyu precipitation over the Yangtze River (Red line denotes the regression fit using the PMT test); (c) anomalies of normal transformed average PDM of 11 stations in Shanghai during the 1961–2021 period (Red line denotes the regression fit using the PMF test).
Land 12 01216 g002
Figure 3. Variation in the total precipitation (a) and extreme daily precipitation (b) at XJH during the Meiyu seasons of 1874–2021 (Dashed lines are the corresponding linear trends).
Land 12 01216 g003
Figure 4. Spatial distribution of the average PDM in Shanghai during Stages 1/2 (a,b); i.e., the slow/fast urban process) and the spatial standard deviation of the PDM in Shanghai in 1961–2021 ((c), yellow and green curves denote the PDM; yellow/green lines represent linear trends).
Land 12 01216 g004
Figure 5. Spatial distribution of the frequency (a,b) and the spatially normalized precipitation (c,d) of strong convection events (hourly precipitation greater than 20 mm) in Shanghai during the Meiyu season during the slow/fast (ad) urban processes.
Land 12 01216 g005
Figure 6. The long-term trend (a) and the interannual (b) components of the regional average PDM in Shanghai (blue curves) together with their corresponding EASMI components (orange curves) in 1961–2021 based on EEMD analysis.
Land 12 01216 g006
Figure 7. Spatial distribution of the correlation coefficients between the PDM and EASM during the slow (a) and rapid (b) urbanization process.
Land 12 01216 g007
Figure 8. The average SAT during the Meiyu season (red curve) and its correlation coefficients (green curve) with PDM at the 11 observational stations (marked on the x-axis) in Stage 2 (The number on the upper right corner denotes the correlation coefficient between the two series).
Land 12 01216 g008
Figure 9. Spatial distribution of the average 10m wind speed in Shanghai during the slow (a) and rapid (b) urbanization processes.
Land 12 01216 g009
Figure 10. Wind-rose diagram at XJH (a) and JS (b) stations during Stages 1 (blue curve) and 2 (orange curve). C1 and C2 denote the frequencies of quiet wind during Stages 1 and 2.
Land 12 01216 g010
Table 1. Correlation coefficients between interannual components of precipitation reanalysis and East Asian summer monsoon index during Meiyu season (bold numbers denote above 0.05 significance level).
Precipitation ComponentStage 1 (1961–1985)Stage 2 (1986–2021)
Total precipitation0.380.07
Large-scale precipitation0.49−0.08
Convective precipitation0.070.32
Disclaimer/Publisher’s Note: The statements, opinions and data contained in all publications are solely those of the individual author(s) and contributor(s) and not of MDPI and/or the editor(s). MDPI and/or the editor(s) disclaim responsibility for any injury to people or property resulting from any ideas, methods, instructions or products referred to in the content.

