Article

Long-Term Variations in Warm and Cold Events in Nanjing, China: Roles of Synoptic Weather Patterns and Urbanization

1
Collaborative Innovation Centre on Forecast and Evaluation of Meteorological Disasters, School of Atmospheric Physics, Nanjing University of Information Science & Technology, Nanjing 210044, China
2
Nanjing Foreign Language School, Nanjing 210018, China
3
Key Laboratory of Transportation Meteorology of China Meteorological Administration, Nanjing Joint Institute for Atmospheric Sciences, Nanjing 210041, China
*
Author to whom correspondence should be addressed.
Land 2023, 12(1), 162; https://doi.org/10.3390/land12010162
Submission received: 30 October 2022 / Revised: 6 December 2022 / Accepted: 23 December 2022 / Published: 3 January 2023

Abstract

:
Studying the long-term variations in warm and cold events and their causes under global warming is important for understanding urban climate change, planning, and green development, as well as for disaster prevention and mitigation. In this study, taking the megacity of Nanjing in China as an example, we analyzed the trends and characteristics of the daily average temperature, daily maximum temperature, daily minimum temperature, and warm and cold events from 1960 to 2021, and their association with synoptic weather patterns (SWPs) and urbanization. The results showed that, over the past 62 years, the maximum/average/minimum temperatures in Nanjing have trended upward significantly (at the urban station they increased at rates of 0.17, 0.34, and 0.67 °C/decade), with the minimum temperatures being the most significant. In spring, the warming rate of the average temperature was the greatest, reaching 0.45 °C/decade. All other seasons had their highest warming rate in their minimum temperatures, reaching 0.38 °C/decade, 0.73 °C/decade, and 0.67 °C/decade in the summer, autumn, and winter, respectively. The extreme high temperatures showed a decreasing trend until the mid-1980s, closely related to the decrease in the two SWPs with prevailing southwesterly winds (Types 1 and 2), while a significant increasing trend was apparent thereafter, mainly related to the increase in the SWPs with prevailing southeasterly winds (Types 3 and 4). The number of warm days was strongly positively correlated with extreme high temperatures during the study period, and about 91% of the warm day interannual variation can be explained by extreme high temperature variation. The extreme low temperatures showed a significant decreasing trend. The number of cold nights was strongly and positively correlated with extreme low temperatures, and about 85% of the cold night interannual variation can be explained by extreme low temperature variation. The effect of urbanization was basically positive, contributing the most to the average temperatures and second-most to the minimum temperatures, with warming contributions of 26.5% and 20.9%, respectively, and an insignificant contribution to the maximum temperatures. The effect of urbanization on extreme high temperatures was not significant, but the contribution of warming to extreme low temperatures reached 27.9%. Our results have important implications for future urban climate prediction, as well as for impact assessment and decision making in urban planning.

1. Introduction

The IPCC’s Sixth Assessment Report states that the global mean surface temperature has increased by about 1 °C since 1850–1900 and this trend is expected to continue in the near future [1]. Global warming has significant impacts on climate and ecosystems, such as sea level rise, melting of permafrost glaciers, reduced biodiversity, and frequent extreme weather [2,3]; moreover, it has far-reaching impacts on human socioeconomic systems, such as crop yields, energy waste, and human health [4,5,6]. Many urban areas around the world are experiencing a changing climate and increasing incidence of extreme weather [7,8,9,10]. Therefore, studying the long-term changes in hot and cold events and their causes in the context of global warming is important for understanding urban climate change, planning human development, and for disaster prevention and mitigation.
In addition to global climate change, human activities (e.g., urbanization) can also have an impact on urban climate change trends as well as extreme cold and warm events [11,12,13,14]. One of the most important features of urbanization is land use and land cover change (replacement of the original natural surface, forests, lakes, grasslands, etc., with roads, bridges, buildings, factories, concrete parking lots, etc.) [15,16,17]. Urban expansion accompanied by urban population growth alters the original physical properties of the surface (e.g., albedo, roughness, specific heat/moisture coefficient), and coupled with anthropogenic heat emissions, the ability of cities to absorb, store, and emit energy is altered [18,19], leading to the well-known urban heat island effect [20]. It has been noted that the direct effect of urban sprawl on temperature warming can even reach 4 °C [21]; urbanization leads to an additional 0.05 °C/decade of average surface temperature warming in southeastern China [22]. The increase in surface temperature increases the risk of extreme heat. Under the synergistic effects of global warming and local urbanization, rapidly growing urban populations are more vulnerable to the threat of extreme heat [23,24,25]. Over the past few decades, China, as a populous country with hundreds of millions of urban residents and one of the most vulnerable regions to extreme weather events, has experienced rapid urbanization, which may further exacerbate the long-term trend of extreme temperatures under global warming [26,27,28]. These trends are particularly evident in highly urbanized and densely populated areas, such as the Yangtze River Delta region [29,30].
As another important driver, different synoptic weather patterns (SWPs) can cause significant temperature changes through modulation of local meteorological factors [1,31,32,33,34]. For example, high-pressure systems in summer can suppress the development of the planetary boundary layer and induce calm and cloud-free conditions favorable for radiation enhancement, thus raising temperatures [35,36,37]. The summer in east-central China is mainly influenced by the East Asian summer wind, which moves from south to north, and the number of high temperature days in southern China increases significantly after the end of the rainy season [38,39]. The western Pacific subtropical high (WPSH) is an important factor in the monsoon system in terms of generating high temperatures in southeastern China [40]. There is significant interannual variability in the extent, intensity, and location of the WPSH, and its positional configuration with the westerly jet and South Asian high (SAH) affects the region where high temperatures occur. For example, the high frequency of high temperature days in the Yangtze River basin in 2013 was closely related to the northwestward position of the WPSH and the strong and northeastward position of the SAH [40].
Nanjing is regarded as one of China’s “Four Furnaces”, which refers to its especially hot and oppressively humid summer weather within China. The long plum-rain season, a subtropical Asian wet season in the late spring and early summer which causes extreme and consistently high humidity levels, contributes significantly to its hottest temperatures in summer. Nanjing has a resident population of 9.42 million. It is not only one of the fastest growing metropolises in China in recent decades, but also a typical subtropical, inland city [41,42]. However, to date, there have been few previous studies on climate trend changes in Nanjing [43,44,45], leaving a knowledge gap regarding synoptic-scale changes and their potential drivers. Overall, there are two questions about climate change trends in Nanjing that have not yet been fully answered: (a) What is the contribution of urbanization to long-term climate change trends of cold and warm events? (b) What is the synoptic circulation situation for extreme cold and warm events? Therefore, taking Nanjing as an example, this study focuses on the long-term daily maximum/mean/minimum temperature trends and extreme cold and warm event trends during 1960–2021, and investigates the role of SWPs and urbanization in the changes of these trends based on surface observations and reanalysis data in an integrated manner. The results of this study are expected to provide a scientific reference for climate prediction and urban planning from the perspective of synoptic weather patterns and urbanization in high-density megacities.

2. Data and Methods

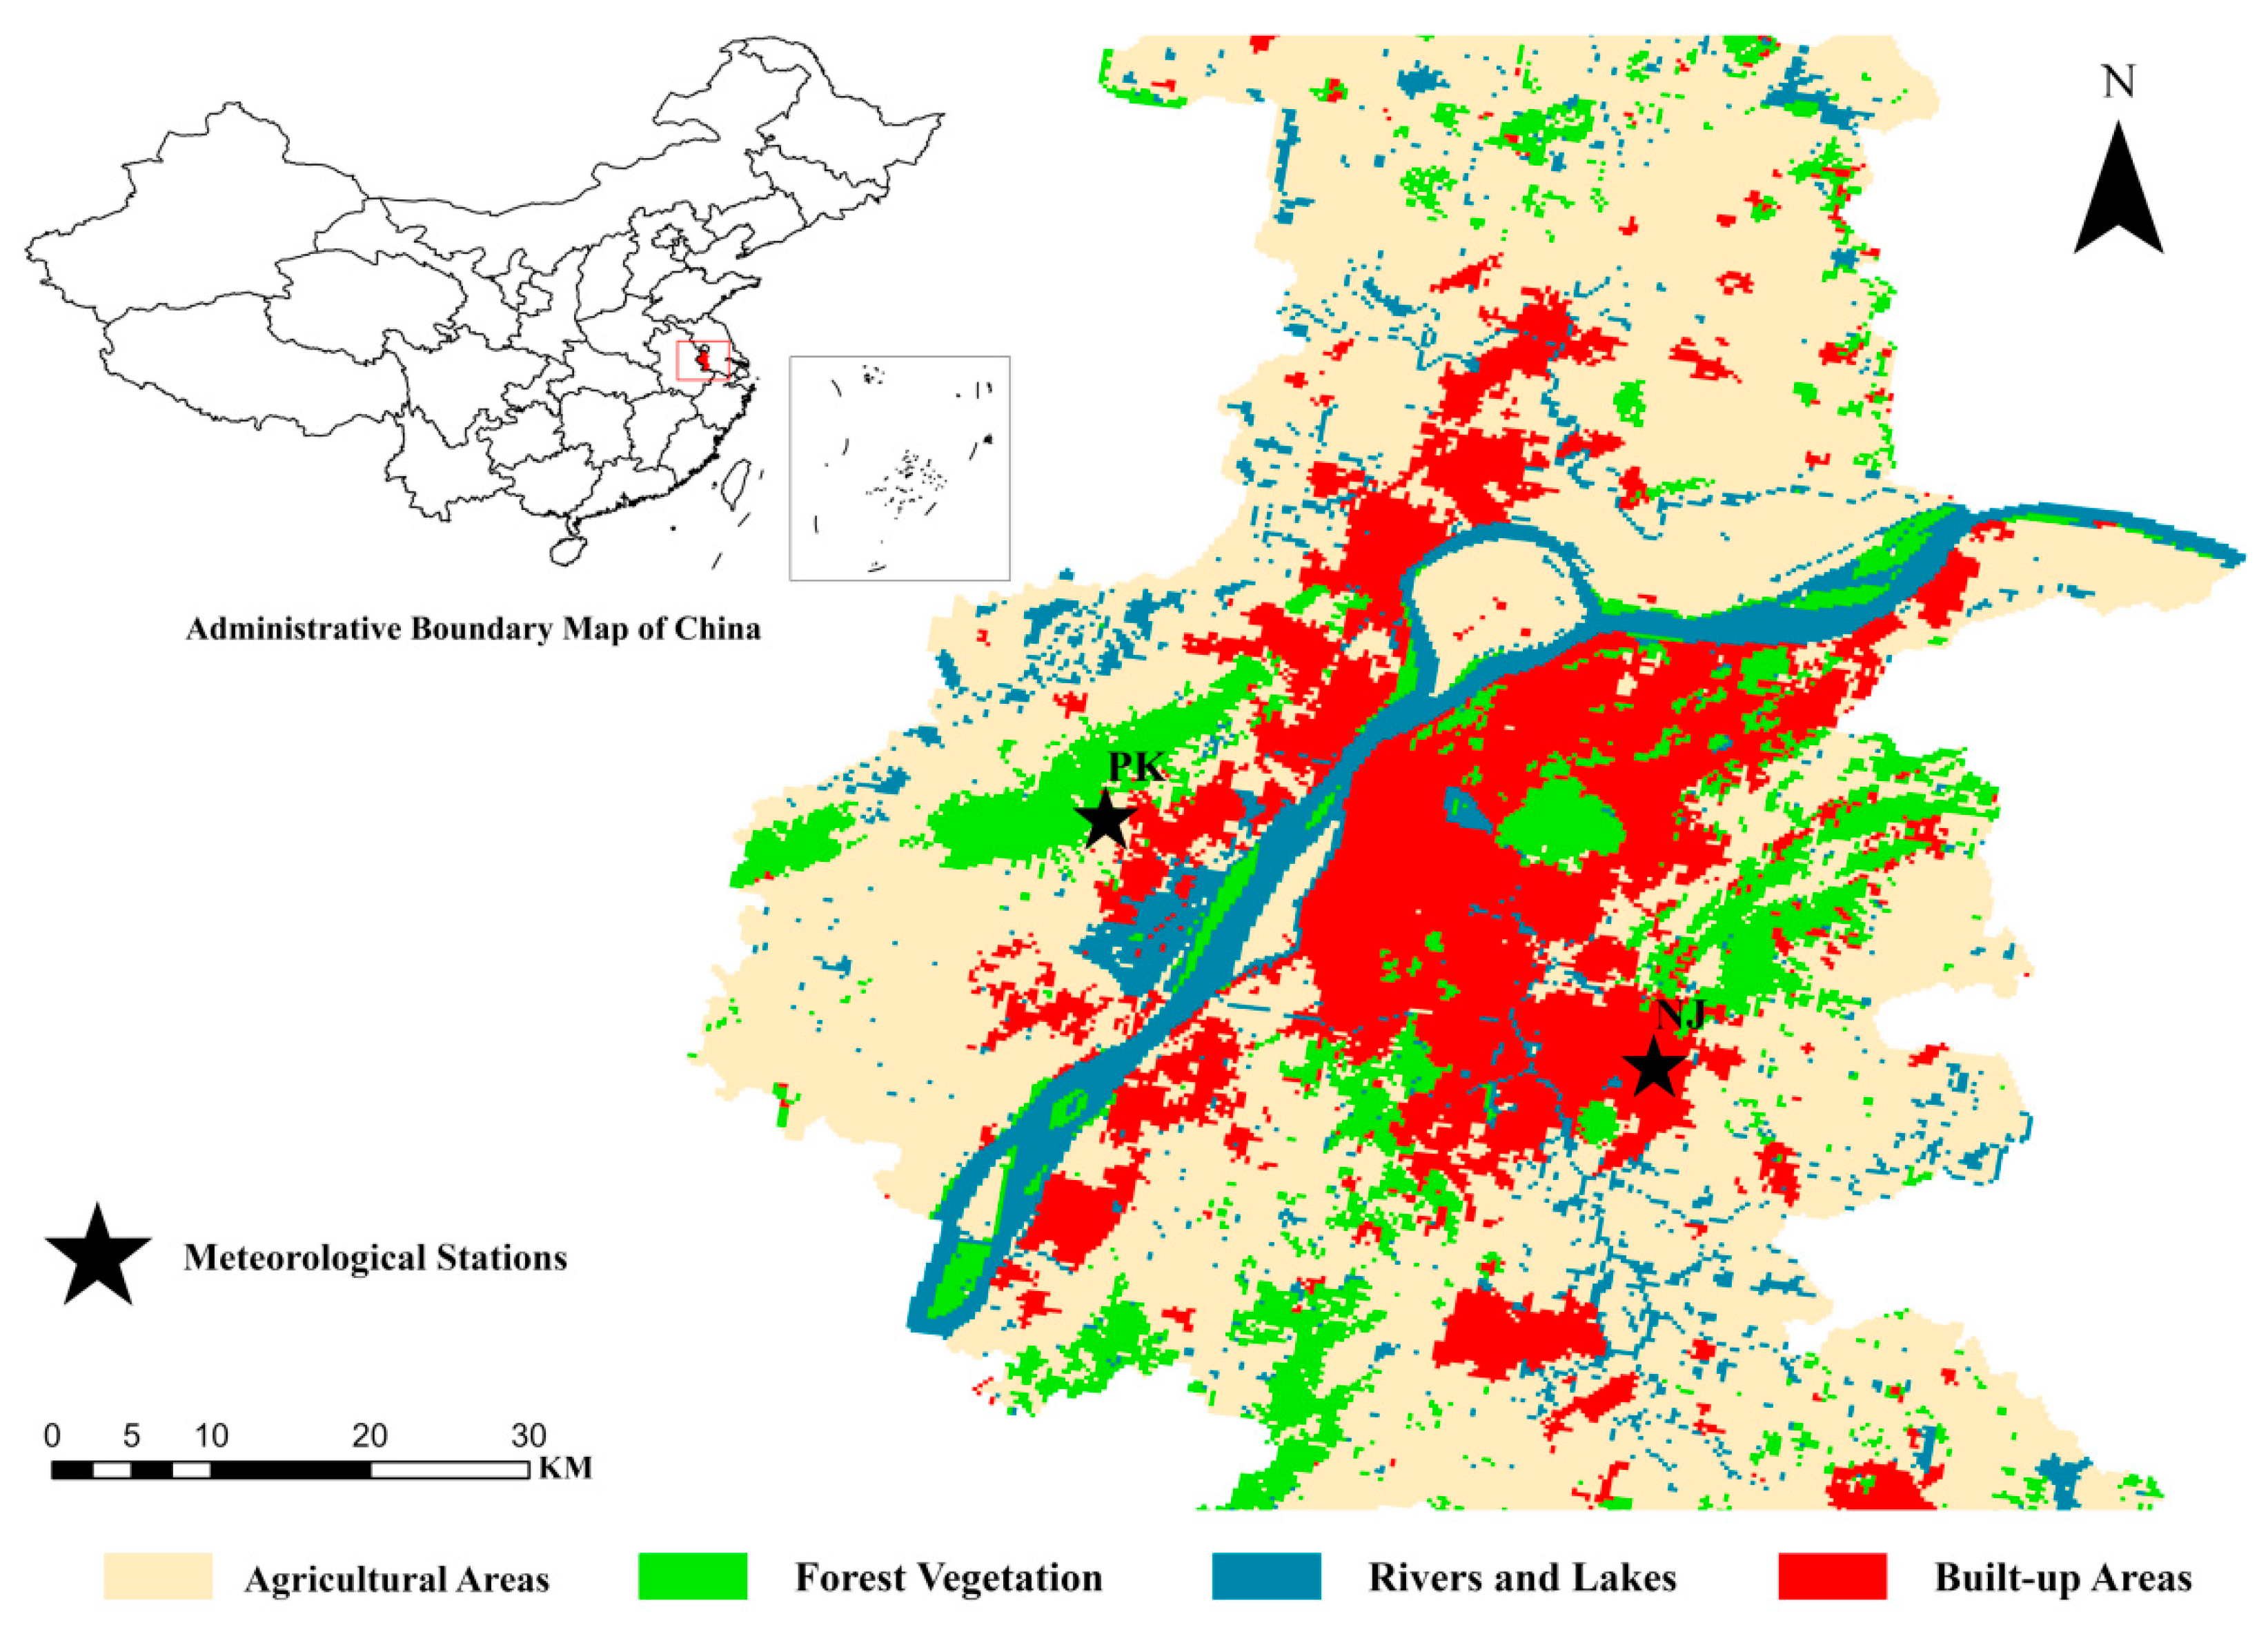
2.1. Study Area and Observational Data

Nanjing, located in the middle and lower reaches of the Yangtze River Delta plain, is a metropolis that combines technological modernity with natural beauty. It is located in the East Asian monsoon region, which belongs to the subtropical monsoon climate and is an area sensitive to climate change and prone to meteorological disasters [42]. With global warming in recent years, climate extremes have occurred, but studies on long-term climate change characteristics in Nanjing are incomplete [43,45].
The daily maximum, daily average, and minimum temperatures of the Nanjing National Climate Observatory from 1960 to 2021 were selected for analysis. The observed data were obtained from the China Meteorological Data Service Center (CMDC: http://data.cma.cn/en (accessed on 22 December 2022)). In general, the quality of the raw data is strictly controlled by the CMDC, and additionally the raw data were homogenized using the method proposed by Xu et al. [46]. Furthermore, the hourly geopotential height (GH) and zonal/meridional wind vector were obtained from the Fifth Major Global Reanalysis of the European Centre for Medium-Range Weather Forecasts for further analysis of synoptic weather types (spatial and temporal resolution of 0.25°) [47,48].

2.2. Research Methods

2.2.1. Division of Station Types

Firstly, following previous studies [24,27], a circular buffer zone with a radius of 2 km was constructed around each station. Most of the stations were 2–3 km away from areas of city or county town when they were initially built, and 2 km was chosen because this scale can represent well the local effects of urban expansion, as suggested by many climate studies [13,49,50]. The proportion of the built-up area was calculated based on the corresponding land cover within the buffer zone [24,41]. A station was classified as urban type if it had a built-up area fraction ≥ 25% [27]. The Nanjing station met the criteria for an urban station (although there was a station relocation in 2007), and the Pukou station was identified as a rural reference station; the specific locations are shown in Figure 1.

2.2.2. Definition of Extreme Events and Urbanization Correlation

Based on previous studies [51,52], a weather process in which the daily maximum temperature exceeded 35 °C for three or more consecutive days was defined as a heat wave (HW) day; and a daily minimum temperature below −5 °C was defined as a low temperature (LT) day in this study. The more traditional percentile threshold method was used for warm days (nights) and cold days (nights) [26,53]. Specifically, the maximum (minimum) temperature information of the station during the study period was arranged in ascending order, and the 95th (5th) percentile value was taken as the threshold value. When the maximum temperature of a day was above (below) the threshold, it was considered a warm (cold) day event; when the minimum temperature of a day was above (below) the threshold, it was considered a warm (cold) night event.
The urbanization effect (Ue) was defined as the difference in observational temperature trends (°C/decade) between urban and rural stations [24,27], i.e., Ue = Tdu − Tdr, in which Tdu and Tdr are the linear trends (°C/decade) for the observed temperatures of the urban and rural stations, respectively.
Following previous studies [24,27], the contribution of urbanization (Uc), the recognized relative impact of urbanization on temperature change, was calculated from Ue and Tdu (i.e., Uc = (Ue / Tdu) × 100%). In this study, simple linear regression was used to calculate the linear trend and the Student’s t-test was used to assess the statistical significance of the trend [54]. Correlation coefficients were used to assess the relationship between relative extreme indices and extreme heat waves (low temperatures).

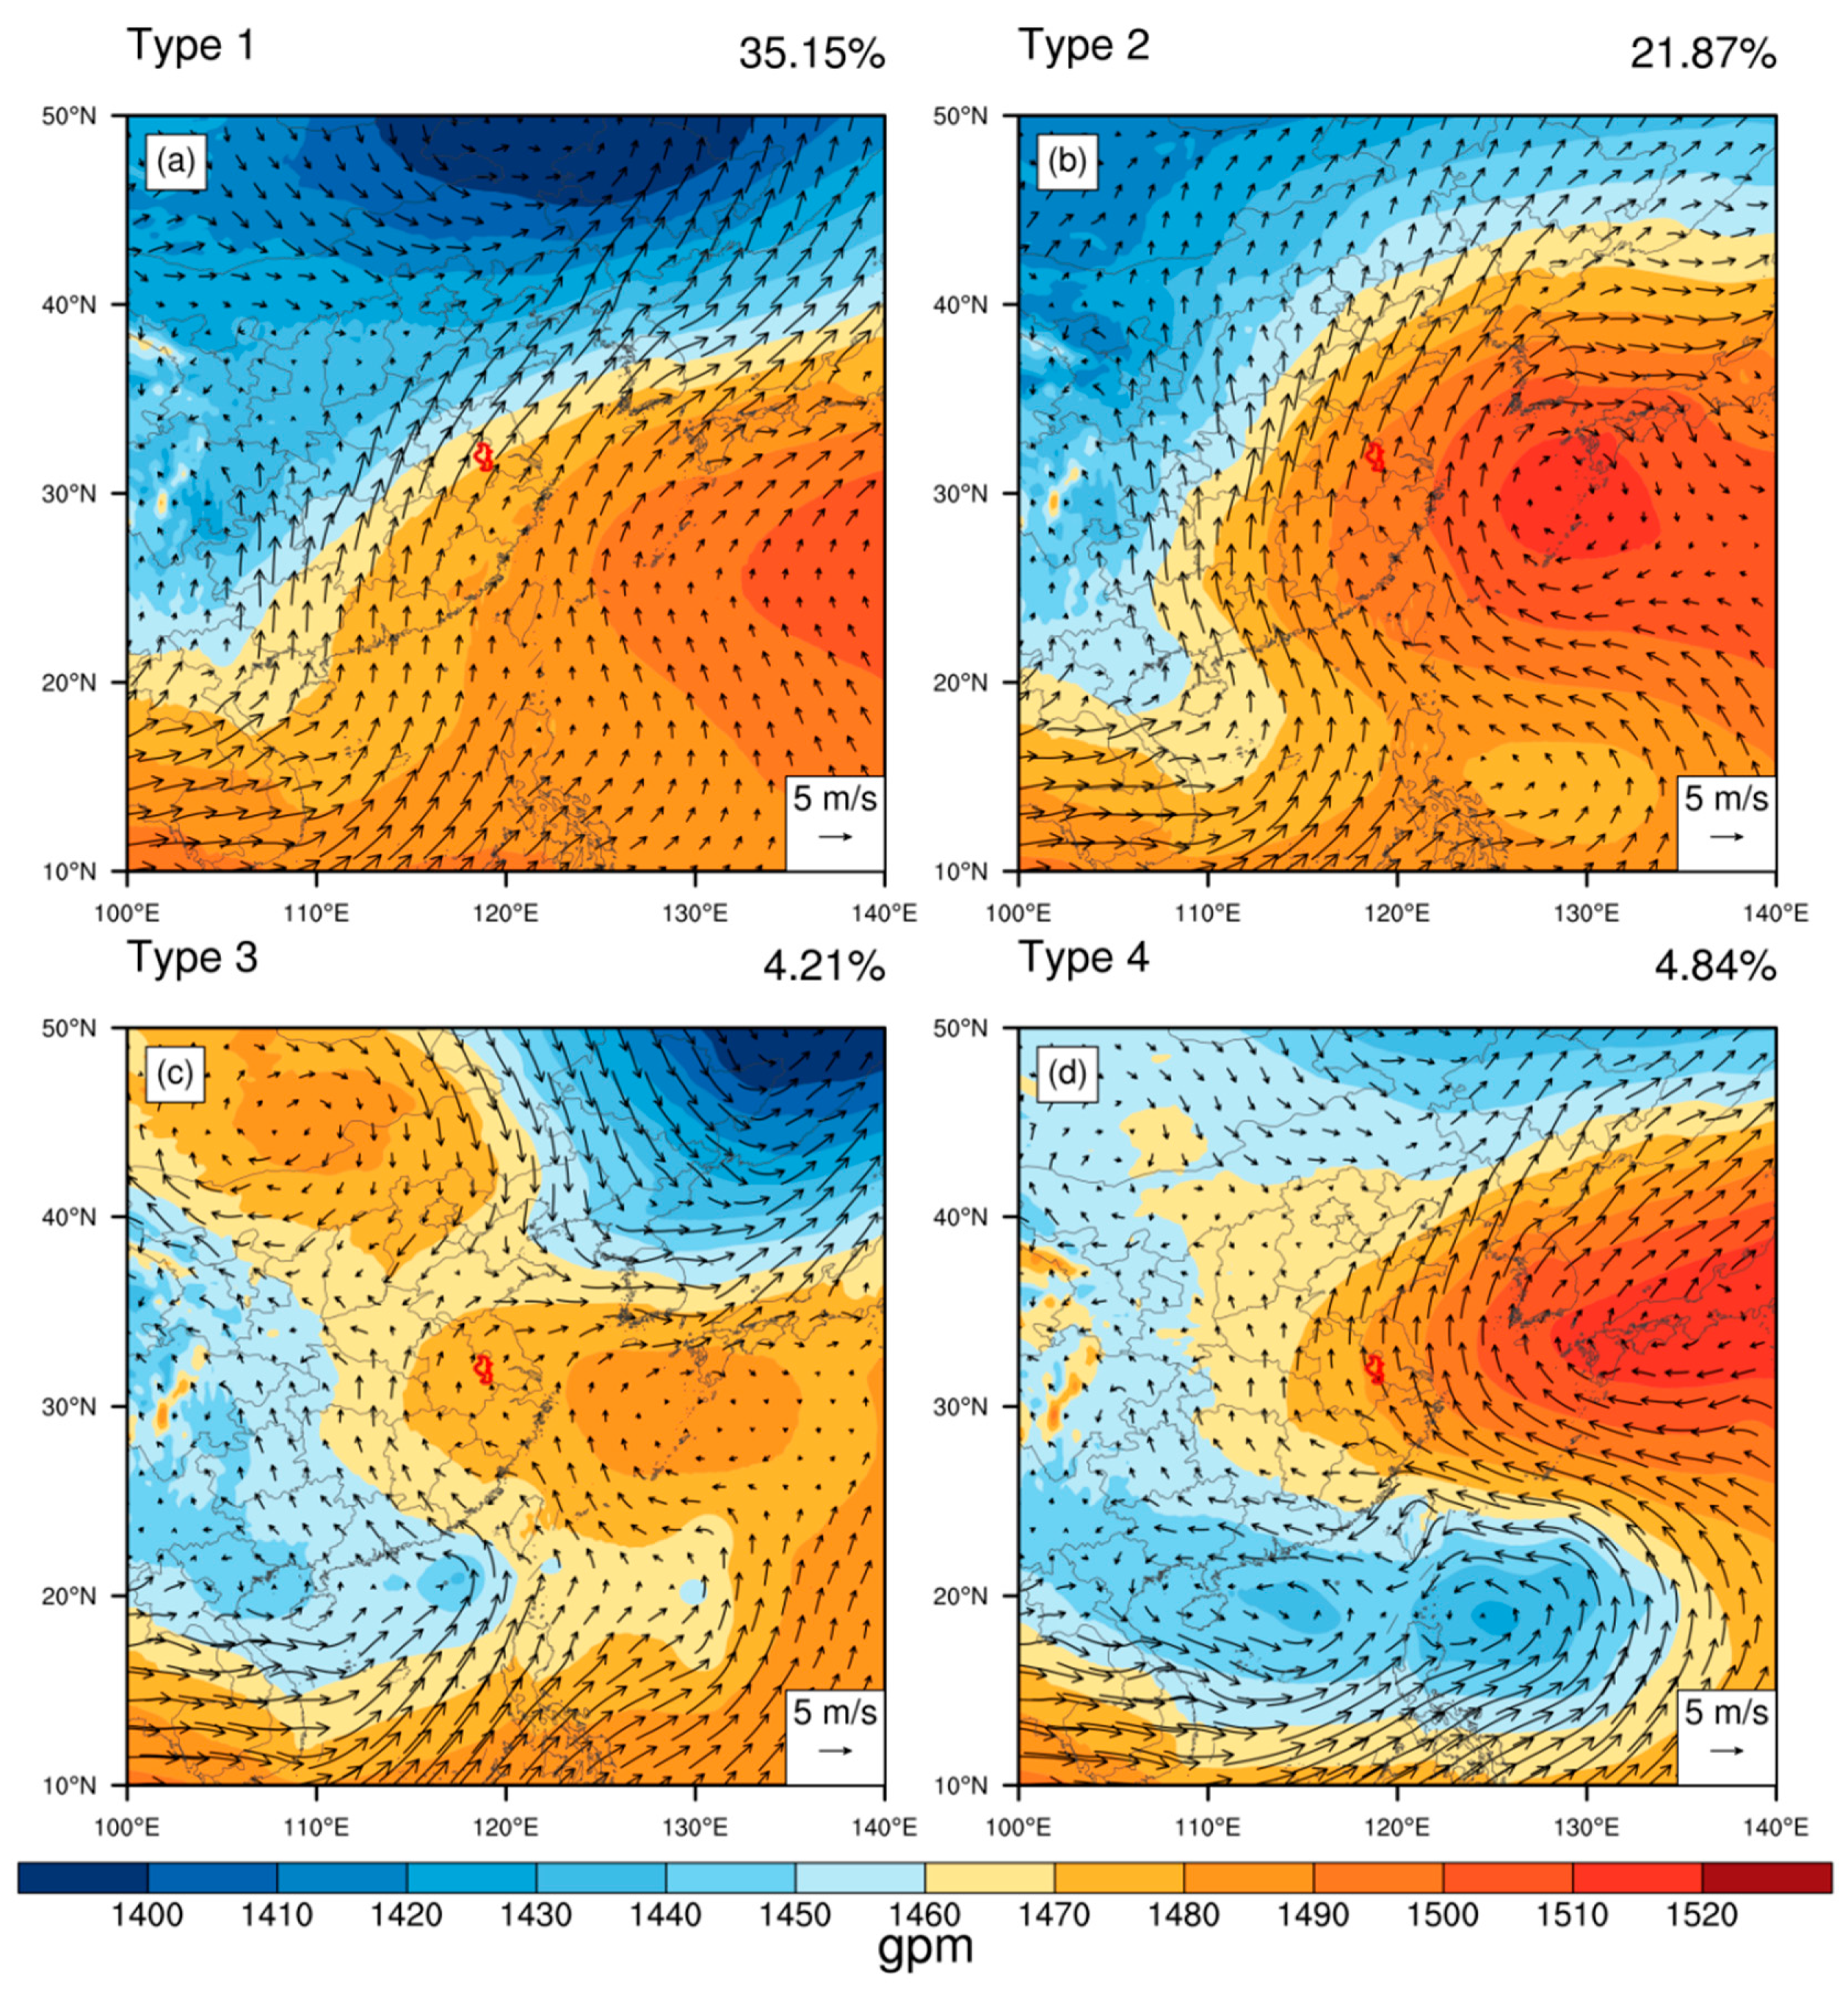
2.2.3. Classification of SWPs

T-mode principal component analysis (T-PCA) is an improved mathematical method for the classification of SWPs [47,55], which can reproduce the preset dominant SWPs without relying on the preset parameters and has the temporal and spatial stability of advanced classification [48,56]. It decomposes the original data matrix into the product of the principal component matrix and the load matrix (two low-dimensional matrices), then rotates the first r (rn) principal components with larger variance contributions obliquely, and finally obtains each time the size of the weather pattern and classification according to the loading [51]. In this study, the T-PCA analysis module of the COST733 software (http://cost733.met.no/ (accessed on 5 July 2022)), developed by the European Cooperation for Scientific and Technological Research, was used to classify the number of days of HW or LT occurrence during the study period based on the 850-hPa GH field. To assess the performance of synoptic classification and determine the number of classes, the explained cluster variance method was selected in this study [33,57,58].

3. Results

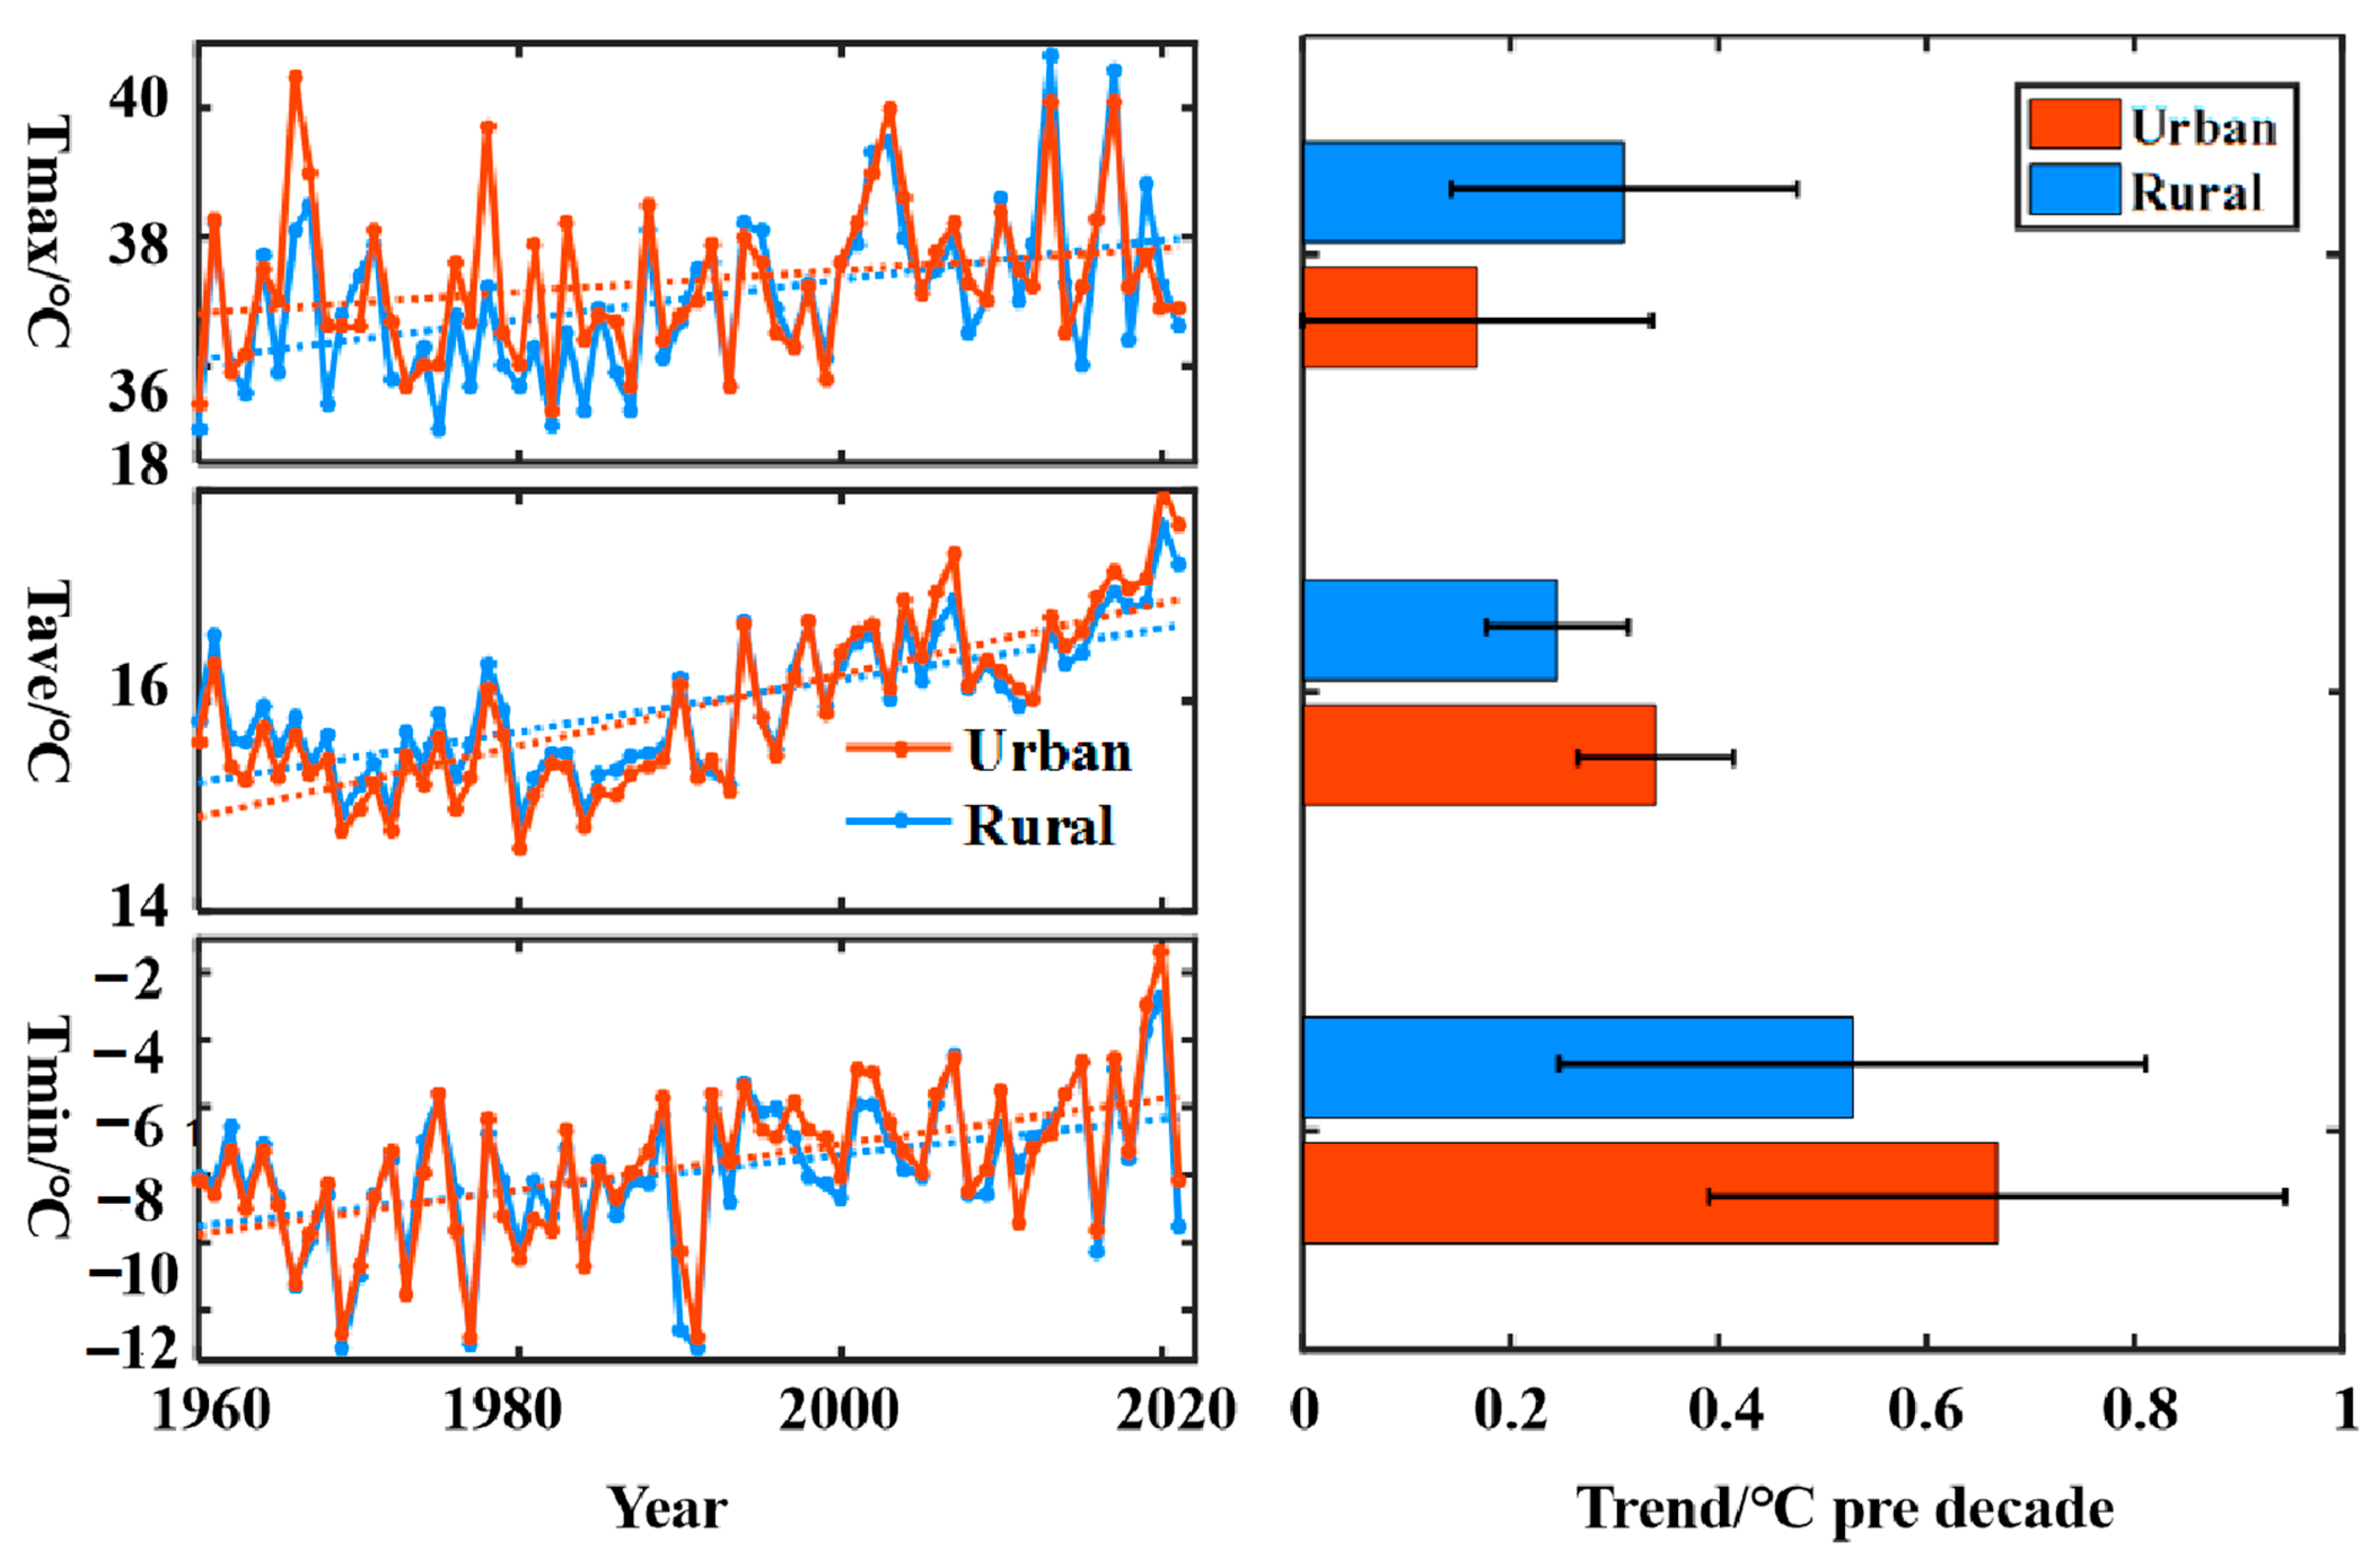
3.1. Long-Term Trends of Maximum/Average/Minimum Temperatures

Figure 2 shows the evolution of the maximum/average/minimum temperatures at the urban station and the rural reference station in Nanjing from 1960 to 2021. It can be seen that the maximum/average/minimum temperatures show an increasing trend during the study period, and most of these indicators are statistically significant. The maximum temperature is the most direct indicator of the heat condition. The annual maximum temperatures at the urban and rural stations show an increasing trend over the last 62 years. The rate of change was greater at the rural station than at the urban station, at 0.31 °C/decade and 0.17 °C/decade, respectively. Although the increase at the urban station does not pass the 0.05 significance test, the greatest increase in warming was in the spring in both cases (Figure S1). The warming trend of the average temperatures at the urban station was significantly greater than that at the rural station (0.25 °C/decade), at approximately 0.34 °C/decade. The warming rate at both station types was greatest in the spring, followed by winter, and the average temperature warming in summer was slower, or even does not increase, compared to other seasons. It is noteworthy that the warming of minimum temperatures at both the urban and rural stations was highly significant, with rates of change of 0.67 °C/decade and 0.53 °C/decade, respectively. The warming of minimum temperatures was greatest in autumn and winter, and the rate of change at the urban station was significantly greater than that at the rural station. In summary, the increase in minimum temperatures at the urban and rural sites was much greater than for the maximum and average temperatures, indicating that the warming in Nanjing was mainly reflected in the increase in minimum temperatures, in addition to the gradual warming of Nanjing in autumn and winter.

3.2. Urbanization Effects

From the above analysis, it can be seen that the trends of maximum/average/minimum temperatures at the urban and rural stations were basically the same, with an increasing trend. In addition, the urban station had a more significant upward trend than the rural station in terms of mean and minimum temperatures. In order to better understand the influence of urbanization on the temperature trends in Nanjing, the impact of urbanization on maximum/mean/minimum temperatures and its contribution were analyzed (Table 1). On the annual scale, the effect of urbanization on maximum temperatures was not significant. On the seasonal scale, urbanization passed the 0.05 significance test only in spring, contributing 25% to the warming of the maximum temperatures. On the annual scale, the impact of urbanization on the average temperatures was more significant, with a contribution of 26.5%. On the seasonal scale, except for summer, when the contribution of urbanization to the average temperatures did not pass the significance test, for all other seasons it was positive, with autumn being the highest, followed by winter and spring, at 39.2%, 19%, and 17.8%, respectively. On the annual scale, the effect of urbanization on the minimum temperatures was significant, with a contribution rate of 20.9%. On the seasonal scale, the highest value for the urbanization contribution to minimum temperatures was in autumn, followed by summer and winter, and the lowest value was in spring, with contributions of 30.1%, 28.9%, 20.9%, and 18.8%, respectively, all of which passed the 0.05 significance test. Overall, the effect of urbanization was basically positive, contributing the most to the average temperatures, and second-most to the minimum temperatures, with an insignificant contribution to the maximum temperatures. Urbanization contributed the most to the maximum temperatures in spring, the most to average temperatures in autumn, and the most to minimum temperatures in summer and winter.

3.3. SWPs Corresponding to Extreme Warm and Cold Events

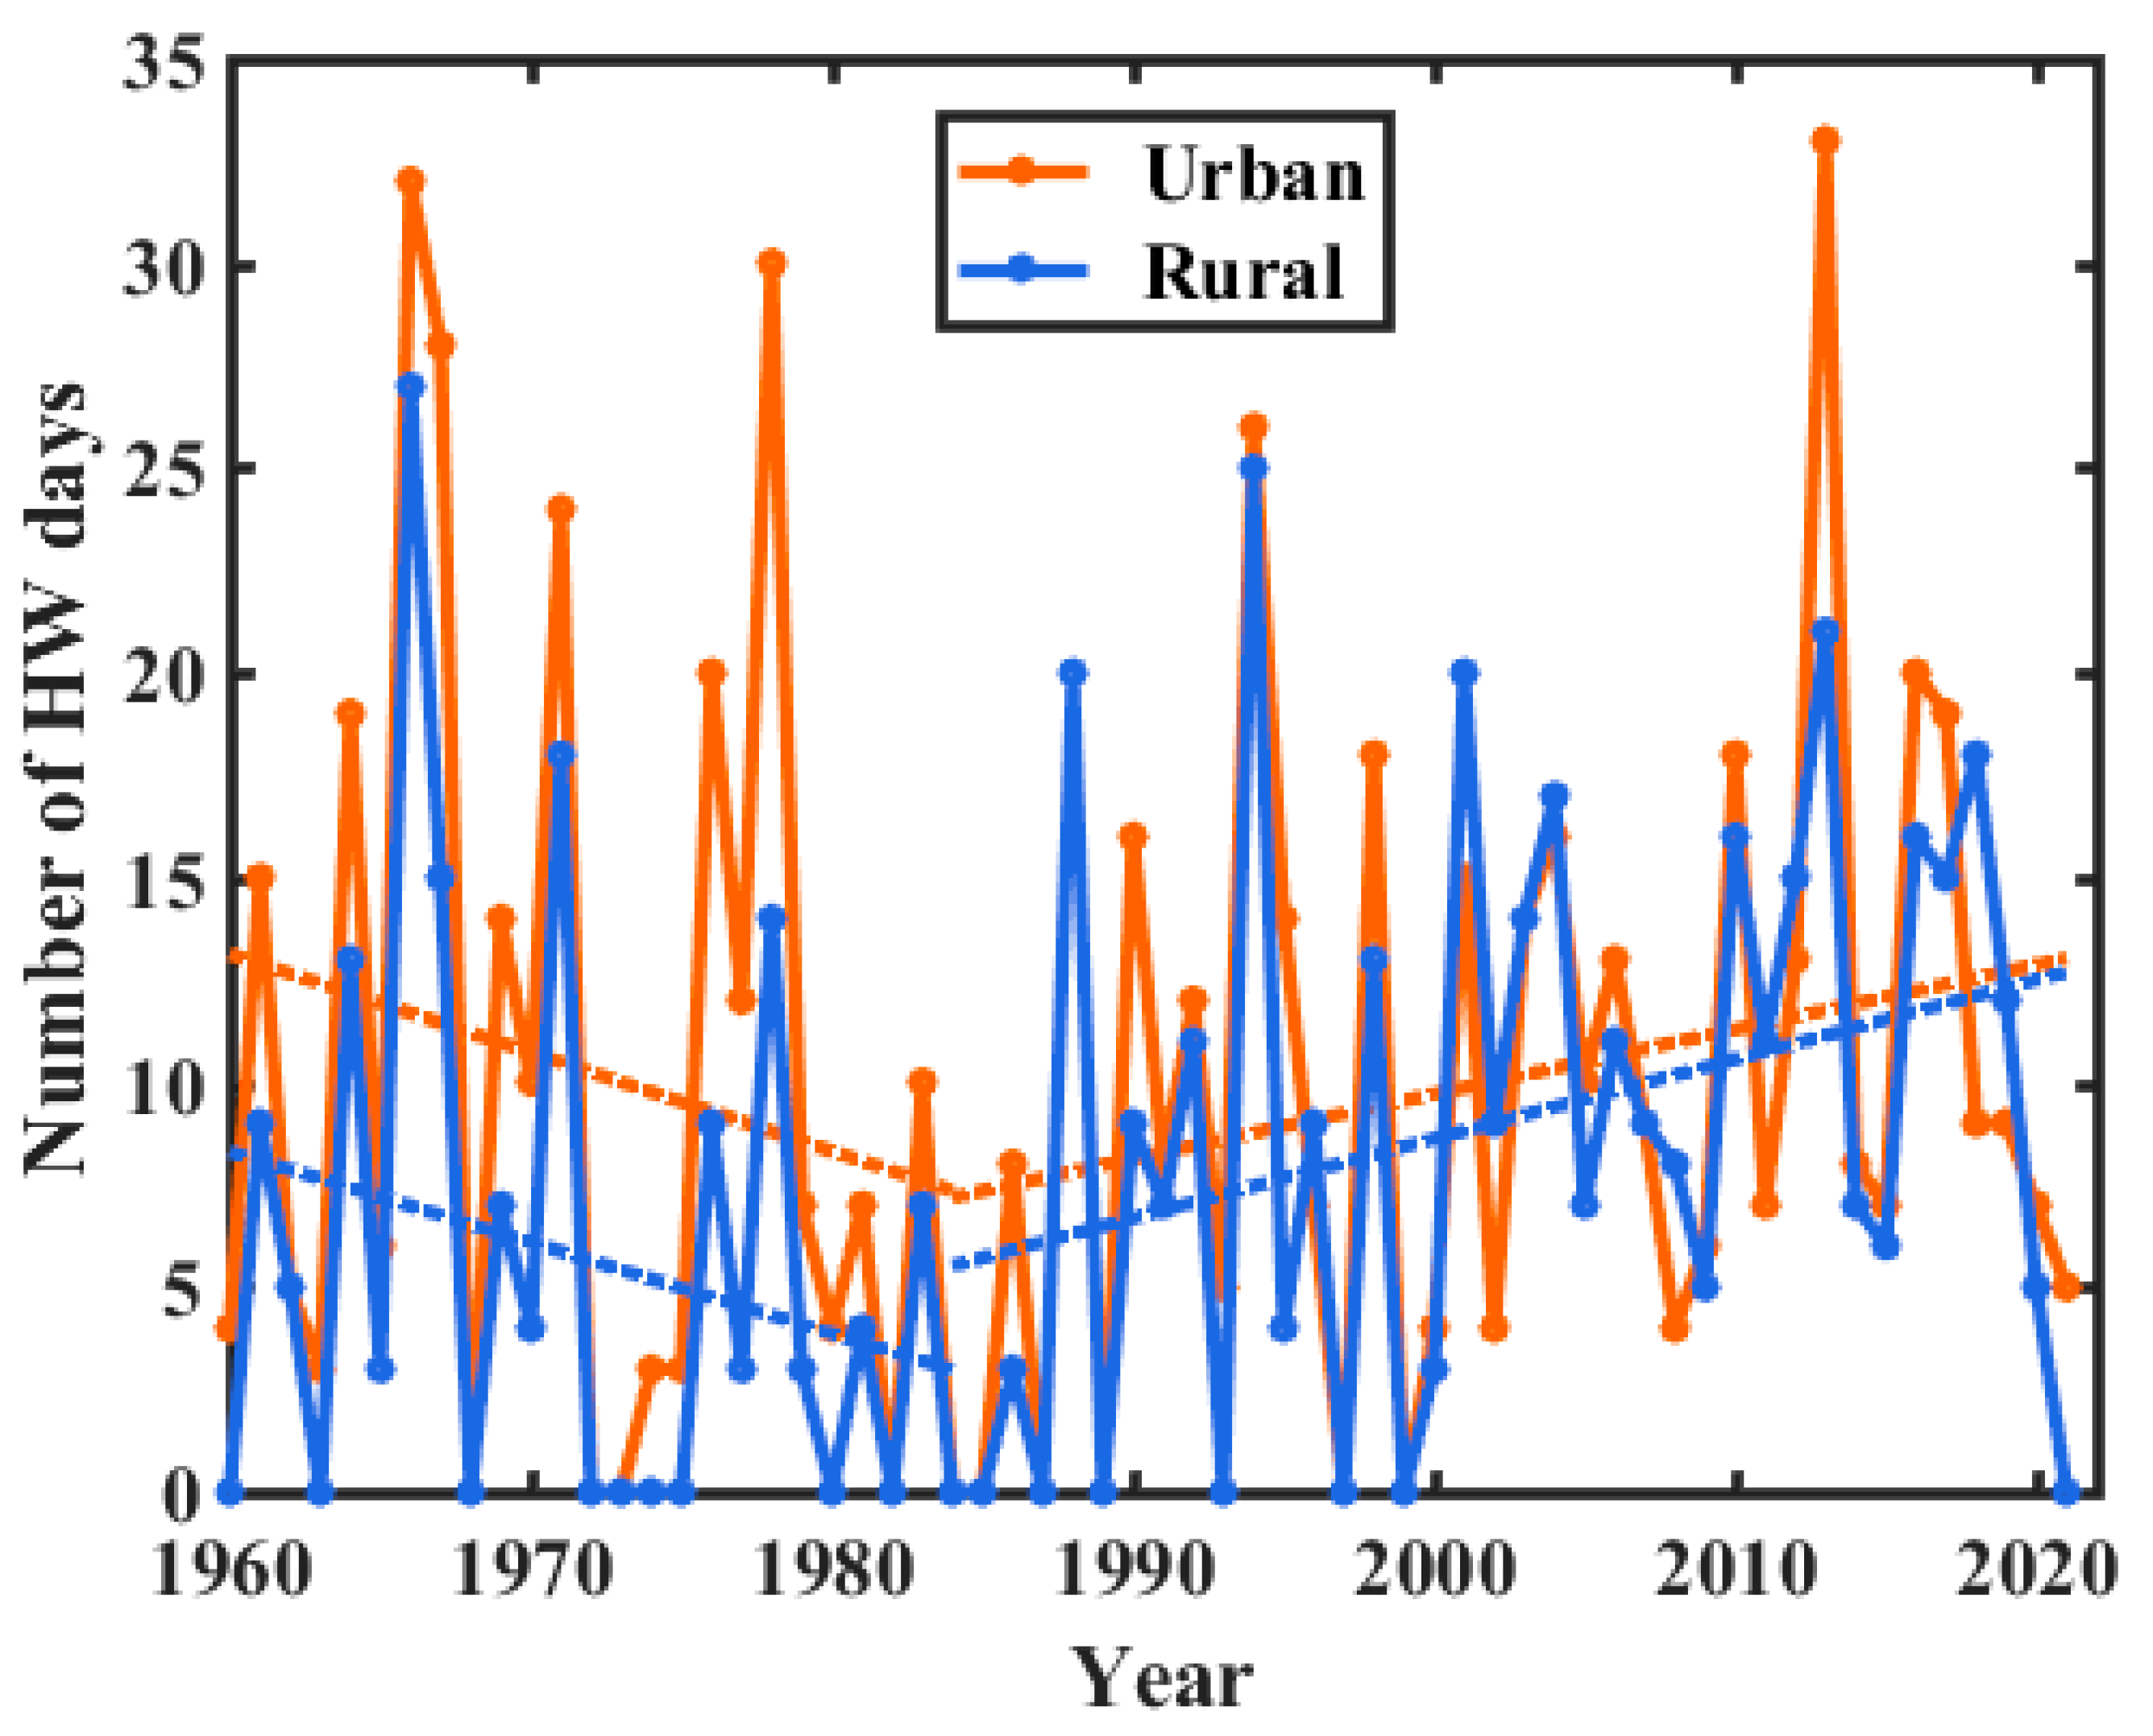
3.3.1. Changes in HW Events and SWPs

Figure 3 shows the 62-year time series for HW days at the urban and rural stations in Nanjing. It can be seen that, before the mid-1980s, the number of HW days shows a significant decreasing trend and the rate of change is slightly higher in urban than rural areas, at −2.4 d/decade and −2.2 d/decade, respectively. However, after the mid-1980s, a significant increasing trend can be seen and the rate of change is slightly higher at the rural than at the urban station, at 0.19 d/decade and 0.16 d/decade, respectively. This is similar to previous reports of extreme maximum temperatures showing a significant warming trend after the 1990s [53,59].
To further elucidate the synoptic weather background during the occurrence of HW days in Nanjing, four favorable weather patterns were identified (Figure 4): (1) Type 1, in which the center of the WPSH is located to the southeast of Nanjing, and Nanjing is under its control, with strong cyclone appearing to the north of Nanjing and prevailing southwesterly winds (Figure 4a); (2) Type 2, which is controlled by the WPSH, with the center of anticyclone located to the east of Nanjing, resulting in prevailing southwesterly winds over Nanjing (Figure 4b); (3) Type 3, which comprises two types of weaker anticyclones appearing in the southeast and northwest of Nanjing, with Nanjing mainly under the control of the southeast anticyclone and a strong cyclone system in the northeast of Nanjing, resulting in very weak southeasterly winds prevailing in Nanjing with almost zero wind speed (Figure 4c); and (4) Type 4, which features a strong WPSH located northeast of Nanjing, controlling the entire area of Nanjing, and weak cyclone located south of Nanjing, leading to prevailing southeasterly winds (Figure 4d). The variability of the prevailing atmospheric circulation system may be directly responsible for significant increases in temperature [43]. Overall, the occurrence of HW days in Nanjing is mainly related to the WPSH (with southerly winds prevailing), and the synoptic weather types favoring the occurrence of HW events follow the order Type 1 (35.15%) > Type 2 (21.87%) > Type 4 (4.84%) > Type 3 (4.21 %).
In order to explore the regulation of HW days by different SWPs, we investigated the variation in the frequency of HW days under the four different synoptic weather types mentioned above (Figure 5). The patterns of variation in HW days under the four weather types were basically similar. However, the decreasing trend of Type 1 and Type 2 was closer to the trend of change in HW days before the mid-1980s (Figure 3); while the increasing trend of Type 3 and Type 4 was more significant after the mid-1980s, which is closely consistent with the trend of change in HW days in that period.
In conclusion, the frequency of extreme HW days declined up until the mid-1980s, which was closely related to the decline in the Type 1 and Type 2 SWPs, and urbanization had no significant effect. However, there was a significant upward trend in HW days after the mid-1980s and this was related to an increase in the Type 3 and Type 4 SWPs, and urbanization again had no significant effect.

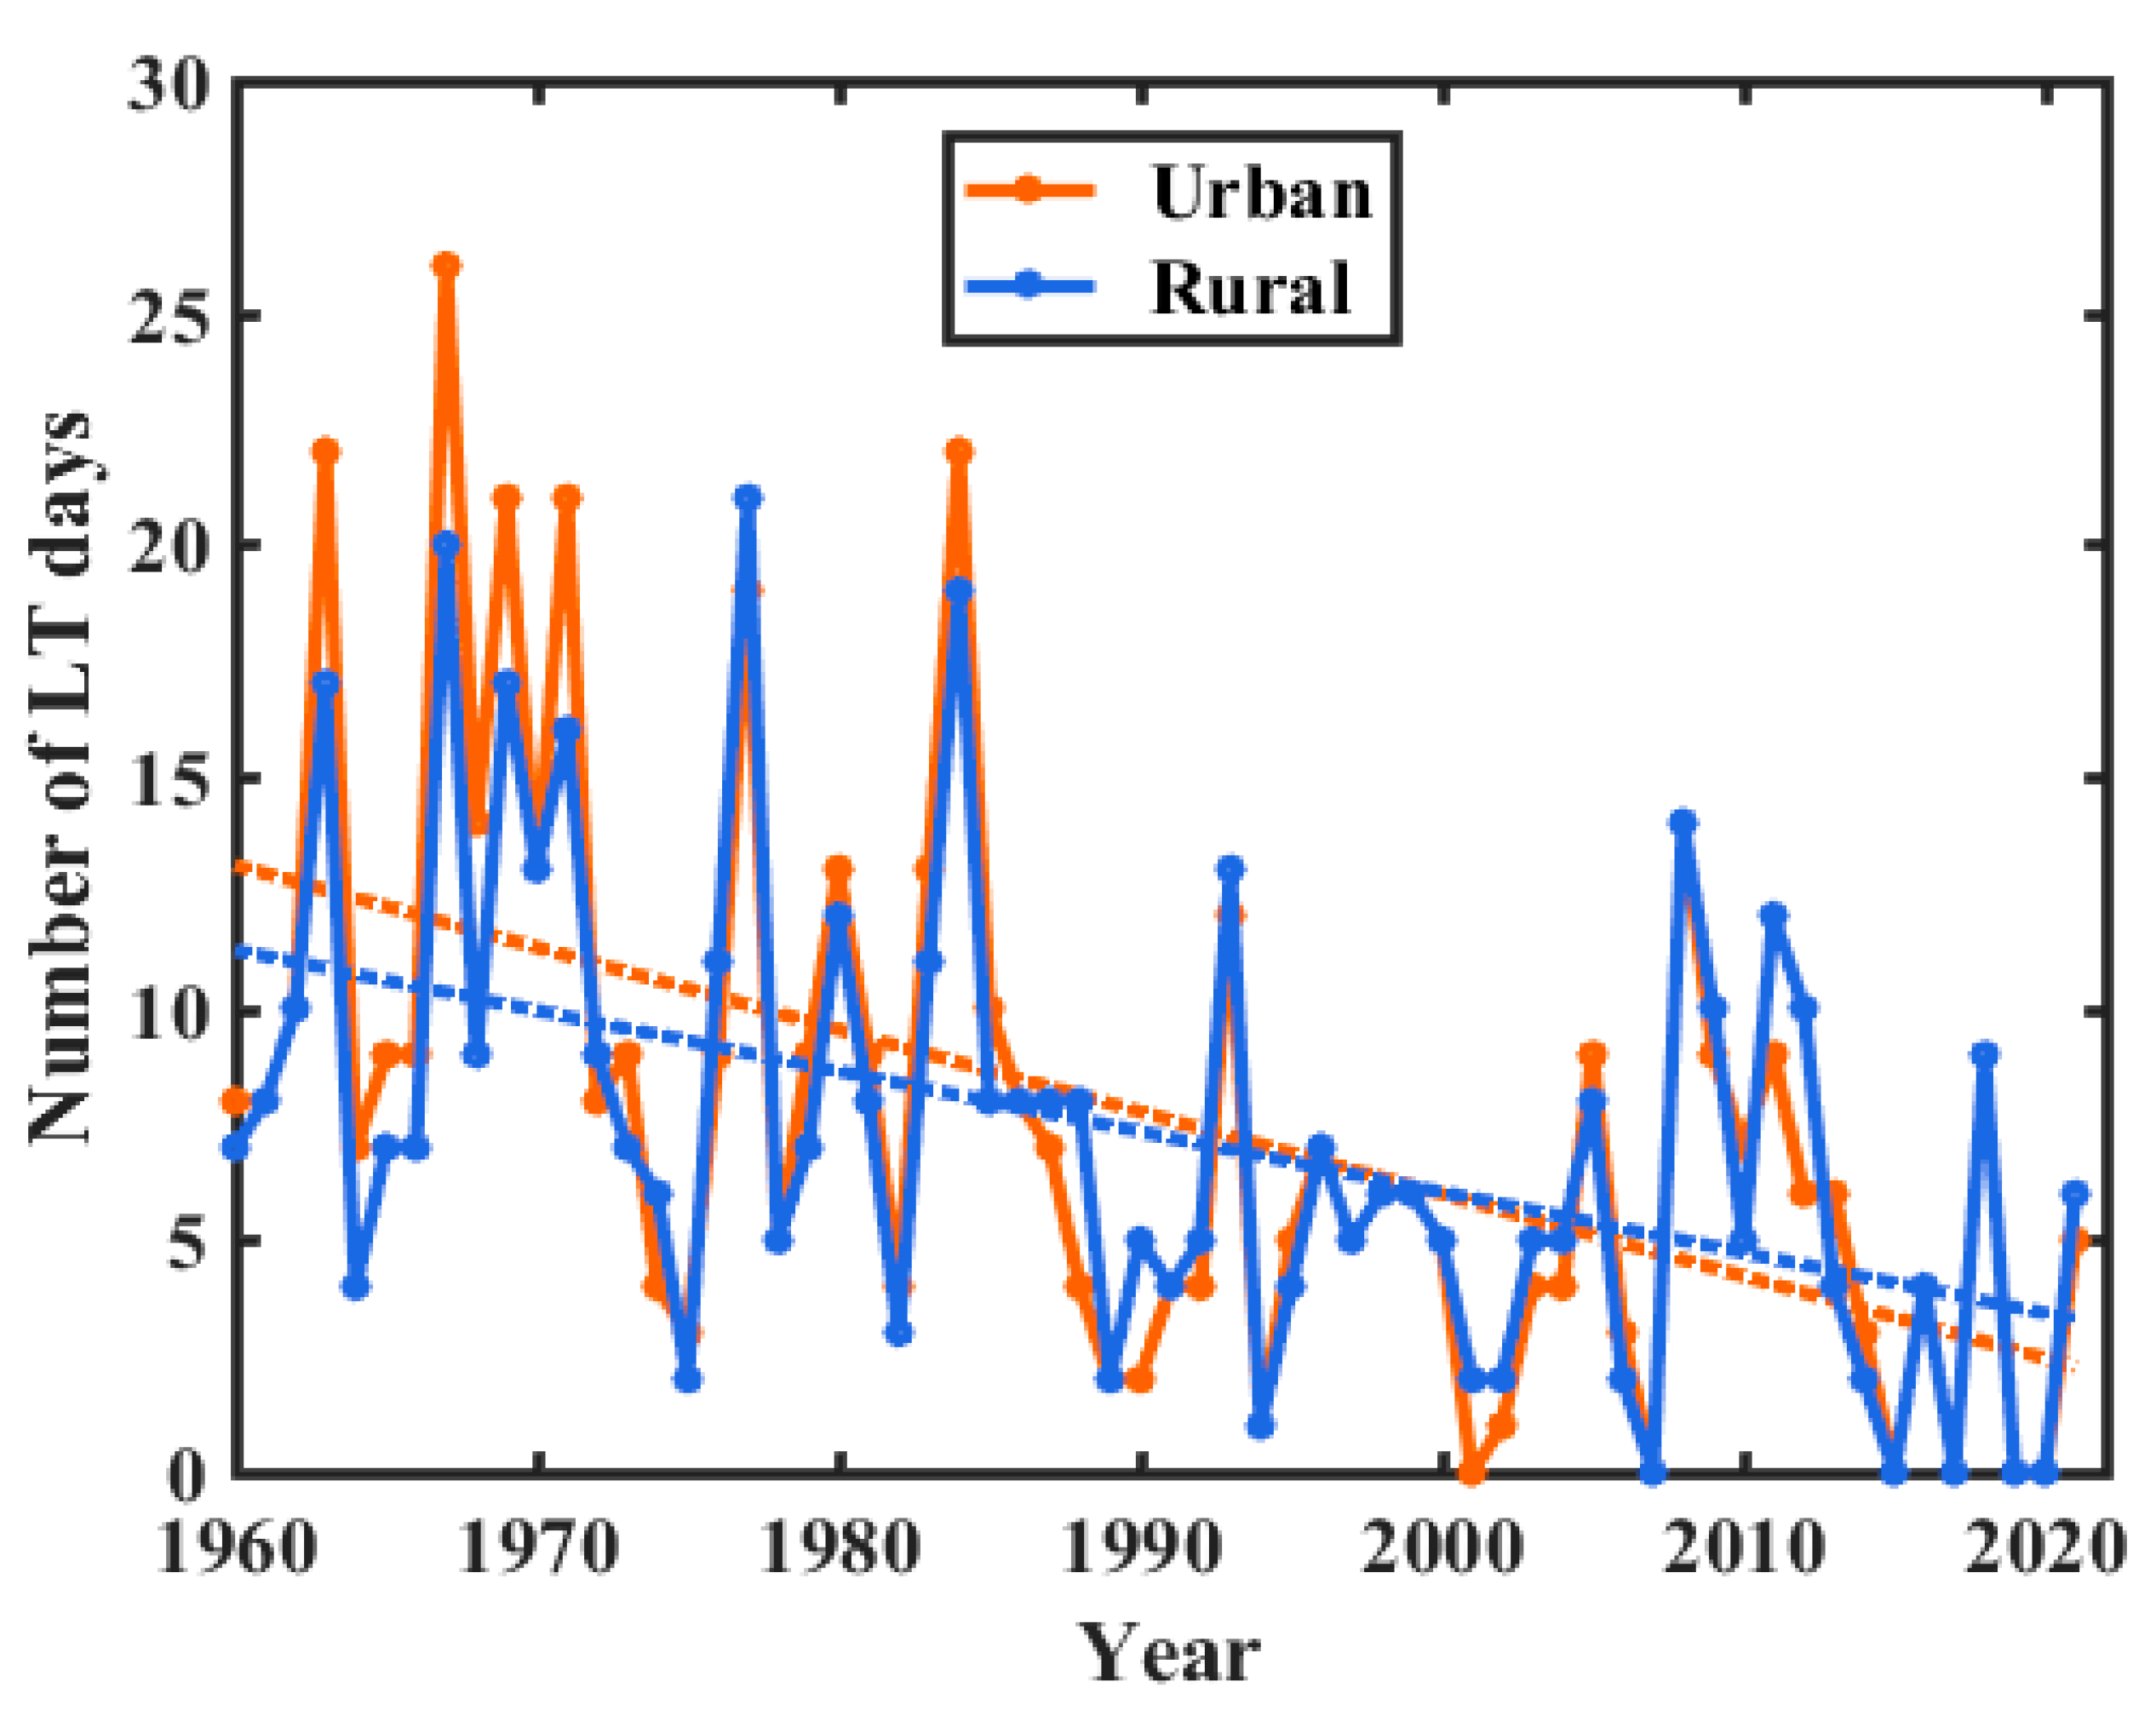
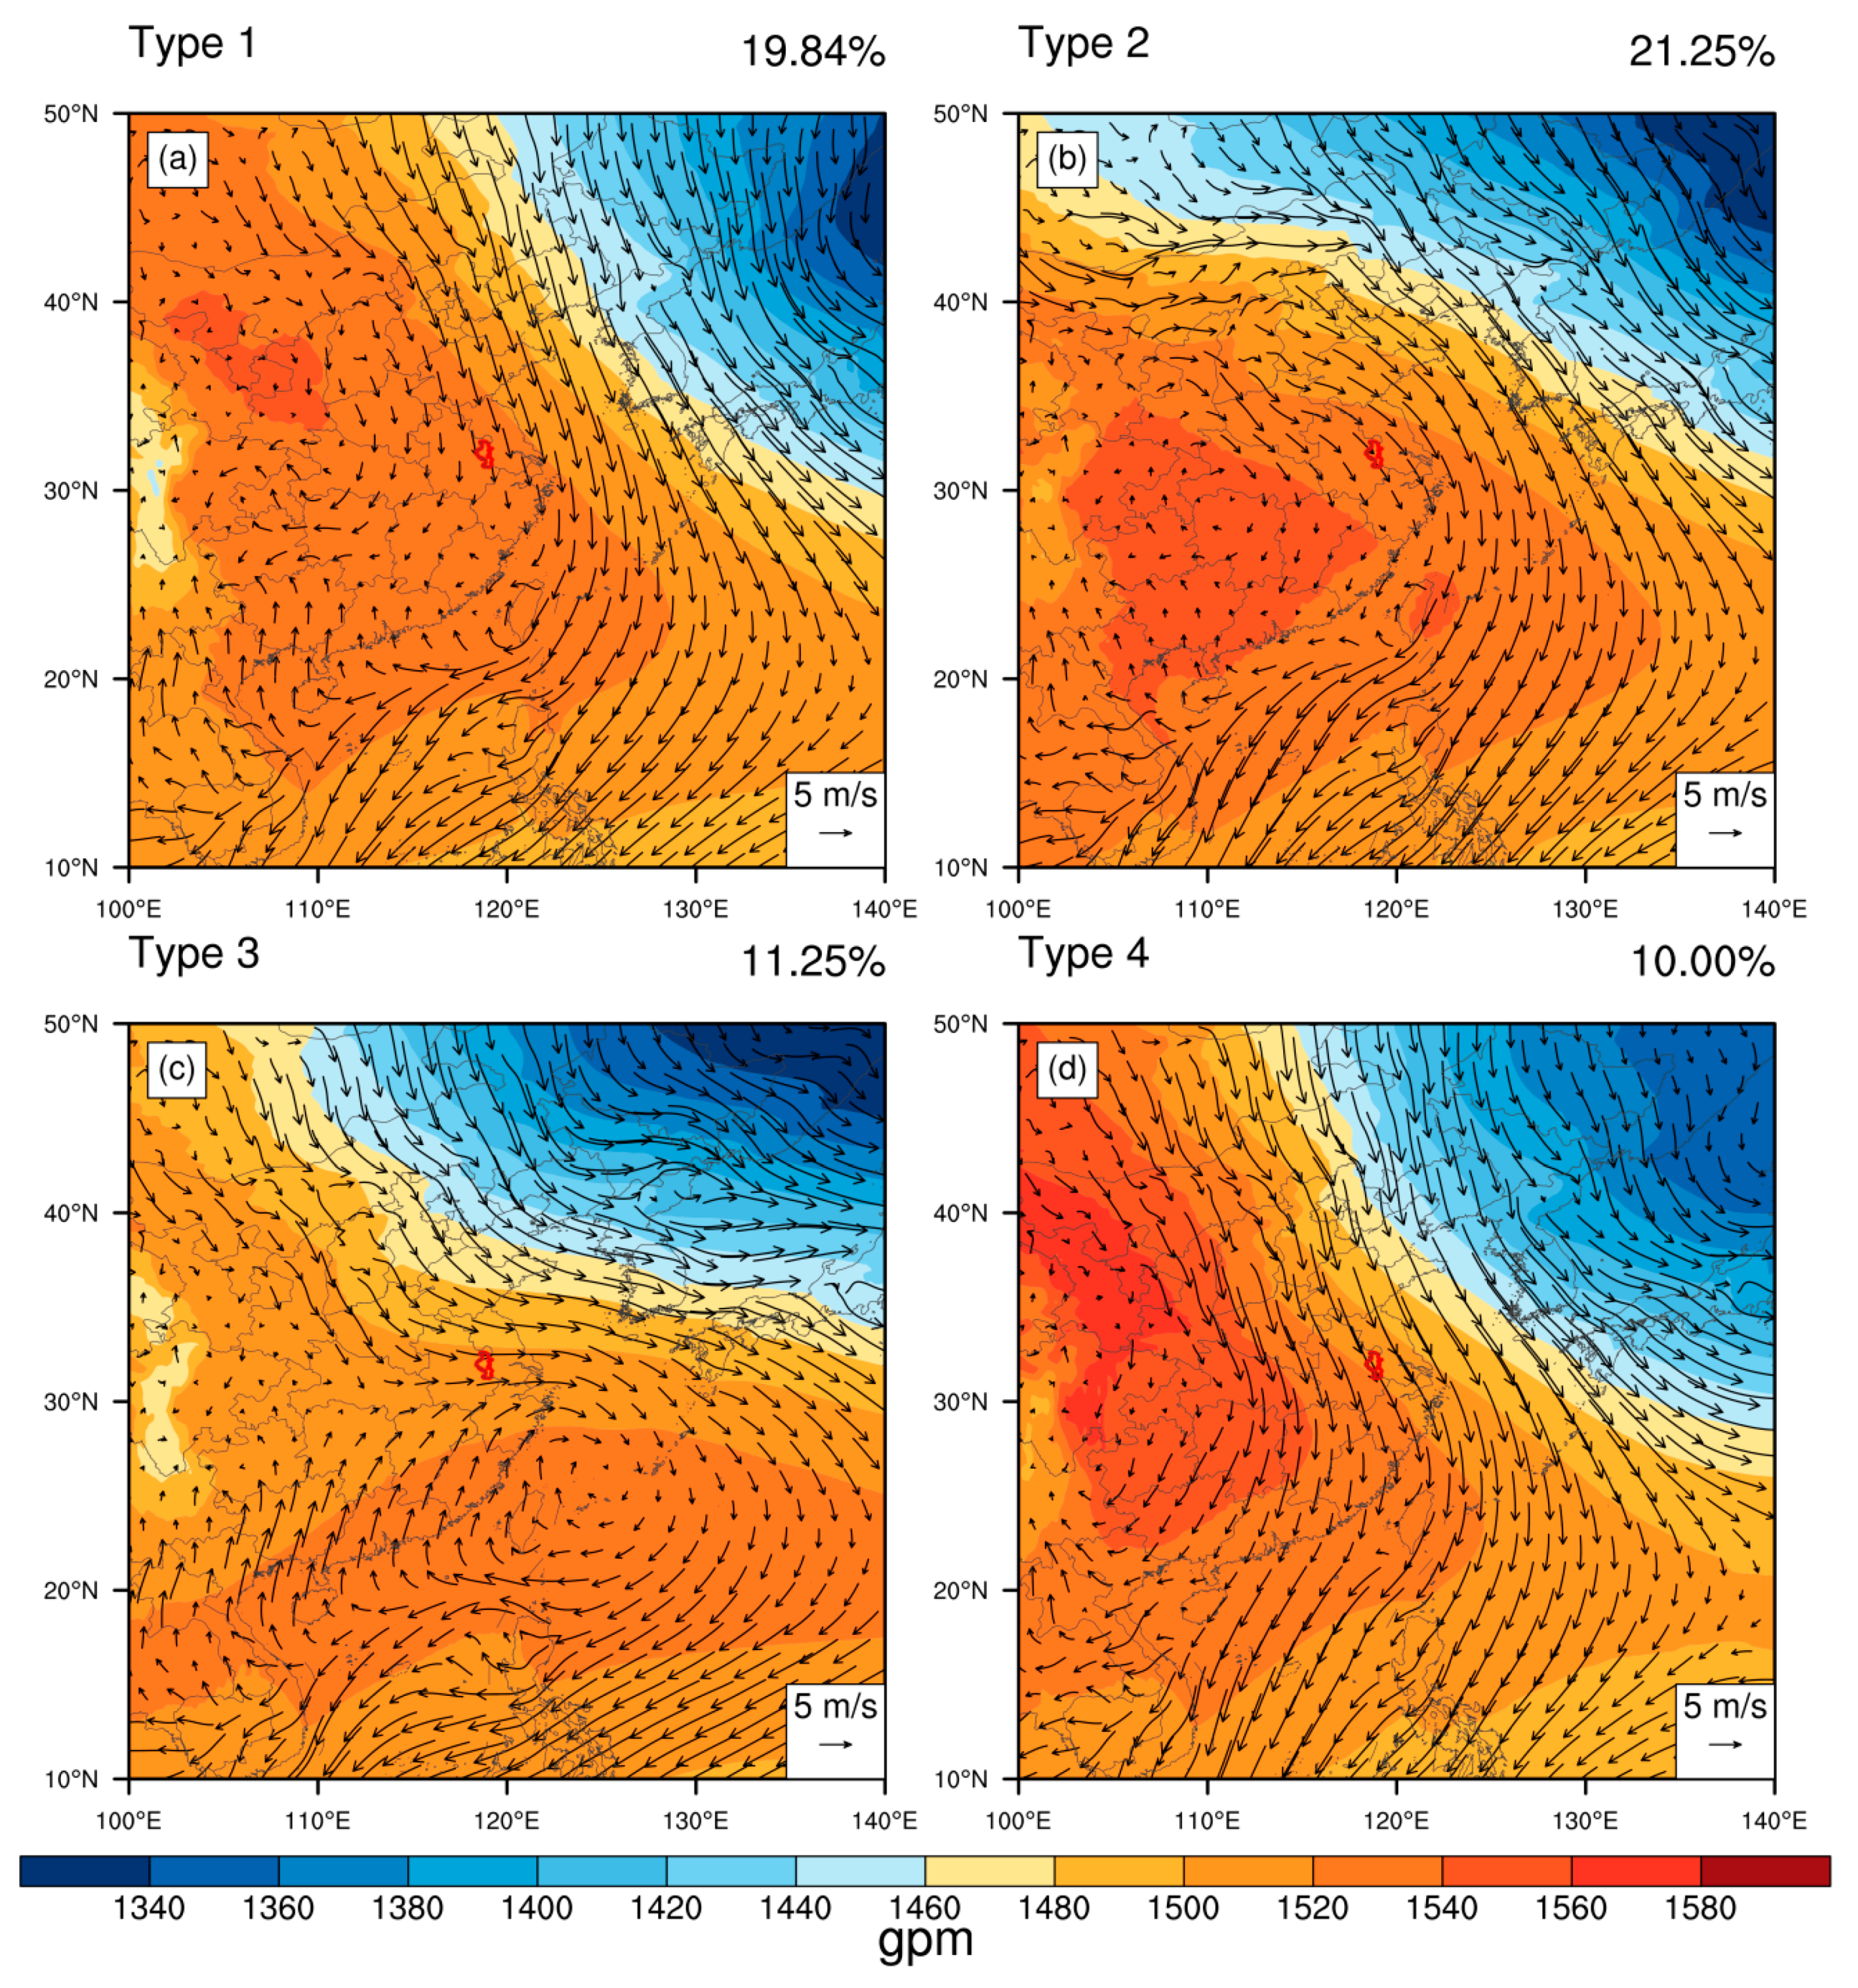
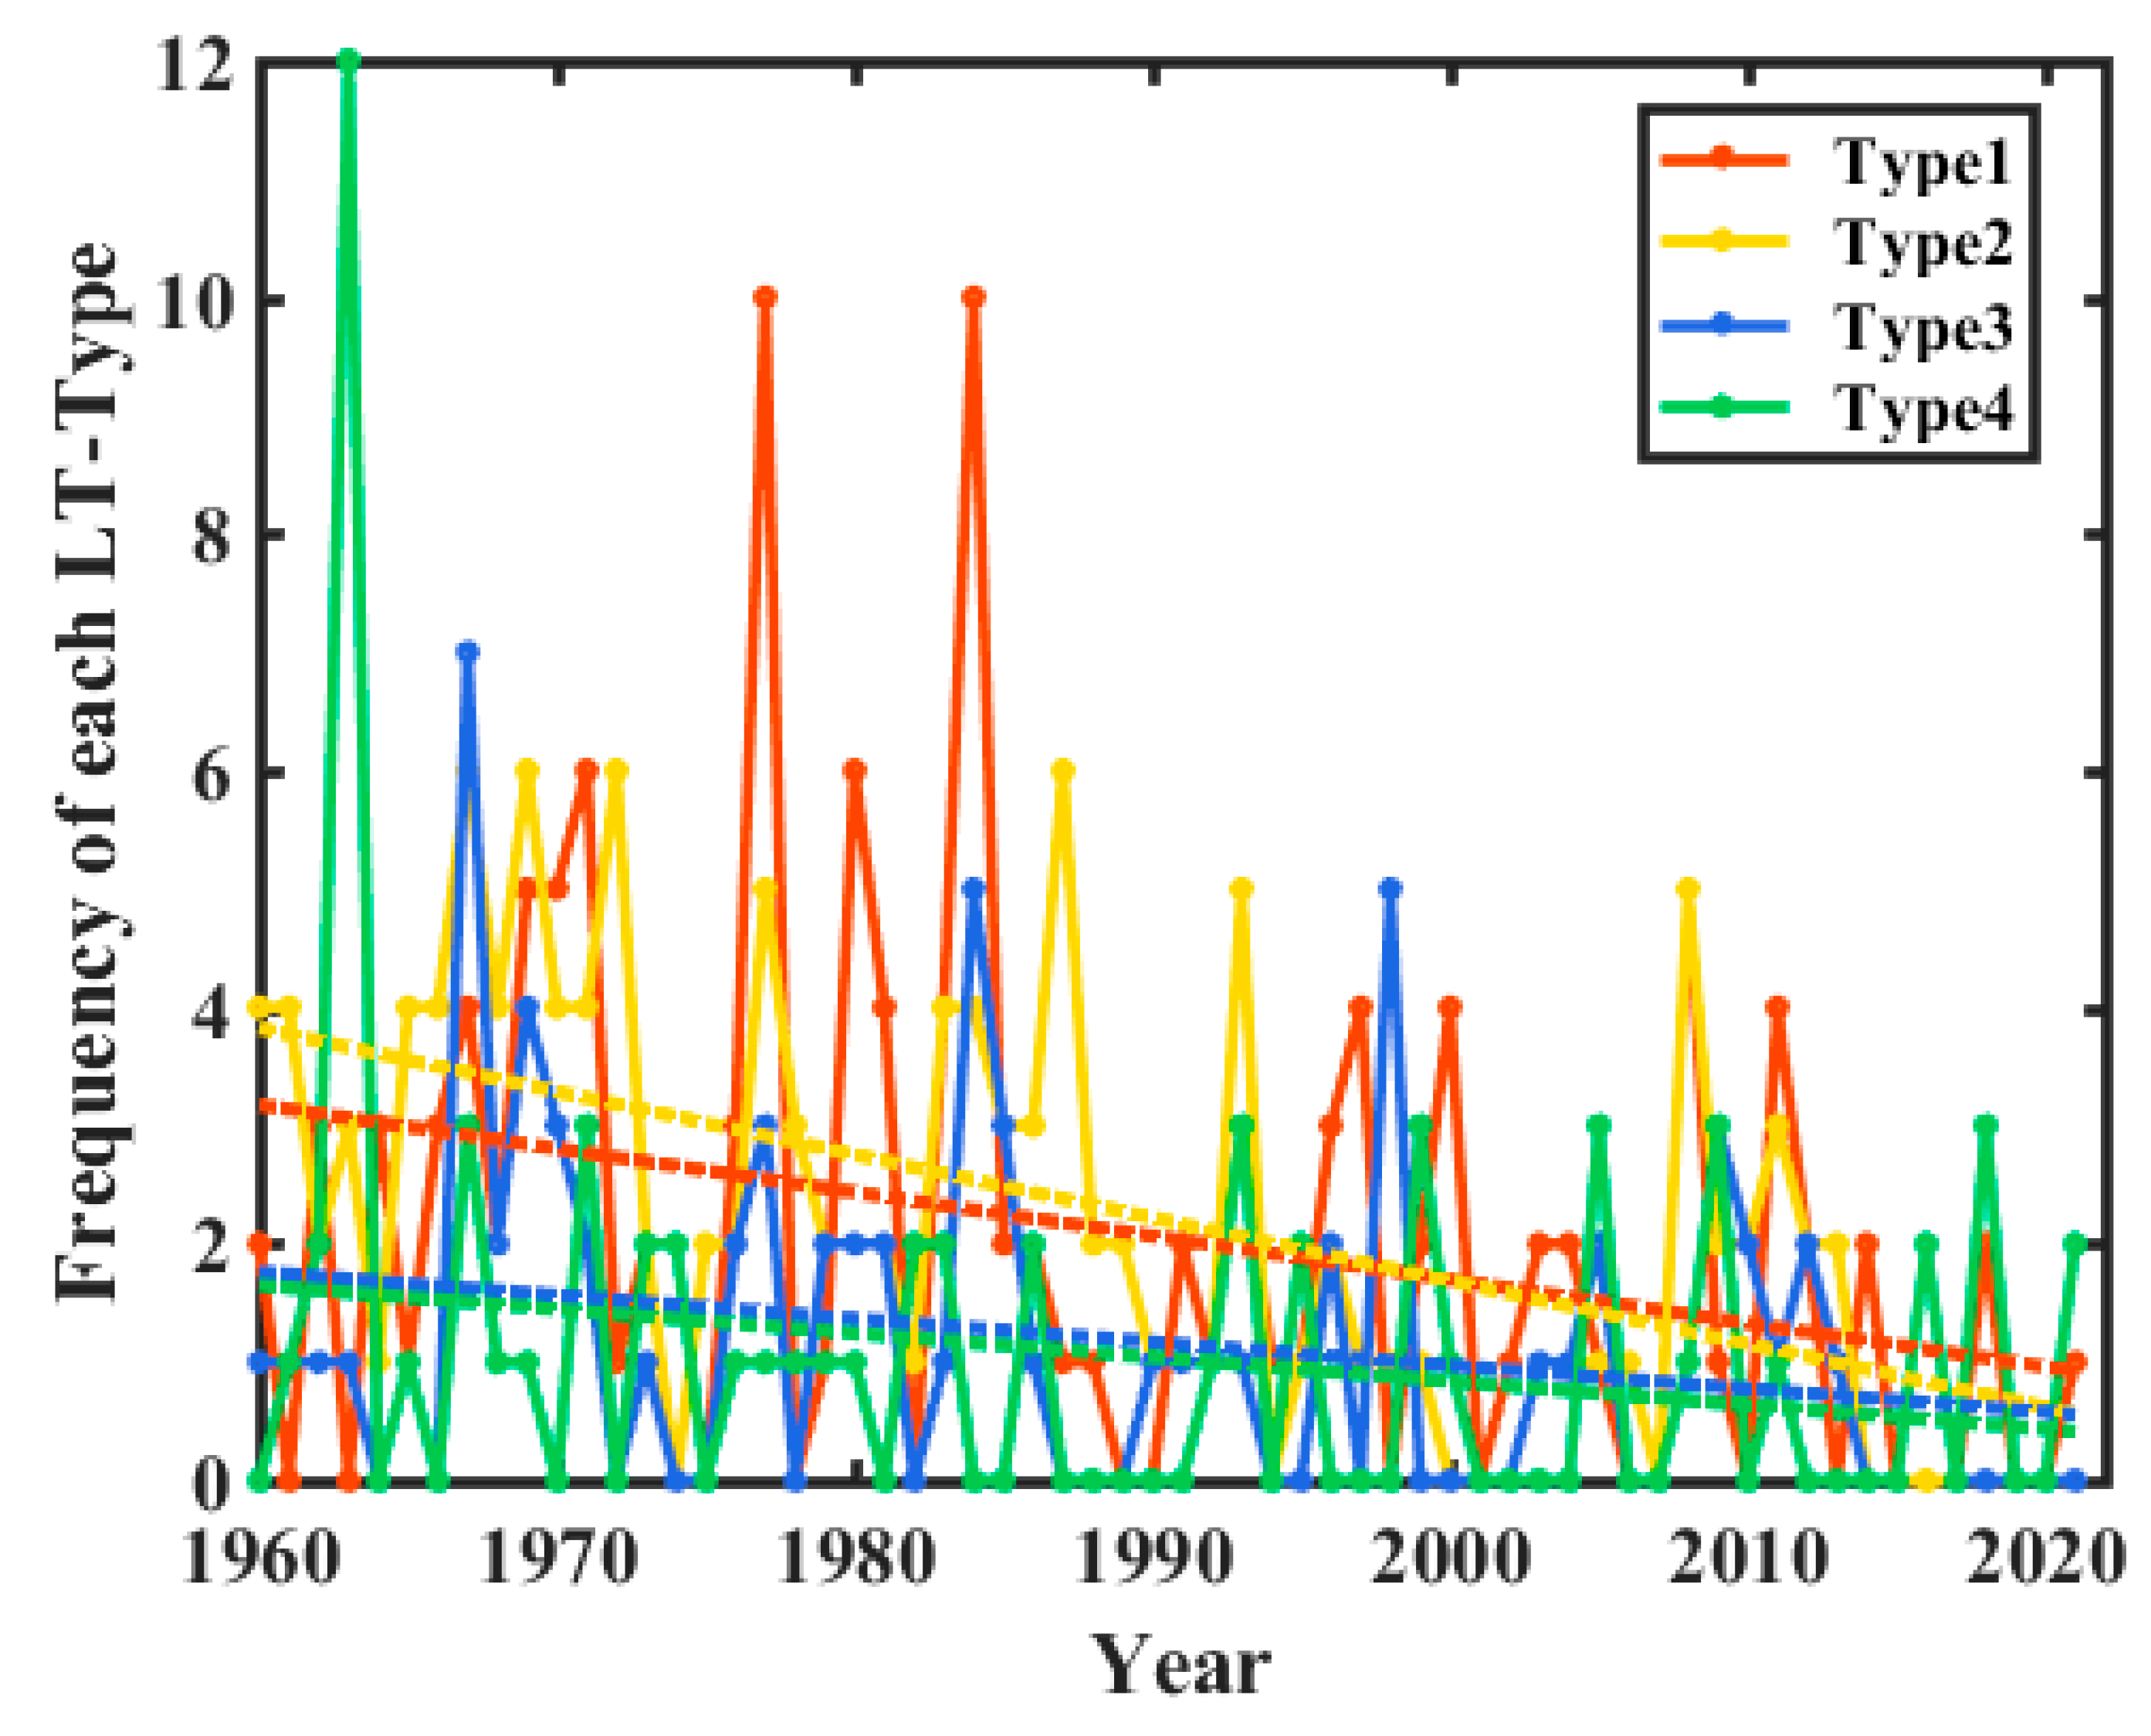
3.3.2. Changes in LT Events and SWPs

Figure 6 shows the 62-year time series for LT days at the urban and rural stations in Nanjing. The trend in extreme LT days was a continuously decreasing one, and the decreasing trend at the urban station was faster than that at the rural station, at 1.8 d/decade and 1.3 d/decade, respectively. This confirms the above conclusion that the warming of the Nanjing area was precisely reflected by the decrease in LT days.
To further elucidate the synoptic weather background for the occurrence of LT days in Nanjing, four favorable weather patterns were identified (Figure 7): (1) Type 1, in which the Mongolian anticyclone center is located in the northwestern part of Nanjing and the northeastern part of Nanjing is controlled by a strong northeastern cold cyclone system with a northwesterly jet over Nanjing under the convergence of anticyclone and cyclone systems, and prevailing northwesterly winds (Figure 7a); (2) Type 2, in which a anticyclone center is located in the southwest of Nanjing with mainly northwesterly winds (Figure 7b); (3) Type 3, with a weaker anticyclone center located in the south of Nanjing leading to prevailing westerly winds over Nanjing (Figure 7c); (4) Type 4, with an anticyclone center located in the west of Nanjing and a weak cyclone system in the northeast near Nanjing, also with a northwesterly jet leading to strong northwesterly winds over Nanjing (Figure 7d). Overall, the occurrence of LT days in Nanjing is mainly due to the control of cold anticyclone (prevailing northerly winds), and the weather types favoring the occurrence of LT days follow the order Type 2 (21.25%) > Type 1 (19.84%) > Type 3 (11.25%) > Type 4 (10.00%).
To explore the regulation of LT days by different SWPs, we investigated the variation in the frequency of LT days under the four different synoptic weather types mentioned above (Figure 8). The patterns of variation in LT days under the four SWPs were basically similar. Notably, the decreasing trend in Type 2 was closer to the trend in LT days.
In conclusion, the frequency of extreme LT days decreased during the study period, a trend that was closest to that of the Type 2 SWP. Also, it is noteworthy that urbanization had a significant impact on it, with a contribution of 27.85%.

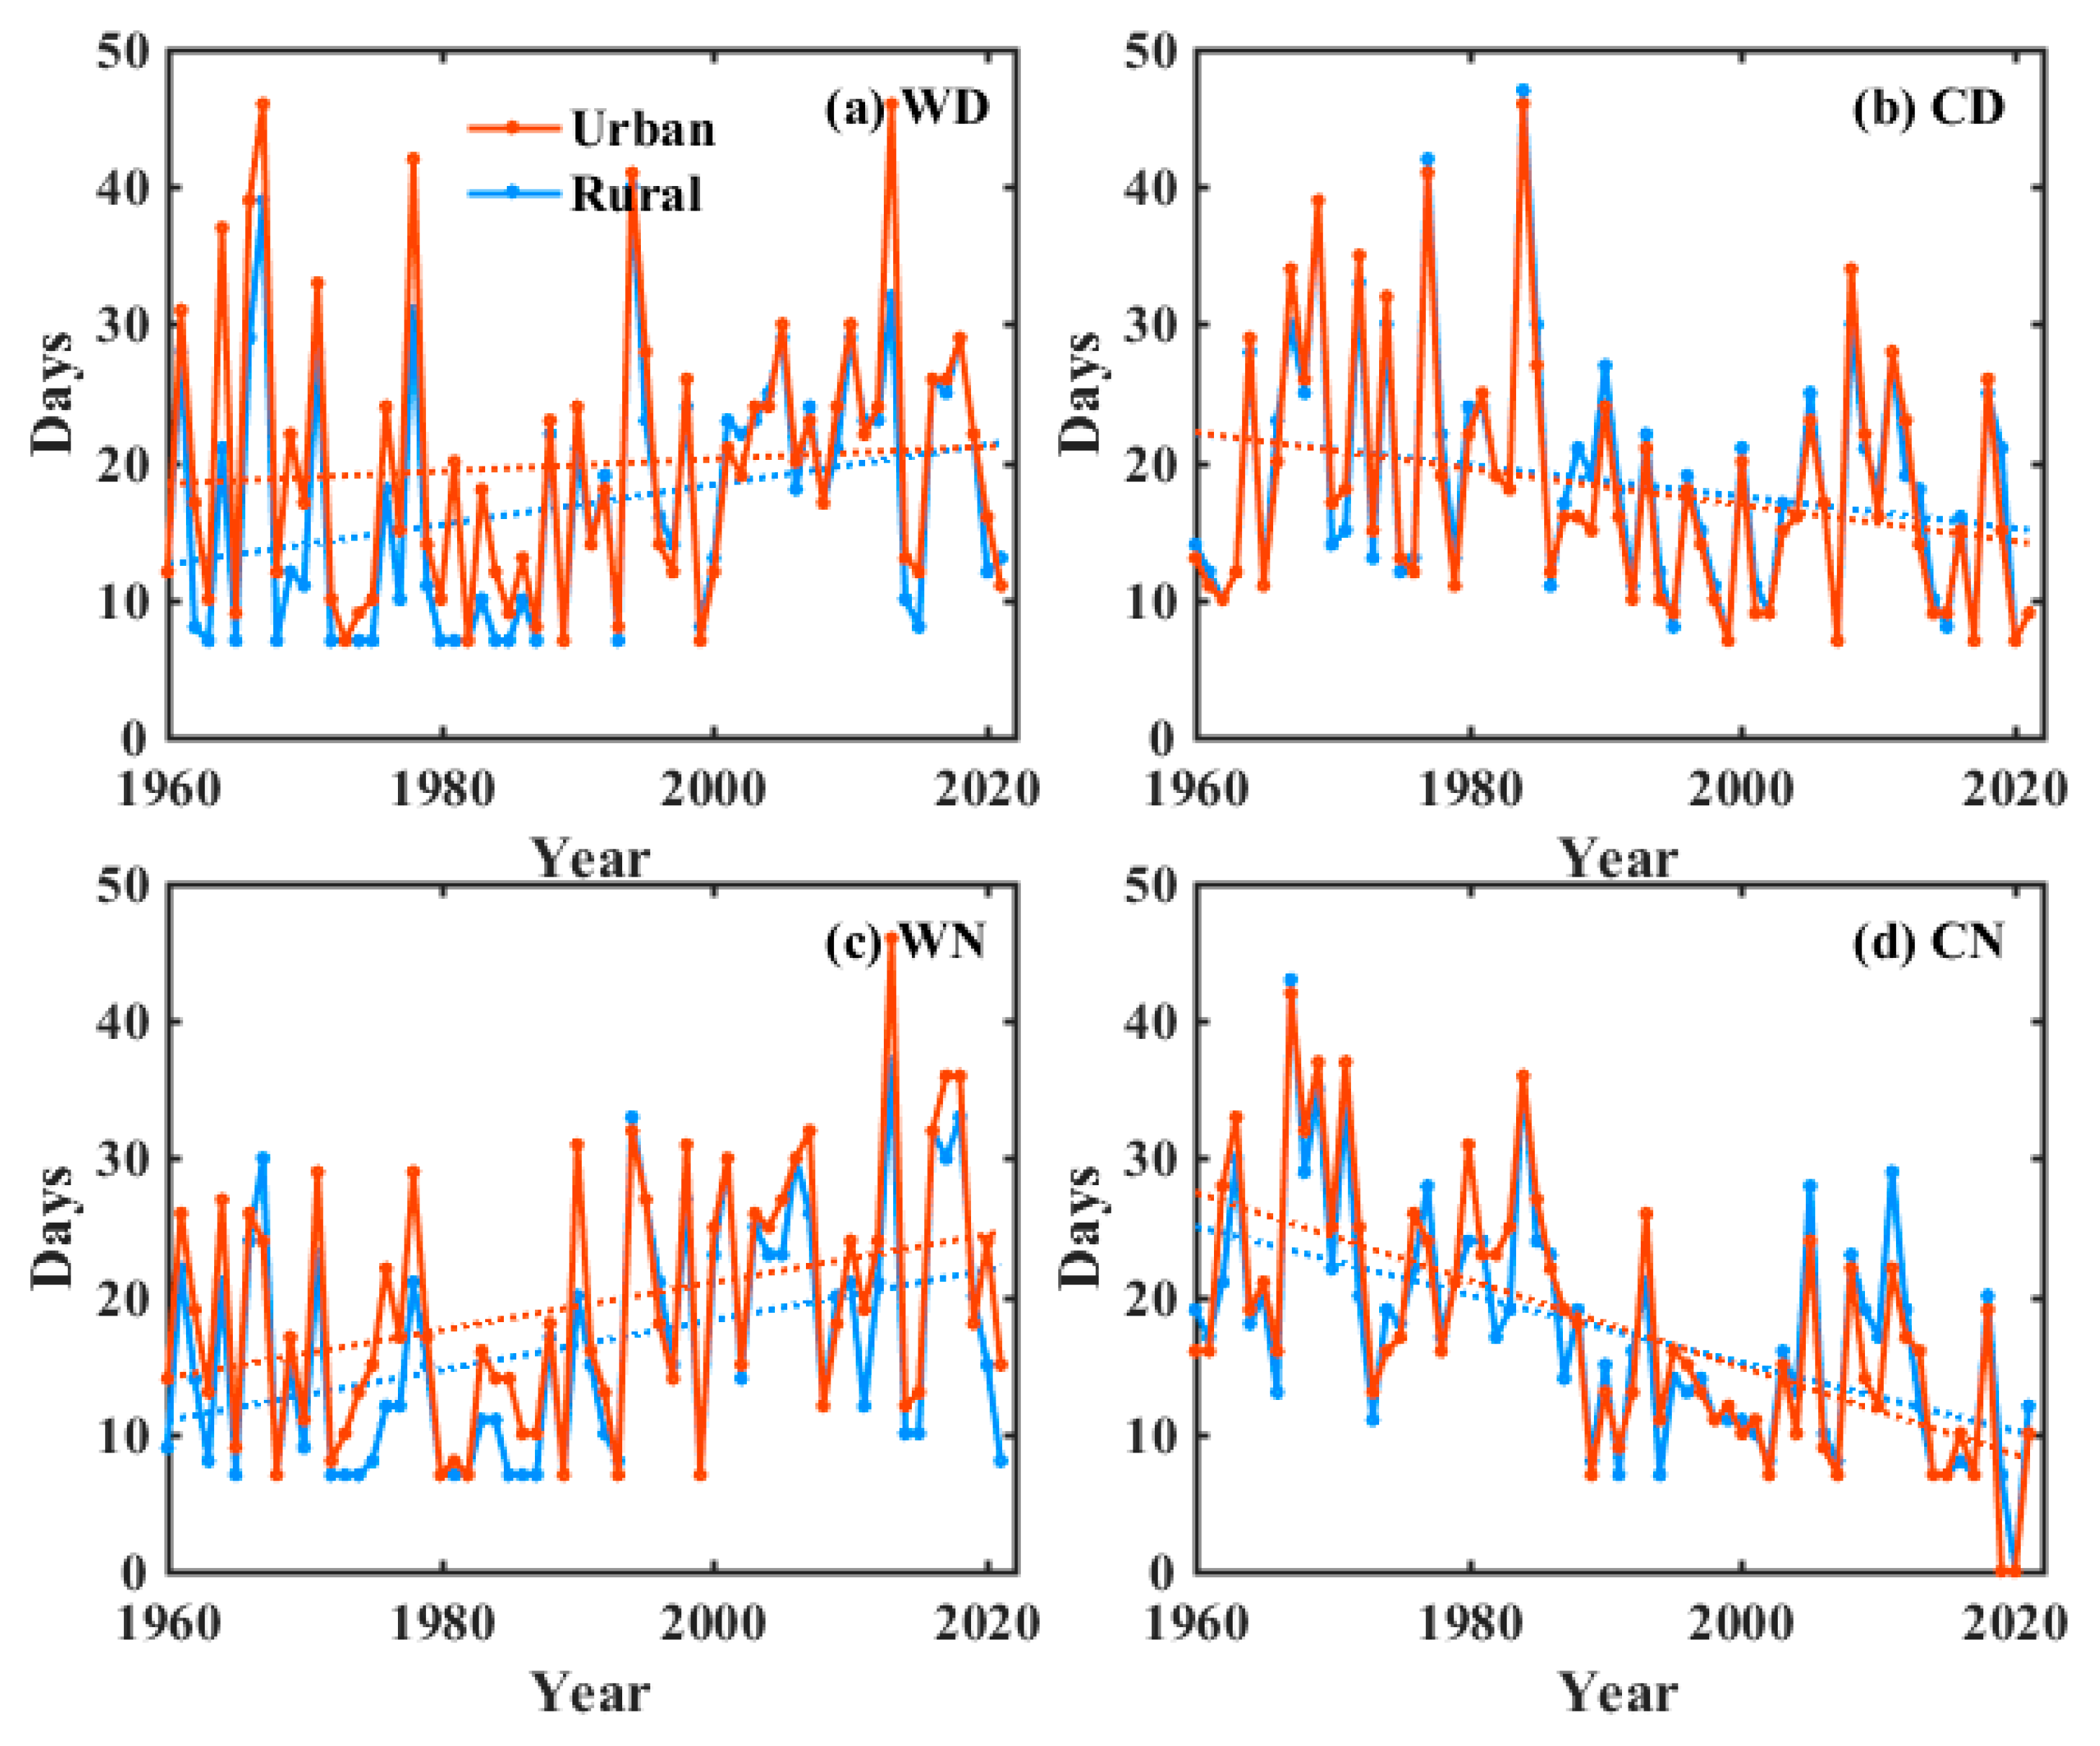
3.4. Changes in Relative Extreme Temperature Indices

The relative extremes of the maximum temperatures include the number of warm days and the number of cold days. Figure 9a shows the trend of warm days in urban and rural areas with an increase of 0.45 d/decade and 1.45 d/decade, respectively (Table S1). The rate of increase in warm days in urban areas was significantly lower than that in rural areas, but did not pass the 0.05 significance test, while the increasing trend in rural areas passed. This increasing trend occurred mainly after the mid-1980s, which is closely consistent with the trend in extreme HW days (Figure 3). Figure 9b shows the trend in the frequency of cold days in urban and rural areas. The decreasing rate of cold days in urban areas was 1.32 d/decade. The reduction rate of 1.15d/decade in rural areas was lower than the reduction rate in urban areas and did not pass the 0.05 significance test (Table S1). The relative extremes of the minimum temperatures include changes in the number of warm nights and cold nights. Figure 9c shows the trend in the number of warm nights in urban and rural areas, from which it can be seen that the number of warm nights was increasing, with increases of 1.74 d/decade and 1.82 d/decade, respectively (Table S1), both passing the 0.05 significance test. Similarly, there was no significant trend in warm nights before the mid-1980s, while a trend of increasing warm nights was clear after that. The significant increase in the frequency of warm nights in Nanjing after the mid-1980s may be related to its rapid economic development and industrialization after China’s “reform and opening up” period. Figure 9d shows that the number of cold nights in urban and rural areas had a clear decreasing trend, with a decrease rate of 3.18 d/decade and 2.48 d/decade, respectively, both passing the 0.05 significance test (Table S1). This is closely consistent with the variation in extreme LT days (Figure 6).

4. Discussion

Previous studies have shown that extreme events have a tendency to spread more intensely, frequently, and destructively in urban areas [7,8,10]. In recent years, studies on extreme events and their associated drivers in China have received increasing attention [11,12,22]. Especially in the context of global warming and still accelerating human activities, the impact of urbanization on regional trends of mean, maximum, and minimum temperatures has been widely analyzed [14,26]. Although the trends vary in different regions, the vast majority of studies show that there is a clear asymmetry in the changes of maximum and minimum temperatures, with the rising trend of minimum temperatures being more pronounced than that of maximum temperatures [24,53,54]. This is generally consistent with the results of our study. However, the difference is that in our study urbanization contributed the most to the average temperature, and the second most to the minimum temperature, with warming contributions of 26.5% and 20.9%, respectively, while the contribution to the maximum temperature did not pass the significance test. Similarly, the contribution of urbanization to extreme high temperature did not pass the significance test, but the contribution to extreme low temperature reached 27.9%.
From a seasonal perspective, urbanization made the greatest contribution to the maximum temperature in spring, to the average temperature in autumn, and to the minimum temperature in summer and winter. This differs from previous studies [24,54], which may be due to climate differences caused by regional differences in urbanization or differences in station selection and classification. In addition, compared to previous studies [40,46,53], we further explored the contribution of large-scale circulation in urban climate extremes. The occurrence of extreme heat waves in Nanjing is mainly related to WPSH (prevailing southerly winds), and the occurrence of extreme low temperatures is mainly due to the control of cold anticyclones (prevailing northerly winds), and different types of weather types contribute differently (specific results are presented above and will not be repeated here).
Relative extreme temperature indices have changed significantly in many regions of the world over the past half-century [24,26,60,61]. These changes are closely related to the changes in extreme HW and LT events, as both relative extreme temperature indices depend on daily maximum and minimum temperature records. In the case of the urban station, the two indices of warm days and HW days were strongly positively correlated (correlation coefficient r = 0.91) (Table 2). After removing the linear trend, the correlation was still strong (r = 0.90, >99% confidence level), indicating that the annual variability of warm days was closely related to the variability of HW days. Cold days and LT days showed a strong positive correlation (r = 0.89). After removing the linear trend, the correlation was still strong (r = 0.84, >99% confidence level), indicating that the annual variability of cold days was closely related to that of LT days. Similarly, warm nights and cold nights were closely correlated with HW and LT days, respectively.
Global warming means not only an increase in global temperature but also a change in the climate system, the most direct impact of which leads to extreme events such as HWs, LTs, floods, and droughts. The health risks associated with extreme weather threaten the fate and health of all mankind [2,3,13,51]. For instance, in summer of 2022, the average temperature in mid-eastern China was the highest since 1961 and the average precipitation was the second lowest controlled by an anomalous high pressure system, with 15.1% of national weather stations recording daily maximum temperatures that were equal to or exceeded recorded historical extremes, together causing problems for electricity supply, drought conditions, cases of heat stroke, and even deaths [62,63]. The impact of ambient temperature on residential mortality was systematically assessed at the national level in a study covering 272 major cities in China and collecting data on 1,826,000 non-accidental deaths [64]. From the perspective of interannual variation in synoptic patterns, therefore, understanding long-term changes in extreme cold and warm events is important for the detection and attribution of climate change and human health adaptation in cities, especially for a densely populated city.

5. Conclusions

This study investigated the long-term maximum/mean/minimum temperature trends and extreme cold and warm event trends from 1960–2021 in Nanjing, China, as well as the role of SWPs and urbanization in the changes in these trends, based on surface observations and reanalysis data. The following conclusions were obtained.
Over the past 62 years, the maximum/mean/minimum temperatures in Nanjing showed a significant upward trend (0.17, 0.34, and 0.67 °C/decade for the urban station; 0.31, 0.25, and 0.53 °C/decade for the rural station), with the minimum temperature warming rates being the most significant. In spring, the greatest warming rate of 0.45 °C/decade was observed for the mean temperature. In summer, autumn, and winter, the warming rate of the minimum temperatures was the largest, reaching 0.38 °C/decade, 0.73 °C/decade, and 0.67 °C/decade, respectively. This indicates that the warming in Nanjing was more obvious in the minimum temperatures, and the Nanjing area was gradually warming in autumn and winter.
The extreme high temperatures showed a decreasing trend until the mid-1980s, closely related to the decrease in the two SWPs with prevailing southwesterly winds (Types 1 and 2). Then, a significant increasing trend was observed, mainly related to the increase in SWPs with prevailing southeasterly winds (Types 3 and 4). The number of warm days was strongly positively correlated with extreme high temperatures during the study period, and about 91% of the warm day interannual variation can be explained by extreme high temperature variation. The frequency of extreme LT days showed a significant decreasing trend. The number of cold nights was strongly and positively correlated with extreme LTs, and about 85% of the cold night interannual variation can be explained by extreme LT variation. The relative extreme indexes of warm days and warm nights generally showed an upward trend, while cold days and cold nights showed a downward trend. Note that the trends in warm days and warm nights remained closely consistent with that of HW days, and, likewise, the trends in cold days and cold nights were also highly consistent with that of LT days.
In general, our findings provide a useful scientific reference for climate prediction, urban planning, and human development from the perspective of synoptic weather patterns and urbanization in large, high-density cities.

Supplementary Materials

The following supporting information can be downloaded at: https://www.mdpi.com/article/10.3390/land12010162/s1. Figure S1. Time series of maximum/mean/minimum temperature in urban areas and rural areas during 1960–2021; Table S1. Interannual and intraseasonal trends in urban and rural warm days; cold days; warm nights; cold nights, along with the contribution of urbanization.

Author Contributions

Conceptualization, Y.Y.; methodology, W.T. and Y.Y.; data curation, D.L. and W.T.; software, W.T.; validation, W.T. and Y.Y.; formal analysis, W.T., L.Z., Y.D., D.L. and Y.Y.; writing—original draft preparation, W.T.; writing—review and editing, W.T., L.Z., Y.D., D.L. and Y.Y.; visualization, W.T.; supervision, Y.Y.; funding acquisition, Y.Y. All authors have read and agreed to the published version of the manuscript.

Funding

This study is supported by the National Natural Science Foundation of China (42222503 and 42175098).

Institutional Review Board Statement

Not applicable.

Informed Consent Statement

Not applicable.

Data Availability Statement

Please direct any inquiries regarding the data to the corresponding author ([email protected]).

Acknowledgments

We thank all the scientists, engineers, and students who participated in the field experiments, maintained the instruments, and processed the measurements.

Conflicts of Interest

The authors declare no conflict of interest.

References

  1. IPCC. Climate Change 2021: The Physical Science Basis. Contribution of Working Group I to the Sixth Assessment Report of the Intergovernmental Panel on Climate Change; Masson-Delmotte, V., Zhai, P., Pirani, A., Connors, S., Péan, C., Berger, S., Caud, N., Chen, Y., Goldfarb, L., Gomis, M., et al., Eds.; Cambridge University Press: Cambridge, UK; New York, NY, USA, 2021; in press. [Google Scholar]
  2. AghaKouchak, A.; Cheng, L.; Mazdiyasni, O.; Farahmand, A. Global warming and changes in risk of concurrent climate extremes: Insights from the 2014 California drought. Geophys. Res. Lett. 2014, 41, 8847–8852. [Google Scholar] [CrossRef] [Green Version]
  3. Gasparrini, A.; Guo, Y.; Hashizume, M.; Lavigne, E.; Zanobetti, A.; Schwartz, J.; Tobias, A.; Tong, S.; Rocklöv, J.; Forsberg, B.; et al. Mortality risk attributable to high and low ambient temperature: A multicountry observational study. Lancet 2015, 386, 369–375. [Google Scholar] [CrossRef] [PubMed]
  4. Tao, F.; Yokozawa, M.; Liu, J.; Zhang, Z. Climate–crop yield relationships at provincial scales in China and the impacts of recent climate trends. Clim. Res. 2008, 38, 83–94. [Google Scholar] [CrossRef]
  5. Kovats, S.; Akhtar, R. Climate, climate change and human health in Asian cities. Environ. Urban. 2008, 20, 165–175. [Google Scholar] [CrossRef]
  6. Hondula, D.M.; Balling, R.C.; Vanos, J.K.; Georgescu, M. Rising Temperatures, Human Health, and the Role of Adaptation. Curr. Clim. Change Rep. 2015, 1, 144–154. [Google Scholar] [CrossRef] [Green Version]
  7. Trenberth, K.E.; Fasullo, J.T. Climate extremes and climate change: The Russian heat wave and other climate extremes of 2010. J. Geophys. Res. Atmos. 2012, 117, 17103. [Google Scholar] [CrossRef]
  8. Mukherjee, S.; Mishra, A.K. Increase in Compound Drought and Heatwaves in a Warming World. Geophys. Res. Lett. 2021, 48, e2020GL090617. [Google Scholar] [CrossRef]
  9. Vose, R.S.; Easterling, D.R.; Gleason, B. Maximum and minimum temperature trends for the globe: An update through 2004. Geophys. Res. Lett. 2005, 32, 1–5. [Google Scholar] [CrossRef] [Green Version]
  10. Meehl, G.A.; Tebaldi, C. More Intense, More Frequent, and Longer Lasting Heat Waves in the 21st Century. Science 2004, 305, 994–997. [Google Scholar] [CrossRef] [Green Version]
  11. Ren, G.; Zhou, Y.; Chu, Z.; Zhou, J.; Zhang, A.; Guo, J.; Liu, X. Urbanization Effects on Observed Surface Air Temperature Trends in North China. J. Clim. 2008, 21, 1333–1348. [Google Scholar] [CrossRef]
  12. Luo, M.; Lau, N.-C. Heat Waves in Southern China: Synoptic Behavior, Long-Term Change, and Urbanization Effects. J. Clim. 2017, 30, 703–720. [Google Scholar] [CrossRef]
  13. Luo, M.; Lau, N. Increasing Human-Perceived Heat Stress Risks Exacerbated by Urbanization in China: A Comparative Study Based on Multiple Metrics. Earth’s Future 2021, 9, e2020EF001848. [Google Scholar] [CrossRef]
  14. Zhang, P.; Ren, G.; Qin, Y.; Zhai, Y.; Zhai, T.; Tysa, S.K.; Xue, X.; Yang, G.; Sun, X. Urbanization Effects on Estimates of Global Trends in Mean and Extreme Air Temperature. J. Clim. 2021, 34, 1923–1945. [Google Scholar] [CrossRef]
  15. Kalnay, E.; Cai, M. Impact of urbanization and land-use change on climate. Nature 2003, 423, 528–531, Erratum in Nature 2003, 425, 102. [Google Scholar] [CrossRef] [PubMed]
  16. Hua, W.; Chen, H.; Li, X. Effects of future land use change on the regional climate in China. Sci. China Earth Sci. 2015, 58, 1840–1848. [Google Scholar] [CrossRef]
  17. Stewart, I.D.; Oke, T.R.; Krayenhoff, E.S. Evaluation of the ‘local climate zone’ scheme using temperature observations and model simulations. Int. J. Climatol. 2014, 34, 1062–1080. [Google Scholar] [CrossRef]
  18. Li, D.; Sun, T.; Liu, M.; Yang, L.; Wang, L.; Gao, Z. Contrasting responses of urban and rural surface energy budgets to heat waves explain synergies between urban heat islands and heat waves. Environ. Res. Lett. 2015, 10, 054009. [Google Scholar] [CrossRef]
  19. Oke, T.R.; Mills, G.; Christen, A.; Voogt, J.A. Urban Climates; Cambridge University Press: Cambridge, UK, 2017. [Google Scholar]
  20. Oke, T.R. The energetic basis of the urban heat island. Q. J. R. Meteorol. Soc. 1982, 108, 1–24. [Google Scholar] [CrossRef]
  21. Georgescu, M.; Moustaoui, M.; Mahalov, A.; Dudhia, J. Summer-time climate impacts of projected megapolitan expansion in Arizona. Nat. Clim. Change 2013, 3, 37–41. [Google Scholar] [CrossRef]
  22. Zhou, L.; Dickinson, R.E.; Tian, Y.; Fang, J.; Li, Q.; Kaufmann, R.K.; Tucker, C.J.; Myneni, R.B. Evidence for a significant urbanization effect on climate in China. Proc. Natl. Acad. Sci. USA 2004, 101, 9540–9544. [Google Scholar] [CrossRef]
  23. Yang, X.; Leung, L.R.; Zhao, N.; Zhao, C.; Qian, Y.; Hu, K.; Liu, X.; Chen, B. Contribution of urbanization to the increase of extreme heat events in an urban agglomeration in east China. Geophys. Res. Lett. 2017, 44, 6940–6950. [Google Scholar] [CrossRef]
  24. Ren, G.; Zhou, Y. Urbanization Effect on Trends of Extreme Temperature Indices of National Stations over Mainland China, 1961–2008. J. Clim. 2014, 27, 2340–2360. [Google Scholar] [CrossRef]
  25. Zong, L.; Liu, S.; Yang, Y.; Ren, G.; Yu, M.; Zhang, Y.; Li, Y. Synergistic Influence of Local Climate Zones and Wind Speeds on the Urban Heat Island and Heat Waves in the Megacity of Beijing, China. Front. Earth Sci. 2021, 9, 673786. [Google Scholar] [CrossRef]
  26. Zhai, P.; Pan, X. Trends in temperature extremes during 1951–1999 in China. Geophys. Res. Lett. 2003, 30(17), 1913. [Google Scholar] [CrossRef]
  27. Yang, Y.-J.; Wu, B.-W.; Shi, C.-E.; Zhang, J.-H.; Li, Y.-B.; Tang, W.-A.; Wen, H.-Y.; Zhang, H.-Q.; Shi, T. Impacts of Urbanization and Station-relocation on Surface Air Temperature Series in Anhui Province, China. Pure Appl. Geophys. 2012, 170, 1969–1983. [Google Scholar] [CrossRef]
  28. Zhang, Y.; Ning, G.; Chen, S.; Yang, Y. Impact of Rapid Urban Sprawl on the Local Meteorological Observational Environment Based on Remote Sensing Images and GIS Technology. Remote Sens. 2021, 13, 2624. [Google Scholar] [CrossRef]
  29. Ren, G.-Y. Urbanization as a major driver of urban climate change. Adv. Clim. Change Res. 2015, 6, 1–6. [Google Scholar] [CrossRef]
  30. Luo, M.; Lau, N.C. Urban Expansion and Drying Climate in an Urban Agglomeration of East China. Geophys. Res. Lett. 2019, 46, 6868–6877. [Google Scholar] [CrossRef]
  31. Lu, R. Interannual Variability of the Summertime North Pacific Subtropical High and its Relation to Atmospheric Convection over the Warm Pool. J. Meteorol. Soc. Jpn. Ser. II 2001, 79, 771–783. [Google Scholar] [CrossRef] [Green Version]
  32. You, Q.; Kang, S.; Aguilar, E.; Pepin, N.; Flügel, W.-A.; Yan, Y.; Xu, Y.; Zhang, Y.; Huang, J. Changes in daily climate extremes in China and their connection to the large scale atmospheric circulation during 1961–2003. Clim. Dyn. 2010, 36, 2399–2417. [Google Scholar] [CrossRef]
  33. Hoffmann, P.; Schlünzen, K.H. Weather Pattern Classification to Represent the Urban Heat Island in Present and Future Climate. J. Appl. Meteorol. Clim. 2013, 52, 2699–2714. [Google Scholar] [CrossRef]
  34. Stewart, I.D.; Oke, T.R. Local Climate Zones for Urban Temperature Studies. Bull. Am. Meteorol. Soc. 2012, 93, 1879–1900. [Google Scholar] [CrossRef]
  35. Miao, Y.; Guo, J.; Liu, S.; Liu, H.; Li, Z.; Zhang, W.; Zhai, P. Classification of summertime synoptic patterns in Beijing and their associations with boundary layer structure affecting aerosol pollution. Atmos. Chem. Phys. 2017, 17, 3097–3110. [Google Scholar] [CrossRef] [Green Version]
  36. Yang, Y.; Zheng, X.; Gao, Z.; Wang, H.; Wang, T.; Li, Y.; Lau, G.N.C.; Yim, S.H.L. Long-Term Trends of Persistent Synoptic Circulation Events in Planetary Boundary Layer and Their Relationships with Haze Pollution in Winter Half Year Over Eastern China. J. Geophys. Res. Atmos. 2018, 123, 10,991–11,007. [Google Scholar] [CrossRef]
  37. Wang, P.; Tang, J.; Sun, X.; Wang, S.; Wu, J.; Dong, X.; Fang, J. Heat Waves in China: Definitions, Leading Patterns, and Connections to Large-Scale Atmospheric Circulation and SSTs. J. Geophys. Res. Atmos. 2017, 122, 10,679–10,699. [Google Scholar] [CrossRef]
  38. Zhou, T.; Wu, B.; Dong, L. Advances in research of ENSO changes and the associated impacts on Asian-Pacific climate. Asia-Pac. J. Atmos. Sci. 2014, 50, 405–422. [Google Scholar] [CrossRef]
  39. Lu, R.-Y.; Chen, R.-D. A review of recent studies on extreme heat in China. Atmos. Ocean. Sci. Lett. 2015, 9, 114–121. [Google Scholar] [CrossRef] [Green Version]
  40. Wang, W.; Zhou, W.; Li, X.; Wang, X.; Wang, D. Synoptic-scale characteristics and atmospheric controls of summer heat waves in China. Clim. Dyn. 2015, 46, 2923–2941. [Google Scholar] [CrossRef]
  41. Chen, S.; Yang, Y.; Deng, F.; Zhang, Y.; Liu, D.; Liu, C.; Gao, Z. A high-resolution monitoring approach of canopy urban heat island using a random forest model and multi-platform observations. Atmos. Meas. Tech. 2022, 15, 735–756. [Google Scholar] [CrossRef]
  42. Yang, X.; Yao, L.; Jin, T.; Peng, L.L.; Jiang, Z.; Hu, Z.; Ye, Y. Assessing the thermal behavior of different local climate zones in the Nanjing metropolis, China. Build. Environ. 2018, 137, 171–184. [Google Scholar] [CrossRef]
  43. Tang, G.L.; Ding, Y.H. The Changes in Temperature and Its Possible Causes in Nanjing in Recent 44 Years. Atmos. Sci. 2006, 30, 13. (In Chinese) [Google Scholar]
  44. Yang, Y.; Jiang, N. Air temperature and heat island effect change Character in Nanjing city for last 50a. Meteorol. Sci. 2009, 29, 88–91. (In Chinese) [Google Scholar]
  45. Deng, S.; Lu, X.; Lu, B.; Zhang, H.; Zhao, C.; Xu, K.; Mao, D.; Cui, D.; Wu, X. Variation Analysis of Annual Mean Temperature and Precipitation Near 53 Years in Nanjing City. Hydropower Energy Sci. 2014, 32, 14–17. (In Chinese) [Google Scholar]
  46. Xu, W.; Li, Q.; Wang, X.L.; Yang, S.; Cao, L.; Feng, Y. Homogenization of Chinese daily surface air temperatures and analysis of trends in the extreme temperature indices. J. Geophys. Res. Atmos. 2013, 118, 9708–9720. [Google Scholar] [CrossRef]
  47. Zong, L.; Yang, Y.; Gao, M.; Wang, H.; Wang, P.; Zhang, H.; Wang, L.; Ning, G.; Liu, C.; Li, Y.; et al. Large-scale synoptic drivers of co-occurring summertime ozone and PM2.5 pollution in eastern China. Atmos. Chem. Phys. 2021, 21, 9105–9124. [Google Scholar] [CrossRef]
  48. Yang, Y.; Guo, M.; Ren, G.; Liu, S.; Zong, L.; Zhang, Y.; Zheng, Z.; Miao, Y.; Zhang, Y. Modulation of Wintertime Canopy Urban Heat Island (CUHI) Intensity in Beijing by Synoptic Weather Pattern in Planetary Boundary Layer. J. Geophys. Res. Atmos. 2022, 127, e2021JD035988. [Google Scholar] [CrossRef]
  49. Yang, Y.; Zheng, Z.; Yim, S.Y.; Roth, M.; Ren, G.; Gao, Z.; Wang, T.; Li, Q.; Shi, C.; Ning, G.; et al. PM 2.5 Pollution Modulates Wintertime Urban Heat Island Intensity in the Beijing-Tianjin-Hebei Megalopolis, China. Geophys. Res. Lett. 2020, 47, e2019GL084288. [Google Scholar] [CrossRef] [Green Version]
  50. Shi, T.; Yang, Y.; Sun, D.; Huang, Y.; Shi, C. Influence of Changes in Meteorological Observational Environment on Urbanization Bias in Surface Air Temperature: A Review. Front. Clim. 2022, 3, 189. [Google Scholar] [CrossRef]
  51. Zong, L.; Yang, Y.; Xia, H.; Gao, M.; Sun, Z.; Zheng, Z.; Li, X.; Ning, G.; Li, Y.; Lolli, S. Joint occurrence of heatwaves and ozone pollution and increased health risks in Beijing, China: Role of synoptic weather pattern and urbanization. Atmos. Chem. Phys. 2022, 22, 6523–6538. [Google Scholar] [CrossRef]
  52. Pan, W.; Miao, Q.; Xu, Y. Characteristics of temperature change in Nanjing from 1951 to 2006. J. Nanjing Meteorol. Inst. 2008, 31, 694–701. (In Chinese) [Google Scholar]
  53. Hua, L.; Ma, Z.; Zeng, Z. The Comparative Analysis of the Changes of Extreme Temperature and Extreme Diurnal Temperature Range of Large Cities and Small Towns in Eastern China. Atmos. Sci. 2006, 30, 80. [Google Scholar]
  54. Rong, W.; Yi, S.; Yuanjian, Y.; Wusan, X.; Yin, T.; Hao, Z.; Tao, S. Effects of Urbanization on Extreme Temperature Events in Anhui Province. Adv. Clim. Change Res. 2016, 12, 527–537. (In Chinese) [Google Scholar]
  55. Huth, R.; Beck, C.; Philipp, A.; Demuzere, M.; Ustrnul, Z.; Cahynová, M.; Kyselý, J.; Tveito, O.E. Classifications of Atmospheric Circulation Patterns. Ann. N. Y. Acad. Sci. 2008, 1146, 105–152. [Google Scholar] [CrossRef] [PubMed]
  56. Ning, G.; Yim, S.H.L.; Wang, S.; Duan, B.; Nie, C.; Yang, X.; Wang, J.; Shang, K. Synergistic effects of synoptic weather patterns and topography on air quality: A case of the Sichuan Basin of China. Clim. Dyn. 2019, 53, 6729–6744. [Google Scholar] [CrossRef]
  57. Guo, M.; Zhang, M.; Wang, H.; Wang, L.; Liu, S.; Zong, L.; Zhang, Y.; Li, Y. Dual Effects of Synoptic Weather Patterns and Urbanization on Summer Diurnal Temperature Range in an Urban Agglomeration of East China. Front. Environ. Sci. 2021, 9, 672295. [Google Scholar] [CrossRef]
  58. Philipp, A.; Beck, C.; Esteban, P.; Krennert, T.; Lochbihler, K.; Spyros, P.; Pianko-Kluczynska, K.; Post, P.; Alvarez, R.; Spekat, A.; et al. Cost733 User Guide; University of Augsburg: Augsburg, Germany, 2014. [Google Scholar]
  59. Miao, Q.; Xu, X.; Pan, W. Winter Temperature Characteristics of Nanjing During 1951–2006. J. Appl. Meteorol. Sci. 2008, 19, 620–626. (In Chinese) [Google Scholar]
  60. Frich, P.; Alexander, L.V.; Della-Marta, P.; Gleason, B.; Haylock, M.; Klein-Tank, A.M.G.; Peterson, T. Observed coherent changes in climatic extremes during the second half of the twentieth century. Clim. Res. 2002, 19, 193–212. [Google Scholar] [CrossRef]
  61. Solomon, S.; Qin, D.; Manning, M.; Chen, Z.; Marquis, M.; Averyt, K.; Tignor, M.; Miller, H.L., Jr. (Eds.) Climate Change 2007: The Physical Science Basis; Cambridge University Press: Cambridge, UK, 2007; 996p. [Google Scholar]
  62. Sun, B.; Wang, H.; Huang, Y.; Yin, Z.; Zhou, B.; Duan, M.K. Characteristics and causes of the hot-dry climate anomalies in China during summer of 2022. Trans. Atmos. Sci. 2022, 1–9, (online published). (In Chinese) [Google Scholar] [CrossRef]
  63. Lu, R.; Xu, K.; Chen, R.; Chen, W.; Li, F.; Lv, C. Heat waves in summer 2022 and increasing concern regarding heat waves in general. Atmos. Ocean. Sci. Lett. 2023, 16, 100290. [Google Scholar] [CrossRef]
  64. Chen, R.; Yin, P.; Wang, L.; Liu, C.; Niu, Y.; Wang, W.; Jiang, Y.; Liu, Y.; Liu, J.; Qi, J.; et al. Association between ambient temperature and mortality risk and burden: Time series study in 272 main Chinese cities. BMJ 2018, 363, k4306. [Google Scholar] [CrossRef]
Figure 1. The study area and the locations of the two national meteorological stations in Nanjing, China (map based on the publicly available land use map provided on the website of the Nanjing Municipal Bureau of Land and Resources).
Land 12 00162 g001
Figure 2. Time series for maximum/mean/minimum temperatures in urban areas and rural areas during 1960–2021. The red and blue dashed lines in the left-hand panel and the columns in the right-hand panel indicate their corresponding linear trends. Error bars in the right-hand panels indicate the 95% confidence interval.
Land 12 00162 g002
Figure 3. Changes and trends of urban heat wave (HW) days (orange) and rural HW days (blue) from 1960 to 2021.
Land 12 00162 g003
Figure 4. The 850-hHPa geopotential height (contours) and zonal/meridional wind (vector) patterns associated with the occurrence of HW events over 62 years at 1400 LST (local standard time) based on objective classification (the red outline indicates Nanjing and the number in the upper-right corner of each panel indicates the frequency of occurrence for each pattern).
Land 12 00162 g004
Figure 5. Changes in heat wave (HW) day frequency corresponding to each of the four synoptic weather types.
Land 12 00162 g005
Figure 6. Changes and trends in urban low temperature (LT) days (orange) and rural LT days (blue) from 1960 to 2021.
Land 12 00162 g006
Figure 7. The 850-hHPa geopotential height (contours) and zonal/meridional wind (vector) patterns associated with the occurrence of LT events over 62 years at 0200 LST (local standard time) based on objective classification (the red outline indicates Nanjing and the number in the upper-right corner of each panel indicates the frequency of occurrence for each pattern).
Land 12 00162 g007
Figure 8. Changes in the frequency of low temperature (LT) days corresponding to each of the four synoptic weather types.
Land 12 00162 g008
Figure 9. Changes in relative extreme temperature indices in urban/rural areas in Nanjing during 1960–2021: (a) warm days; (b) cold days; (c) warm nights; (d) cold nights.
Land 12 00162 g009
Table 1. Interannual and intraseasonal trends in urban and rural maximum/mean/minimum temperatures, along with the contribution of urbanization (statistical significance level at the 0.05 is denoted by *, and a tilde (~) indicates that the effect of urbanization failed the 0.05 significance test and no calculation of the urbanization contribution was performed).
TimeUrban Max/Mean/Min Temperature Trends
(°C/Decade)
Rural Max/Mean/Min Temperature Trends (°C/Decade)Urbanization Contribution Rate (%)
Interannual variation0.17/0.34 */0.67 *0.31 */0.25 */0.53 *~/26.5/20.9
Spring0.32 */0.45 */0.32 *0.24 */0.37 */0.26 *25/17.8/18.8
Summer0.17/0.11/0.38 *0.3 */0.02/0.27 *~/~/28.9
Autumn−0.03/0.33 */0.73 *0.14/0.2 */0.51 *~/39.4/30.1
Winter0.12/0.42 */0.67 *0.11/0.34 */0.53 *~/19/20.9
Table 2. Correlation and significance testing between relative extreme indexes and HW (LT).
UrbanRural
warm day–HWr = 0.91, p < 0.01r = 0.86, p < 0.01
cold night–LTr = 0.89, p < 0.01r = 0.88, p < 0.01
warm night–HWr = 0.75, p < 0.01r = 0.79, p < 0.01
cold day–LTr = 0.61, p < 0.01r = 0.60, p < 0.01
Disclaimer/Publisher’s Note: The statements, opinions and data contained in all publications are solely those of the individual author(s) and contributor(s) and not of MDPI and/or the editor(s). MDPI and/or the editor(s) disclaim responsibility for any injury to people or property resulting from any ideas, methods, instructions or products referred to in the content.

